Abstract
Waterlogging is the primary abiotic factor that destabilizes the yield and quality of barley (Hordeum vulgare L.). However, the genetic basis of waterlogging tolerance remains poorly understood. In this study, we conducted a genome-wide association study (GWAS) by involving 106,131 single-nucleotide polymorphisms (SNPs) with a waterlogging score (WLS) of 250 barley accessions in two years. Out of 72 SNPs that were found to be associated with WLS, 34 were detected in at least two environments. We further performed the transcriptome analysis in root samples from TX9425 (waterlogging tolerant) and Franklin (waterlogging sensitive), resulting in the identification of 5,693 and 8,462 differentially expressed genes (DEGs) in these genotypes, respectively. The identified DEGs included various transcription factor (TF) genes, primarily including AP2/ERF, bZIP and MYB. By combining GWAS and RNA-seq, we identified 27 candidate genes associated with waterlogging, of which three TFs (HvDnaJ, HvMADS and HvERF1) were detected in multiple treatments. Moreover, by overexpressing barley HvERF1 in Arabidopsis, the transgenic lines were detected with enhanced waterlogging tolerance. Altogether, our results provide new insights into the genetic mechanisms of waterlogging, which have implications in the molecular breeding of waterlogging-tolerant barley varieties.
Introduction
Waterlogging is one of the major abiotic stresses that limits crop production and affects 16% of the global land area (Setter and Waters, 2003). As a result of global climate change, extreme weather events have become more frequent and severe in crop cultivated areas (Donat et al., 2016). Waterlogging is caused by high rain, irrigation practices and/or poor soil drainage, which results in anoxic soils and severe hypoxia in crop roots (Bailey-Serres et al., 2012). Waterlogging has severely limited the production of wheat and barley in the Yangtze River Plain of China. Furthermore, winter wheat grain yield was reported to be as low as 4978.5 kg ha-1 or zero in years with extreme precipitation (Ding et al., 2020; He et al., 2020).
Barley (Hordeum vulgare L.) is the fourth cereal crop worldwide and is primarily used for animal feed, malting and brewing (Pegler et al., 2018). Compared with other crop species, barley is more sensitive to waterlogging stress. Waterlogging causes a reduction in shoot and root growth, leaf area, and biomass and eventually leads to a reduction in crop yield (Ciancio et al., 2021). Barley, as with other plants, has evolved with diverse morpho-physiological, biochemical, transcriptional and metabolic strategies to overcome waterlogging stresses, such as the formation of adventitious roots, aerenchyma in shoots, plant hormones and reactive oxygen species (ROS) detoxification (Zhang et al., 2016; Luan et al., 2018a; Gill et al., 2019). Plant waterlogging tolerance is a complex trait, and the underlying mechanisms are still poorly understood.
The selection of waterlogging-tolerant varieties is an effective strategy for increasing barley yield. However, waterlogging tolerance is a complex trait controlled by several genes (Borrego et al., 2021). In general, marker-assisted selection (MAS) is a high-efficiency and economical approach that can overcome the inefficiencies of traditional phenotyping breeding. Recently, numerous quantitative trait loci (QTL) that are involved in waterlogging tolerance in barley, including leaf chlorosis, plant survival, plant biomass reduction, chlorophyll fluorescence, root porosity, and aerenchyma development, have been identified by linkage analysis of doubled haploid (DH) (Zhou, 2011; Zhou et al., 2012; Broughton et al., 2015; Zhang et al., 2016; Zhang et al., 2017). However, QTL mapping for targeted traits is dependent on the polymorphisms between the parents and the population size (Wang et al., 2020).
A genome-wide association study (GWAS) is an effective approach to identify genomic regions associated with specific variants of complex traits, which could dissect more alleles compared with linkage analysis. Recently, GWAS has been widely used to detect important candidate genes associated with yield, quality, salt stress, and drought stress (Reig-Valiente et al., 2018; Luo et al., 2021; Hao et al., 2022; Wu et al., 2022). In barley, many functional loci associated with agronomic traits (Xu et al., 2018), salt stress tolerance (Mwando et al., 2020), drought stress tolerance (Tarawneh et al., 2020), grain quality (Jia et al., 2021) and disease resistance (Pan et al., 2022) have been identified by GWAS. Borrego et al. (2021) were the first to identify 51 significant markers associated with barley waterlogging tolerance under controlled field conditions. RNA sequencing (RNA-seq) is a valuable tool for identifying candidate genes and regulation pathways, and has been used widely in plants response to waterlogging stress (Borrego et al., 2020; Sharmin et al., 2020; Chen et al., 2021). Combined GWAS and RNA-seq have been shown to identify candidate genes and provide molecular makers for MAS more efficiently. For example, Zhao et al. (2021) detected eight candidate genes and developed KASP markers for verticillium wilt resistance in cotton by combining GWAS and RNA-seq. Jia et al. (2020) identified six candidate genes of grain drying rate in maize with GWAS, and one of the candidate genes was verified by transcriptomic data.
In this study, we first performed a GWAS analysis of waterlogging-related traits among 250 barley accessions grown across four different periods in two years. Next, we performed RNA-seq analysis to identify the genes involved in waterlogging tolerance in barley. Through the combination of GWAS and RNA-seq analysis, we identified candidate genes related to waterlogging tolerance in barley. Finally, we validated candidate genes with qRT-PCR and transgenic Arabidopsis. The results may provide helpful information to better understand the molecular mechanism of waterlogging tolerance in barley.
Materials and methods
Plant materials and phenotypic analysis
In total, 250 barley accessions including 172 genotypes from China and 78 exotic lines, from 19 countries, were used in the association mapping of waterlogging tolerance at the tillering stage (Supplementary Table 1). These accessions were composed of 148 two-rowed and 102 six-rowed barley. The plants were cultured in a cement pool containing soil and subjected to waterlogging at the tillering stage (keeping the water level above the soil surface). Seeds were sown with a randomized block design over three consecutive years (2018-2020) and three replicates were used in both waterlogging and controls. Each pool contained 250 rows, with 10 plants per row, 3 cm between plants within each row and 30 cm between rows. The waterlogging score (WLS) was assessed based on leaf chlorosis and plant survival. Durative waterlogging was kept for four weeks, and then, plants were scored from 1 (susceptible) to 5 (tolerant) (1, leaf chlorosis of plants ≥80%; 2, leaf chlorosis of plants 60-80%; 3, leaf chlorosis of plants 40-60%; 4, leaf chlorosis of plants 20-40%; 5, leaf chlorosis of plants ≤20%) (Figure 1). WLS-1 represents waterlogging for 2 weeks, WLS-2 represents waterlogging for 3 weeks, WLS-3 represents waterlogging for 3 weeks, WLS-4 represents 2 weeks after drained water.
Figure 1
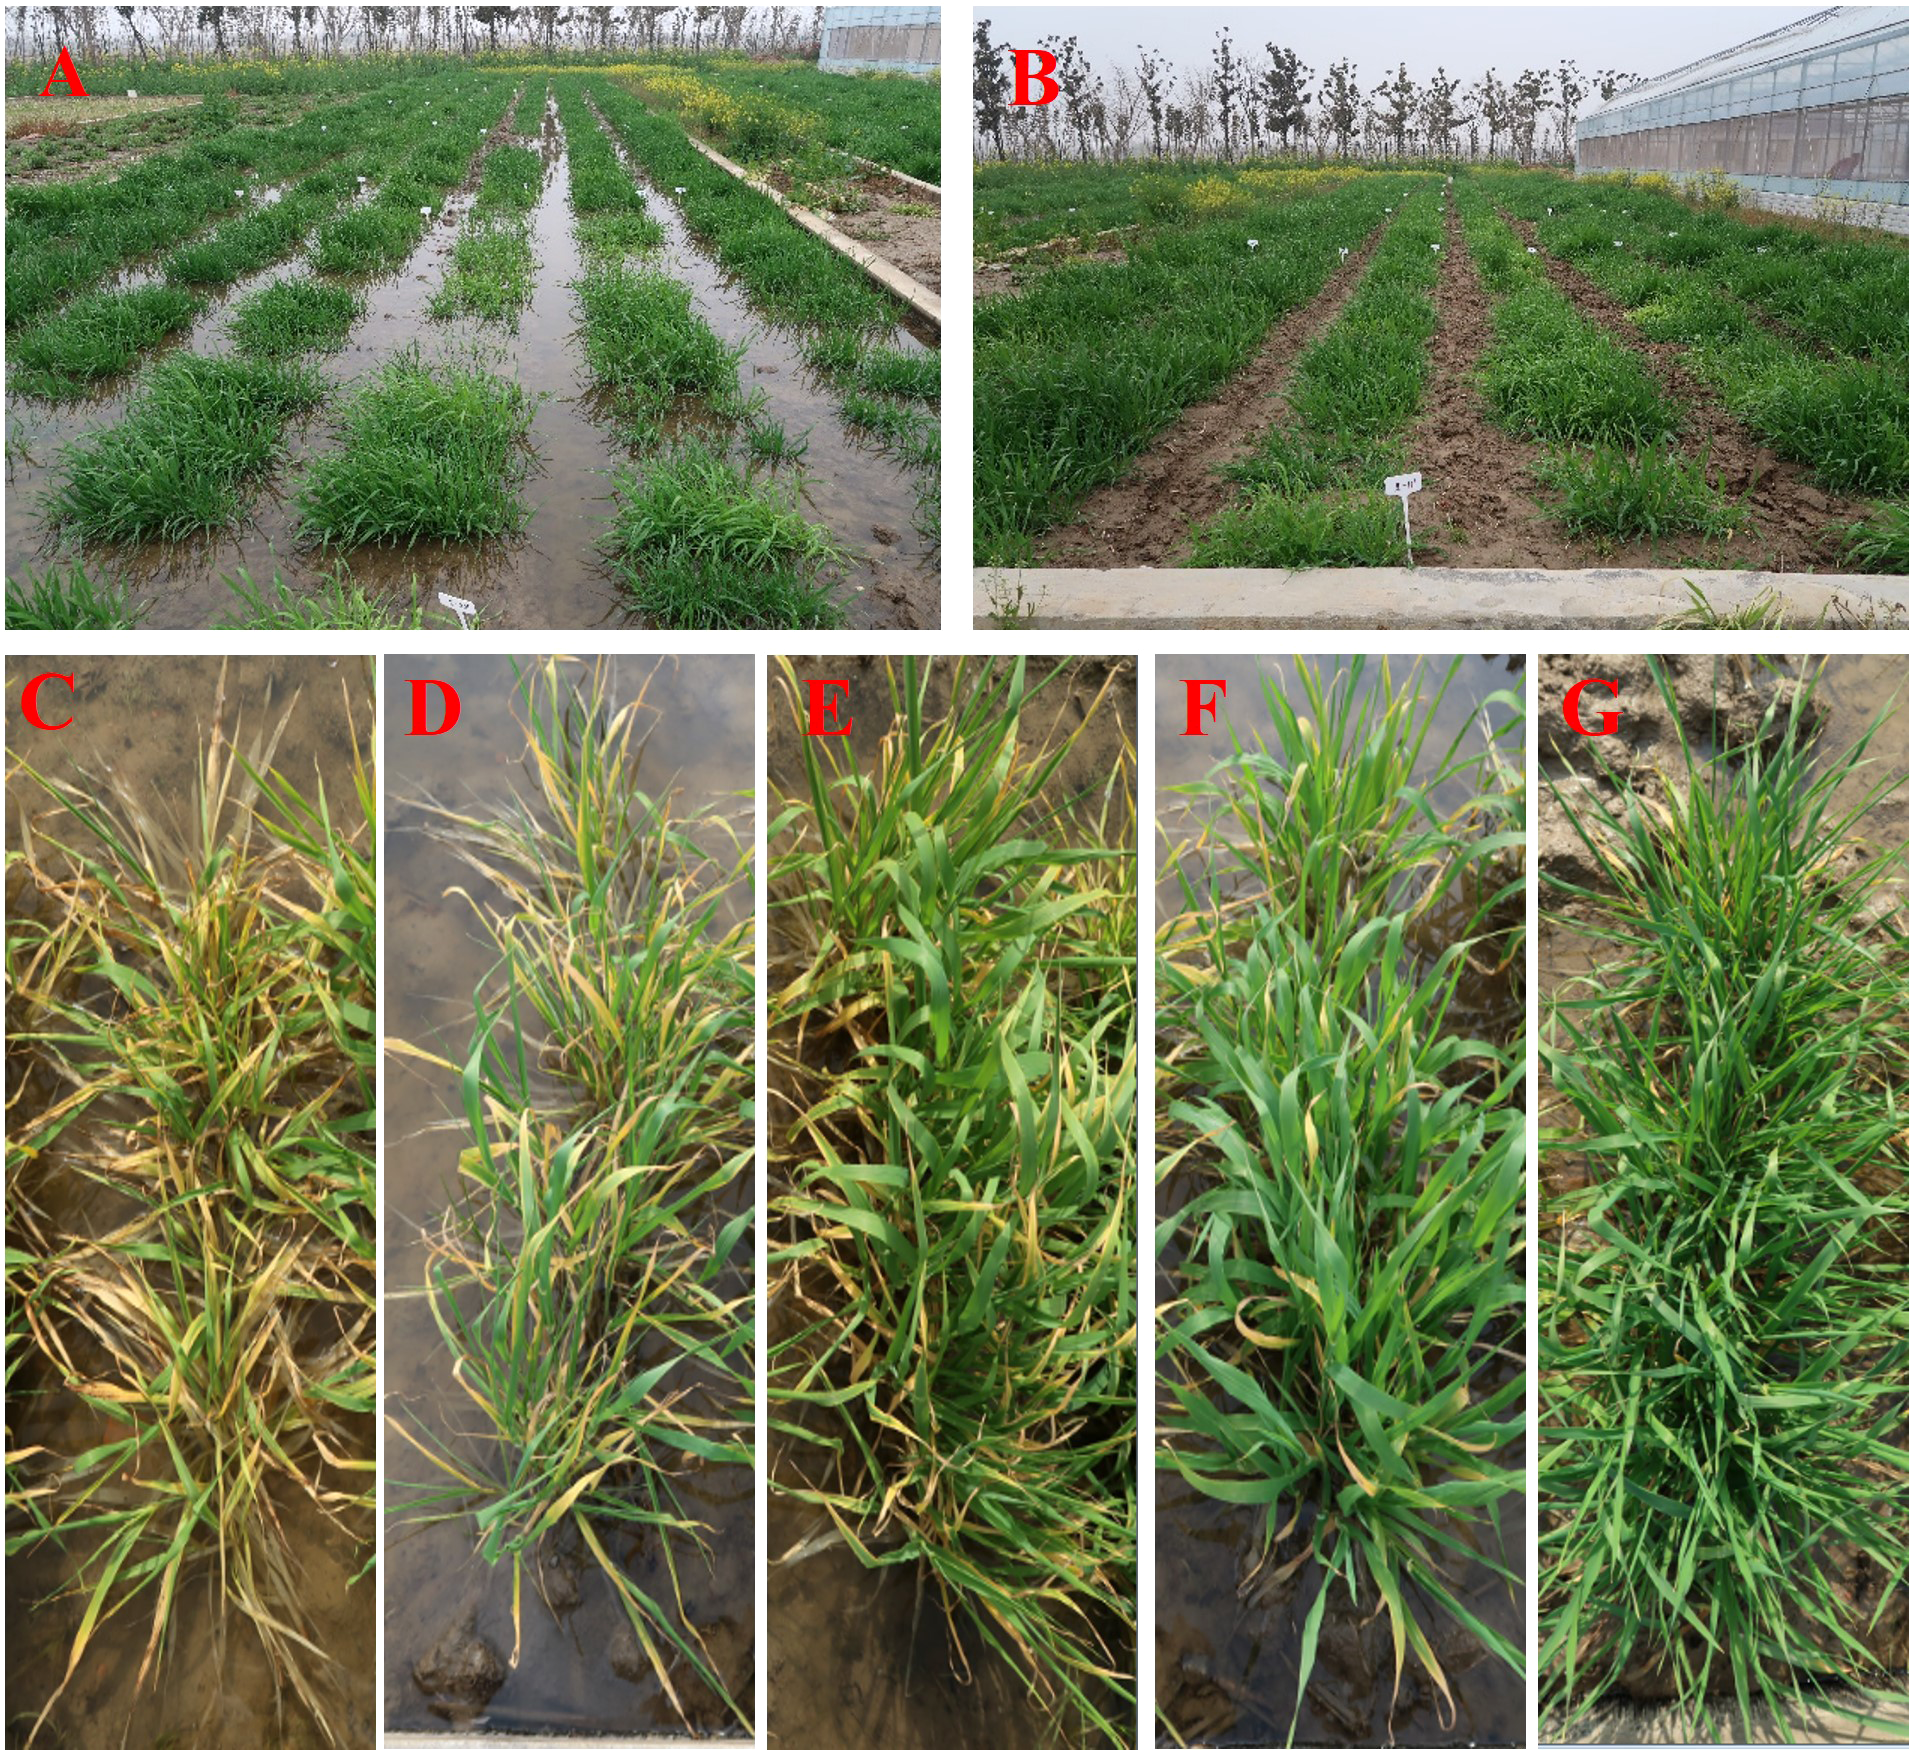
A cement pool experiment used to screen 250 barley lines for waterlogging tolerance (A, B). (A) Waterlogging treatment. (B) Control. Barley lines with different waterlogging tolerance scores (C–G). (C) 1; (D) 2; (E) 3; (F) 4; (G) 5.
Genome-wide association scanning
Genomic DNAs were extracted from young leaves. DNA degradation and contamination were checked on 1% agarose gels, and DNA purity was checked using the NanoPhotometer® spectrophotometer (IMPLEN, CA, USA). DNA library construction and sequencing were performed by Novogene Bioinformatics Technology (Beijing, China). Single-nucleotide polymorphism (SNPs) annotation was performed according to the barley cultivar Morex (Mascher et al., 2017) (http://plants.ensembl.org/Hordeum_vulgare/Info/Annotation/#assembly) using the package ANNOVAR (Version: 2013-05-20) (Wang et al., 2010). To clarify the phylogenetic relationship from a genome-wide perspective, an individual-based neighbor-joining tree was constructed based on the p-distance using the software TreeBest (http://treesoft.sourceforge.net/treebest.shtml). The software MEGA6.0 (http://www.megasoftware.net/) was used for visualizing the phylogenetic trees. SNP calling was implemented in the package SAMtools (Li et al., 2009). Based on reads from each individual’s genomic location, genotype likelihoods were calculated, and the allele frequencies were calculated using Bayesian inference. After filtering with minor allele frequency (MAF) ≥ 0.05, SNP call rate≥ 0.95, and missing rate≤ 0.01, 106,131 high-quality SNPs were used in our GWAS for waterlogging-tolerant traits. The association analysis was conducted using the GEMMA (genome-wide efficient mixed-model association) (Zhou and Stephens, 2012) software package by incorporating the population analysis with the relative kinship matrix. Significant SNP markers associated with the target traits were identified according to the standard of log10 P > 4.0 (Tu et al., 2021). The candidate genes were selected within a 100 kb upstream and 100 kb downstream region delimited by each significant SNP (Tu et al., 2021).
RNA-seq and transcription analysis
Based on the waterlogging score of the 250 genotypes and previous study (Zhou, 2011), the tolerant cultivar Taixing 9425 and the sensitive cultivar Franklin were used to RNA-seq analysis under waterlogging stress. The roots of samples were collected after waterlogging treatment for 72 h, and control without waterlogging. Each treatment was processed with three biological replicates. Total RNA was extracted using the Plant RNA Purification Kit (Tiangen, Beijing, China). Twelve RNA-seq libraries (two accessions × two treatment × three biological replicates) were constructed by Novogene Bioinformatics Technology (Beijing, China) and sequenced by an Illumina HiSeq 2500 platform (Illumina Inc., San Diego, CA, USA). The data presented in the study are deposited in the NCBI SRA repository, accession number PRJNA889532. Initially, raw fastq reads were processed through custom perl scripts. Then, raw data was cleaned by removing adapter, ploy-N, and low-quality reads. In addition to the Q20, Q30 and GC content in the clean data were calculated. High-quality clean data was used in all downstream analyses. A transcript abundance estimate for each gene was calculated using FPKM value. And the DEGs were further filtered with P value ≤ 0.05 and normalized fold change (FPKM in the waterlogging group/control group) ≥ 1 (Luan et al., 2016).
Quantitative real-time RT-PCR
To confirm the reality of candidate genes screened from the analysis of GWAS and RNA-seq. 8 candidate genes were selected to further validate by quantitative (qRT-PCR). The method of qRT-PCR was described as previous report (Luan et al., 2018a). cDNA was initially synthesized using Random Primer 6 and M-MLV reverse transcriptase (Takara, Tokyo, Japan). The specific primers used for target were designed using the Primer Premier 5.0. All the primers are listed in Supplementary Table S8. The Hvactin gene was used as the internal control. A ViiA™ 7 Real-Time PCR System (Carlsbad City, CA, USA) was used for quantitative real-time PCR. Target genes’ relative expression levels were determined as 2-ΔCt. Three biological replicates and three technical repeats were performed in all the qRT-PCR experiments.
Candidate gene validation by transgenic Arabidopsis
To further verify the candidate gene, transgenic Arabidopsis overexpressing HvERF1 were generated by floral dipping. The detailed design and methods have been previously described (Luan et al., 2020). The Gateway technology (Invitrogen, USA) was used to constructed the expression vectors. Through the floral dipping method, recombinant vectors were transferred into Arabidopsis (Columbia) using the Agrobacterium tumefaciens strain GV3101 (Clough and Bent, 1998). Homozygous Arabidopsis lines containing single-site transgene insertions were identified and maintained in growth until T3 generation. Further genetic analysis was performed using the homozygous T3 generation. Five-week-old Arabidopsis plants (T3 lines) were used for waterlogging treatment. The control plants were kept in normal conditions with regular watering. After the treatment of two weeks, the phenotypic traits were observed and recorded. For the analysis of gene expression related to waterlogging, shoots were collected at different times (0d, 3d, 6d, 9d) after waterlogging treatment. The internal control was conducted using Arabidopsis actin. The list of the primes used in this experiment can be found in Supplementary Table S8.
Results
Analysis of phenotypic variation
The WLS values were measured in 250 barley genotypes at different stages, and the results are presented in Table 1 and Table S2. The plant growth was significantly impeded by waterlogging stress. The mean values of WLSs were 2.27, 2.74, 3.07 and 2.22 in 2019. The mean values were found to be higher along with increasing waterlogging duration, while the value decreased under two weeks after draining water. The variation trend of the mean was basically similar between 2019 and 2020. Under waterlogging conditions, the CVs (coefficient variations) ranged from 23.86 in 2019 WLS-4 to 42.70 in 2020 WLS-1.
Table 1
| Trait | 2019 | 2020 | ||||||
|---|---|---|---|---|---|---|---|---|
| WLS-1 | WLS-2 | WLS-3 | WLS-4 | WLS-1 | WLS-2 | WLS-3 | WLS-4 | |
| Min | 1.00 | 1.00 | 2.00 | 1.00 | 1.00 | 1.00 | 1.00 | 1.00 |
| Max | 4.00 | 5.00 | 5.00 | 5.00 | 5.00 | 5.00 | 5.00 | 5.00 |
| Mean | 2.27 | 2.74 | 3.07 | 2.22 | 2.19 | 2.92 | 3.43 | 2.29 |
| SD | 0.75 | 0.77 | 0.73 | 0.53 | 0.94 | 0.89 | 0.90 | 0.71 |
| CV(%) | 32.86 | 28.00 | 23.95 | 23.86 | 42.70 | 30.50 | 26.20 | 31.03 |
Phenotypic variation of barley plants under waterlogging stress.
WL, waterlogging score.
The correlation analysis among different waterlogging treatment stages is shown in Table 2. WSL-1 in 2019 and2020 showed the highest consistency across WSL-4 in two years, with a correlation coefficient r2 = 0.747 and 0.819, respectively. However, 2019 WLS-1 showed a weak correlation with 2020 WLS-2 and 2020 WLS-3 (correlation coefficients were 0.064 and -0.062, respectively). Furthermore, 2019 WLS-4 showed less correlation with 2020 WLS-2 and 2020 WLS-3 (correlation coefficients were 0.086 and -0.042, respectively). These results suggeste that waterlogging score is a highly heritable trait that may be suitable for GWAS.
Table 2
| Traits | 2019WLS-1 | 2019WLS-2 | 2019WLS-3 | 2019WLS-4 | 2020WLS-1 | 2020WLS-2 | 2020WLS-3 | 2020WLS-4 |
|---|---|---|---|---|---|---|---|---|
| 2019WLS-1 | 1 | |||||||
| 2019WLS-2 | 0.4** | 1 | ||||||
| 2019WLS-3 | 0.142** | 0.539** | 1 | |||||
| 2019WLS-4 | 0.747** | 0.426** | 0.139** | 1 | ||||
| 2020WLS-1 | 0.177** | 0.235** | 0.286** | 0.215** | 1 | |||
| 2020WLS-2 | 0.064 | 0.272** | 0.254** | 0.086 | 0.558** | 1 | ||
| 2020WLS-3 | -0.062 | 0.191** | 0.335** | -0.042 | 0.437** | 0.705** | 1 | |
| 2020WLS-4 | 0.228** | 0.295** | 0.327** | 0.281** | 0.819** | 0.542** | 0.404** | 1 |
Correlation analysis of waterlogging score at different stages.
* and ** indicated the signficant correlation at P < 0.05 and P < 0.01
Genome-wide association study of waterlogging stress tolerance
Based on the sequencing results, we obtained 6,536,895 SNPs distributed across 7 barley chromosomes. After quality control, 106,131 SNP loci were used for subsequent GWAS analyses (Figure S1). The population structure analysis suggested that the population could be classified into two groups (Figure S2). Subpopulation 1 primarily included 58 genotypes composed of local varieties in China, while subpopulation 2 included 192 cultivars from different countries (Figure S2; Table S1).
The genome-wide association scanning was conducted by using the GLM and MLM algorithms to identify significant SNPs associated with waterlogging stress. A total of 356 SNPs were associated with waterlogging tolerance when GLM was performed (Figure S3; Table S3). While with MLM analysis, only 72 significant SNPs were found and all these associations were common in the GLM (Figure 2; Table S4). The MLM model was more efficient in reducing false positive associations. Therefore, significant SNPs finalized based only on MLM were presented here. Among these, 34 were detected in at least two environments (two years and four development stages). As false positives were always caused by a single environment, four overlapping SNPs (chr2H-250021530, chr2H-258433925, chr4H-138201763, chr6H-26353758) in three different stages were defined as significant, which were mainly anchored in chromosomes 2, 4 and 6. Only one SNP (chr7H-478156203) in four different stages was defined in chromosome 7 (Table 3).
Figure 2
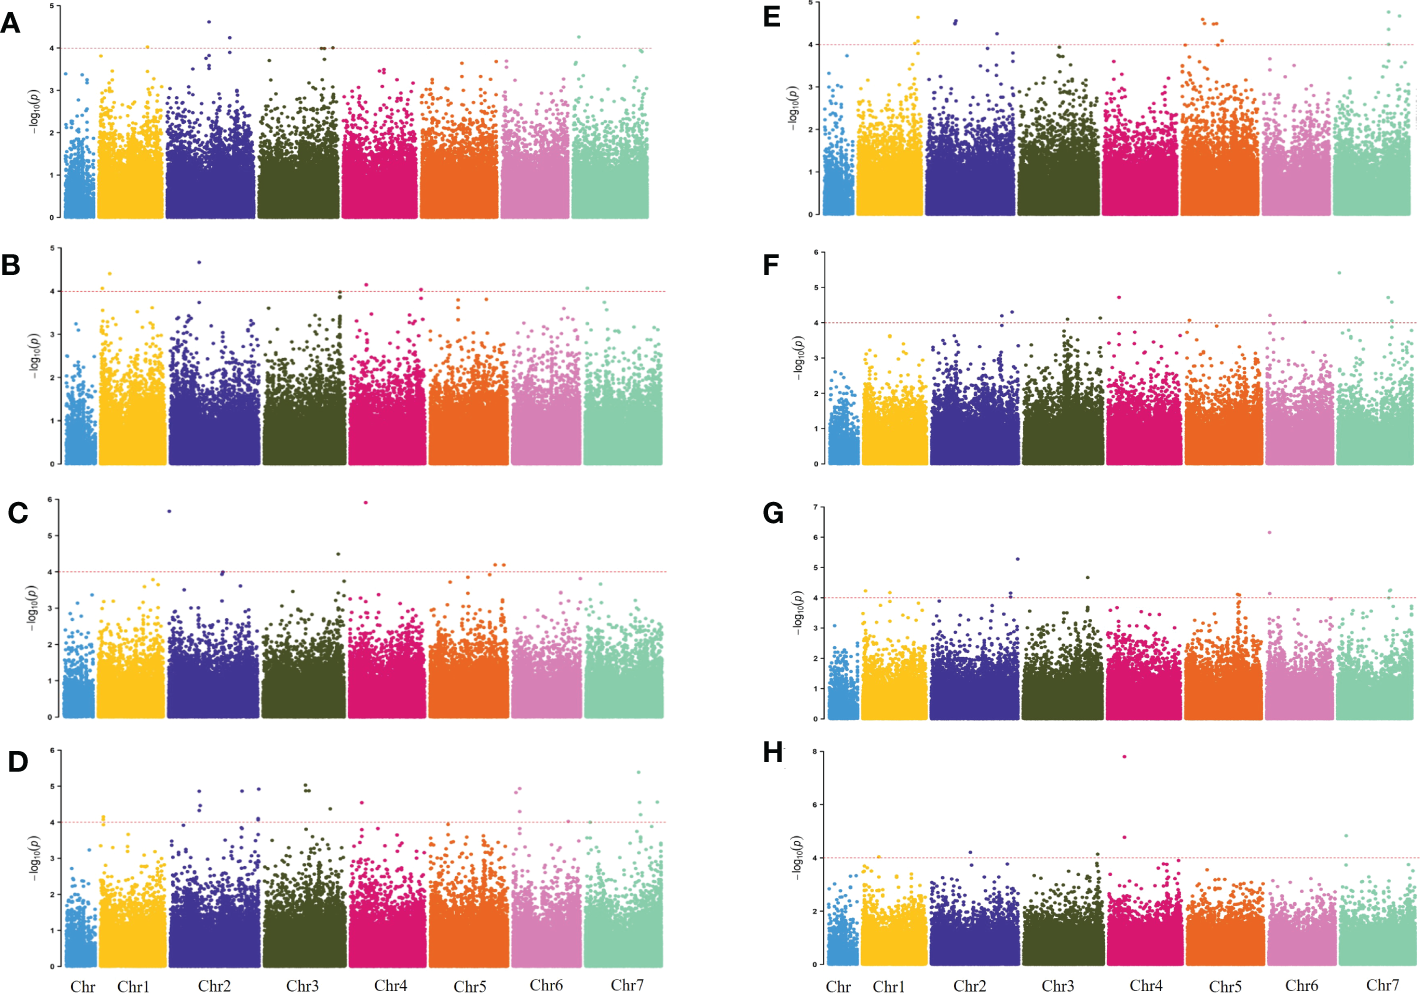
Manhattan plots for 2019 WLS-1, 2019 Q34 WLS-2, 2019 WLS-3, 2019 WLS-4, 2020 WLS-1, 2020 WLS-2, 2020 WLS-3, 2020 WLS-4 were shown in (A–H), respectively. The x-axis shows SNP loci along the seven barley chromosomes. The horizontal red line shows the genome-wide significance threshold P-value of –log10 (P-value) value of 4.0. GWAS was performed using the MLM (Q + K) model.
Table 3
| Traits | Marker Name | Chr | POS | REF | ALT | p value | Annotation |
|---|---|---|---|---|---|---|---|
| 2019 WSL-1 | chr7H-51003579 | 7 | 51003579 | G | A | 5.50E-05 | Vesicle-associated membrane protein 713 |
| 2019 WSL-2 | chr2H-249486624 | 2 | 249486624 | T | A | 2.17E-05 | MATE efflux family protein |
| chr4H-138201763 | 4 | 138201763 | A | C | 7.17E-05 | Nuclear pore complex protein Nup98-Nup96 | |
| 2019 WSL-3 | chr3H-649787421 | 3 | 649787421 | C | T | 3.23E-05 | MADS-box transcription factor family protein |
| chr4H-138201763 | 4 | 138201763 | A | C | 1.24E-06 | Nuclear pore complex protein Nup98-Nup96 | |
| chr5H-562950502 | 5 | 562920502 | C | G | 6.42E-05 | Ethylene-responsive transcription factor 1 | |
| 2019 WSL-4 | chr1H-22266723 | 1 | 22266723 | G | A | 6.39E-05 | alcohol dehydrogenase 1 |
| chr2H-250021560 | 2 | 250021560 | T | G | 1.39E-05 | MATE efflux family protein | |
| chr2H-258433925 | 2 | 258433925 | A | G | 3.46E-05 | Glucan endo-1,3-beta-glucosidase 1 | |
| chr2H-621475962 | 2 | 621475962 | C | T | 1.38E-05 | S-adenosylmethionine decarboxylase proenzyme | |
| chr2H-767327252 | 2 | 767327252 | C | A | 1.21E-05 | Peroxidase superfamily protein | |
| chr3H-386903964 | 3 | 386903964 | G | A | 1.35E-05 | Chaperone protein DnaJ | |
| chr3H-570919222 | 3 | 570919222 | A | T | 4.28E-05 | External alternative NAD(P)H-ubiquinone oxidoreductase B3, mitochondrial | |
| chr4H-97729513 | 4 | 97729513 | G | A | 2.89E-05 | Abscisic stress-ripening protein 1 | |
| chr6H-26353758 | 6 | 26353758 | G | C | 1.50E-05 | ATP-dependent protease La (LON) domain protein | |
| chr7H-461397916 | 7 | 461397916 | G | T | 4.14E-06 | Protein kinase superfamily protein | |
| chr7H-478156220 | 7 | 478156220 | G | A | 6.20E-05 | Peroxidase superfamily protein | |
| 2020 WSL-1 | chr2H-250021530 | 2 | 250021530 | C | T | 3.31E-05 | MATE efflux family protein |
| chr2H-258433925 | 2 | 258433925 | A | G | 2.80E-05 | Glucan endo-1,3-beta-glucosidase 1 | |
| chr2H-621475919 | 2 | 621475919 | G | A | 5.64E-05 | S-adenosylmethionine decarboxylase proenzyme | |
| chr7H-478156201 | 7 | 478156201 | G | A | 0.000100413 | Peroxidase superfamily protein | |
| chr7H-478156300 | 7 | 478156300 | A | G | 4.45E-05 | Peroxidase superfamily protein | |
| 2020 WSL-2 | chr2H-621250575 | 2 | 621250575 | C | A | 6.42E-05 | S-adenosylmethionine decarboxylase proenzyme |
| chr3H-388566821 | 3 | 388566821 | A | G | 8.01E-05 | Chaperone protein DnaJ | |
| chr4H-97729513 | 4 | 97729513 | G | A | 1.93E-05 | Abscisic stress-ripening protein 1 | |
| chr6H-26353758 | 6 | 26353758 | G | C | 6.27E-05 | ATP-dependent protease La (LON) domain protein | |
| chr7H-478156203 | 7 | 478156203 | C | A | 8.89E-05 | Peroxidase superfamily protein | |
| 2020 WSL-3 | chr1H-22266723 | 1 | 22266723 | G | A | 5.95E-05 | alcohol dehydrogenase 1 |
| chr2H-767327252 | 2 | 767327252 | C | A | 5.30E-06 | Peroxidase superfamily protein | |
| chr3H-570919222 | 3 | 570919222 | A | T | 2.17E-05 | External alternative NAD(P)H-ubiquinone oxidoreductase B3, mitochondrial | |
| chr5H-562950502 | 5 | 562920502 | A | G | 7.81E-05 | Ethylene-responsive transcription factor 1 | |
| chr6H-26353758 | 6 | 26353758 | G | C | 6.99E-07 | ATP-dependent protease La (LON) domain protein | |
| chr7H-461397916 | 7 | 461397916 | G | T | 5.96E-05 | Protein kinase superfamily protein | |
| 2020 WSL-4 | chr3H-649787421 | 3 | 649787421 | C | T | 7.30E-05 | MADS-box transcription factor family protein |
| chr4H-138201763 | 4 | 138201763 | A | C | 1.59E-08 | Nuclear pore complex protein Nup98-Nup96 | |
| chr7H-51003579 | 7 | 51003579 | G | A | 1.48E-05 | Vesicle-associated membrane protein 713 |
Significant SNPs associated with waterlogging identified across two or more environments.
RNA-seq analysis of root transcripts in response to waterlogging stress
Several QTLs for waterlogging tolerance have been mapped by the DH population of TX9425 × Franklin (Li et al., 2008). In the present study, the two varieties also showed significant differences in waterlogging tolerance (Table S2). To facilitate the comparison, the roots of TX9425 and Franklin were harvested 72 h after waterlogging treatments. We subsequently performed high-throughput RNA-seq using Illumina HiSeq 2500 and obtained an average of 4.86 million reads from each sample. After removing low-mass, joint, and potentially contaminated data, 2.87–7.58 GB data were obtained from each sample, and the Q30 value ranged from 89.41% to 92.33%, indicating the high-quality sequencing data in the RNA-seq experiments (Table S5).
A principal component analysis (PCA) was conducted based on the transcriptional profiles. The control and treatment samples of two genotypes could be clearly separated by the first principal component (PC1), which accounted for 99.46 % of the total variation (Figure 3A). We identified 5,693 and 8,462 differentially expressed genes (DEGs) under waterlogging treatment (72 h) versus control in TX9425 and Franklin, respectively. We noted that 2,012 DEGs were upregulated and 3,681 DEGs were down-regulated in TX9425, while 3,314 DEGs were up-regulated and 5,148 DEGs were down-regulated in Franklin (Figures 3B–D). The gene ontology (GO) functional classification analysis was performed to categorize the DEGs. After 72 h of waterlogging, the DEGs in the two genotypes were mainly functional in binding, catalytic activity, antioxidant activity, cellular anatomical entity, response to stimulus, metabolic process, biological regulation, cellular process and localization (Figure S4; Table S6).
Figure 3
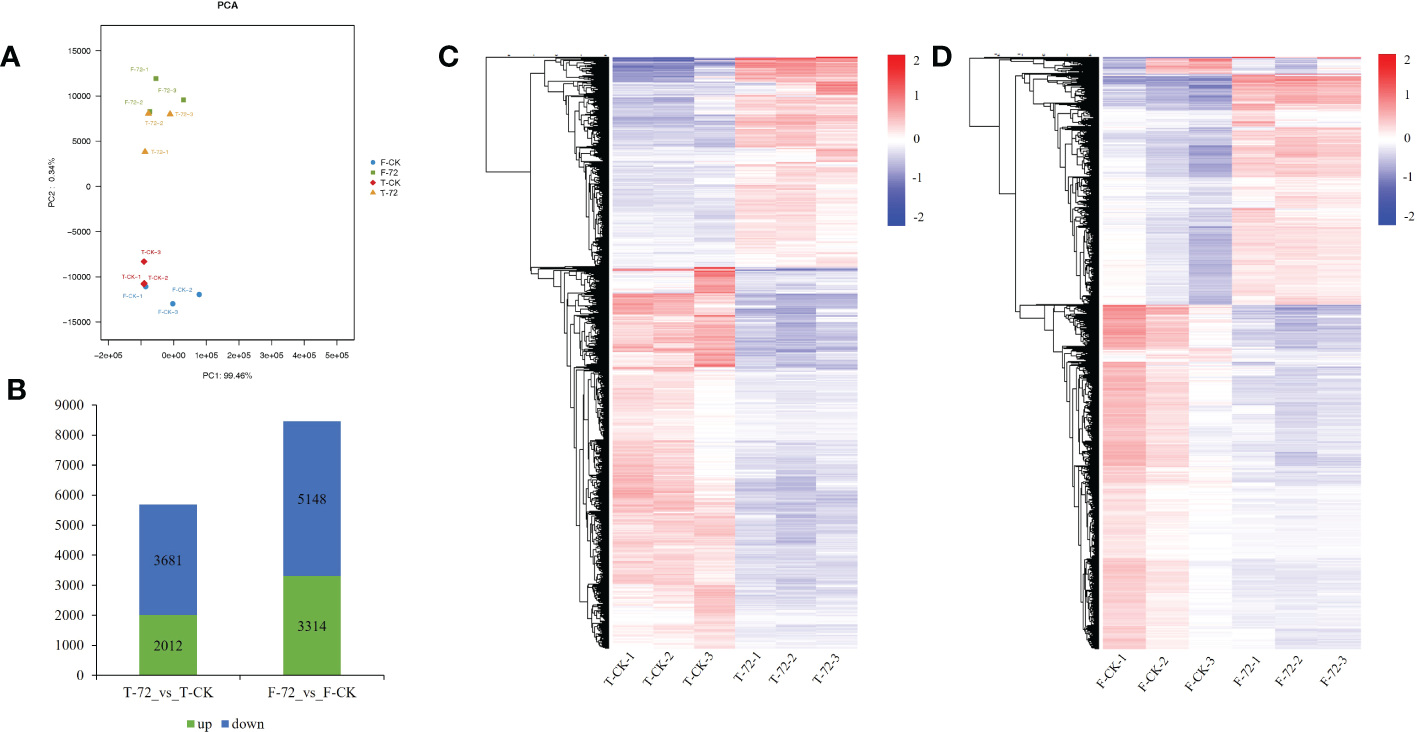
Transcriptome analysis in roots of TX9425 and Franklin under control and waterlogging conditions. (A) Principal component analysis (PCA) of transcript changes separates the samples under control and waterlogging (72h waterlogging treatment) conditions. Horizontal and vertical coordinates respectively represent the first and second principal components, and the contribution degree of each principal component is in parentheses. (B) Number of upregulated genes (green) and downregulated genes (blue) between barley under waterlogging stress and normal conditions. (C) Heatmap clustering of the DEGs in TX9425 according to their expression abundance. (D) Heatmap clustering of the DEGs in Franklin according to their expression abundance. The different colors indicate different levels of expression abundance.
Responses of transcription factors to waterlogging
Under waterlogging stress, 273 DEGs related to TFs were identified. Of these, 168 TFs were up-regulated in TX9425 and Franklin, and 184 TFs were down-regulated in TX9425 and Franklin at 72 h. The AP2/ERF, bZIP, and MYB families represented the highest number of significantly expressed TFs at 72 h of waterlogging (Figure 4A).
Figure 4
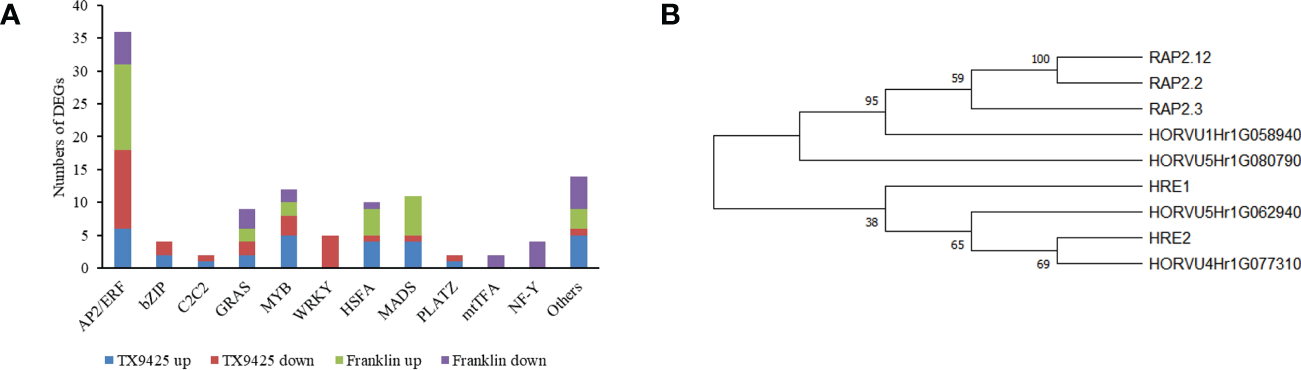
Differentially expressed genes (DEGs) associated with the transcription factor (TF) activity in response to barley waterlogging tolerance. (A) Twelve different TF families representing highest number of up- and down-regulated DEGs. (B) Phylogenetic tree of barley and Arabidopsis ERF VII proteins. Full-length protein sequences were analyzed using Neighbor-joining method in MEGA software. Numbers above branches indicate the bootstrapped value from 1000 replicates.
The AP2/ERF TFs, in particular ERFVII with conserved N-terminal motif [MCGGAII(A/S)], were previously reported to be associated with waterlogging tolerance in different crop plants (Hinz et al., 2010). This motif has been previously reported to play an important role in low oxygen conditions (Gibbs et al., 2011; Licausi et al., 2011). In this study, four ERFVII-type HvAP2/ERF genes, including HORVU4Hr1G077310, HORVU5Hr1G080790, HORVU1Hr1G058940 and HORVU5Hr1G062940, were found to be differentially expressed. Among these four AP2/ERF TFs, the HORVU4Hr1G077310 and HORVU5Hr1G080790 were induced at higher levels in TX9425 than in Franklin. Moreover, phylogenetic analysis revealed that HORVU4Hr1G077310 and HORVU5Hr1G062940 were more closely related to Arabidopsis ERFVII viz., HRE1 and HRE2, whereas HORVU5Hr1G080790 and HORVU1Hr1G058940 were more closely related to RAP2.3, RAP2.2, and RAP2.12 (Figure 4B). Therefore, these results suggested four TFs with important roles in regulating waterlogging tolerance in barley.
Combined analysis of GWAS and RNA-seq for screening candidate genes of waterlogging stress tolerance
We combined the GWAS and RNA-seq results to further screen waterlogging tolerance candidate genes. After screening with a region of 100 kb near putative SNPs, 166 candidate genes were found for the 72 significant SNPs (Table S4). Of the 166 candidate genes in GWAS, 27 exhibited significantly different expression levels under waterlogging stress relative to the control (Table 4). Those candidate genes were mapped on 7 chromosomes, 3 on 1H, 7 on 2H, 4 on 3H, 4 on 4H, 3 on 5H, 1 on 6H, and 5 on 7H, respectively. Of the 27 putative DEGs, 11 were up-regulated and 16 were down-regulated. Among them, 10 exhibited significantly different expressions at two or more different time points. 4 candidate genes (HORVU3Hr1G053060, HORVU3Hr1G095240, HORVU4Hr1G024430, and HORVU5Hr1G080790) were significantly induced by waterlogging stress in TX9425 and Franklin. These genes encode the following enzymes: chaperone protein DnaJ (Hv DnaJ), MADS-box transcription factor family protein (HvMADS), nuclear pore complex protein (HvNPC), and ethylene-responsive transcription factor 1 (HvERF1). Comparatively, the four candidate genes except HvNPC in the waterlogging-tolerant line (TX9425) had higher expression levels than the waterlogging-sensitive line. HvERF1 in TX9425 exhibited a 39-fold change which was the highest.
Table 4
| GeneID | Position | T-CK | T-72 | Log2 (fc) | p value | F-CK | F-72 | Log2 (fc) | p value | Annotation |
|---|---|---|---|---|---|---|---|---|---|---|
| HORVU1Hr1G010130 | chr1: 23059462-23064407 | 17.74 | 2.35 | -2.91 | 0.00 | 13.88 | 1.32 | -3.39 | 5.62E-05 | alcohol dehydrogenase 1 |
| HORVU1Hr1G010230 | chr1: 23219158-23220138 | 14.60 | 6.14 | -1.25 | 0.28 | 13.27 | 1.45 | -3.19 | 0.00040075 | Defensin-like protein |
| HORVU1Hr1G082250 | chr1: 528988587-528990782 | 30.92 | 782.58 | 4.66 | 0.00 | 40.65 | 459.58 | 3.50 | 2.05E-05 | alcohol dehydrogenase 1 |
| HORVU2Hr1G046410 | chr2: 249270844-249271705 | 16.16 | 2.85 | -2.50 | 0.00 | 5.90 | 2.39 | -1.31 | 0.357144795 | MATE efflux family protein |
| HORVU2Hr1G046530 | chr2: 249939061-249942337 | 58.23 | 28.25 | -1.04 | 0.34 | 39.98 | 7.95 | -2.33 | 0.007513532 | Ribonuclease UK114 |
| HORVU2Hr1G047430 | chr2: 258846019-258881832 | 5.52 | 1.58 | -1.80 | 0.05 | 3.66 | 0.15 | -4.56 | 4.91E-07 | Glucan endo-1,3-beta-glucosidase 1 |
| HORVU2Hr1G086140 | chr2: 621114389-621117212 | 1013.24 | 817.64 | -0.31 | 0.88 | 696.05 | 632.72 | -0.14 | 0.615583461 | S-adenosylmethionine decarboxylase proenzyme |
| HORVU2Hr1G107350 | chr2: 711653899-711656553 | 2.44 | 0.31 | -2.95 | 0.00 | 1.74 | 0.08 | -4.42 | 1.71E-05 | Peroxidase superfamily protein |
| HORVU2Hr1G127480 | chr2: 767283074-767284606 | 9.11 | 3.27 | -1.48 | 0.15 | 0.73 | 0.46 | -0.68 | 0.202301583 | Peroxidase superfamily protein |
| HORVU2Hr1G127650 | chr2: 767602920-767603154 | 85.45 | 142.69 | 0.74 | 0.12 | 110.84 | 37.03 | -1.58 | 0.068568152 | Peroxidase superfamily protein |
| HORVU3Hr1G050320 | chr3: 359507412-359509968 | 11.08 | 8.42 | -0.40 | 0.89 | 7.26 | 1.04 | -2.81 | 0.000800056 | Cell growth-regulating nucleolar protein |
| HORVU3Hr1G053060 | chr3: 389274477-389280164 | 1.98 | 16.70 | 3.08 | 0.00 | 1.12 | 7.41 | 2.72 | 1.29E-05 | Chaperone protein DnaJ |
| HORVU3Hr1G095240 | chr3: 649184868-649185995 | 2.34 | 78.13 | 5.06 | 0.00 | 9.18 | 107.78 | 3.55 | 4.25E-08 | MADS-box transcription factor family protein |
| HORVU3Hr1G097160 | chr3: 655237978-655243219 | 25.44 | 9.39 | -1.44 | 0.14 | 51.92 | 4.72 | -3.46 | 0.000174693 | Alcohol dehydrogenase |
| HORVU4Hr1G020030 | chr4: 97456114-97457293 | 484.90 | 46.85 | -3.37 | 0.00 | 234.69 | 13.75 | -4.09 | 4.49E-07 | Abscisic stress-ripening protein 1 |
| HORVU4Hr1G024430 | chr4: 138776287-138780671 | 12.69 | 48.70 | 1.94 | 0.00 | 8.53 | 63.29 | 2.89 | 4.30E-06 | Nuclear pore complex protein Nup98-Nup96 |
| HORVU4Hr1G024460 | chr4: 139378618-139382267 | 7.91 | 18.35 | 1.21 | 0.01 | 5.58 | 15.73 | 1.50 | 0.002731588 | alpha/beta-Hydrolases superfamily protein |
| HORVU4Hr1G080250 | chr4: 614656390-614657915 | 32.85 | 0.98 | -5.06 | 0.00 | 8.64 | 0.20 | -5.42 | 7.87E-09 | RING/U-box superfamily protein |
| HORVU5Hr1G045650 | chr5: 353125421-353127300 | 8.01 | 46.81 | 2.55 | 0.00 | 8.13 | 63.35 | 2.96 | 6.78E-07 | NAC domain protein, |
| HORVU5Hr1G111870 | chr5: 637431028-637433690 | 165.84 | 282.78 | 0.77 | 0.07 | 68.96 | 219.81 | 1.67 | 0.001678263 | DCD (Development and Cell Death) domain protein |
| HORVU5Hr1G080790 | chr5: 562157978-562159066 | 3.32 | 129.73 | 4.97 | 0.00 | 8.80 | 104.05 | 3.88 | 1.08E-08 | Ethylene-responsive transcription factor 1 |
| HORVU6Hr1G013240 | chr6: 26802224-26804260 | 17.92 | 334.62 | 4.22 | 0.00 | 31.54 | 367.07 | 3.54 | 5.96E-08 | ATP-dependent protease La (LON) domain protein |
| HORVU7Hr1G008830 | chr7: 11491985-11493095 | 7.61 | 0.44 | -4.11 | 0.00 | 2.31 | 0.06 | -5.26 | 0.000112765 | Glutathione S-transferase family protein |
| HORVU7Hr1G012940 | chr7: 18711043-18716636 | 9.38 | 25.18 | 1.42 | 0.01 | 4.90 | 26.24 | 2.42 | 4.88E-05 | Peptidyl-prolyl cis-trans isomerase-like 3 |
| HORVU7Hr1G028250 | chr7: 51040903-51043976 | 74.72 | 176.44 | 1.24 | 0.01 | 57.08 | 110.04 | 0.95 | 0.043933689 | vesicle-associated membrane protein 713 |
| HORVU7Hr1G080580 | chr7: 478251074-478251490 | 50.05 | 21.27 | -1.23 | 0.20 | 26.63 | 5.84 | -2.19 | 0.008090979 | Cryptochrome DASH |
| HORVU7Hr1G107210 | chr7: 622362695-622364651 | 20.17 | 4.65 | -2.12 | 0.01 | 9.33 | 2.02 | -2.21 | 0.011240794 | UDP-Glycosyltransferase superfamily protein |
The differential expression of the putative genes detected in both GWAS and transcriptome sequencing.
To validate the transcriptional profiles revealed by RNA-seq, qRT-PCR analysis was performed for the eight candidate genes (Figure 5). The results showed that the RNA-seq results and qRT-PCR results were highly consistent. Therefore, we speculated that the high expression of these genes is closely related to waterlogging tolerance in barley.
Figure 5
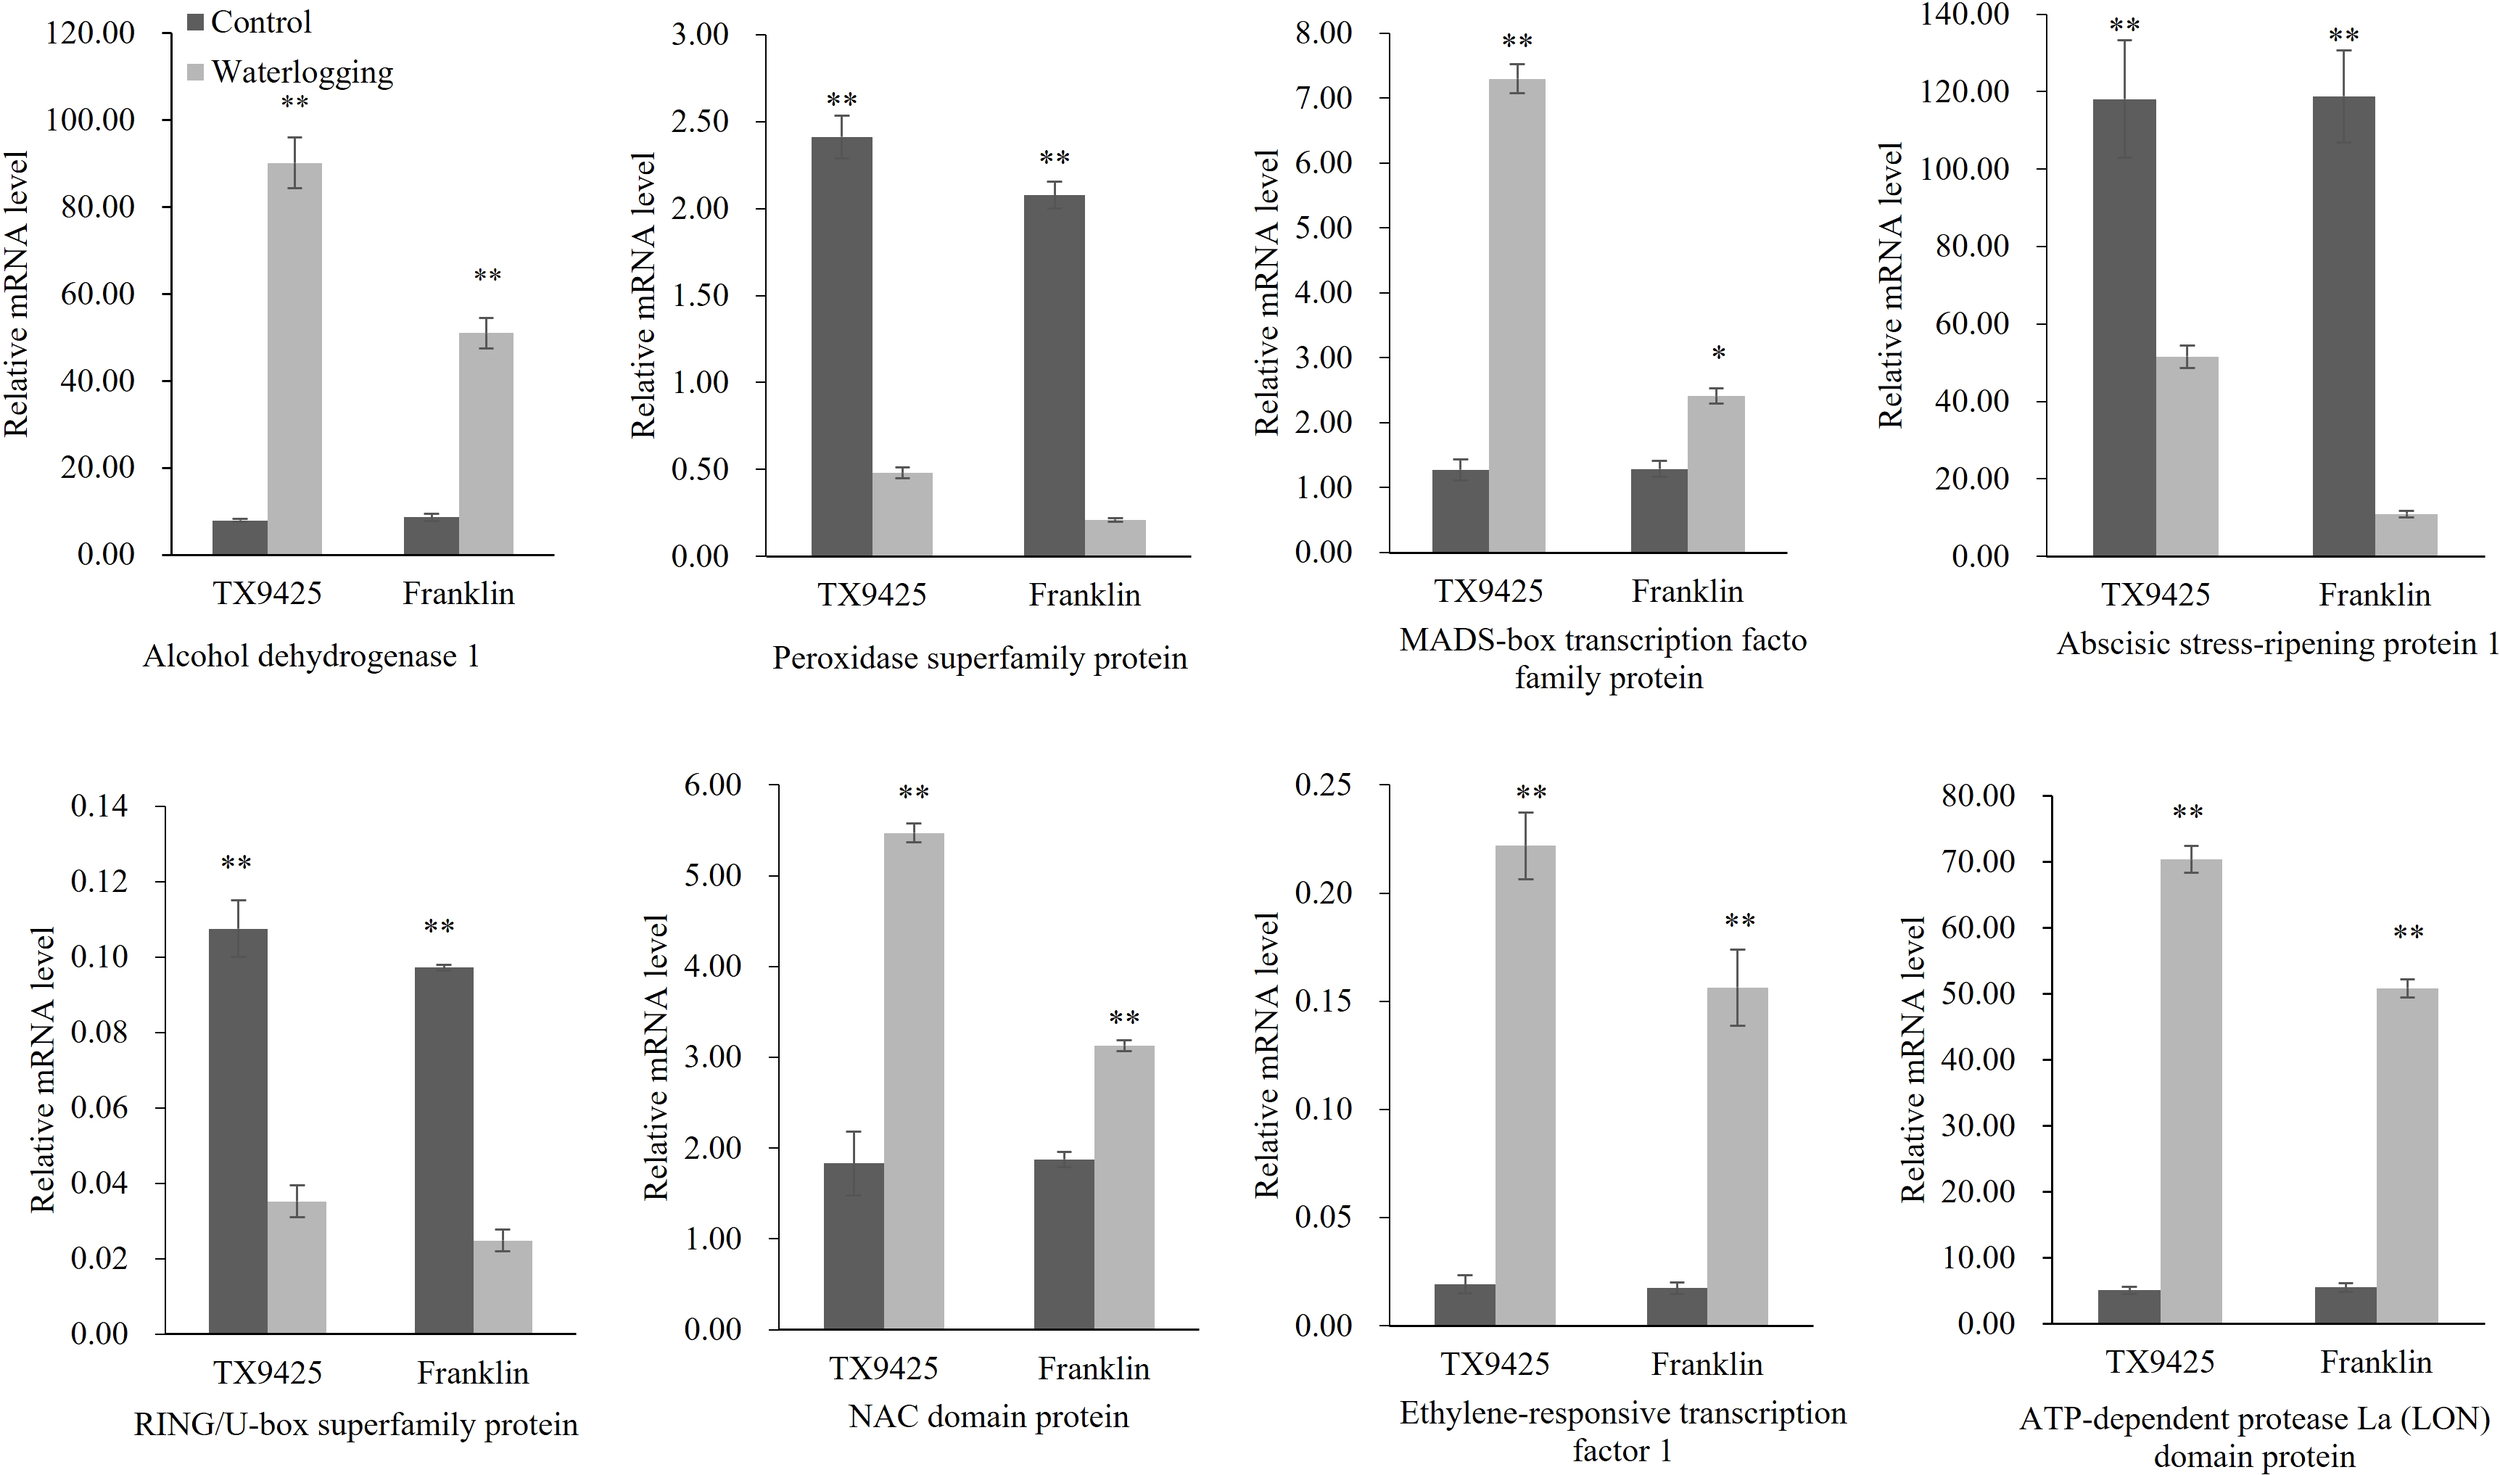
qRT-PCR analysis of eight candidate genes associated with the waterlogging tolerance in barley. “*” means a significant difference at the P < 0.05 level, “**” means a significant difference at the P < 0.01 level.
Overexpression of HvERF1 in Arabidopsis enhances plant waterlogging tolerance
To investigate the function of barley HvERF1 (HORVU5Hr1G080790), transgenic Arabidopsis plants overexpressing the HvERF1 gene from TX9425 were generated. Five-week-old plants of the wild type (WT) and three homozygous T3 transgenic lines were selected for waterlogging stress experiments. As shown in Figure 6, no discernible changes in morphological and developmental phenotypes appeared between the WT and transgenic lines under normal conditions, while the transgenic lines grew better than WT plants after two weeks of waterlogging (Figure 6A). Under waterlogging conditions, the plant height was reduced by 49.1% in the WT, and by 11.7%, 11.4%, and 10.3% in the transgenic lines (Figure 6B). Compared with the control, the soil and plant analyzer development (SPAD) value was lower 61.6% in the WT, and 20.5%, 31.8%, 34.2% lower in the transgenic lines (Figure 6C). The shoot fresh weights of the transgenic lines were 36.1%, 42.3%, and 44.0%, respectively, which were lower than those of the control, while they were 65.8% lower than that in the WT (Figure 6D). The shoot dry weight decreased by 51.0% in the WT, and by 18.0%, 36.5% and 31.1% in the transgenic lines (Figure 6E). In addition, the root lengths of the WT plants were further reduced compared to those of the transgenic lines during waterlogging stress (Figure 6F). Furthermore, the average survival rate of the transgenic lines after waterlogging was 81.8%, but that of the WT was only 27.6% (Figure 6G). Altogether, these data indicated that the overexpression of HvERF1 in Arabidopsis significantly enhanced waterlogging tolerance.
Figure 6
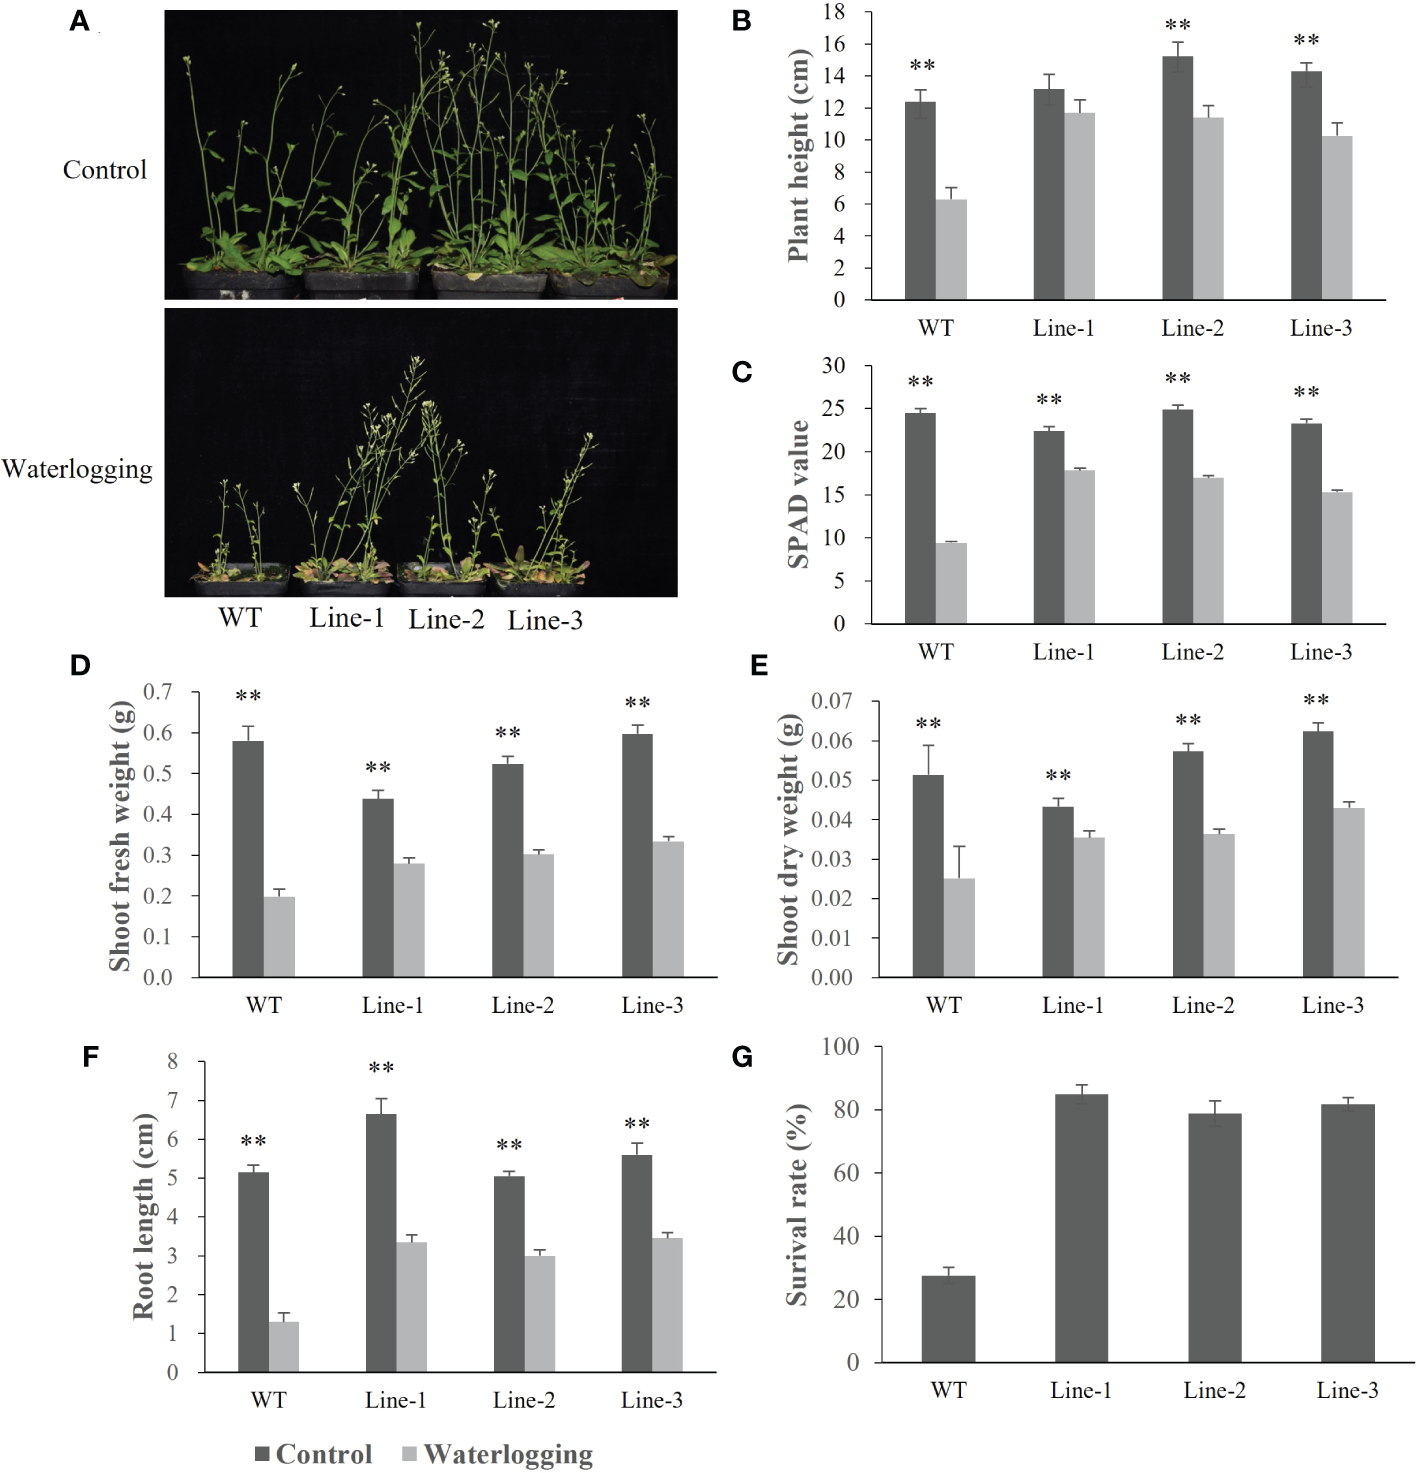
Waterlogging tolerance assay of HvERF1 overexpression lines (Line1, Line2, Line 3) and wild-type (WT). (A) Five week-old plants were subjected to waterlogging stress for further 2 weeks. (B) Plant height. (C) Soil-plant analysis development (SPAD) value (based on chlorophyll meter reading). (D) Shoot fresh weight. (E) Shoot dry weight. (F) Root length. (G) Surival rate in the wild-type and HvERF1 transgenic lines were measured under control and waterlogging stress. Values are the means ± SD. Means were generated from three independent measurements. Data were analyzed by one-way analysis of variance followed by Duncan’s test. “**” means a significant difference at the P < 0.01 level.
Overexpression of HvERF1 induced changes in stress-related gene expression levels
To understand the molecular mechanisms of the HvERF1 responding to waterlogging stress, the transcriptional profiles of five genes related to ROS scavenging and glycolysis (AtSOD1, AtCAT1, AtPOD1, AtADH1 and AtPDC1) were analyzed by qRT-PCR in HvERF1-transgenic and WT plants (Figure 7). The expression of the stress-related genes, except AtPOD1, was not significantly different between the HvERF1-transgenic and WT plants under normal conditions. Compared with the control, the expression levels of the five genes were all increased in both the transgenic lines and WT under waterlogging stress, and the increase in the expression level was significantly greater in transgenic lines than in the WT. The expression of AtSOD1 and AtPOD1 increased rapidly after waterlogging, reaching peak levels at day 3 of treatment and then decreasing progressively after days 6 and 9 of treatment (Figure 7A, C). However, the expression of AtCAT1, AtADH1 and AtPDC1 increased slowly, reaching maximum levels at day 6, and then decreasing at day 9 (Figure 7B, D, E). These results suggested that overexpression of HvERF1 in Arabidopsis might be able to regulate the expression of genes related to antioxidants and fermentation under waterlogging stress conditions.
Figure 7
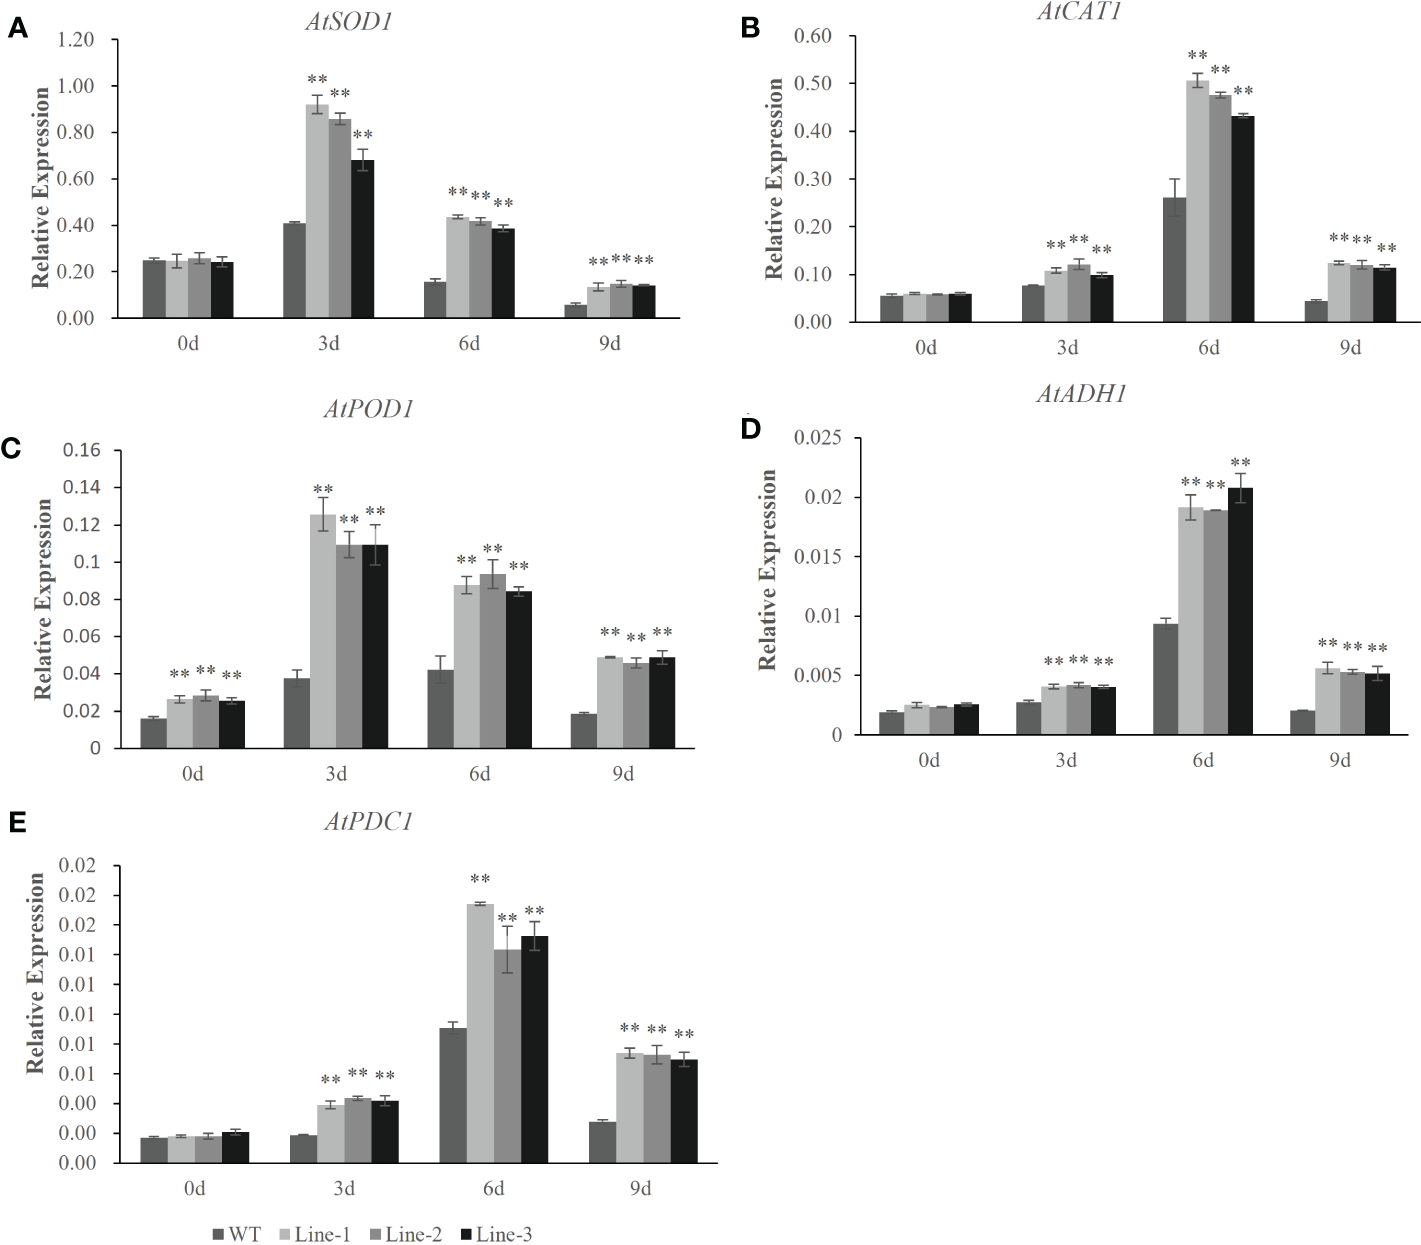
Expression analysis of stress-responsive genes in HvERF1 overexpression lines and WT under waterlogging stresses. The relative expression levels of stress-responsive genes (AtSOD1, AtCAT1, AtPOD1, AtADH1, AtPDC1) were determined by qRT-PCR (A–E). After 3 days, 6 days, 9 days waterlogging treatments, respectively. Seedlings harvested before treatment were used as control. Relative expression levels of these five genes were normalized to the transcripts of AtActin in the same samples. The mean value and standard deviation were obtained from three independent experiments. The data represent mean ± SD of three biological repeats with three measurements per sample. Asterisks indicate significant differences between transgenic plants and WT according to Student’s t-test (** p < 0.01).
Discussion
The evaluation of waterlogging tolerance in barley
To accurately identify marker-trait associations and QTL, precise phenotyping is essential owning to the complexity of waterlogging tolerance (Zhou, 2011). Different traits have been used to detect the QTL for waterlogging tolerance in barley, such as leaf scoring system, aerenchyma formation, major agronomical traits, carotenoid content, chlorophyll content, and potential membrane maintenance (Zhou, 2011; Zhou et al., 2012; Broughton et al., 2015; Zhang et al., 2016; Zhang et al., 2017; Gill et al., 2017; Gill et al., 2019; Borrego et al., 2021). The WLS and aerenchyma formation have been demonstrated to be the most reliable screening method in barley (Zhou, 2011). However, the measurement of root aerenchyma is labor-intensive and time-consuming, and it cannot be used for high-throughput screening.
In this study, a cement pool experiment and WLS were used to screen and identify waterlogging tolerance in barley. The pool experiment is closer to actual field conditions, and the condition can be better controlled than the pot experiment (Zhou, 2011). The current results revealed a significant variation among barley genotypes under waterlogging treatment. These results suggest that the population was appropriate for use in a GWAS analysis involving barley waterlogging tolerance. Waterlogging stress led to leaf chlorosis, which has been reported in previous studies (Li et al., 2008). Some of the barley genotypes have been reported in response to waterlogging stress. For example, TX9425 from China displayed tolerance to waterlogging stress, while the cultivars Franklin (Australia) and Naso Nijo (Japan) were susceptible (Luan et al., 2018b). In this study, some landraces from the Yangtze River Basin of China were identified with higher waterlogging tolerance, including Liuhesileng and Linanliuleng, among others. These germplasm resources have not been reported before and might represent novel gene sources for waterlogging tolerance in barley.
Significant SNPs detected with GWAS and previously reported regions
Different marker types and mapping populations have been used to investigate QTLs associated with barley waterlogging tolerance in previous studies (Broughton et al., 2015; Zhang et al., 2016; Gill et al., 2017; Gill et al., 2019; Zhang et al., 2017). A meta-analysis of abiotic stress tolerance QTLs in barley was also reported. Forty-eight QTLs related to waterlogging were identified on all seven chromosomes, and most QTLs were located on chromosomes 2 H and 4 H (Zhang et al., 2016). In this study, the significant SNPs related to barley waterlogging tolerance were mainly concentrated on 2 H (18) and 7 H (15) (Table S3). Studies on barley waterlogging tolerance based on GWAS remain relatively scarce. In a study, 247 worldwide spring barley with 35,926 SNPs were used to perform GWAS analysis of barley waterlogging tolerance, and 51 significant associated markers were identified with agronomic and physiological traits. Six novel QTLs and eight candidate genes associated with waterlogging were detected (Borrego et al., 2021).
In this study, GWAS was conducted in 250 barley accessions using 106,131 SNP markers and WLS in different periods of waterlogging treatment. Seventy-two significantly associated markers were detected, and 34 SNPs were detected in at least two environments. The results revealed a complex genetic mechanism of waterlogging tolerance in barley, controlled by multiple small-effect genes. The direct comparison of our GWAS findings with other studies is difficult, as the differences in populations, reference genomes, waterlogging tolerance assessment traits, marker types, and marker densities were used in different studies.
Some associated SNPs in this study overlapped with a number of previously reported regions (Table S7). Eleven waterlogging-related QTLs detected in our study are close to the previously reported. The genomic regions (78Mb on 1H, 704 Mb on 2H, 563 Mb on 5H) were major hotspot regions, which were detected multiple times in different populations. The marker chr1H-78215494 was also associated with QHLRL.1H, QHSDW.1H, QHRDW.1H, QHRFW.1H in the Franklin/YYXT mapping population (Broughton et al., 2015), and JHI-Hv50k-2016-19217 used in GWAS (Borrego et al., 2021). The marker chr2H-704331873 was also closely positioned near the QTL GSw1.1, GSw2.1 in Franklin/Yerong, tfsur-1 in Franklin/TX9425, JHI-Hv50k-2016-109151 in nature population (Li et al., 2008; Xue et al., 2010; Borrego et al., 2021). The genomic region 563 Mb on 5H was coincident for the JHI-Hv50k-2016-322832 and JHI-Hv50k-2016-322288 in the natural population, and the QTL yfsur-2 in the DH population of Yerong × Franklin (Li et al., 2008; Borrego et al., 2021). However, compared with the previous reports, some important regions associated with waterlogging were not detected in this study, such as 98cM on 4H and 29Mb on 2H (Broughton et al., 2015; Borrego et al., 2021). Borrego et al. (2021) found that only four markers were associated with WLS traits by GWAS, and three markers (0.37 and 567 Mb on 4H, 554 Mb on 6H) of which were no co-location with the results herein. These results may be related to low-density markers and differences in populations.
Transcription factors ERFs enhance waterlogging tolerance
Many previous studies have proven that the integrated analysis of GWAS and RNA-seq is useful in detecting candidate genes of complex traits (Yuan et al., 2019; Wang et al., 2022; He et al., 2022). For example, eight candidate genes were identified for tolerance to salt stress in Alfalfa by GWAS coupled with transcriptome analysis (He et al., 2022). Eight candidate genes for forage yield in Sorghum were also identified by this method (Wang et al., 2022). In the present study, 27 DEGs were identified by GWAS and transcriptome sequencing, of which four were significantly up-regulated under waterlogging stress and were detected in different stages. The expression fold changes in HvDnaJ, HvMADS, and HvERF1 in TX9425 were more than that in Franklin (Table 4). DnaJ (also called HSP40 or J-protein) has been demonstrated in the regulation of physiological pathways, including hormone regulation and plant disease resistance (Liu et al., 2022). In plants, the MADS genes play a positive role in abiotic stresses such as salt, drought, cold, and osmotic stress (Chen et al., 2018).
TFs are known to play a vital role in both abiotic and biotic stress responses. A study reported that several TFs, including MYB, AP2/ERF, NAC, WRKY, and bHLH, were induced under waterlogging stress (Borrego et al., 2020). In the present study, the AP2/ERF families represented the highest number of DEGs in the two genotypes. ERFVIIs play an important role in adjusting to low-oxygen stress. Genes related to low-oxygen stress, such as SNORKEL, SUB 1 A, HRE1, HRE2, RAP2.2, RAP2.3, and RAP2.12 have been cloned in rice, Arabidopsis and belong to the ERFVII (Xu et al., 2006; Hinz et al., 2010; Licausi et al., 2010; Gibbs et al., 2011). In agreement with these studies, our study identified four genes, HORVU4Hr1G077310, HORVU5Hr1G080790, HORVU1Hr1G058940 and HORVU5Hr1G062940, which up-regulated and possessed conserved N-terminal motif of MCGGAII(A/S). Hence, the results revealed an essential role of AP2/ERF in waterlogging tolerance of barley.
HvERF1 (HORVU5Hr1G080790) in TX9425 showed a 39-fold change by RNA-seq. Intriguingly, HvERF1 (563 Mb, 5H) was positioned relatively close to the QTL yfsur-2 in DH population of Yerong × Franklin and the JHI-Hv50k-2016-322832, JHI-Hv50k-2016-322288 in the natural population (Table S7) (Li et al., 2008; Borrego et al., 2021). Cluster analysis also found that HvERF1 was closely related to the waterlogging tolerance genes in Arabidopsis (RAP2.3, RAP2.2 and RAP2.12). Three Arabidopsis ERFVII genes improved waterlogging tolerance by directly activating genes related to energy metabolism (Licausi et al., 2010; Licausi et al., 2011). Members of the ERF families have been shown to regulate waterlogging tolerance in wheat, wild soybean and cucumber (Xu et al., 2017; Sharmin et al., 2020; Shen et al., 2020). In this study, overexpression of HvERF1 in Arabidopsis enhanced waterlogging tolerance, protected antioxidant enzyme activities (SOD, POD, and CAT), and increased energy metabolism (ADH). The enhancement of these related indicators may be achieved by HvERF1 interacting with the downstream specific target genes. Additionally, further experiments are necessary to demonstrate the function of HvERF1.
On the whole, this study deployed GWAS and RNA-seq to mine important genes, which might be relevant to waterlogging tolerance in barley, and provided the candidate genes showing waterlogging tolerance applicable in barley molecular breeding.
Statements
Data availability statement
The datasets presented in this study can be found in online repositories. The names of the repository/repositories and accession number(s) can be found in the article/Supplementary Material.
Author contributions
JW conceived and designed the study, supervised the experiments, XX compiled and finalized the article, HYL performed the experiments, CC performed the experiments, JY performed the experiments, HTL analyzed the data, SL analyzed the data, HQ drafted and wrote the manuscript, JZ revised the manuscript, HS revised the manuscript. All authors contributed to the article and approved the submitted version.
Funding
The work was sponsored by Natural Science Foundation of Jiangsu Province (BK20201215), National Barley and Highland Barley Industrial Technology Specially Constructive Foundation of China (CARS-05). Jiangsu (Lianyungang) Modern Agricultural (Science and technology comprehensive demonstration base (JAST[2022]175). Jiangsu (Yancheng) Modern Agricultural (Science and technology comprehensive demonstration base (JAST[2022]236). Jiangsu Provincial Key Laboratory for Bioresources of Saline Soils Open Foundation (JKLBS2022002).
Conflict of interest
The authors declare that they have no known competing financial interests or personal relationships that could have appeared to influence the work reported in this paper.
Publisher’s note
All claims expressed in this article are solely those of the authors and do not necessarily represent those of their affiliated organizations, or those of the publisher, the editors and the reviewers. Any product that may be evaluated in this article, or claim that may be made by its manufacturer, is not guaranteed or endorsed by the publisher.
Supplementary material
The Supplementary Material for this article can be found online at: https://www.frontiersin.org/articles/10.3389/fpls.2022.1048939/full#supplementary-material
Supplementary Figure 1Distribution of 106,131 SNPs on the 7 chromosomes of barley. The horizontal axis shows chromosome length (Mb); the different colors depict SNP density (the number of SNPs per window).
Supplementary Figure 2Population structure of the 250 accessions. (A) Neighbor-joining tree of all 250 barley varieties. (B) Principal component analysis of 250 accessions based on genotype. (C) Population structure of the 250 accessions based on STRUCTURE when K = 2.
Supplementary Figure 3Manhattan plots resulting from the SNP-based GWAS in waterlogging treatment under different periods. Manhattan plots for 2019 WLS-1, 2019 WLS-2, 2019 WLS-3, 2019 WLS-4, 2020 WLS-1, 2020 WLS-2, 2020 WLS-3, 2020 WLS-4 were shown in (A-F), respectively. The x-axis shows SNP loci along the seven barley chromosomes. The horizontal red line shows the genome-wide significance threshold P-value of –log10 (P-value) value of 4.0. GWAS was performed using the GLM (Q + K) model.
Supplementary Figure 4GO functional enrichment analysis of DEGs in the roots of two barley varieties under the waterlogging and control treatments. (A) TX9425 at 72h after waterlogging refer to Control; (B) Franklin at 72h after waterlogging refer to Control.
References
1
Bailey-Serres J. Fukao T. Gibbs D. J. Holdsworth M. J. Lee S. C. Licausi F. et al . (2012). Making sense of low oxygen sensing. Trends Plant Sci.17, 129–138. doi: 10.1016/j.tplants.2011.12.004
2
Borrego B. A. Carter A. Tucker J. R. Yao Z. Xu W. Badea A. (2020). Genome-wide analysis of gene expression provides new insights into waterlogging responses in barley (Hordeum vulgare l.). Plants9, 240. doi: 10.3390/plants9020240
3
Borrego B. A. Carter A. Zhu M. Tucker J. R. Zhou M. X. Badea A. et al . (2021). Genome-wide association study of waterlogging tolerance in barley (Hordeum vulgare l.) under controlled field conditions. Front. Plant Sci.12, 711654. doi: 10.3389/fpls.2021.711654
4
Broughton S. Zhou G. Teakle N. Matsuda R. Zhou M. O’Leary R. et al . (2015). Waterlogging tolerance is associated with root porosity in barley (Hordeum vulgare l.). Mol. Breed.35, 27. doi: 10.1007/s11032-015-0243-3
5
Chen R. G. Ma J. H. Luo D. Hou X. M. Fang M. Zhang Y. M. et al . (2018). CaMADS, a MADS-box transcription factor from pepper, plays an important role in the response to cold, salt, and osmotic stress. Plant Sci.280, 164–174. doi: 10.1016/j.plantsci.2018.11.020
6
Chen S. Xu Z. Adil M. F. Zhang G. (2021). Cultivar-, stress duration- and leaf age-specific hub genes and co-expression networks responding to waterlogging in barley. Environ. Exp. Bot.191, 104599. doi: 10.1016/j.envexpbot.2021.104599
7
Ciancio N. Miralles D. J. Striker G. G. Abeledo L. G. (2021). Plant growthrate after, and not during, waterlogging better correlates to yield responses in wheat and barley. J. Agron. Crop Sci.207, 304–316. doi: 10.1111/jac.12472
8
Clough S. J. Bent A. F. (1998). Floral dip: A simplified method for agrobacterium-mediated transformation of arabidopsis thaliana. Plant J.16, 735–743. doi: 10.1046/j.1365-313x.1998.00343.x
9
Ding J. F. Liang P. Wu P. Zhu M. Li C. Y. Zhu X. K. et al . (2020). Effects of waterlogging on grain yield and associated traits of historic wheat cultivars in the middle and lower reaches of the Yangtze river, China. Field Crop Res.246, 107695. doi: 10.1016/j.fcr.2019.107695
10
Donat M. G. Lowry A. L. Alexander L. V. O’Gorman P. A. Maher N. (2016). More extreme precipitation in the world’s dry and wet regions. Nat. Clim. Change6, 508–513. doi: 10.1038/nclimate2941
11
Gibbs D. Lee S. Isa N. (2011). Homeostatic response to hypoxia is regulated by the n-end rule pathway in plants. Nature479, 415–418. doi: 10.1038/nature10534
12
Gill M. B. Zeng F. R. Shabala L. Zhang G. P. Fan Y. Shabala S. et al . (2017). Cell-based phenotyping reveals QTL for membrane potential maintenance associated with hypoxia and salinity stress tolerance in barley. Front. Plant Sci.8, 1941. doi: 10.3389/fpls.2017.01941
13
Gill M. B. Zeng F. Shabala L. Zhang G. Yu M. Demidchik V. et al . (2019). Identification of QTL related to ROS formation under hypoxia and their association with waterlogging and salt tolerance in barley. Int. J. Mol. Sci.20, 699. doi: 10.3390/ijms20030699
14
Hao S. Y. Lou H. Y. Wang H. W. (2022). Genome-wide association study reveals the genetic basis of five quality traits in chinese wheat. Front. Plant Sci.13, 835306. doi: 10.3389/fpls.2022.835306
15
He F. Wei C. X. Zhang Y. X. Long R. C. Li M. N. Wang Z. et al . (2022). Genome-wide association analysis coupled with transcriptome analysis reveals candidate genes related to salt stress in alfalfa (Medicago sativa l.). Front. Plant Sci.12, 826584. doi: 10.3389/fpls.2021.826584
16
Hinz M. Wilson I. W. Yang J. Buerstenbinder K. Llewellyn D. Dennis E. S. et al . (2010). Arabidopsis RAP2.2: An ethylene response transcription factor that is important for hypoxia survival. Plant Physiol.153, 757–772. doi: 10.1104/pp.110.155077
17
Jia Y. Westcott S. He T. McFawn L. A. Angessa T. Hill C. et al . (2021). Genome-wide association studies reveal QTL hotspots for grain brightness and black point traits in barley. Crop J.9, 154–167. doi: 10.1016/j.cj.2020.04.013
18
Jia T. Wang L. Li J. Ma J. Cao Y. Lübberstedt T. et al . (2020). Integrating a genome-wide association study with transcriptomic analysis to detect genes controlling grain drying rate in maize (Zea may, L.). Theo. Appl Genet.133, 623–34. doi: 10.1007/s00122-019-03492-0
19
Licausi F. Kosmacz M. Weits D. A. Giuntoli B. Giorgi F.M. Voesenek L. A. C. J. (2011). Oxygen sensing in plants is mediated by an n-end rule pathway for protein destabilization. Nature479, 419–422. doi: 10.1038/nature10536
20
Licausi F. Van Dongen J. T. Giuntoli B. Novi G. Santaniello A. et al . (2010). HRE1 and HRE2, two hypoxia-inducible ethylene response factors, affect anaerobic responses in arabidopsis thaliana. Plant J.62, 302–315. doi: 10.1111/j.1365-313X.2010.04149.x
21
Li H. Handsaker B. Wysoker A. Fennell T. Ruan J. Homer N. et al . (2009). The sequence alignment/map format and SAMtools. Bioinformatics25, 2078–2079. doi: 10.1093/bioinformatics/btp352
22
Liu T. T. Xu M. Z. Gao S. Q. Zhang Y. Hu Y. Jin P. et al . (2022). Genome-wide identification and analysis of the regulation wheat DnaJ family genes following wheat yellow mosaic virus infection. J. Integr. Agr.21, 153–169. doi: 10.1016/S2095-3119(21)63619-5
23
Li H. B. Vaillancourt R. Mendham N. Zhou M. X. (2008). Comparative mapping of quantitative trait loci associated with waterlogging tolerance in barley (Hordeum vulgare l.). BMC Genomics9, 401–413. doi: 10.1186/1471-2164-9-401
24
Luan H. Y. Guo B. J. Pan Y. H. Lv C. Shen H. Q. Xu R. G. (2018b). Morpho-anatomical and physiological responses to waterlogging stress in different barley (Hordeum vulgare l.) genotypes. Plant Growth Regul.85, 399–409. doi: 10.1007/s10725-018-0401-9
25
Luan H. Y. Guo B. J. Shen H. Q. Pan Y. H. Hong Y. Lv C. et al . (2020). Overexpression of barley transcription factor HvERF2.11 in arabidopsis enhances plant waterlogging tolerance. Int. J. Mol. Sci.6, 1982. doi: 10.3390/ijms21061982
26
Luan H. Y. Shen H. Q. Pan Y. H. Guo B. J. Lv C. Xu R. G. (2018a). Elucidating the hypoxic stress response in barley (Hordeum vulgare l.) during waterlogging: A proteomics approach. Sci. Rep.8, 1–13. doi: 10.1038/s41598-018-27726-1
27
Luan H. Y. Shen H. Q. Zhang Y. H. Zang H. Qiao H. L. Tao H. et al . (2016). Comparative transcriptome analysis of barley (Hordeum vulgare l.) glossy mutant using RNA-seq. Braz. J. Bot.40, 247–256. doi: 10.1007/s40415-016-0328-1
28
Luo M. J. Zhang Y. X. Li J. N. Zhang P. P. Chen K. Song W. et al . (2021). Molecular dissection of maize seedling salt tolerance using a genome-wide association analysis method. Plant Biotechnol. J.19, 1937–1951. doi: 10.1111/pbi.13607
29
Mascher M. Gundlach H. Himmelbach A. Beier S. Twardziok S. Wicker T. et al . (2017). A chromosome conformation capture ordered sequence of the barley genome. Nature544, 427–433. doi: 10.1038/nature22043
30
Mwando E. Han Y. Angessa T. T. Zhou G. Hill C. B. Zhang X. Q. et al . (2020). Genome-wide association study of salinity tolerance during germination in barley (Hordeum vulgare l.). Front. Plant Sci.11, 118. doi: 10.3389/fpls.2020.00118
31
Pan Y. H. Zhu J. Hong Y. Zhang M. Lv C. Guo B. J. et al . (2022). Screening of stable resistant accessions and identification of resistance loci to barley yellow mosaic virus disease. Peer. J.10, e13128. doi: 10.7717/peerj.13128
32
Pegler J. L. Grof C. P. L. Eamens A. L. (2018). Profiling of the differential abundance of drought and salt stress-responsive MicroRNAs across grass crop and genetic model plant species. Agron. J.8, 118. doi: 10.3390/agronomy8070118
33
Reig-Valiente J. L. Marques L. Talon M. Domingo C. (2018). Genome-wide association study of agronomic traits in rice cultivated in temperate regions. BMC Genomics19, 706. doi: 10.1186/s12864-018-5086-y
34
Setter T. L. Waters I. (2003). Review of prospects for germplasm improvement for waterlogging tolerance in wheat, barley and oats. Plant Soil253, 1–34. doi: 10.1023/A:1024573305997
35
Sharmin R. A. Bhuiyan M. R. Lv W. H. Yu Z. P. Chang F. G. Kong J. J. et al . (2020). RNA-Seq based transcriptomic analysis revealed genes associated with seed-flooding tolerance in wild soybean (Glycine soja sieb. & zucc.). Environ. Exp. Bot.171, 103906. doi: 10.1016/j.envexpbot.2019.103906
36
Shen C. W. Yuan J. P. Qiao H. Wang Z. J. Liu Y. H. Ren X. J. et al . (2020). Transcriptomic and anatomic profiling reveal the germination process of different wheat varieties in response to waterlogging stress. BMC Genet.21, 93. doi: 10.1186/s12863-020-00901-y
37
Tarawneh R. A. Alqudah A. M. Nagel M. Börner A. (2020). Genome-wide association mapping reveals putative candidate genes for drought tolerance in barley. Environ. Exp. Bot.180, 104237. doi: 10.1016/j.envexpbot.2020.104237
38
Tu Y. S. Fu L. B. Wang F. Y. Wu D. Z. Zhang G. P. (2021). GWAS and transcriptomic integrating analysis reveals key salt-responding genes controlling na+ content in barley roots. Plant Physiol. Bioch.167, 596–606. doi: 10.1016/j.plaphy.2021.08.038
39
Wang K. Li M. Hakonarson H. (2010). ANNOVAR: functional annotation of genetic variants from high-throughput sequencing data. Nucleic Acids Res.38, e164. doi: 10.1093/nar/gkq603
40
Wang L. H. Liu Y. L. Gao L. Yang X. C. Zhang X. Xie S. P. et al . (2022). Identification of candidate forage yield genes in sorghum (Sorghum bicolor l.) using integrated genome-wide association studies and RNA-seq. Front. Plant Sci.12, 788433. doi: 10.3389/fpls.2021.788433
41
Wang H. L. Yan A. L. Sun L. Zhang G. J. Wang X. Y. Ren J. C. et al . (2020). Novel stable QTLs identification for berry quality traits based on high-density genetic linkage map construction in table grape. BMC. Plant Biol.20, 411. doi: 10.1186/s12870-020-02630-x
42
Wu Y. Shi H. M. Yu H. F. Ma Y. Hu H. B. Han Z. G. et al . (2022). Combined GWAS and transcriptome analyses provide new insights into the response mechanisms of sunflower against drought stress. Front. Plant Sci.13, 847435. doi: 10.3389/fpls.2022.847435
43
Xu X. W. Chen M. Y. Ji J. Xu Q. Qi X. H. Chen X. H. (2017). Comparative RNA-seq based transcriptome profiling of waterlogging response in cucumber hypocotyls reveals novel insights into the de novo adventitious root primordia initiation. BMC Plant Biol.17, 129. doi: 10.1186/s12870-017-1081-8
44
Xue D. W. Zhou M. X. Zhang X. Q. Chen S. Wei K. Zeng F. R. et al . (2010). Identification of QTLs for yield and yield components of barley under different growth conditions. J. Zhejiang. Univ-SC. B.11, 169–176. doi: 10.1631/jzus.B0900332
45
Xu X. Sharma R. Tondelli A. Russell J. Comadran J. Schnaithmann F. et al . (2018). Genome-wide association analysis of grain yield-associated traits in a pan-European barley cultivar collection. Plant Genome.11, 170073. doi: 10.3835/plantgenome2017.08.0073
46
Xu K. N. Xu X. Fukao T. Canlas P. Maghirang-Rodriguez R. Heuer S. et al . (2006). Sub1A is an ethylene-response-factor-like gene that confers submergence tolerance to rice. Nature442, 705–708. doi: 10.1038/nature04920
47
Yuan Y. C. Xing H. X. Zeng W. G. Xu J. L. Mao L. L. Wang L. Y. et al . (2019). Genome-wide association and differential expression analysis of salt tolerance in gossypium hirsutum l at the germination stage. BMC Plant Biol.19, 394. doi: 10.1186/s12870-019-1989-2
48
Zhang X. C. Fan Y. Shabala S. Koutoulis A. Shabala L. Johnson P. et al . (2017). A new major-effect QTL for waterlogging tolerance in wild barley (H. spontaneum). Theor. Appl. Genet.130, 1559–1568. doi: 10.1007/s00122-017-2910-8
49
Zhang X. C. Zhou G. F. Shabala S. Koutoulis A. Shabala L. Johnson P. et al . (2016). Identification of aerenchyma formation related QTL in barley that can be effective in breeding for waterlogging tolerance. Theor. Appl. Genet.129, 1167–1177. doi: 10.1007/s00122-016-2693-3
50
Zhao Y. L. Chen W. Cui Y. L. Sang X. H. Lu J. H. Jing H. J. et al . (2021). Detection of candidate genes and development of KASP markers for verticillium wilt resistance by combining genome-wide association study, QTL-seq and transcriptome sequencing in cotton. Theor. Appl. Genet.134, 1063–1081. doi: 10.1007/s00122-020-03752-4
51
Zhou M. X. (2011). Accurate phenotyping reveals better QTL for waterlogging tolerance in barley. Plant Breed.130, 203–208. doi: 10.1111/j.1439-0523.2010.01792.x
52
Zhou M. X. Johnson P. Zhou G. F. Li C. D. Lance R. (2012). Quantitative trait loci for waterlogging tolerance in a barley cross of franklin x YuYaoXiangTian erleng and the relationship between waterlogging and salinity tolerance. Crop Sci.52, 2082–2088. doi: 10.2135/cropsci2012.01.0008
53
Zhou X. Stephens M. (2012). Genome-wide efficient mixed-model analysis for association studies. Nat. Genet.44, 821–824. doi: 10.1038/ng.2310
Summary
Keywords
barley, waterlogging, genome-wide association scan, RNA-seq, candidate genes
Citation
Luan H, Chen C, Yang J, Qiao H, Li H, Li S, Zheng J, Shen H, Xu X and Wang J (2022) Genome-wide association scan and transcriptome analysis reveal candidate genes for waterlogging tolerance in cultivated barley. Front. Plant Sci. 13:1048939. doi: 10.3389/fpls.2022.1048939
Received
20 September 2022
Accepted
24 November 2022
Published
15 December 2022
Volume
13 - 2022
Edited by
Hongxiang Ma, Yangzhou University, China
Reviewed by
Mingyang Quan, Beijing Forestry University, China; Mir Asif Iquebal, Indian Agricultural Statistics Research Institute, Indian Council of Agricultural Research, India
Updates
Copyright
© 2022 Luan, Chen, Yang, Qiao, Li, Li, Zheng, Shen, Xu and Wang.
This is an open-access article distributed under the terms of the Creative Commons Attribution License (CC BY). The use, distribution or reproduction in other forums is permitted, provided the original author(s) and the copyright owner(s) are credited and that the original publication in this journal is cited, in accordance with accepted academic practice. No use, distribution or reproduction is permitted which does not comply with these terms.
*Correspondence: Xiao Xu, luanhaiye@163.com; Jun Wang, 244693584@qq.com
†These authors have contributed equally to this work
This article was submitted to Plant Breeding, a section of the journal Frontiers in Plant Science
Disclaimer
All claims expressed in this article are solely those of the authors and do not necessarily represent those of their affiliated organizations, or those of the publisher, the editors and the reviewers. Any product that may be evaluated in this article or claim that may be made by its manufacturer is not guaranteed or endorsed by the publisher.