 Haitao Yu1,2†
 Yongchao Hao3†Mengyao Li3†Luhao Dong3Naixiu Che3Lijie Wang2Shun Song2
 Yanan Liu2Lingrang Kong3*Shubing Shi1*
- 1College of Agriculture, Xinjiang Agricultural University, Urumqi, Xinjiang, China
- 2Wheat Research Institute, Weifang Academy of Agricultural Sciences, Weifang, Shandong, China
- 3State Key Laboratory of Crop Biology, Shandong Key Laboratory of Crop Biology, College of Agronomy, Shandong Agricultural University, Taian, China
Grain size is a key trait associated with bread wheat yield. It is also the most frequently selected trait during domestication. After the phenotypic characterization of 768 bread wheat accessions in three plots for at least two years, the present study shows that the improved variety showed significantly higher grain size but lower grain protein content than the landrace. Using 55K SNP assay genotyping and large-scale phenotyping population and GWAS data, we identified 5, 6, 6, and 6 QTLs associated with grain length, grain weight, grain area, and thousand grain weight, respectively. Seven of the 23 QTLs showed common association within different locations or years. Most significantly, the key locus associated with grain length, qGL-2D, showed the highest association after years of multi-plot testing. Haplotype and evolution analysis indicated that the superior allele of qGL-2D was mainly hidden in the improved variety rather than in landrace, which may contribute to the significant difference in grain length. A comprehensive analysis of transcriptome and homolog showed that TraesCS2D02G414800 could be the most likely candidate gene for qGL-2D. Overall, this study presents several reliable grain size QTLs and candidate gene for grain length associated with bread wheat yield.
Introduction
Bread wheat is one of the major crops, accounting for nearly 20% of calories in our diet (http://faostat.fao.org). Improvement of yield remains a challenge under heavy population pressure and projected global change (Ray et al., 2013). Grain size is a major determinant of grain weight, besides the number of panicles per plant and the number of grains per panicle (Fan et al., 2006). In wheat breeding, grain size is usually evaluated by grain weight, which is positively correlated with grain length, grain width and grain thickness (Evans, 1972; Fan et al., 2006). Thus, it is vital to identify and introduce favorable genes or alleles controlling grain traits to improve the grain yield in bread wheat breeding.
Using linkage mapping, hundreds of grain size quantitative trait loci (QTLs) have been identified in the past few years (Zhang et al., 2018; Mora-Ramirez et al., 2021; Guo et al., 2022). Recently, multiple signals associated with grain size were detected in different populations via genome-wide association study (GWAS) (Breseghello and Sorrells, 2006a; Breseghello and Sorrells, 2006b; Pang et al., 2020). These QTLs are distributed on all the 21 chromosomes of bread wheat. However, the real genes underlying these QTLs have yet to be identified due to the complexity of parental mapping, QTL effect, QTL × genotype and QTL × QTL interactions. Using homology cloning, several orthologous genes associated with grain traits have been isolated and characterized in bread wheat. For instance, TaGW2 and TaGS5 were isolated in wheat based on OsGW2 and OsGS5 orthologs in rice (Wang et al., 2016; Zhai et al., 2018). TaGW2 is involved in regulation of grain weight and grain number in bread wheat (Zhai et al., 2018). TaGS5 is associated with thousand grain weight (Wang et al., 2016), TaGW8 is related to grain size in bread wheat (Yan et al., 2019). It is still hard to determine the variation in natural elite alleles of these known genes that can be used in marker assisted selection (MAS) of bread wheat. Therefore, it is still very important to explore and identify new QTLs and their natural allelic variation in wheat breeding.
In this study, we constructed a GWAS panel with 768 bread wheat accessions. After phenotypic evaluation in multiple plots for several years, we performed GWAS to the identify grain size of QTLs. A total of 23 grain size QTLs were identified. For a major grain length QTL qGL-2D, we investigated the signatures of natural variation via comprehensive analysis of haplotype and evolutionary features. Finally, one candidate gene associated with qGL-2D was identified. The results suggest that grain size QTLs and grain length candidate genes as well as information may facilitate MAS of these loci/genes in breeding high-yield wheat in the future.
Materials and methods
Materials
A total of 768 bread wheat accessions were used to identify QTLs of grain size, including 683 Chinese resources (560 improved varieties and 123 landraces) and 85 introduced accessions. Field experiments were performed at three locations, i: the Shandong Agricultural University Agronomy Experimental Station in Tai’an from 2016 to 2019, ii: Weifang Academy of Agricultural Sciences in Weifang in 2019, and iii: Jining Academy of Agricultural Sciences in Jining in 2019. Each accession was planted in five-row plots with 5 cm distance between plants and 25 cm distance between rows. The interval between adjacent plots was 50 cm. At the mature stage, we harvest 10 spikes without any mechanical damage, disease or insect infestation. After threshing, we measured thousand grain weight (TGW), grain length (GL), grain width (GW), grain area (GA), grain perimeter (GP), grain roundness (GR), grain diameter (GD), length-to-width ratio (LWR), grain protein content (GPC) and grain starch content (GSC) for each accession using a Crop Grain Appearance Quality Scanning Machine (SC-E, Wanshen Technology Company, Hangzhou, China).
Genotyping
Genomic DNA was extracted from the seedling leaves of all 768 wheat accessions, followed by further genotyping via an Illumina 55K assay. Finally, a total of 47,743 of 53,063 SNPs were identified in the wheat panel. We estimated the whole-genome distribution and minor allele frequency (MAF) of these SNPs using an in-house Python script. Additionally, we performed quality control of SNPs to exclude those with high missing rate (> 50%) and low MAF (< 5%) for further analysis.
Population structure
We first extracted 45,298 SNPs with miss rate ≤ 0.5 and MAF ≥ 0.05 from 53,063 SNPs using an in-house Python script. Using PLINK (window size 50, step size 50, r2 ≥ 0.3), a total of 4,360 independent SNPs were further screened out based on r2 of LD ≤ 0.3 (Purcell et al., 2007). The software STRUCTURE was used to calculate varying levels of K (K = 1-20) (Pritchard et al., 2000). We also performed principal component analysis (PCA) and kinship analysis using these independent SNPs and GAPIT software (Lipka et al., 2012; Tang et al., 2016). The phylogenetic analysis of qGL-2D was performed by generating a neighbor-joining tree using Mega 7 (Kumar et al., 2016).
Association mapping
Only 45,298 un-imputed SNPs with miss rate ≤ 0.5 and MAF ≥ 0.05 were used to conduct GWAS for GL, GW, GA and TGW, respectively. The first three PCs were used to construct the PC matrix. We performed GWAS with a Compressed Mixed Linear Model (CMLM) via PCA and kinship analysis using default settings of GAPIT (Lipka et al., 2012; Tang et al., 2016). Additionally, the threshold to determine significant association was set at 1.0 × 10⁻⁵ after Bonferroni-adjusted correction (Pang et al., 2020).
Expression analysis and epidermal cell observation
Gene expression data from different wheat cultivars were used to analyze the gene expression profiles of the candidate region. Expression data were download from wheat-URGI website (https://wheat-urgi.versailles.inra.fr/Seq-Repository/Expression). Then the transcriptomic information of candidate genes were exacted by a custom python script. Epidermal tissues were peeled off using tweezers under a stereomicroscope. Then, the cell layers were stained with safranin and mounted on glass slides (Matsunami Glass Ind., Japan). The tissue specimens were subjected to observation with a light microscope (BX50F Olympus Optical Co., Ltd, Japan).
Screening of candidate genes for qGL-2D
In order to identify candidate genes for qGL-2D, LD heatmaps surrounding peaks were constructed using the R package “LD heatmap” (Shin et al., 2006). Using pairwise LD correlation (r2 > 0.6), we mined the candidate regions of qGL-2D (Yano et al., 2016). We further investigated the expression of these candidate genes in bread wheat grain using typical materials belonging to different haplotypes.
Results
Population structure and grain characterization of 768 bread wheat accessions
To identify genetic loci associated with grain weight, a panel of 768 bread wheat accessions were constructed, including 560 improved varieties, 123 landraces and 85 introduced accessions. Using a 55K SNP assay, we obtained 47,743 SNPs of the panel. Subsets of these data were further filtered and used in additional analyses (Figure S1). A reasonable assessment of population structure facilitates the identification of real marker-trait associations (Crowell et al., 2016; Juliana et al., 2019). Therefore, we calculated varying levels of K means using un-imputed SNPs and STRUCTURE software (Golbeck, 1987). Landrace, improved and introduced varieties appeared clearly at K = 3 (Figure 1A). Further PCA indicated that top three PCs accounted for 17.09%, 6.15% and 3.38% of genetic variation within the bread wheat panel (Figure 1B). The results suggested obvious genetic differentiation between landrace and improved varieties of bread wheat.
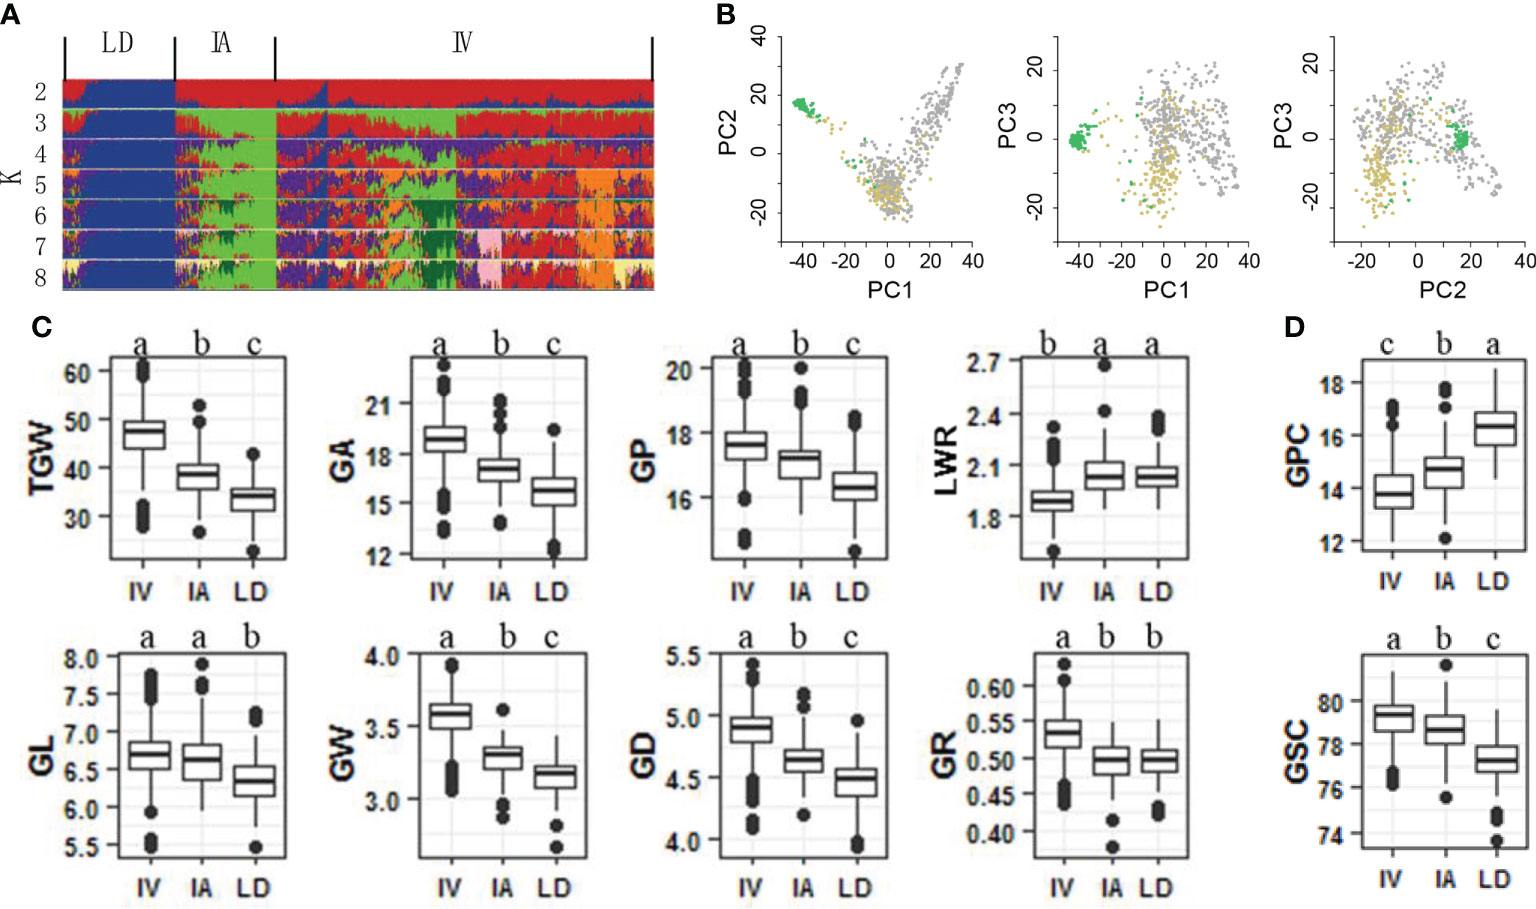
Figure 1 Genetic architecture and characteristic of grain size and grain quality of 768 bread wheat accessions. (A) Genetic structure of the panel analyzed using the program STRUCTURE. Landrace (LD), improved variety (IV) and introduced variety (IA) groups appeared at K = 3. (B) Principle components analysis reveals that the first 3 principle components explain 17.09%, 6.15% and 3.38% of the genetic variance within the panel. Comparison of grain size traits (C) and grain quality traits (D) among LD, IA, IV. Different letters above the boxes indicate significant differents (p < 0.05) when analyzed by Duncan’s test.
A total of 10 traits were identified in three different plots for two years, including eight grain shape components (TGW, GL, GW, GA, GP, GR, GD, and LWR) and two grain quality components (GPC and GSC). All traits showed high heritability from 89.30% (GSC) to 95.27% (TGW) (Table S1). After obtaining the best linear unbiased prediction (BLUP) of each accession with respect to each trait across all traits, the coefficient of variation (CV) of all traits ranged from 1.44% GSC to 15.48% TGW (Table S1). GPC was proved to be negatively correlated with the eight grain size components, suggesting that larger, heavier and longer bread wheat grains usually had lower GPC (Figure S2). During the domestication of landrace to improved variety, bread wheat grains increased in size, weight, and length, but their GPC decreased (Figures 1C, D, 2C).
Identification of grain shape QTLs by GWAS
Focusing on four key grain shape traits (GL, GW, GA and TGW), GWAS was performed to identify QTLs based on their respective multi-year and multi-location data and BLUP. A total of 23 QTLs were detected on 12 chromosomes, including 5, 6, 6 and 6 QTLs for GL, GW, GA and TGW, respectively (Table 1 and Figures S3, S4). Seven of 23 QTLs showed common association within different locations or years, including qGW-2B, qGL-2D, qGW-2D.1, qTGW-4A, qTGW-5A.1, qGA-6D, qTGW-6D and qTGW-7D. Consistent with the positive correlations between GL, GW, GA and TGW (Figure S2), close linkage, and overlapping or one-factor-to-many-effects (pleiotropy) were detected on chromosome 2D (for qGA-2D and qGL-2D), chromosome 5A (for qGA-5A, qTGW-5A.1 and qGL-5A.1), chromosome 6D (for qGA-6D and qTGW-6D), and chromosome 7D (for qGA-7D, qGW-7D and qTGW-7D (Table 1).
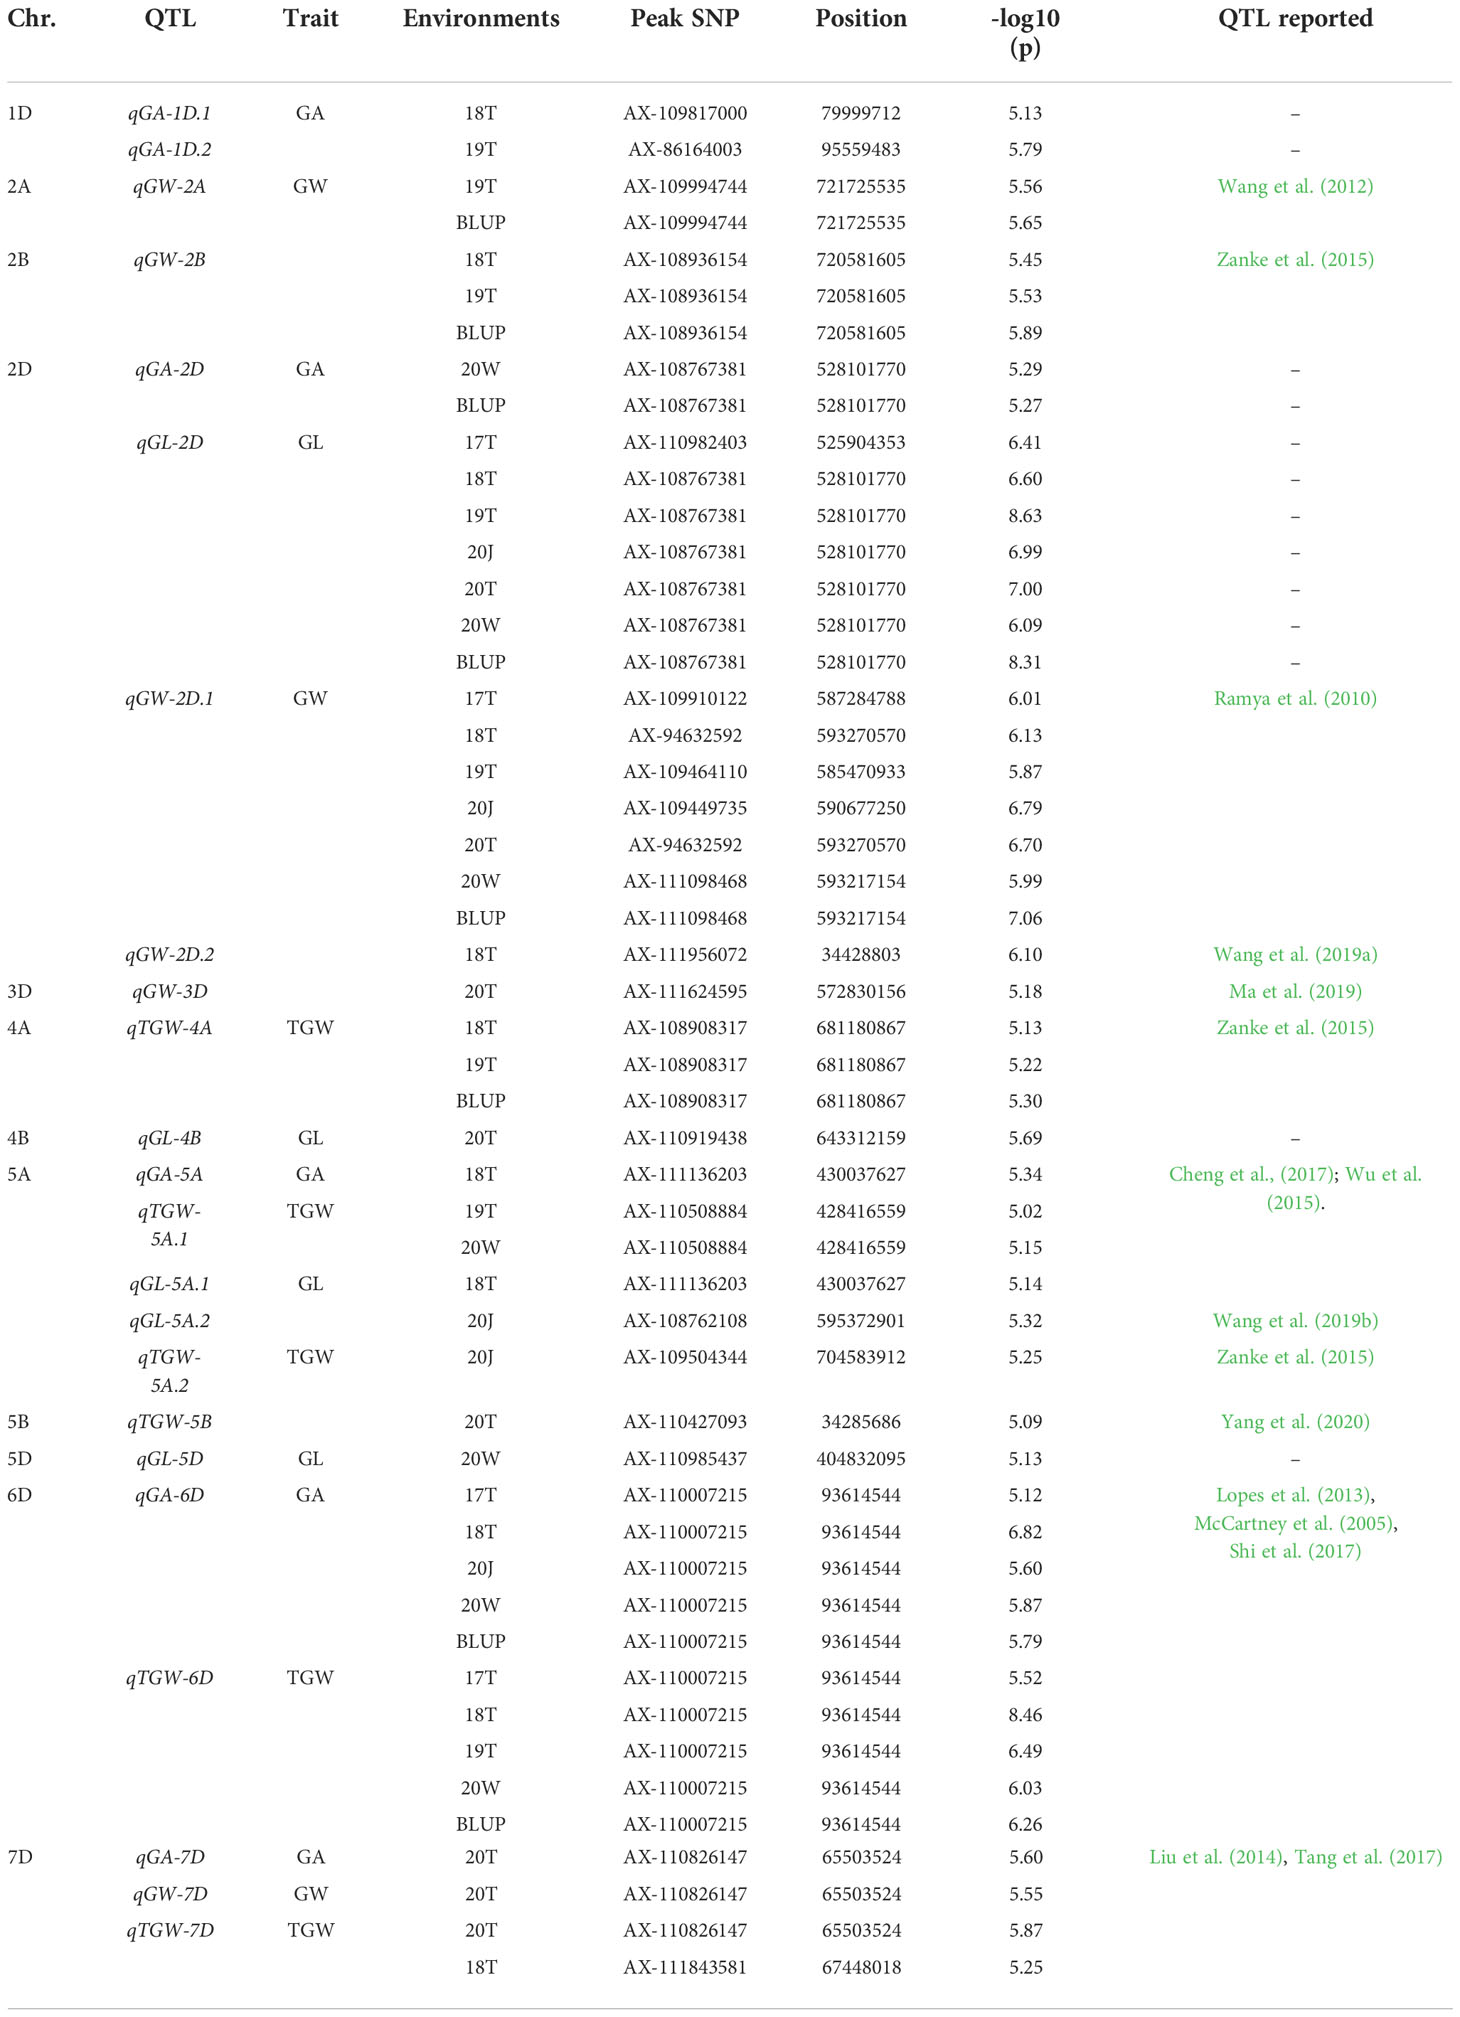
Table 1 QTL identified for grain weight or shape by combined analysis of six environments and BLUP.
To validate the results of GWAS, we compared the localization of the QTLs identified in this study with previously detected QTLs associated with bi-parental mapping population. Twelve of 23 QTLs in this study were co-localized with previously reported QTLs, including 1, 6, 3 and 6 QTLs for GL, GW, GA, and TGW, respectively (Table 1). The qGA-6D and qTGW-6D were detected most frequently (five times), followed by qGA-5A, qTGW-5A.1, qGL-5A.1, qGL-5A.2, qGA-7D, qGW-7D and qTGW-7D (twice), whereas qGW-2A, qGW-2B, qGW-2D.1, qGW-2D.2, qGW-3D, qTGW-4A, qGL-5A.2, qTGW-5A.2 and qTGW-5B were detected rarely (once). Additionally, we also identified six new grain size QTLs, including qGA-1D.1, qGA-1D.2, qGA-2D, qGL-2D and qGL-4B.
Haplotype analysis of qGL-2D
The qGL-2D was a key locus for GL, as it was detected using the data for each location every year and BLUP (Figures 3A, B and Figure S3). Using BLUP of GL yielded five significant SNPs (-log(p) > 5) representing qGL-2D. Thus, the five SNPs were identified via qGL-2D haplotype analysis. A total of seven haplotypes were detected, including two high-frequency haplotypes (HAP1 and HAP4, 36.6% and 56.4%), two low-frequency haplotypes (HAP2 and HAP3, 3.6% and 2.8%) and three rare haplotypes (HAP5-7, < 1%) (Figure 3C). Among them, GL was the shortest in HAP1 (6.56 mm), followed by HAP2 (6.57 mm) and HAP3 (6.70 mm), whereas HAP4 had the longest GL (Figure 3C). For other five traits were related to grain shape (GA, GW, GD and HGW) and grain quality (GPC). The HAP4 exhibited the greatest GA, GW, GD, and HGW, and the lowest GPC (Figure 3D). The results suggested that qGL-2D was widely involved in grain shape and grain quality.
To determine the evolutionary features of qGL-2D, we conducted a phylogenetic analysis of the seven haplotypes. Two major clades were formed (Figure 3E). One clade contained a widely divergent group, including HAP4, HAP3, HAP2 and HAP7, the most prevalent haplotypes associated with improved varieties of bread wheat. Another major haplotype in bread wheat landrace, HAP1, was clustered in the other clade (Figure 3E). In summary, the qGL-2D allele associated with improved varieties of bread wheat showed substantial genetic differences compared with bread wheat landrace, which could be attributed to selective effects on large grain during the process of modern bread wheat improvement.
Determination of candidate genes within qGL-2D
To analyze the candidate gene within qGL-2D, we defined the QTL region based on local LD. As indicated in the LD heatmap, an interval from 522,544,495 to 533,987,666 bp on chromosome 2D was an LD block with r2 > 0.6 (Figure 2A). The qGL-2D contains 125 annotated genes. To further reduce the candidate number, we performed transcriptome analysis using one short-grain accession (Chinese Spring (HAP1)), two long-grain bread wheat accessions (Aikang 58 (HAP4), 04chu122 (HAP5)) and 5 BC2 near isogenic lines (NILs) carrying qGL-2D 04chu122 or aikang58 segment (Figure 2B). A total of 29 expressed genes were identified in eight accessions mentioned above (Table S2), and only TraesCS2D02G414800 showed higher expression within two long-grain and eight NILs than in one short-grain accession (Figures 2D, E). Homology analysis showed that TraesCS2D02G414800 encodes oleosin, which is involved in seed maturation and germination. Taken together, the results provide possible key candidates for further investigation of the molecular mechanism underlying GL within bread wheat.
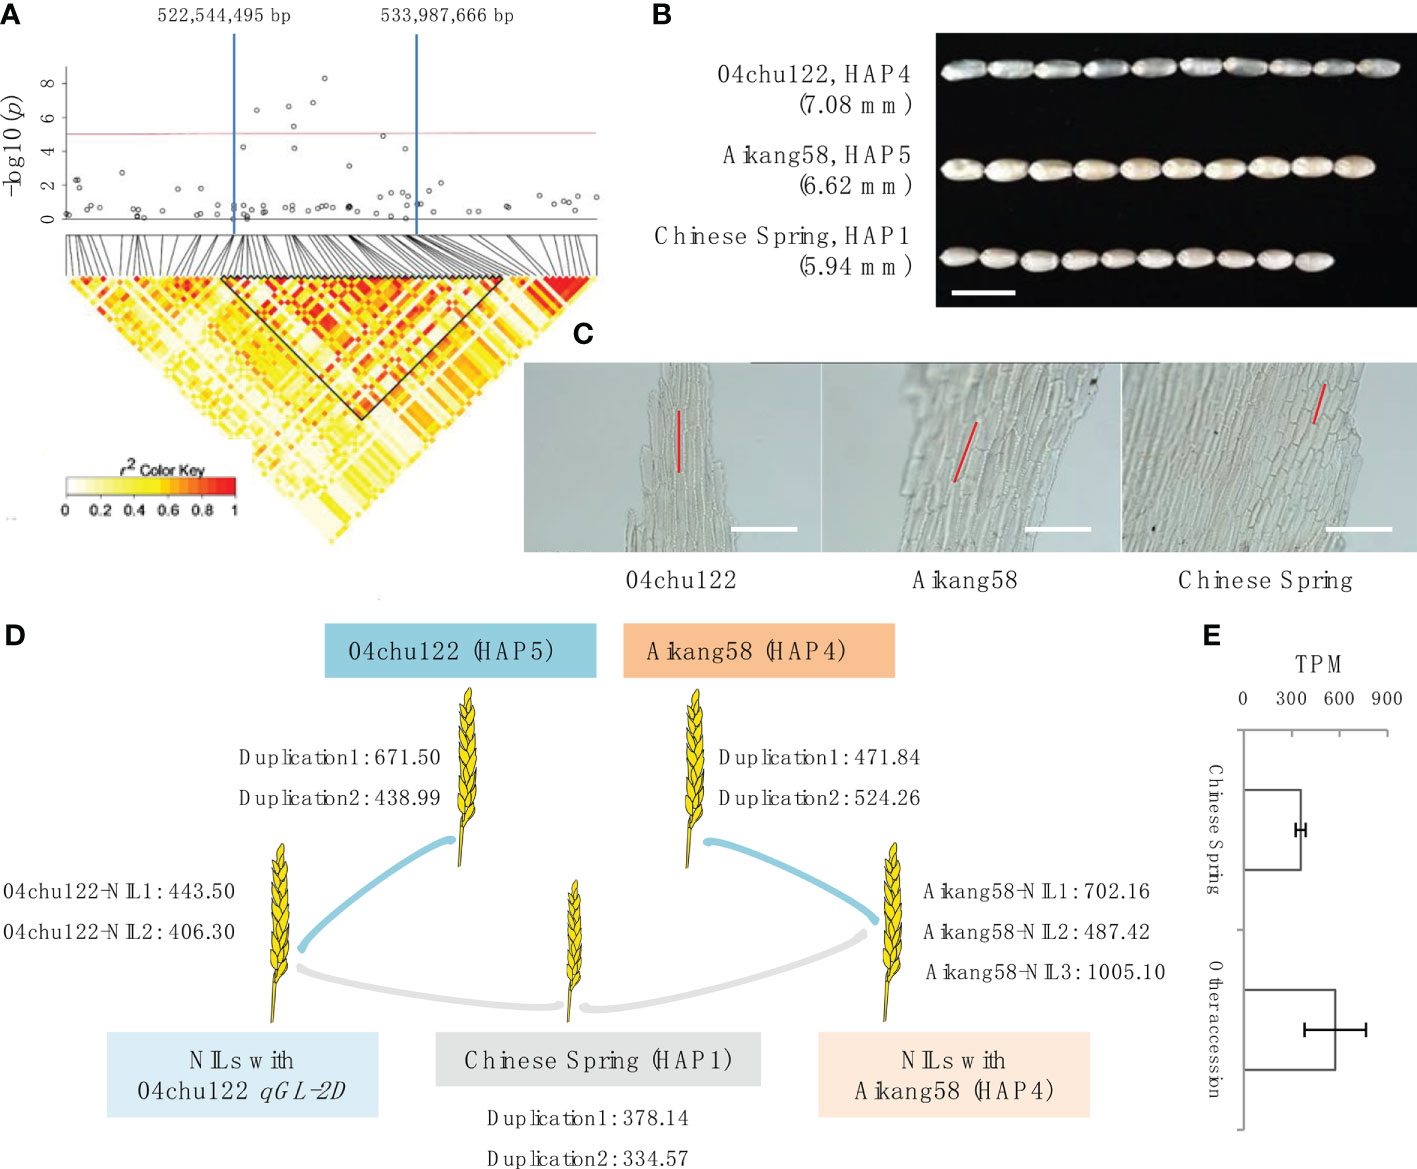
Figure 2 Identification and haplotype analysis of grain length QTL qGL-2D. Quantile-quantile (Q-Q) plot (A) and manhattan plot (B) using 7 groups of GL data of multi-year and multi-plots. qGL-2D is an association signal detected in all tests. (C) qGL-2D haplotype analysis and comparisons of grain length (GL) among four qGL-2D haplotypes. (D) Comparison of grain area (GA), grain perimeter (GP), grain width (GW), length-width ratio (LWR), grain diameter (GD), grain roundness (GR), hundred grain weight (HGW) and grain protein content (GPC) among four qGL-2D haplotypes. For better chart presentation, TGW is replaced by HGW. (E) Phylogenetic tree of the four qGL-2D haplotypes. The number of landrace (LD), improved variety (IV) and introduced variety (IV) are marked for four haplotypes.
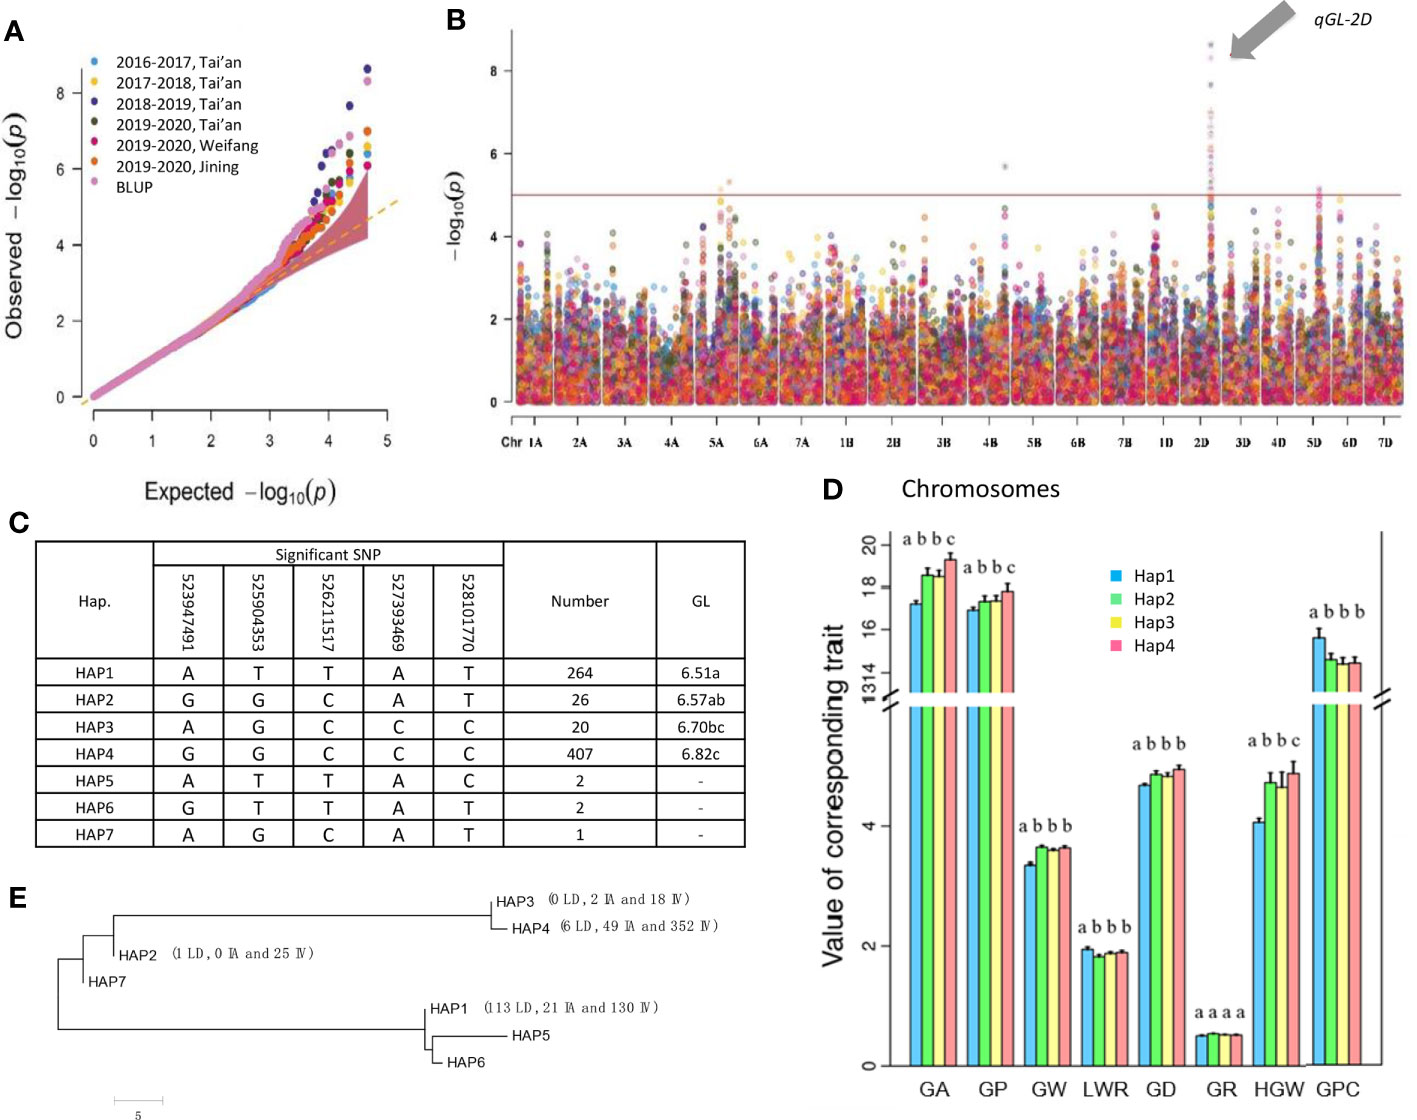
Figure 3 Determination of candidate genes within qGL-2D. (A) Association signals (top) and LD heatmap (bottom) of qGL-2D. Triangular block shows region with strong local LD (r2 > 0.6). (B) Grain length of 04chu122, Aikang58 and Chinese Spring. Scale bar, 10 mm. (C) Epidermal cell length of 04chu122, Aikang58 and Chinese Spring. Scale bars, 200 um. (D) Expression level of TraesCS2D02G414800 in 04chu122, Aikang58, Chinese Spring and NILs carried 04chu122 qGL-2D or Aikang58 qGL-2D. (E) Comparison of expression level of Chinese Spring (HAP1), and the other accessions including 04chu122 (HAP5), Aikang58 (HAP4) and NILs carried 04chu122 qGL-2D and Aikang58 qGL-2D.
Discussion
Grain size is one of the most frequently selected traits during domestication (Meyer and Purugganan, 2013; Zuo and Li, 2014). Among the many yield-related traits, increased grain size is the main factor associated with increased grain yield at a certain stage of domestication (Zheng et al., 2011). The grains of wild relatives are usually small and round in shape, and domestication has greatly increased the diversity of grain shape and size together with other changes (Fan et al., 2006). Grain size is predominantly determined by genetic factors, whereas grain filling is controlled by both genetic and environmental factors (Sakamoto and Matsuoka, 2008). Our study validated the significant changes in grain size of landrace to improved variety of bread wheat, and also suggested further accumulation of large-size alleles within improved variety rather than landrace. The most significant finding of the present study was the key locus for GL, qGL-2D, which showed the highest association after years of multi-plot testing. Haplotype and evolution analysis indicated that the superior allele of qGL-2D was mainly hidden in the improved variety rather than in landrace, which may result in significant difference in GL. Identification of the differential expression yielded a single candidate gene of qGL-2D. The results provide the opportunity for the delineation of the regulatory mechanism and related processes during grain development.
The coordination of grain size (weight) and grain quality is a major goal in breeding, as the increased grain size often reduces grain quality (Sakamoto and Matsuoka, 2008; Wang et al., 2012). Correlations between traits are a common biological phenomenon, especially those associated with determination of spike, growth duration, yield, and root and shoot (Crowell et al., 2016; Li et al., 2018; Zhao et al., 2019; Zhao et al., 2021). The present study indicated that the grain size increased while the GPC of bread wheat decreased from landrace to improved variety. The long-grain allele of qGL-2D showed a lower GPC, while the short-grain allele of qGL-2D showed a higher GPC. Pleiotropy and LD in natural population are usually considered as the main factors underlying this phenomenon, which is a major challenge in future breeding programs (Chen and Lübberstedt, 2010; Crowell et al., 2016). The role of two complementary genes associated with grain yield and grain quality requires further analysis (Zuo and Li, 2014).
Data availability statement
The data presented in the study are deposited in the OMIX repository (https://ngdc.cncb.ac.cn/omix/), accession number OMIX002373.
Author contributions
S.B.S. and L.R.K. designed and supervised the work; H.T.Y., M.Y.L., L.H.D., N.X.C., L.J.W., S.S. and Y.N.L. performed the research; H.T.Y. and Y.C.H. analyzed the data; H.T.Y. and S.B.S. wrote the paper. All authors read and approved the final manuscript.
Funding
This work was supported by the Natural Science Foundation of Shandong Province (ZR2020MC096 and ZR2021ZD31).
Conflict of interest
The authors declare that the research was conducted in the absence of any commercial or financial relationships that could be construed as a potential conflict of interest.
Publisher’s note
All claims expressed in this article are solely those of the authors and do not necessarily represent those of their affiliated organizations, or those of the publisher, the editors and the reviewers. Any product that may be evaluated in this article, or claim that may be made by its manufacturer, is not guaranteed or endorsed by the publisher.
Supplementary material
The Supplementary Material for this article can be found online at: https://www.frontiersin.org/articles/10.3389/fpls.2022.1072904/full#supplementary-material
References
Breseghello, F., Sorrells, M. E. (2006a). Association analysis as a strategy for improvement of quantitative traits in plants. Crop Sci. 46, 1323–1330. doi: 10.2135/cropsci2005.09-0305
Breseghello, F., Sorrells, M. E. (2006b). Association mapping of kernel size and milling quality in wheat (Triticum aestivum l.) cultivars. Genetics 172, 1165–1177. doi: 10.1534/genetics.105.044586
Chen, Y., Lübberstedt, T. (2010). Molecular basis of trait correlations. Trends Plant Sci. 15, 454–461. doi: 10.1016/j.tplants.2010.05.004
Cheng, R., Kong, Z., Zhang, L., Xie, Q., Jia, H., Yu, D., et al. (2017). Mapping QTLs controlling kernel dimensions in a wheat inter-varietal RIL mapping population. Theor. Appl. Genet. 130, 1405–1414. doi: 10.1007/s00122-017-2896-2
Crowell, S., Korniliev, P., Falcão, A., Ismail, A., Gregorio, G., Mezey, J., et al. (2016). Genome-wide association and high-resolution phenotyping link oryza sativa panicle traits to numerous trait-specific QTL clusters. Nat. Commun. 7, 10527. doi: 10.1038/ncomms10527
Fan, C., Xing, Y., Mao, H., Lu, T., Han, B., Xu, C., et al. (2006). GS3, a major QTL for grain length and weight and minor QTL for grain width and thickness in rice, encodes a putative transmembrane protein. Theor. Appl. Genet. 112, 1164–1171. doi: 10.1007/s00122-006-0218-1
Golbeck, J. H. (1987). Structure, function and organization of the photosystem I reaction center complex. Biochim. Biophys. Acta 895, 167–204. doi: 10.1016/S0304-4173(87)80002-2
Guo, X., Fu, Y., Lee, Y. J., Chern, M., Li, M., Cheng, M., et al. (2022). The PGS1 basic helix-loop-helix protein regulates Fl3 to impact seed growth and grain yield in cereals. Plant Biotechnol. J. 20, 1311–1326. doi: 10.1111/pbi.13809
Juliana, P., Poland, J., Huerta-Espino, J., Shrestha, S., Crossa, J., Crespo-Herrera, L., et al. (2019). Improving grain yield, stress resilience and quality of bread wheat using large-scale genomics. Nat. Genet. 51, 1530–1539. doi: 10.1038/s41588-019-0496-6
Kumar, S., Stecher, G., Tamura, K. (2016). MEGA7: Molecular evolutionary genetics analysis version 7.0 for bigger datasets. Mol. Biol. Evol. 33, 1870–1874. doi: 10.1093/molbev/msw054
Lipka, A. E., Tian, F., Wang, Q., Peiffer, J., Li, M., Bradbury, P. J., et al. (2012). GAPIT: Genome association and prediction integrated tool. Bioinformatics 28, 2397. doi: 10.1093/bioinformatics/bts444
Li, F., Xie, J., Zhu, X., Wang, X., Zhao, Y., Ma, X., et al. (2018). Genetic basis underlying correlations among growth duration and yield traits revealed by GWAS in rice (Oryza sativa l.). Front. Plant Sci. 9. doi: 10.3389/fpls.2018.00650
Liu, G., Jia, L., Lu, L., Qin, D., Zhang, J., Guan, P., et al. (2014). Mapping QTLs of yield-related traits using RIL population derived from common wheat and Tibetan semi-wild wheat. Theor. Appl. Genet. 127, 2415–2432. doi: 10.1007/s00122-014-2387-7
Lopes, M. S., Reynolds, M. P., Mcintyre, C. L., Mathews, K. L., Jalal Kamali, M. R., Mossad, M., et al. (2013). QTL for yield and associated traits in the Seri/Babax population grown across several environments in Mexico, in the West Asia, north Africa, and south Asia regions. Theor. Appl. Genet. 126, 971–984. doi: 10.1007/s00122-012-2030-4
Ma, J., Zhang, H., Li, S., Zou, Y., Li, T., Liu, J., et al. (2019). Identification of quantitative trait loci for kernel traits in a wheat cultivar Chuannong16. BMC Genet. 20, 77. doi: 10.1186/s12863-019-0782-4
Mccartney, C. A., Somers, D. J., Humphreys, D. G., Lukow, O., Ames, N., Noll, J., et al. (2005). Mapping quantitative trait loci controlling agronomic traits in the spring wheat cross RL4452x'AC domain'. Genome 48, 870–883. doi: 10.1139/g05-055
Meyer, R. S., Purugganan, M. D. (2013). Evolution of crop species: genetics of domestication and diversification. Nat. Rev. Genet. 14, 840–852. doi: 10.1038/nrg3605
Mora-Ramirez, I., Weichert, H., Wirén, N., Frohberg, C., Bodt, S., Schmidt, R. C., et al. (2021). Theda1 mutation in wheat increases grain size under ambient and elevated CO2 but not grain yield due to trade-off between grain size and grain number. Plant-Environment Interact. 2, 61–73. doi: 10.1002/pei3.10041
Pang, Y., Liu, C., Wang, D., St. Amand, P., Bernardo, A., Li, W., et al. (2020). High-resolution genome-wide association study identifies genomic regions and candidate genes for important agronomic traits in wheat. Mol. Plant 13, 1311–1327. 10.1016/j.molp.2020.07.008
Pritchard, J. K., Stephens, M., Donnelly, P. (2000). Inference of population structure using multilocus genotype data. Genetics 155, 945–959. doi: 10.1093/genetics/155.2.945
Purcell, S., Neale, B., Todd-Brown, K., Thomas, L., Ferreira, M. A. R., Bender, D., et al. (2007). PLINK: A tool set for whole-genome association and population-based linkage analyses. Am. J. Hum. Genet. 81, 559–575. doi: 10.1086/519795
Ramya, P., Chaubal, A., Kulkarni, K., Gupta, L., Kadoo, N., Dhaliwal, H. S., et al. (2010). QTL mapping of 1000-kernel weight, kernel length, and kernel width in bread wheat (Triticum aestivum l.). J. Appl. Genet. 51, 421–429. doi: 10.1007/BF03208872
Ray, D. K., Mueller, N. D., West, P. C., Foley, J. A. (2013). Yield trends are insufficient to double global crop production by 2050. PloS One 8, e66428. doi: 10.1371/journal.pone.0066428
Sakamoto, T., Matsuoka, M. (2008). Identifying and exploiting grain yield genes in rice. Curr. Opin. Plant Biol. 11, 209–214. doi: 10.1016/j.pbi.2008.01.009
Shi, S., Azam, F. I., Li, H., Chang, X., Jing, R. (2017). Mapping QTL for stay-green and agronomic traits in wheat under diverse water regimes. Euphytica 213, 246. doi: 10.1007/s10681-017-2002-5
Shin, J.-H., Blay, S., Mcneney, B., Graham, J. (2006). LDheatmap: An r function for graphical display of pairwise linkage disequilibria between single nucleotide polymorphisms. J. Stat. Software 16, 1–9. doi: 10.18637/jss.v016.c03
Tang, Y., Liu, X., Wang, J., Li, M., Wang, Q., Tian, F., et al. (2016). GAPIT version 2: An enhanced integrated tool for genomic association and prediction. Plant Genome 9, 1–9. doi: 10.3835/plantgenome2015.11.0120
Tang, H., Wang, H., He, M., Zhang, M., Hu, Y., Li, Z., et al. (2017). QTL analysis for wheat falling number in a recombinant inbred line population segregated with 1BL/1RS translocation in a rainfed agricultural area of China. Euphytica 213, 235. doi: 10.1007/s10681-017-2028-8
Wang, S., Kun, W., Yuan, Q., Liu, X., Liu, Z., Lin, X., et al. (2012). Control of grain size, shape and quality by OsSPL16 in rice. Nat. Genet. 44, 950–954. doi: 10.1038/ng.2327
Wang, S., Yan, X., Wang, Y., Liu, H., Cui, D., Chen, F. (2016). Haplotypes of the TaGS5-A1 gene are associated with thousand-kernel weight in chinese bread wheat. Front. Plant Sci. 7. doi: 10.3389/fpls.2016.00783
Wang, X., Dong, L., Hu, J., Pang, Y., Hu, L., Xiao, G., et al. (2019b). Dissecting genetic loci affecting grain morphological traits to improve grain weight via nested association mapping. Theor. Appl. Genet. 132, 3115–3128. doi: 10.1007/s00122-019-03410-4
Wang, J., Li, X., Do Kim, K., Scanlon, M. J., Jackson, S. A., Springer, N. M., et al. (2019a). Genome-wide nucleotide patterns and potential mechanisms of genome divergence following domestication in maize and soybean. Genome Biol. 20, 74. doi: 10.1186/s13059-019-1683-6
Wu, Q. H., Chen, Y. X., Zhou, S. H., Fu, L., Chen, J. J., Xiao, Y., et al. (2015). High-density genetic linkage map construction and QTL mapping of grain shape and size in the wheat population Yanda1817 × Beinong6. PloS One 10, e0118144. doi: 10.1371/journal.pone.0118144
Yang, L., Zhao, D., Meng, Z., Xu, K., Yan, J., Xia, X., et al. (2020). QTL mapping for grain yield-related traits in bread wheat via SNP-based selective genotyping. Theor. Appl. Genet. 133, 857–872. doi: 10.1007/s00122-019-03511-0
Yano, K., Yamamoto, E., Aya, K., Takeuchi, H., Lo, P.-C., Hu, L., et al. (2016). Genome-wide association study using whole-genome sequencing rapidly identifies new genes influencing agronomic traits in rice. Nat. Genet. 48, 927–934. doi: 10.1038/ng.3596
Yan, X., Zhao, L., Ren, Y., Dong, Z., Cui, D., Chen, F. (2019). Genome-wide association study revealed that the TaGW8 gene was associated with kernel size in Chinese bread wheat. Sci. Rep. 9, 2702. doi: 10.1038/s41598-019-38570-2
Zanke, C., Ling, J., Plieske, J., Kollers, S., Ebmeyer, E., Korzun, V., et al (2015). Analysis of main effect QTL for thousand grain weight in European winter wheat (Triticum aestivum L.) by genome-wide association mapping. Frontiers in Plant Science 6. doi: 10.3389/fpls.2015.00644
Zhai, H., Feng, Z., Du, X., Song, Y., Liu, X., Qi, Z., et al. (2018). A novel allele of TaGW2-A1 is located in a finely mapped QTL that increases grain weight but decreases grain number in wheat (Triticum aestivum l.). Theor. Appl. Genet. 131, 539–553. doi: 10.1007/s00122-017-3017-y
Zhang, Y., Li, D., Zhang, D., Zhao, X., Cao, X., Dong, L., et al. (2018). Analysis of the functions of TaGW2 homoeologs in wheat grain weight and protein content traits. Plant J. 94, 857–866. doi: 10.1111/tpj.13903
Zhao, Y., Jiang, C., Rehman, R. M. A., Zhang, H., Li, J., Li, Z. (2019). Genetic analysis of roots and shoots in rice seedling by association mapping. Genes Genomics 41, 95–105. doi: 10.1007/s13258-018-0741-x
Zhao, Y., Yin, Z., Wang, X., Jiang, C., Aslam, M. M., Gao, F., et al. (2021). Genetic basis and network underlying synergistic roots and shoots biomass accumulation revealed by genome-wide association studies in rice. Sci. Rep. 11, 13769. doi: 10.1038/s41598-021-93170-3
Zheng, T. C., Zhang, X. K., Yin, G. H., Wang, L. N., Han, Y. L., Chen, L., et al. (2011). Genetic gains in grain yield, net photosynthesis and stomatal conductance achieved in henan province of China between 1981 and 2008. Field Crops Res. 122, 225–233. doi: 10.1016/j.fcr.2011.03.015
Keywords: wheat, grain size, mapping, GWAS, yield
Citation: Yu H, Hao Y, Li M, Dong L, Che N, Wang L, Song S, Liu Y, Kong L and Shi S (2022) Genetic architecture and candidate gene identification for grain size in bread wheat by GWAS. Front. Plant Sci. 13:1072904. doi: 10.3389/fpls.2022.1072904
Received: 18 October 2022; Accepted: 08 November 2022;
Published: 30 November 2022.
Edited by:
Jun Li, Zhejiang University, ChinaCopyright © 2022 Yu, Hao, Li, Dong, Che, Wang, Song, Liu, Kong and Shi. This is an open-access article distributed under the terms of the Creative Commons Attribution License (CC BY). The use, distribution or reproduction in other forums is permitted, provided the original author(s) and the copyright owner(s) are credited and that the original publication in this journal is cited, in accordance with accepted academic practice. No use, distribution or reproduction is permitted which does not comply with these terms.
*Correspondence: Shubing Shi, c3NiQHhqYXUuZWR1LmNu; Lingrang Kong, bGtvbmdAc2RhdS5lZHUuY24=
†These authors have contributed equally to this work