 Xinmei Ma1†
 Jian Ning Liu1†Liping Yan2†Qiang Liang1,3,4
 Hongcheng Fang1,3,4Changxi Wang1
 Yuhui Dong1,3,4Zejia Chai1Rui Zhou1Yan Bao1Wenrui Hou1
 Ke Qiang Yang1,3,4*Dejun Wu2*
- 1College of Forestry, Shandong Agricultural University, Tai’an, China
- 2Shandong Provincial Academy of Forestry, Jinan, China
- 3State Forestry and Grassland Administration Key Laboratory of Silviculture in the Downstream Areas of the Yellow River, Shandong Agricultural University, Tai’an, China
- 4Shandong Taishan Forest Ecosystem Research Station, Shandong Agricultural University, Tai’an, China
Fraxinus velutina Torr with high salt tolerance has been widely grown in saline lands in the Yellow River Delta, China. However, the salt-tolerant mechanisms of F. velutina remain largely elusive. Here, we identified two contrasting cutting clones of F. velutina, R7 (salt-tolerant), and S4 (salt-sensitive) by measuring chlorophyll fluorescence characteristics (Fv/Fm ratio) in the excised leaves and physiological indexes in roots or leaves under salt treatment. To further explore the salt resistance mechanisms, we compared the transcriptomes of R7 and S4 from leaf and root tissues exposed to salt stress. The results showed that when the excised leaves of S4 and R7 were, respectively, exposed to 250 mM NaCl for 48 h, Fv/Fm ratio decreased significantly in S4 compared with R7, confirming that R7 is more tolerant to salt stress. Comparative transcriptome analysis showed that salt stress induced the significant upregulation of stress-responsive genes in R7, making important contributions to the high salt tolerance. Specifically, in the R7 leaves, salt stress markedly upregulated key genes involved in plant hormone signaling and mitogen-activated protein kinase signaling pathways; in the R7 roots, salt stress induced the upregulation of main genes involved in proline biosynthesis and starch and sucrose metabolism. In addition, 12 genes encoding antioxidant enzyme peroxidase were all significantly upregulated in both leaves and roots. Collectively, our findings revealed the crucial defense pathways underlying high salt tolerance of R7 through significant upregulation of some key genes involving metabolism and hub signaling pathways, thus providing novel insights into salt-tolerant F. velutina breeding.
Introduction
Soil salinization has become a global major challenge. Saline soils are a major contributor to the regional fragile ecosystems, thereby posing a heavy burden on the sustainable advancement of local economies (Egamberdieva et al., 2019; Wani et al., 2020). As one kind of the most important tree species for afforestation, the Fraxinus species play crucial roles in ecological restoration (Yildiz et al., 2018; He et al., 2021). Thus, it is of importance to breeding high salt-tolerant Fraxinus species suitable for afforestation, especially in the areas with heavy saline-alkaline pollution. Fraxinus velutina Torr is a deciduous tree native to southwestern North America. Due to the rapid growth rate and superior salinity tolerance, the species has been intentionally introduced and widely planted in saline land in the Yellow River Delta, China (Mao et al., 2017). However, the molecular mechanisms underlying the high salt tolerance of F. velutina remain largely unknown.
Saline stress imposes primary stresses (ionic and osmotic) and secondary stresses (oxidative stress) on plants (Zhu, 2002; Yang and Guo, 2018a). Thus, plants mainly rely on the reestablishment of cellular homeostasis, namely, ionic, osmotic, and reactive oxygen species (ROS) to cope with salt stress. The process is complicated and involved in multiple signals and pathways, such as Ca2+, plant hormone, and ROS signaling pathways (Yang and Guo, 2018b). After salt exposure, the excessive extracellular Na+ induces the generation of several second messengers (e.g., cytosolic Ca2+), which are sensed by their sensors/receptors and protein kinases including mitogen-activated protein kinase (MAPK) and then transduce the stimuli signals into downstream components that switch on transcriptional cascades to defense against salt stress (Chinnusamy et al., 2004; Huang et al., 2012; Van Zelm et al., 2020; Chen et al., 2021). Plant hormones, namely, ethylene, salicylic acid, and abscisic acid (ABA) play irreplaceable roles in the defense response of plants to salt stress (Bari and Jones, 2009; Yu et al., 2020). For instance, salt stress can enhance ABA signaling and activate an ABA-dependent responsive complex to cope with saline stress in plants (Umezawa et al., 2009; Cai et al., 2017; Soma et al., 2017; Lin et al., 2021). In addition, salt stress induces the rapid production of ROS, which is sensed by ROS sensor/receptor and then transduced to regulate the defense response of plants under salt stress (Ashraf, 2009; Yang and Guo, 2018b). However, different plants or even different accessions of the same plant species respond differently to salt stress (Seki et al., 2003; Ji et al., 2013). Therefore, an in-depth understanding of the defense response of F. velutina against salt stress is an essential aid to breeding work on salt resistance.
Transcriptome profiling has been widely used to analyze salt-induced gene expression in various plants (Zhu et al., 2019; Zhang et al., 2020; Li et al., 2021; Ma et al., 2021). With the aid of RNA sequencing, significant pathways of differentially expressed genes (DEGs) are identified that would otherwise have been overlooked. In this study, two contrasting materials, F. velutina R7 (salt-tolerant) and S4 (salt-sensitive) were identified by measuring chlorophyll fluorescence characteristics (Fv/Fm ratio) in the excised leaves and physiological indexes in roots or leaves under salt treatment. To further explore the mechanisms underlying salt tolerance, a comparative transcriptome analysis was performed on the leaf and root of R7 and S4 clone exposed to salt stress. Our findings revealed the crucial defense response genes underlying high salt tolerance, thus providing insights into the salt-tolerant F. velutina breeding.
Materials and Methods
Plant Materials
The F. velutina materials were obtained from the Experimental Base of Afforestation on Saline—Alkali Soil of Shandong Provincial Academy of Forestry, Shouguang City, Shandong Province, China (118°42′9.18″ E, 37°9′38.94″ N), China. The salt-tolerant F. velutina R7 accession and salt-sensitive F. velutina S4 accession were identified from 189 F. velutina accessions (unpublished data) by measuring Fv/Fm ratio on the excised leaves exposed to 250 mM NaCl for 48 h according to the previously described method (Smethurst et al., 2009). Due to easy availability and appropriate size of 1-year-old cuttings of F. velutina (height: 26.40 ± 0.50 cm) for the experiment. In addition, 1-year-old cuttings are frequently used as plant materials for salt resistance research (Gucci et al., 1997; Tsabarducas et al., 2015; Ran et al., 2021). So, 1-year-old cuttings of F. velutina R7 and S4 were used in this study. After gently removing the soil around the root, the cuttings were firstly precultivated in distilled water for 2 weeks and then transferred to a plastic container containing 6 L of half-strength Hoagland’s solution for 4 weeks. The solutions were refreshed every 7 days. The cuttings were grown in a growth incubator (LICHEN, Shanghai, China) under 25/20°C (day/night temperature), 65% relative humidity, 16 h light (1,200 μmol m–2 s–1)/8 h dark.
Chlorophyll Fluorescence
As previously described (Gabilly et al., 2019), chlorophyll fluorescence parameters (Fv/Fm ratio) were determined using a pulse-amplitude modulated chlorophyll fluorometer (FMS2, Hansatech Instruments, Pentney King’s Lynn, United Kingdom). The images reflecting chlorophyll fluorescence parameters were acquired with FluorCam imaging fluorimeters (Photon Systems Instruments, Brno, Czech Republic) according to the instructions of the manufacturer.
Salt Treatment
After 6 weeks of acclimatization, the healthy cuttings with appropriate size (height: 26.40 ± 0.50 cm) for this experiment were selected and exposed to the solution containing 250 mM NaCl for 12 h, and the clone without NaCl treatment were considered as control. The NaCl concentration and exposure time were selected based on our preliminary tests and previous studies (Li et al., 2012; Yan et al., 2019; Catalá et al., 2021). The leaves and roots of each clone from three independent biological replicates were harvested and stored in -80°C until being used.
For easy understanding, the letters “S” and “C” were used to represent the salt-treated samples and control, respectively, while “L” and “R” represented the leaves and roots samples, respectively. For instance, the sample R7SL represented the leaves of R7 clone treated with NaCl solution.
Physiological Parameter Measurements
The contents of proline, soluble sugar, and H2O2 were determined using the commercial kits purchased from Nanjing Jiangcheng Bioengineering Institute (Nanjing, China) following the instructions of the manufacturer. Histochemical location of H2O2 was conducted by staining with 3,3′-diaminobenzidine (DAB) according to the previously described (Daudi and O’Brien, 2012). Cell death was determined by trypan blue staining as previously described (Pogány et al., 2009). Each sample group contained five biological replicates.
Transcriptome Sequencing
Total RNA was extracted using the GeneJET Plant RNA Purification Mini Kit (Thermo Fisher Scientific, Waltham, Massachusetts, United States). The concentration and integrity of RNA were evaluated using a NanoDrop ND-2000 (Thermo Fisher Scientific, Waltham, Massachusetts, United States) and Agilent Bioanalyzer 2100 (Agilent Technologies, Santa Clara, California, United States), respectively. About 1 μg of qualified total RNA was used to construct cDNA libraries with an insert size of 350 bp using the TruSeq RNA Sample Preparation Kit v2 (Illumina, San Diego, California, United States). The qualified libraries were sequenced on an Illumina NovaSeq 6000 platform (KeGene Science and Technology Corporation Ltd., Shandong, China) with a paired-end 150 mode.
Transcriptome Data Analysis
The raw reads obtained were trimmed using Trimmomatic v0.39 (Bolger et al., 2014), and the high-quality reads obtained were mapped to velvet ash reference genome1 (Kelly et al., 2020) using HISAT2 version 2.2.1 software (Kim et al., 2015). The transcripts were assembled and quantified using StringTie v2.1.5 (Pertea et al., 2015), and the gene expression levels were measured using fragments per kilobase of transcript per million fragments mapped (FPKM). The genes with FPKM ≥ 5 in at least one sample were selected to perform differential gene expression analysis using DESeq2 v4.1 (Love et al., 2014) based on | log2 (fold change)| ≥ 2 and false discovery rate < 0.01.
Gene Set Enrichment Analysis
The Gene Ontology (GO) enrichment analysis of the DEGs was performed using the Cytoscape v3.9.0 plug-in ClueGO v2.5.8 (Bindea et al., 2009). Kyoto Encyclopedia of Genes and Genomes (KEGG) pathway enrichment analysis of the DEGs was carried out using clusterProfiler v4.2.0 (Yu et al., 2012). The transcription factors were identified by aligning all the transcripts obtained against the plant TF database PlantTFDB v5.0 (Tian et al., 2020).
Quantitative Real-Time Reverse Transcription PCR Analysis
To validate the reliability of transcriptome sequencing data, 16 DEGs were randomly selected to perform quantitative real-time (qRT)-PCR analysis. The CFX Connect Real-Time System (Bio-Rad, Hercules, CA, United States) was used for qRT-PCR. The PCR assays were conducted as previously described (Fang et al., 2021). The actin genes were chosen as internal reference (Li et al., 2013, 2019). The genes were quantified using the 2–ΔΔCT method (Arocho et al., 2006). Each sample group contained three biological replicates. The primers are listed in Supplementary Table 1.
Statistical Analysis
Statistical data were represented as mean ± SD. The Student’s t-test was used to determine the differences between the two groups. The statistical analyses were performed with GraphPad Prism v9.0 (GraphPad Software Inc., La Jolla, United States). *P < 0.05, **P < 0.01, and ***P < 0.001 represented statistical significance.
Results
Fraxinus velutina R7 Accession Is More Salt Tolerant Than S4
To evaluate the salt tolerance between R7 and S4, the Fv/Fm parameters in the salt-treated excised leaves were determined. The results showed that when the excised leaves of S4 and R7 were, respectively, exposed to 250 mM NaCl for 48 h, Fv/Fm ratio decreased significantly in S4 than in R7 (Figures 1A,B), suggesting that R7 is more salt tolerant.
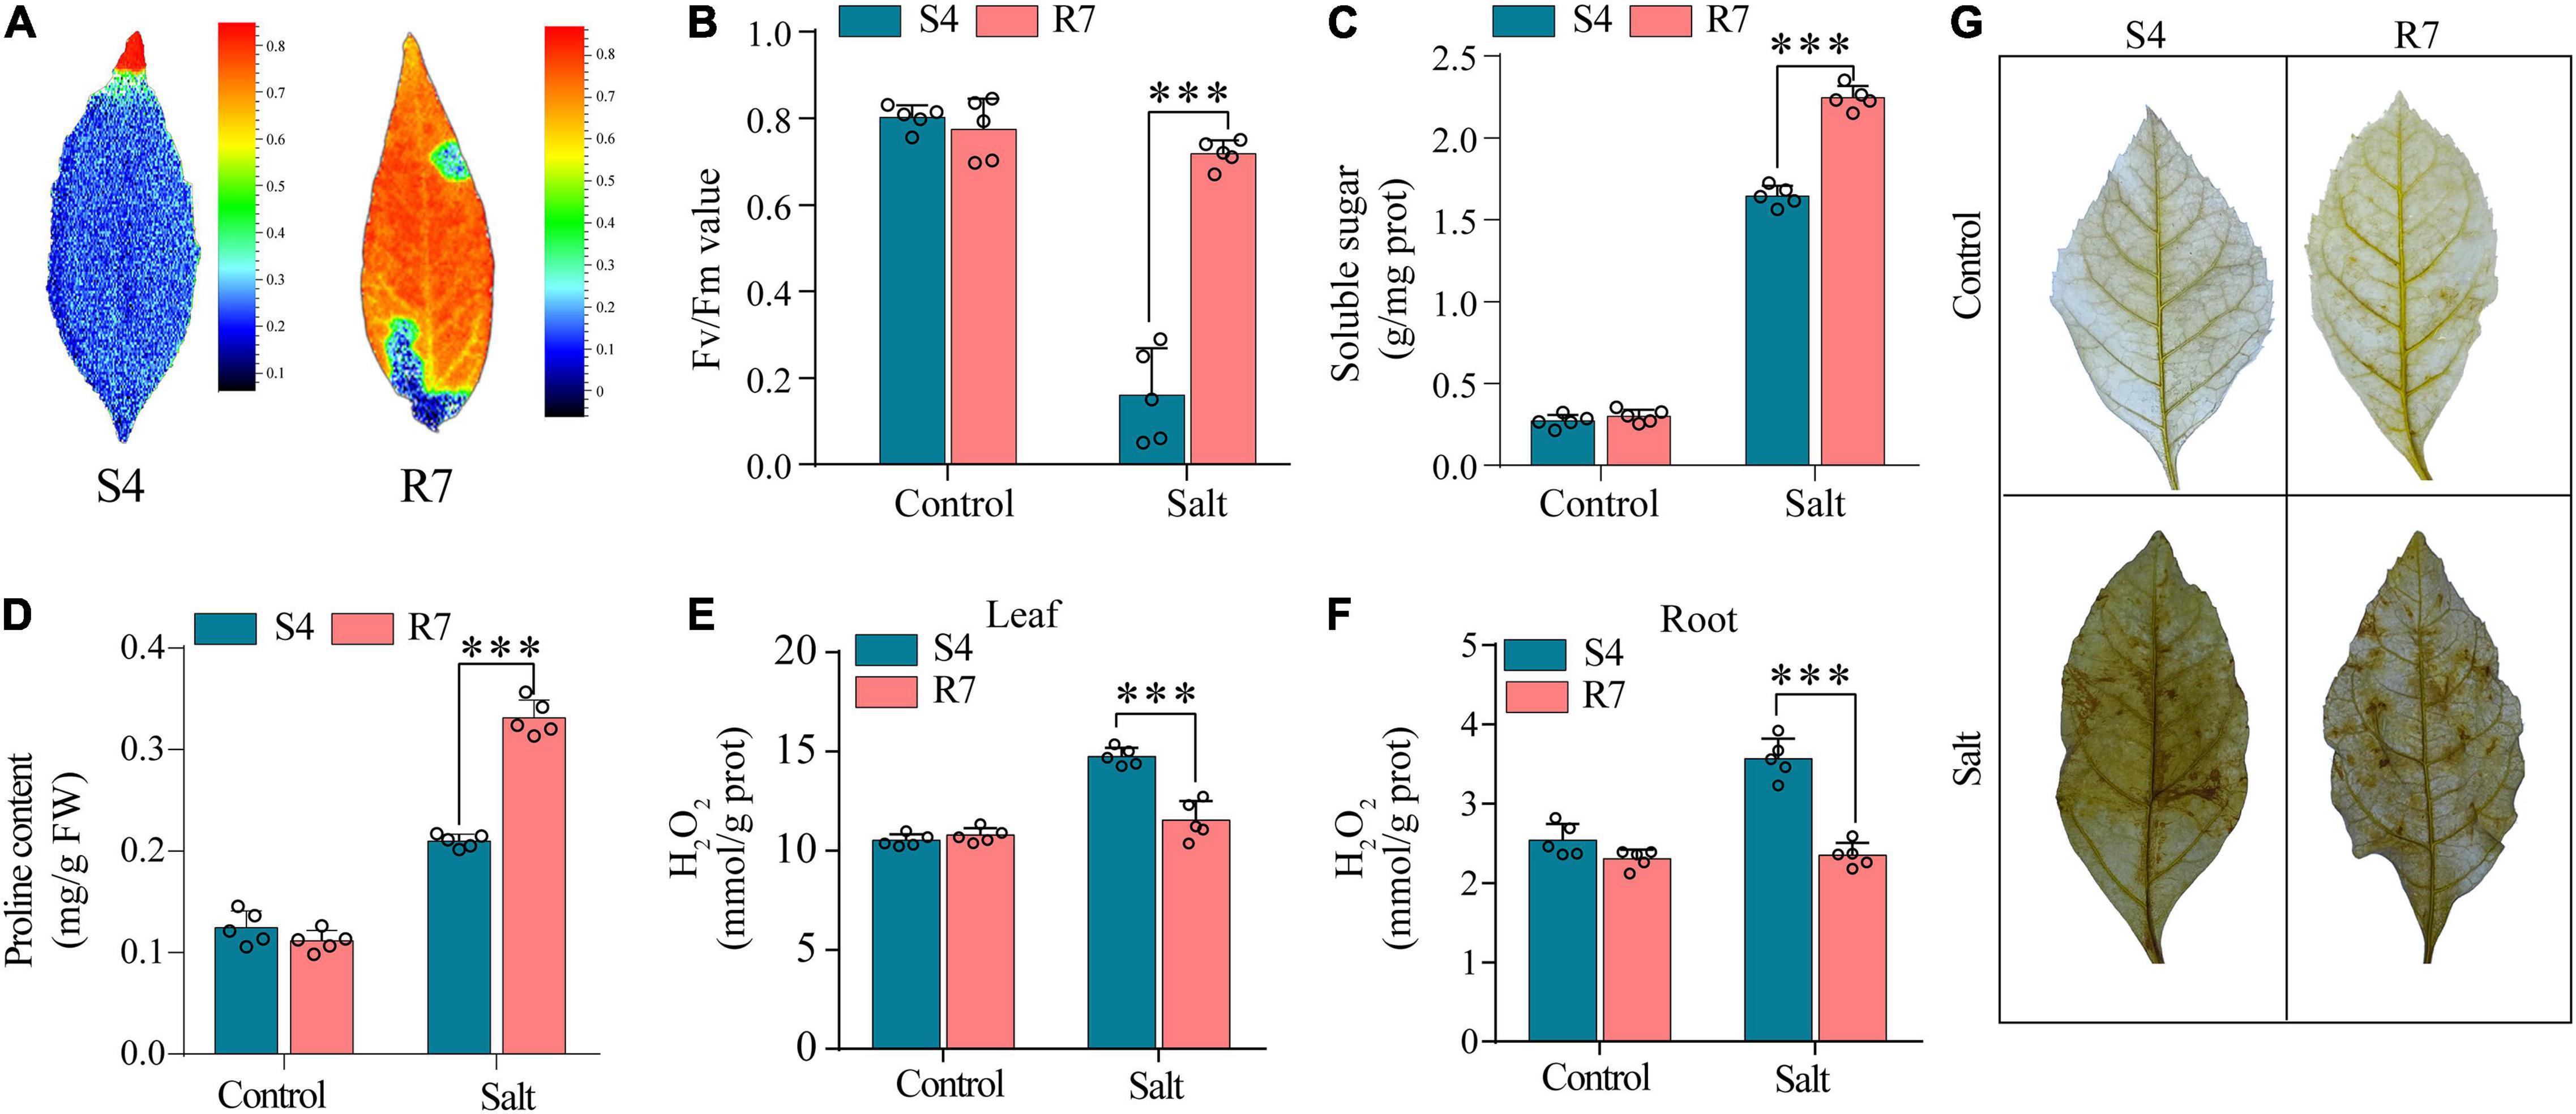
Figure 1. Determination of selected biochemical parameters in F. velutina R7 and S4. (A) The images reflecting chlorophyll fluorescence parameters. (B) Chlorophyll fluorescence parameters (Fv/Fm ratio) of the excised leaves of F. velutina R7 and S4 exposed to 250 mM NaCl for 48 h. Soluble sugar (C,D) proline content in R7 and S4 roots with or without salt treatment. (E,F) H2O2 content in leaves (E) and roots (F) of R7 and S4 before and after salt stress. (G) In situ visualization of H2O2 accumulation by DAB staining in R7 and S4 leaves before and after salt stress. Error bars represented SD (n = 5). ***P < 0.001 represented significant differences.
Several selected biochemical parameters, such as soluble sugars and proline content in roots, and H2O2 content (both leaves and roots) of R7 and S4 clone exposed to salt stress were determined. The results showed that the levels of soluble sugars and proline in R7 roots were significantly higher than in S4 (Figures 1C,D). Moreover, R7 leaves and roots presented lower levels of H2O2 than S4 under salt stress (Figures 1E,F), which was further confirmed by the histochemical staining (Figure 1G). The above results further demonstrated that R7 is more tolerant to salt stress.
Transcriptome Sequencing of R7 and S4 Accessions
To explore the differences between R7 and S4 accessions regarding gene expressions, a comparative transcriptome analysis was performed on the leaf and root of R7 and S4 clone exposed to salt stress. The results showed that 1.01 billion clean reads were obtained, with an average Q30 value was 98%. Then the clean reads were mapped to the F. velutina genome assembly and the results showed that 73.96–94.85% of total reads were mapped to the genome. After transcript assembly, 32,887 genes were finally produced by RNA sequencing (Supplementary Table 3).
To evaluate the consistency among the biological replicates, hierarchical clustering of all samples based on the correlation coefficient γ2 between each sample was performed. The results showed that leaf and root samples were clustered individually whereas the three biological replicates of each group were clustered together (Supplementary Figure 1), indicating that the biological replicates in each group are highly consistent.
To identify salt-responsive genes, the differential gene expression analysis of pairwise comparisons R7SL vs. R7CL, S4SL vs. S4CL, R7SL vs. S4SL, and R7CL vs. S4CL in leaves and R7SR vs. R7CR, S4SR vs. S4CR, R7SR vs. S4SR, and R7CR vs. S4CR in roots were performed, respectively (Supplementary Table 4). The results showed that 3,218, 2,238, 3,592, and 2,119 DEGs were identified in comparisons R7SL vs. R7CL, S4SL vs. S4CL, R7SL vs. S4SL, and R7CL vs. S4CL in leaves, respectively (Figure 2A and Supplementary Figure 2). There were 8,455, 9,548, 1,797, and 1,898 DEGs in comparisons R7SR vs. R7CR, S4SR vs. S4CR, R7SR vs. S4SR, and R7CR vs. S4CR in roots, respectively (Figure 2B and Supplementary Figure 3).
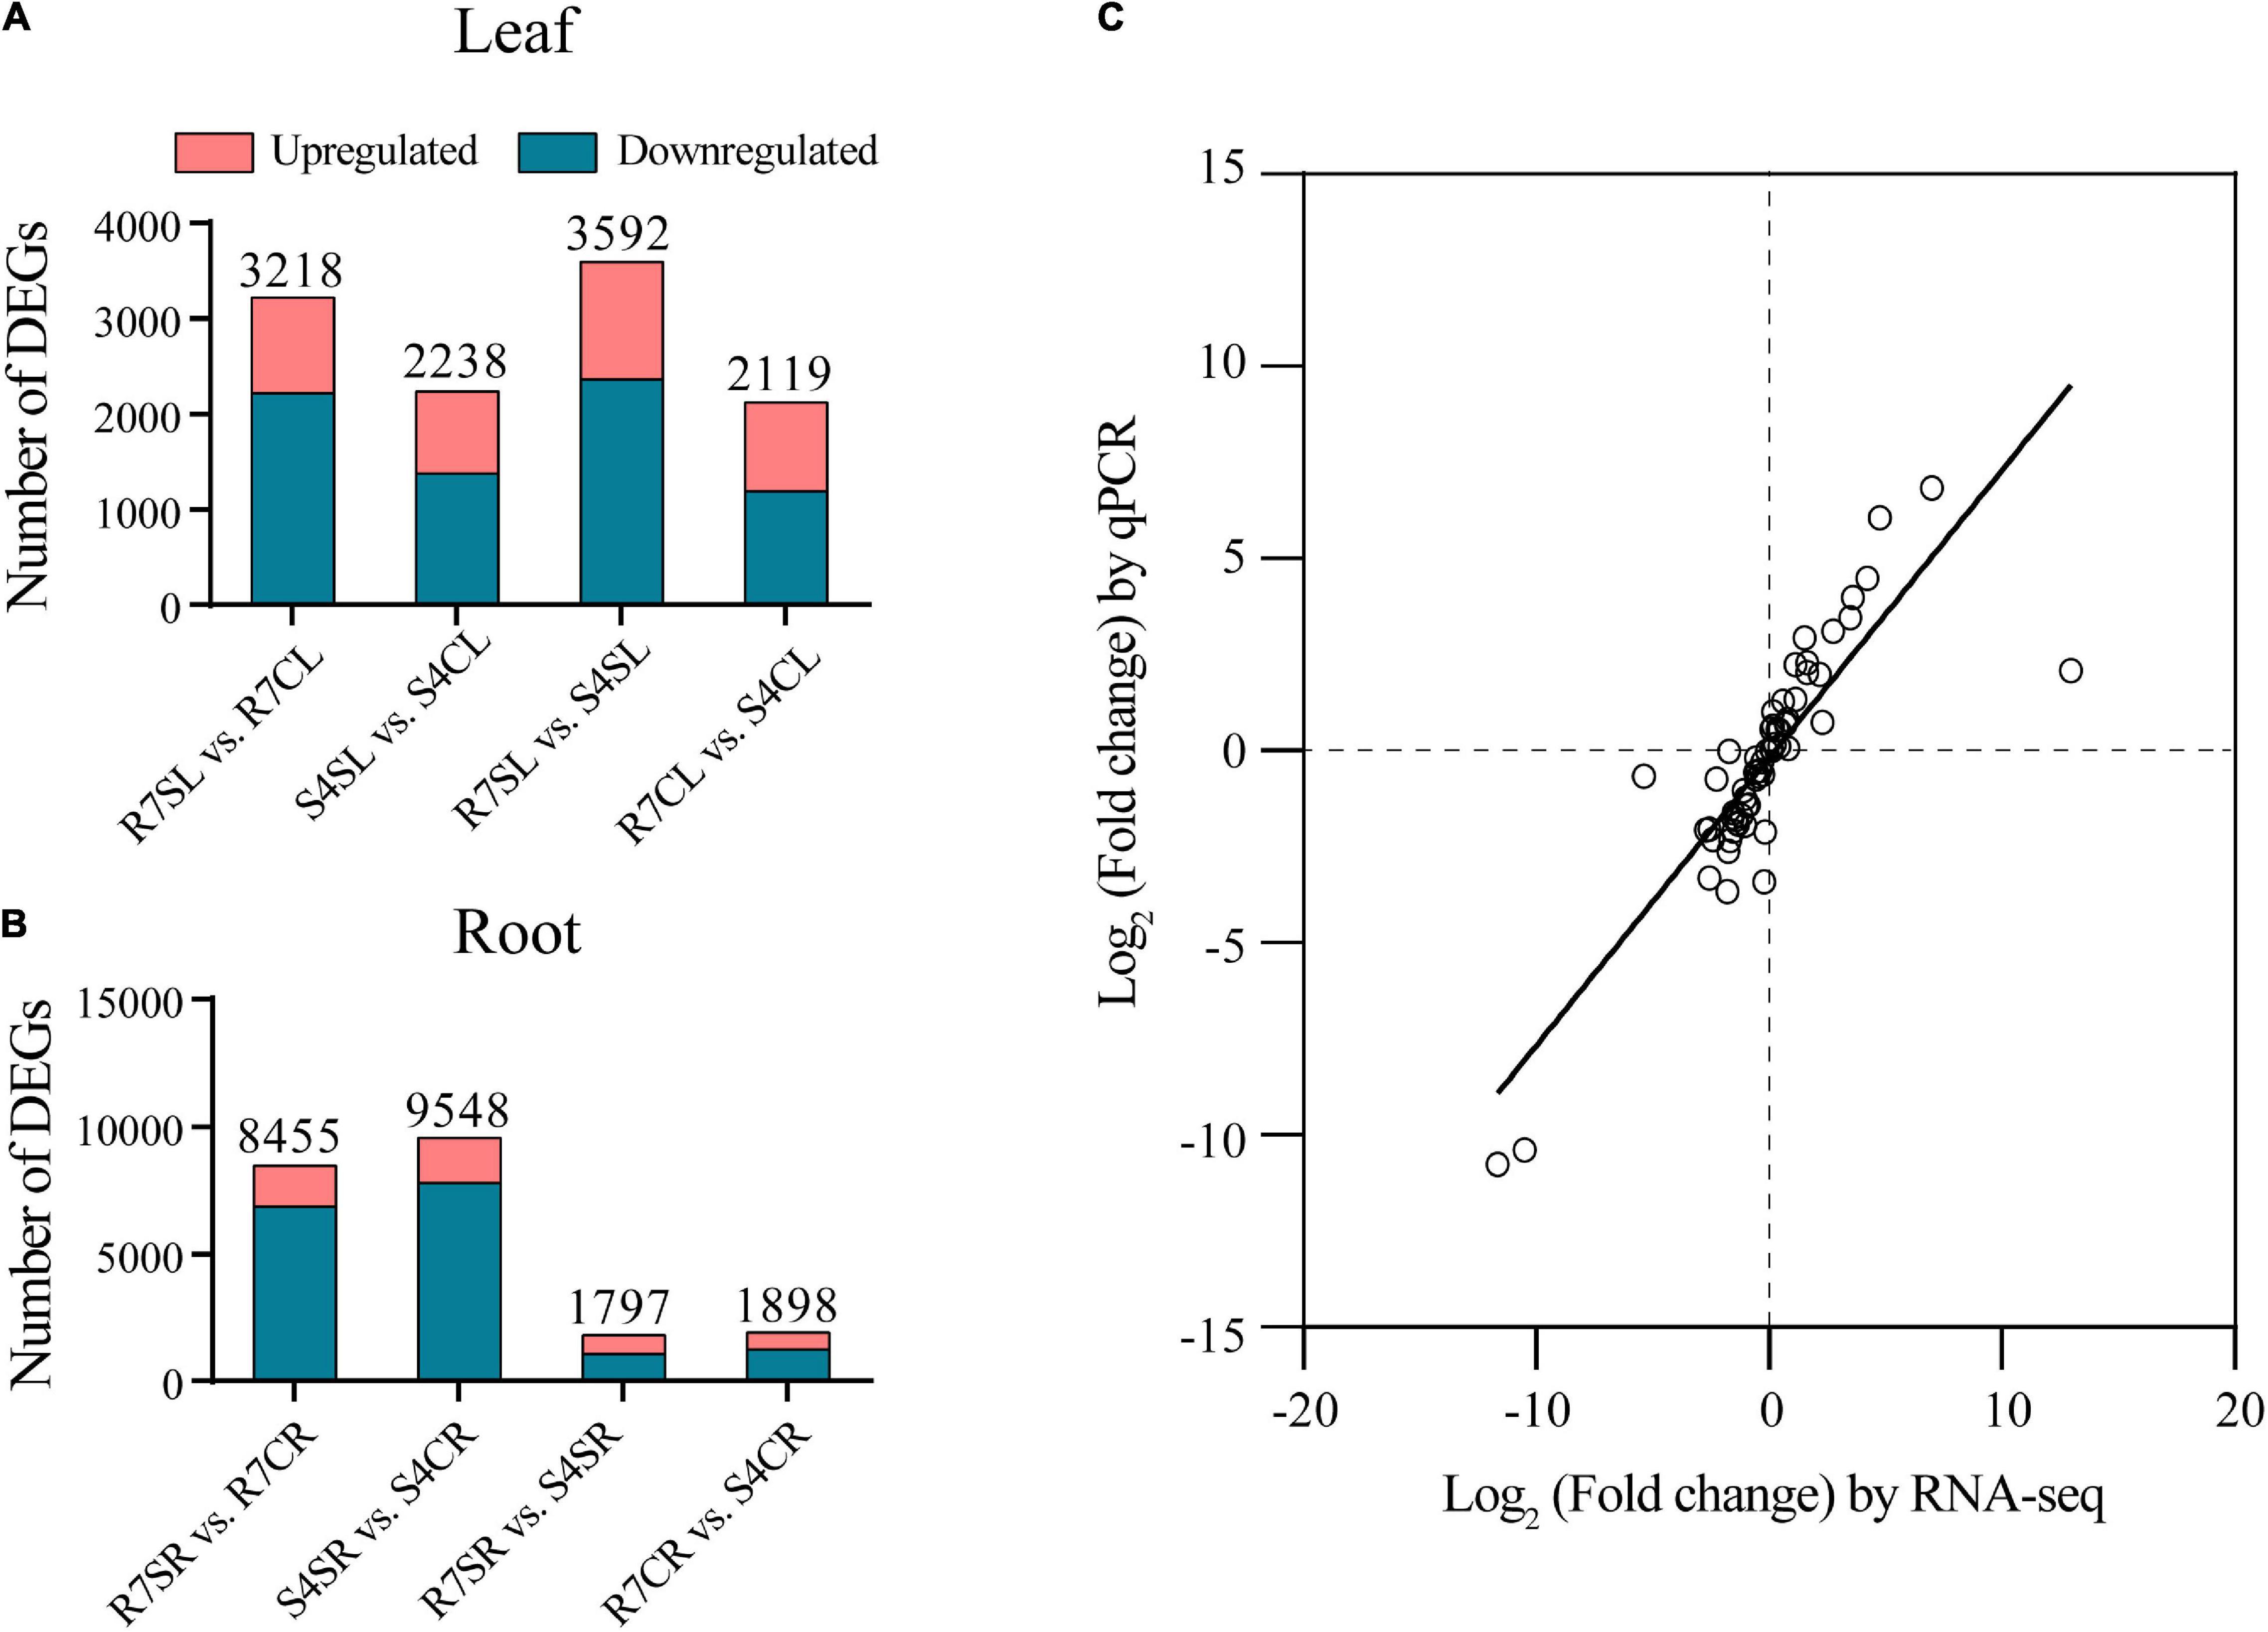
Figure 2. Transcriptome data and the differentially expressed genes (DEGs) in F. velutina R7 and S4 plants with or without salt treatment. (A) The DEG number of each pairwise comparison in leaf samples. (B) The DEG number of each pairwise comparison in root samples. (C) Correlation between qPCR (X-axis) and RNA-seq (Y-axis) was calculated based on log2 (fold change).
To validate the reliability of RNA sequencing data, 16 DEGs were randomly selected to perform qRT-PCR analysis. The results showed a high correlation coefficient (R2 = 0.7266) between RNA sequencing data and qRT-PCR results, indicating that the RNA sequencing data are reliable (Figure 2C). We, therefore, concluded that the global transcriptome in R7 is altered than in S4.
Fraxinus velutina R7 Enriched Stress-Responsive Genes Under Salt Stress
To understand the potential mechanisms underlying the distinguishing R7 and S4 in response to salt stress, a GO enrichment analysis of the DEGs in the comparisons R7SL vs. S4SL and R7SR vs. S4SR was performed, respectively. The results showed that multiple stress-associated GO terms were significantly enriched in both leaves and roots, such as response to an inorganic substance, response to salt stress, response to an organic substance, and response to the hormone (Figures 3A,C). Several GO terms related to oxidative stress, signal transduction, and metabolic process were also enriched in both leaves and roots. In addition, several GO terms, namely, photosynthesis, transmembrane receptor protein tyrosine kinase signaling pathway, and cell surface receptor signaling pathway were specifically enriched in leaves, whereas the terms including response to cadmium ion and response to osmotic stress were peculiarly enriched in roots (Figures 3B,D and Supplementary Table 5). These results suggested that salt stress induces the higher enrichment of specific stress-responsive genes in R7 than in S4.
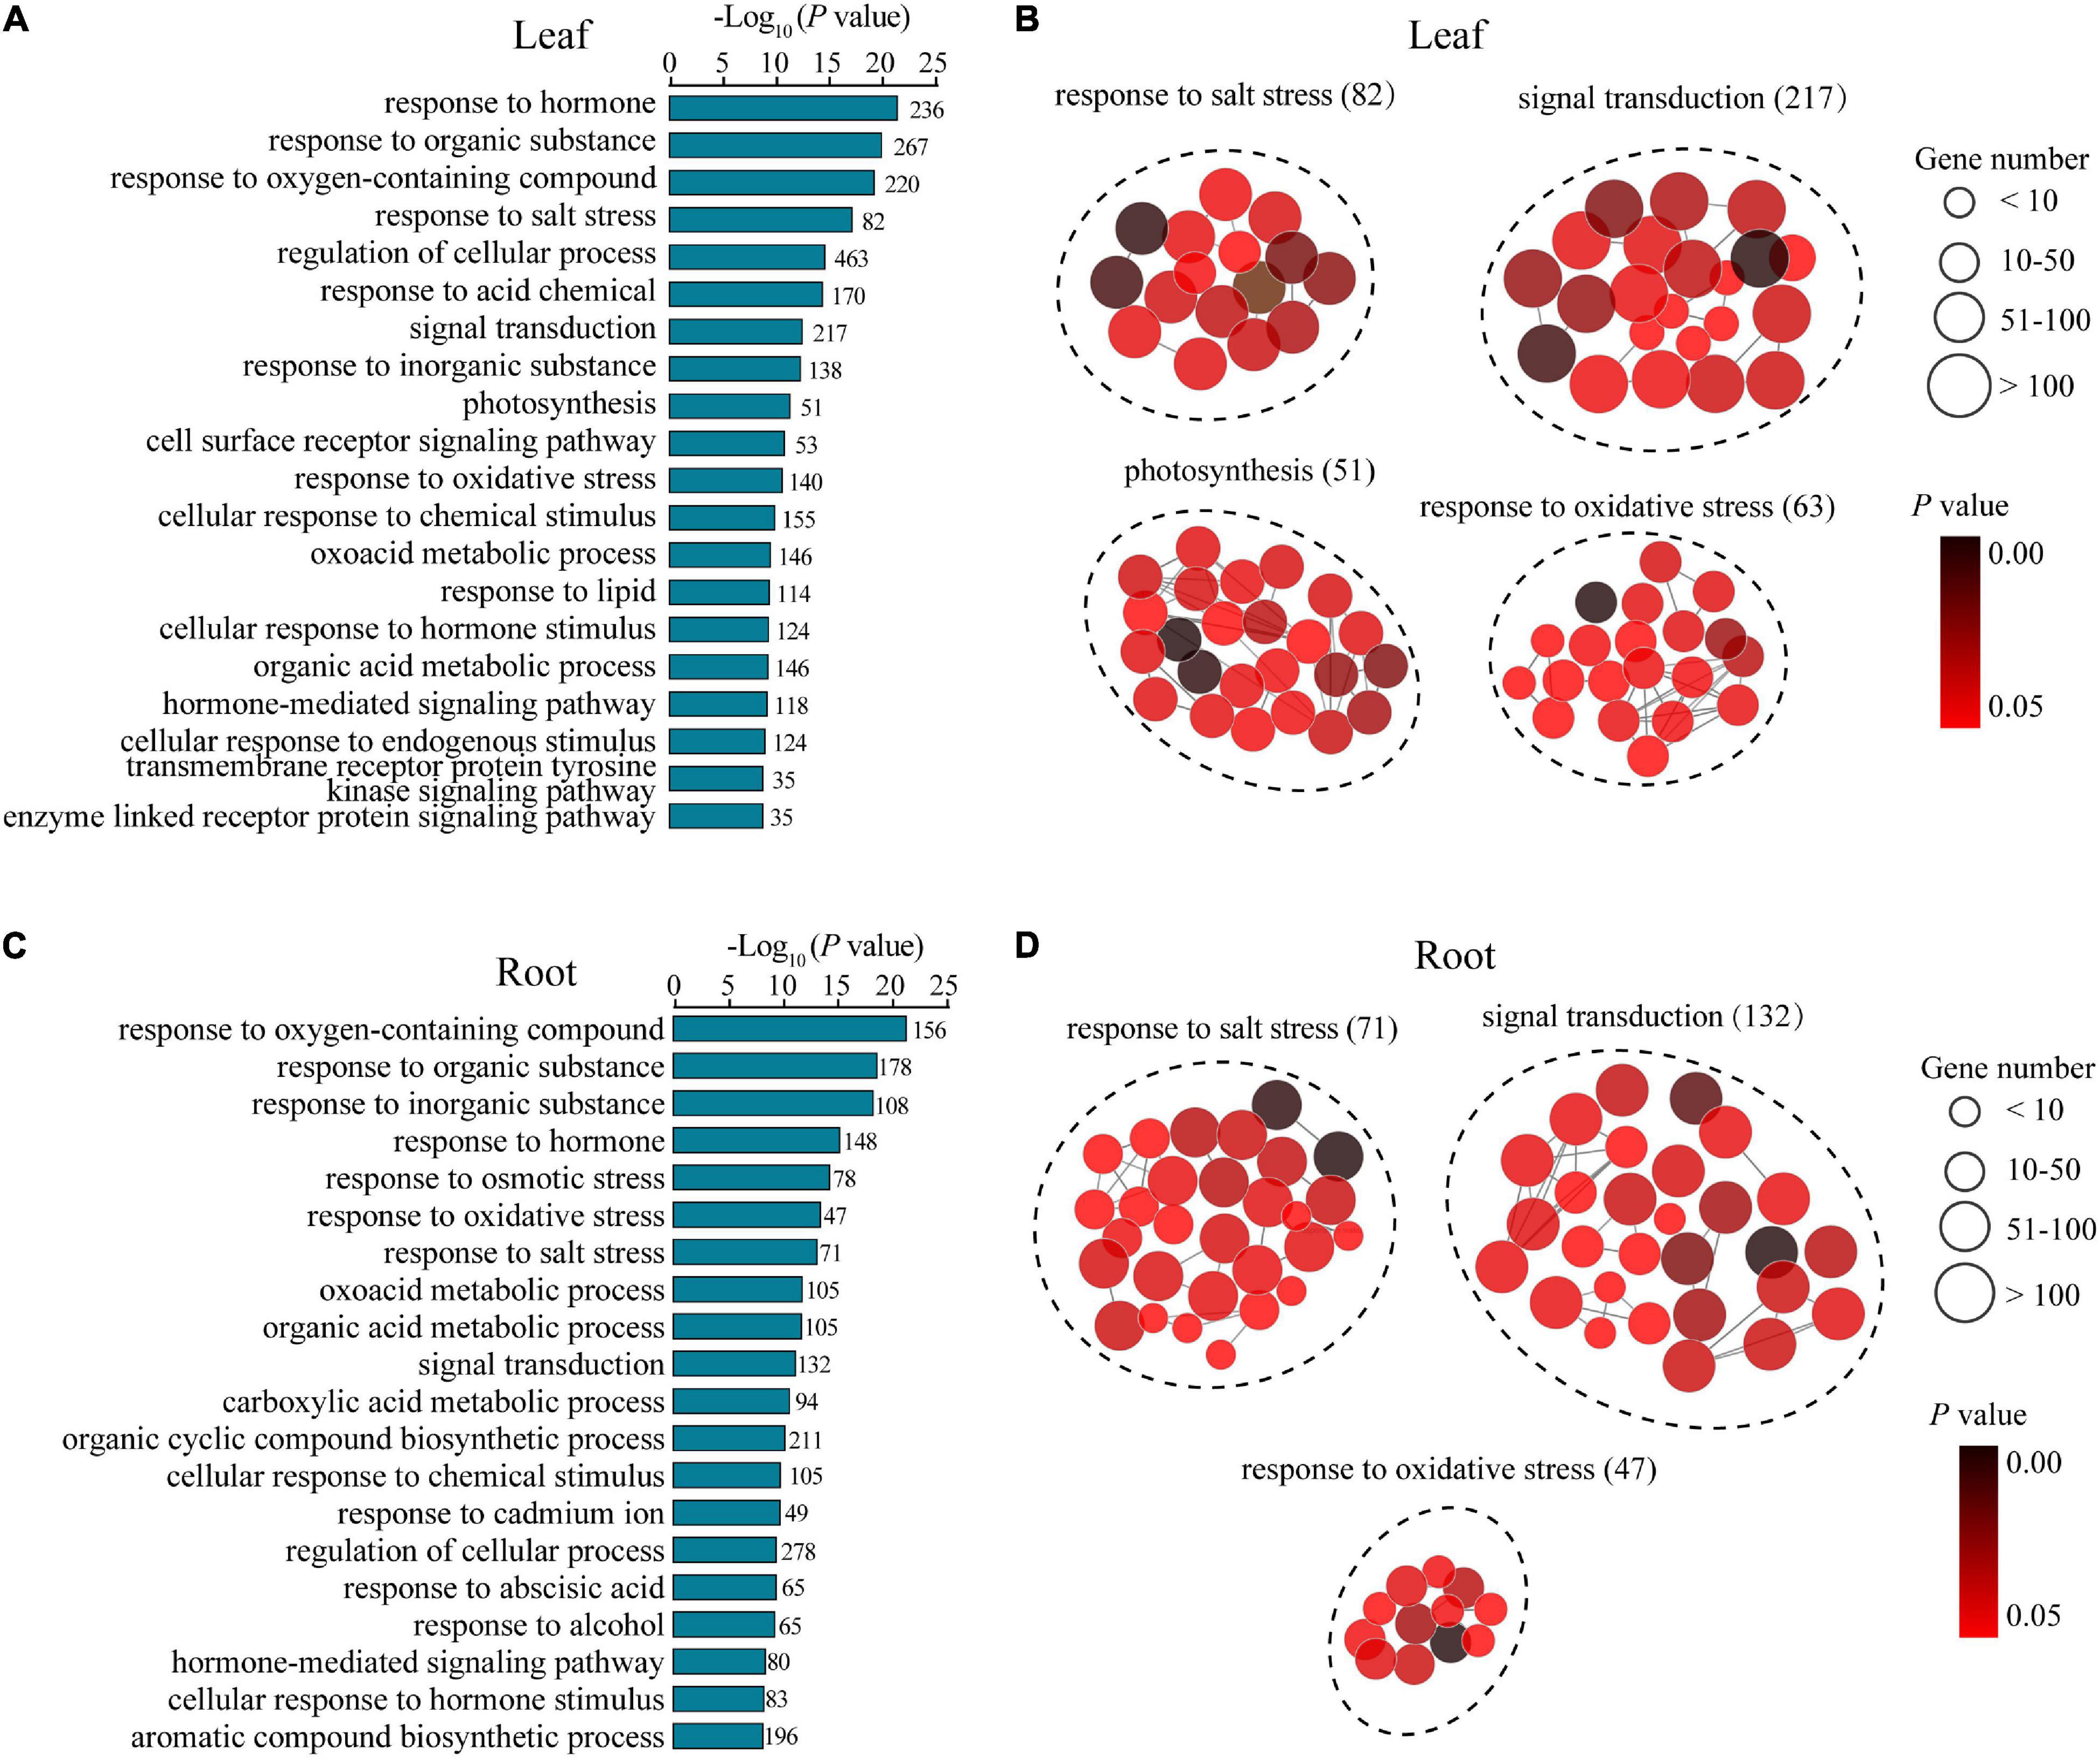
Figure 3. The Gene Ontology (GO) enrichment analysis of the differentially expressed genes (DEGs) in leaves and roots. (A,B) the GO terms of the DEGs generated from comparison R7SL vs. S4SL in leaves. (C,D) the GO terms of the DEGs generated from comparison R7SR vs. S4SR in leaves.
Fraxinus velutina R7 Leaves Enriched Hormonal and MAPK Signaling Pathways Under Salt Stress
To identify the signaling pathways involved in enhancing the salt tolerance of R7, the KEGG pathway enrichment analysis was performed using upregulated and downregulated DEGs from the comparison R7SL vs. S4SL. The results showed that the upregulated DEGs were mainly enriched in “plant hormone signal transduction” and “MAPK signaling pathway-plant” (Figure 4A and Supplementary Table 6), whereas the downregulated DEGs were enriched in “photosynthesis” and “photosynthesis-antenna proteins” (Supplementary Figure 4).
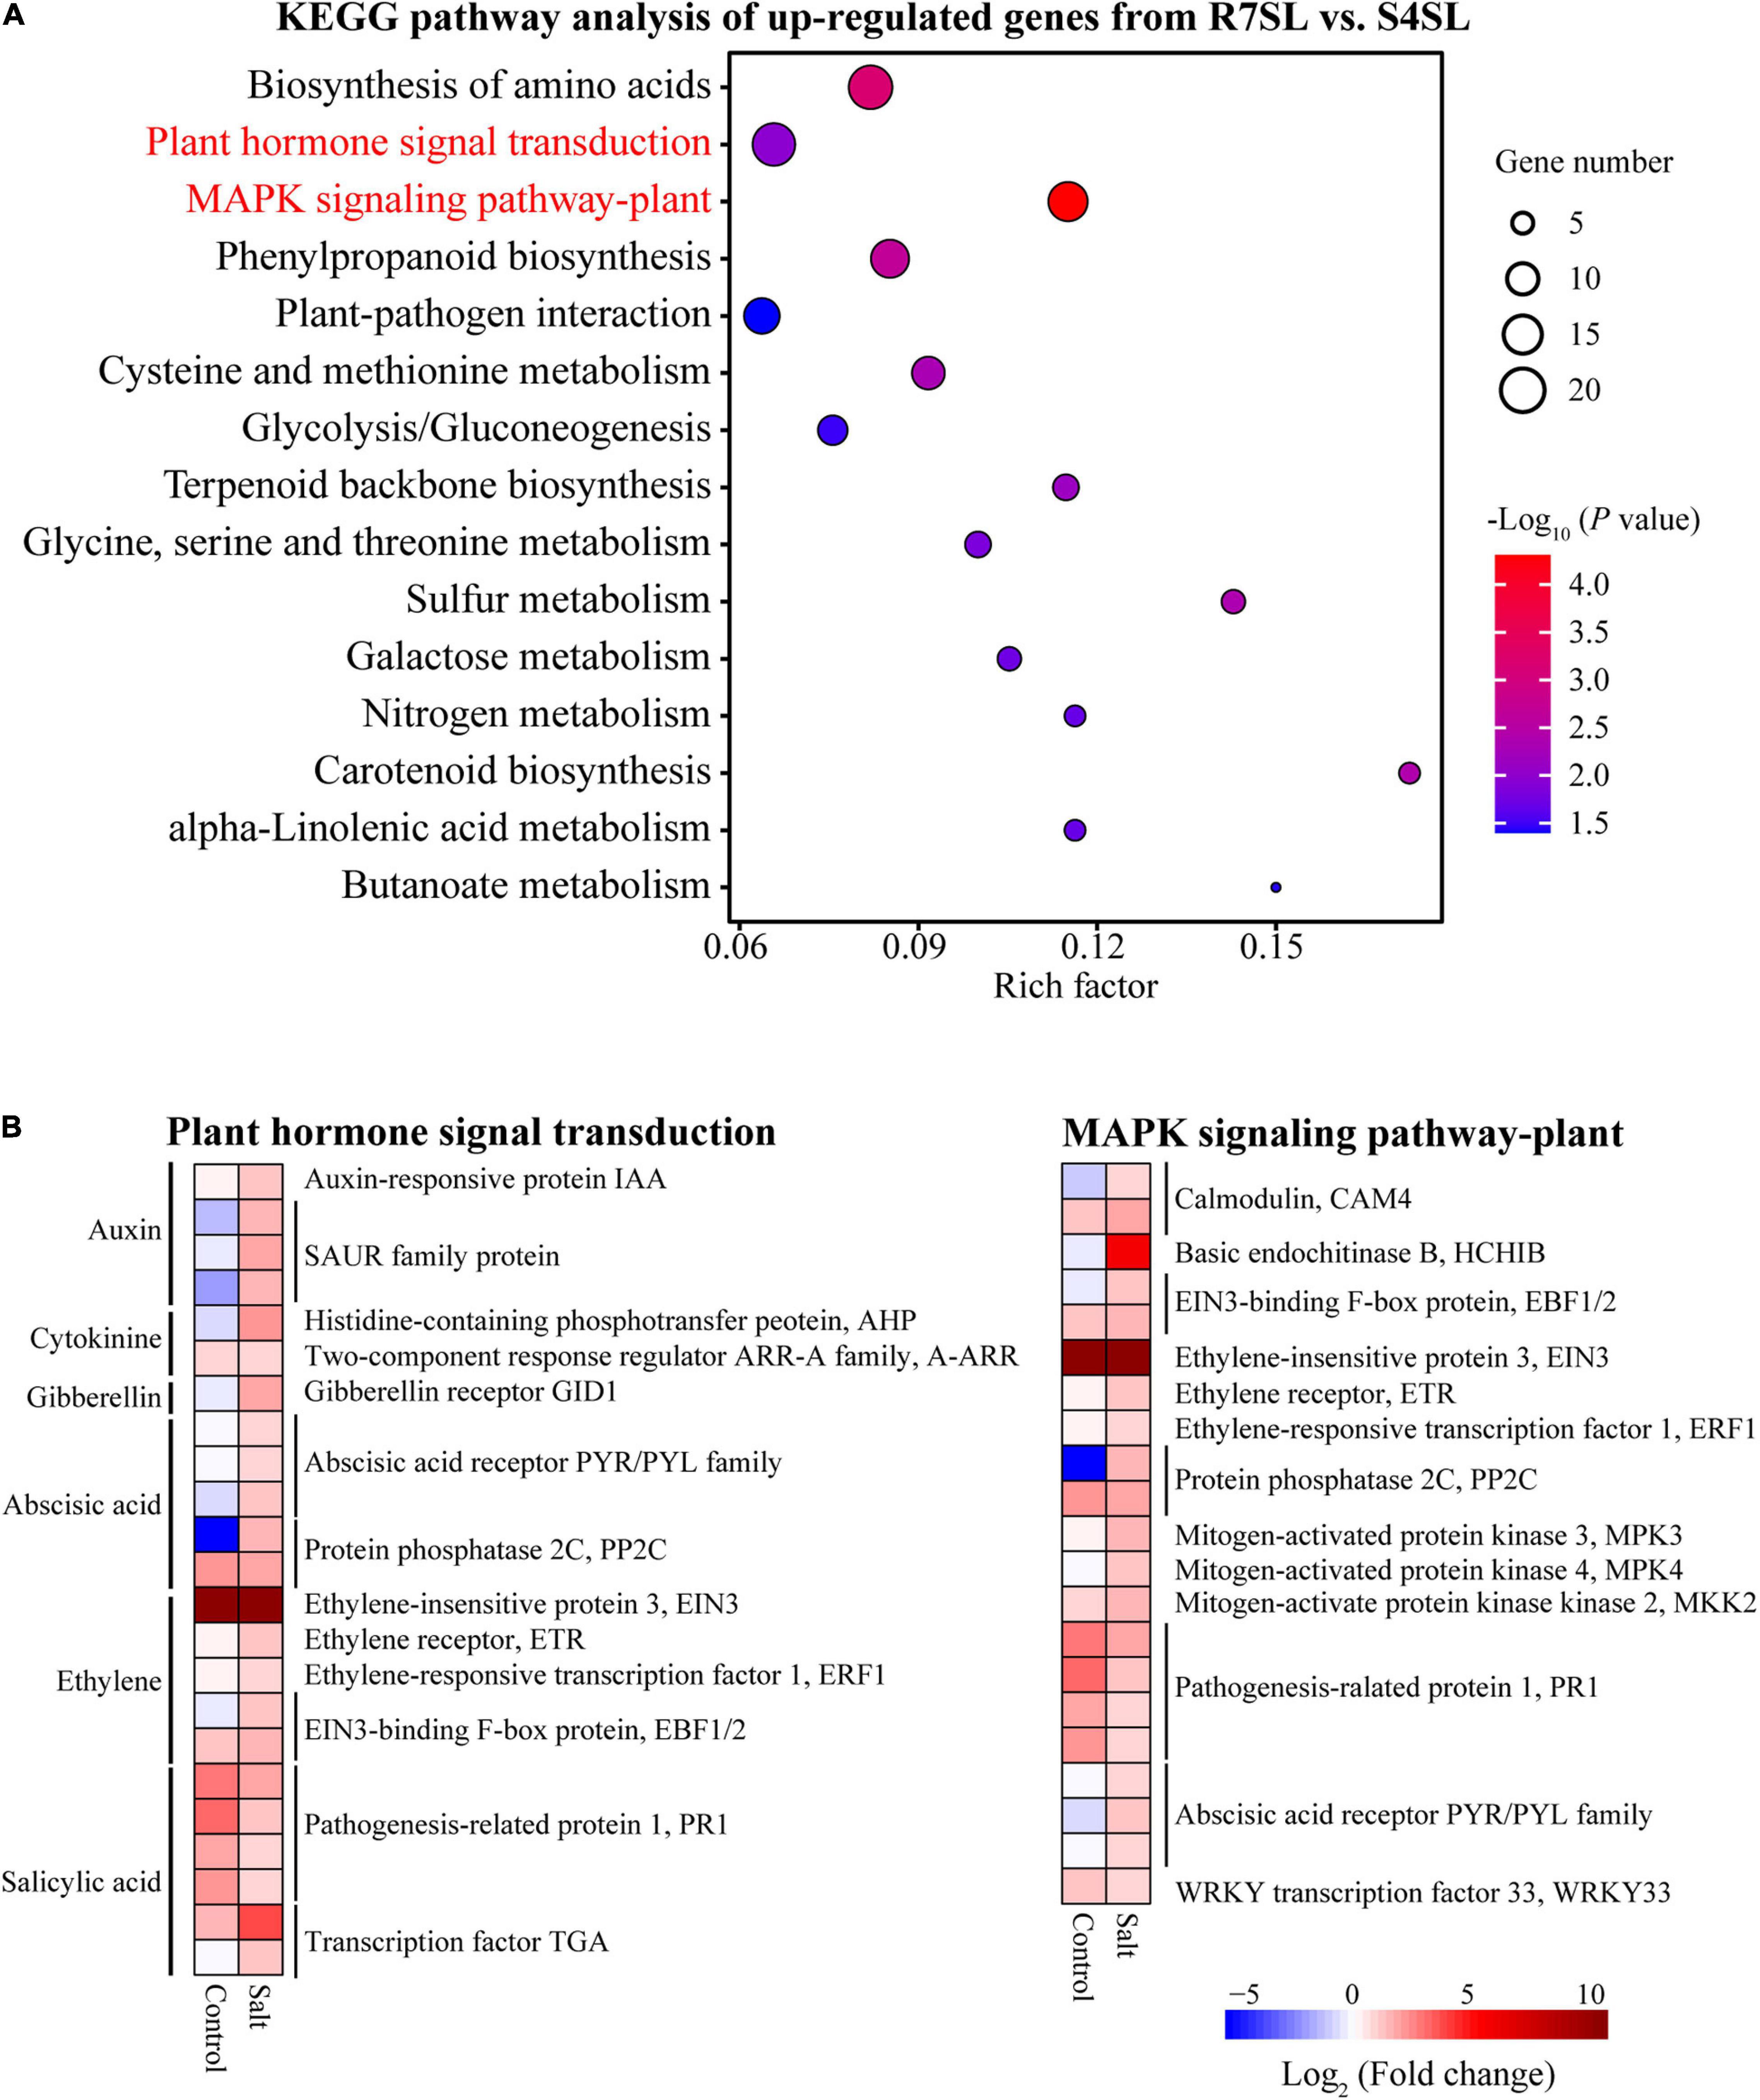
Figure 4. The Kyoto Encyclopedia of Genes and Genomes (KEGG) enrichment analysis of the differentially upregulated genes from leaves. (A) The top 15 enriched pathways (ranked by P-value) of upregulated genes in comparison R7SL vs. S4SL were showed. The size of dot represented the number of DEGs. From blue to red represented the P-value from low to high. (B) Heatmap showed the expression patterns of DEGs related to plant hormone signal transduction and MAPK signaling pathway pant. From blue to red represented the fold change in tolerant leaves compared to sensitive leaves from low to high.
There were 23 DEGs involved in “plant hormone signal transduction,” namely, the signaling network of auxin (IAA and SAUR), cytokinin (AHP and A-ARR), gibberellin (GID1), abscisic acid (PYR/PYL and PP2C), ethylene (EIN3, ETR, ERF1, and EBF1/2), and salicylic acid (PR1and TGA). In addition, there were 21 DEGs involved in the “MAPK signaling pathway plant.” All these genes exhibited upregulation in the leaves of F. velutina R7 in comparison to the one in S4 under salt treatment (Figure 4B). The findings indicated that hormonal and MAPK signaling pathways are altered in the leaves of R7 after salt exposure.
Fraxinus velutina R7 Roots Accumulated More Soluble Sugar and Proline Than S4 Under Salt Stress
To explore the differences between R7 and S4 roots in response to salt stress, KEGG pathway enrichment analysis was performed based on the DEGs from comparisons R7SR vs. R7CR and S4SR vs. S4CR, respectively (Supplementary Table 7). The results showed that three pathways were overlapped between two comparisons included “carbon metabolism,” “biosynthesis of amino acids,” and “starch and sucrose metabolism” (Figures 5A,B).
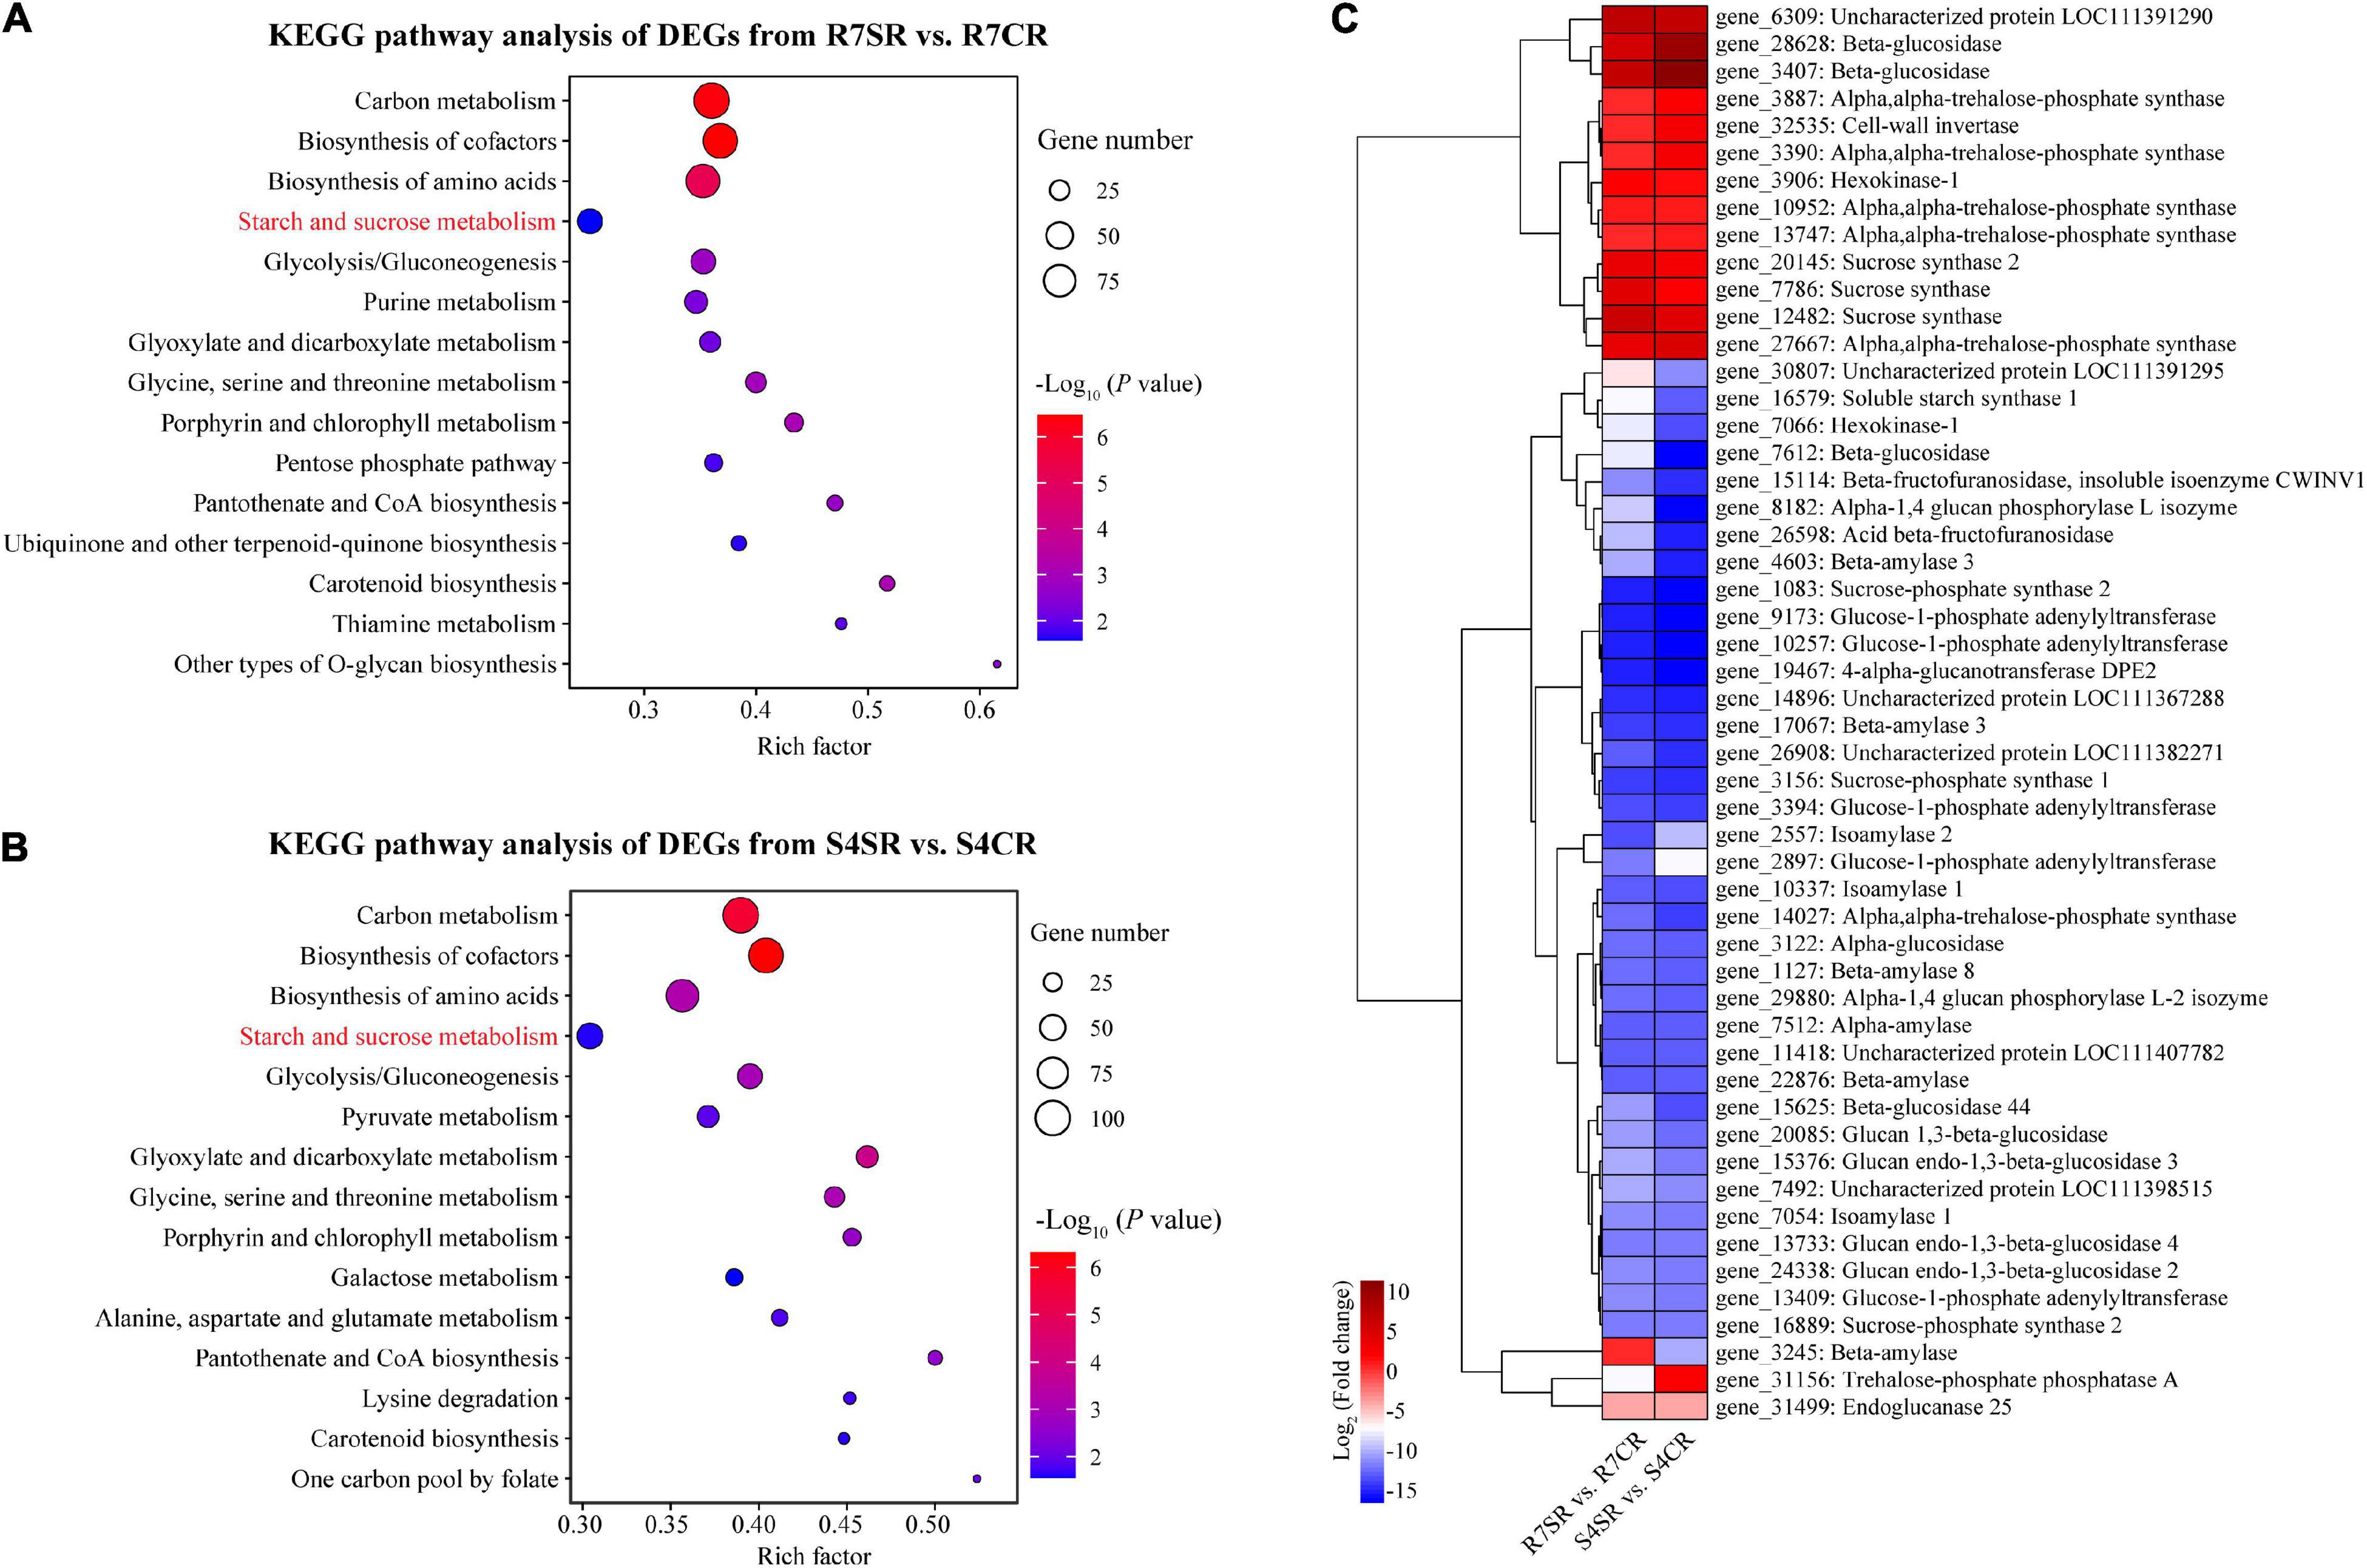
Figure 5. Functional enrichment analysis of the DEGs and measuring soluble sugar contents in F. velutina R7 and S4 roots. (A,B) The top 15 enriched KEGG pathways (ranked by P-value) for DEGs in response to salt stress in tolerant (A) and sensitive roots (B) were showed. (C) The expression patterns of DEGs associated with “starch and sucrose metabolism” pathway in R7 and S4 roots underlying salt conditions. Heatmap colors represented the fold change and from blue to red represented the value from low to high.
Starch and sucrose metabolism can regulate osmotic adjustment via determining the contents of soluble sugars, playing critical roles in salt tolerance (Dahro et al., 2016; Wei et al., 2019). Thus, the expression patterns of DEGs in “starch and sucrose metabolism” in R7 and S4 roots under salt stress were further analyzed. The results showed that the expression patterns of several genes were different between R7 and S4 roots under salt stress (Figure 5C), which was consistent with the significantly elevated levels of soluble sugars in R7 roots than in S4 (Figure 1C), suggesting that starch and sucrose metabolism induced by salt stress in R7 and S4 roots is different.
To explore the common mechanisms in response to salt stress between R7 and S4 roots, an intersection analysis between the comparisons R7SR vs. R7CR and S4SR vs. S4CR was performed. The results identified 5,296 shared DEGs in F. velutina R7 and S4 roots under salt stress (Figure 6A). KEGG enrichment analysis of these genes revealed 16 significantly enriched pathways, such as “biosynthesis of amino acids” and “Arginine and proline metabolism” (Figure 6B and Supplementary Table 8), suggesting that accumulation of amino acids might improve the salt tolerance in both F. velutina R7 and S4 roots. Proline acting as an osmoprotectant plays an important role in improving salt tolerance in the plant (Liang et al., 2018; Rady et al., 2019). As a rate-limiting enzyme involved in proline biosynthesis (Turchetto-Zolet et al., 2009), a gene encoding delta-1-pyrroline-5-carboxylate synthase 1 (P5CS1) was differentially upregulated to higher levels in R7 roots than in S4 (Figure 6C), which was consistent with the significantly elevated levels of proline in R7 roots than in S4 (Figure 1D).
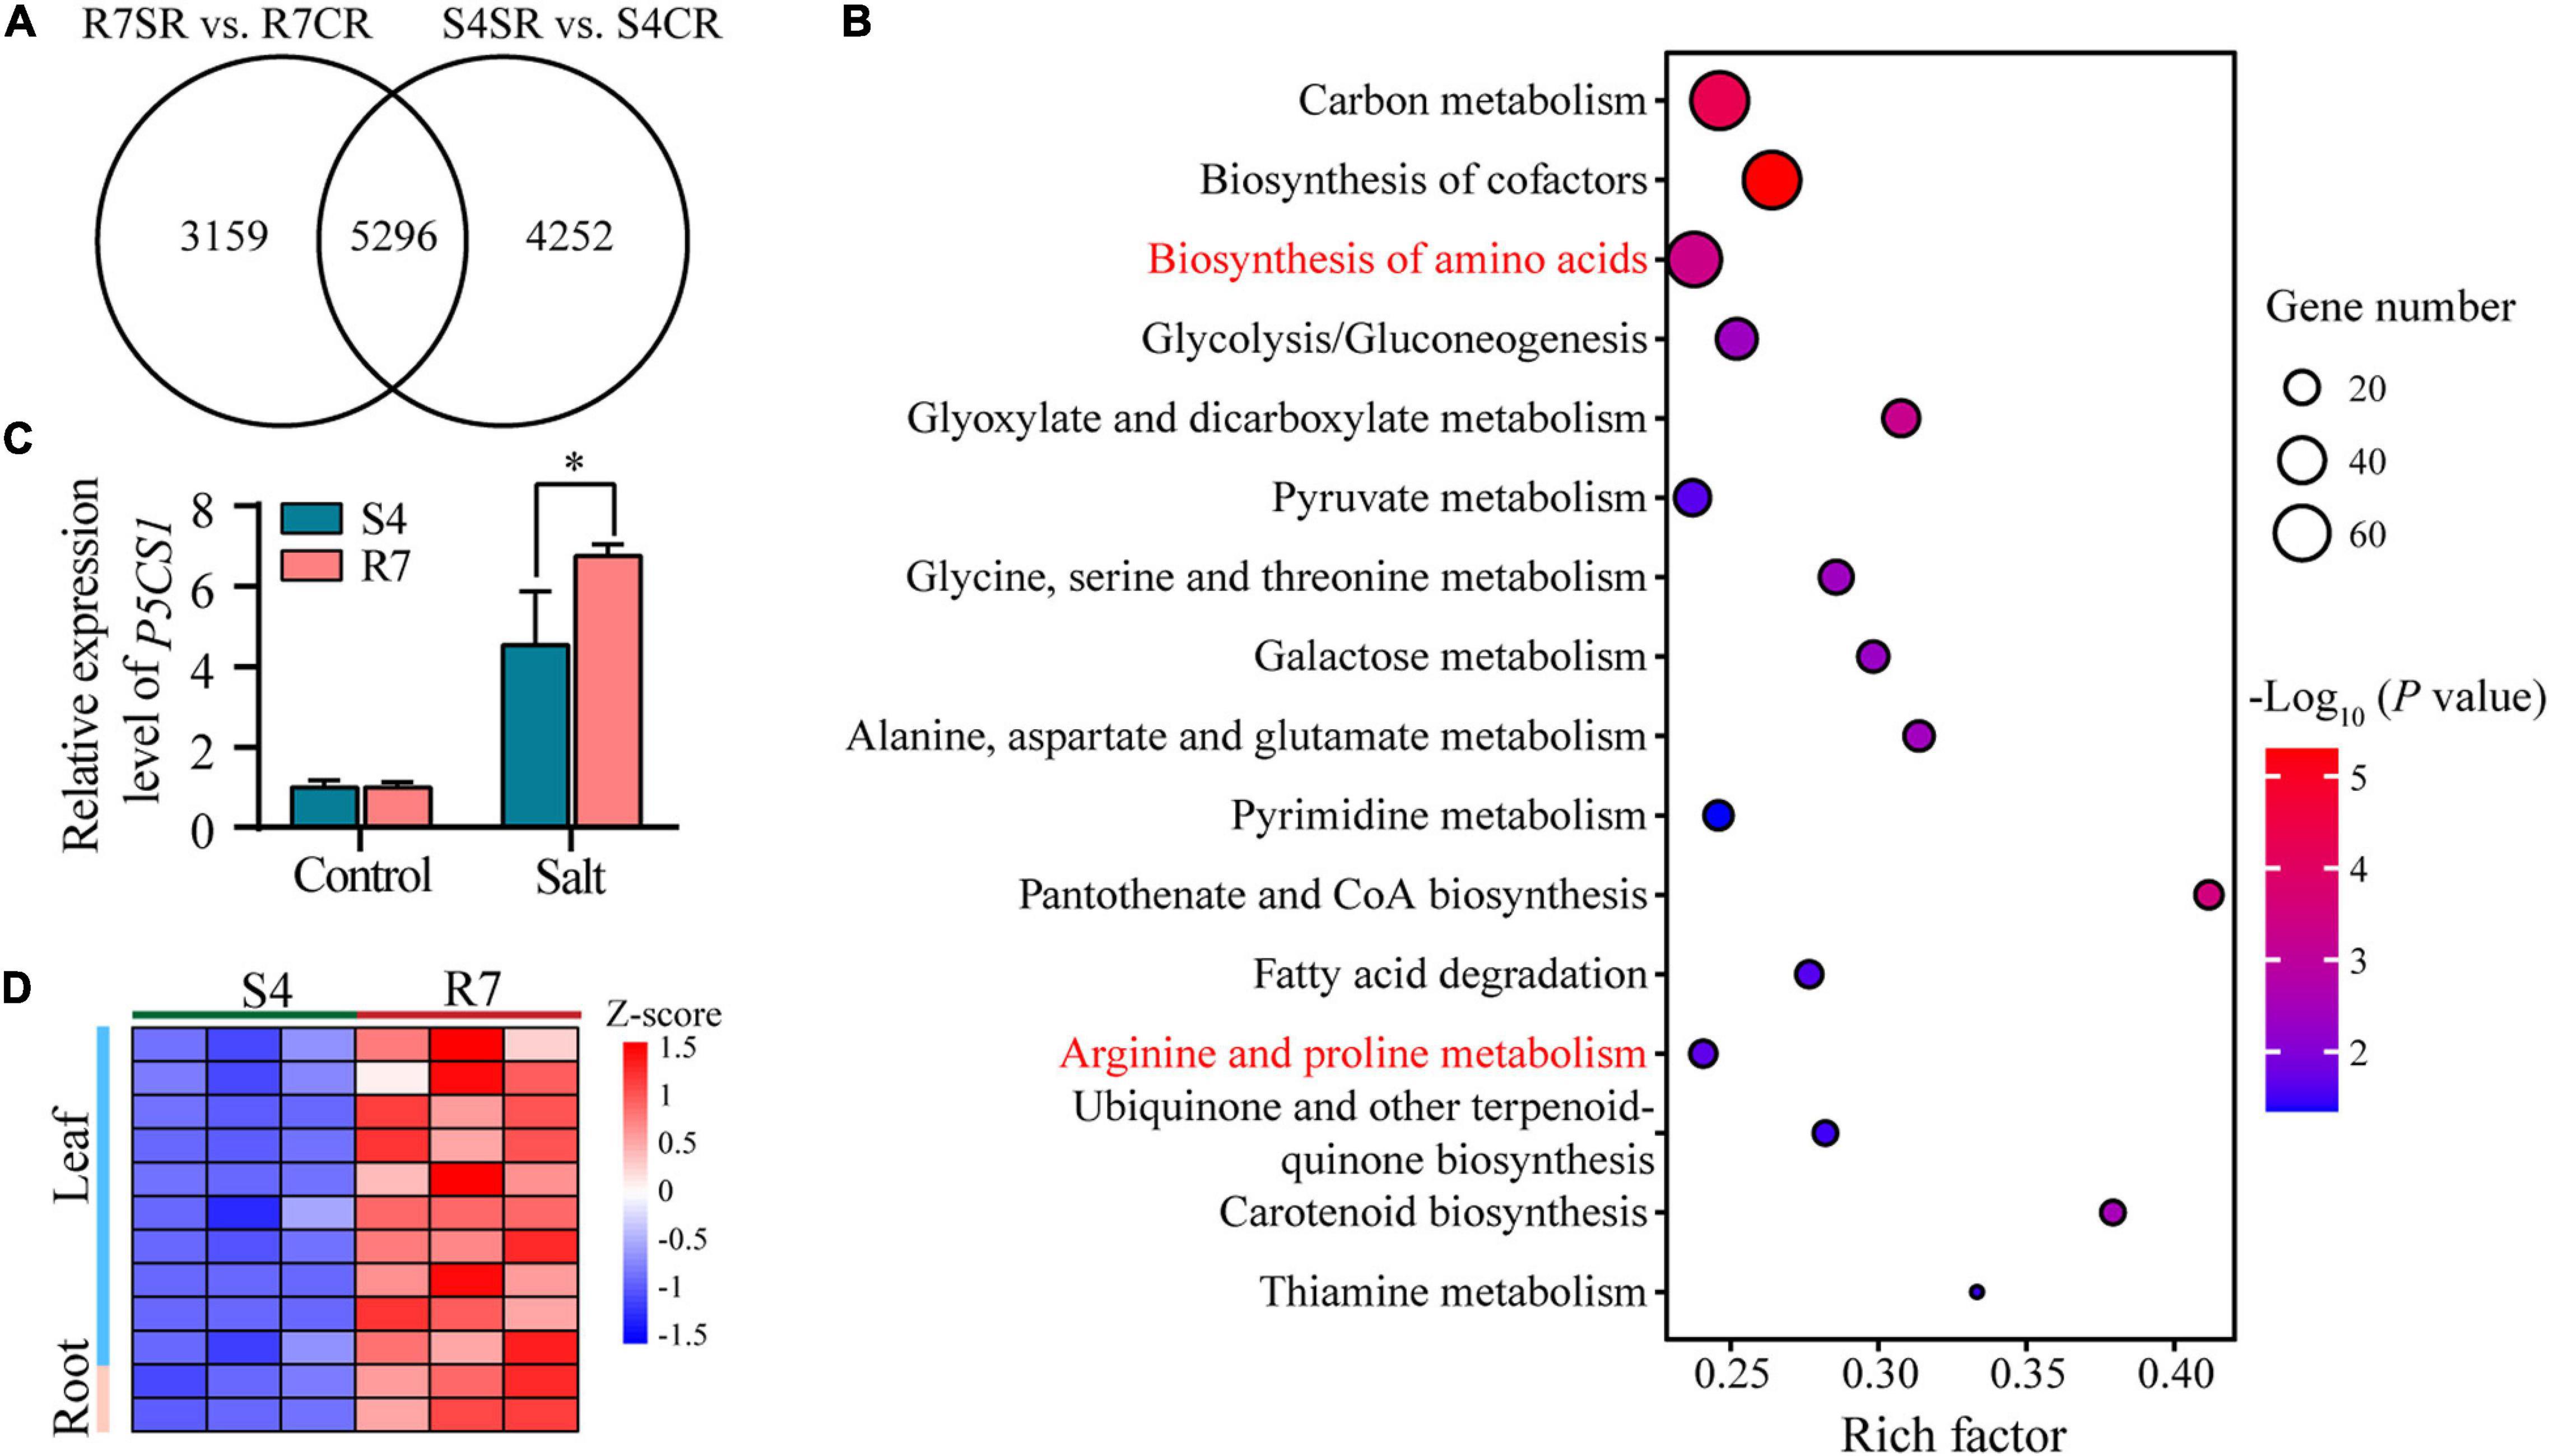
Figure 6. The KEGG pathway enrichment analysis of the shared DEGs between comparisons R7SR vs. R7CR and S4SR vs. S4CR and further analysis of proline metabolism. (A) Venn diagram of DEGs in response to salt stress in F. velutina R7 and S4 roots. (B) The significantly enriched pathways (P < 0.05). Size of dot represented the number of DEGs and from blue to red represented the P-value from low to high. (C) Detecting the relative expression levels of P5CS1 in F. velutina R7 and S4 roots with or without salt treatment. (D) Relative expression levels of a peroxidase (POD) gene in R7 and S4 roots with or without salt treatment. Heatmap color represented z-score and from blue to red represented the value from low to high. *P < 0.05 represented significant differences.
Fraxinus velutina R7 Roots and Leaves Accumulated Less Reactive Oxygen Species Than S4
The increase in ROS levels leads to oxidative stress, posing detrimental effects on plant cells and tissues (Choudhury et al., 2017). Therefore, the DEGs involved in response to oxidative stress were analyzed further via dissecting the oxidative stress-related GO terms. Among the genes, 12 encoding peroxidases (PODs) were upregulated higher in R7 leaves (10 genes) and roots (2 genes) than in S4 (Figure 6D and Supplementary Table 4) under salt stress. Consistently, R7 leaves and roots presented lower levels of H2O2 than S4 under salt stress (Figures 1E–G). Collectively, these results suggested that R7 exhibits higher ROS scavenging capacity than S4 under salt stress.
Several Transcription Factors Were Involved in Defense Response of Fraxinus velutina R7 Against Salt Stress
Transcription factors (TFs) act as the master switches in regulating multiple downstream target genes, thus playing crucial roles in various biological processes including salt stress response. By dissecting the RNA sequencing data, multiple TF genes were significantly altered between R7 and S4 under salt stress (Figure 7 and Supplementary Tables 9, 10). Among the significantly expressed TFs, 172 and 85 TFs were specifically expressed in R7SL vs. R7CL and S4SL vs. S4CL, respectively, and 115 were overlapped in both R7 and S4 (Figures 7A,B). Of the shared TFs, ERF, WRKY, LBD, and MYB were the most represented TF families induced by salt stress (Figure 7C).
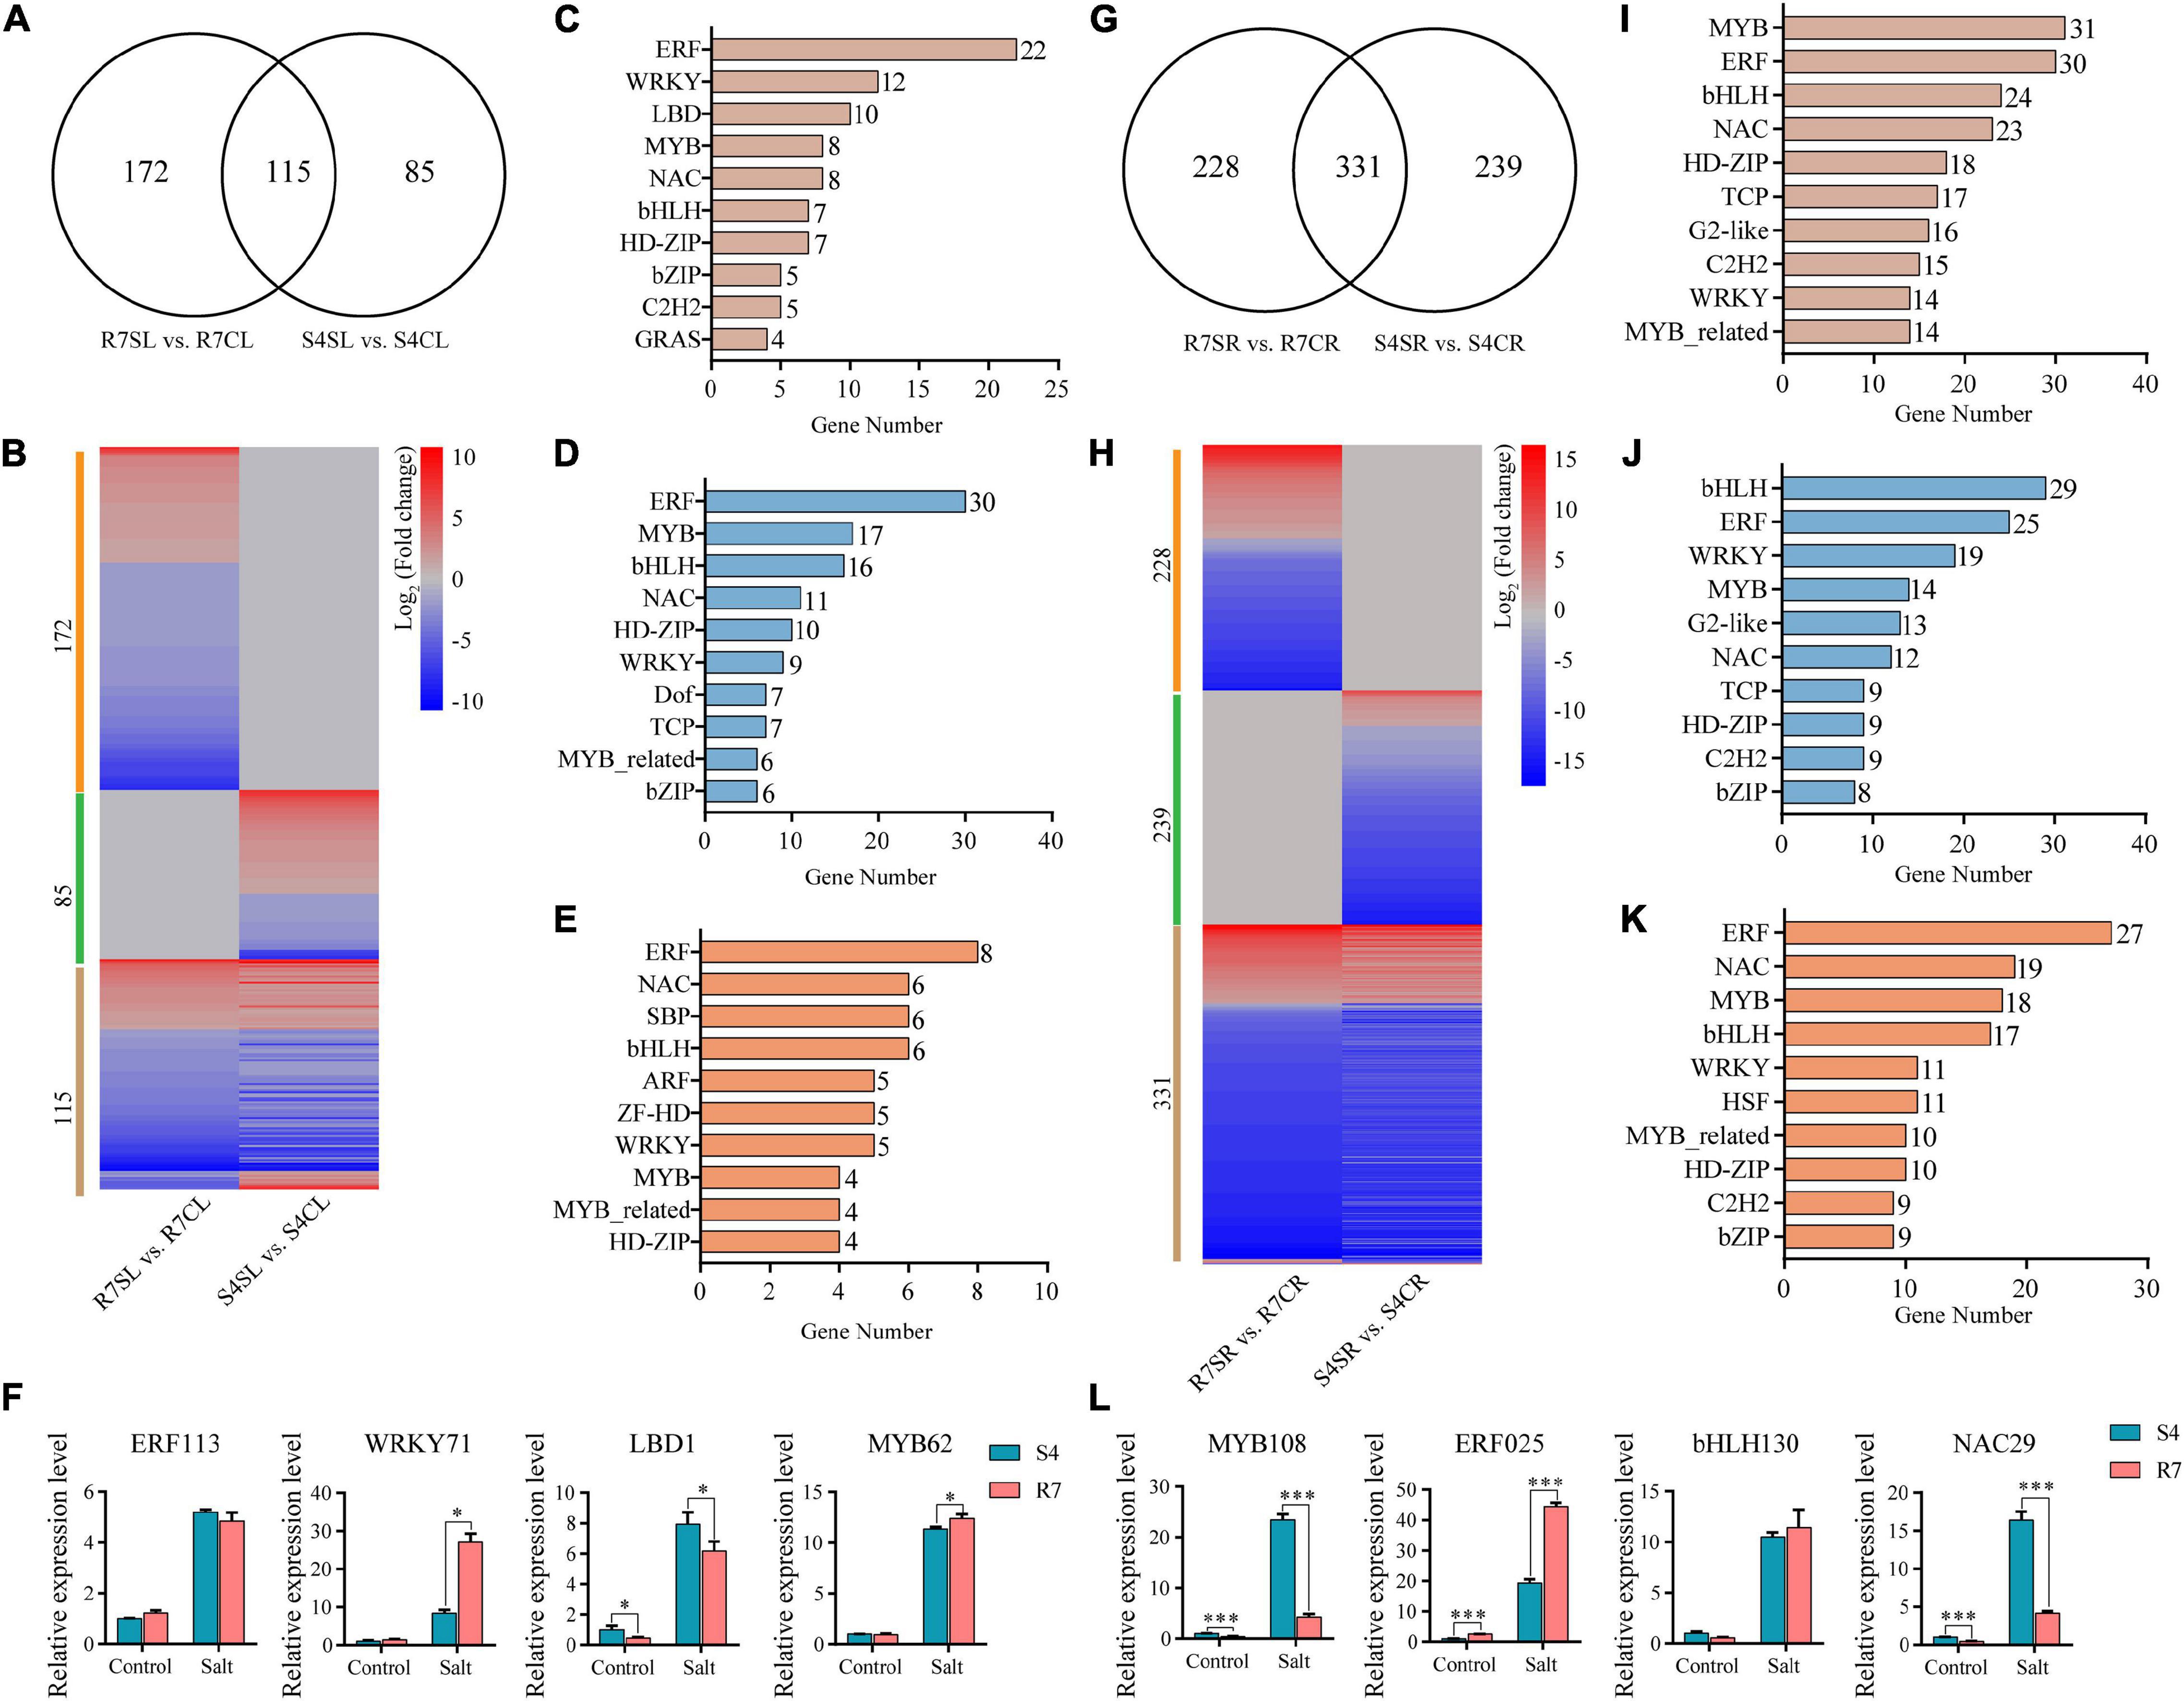
Figure 7. Analysis of the differentially expressed transcription factors (TFs) in R7 and S4. (A,G) Venn diagrams showed the distribution of salt-induced TFs in R7 and S4 leaves and roots. (B,H) Heatmap showed the fold change of salt-treated R7 and S4 roots and leaves compared to their corresponding non-treated samples. (A–E, I–K) The top 10 TF families (ranked by gene number) in specific and common TFs among different comparisons. (F,L) The relative expression levels of the shared differentially expressed TFs in leaves and roots. *P < 0.05 and ***P < 0.001 represented significant differences.
In leaves under salt stress, 30 genes were encoding ERF, 17 encoding MYB, 16 encoding bHLH, and 11 encoding NAC prominently expressed in R7 (Figure 7D), whereas there were 8 encoding ERF, 6 encoding NAC, 6 encoding SBP, and 6 encoding bHLH prominently expressed in S4 (Figure 7E). In root tissues, bHLH, ERF, WRKY, and MYB TF families were prominently induced by salt stress in both R7 and S4 (Figures 7H,I). There were 29 genes encoding bHLH, 25 encoding ERF, and 19 encoding WRKY preferentially induced in R7 (Figure 7J), whereas 27 genes were encoding ERF, 19 encoding NAC, and 18 encoding MYB preferentially induced in S4 (Figure 7K).
To further confirm the roles of these TFs in regulating the stress response, 8 TF genes, namely, ERF113, WRKY71, LBD1, and MYB62 in leaves and MYB108, ERF025, bHLH130, and NAC29 in roots were chosen to perform qRT-PCR analysis. The results showed that both WRKY71 and MYB62 were significantly upregulated higher in R7 leaf than in S4, while LBD1 was downregulated in R7 compared with S4 (Figure 7F). In addition, MYB108 and NAC29 were found downregulated in R7 root than in S4, whereas ERF025 was significantly upregulated in R7 in comparison to S4 (Figure 7L). These results suggested that the stress-responsive TFs, such as WRKY71, MYB62, and ERF025 are the important contributors to enhancing salt tolerance in R7.
Discussion
In this study, to explore the mechanisms underlying salt tolerance of F. velutina, a comparative transcriptome analysis was performed on the leaf and root of two contrasting materials, F. velutina R7 (salt-tolerant) and S4 (salt-sensitive) clone exposed to salt stress. The results showed that the high salt tolerance of R7 is mainly attributed to the enrichment of stress-responsive genes. The stress-responsive genes in the R7 leaf were associated with plant hormone signaling and MAPK signaling pathways, whereas the genes in the root were involved in proline biosynthesis and starch and sucrose metabolism. The genes encoding POD were upregulated after salt exposure, resulting in high ROS scavenging capacity in R7.
Plant hormones are the important contributors of plant growth and developmental processes and play crucial roles in biotic and abiotic stress responses (Wang et al., 2013; Xia et al., 2015; Kaleem et al., 2018). In this study, the pathway “plant hormone signal transduction” was significantly enriched in the R7 leaf, which included 23 DEGs related to auxin, cytokinin, gibberellin, abscisic acid, ethylene, and salicylic acid. Our results were consistent with the previous studies showed that these hormones play irreplaceable roles in the response to salt stress in plants (Zheng et al., 2018; Feng et al., 2019; Gao et al., 2021; Huang et al., 2021; Saini et al., 2021; Zhu et al., 2021). For instance, salt stress can induce ABA signaling and activate an ABA-dependent responsive complex to cope with saline stress in plants (Umezawa et al., 2009; Cai et al., 2017; Soma et al., 2017; Lin et al., 2021). In this study, 5 DEGs related to ABA signal transduction were significantly affected under salt stress, such the significantly upregulated genes encoding protein phosphatase (PP2C), which has been confirmed that the upregulation of PP2C can lead to enhanced salt tolerance in Arabidopsis and maize (Liu et al., 2012). These findings suggested that the activation of hormone signaling improves salt tolerance in plants. In addition, we found that PYR1/PYL/RCAR ABA receptor genes and PP2C were the top salt responsive genes, suggesting that these genes are the candidate genes for developing salinity resilience through genetic engineering in the future.
The stress-responsive genes in the R7 leaf were also involved in the MAPK signaling pathway, which is documented to modulate plant tolerance to various abiotic stress, such as salt stress (De Zelicourt et al., 2016). The pathway included multiple genes that respond to salt stress, such as calmodulin (CAM4), mitogen-activated protein kinase 3 (MPK3), and WRKY transcription factor 33 (WRKY33). The overexpression of MsCML46 in tobacco can lead to enhanced tolerance to multiple stresses, namely, drought, freezing, and salt stress (Du et al., 2021). In potatoes, it is confirmed that the overexpression of MPK3 can enhance osmosis and salinity tolerances by modulating the antioxidant system and proline biosynthesis (Zhu et al., 2020). In Arabidopsis, WRKY33 leads to enhanced salt tolerance by modulating CYP94B1 expression (Krishnamurthy et al., 2020). These results indicated that the genes involved in the MAPK signaling pathway are important contributors to high salt tolerance in plants, especially CAM4, MPK3, and WRKY33 which are the important candidate genes for future salt-tolerant plants breeding through genetic engineering.
Under salt stress conditions, the compatible osmolytes soluble sugars and proline are critical for adjusting osmotic potential induced by excessive salt stress (Zhu, 2016; Liang et al., 2018). Increasing evidence indicated that the accumulation of soluble sugars and proline is associated with enhanced stress tolerance in plant cells (Mansour and Ali, 2017; Dai et al., 2018; Rady et al., 2019). Proline content, antioxidant activities, and potassium content are influenced in response to abiotic stresses for controlling membrane stability and mitigating the toxicity of sodium (Heidari et al., 2021; Musavizadeh et al., 2021). In our study, a gene encoding P5CS1, a rate-limiting enzyme involved in proline biosynthesis (Turchetto-Zolet et al., 2009), was differentially upregulated to higher levels in R7 roots than in S4. Meanwhile, significantly elevated levels of proline were also found in R7 roots. In addition, the contents of soluble sugars were determined and we found R7 roots exhibited higher levels of soluble sugars than S4. These results suggested that the increased levels in soluble sugars and proline lead to enhanced salt tolerance and that the salt stress-induced P5CS1 is a crucial candidate for salt-tolerant engineering in F. velutina.
Salt stress causes oxidative stress by promoting the generation of ROS in the plant (Zhu, 2016). It is documented that plants can alleviate ROS-caused damages by activating several enzymatic and non-enzymatic pathways involved in the antioxidant system (Choudhury et al., 2017). Previous studies have revealed that the improved ROS scavenging capacity can enhance plant tolerance to several stresses (Gill and Tuteja, 2010; Zhang et al., 2015; Wei et al., 2019). In our study, 12 genes encoding POD were upregulated to higher in R7 compared with S4 under salt stress. Consistently, lower levels of H2O2 and fewer cell damages were found in R7 than in S4.
Conclusion
This study revealed that F. velutina R7 presents higher salt tolerance than S4. The findings reported here allow us to propose a potential mechanism to explain the high salt tolerance of R7 (Figure 8). Under salt stress, R7 activates multifaceted defense machines in the roots and leaves to enhance salt tolerance. In the R7 root, salt stress induces the upregulation of P5CS1 and the key genes involved in starch and sucrose metabolism, therefore increasing osmotic adjustment. In the R7 leaf, salt stress induces the upregulation of important genes involved in plant hormone signaling (especially PYR1/PYL/RCAR ABA receptor genes and PP2C) and MAPK signaling pathways (especially CAM4, MPK3, and WRKY33). In addition, salt stress induces the upregulation of POD genes in both roots and leaves, enhancing ROS scavenging capacity. Collectively, our findings revealed the crucial defense pathways underlying the high salt tolerance of R7, thus providing insights into the salt-tolerant F. velutina breeding.
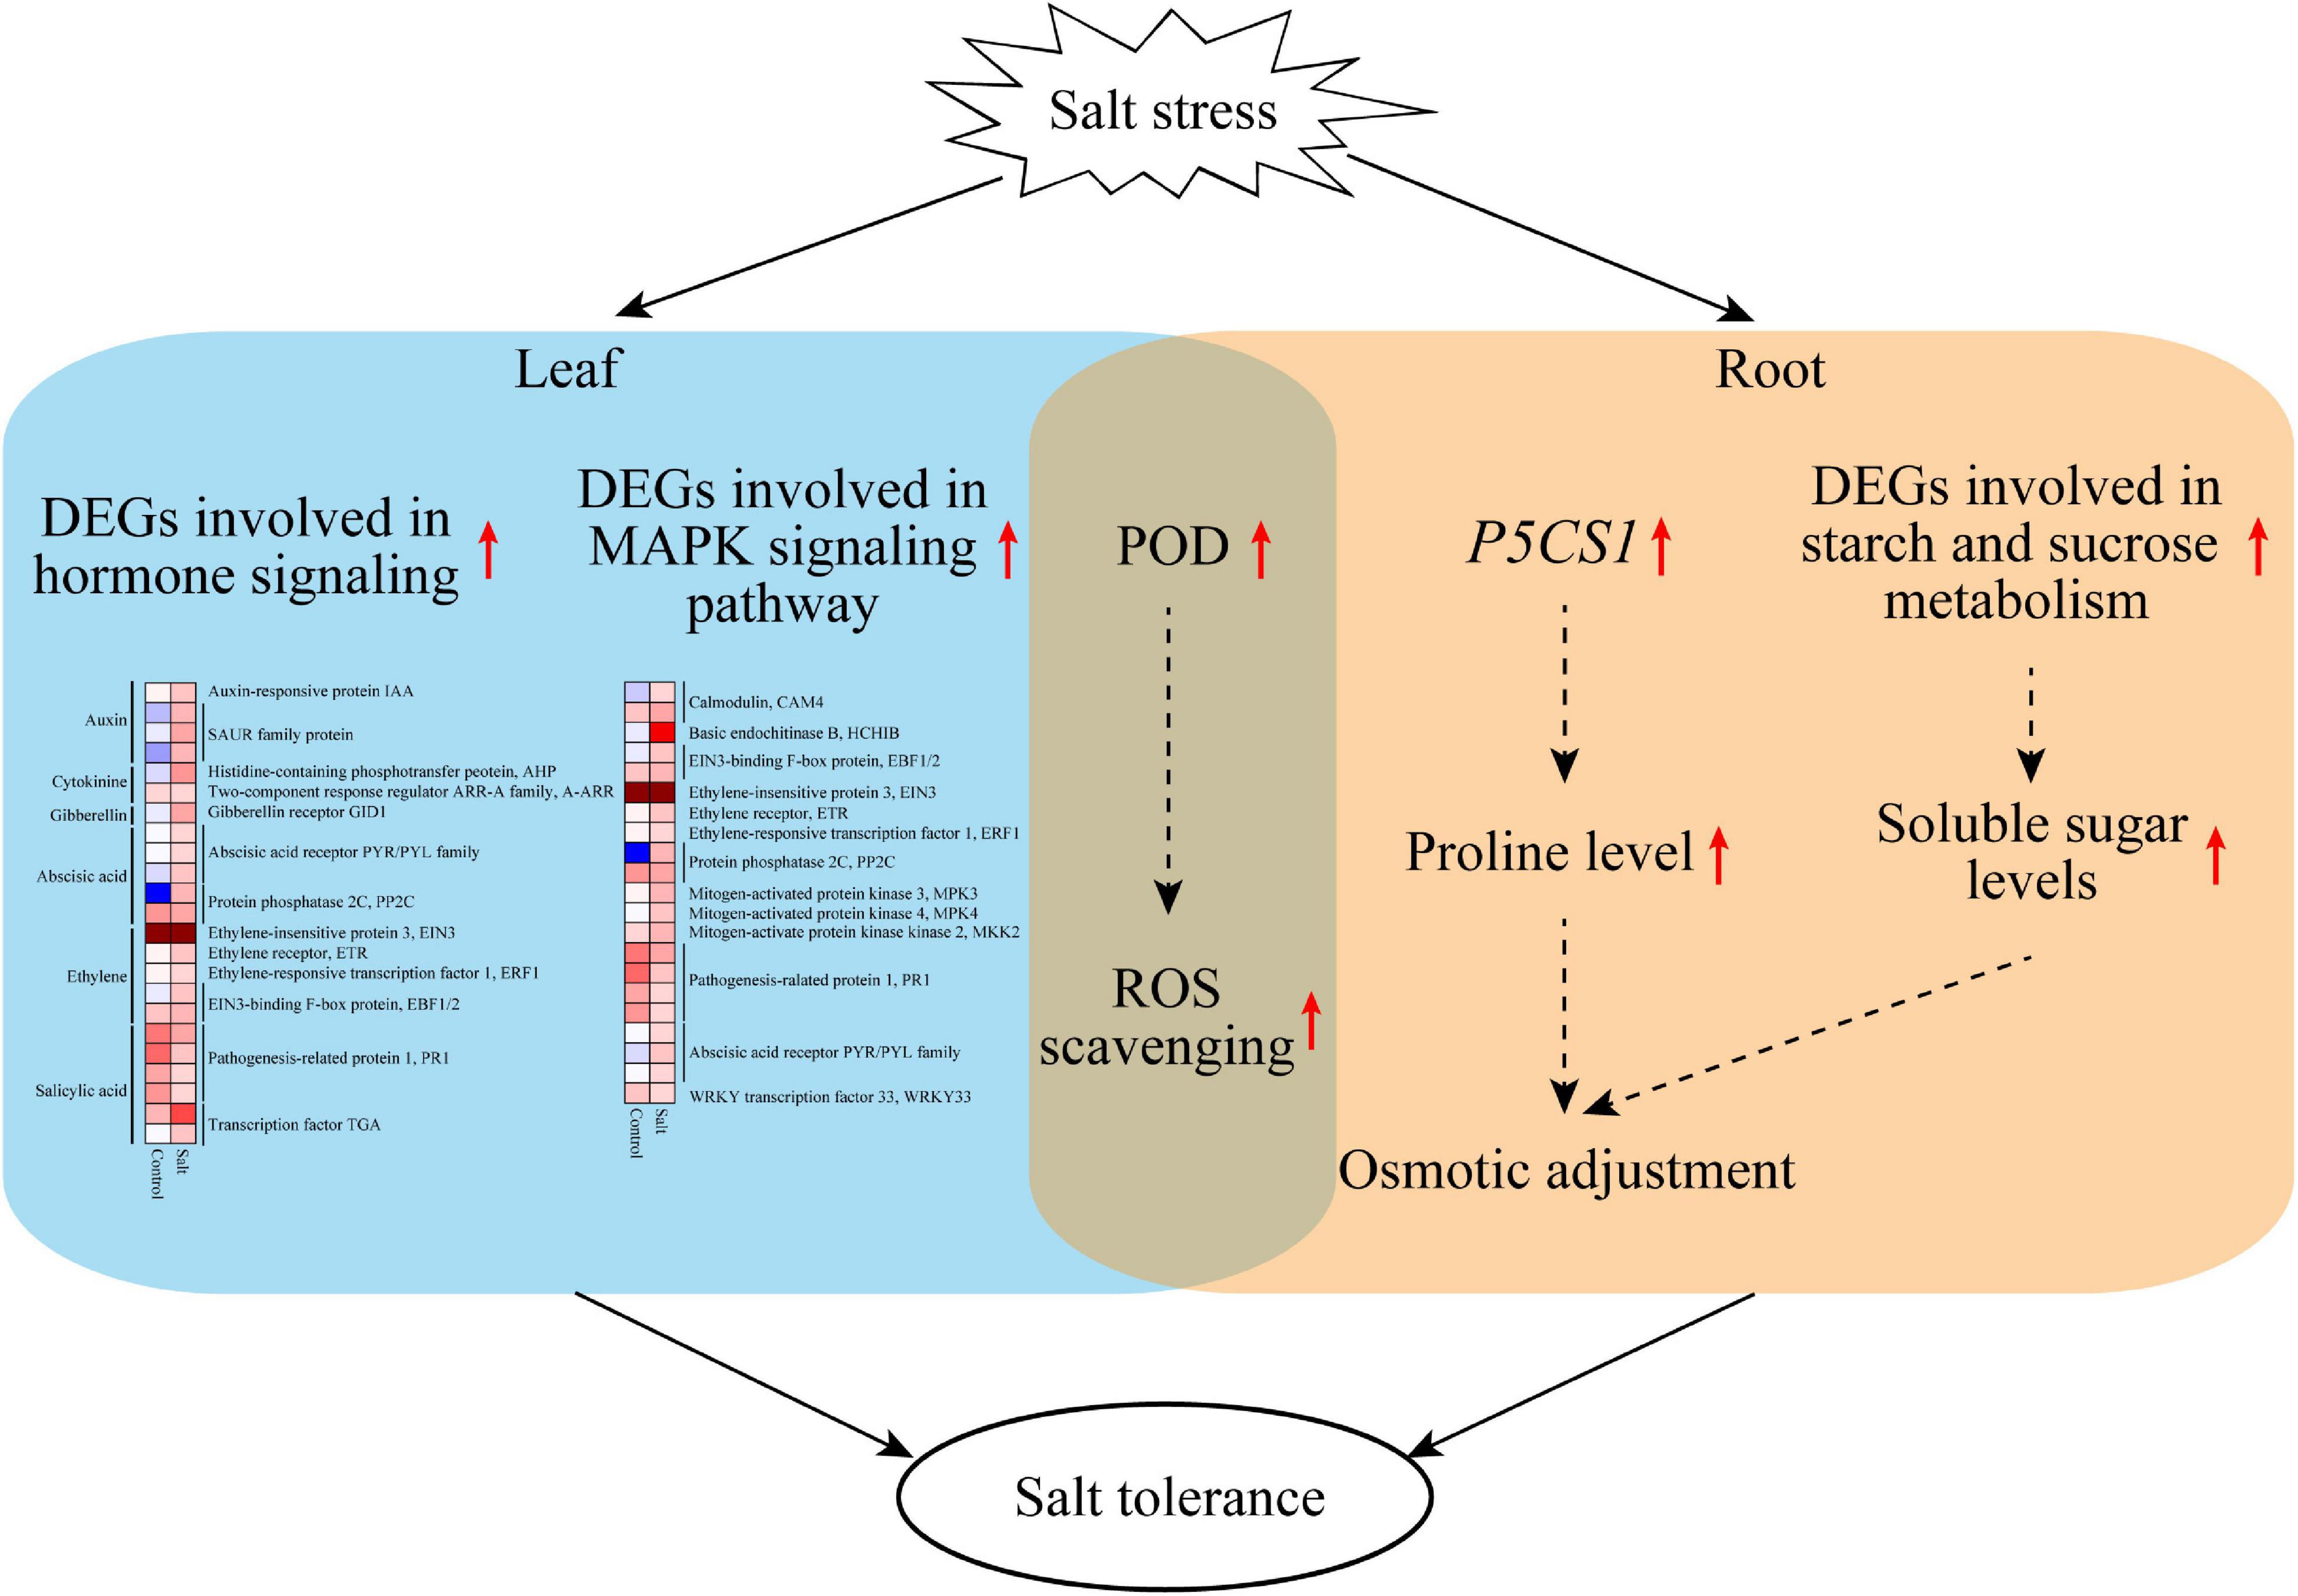
Figure 8. A model proposed potentially to explain the high salt tolerance of F. velutina R7. Under salt stress, R7 activates multifaceted defense machines in the roots and leaves to enhance salt tolerance. In the R7 root, salt stress induces the upregulation of P5CS1 and the key genes involved in starch and sucrose metabolism, therefore increasing osmotic adjustment. In the R7 leaf, salt stress induces the upregulation of important genes involved in plant hormone signaling (especially PYR1/PYL/RCAR ABA receptor genes and PP2C) and MAPK signaling pathways (especially CAM4, MPK3, and WRKY33). In addition, salt stress induces the upregulation of POD genes in both roots and leaves, so enhancing ROS scavenging capacity.
Data Availability Statement
The datasets presented in this study can be found in online repositories. The names of the repository/repositories and accession number(s) can be found in the article/Supplementary Material. The RNA-Seq data presented in this study can be available at the Sequence Read Archive under accession numbers PRJNA791967.
Author Contributions
KY and DW conceptualized the research program. JL, XM, and LY finished the analysis of this study and wrote the manuscript. QL, HF, and CW conducted the RNA sequencing data analysis. YD and ZC designed the qRT-PCR experiment and finished the operation. RZ, YB, and WH planted the material and finished the physiology analysis. JL, KY, and DW revised the manuscript. All authors discussed the results, commented on the manuscript, and approved the submitted version.
Funding
This study was supported by the Improved Variety Program of Shandong Province of China (2019LZGC009).
Conflict of Interest
The authors declare that the research was conducted in the absence of any commercial or financial relationships that could be construed as a potential conflict of interest.
Publisher’s Note
All claims expressed in this article are solely those of the authors and do not necessarily represent those of their affiliated organizations, or those of the publisher, the editors and the reviewers. Any product that may be evaluated in this article, or claim that may be made by its manufacturer, is not guaranteed or endorsed by the publisher.
Supplementary Material
The Supplementary Material for this article can be found online at: https://www.frontiersin.org/articles/10.3389/fpls.2022.842726/full#supplementary-material
Supplementary Figure 1 | All the samples were hierarchical clustered by calculating correlation coefficient (γ2) between each sample. From blue to red represented the value of γ2 from low to high.
Supplementary Figure 2 | Identification of the differentially expressed genes (DEGs) in leaves. (A) Heatmap showed the expression patterns of DEGs in comparisons S4SL vs. S4CL, R7CL vs. S4CL, R7SL vs. S4SL, and R7SL vs. R7CL based on Z-score. The color represented the Z-score. From blue to red represented the Z-score from low to high. (B) Venn diagram showed the distribution of upregulated and downregulated DEGs among different comparisons, respectively.
Supplementary Figure 3 | Identification of the differentially expressed genes (DEGs) in roots. (A) Heatmap showed the expression patterns of DEGs in comparisons S4SR vs. S4CR, R7CR vs. S4CR, R7SR vs. S4SR, and R7SR vs. R7CR based on Z-score. The color represented the Z-score. From blue to red represented the Z-score from low to high. (B) Venn diagram showed the distribution of upregulated and downregulated DEGs among different comparisons, respectively.
Supplementary Figure 4 | The Kyoto Encyclopedia of Genes and Genomes (KEGG) pathway analysis of downregulated genes in comparison R7SL vs. S4SL.
Footnotes
References
Arocho, A., Beiyun, C., Marc, L., and Qiulu, P. (2006). Validation of the 2-DeltaDeltaCt calculation as an alternate method of data analysis for quantitative PCR of BCR-ABL P210 transcripts. Diagn. Mol. Pathol. 15, 56–61. doi: 10.1097/00019606-200603000-00009
Ashraf, M. (2009). Biotechnological approach of improving plant salt tolerance using antioxidants as markers. Biotechnol. Adv. 27, 84–93. doi: 10.1016/j.biotechadv.2008.09.003
Bari, R., and Jones, J. D. (2009). Role of plant hormones in plant defence responses. Plant Mol. Biol. 69, 473–488. doi: 10.1007/s11103-008-9435-0
Bindea, G., Mlecnik, B., Hackl, H., Charoentong, P., Tosolini, M., Kirilovsky, A., et al. (2009). ClueGO: a cytoscape plug-in to decipher functionally grouped gene ontology and pathway annotation networks. Bioinformatics 25, 1091–1093. doi: 10.1093/bioinformatics/btp101
Bolger, A. M., Lohse, M., and Usadel, B. (2014). Trimmomatic: a flexible trimmer for Illumina sequence data. Bioinformatics 30, 2114–2120. doi: 10.1093/bioinformatics/btu170
Cai, S., Chen, G., Wang, Y., Huang, Y., Marchant, D. B., Wang, Y., et al. (2017). Evolutionary conservation of ABA signaling for stomatal closure. Plant Physiol. 174, 732–747. doi: 10.1104/pp.16.01848
Catalá, R., López-Cobollo, R., Berbís, M. Á, Jiménez-Barbero, J., and Salinas, J. (2021). Trimethylamine N-oxide is a new plant molecule that promotes abiotic stress tolerance. Sci. Adv. 7:eabd9296. doi: 10.1126/sciadv.abd9296
Chen, X., Ding, Y., Yang, Y., Song, C., Wang, B., Yang, S., et al. (2021). Protein kinases in plant responses to drought, salt, and cold stress. J. Integr. Plant. Biol. 63, 53–78. doi: 10.1111/JIPB.13061
Chinnusamy, V., Schumaker, K., and Zhu, J. K. (2004). Molecular genetic perspectives on cross-talk and specificity in abiotic stress signalling in plants. J. Exp. Bot. 55, 225–236. doi: 10.1093/jxb/erh005
Choudhury, F. K., Rivero, R. M., Blumwald, E., and Mittler, R. (2017). Reactive oxygen species, abiotic stress and stress combination. Plant J. 90, 856–867. doi: 10.1111/tpj.13299
Dahro, B., Wang, F., Peng, T., and Liu, J. H. (2016). PtrA/NINV, an alkaline/neutral invertase gene of Poncirus trifoliata, confers enhanced tolerance to multiple abiotic stresses by modulating ROS levels and maintaining photosynthetic efficiency. BMC Plant Biol. 16:76. doi: 10.1186/s12870-016-0761-0
Dai, W., Wang, M., Gong, X., and Liu, J. H. (2018). The transcription factor FcWRKY40 of Fortunella crassifolia functions positively in salt tolerance through modulation of ion homeostasis and proline biosynthesis by directly regulating SOS2 and P5CS1 homologs. New Phytol. 219, 972–989. doi: 10.1111/nph.15240
Daudi, A., and O’Brien, J. A. (2012). Detection of hydrogen peroxide by DAB staining in Arabidopsis leaves. Bio Protoc. 2:e263. doi: 10.21769/BioProtoc.263
De Zelicourt, A., Jean, C., and Heribert, H. (2016). The role of MAPK modules and ABA during abiotic stress signaling. Trends Plant Sci. 21, 677–685. doi: 10.1016/j.tplants.2016.04.004
Du, B., Chen, N., Song, L., Wang, D., Cai, H., and Yao, L. (2021). Alfalfa (Medicago sativa L.) MsCML46 gene encoding calmodulin-like protein confers tolerance to abiotic stress in tobacco. Plant Cell Rep. 40, 1907–1922. doi: 10.1007/S00299-021-02757-7
Egamberdieva, D., Wirth, S., Bellingrath-Kimura, S. D., Mishra, J., and Arora, N. K. (2019). Salt-tolerant plant growth promoting rhizobacteria for enhancing crop productivity of saline soils. Front Microbiol. 10, 2791–2791. doi: 10.3389/fmicb.2019.02791
Fang, H., Liu, X., Dong, Y., Feng, S., Zhou, R., and Wang, C. (2021). Transcriptome and proteome analysis of walnut (Juglans regia L.) fruit in response to infection by colletotrichum gloeosporioides. BMC Plant Biol. 21:249. doi: 10.1186/S12870-021-03042-1
Feng, Y., Liu, J., Zhai, L., Gan, Z., Zhang, G., Yang, S., et al. (2019). Natural variation in cytokinin maintenance improves salt tolerance in apple rootstocks. Plant Cell Environ. 42, 424–436. doi: 10.1111/pce.13403
Gabilly, S. T., Baker, C. R., Wakao, S., Crisanto, T., Guan, K., Bi, K., et al. (2019). Regulation of photoprotection gene expression in Chlamydomonas by a putative E3 ubiquitin ligase complex and a homolog of CONSTANS. Proc. Natl. Acad. Sci. U.S.A. 116, 17556–17562. doi: 10.1073/pnas.1821689116
Gao, H., Huang, H., Lu, K., Wang, C., Liu, X., Song, Z., et al. (2021). OsCYP714D1 improves plant growth and salt tolerance through regulating gibberellin and ion homeostasis in transgenic poplar. Plant Physiol. Biochem. 168, 447–456. doi: 10.1016/J.PLAPHY.2021.10.023
Gill, S. S., and Tuteja, N. (2010). Reactive oxygen species and antioxidant machinery in abiotic stress tolerance in crop plants. Plant Physiol. Biochem. 48, 909–930. doi: 10.1016/j.plaphy.2010.08.016
Gucci, R., Lombardini, L., and Tattini, M. (1997). Analysis of leaf water relations in leaves of two olive (Olea europaea) cultivars differing in tolerance to salinity. Tree Physiol. 17, 13–21. doi: 10.1093/treephys/17.1.13
He, L., Xu, Y., Zeng, F., Tian, H., Xiao, Y., Liu, H., et al. (2021). Establishment of a micropropagation supporting technology for the Fraxinus mandshurica × Fraxinus sogdiana. Vitro Cell Dev. Biol. 57, 307–318. doi: 10.1007/S11627-021-10157-5
Heidari, P., Entazari, M., Ebrahimi, A., Ahmadizadeh, M., Vannozzi, A., Palumbo, F., et al. (2021). Exogenous EBR ameliorates endogenous hormone contents in tomato species under low-temperature stress. Horticulturae 7:84. doi: 10.3390/horticulturae7040084
Huang, G. T., Ma, S. L., Bai, L. P., Zhang, L., Ma, H., Jia, P., et al. (2012). Signal transduction during cold, salt, and drought stresses in plants. Mol. Biol. Rep. 39, 969–987. doi: 10.1007/s11033-011-0823-1
Huang, Y., Zhou, J., Li, Y., Quan, R., Wang, J., Huang, R., et al. (2021). Salt stress promotes abscisic acid accumulation to affect cell proliferation and expansion of primary roots in rice. Int. J. Mol. Sci. 22:10892. doi: 10.3390/IJMS221910892
Ji, H., Pardo, J. M., Batelli, G., Van Oosten, M. J., Bressan, R. A., Li, X., et al. (2013). The Salt Overly Sensitive (SOS) pathway: established and emerging roles. Mol. Plant. 6, 275–286. doi: 10.1093/mp/sst017
Kaleem, F., Shabir, G., Aslam, K., Rasul, S., Manzoor, H., Shah, S. M., et al. (2018). An overview of the genetics of plant response to salt stress: present status and the way forward. Appl. Biochem. Biotechnol. 186, 306–334. doi: 10.1007/s12010-018-2738-y
Kelly, L. J., Plumb, W. J., Carey, D. W., Mason, M. E., Cooper, E. D., Crowther, W., et al. (2020). Convergent molecular evolution among ash species resistant to the emerald ash borer. Nat. Ecol. Evol. 4, 1116–1128. doi: 10.1038/s41559-020-1209-3
Kim, D., Langmead, B., and Salzberg, S. L. (2015). HISAT: a fast spliced aligner with low memory requirements. Nat. Methods. 12, 357–360. doi: 10.1038/nmeth.3317
Krishnamurthy, P., Vishal, B., Ho, W. J., Lok, F. C. J., Lee, F. S. M., Kumar, P. P., et al. (2020). Regulation of a cytochrome P450 gene CYP94B1 by WRKY33 transcription factor controls apoplastic barrier formation in roots to confer salt tolerance. Plant Physiol. 184, 2199–2215. doi: 10.1104/pp.20.01054
Li, C., Cheng, P., Li, Z., Xu, Y., Sun, Y., Qin, D., et al. (2021). Transcriptomic and metabolomic analyses provide insights into the enhancement of torulene and torularhodin production in rhodotorula glutinis ZHK under moderate salt conditions. J. Agric. Food Chem. 69, 11523–11533. doi: 10.1021/ACS.JAFC.1C04028
Li, M., Li, Y., Li, H., and Wu, G. (2012). Improvement of paper mulberry tolerance to abiotic stresses by ectopic expression of tall fescue FaDREB1. Tree Physiol. 32, 104–113. doi: 10.1093/treephys/tpr124
Li, T., Peng, Z. Y., Bi, Y. P., and Fan, Z. X. (2013). Molecular cloning and expression analysis of FvMYB1 from Fraxinus velutina Torr. Turk J. Agric. For. 37, 517–526. doi: 10.3906/tar-1209-4
Li, T., Sun, J., Li, C., Lu, Z., and Xia, J. (2019). Cloning and expression analysis of the FvNCED3 gene and its promoter from ash (Fraxinus velutina). J. For. Res. 30, 471–482. doi: 10.1007/s11676-018-0632-7
Liang, W., Ma, X., Wan, P., and Liu, L. (2018). Plant salt-tolerance mechanism: a review. Biochem. Biophys. Res. Commun. 495, 286–291. doi: 10.1016/j.bbrc.2017.11.043
Lin, Z., Li, Y., Wang, Y., Liu, X., Ma, L., Zhang, Z., et al. (2021). Initiation and amplification of SnRK2 activation in abscisic acid signaling. Nat. Commun. 12:2456. doi: 10.1038/S41467-021-22812-X
Liu, X., Zhu, Y., Zhai, H., Cai, H., Ji, W., Luo, X., et al. (2012). AtPP2CG1, a protein phosphatase 2C, positively regulates salt tolerance of Arabidopsis in abscisic acid-dependent manner. Biochem. Biophs. Res. Commun. 422, 710–715. doi: 10.1016/j.bbrc.2012.05.064
Love, M. I., Huber, W., and Anders, S. (2014). Moderated estimation of fold change and dispersion for RNA-seq data with DESeq2. Genome Biol. 15:550. doi: 10.1186/s13059-014-0550-8
Ma, L., Zhang, M., Chen, J., Qing, C., He, S., Zou, C., et al. (2021). GWAS and WGCNA uncover hub genes controlling salt tolerance in maize (Zea mays L.) seedlings. Theor. Appl. Genet. 134, 3305–3318. doi: 10.1007/S00122-021-03897-W
Mansour, M. M. F., and Ali, E. F. (2017). Evaluation of proline functions in saline conditions. Phytochemistry 140, 52–68. doi: 10.1016/j.phytochem.2017.04.016
Mao, P., Tang, Q., Cao, B., Liu, J., Shao, H., Cai, Z., et al. (2017). Eco-physiological adaptability in mixtures of robinia pseudoacacia and Fraxinus velutina and coastal eco-engineering. Ecol. Eng. 106, 109–115. doi: 10.1016/j.ecoleng.2017.05.021
Musavizadeh, Z., Najafi-Zarrini, H., Kazemitabar, S. K., Hashemi, S. H., Faraji, S., Barcaccia, G., et al. (2021). Genome-wide analysis of potassium channel genes in rice: expression of the OsAKT and OsKAT genes under salt stress. Genes 12:784. doi: 10.3390/genes12050784
Pertea, M., Pertea, G. M., Antonescu, C. M., Chang, T. C., Mendell, J. T., Salzberg, S. L., et al. (2015). StringTie enables improved reconstruction of a transcriptome from RNA-seq reads. Nat. Biotechnol. 33, 290–295. doi: 10.1038/nbt.3122
Pogány, M., Von Rad, U., Grün, S., Dongó, A., Pintye, A., Simoneau, P., et al. (2009). Dual roles of reactive oxygen species and NADPH oxidase RBOHD in an Arabidopsis-alternaria pathosystem. Plant Physiol. 151, 1459–1475. doi: 10.1104/pp.109.141994
Rady, M. M., Elrys, A. S., Abo El-Maati, M. F., and Desoky, E. M. (2019). Interplaying roles of silicon and proline effectively improve salt and cadmium stress tolerance in Phaseolus vulgaris plant. Plant Physiol. Biochem. 139, 558–568. doi: 10.1016/j.plaphy.2019.04.025
Ran, X., Wang, X., Gao, X., Liang, H., Liu, B., and Huang, X. (2021). Effects of salt stress on the photosynthetic physiology and mineral ion absorption and distribution in white willow (Salix alba L.). PLoS One 16:e0260086. doi: 10.1371/journal.pone.0260086
Saini, S., Kaur, N., Marothia, D., Singh, B., Singh, V., Gantet, P., et al. (2021). Morphological analysis, protein profiling and expression analysis of auxin homeostasis genes of roots of two contrasting cultivars of rice provide inputs on mechanisms involved in rice adaptation towards salinity stress. Plants (Basel) 10:1544. doi: 10.3390/PLANTS10081544
Seki, M., Ayako, K., Kazuko, Y. S., and Kazuo, S. (2003). Molecular responses to drought, salinity and frost: common and different paths for plant protection. Curr. Opin. Biotechnol. 14, 194–199. doi: 10.1016/S0958-1669(03)00030-2
Smethurst, C. F., Warwick, M. G., and Sergey, S. (2009). Using excised leaves to screen lucerne for salt tolerance: physiological and cytological evidence. Plant Signal. Behav. 4, 39–41. doi: 10.4161/psb.4.1.7269
Soma, F., Mogami, J., Yoshida, T., Abekura, M., Takahashi, F., Kidokoro, S., et al. (2017). ABA-unresponsive SnRK2 protein kinases regulate mRNA decay under osmotic stress in plants. Nat. Plants 3:16204. doi: 10.1038/nplants.2016.204
Tian, F., Yang, D. C., Meng, Y. Q., Jin, J., and Gao, G. (2020). PlantRegMap: charting functional regulatory maps in plants. Nucleic Acids Res. 48, D1104–D1113. doi: 10.1093/nar/gkz1020
Tsabarducas, V., Chatzistathis, T., Therios, I., Koukourikou-Petridou, M., and Tananaki, C. (2015). Differential tolerance of 3 self-rooted Citrus limon cultivars to NaCl stress. Plant Physiol. Biochem. 97, 196–206. doi: 10.1016/j.plaphy.2015.10.007
Turchetto-Zolet, A. C., Margis-Pinheiro, M., and Margis, R. (2009). The evolution of pyrroline-5-carboxylate synthase in plants: a key enzyme in proline synthesis. Mol. Genet. Genomics 281, 87–97. doi: 10.1007/s00438-008-0396-4
Umezawa, T., Sugiyama, N., Mizoguchi, M., Hayashi, S., Myouga, F., Yamaguchi-Shinozaki, K., et al. (2009). Type 2C protein phosphatases directly regulate abscisic acid-activated protein kinases in Arabidopsis. Proc. Natl. Acad. Sci. U.S.A. 106, 17588–17593. doi: 10.1073/pnas.0907095106
Van Zelm, E., Zhang, Y. X., and Testerink, C. (2020). Salt tolerance mechanisms of plants. Annu. Rev. Plant Biol. 71, 403–433. doi: 10.1146/annurev-arplant-050718-100005
Wang, Z., Wang, M., Liu, L., and Meng, F. (2013). Physiological and proteomic responses of diploid and tetraploid black locust (Robinia pseudoacacia L.) subjected to salt stress. Int. J. Mol. Sci. 14, 20299–20325. doi: 10.3390/ijms141020299
Wani, S. H., Kumar, V., Khare, T., Guddimalli, R., Parveda, M., Solymosi, K., et al. (2020). Engineering salinity tolerance in plants: progress and prospects. Planta 251:76. doi: 10.1007/s00425-020-03366-6
Wei, T., Wang, Y., Xie, Z., Guo, D., Chen, C., Fan, Q., et al. (2019). Enhanced ROS scavenging and sugar accumulation contribute to drought tolerance of naturally occurring autotetraploids in Poncirus trifoliata. Plant. Biotechnol. J. 17, 1394–1407. doi: 10.1111/pbi.13064
Xia, X. J., Zhou, Y. H., Shi, K., Zhou, J., Foyer, C. H., Yu, J. Q., et al. (2015). Interplay between reactive oxygen species and hormones in the control of plant development and stress tolerance. J. Exp. Bot. 66, 2839–2856. doi: 10.1093/jxb/erv089
Yan, L., Liu, C., Wang, Y., Wang, K., Ren, F., Yao, J., et al. (2019). De novo transcriptome analysis of Fraxinus velutina Torr in response to NaCl stress. Tree Genet. Genomes 15:56. doi: 10.1007/s11295-019-1340-y
Yang, Y., and Guo, Y. (2018a). Elucidating the molecular mechanisms mediating plant salt-stress responses. New Phytol. 217, 523–539. doi: 10.1111/nph.14920
Yang, Y., and Guo, Y. (2018b). Unraveling salt stress signaling in plants. J. Integr. Plant Biol. 60, 796–804. doi: 10.1111/jipb.12689
Yildiz, O., Altundag, E., Cetin, B., Guner, S. T., Sarginci, M., Toprak, B., et al. (2018). Experimental arid land afforestation in central anatolia, turkey. Environ. Monit. Assess. 190:355. doi: 10.1007/s10661-018-6724-1
Yu, G., Wang, L. G., Han, Y., and He, Q. Y. (2012). ClusterProfiler: an R package for comparing biological themes among gene clusters. Omics 16, 284–287. doi: 10.1089/omi.2011.0118
Yu, Z., Duan, X., Luo, L., Dai, S., Ding, Z., Xia, G., et al. (2020). How plant hormones mediate salt stress sesponses. Trends Plant Sci. 25, 1117–1130. doi: 10.1016/j.tplants.2020.06.008
Zhang, K., Cui, H., Li, M., Xu, Y., Cao, S., Long, R., et al. (2020). Comparative time-course transcriptome analysis in contrasting Carex rigescens genotypes in response to high environmental salinity. Ecotoxicol. Environ. Saf. 194:110435. doi: 10.1016/j.ecoenv.2020.110435
Zhang, Q., Wang, M., Hu, J., Wang, W., Fu, X., and Liu, J. H. (2015). PtrABF of Poncirus trifoliata functions in dehydration tolerance by reducing stomatal density and maintaining reactive oxygen species homeostasis. J. Exp. Bot. 66, 5911–5927. doi: 10.1093/jxb/erv301
Zheng, J., Ma, X., Zhang, X., Hu, Q., and Qian, R. (2018). Salicylic acid promotes plant growth and salt-related gene expression in Dianthus superbus L. (Caryophyllaceae) grown under different salt stress conditions. Physiol. Mol. Biol. Plants 24, 231–238. doi: 10.1007/s12298-017-0496-x
Zhu, H., He, M., Jahan, M. S., Wu, J., Gu, Q., Shu, S., et al. (2021). CsCDPK6, a CsSAMS1-Interacting protein, affects polyamine/ethylene biosynthesis in cucumber and enhances salt tolerance by overexpression in tobacco. Int. J. Mol. Sci. 22:11133. doi: 10.3390/IJMS222011133
Zhu, J. K. (2002). Salt and drought stress signal transduction in plants. Annu. Rev. Plant Biol. 53, 247–273. doi: 10.1146/annurev.arplant.53.091401.143329
Zhu, J. K. (2016). Abiotic stress signaling and responses in plants. Cell 167, 313–324. doi: 10.1016/j.cell.2016.08.029
Zhu, X., Zhang, N., Liu, X., Wang, S., Li, S., Yang, J., et al. (2020). StMAPK3 controls oxidase activity, photosynthesis and stomatal aperture under salinity and osmosis stress in potato. Plant Physiol. Biochem. 156, 167–177. doi: 10.1016/j.plaphy.2020.09.012
Keywords: Fraxinus velutina Torr, salt stress, comparative transcriptome, stress-responsive gene, defense response
Citation: Ma X, Liu JN, Yan L, Liang Q, Fang H, Wang C, Dong Y, Chai Z, Zhou R, Bao Y, Hou W, Yang KQ and Wu D (2022) Comparative Transcriptome Analysis Unravels Defense Pathways of Fraxinus velutina Torr Against Salt Stress. Front. Plant Sci. 13:842726. doi: 10.3389/fpls.2022.842726
Received: 24 December 2021; Accepted: 17 January 2022;
Published: 04 March 2022.
Edited by:
Mukesh Jain, Jawaharlal Nehru University, IndiaReviewed by:
Parviz Heidari, Shahrood University of Technology, IranTushar Suhas Khare, Savitribai Phule Pune University, India
Copyright © 2022 Ma, Liu, Yan, Liang, Fang, Wang, Dong, Chai, Zhou, Bao, Hou, Yang and Wu. This is an open-access article distributed under the terms of the Creative Commons Attribution License (CC BY). The use, distribution or reproduction in other forums is permitted, provided the original author(s) and the copyright owner(s) are credited and that the original publication in this journal is cited, in accordance with accepted academic practice. No use, distribution or reproduction is permitted which does not comply with these terms.
*Correspondence: Ke Qiang Yang, eWFuZ3dlcmVAMTI2LmNvbQ==; Dejun Wu, c2Rsa3k0MTJ4QDE2My5jb20=
†These authors have contributed equally to this work