Abstract
Analyzing the contribution of nitrogen (N) uptake and its utilization in grain yield and protein quality-related traits in rice-wheat (RW) and soybean-wheat (SW) cropping systems is essential for simultaneous improvements in the two target traits. A field experiment with nine wheat genotypes was conducted in 2018–19 and 2019–20 cropping years to investigate N uptake and utilization-related traits associated with high wheat yield and good protein quality. Results showed that N uptake efficiency (NUpE) in the RW cropping system and N utilization efficiency (NUtE) in the SW cropping system explained 77.6 and 65.2% of yield variation, respectively, due to the contribution of fertile spikes and grain number per spike to grain yield varied depending on soil water and N availability in the two rotation systems. Lower grain protein content in the RW cropping system in comparison to the SW cropping system was mainly related to lower individual N accumulation at maturity, resulting from higher fertile spikes, rather than N harvest index (NHI). However, NHI in the SW cropping system accounted for greater variation in grain protein content. Both gluten index and post-anthesis N uptake were mainly affected by genotype, and low gluten index caused by high post-anthesis N uptake may be related to the simultaneous increase in kernel weight. N remobilization process associated with gluten quality was driven by increased sink N demand resulting from high grain number per unit area in the RW cropping system; confinement of low sink N demand and source capability resulted in low grain number per spike and water deficit limiting photosynthesis of flag leaf in the SW cropping system. CY-25 obtained high yield and wet gluten content at the expense of gluten index in the two wheat cropping systems, due to low plant height and high post-anthesis N uptake and kernel weight. From these results, we concluded that plant height, kernel weight, and post-anthesis N uptake were the critically agronomic and NUE-related traits for simultaneous selection of grain yield and protein quality. Our research results provided useful guidelines for improving both grain yield and protein quality by identifying desirable N-efficient genotypes in the two rotation systems.
Introduction
Rice-wheat (RW) and soybean-wheat (SW) cropping systems are two dominant crop rotation systems in the world (Hu et al., 2019; Lian et al., 2020). The previous crop affects subsequent wheat growth and development (Singh et al., 2008), resulting in different wheat yield and grain protein quality, which can be explained by the effects of water, nitrogen (N), and their effect on N uptake and N utilization (Vashisht et al., 2021). Wheat cultivated from the RW cropping system is often used for wine-making (Peng Q. et al., 2022) and biscuit processing due to its low grain protein content, while wheat cultivated from the SW cropping system is processed into bread, steamed bread, and noodles due to its relatively high grain protein content (Ma et al., 2019). However, simultaneous selection of grain yield and grain protein quality is challenging due to the negative correlation between grain yield and grain N content (Rapp et al., 2018) and the complex effects of genotype, environment, and their effect on grain yield and protein quality-related traits (Saleem et al., 2015). Thus, identifying high-yielding wheat with diverse processing requirements through genetic selection for critical N use efficiency (NUE)- related traits may help break the negative relationship between grain yield and grain N content.
Nitrogen is an essential component of chlorophyll, photosynthetic enzymes, and storage proteins (Luo et al., 2021), and it is also linked to grain yield and protein quality. Although genetic improvement of NUE is known to increase the grain yield (Yang et al., 2021), the relative contribution of N uptake efficiency (NUpE) and N utilization efficiency (NUtE) to yield, and the effects of NUE-related traits on the improvements of yield, gluten content, and gluten index in the two rotation systems remain unclear. Moreover, critical NUE-related traits associated with simultaneous selection for high yield and target grain protein quality in the two rotation systems warrant further exploration.
Nitrogen uptake efficiency represents the capability of the root system to take up N from soil (Bryant Schlobohm et al., 2020), and a higher NUpE entails more fertile tillers and (or) higher individual N accumulation on maturity. Improving N acquisition by identifying N uptake-efficient genotypes (Chandna et al., 2012) is economical in both high- and low-input cropping systems. This is because of the fact that high N fertilizer input reduces N recovery efficiency, thereby increasing the risk of environmental pollution (Zhang et al., 2021). However, the effect of soil water and N supply on the genetic selection of N efficient traits should be considered due to the interaction between genotype and environment (Lemaire and Ciampitti, 2020). The soil water, N reserves, and enzyme activities in the RW cropping system were significantly higher than that in the SW system (Sharma et al., 2021); while in the SW cropping system, soil water restricts the root N uptake, thus presenting lower NUpE and grain yield in comparison to the RW cropping system (Gao et al., 2009). Although improving the NUpE is beneficial to increase grain yield, the relative contribution of fertile tillers and individual N accumulation at maturity to NUpE and the effects of NUpE-related traits on grain yield and protein quality-related traits remains unknown.
Nitrogen utilization efficiency represents the capability of crops to convert the absorbed N into grain yield (De Oliveira Silva et al., 2020), and high NUtE requires plants to maximize post-anthesis N uptake, N remobilization efficiency, and N harvest index (NHI) (Kichey et al., 2007). In the RW cropping system, increased post-anthesis N uptake resulting from improved soil water and N environments (Li et al., 2019) improves the NHI and yield by increasing post-anthesis photosynthesis but decreasing the N remobilization efficiency (Wu et al., 2018), while in the SW cropping system, soil water deficit suppresses stomatal conductance in leaves, decreases photosynthesis, accelerates leaf senescence, resulting in decreased plant biomass and grain yield (Olszewski et al., 2008). However, the complex and controversial effects of post- anthesis N uptake and N remobilization on grain protein quality have also been reported (Barraclough et al., 2014; Ding et al., 2016). In this context, the relative importance of NUtE-related traits in the simultaneous selection for high yield and target protein quality in the two wheat cropping systems warrants further research.
There is a universal and negative correlation between grain yield and grain protein content (Lollato et al., 2019; Crosta et al., 2021); hence, this increase in grain protein content was considered at the expense of grain yield (Pompa et al., 2011). However, this negative correlation was affected by soil water and N environment (Dupont et al., 2006; Triboi et al., 2006). Previous studies on grain protein deviation have identified genotypes with both high grain yield and protein content, attributed to improvements of post-anthesis N uptake or N remobilization efficiency (Bogard et al., 2010; Latshaw et al., 2016; Thorwarth et al., 2018). However, the positive and negative effects of post-anthesis N uptake and N remobilization efficiency on grain yield and protein quality have also been reported (Oosterom et al., 2010; Barraclough et al., 2014; Kong et al., 2015). Hence, the complexity of yield and grain protein quality implies that a single NUE-related trait cannot explain simultaneous improvements in grain yield and protein quality, due to the effects of genotype and environment as well as their interaction on these traits. The associations between NUE and yield, and grain protein content have been explored previously (Kayan et al., 2020; Ma et al., 2021). Our previous results showed that genetic gains in grain yield and NUE in a historical set of cultivars were associated with improvements in light interception, solar energy conversion, and biomass partitioning efficiency (Yang et al., 2021). However, comparative studies on the contribution of N uptake, partitioning, remobilization, and utilization in simultaneous selection for grain yield and target protein quality-related traits of different wheat genotypes in the two rotation systems are lacking. Therefore, the objectives of the current study were to (i) investigate the relative contributions of NUpE and NUtE to genetic variation in grain yield and the effects of NUE-related traits on grain protein quality-related traits in the two rotation systems; (ii) and to identify crucially agronomic and NUE-related traits contributing to simultaneous selection for wheat yield and target protein quality in the two rotation systems.
Materials and methods
Site and experiment description
Field trials were conducted during 2018–19 and 2019–20 cropping years at Renshou (29°51′N, 104°12′E) and Dayi (30°49′N, 103°58′E) experimental stations in southwestern China. SW and RW cropping systems were the dominant rotation systems in Renshou and Dayi experiment stations, respectively. According to the FAO classification (Faostat, 2016), soil in both SW and RW cropping systems were purple soil and clay loam, respectively. The respective average physicochemical properties soil (0–20 cm depth) before wheat sowing (Hawkesford, 2017) in SW and RW cropping systems were as follows: pH = 6.84 and 7.46; soil water storage = 320 mm and 470 mm; total N = 1.25 and 2.04 g kg−1; available N = 100.50 and 153.67 mg kg−1; available P = 4.73 and 23.51 mg kg−1; available K = 162.99 and 221.30 mg kg−1; and organic matter = 15.69 and 58.80 g kg−1. Monthly precipitation, cumulative precipitation, and average air temperature in two wheat cropping systems during 2018–19 and 2019–20 cropping years are shown in Figure 1. Cumulative precipitation of the SW cropping system were 149.9 mm and 69.3 mm in 2018–19 and 2019–20 cropping years, respectively, and the cumulative precipitation of the RW cropping system in 2018–19 and 2019–20 cropping years were 205.3 mm and 101.9 mm, respectively. Therefore, 2019–20 cropping year was considered a typical drought year.
Figure 1
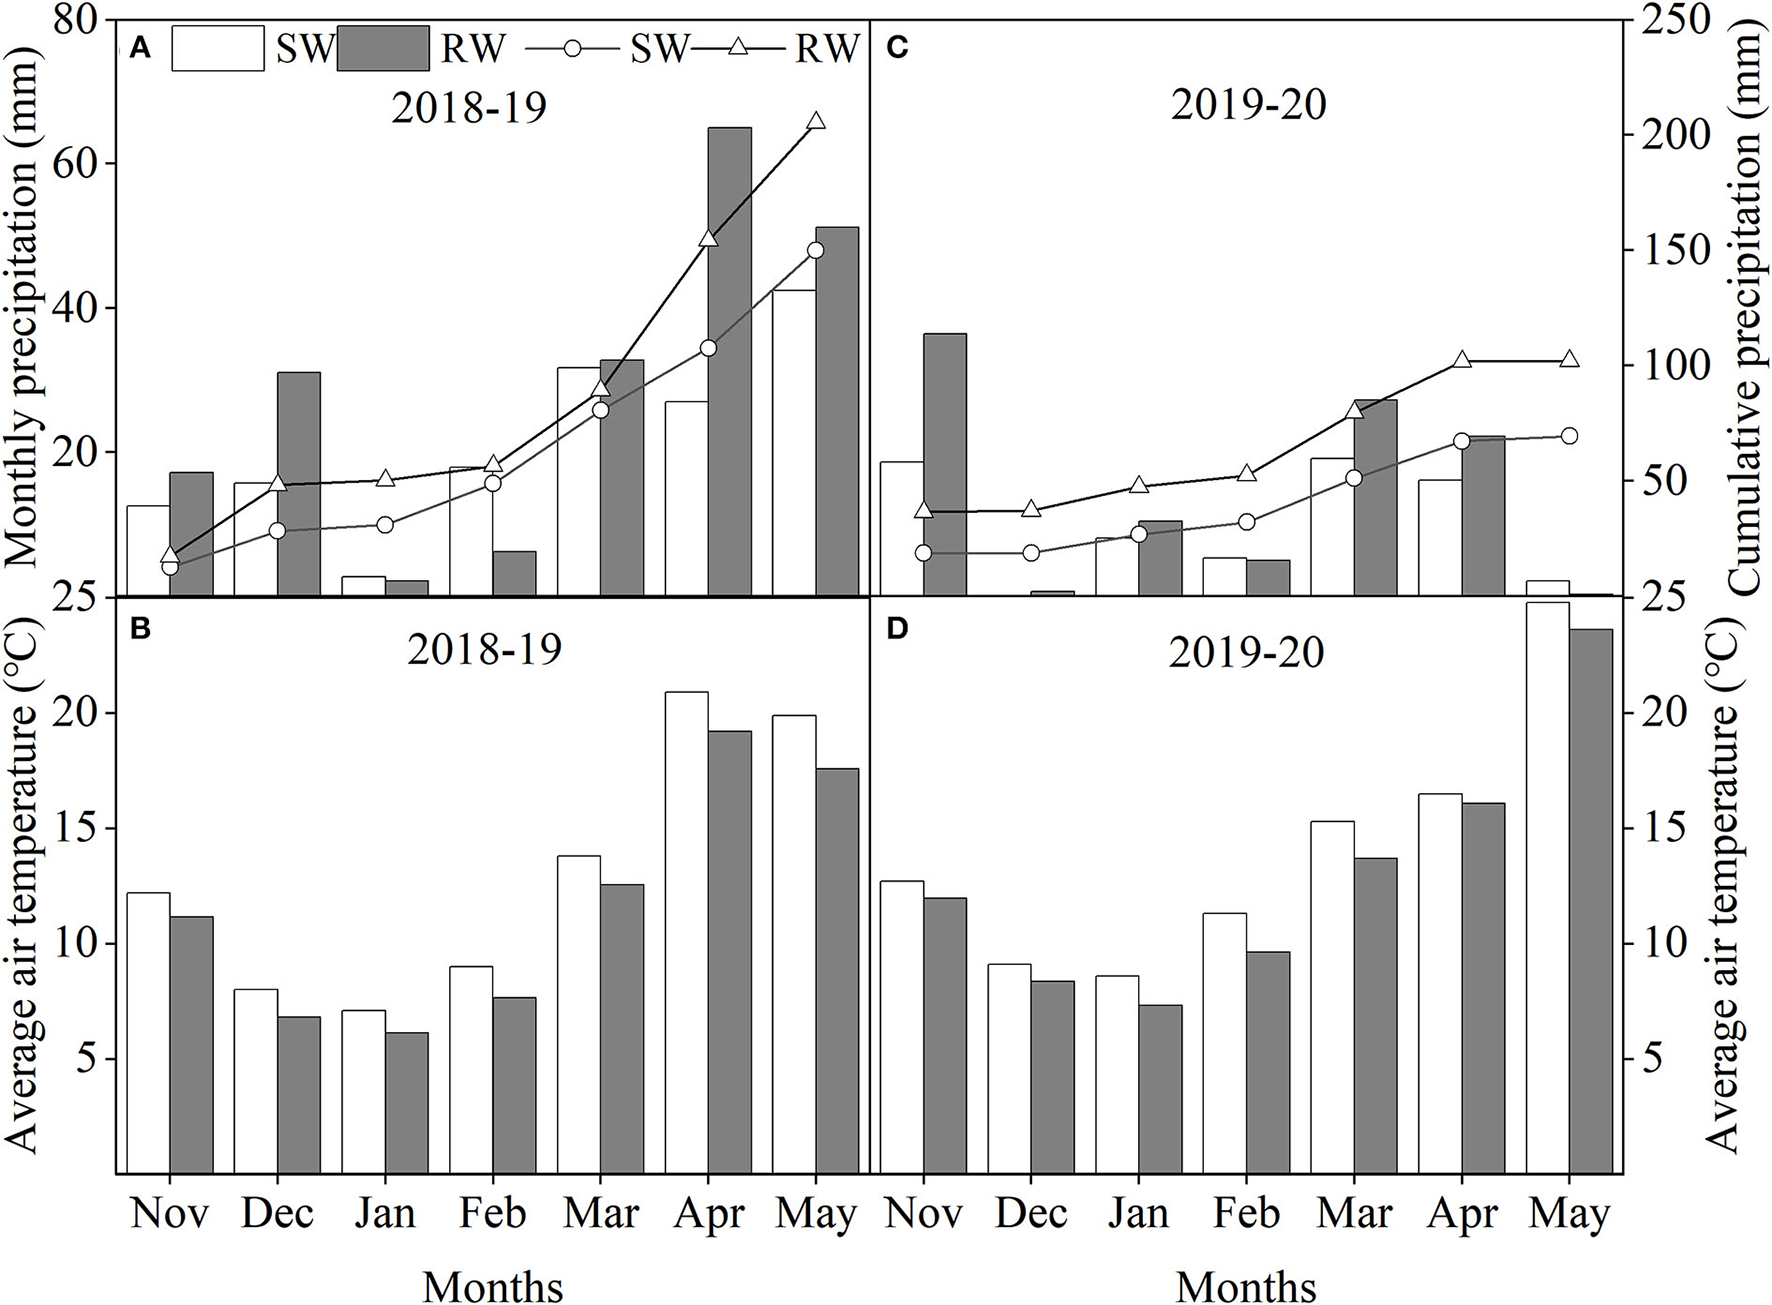
Monthly precipitation, cumulative precipitation during 2018–19 (A) and 2019–20 (C) cropping years and average air temperature during 2018–19 (B) and 2019–20 (D) cropping years in two wheat cropping systems. All data were collected from sowing to physiological maturity in each cropping year. SW, soybean-wheat cropping system; RW, rice-wheat cropping system.
A randomized complete block design with three replicates was conducted in both experimental stations. Each plot was 4 m long and 3 m wide. Based on our previous two-year field experiment, nine typical wheat genotypes, including landraces, advanced landraces and modern genotypes were selected from 32 wheat (Triticum aestivum L.) genotypes released in Southwest China between 1965 and 2017. All selected genotypes are registered and grown widely (>100,000 ha per year) in Southwest China. The selected genotypes presented noticeable genetic variations in grain yield, protein quality, and food use properties (Table 1). Dwarf genes and harvest index of nine wheat genotypes are also shown in Table 1. Wheat was sown at the end of October. Row spacing was maintained at 0.2 m to yield an initial seedling population of 180 seedlings m−2. Before sowing, 150 kg ha−1 N (at a 6:4 sowing: jointing ratio), 75 kg ha−1 P, and 75 kg ha−1 K were applied as urea, P2O5, and K2O, respectively. Commercial herbicides, pesticides, and fungicides were applied monthly after tillering to avoid yield loss. Other management practices followed the local practices.
Table 1
| Genotype |
Breeding
groups |
Grain
protein content (%) |
Wet gluten
content (%) |
Gluten index
(%) |
Grain yield
(t ha−1) |
Food
useproperty |
Dwarfing
genes |
Harvest
index |
|
|---|---|---|---|---|---|---|---|---|---|
| G1 | SM-482 | L | 14.3 | 31.7 | 88 | 3.2 | Noodle | Rht 8 | 0.46 |
| G2 | CM-39 | AD | 15.0 | 36.0 | 97 | 3.2 | Noodle | Rht 8 | 0.39 |
| G3 | CM-66 | AD | 14.1 | 30.0 | 67 | 3.4 | Biscuit | Rht 8 | 0.43 |
| G4 | NM-101 | L | 15.5 | 40.4 | 54 | 2.9 | Noodle | Rht D1b | 0.34 |
| G5 | MY-26 | AD | 13.9 | 37.3 | 73 | 3.3 | Bread | Rht 8 | 0.46 |
| G6 | CM-81 | L | 13.5 | 30.3 | 84 | 3.1 | Biscuit | Rht 8 | 0.47 |
| G7 | CY-25 | S × AD | 14.2 | 38.2 | 52 | 4.1 | Noodle | Rht 8 | 0.47 |
| G8 | MM-51 | AD | 11.6 | 27.4 | 87 | 3.9 | Biscuit | Rht D1b | 0.47 |
| G9 | CM-104 | S × AD | 13.6 | 30.2 | 89 | 3.9 | Noodle | Rht 8 | 0.49 |
Introduction about the basic information of nine wheat genotypes.
G, genotype; L, landrace; AD, advanced landrace; S × AD, synthetic hexaploid wheat × advanced landrace.
All data were the mean values of nine wheat genotypes in 2016–17 and 2017–18 cropping years.
Sampling methods and measurements
Yield, yield components, and yield-related traits
Numbers of initial seedling, maximum seedling, and fertile spikes were measured in the middle row (4 m2 areas) at the seedling (GS21), jointing (GS31), and maturity (GS92) stages (Fischer, 1985). The maximum seedling number and fertile spikes were calculated as the ratios of the maximum seedling number to the initial seedling number and the fertile spike number to the initial seedling number, respectively.
Grain yield was determined in a harvested area of 4 m2 for each plot. Fertile spikes were counted in a harvest area of 4 m2, and grain number per spike was counted for 30 spikes in each of the three trials. The grains from each plot was air-dried, weighed, and held for moisture determination using a DMC-700 digital moisture tester (Seedburo, Chicago, IL, USA). The 1,000-kernel weight was measured at a kernel moisture content of 13.5%. The grains from each plot were dried and ground into powder and passed through a 0.15-mm screen. The harvest index was calculated as the ratio of grain yield to above-ground dry matter yield at maturity.
NUE-related traits
Thirty wheat plants were collected consecutively from the middle row of each plot at anthesis (GS65) and physiological maturity to measure N content and NUE-related traits. The plant samples were separated into stems, green leaves, yellow leaves, spikes (glumes combined with rachilla, excluding grains), and grains. The segmented organ was oven-dried at 105°C for 30 min and then dried to a constant weight at 80°C for at least 72 h. The N content of the organs was determined using the Kjeldahl method (Kjeldahl, 1883). Soil N supply was the sum of potential N supply from soil and fertilizer. Potential N supply from the soil at sowing was estimated using the initial available N and bulk density. Total above-ground N accumulation was calculated as the product of above-ground dry matter and corresponding N content. NUE is defined as the average grain yield produced per kg of N supply and it can be subdivided into NUpE and NUtE. NUpE was calculated by dividing total above-ground N accumulation at harvest by soil N supply (Equation 1). NUtE is expressed as kilograms of grain yield per kilogram of total above-ground N accumulation (Equation 2). NHI was determined as the ratio of N accumulation in grains to total above-ground N accumulation at maturity (Equation 3). N partitioning was determined as the ratio of N accumulation at a specific organ (i.e., stems, green leaves, and spikes) to total above-ground N accumulation at anthesis. Post-anthesis N uptake was the difference between above-ground N accumulation at anthesis and maturity. N remobilization was calculated as the difference between above-ground N accumulation at anthesis and N accumulation in vegetative organs at maturity, including stems, leaves, and spikes. The remobilized dry matter (DM) and N were the DM and N lost from the vegetative organs, which was assumed to be remobilized to the developing organs.
Grain protein quality-related traits
Grain protein content was measured as grain N content × 5.7. The wet gluten content and gluten index were measured according to gluten index method (Sekularac et al., 2018) using a Perten Glutomatic 2200 Instrument and a Perten 2015 Centrifuge (Perten Instruments AB, Hägersten, Sweden).
Statistical analysis
Analysis of variance (ANOVA) was used to assess the effects of environment (E), genotype (G), year (Y), and their interactions (E × G, E × Y, G × Y, and E × G × Y). Statistical comparisons were considered significant at P < 0.05 or P < 0.01. Genotype plus genotype × environment (GGE) biplots were used to evaluate the productivity and sustainability of nine wheat genotypes in two wheat cropping systems. Principal component analysis (PCA) was used to evaluate relationships among NUE, yield, and protein quality-related traits. The contribution of key indicators to genetic variations in yield, NUpE, and NUtE were evaluated using dominance analysis. Associations among key indicators were evaluated using Pearson's correlation analysis.
Results
Genetic variations in grain yield, protein quality, and NUE-related traits
The wheat cropping systems affected most traits in nine wheat genotypes, except grain number per spike, 1,000-kernel weight, gluten index, and N remobilization efficiency. Post-anthesis N uptake was mainly affected by genotype. The 1,000-kernel weight, N remobilization efficiency, NHI, and NUtE in 2019–20 cropping year were markedly higher than those in 2018–19 cropping year. Meanwhile, significantly higher grain number per spike and gluten index in 2019–20 cropping year in comparison to 2018–19 cropping year were recorded only in the SW cropping system (Table 2). Higher grain yield, fertile spikes, NUpE, NUtE, and spike N% at anthesis were recorded in the RW cropping system, while higher grain protein content, wet gluten content, N accumulation at maturity, stem N% at anthesis, and leaf N% at anthesis were recorded in the SW cropping system (Figure 2).
Table 2
| Parameters | Mean values | F -value | |||||||||
|---|---|---|---|---|---|---|---|---|---|---|---|
| 2018–19 | 2019–20 | ||||||||||
| SW | RW | SW | RW | E | G | Y | E × G | E × Y | G × Y | E × G × Y | |
| Yield (t ha−1) | 4.4c | 6.6b | 4.7c | 7.6a | 6522** | 310** | 480** | 143** | 116** | 78** | 138** |
| Fertile spikes (number per plant) | 1.3c | 1.9a | 1.2c | 1.7b | 2547** | 98** | 258** | 32** | 31** | 24** | 29** |
| Grain number (number per spike) | 39b | 42ab | 43a | 46a | 140** | 183** | 293** | 17** | 2ns | 63** | 17** |
| 1,000-kernel weight (g) | 49c | 47d | 52b | 56a | 26** | 183** | 1153** | 23** | 341** | 6** | 11** |
| Grain weight (g per spike) | 1.9c | 2.0c | 2.2b | 2.5a | 187** | 180** | 1088** | 16** | 102** | 46** | 26** |
| Grain protein content (%) | 12.0a | 9.6c | 11.4b | 9.0d | 3325** | 470** | 6** | 25** | 0ns | 29** | 17** |
| Wet gluten content (%) | 24.2a | 15.0b | 24.5a | 15.3b | 4790** | 470** | 6** | 25** | 0** | 36** | 53** |
| Gluten index (%) | 78b | 89a | 90a | 91a | 216** | 310** | 322** | 53** | 184** | 116** | 58** |
| Wet gluten content/ grain protein content |
2.0a | 1.5b | 2.1a | 1.7b | 890** | 159** | 72** | 30** | 0ns | 20** | 26** |
| N accumulation at anthesis (10−2g per shoot) | 4.5a | 3.7b | 4.9a | 4.0b | 823** | 155** | 168** | 13** | 0ns | 40** | 30** |
| Post anthesis N uptake (10−2g per shoot) |
0.6a | 0.7a | 0.5a | 0.8a | 97** | 182** | 0ns | 22** | 8** | 6** | 45** |
| N accumulation at maturity (10−2g per shoot) |
5.1ab | 4.4c | 5.4a | 4.8bc | 361** | 119** | 121** | 6** | 1ns | 30** | 18** |
| Stem N at anthesis (%) | 39a | 36b | 39a | 37b | 109** | 66** | 3ns | 11** | 1ns | 13** | 5** |
| Leaf N at anthesis (%) | 40a | 36c | 38ab | 37bc | 246** | 94** | 8** | 8** | 55** | 27** | 18** |
| Spike N at anthesis (%) | 20b | 27a | 21b | 26a | 1246** | 38** | 2ns | 20** | 62** | 13** | 26** |
| N remobilization efficiency (%) | 75b | 71c | 79a | 80a | 129** | 41** | 2232** | 37** | 357** | 53** | 60** |
| NHI (%) | 78b | 76c | 81a | 83a | 0ns | 129** | 3396** | 82** | 534** | 108** | 24** |
| NUpE (kg kg−1) | 0.47b | 0.58a | 0.47b | 0.57a | 1153** | 118** | 1ns | 70** | 0ns | 65** | 81** |
| NUtE (kg kg−1) | 38d | 46b | 41c | 53a | 3384** | 201** | 1034** | 26** | 164** | 48** | 10** |
Combined ANOVA on variations in grain yield, protein quality, nitrogen efficiency, and related traits in two wheat cropping systems and two cropping years.
All data were the mean values of nine wheat genotypes in each cropping year (n = 9).
E, environment; G, genotype; Y, year; E × G, interaction between environment and genotype; E × Y, interaction between environment and year; G × Y, interaction between genotype and year; E × G × Y, interaction between environment, genotype, and year; SW, soybean-wheat cropping system; RW, rice-wheat cropping system; N, nitrogen; NUpE, N uptake efficiency; NUtE, N utilization efficiency; NHI, N harvest index.
nsrepresents non-significant at P > 0.05, while * and
represent significant at P < 0.05 and P < 0.01 from ANOVA, respectively.
Different lowercase letters indicate significant difference at P < 0.05.
Figure 2
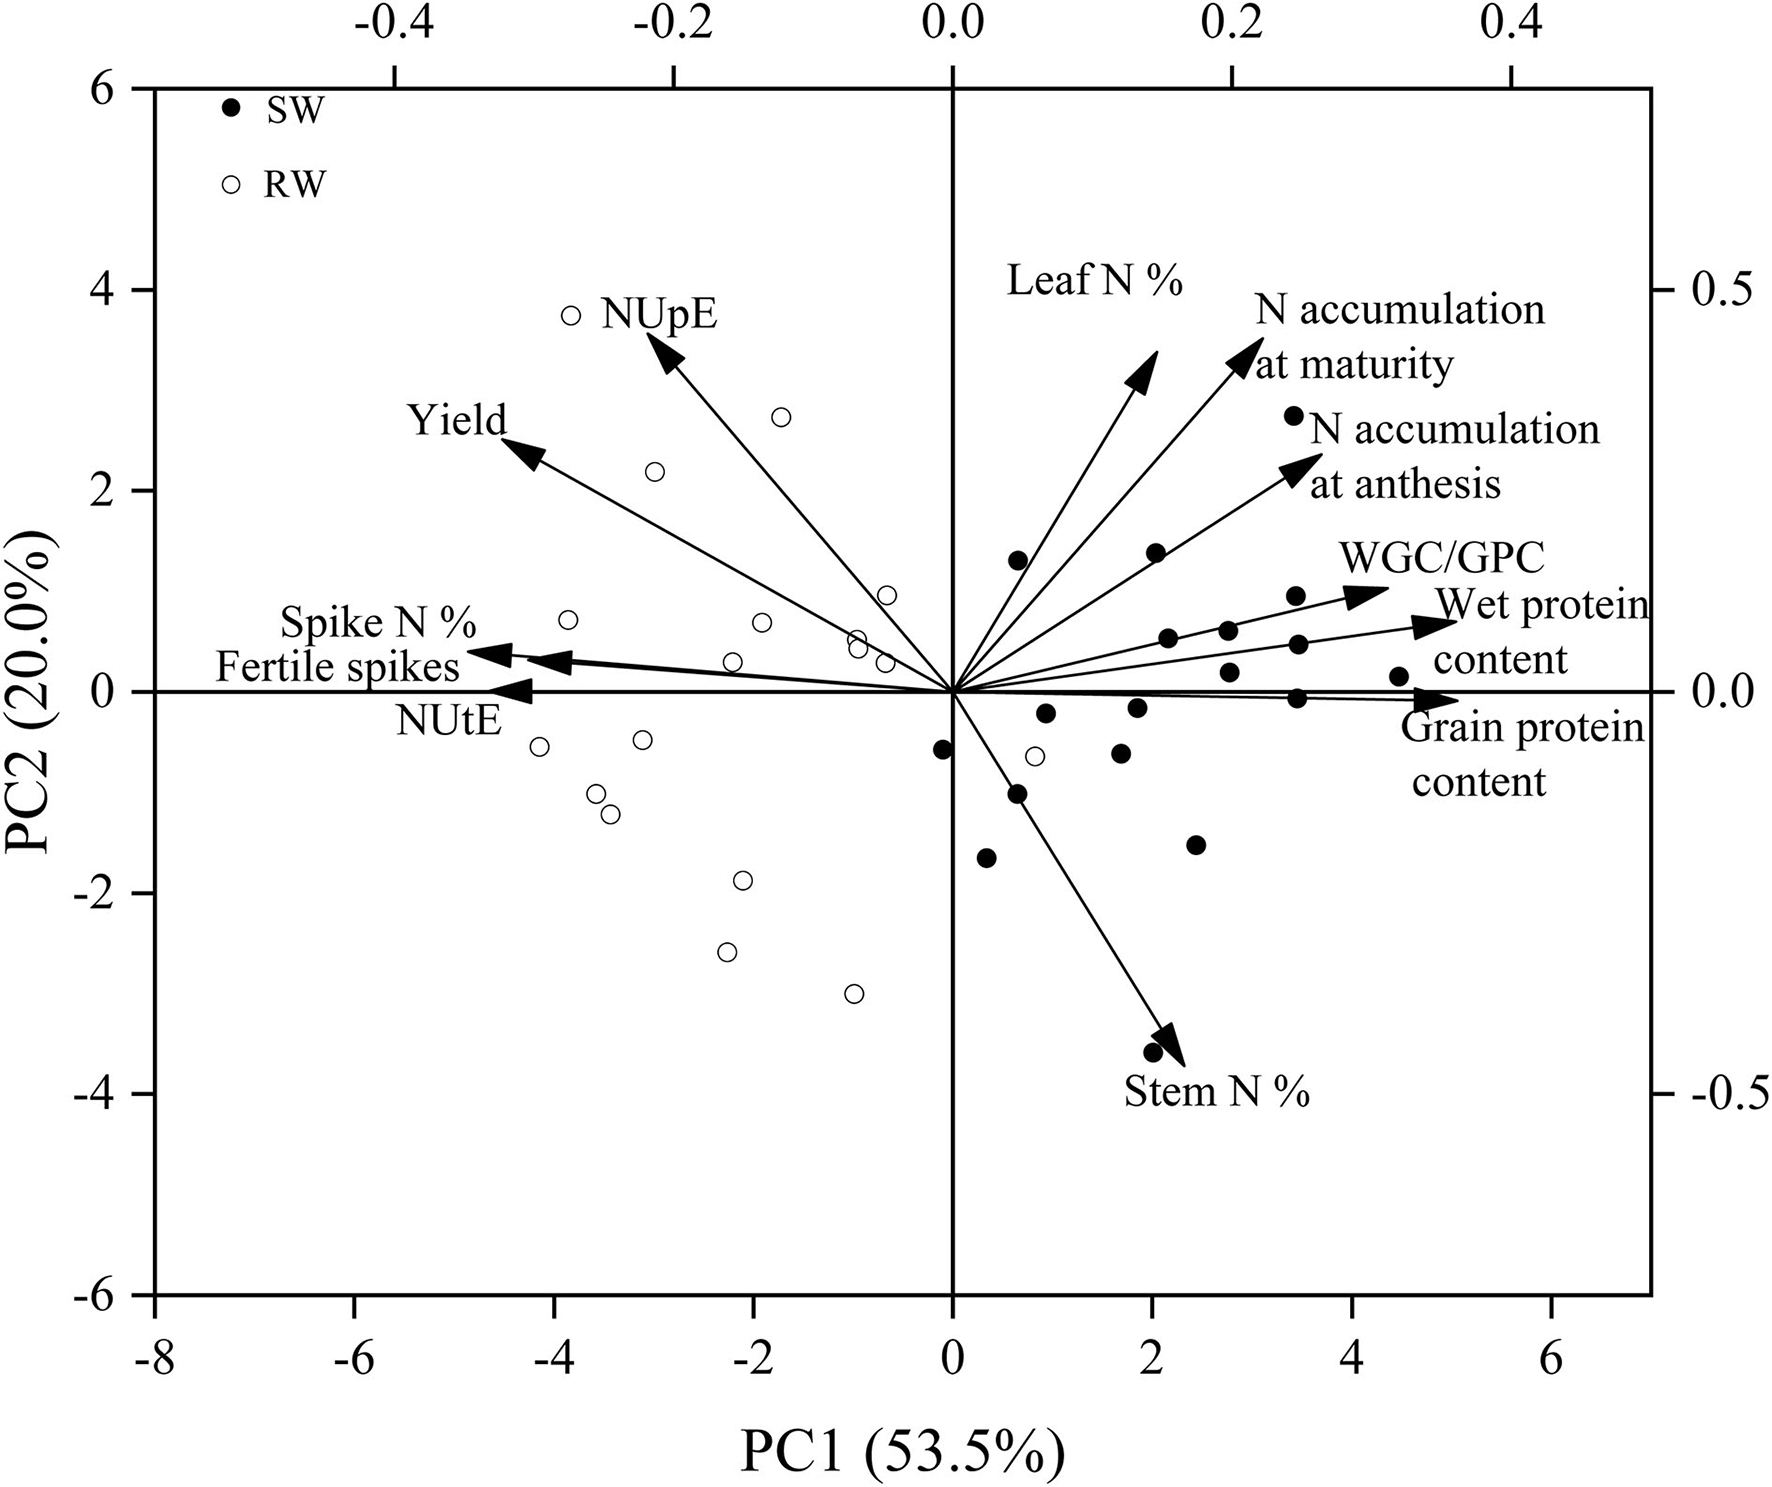
The principal component analysis (PCA) on yield, grain protein quality, and nitrogen efficiency and related traits in two wheat cropping systems and two cropping years. All values were measured with three replications (n = 3), and the two-year data were pooled. SW, soybean-wheat cropping system; RW, rice-wheat cropping system; WGC/GPC, Wet gluten content/grain protein content; N, nitrogen; NUpE, N uptake efficiency; NUtE, N utilization efficiency.
Grain yield and yield-related traits
Dominance analysis revealed that in 2018–19 cropping year, fertile spikes, grain number per spike, 1,000-kernel weight in SW and RW cropping systems contributed by 12.6, 48.0, and 37.0% and 25.6, 48.6, and 24.4% of grain yield variation, respectively. Meanwhile, in 2019–20 cropping year, fertile spikes, grain number per spike, 1,000-kernel weight in SW and RW cropping systems contributed by17.1, 70.2, and 9.4% and 43.7, 20.4, and 35.3% of grain yield variation, respectively. Averaged across the two cropping years, grain number per spike showed a more significant and greater contribution to grain yield variation than other yield components in the SW cropping system, while fertile spikes and 1,000-kernel weight showed more outstanding contribution to grain yield variation in RW cropping system.
When averaged across the two cropping systems and two cropping years, SM-482, CM-39, and NM-101 showed stably low grain yield, while CY-25 showed the highest grain yield, which was primarily attributed to its highest 1,000-kernel weight. MM-51 and MY-26 showed low-yield sustainability due to their low fertile spikes in the RW cropping system in 2019–20 cropping year and low grain number per spike in the SW cropping system in 2018–19 cropping year, respectively (Table 3 and Figure 3).
Table 3
| Genotype | Yield | Fertile spikes | Grain number | 1,000-kernel weight | ||||||||||||
|---|---|---|---|---|---|---|---|---|---|---|---|---|---|---|---|---|
| (t ha −1 ) | (number per plant) | (number per spike) | (g) | |||||||||||||
| 2018–19 | 2019–20 | 2018–19 | 2019–20 | 2018–19 | 2019–20 | 2018–19 | 2019–20 | |||||||||
| SW | RW | SW | RW | SW | RW | SW | RW | SW | RW | SW | RW | SW | RW | SW | RW | |
| SM-482 | 3.3e | 5.9d | 4.3d | 4.3g | 1.4a | 2.0b | 1.3ab | 1.3d | 28e | 37e | 38f | 35f | 47d | 45d | 49ef | 53de |
| CM-39 | 3.9d | 6.0d | 4.1d | 5.5f | 1.2b | 1.7d | 1.1cd | 1.4c | 38c | 43b | 38f | 40e | 46d | 46bc | 52cd | 55c |
| CM-66 | 4.6bc | 6.7b | 4.8c | 9.2b | 1.4a | 2.0b | 1.3ab | 1.9b | 39bc | 41bc | 43cd | 47c | 46d | 46bc | 48f | 57b |
| NM-101 | 3.8d | 5.6e | 5.5a | 6.4e | 1.2bc | 1.8c | 1.1d | 1.2d | 41b | 38de | 58a | 57a | 43e | 45cd | 48f | 50f |
| MY-26 | 4.6bc | 6.3c | 4.1d | 9.1bc | 1.2bc | 1.7d | 1.1d | 1.8b | 40b | 40cd | 39ef | 45d | 53b | 51a | 53bc | 61a |
| CM-81 | 4.5c | 7.4a | 5.1b | 8.9c | 1.4a | 2.1a | 1.4a | 2.0a | 33d | 40cd | 38f | 46cd | 53b | 47b | 54b | 55cd |
| CY-25 | 4.9a | 7.5a | 4.7c | 11.3a | 1.2bc | 1.9c | 1.1d | 2.0a | 41b | 43b | 41de | 51b | 56a | 51a | 59a | 62a |
| MM-51 | 4.8ab | 7.4a | 4.9bc | 6.4e | 1.1c | 1.7d | 1.1d | 1.4c | 49a | 54a | 50b | 49b | 48c | 46bc | 51de | 53e |
| CM-104 | 5.1a | 6.5bc | 5.1b | 7.5d | 1.4a | 1.8c | 1.2bc | 1.8b | 40b | 42bc | 44c | 41e | 52b | 47b | 53bc | 55cd |
| Mean | 4.7 | 6.6 | 4.7 | 7.6 | 1.3 | 1.9 | 1.1 | 1.6 | 39 | 42 | 43 | 49 | 49 | 47 | 52 | 56 |
| F-value | 42** | 59** | 33** | 423** | 17** | 32** | 13 ** | 163** | 74** | 46** | 60** | 125** | 166** | 22** | 34** | 67** |
The grain yield and yield components of nine wheat genotypes in two wheat cropping systems and two cropping years.
All values were measured with three replications (n = 3).
SW, soybean-wheat cropping system; RW, rice-wheat cropping system.
* and
represent significant at P < 0.05 and P < 0.01 from ANOVA, respectively.
Different lowercase letters indicate significant difference at P < 0.05.
Figure 3
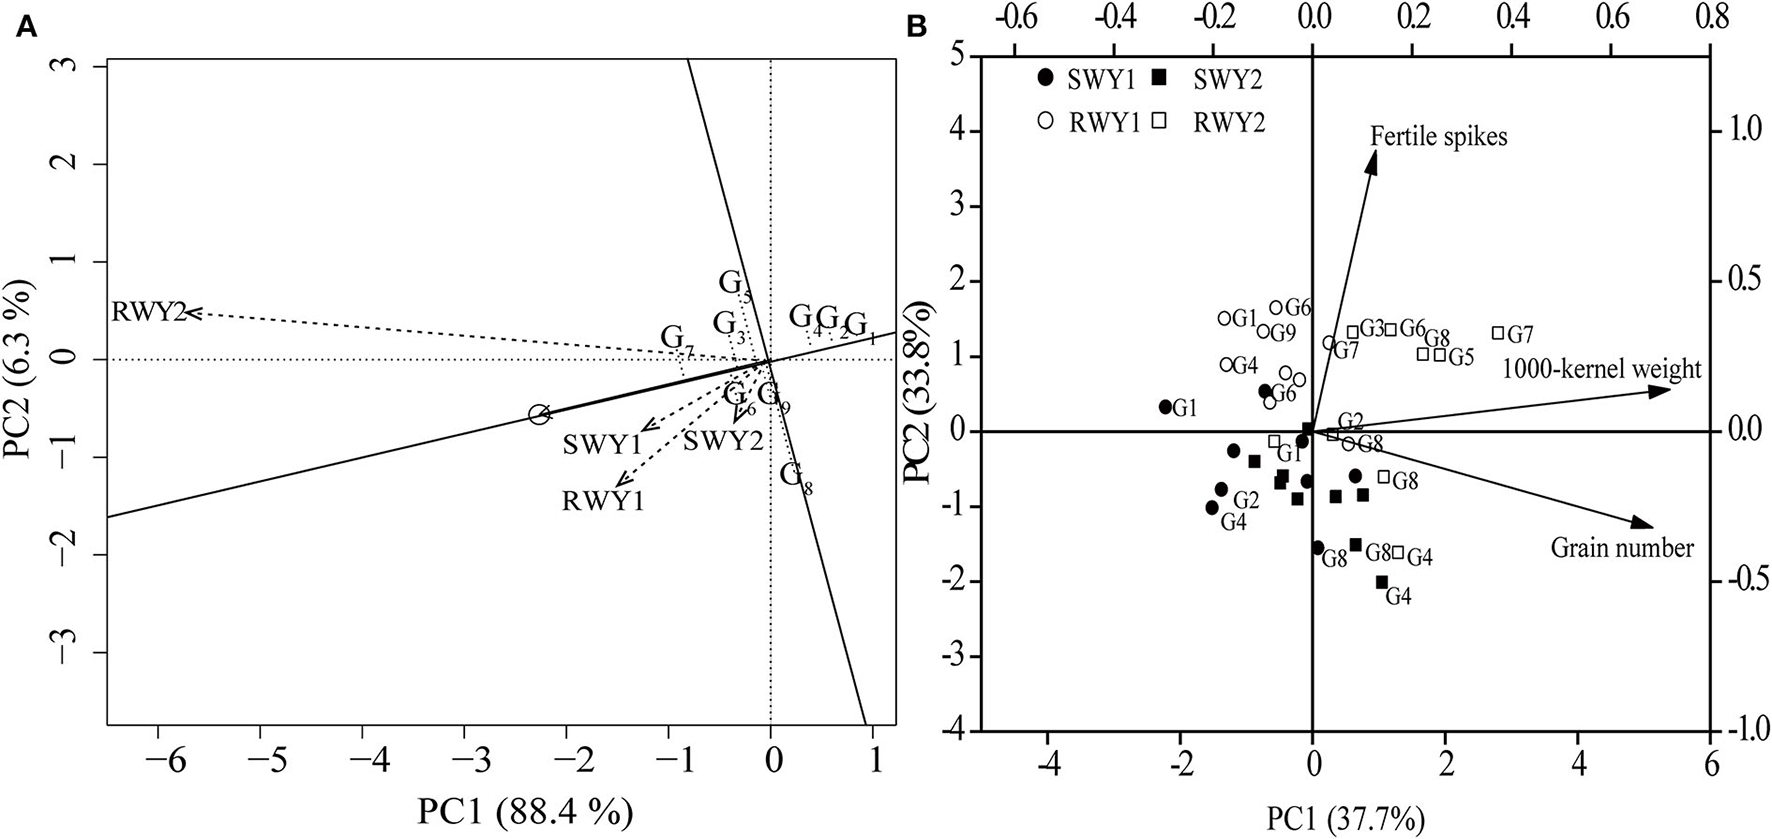
The genotype main effects and genotype × environment interaction analysis (A) on mean yield, yield stability, and principal component analysis (PCA) (B) on yield components of nine wheat genotypes in two wheat cropping systems and two cropping years. All values were measured with three replications (n = 3). The vectors represent the loading scores of variables for PC1 and PC2. SW, soybean-wheat cropping system; RW, rice-wheat cropping system; G, genotype; Y1, 2018–19 cropping year; Y2, 2019–20 cropping year.
Grain protein quality-related traits
Dominance analysis revealed that grain protein content, wet gluten content/grain protein content, gluten index in SW and RW wheat cropping systems contributed by 40.1, 52.2, and 7.2% and 27.6, 58.2, and 13.6% of variation in wet gluten content. Wet gluten content/grain protein content accounted for a more significant variation in wet gluten content. However, a significantly negative correlation between wet gluten content/grain protein content and gluten index (R2 = 0.39, P < 0.01) was observed in the RW cropping system. Regarding overall performance over the two cropping systems and two cropping years, CM-39, MY-26, and CY-25 showed a higher wet gluten content, whereas the gluten index of CM-39 alone exceeded 90% (Table 4).
Table 4
| Genotype | Grain protein content | Wet gluten content | Wet gluten content/ | Gluten index | ||||||||||||
|---|---|---|---|---|---|---|---|---|---|---|---|---|---|---|---|---|
| (%) | (%) | grain protein content | (%) | |||||||||||||
| 2018–19 | 2019–20 | 2018–19 | 2019–20 | 2018–19 | 2019–20 | 2018–19 | 2019–20 | |||||||||
| SW | RW | SW | RW | SW | RW | SW | RW | SW | RW | SW | RW | SW | RW | SW | RW | |
| SM-482 | 12.8b | 10.0bc | 12.3a | 9.2bc | 25.7d | 13.7e | 24.5c | 18.2b | 2.0cd | 1.4e | 2.0cde | 2.0b | 83c | 93bc | 93bc | 83c |
| CM-39 | 14.8a | 10.6a | 12.3a | 10.5a | 31.5a | 18.8c | 28.8b | 23.5a | 2.1bc | 1.8c | 2.3b | 2.3a | 95ab | 99a | 99a | 97a |
| CM-66 | 10.8d | 8.4f | 11.7b | 8.5de | 17.7f | 8.6g | 23.2c | 12.1e | 1.7e | 1.0g | 2.0def | 1.5e | 79d | 97ab | 92bc | 96a |
| NM-101 | 12.9b | 10.6a | 10.9c | 9.0c | 29.3b | 17.0d | 23.4c | 17.6bc | 2.3ab | 1.6d | 2.1c | 1.9b | 47g | 94bc | 94bc | 89b |
| MY-26 | 12.0c | 10.1b | 11.5b | 9.5b | 28.6b | 23.3a | 28.9b | 17.1c | 2.4a | 2.3a | 2.5a | 1.8c | 58e | 55e | 85e | 88b |
| CM-81 | 10.9d | 8.6ef | 10.6cd | 8.2f | 17.1f | 14.0e | 19.6e | 12.6e | 1.6e | 1.6d | 1.8f | 1.6de | 94b | 92c | 88d | 88b |
| CY-25 | 11.9c | 9.8c | 12.3a | 9.3bc | 27.0c | 20.2b | 30.8a | 15.2d | 2.3ab | 2.1b | 2.5a | 1.6d | 50f | 75d | 72f | 84c |
| MM-51 | 10.7d | 8.7e | 10.5d | 8.2ef | 20.1e | 6.9h | 21.4d | 10.3g | 1.9d | 0.8h | 2.0cd | 1.2f | 98a | 98a | 91cd | 95a |
| CM-104 | 10.8d | 9.5d | 10.5cd | 8.6d | 20.8e | 12.0f | 19.6e | 11.2f | 1.9d | 1.3f | 1.9ef | 1.3f | 96ab | 97ab | 95b | 95a |
| Mean | 12 | 9.6 | 11.4 | 9.0 | 24.2 | 14.9 | 24.5 | 15.3 | 2.0 | 1.5 | 2.1 | 1.7 | 78 | 89 | 90 | 91 |
| F-value | 91** | 58** | 31** | 62** | 192** | 167** | 72 ** | 251** | 30** | 135** | 26** | 71** | 517** | 101** | 50** | 21** |
The grain protein quality-related traits of nine wheat genotypes in two wheat cropping systems and two cropping years.
All values were measured with three replications (n = 3).
SW, soybean-wheat cropping system; RW, rice-wheat cropping system.
* and
represent significant at P < 0.05 and P < 0.01 from ANOVA, respectively.
Different lowercase letters indicate significant difference at P < 0.05.
Critically NUE-related traits associated with simultaneous selection for high grain yield and good protein quality
Results from PCA revealed that MY-26 and CY-25 achieved high grain yield and wet gluten content in the two wheat cropping systems in 2018–19 cropping year, which was associated with high 1,000-kernel weight, post- anthesis N uptake, N accumulation at maturity, and low gluten index (Table 5 and Figure 4). It was noteworthy that CY-25 with low plant height showed high NHI (Table 6). In addition, the wet gluten content of NM-101 in 2019–20 cropping year was higher than that of MM-51 at an equivalently high level of grain number per spike, which was mainly related to its higher plant height, flag leaf area (data not shown), and N accumulation at anthesis.
Table 5
|
Cropping
years |
Genotype |
Plant
height (cm) |
Days from sowing
to flowering (d) |
N accumulation
at anthesis (10 −2 g per shoot) |
Post anthesis
N uptake (10 −2 g per shoot) |
N accumulation
at maturity (10 −2 g per shoot) |
NUpE
(kg kg −1 ) |
||||||
|---|---|---|---|---|---|---|---|---|---|---|---|---|---|
| SW | RW | SW | RW | SW | RW | SW | RW | SW | RW | SW | RW | ||
| 2018–19 | SM-482 | 80 | 90 | 143 | 145 | 3.2f | 3.1d | 0.6c | 0.7d | 3.8e | 3.8d | 0.39e | 0.54c |
| CM-39 | 90 | 94 | 147 | 148 | 5.7a | 4.1b | 0.2de | 0.7d | 5.9ab | 4.8ab | 0.53a | 0.58b | |
| CM-66 | 89 | 89 | 147 | 148 | 4.0d | 3.2d | 0.3de | 0.4e | 4.3d | 3.7d | 0.44cd | 0.51c | |
| NM-101 | 96 | 103 | 147 | 148 | 5.1b | 4.0b | 0.1e | 0.4e | 5.2c | 4.5c | 0.45cd | 0.58b | |
| MY-26 | 90 | 92 | 140 | 144 | 5.2b | 3.7c | 0.8b | 1.2b | 6.0a | 4.8a | 0.52a | 0.60ab | |
| CM-81 | 84 | 84 | 140 | 143 | 3.6e | 2.9d | 0.4d | 0.9c | 4.0e | 3.8d | 0.42d | 0.59b | |
| CY-25 | 86 | 90 | 143 | 145 | 4.4c | 3.2d | 1.5a | 1.4a | 5.9ab | 4.6bc | 0.50a | 0.62a | |
| MM-51 | 89 | 93 | 143 | 145 | 5.0b | 4.5a | 0.6bc | 0.3ef | 5.7b | 4.9a | 0.47bc | 0.58b | |
| CM-104 | 89 | 95 | 140 | 144 | 4.5c | 4.3ab | 0.6c | 0.2f | 5.0c | 4.6bc | 0.50ab | 0.60ab | |
| Mean | 88 | 92 | 143 | 146 | 4.5 | 3.7 | 0.6 | 0.7 | 5.1 | 4.4 | 0.47 | 0.58 | |
| F-value | \ | \ | \ | \ | 108** | 32** | 52** | 54** | 63** | 33 ** | 20** | 14** | |
| 2019–20 | SM-482 | 88 | 77 | 131 | 135 | 4.6e | 2.8g | 0.3de | 0.7c | 5.0ef | 3.6f | 0.46c | 0.33h |
| CM-39 | 86 | 80 | 135 | 142 | 5.3bc | 4.7b | 0.1f | 0.3e | 5.4cde | 5.0c | 0.45c | 0.49f | |
| CM-66 | 94 | 80 | 135 | 139 | 5.0cd | 4.5c | 0.4de | 0.4de | 5.5cd | 4.9c | 0.52a | 0.67c | |
| NM-101 | 101 | 90 | 135 | 139 | 6.1a | 5.1a | 0.5cd | 0.2e | 6.5a | 5.4b | 0.52a | 0.48f | |
| MY-26 | 87 | 84 | 128 | 135 | 4.5e | 4.1d | 0.8ab | 1.3b | 5.2de | 5.4b | 0.41d | 0.72b | |
| CM-81 | 84 | 75 | 128 | 132 | 3.6f | 3.9e | 0.9a | 0.5d | 4.5f | 4.4de | 0.46c | 0.61d | |
| CY-25 | 87 | 84 | 131 | 139 | 5.4b | 3.9e | 0.7ab | 2.2a | 6.1ab | 6.1a | 0.49b | 0.87a | |
| MM-51 | 92 | 91 | 135 | 142 | 5.1bc | 3.7f | 0.6bc | 0.7c | 5.7bc | 4.5d | 0.44c | 0.44g | |
| CM-104 | 91 | 88 | 128 | 138 | 4.7de | 3.7f | 0.3e | 0.5d | 5.0e | 4.2e | 0.44c | 0.55e | |
| Mean | 90 | 83 | 132 | 138 | 4.9 | 4.0 | 0.5 | 0.8 | 5.4 | 4.8 | 0.47 | 0.57 | |
| F-value | \ | \ | \ | \ | 41** | 120** | 18** | 172** | 18** | 119 ** | 22** | 209** | |
The N uptake-related traits of nine wheat genotypes in two wheat cropping systems and two cropping years.
All values were measured with three replications (n = 3).
SW, soybean-wheat cropping system; RW, rice-wheat cropping system; N, nitrogen; NUpE, N uptake efficiency.
* and
represent significant at P < 0.05 and P < 0.01 from ANOVA, respectively.
Different lowercase letters indicate significant difference at P < 0.05.
Figure 4
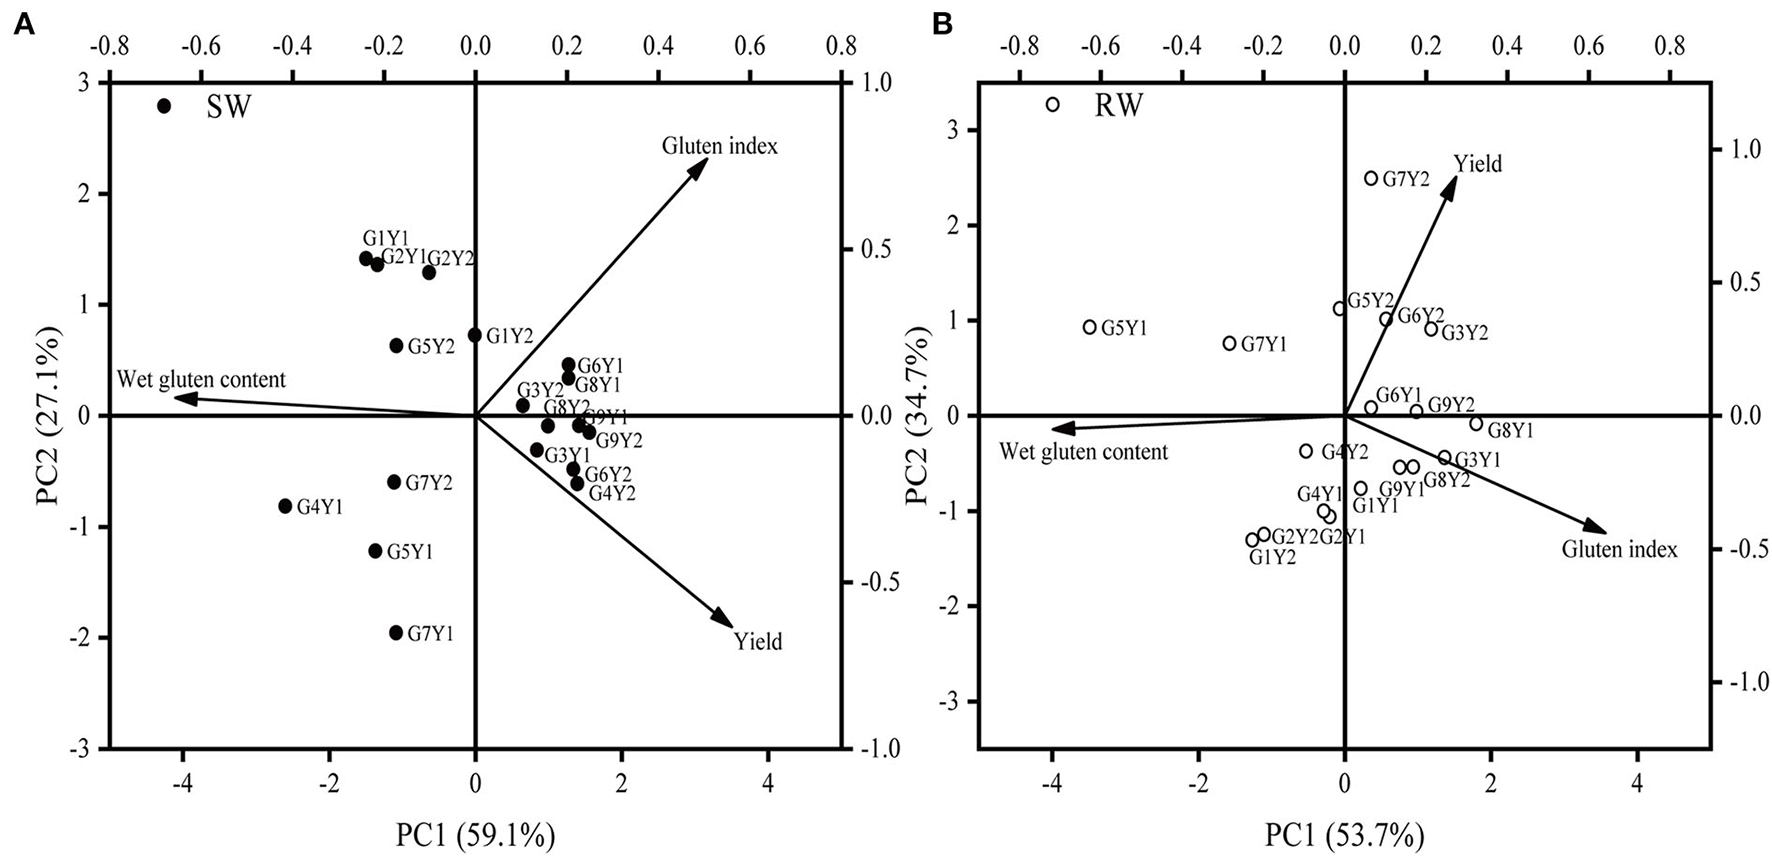
The PCA on yield and grain protein quality of nine wheat genotypes in two wheat cropping systems and two cropping years. All values were measured with three replications (n = 3). The vectors represent the loading scores of variables for PC1 and PC2. SW, soybean-wheat cropping system; RW, rice-wheat cropping system; G, genotype; Y1, 2018−19 cropping year; Y2, 2019–20 cropping year.
Table 6
| Genotype | N remobilization efficiency | NHI | NUtE | |||||||||
|---|---|---|---|---|---|---|---|---|---|---|---|---|
| (%) | (%) | (kg kg −1 ) | ||||||||||
| 2018–19 | 2019–20 | 2018–19 | 2019–20 | 2018–19 | 2019–20 | |||||||
| SW | RW | SW | RW | SW | RW | SW | RW | SW | RW | SW | RW | |
| SM-482 | 73f | 72c | 79de | 80bc | 78c | 77c | 80e | 84b | 34de | 44d | 37d | 52cde |
| CM-39 | 76cd | 72c | 78e | 80bc | 76d | 76c | 79f | 82d | 29f | 41f | 37d | 45f |
| CM-66 | 77b | 73c | 74f | 80bc | 79b | 77c | 77g | 82d | 42b | 52a | 37d | 55b |
| NM-101 | 76c | 69e | 81bc | 85a | 77d | 72e | 82d | 85a | 34e | 39g | 43b | 54bcd |
| MY-26 | 71g | 66f | 78e | 80c | 74e | 75d | 81e | 85ab | 35d | 42ef | 40c | 51e |
| CM-81 | 81a | 67f | 78de | 81bc | 82a | 75d | 83c | 83c | 43a | 50b | 45a | 58a |
| CY-25 | 76cd | 75b | 82b | 76d | 82a | 82a | 84b | 85ab | 39c | 48c | 39c | 52de |
| MM-51 | 75de | 77a | 80cd | 81b | 78c | 78b | 82cd | 85ab | 41b | 51ab | 45a | 59a |
| CM-104 | 75e | 70d | 84a | 80bc | 78c | 71e | 85a | 82cd | 41b | 43de | 46a | 54bc |
| Mean | 75 | 71 | 79 | 80 | 78 | 76 | 81 | 84 | 38 | 46 | 41 | 53 |
| F-value | 97** | 70** | 41** | 20** | 80** | 222** | 85** | 21** | 164** | 106** | 46** | 41** |
The N utilization-related traits of nine wheat genotypes in two wheat cropping systems and two cropping years.
All values were measured with three replications (n = 3).
SW, soybean-wheat cropping system; RW, rice-wheat cropping system; N, nitrogen; NHI, N harvest index; NUtE, N utilization efficiency.
* and
represent significant at P < 0.05 and P < 0.01 from ANOVA, respectively.
Different lowercase letters indicate significant difference at P < 0.05.
Associations among grain yield, protein quality, and NUE and related traits in the two wheat cropping systems
The grain yield in the RW cropping system was higher than that in the SW cropping system, due to higher fertile spikes (Table 3) and spike N partitioning at anthesis (Table 7), while lower grain protein content (Table 4) in the RW cropping system was mainly related to lower N accumulation at maturity (Table 5), rather than NHI (Table 6). The low gluten index of MY-26 and CY-25 (Table 4) in two wheat cropping systems were mainly associated with high 1,000-kernel weight and post-anthesis N uptake, while the low gluten index of NM-101 and MY-26 in the SW cropping system in 2018–19 cropping year (Table 4) were mainly related to low NHI caused by low grain number per spike and N remobilization efficiency.
Table 7
| Genotype | N partitioning at anthesis (%) | |||||||||||
|---|---|---|---|---|---|---|---|---|---|---|---|---|
| 2018–19 | 2019–20 | |||||||||||
| SW | RW | SW | RW | |||||||||
| Stem | Leaf | Spike | Stem | Leaf | Spike | Stem | Leaf | Spike | Stem | Leaf | Spike | |
| SM-482 | 46a | 33g | 20bc | 43a | 30e | 25cde | 45a | 35d | 19e | 39b | 33cd | 27b |
| CM-39 | 43b | 37f | 19cde | 36bc | 37c | 26cde | 41b | 38bc | 19e | 41ab | 33cd | 24c |
| CM-66 | 38d | 41cd | 19bcd | 36cd | 38abc | 24e | 38cd | 39b | 19e | 33cd | 42a | 23c |
| NM-101 | 37e | 42bc | 20b | 33d | 39ab | 25de | 38c | 37cd | 23b | 35c | 34cd | 30a |
| MY-26 | 32f | 49a | 18de | 33d | 38bc | 27c | 35e | 43a | 22c | 34cd | 44a | 21d |
| CM-81 | 40c | 40de | 19cde | 34cd | 32e | 32a | 36de | 38b | 24a | 34cd | 37b | 27b |
| CY-25 | 41c | 39e | 18e | 35cd | 34d | 29b | 39c | 39b | 21cd | 32d | 38b | 29a |
| MM-51 | 41c | 38ef | 20bc | 39b | 33d | 26cd | 42b | 35d | 21d | 42a | 35c | 22d |
| CM-104 | 31f | 44b | 24a | 34cd | 39a | 25cde | 38cd | 39b | 22c | 39b | 32d | 27b |
| Mean | 39 | 40 | 20 | 36 | 36 | 27 | 39 | 38 | 21 | 37 | 37 | 26 |
| F-value | 121** | 54** | 17** | 12** | 46** | 16** | 21** | 14** | 33** | 16** | 38** | 36** |
The N partitioning at anthesis of nine wheat genotypes in two wheat cropping systems and two cropping years.
All values were measured with three replications (n = 3).
SW, soybean-wheat cropping system; RW, rice-wheat cropping system; N, nitrogen.
* and
represent significant at P < 0.05 and P < 0.01 from ANOVA, respectively.
Different lowercase letters indicate significant difference at P < 0.05.
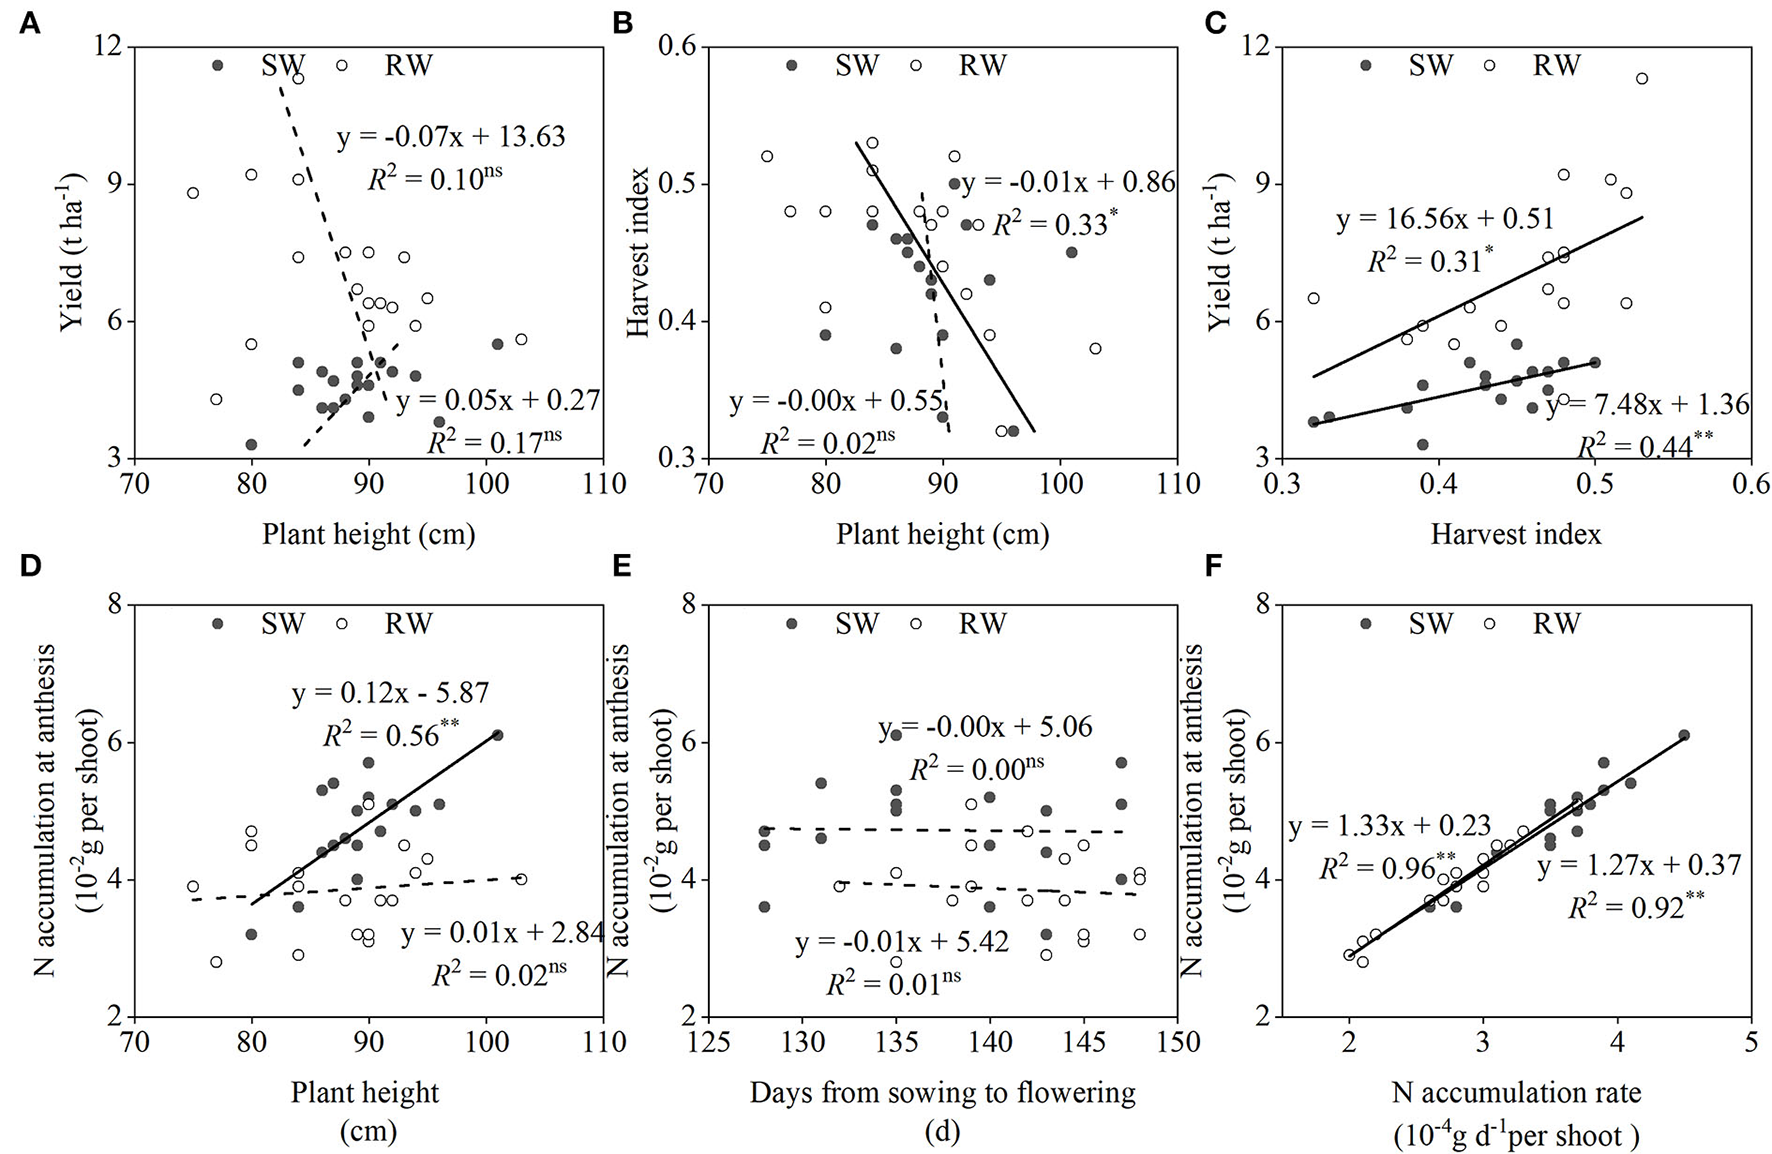
No significant correlation between grain yield and plant height was observed in both wheat cropping systems (Figure 5A). When averaged across the two cropping years, the genetic gain of grain yield was mainly related to the improvement of harvest index, especially in the SW cropping system (Figure 5C). However, the negative correlation between plant height and harvest index was only recorded in the RW cropping system (Figure 5B). N accumulation at anthesis was mainly associated with N accumulation rate (Figure 5F), rather than days from sowing to flowering (Figure 5E) in both wheat cropping systems. In addition, N accumulation at anthesis showed a significantly positive correlation with plant height in the SW cropping system (Figure 5D).
Figure 5
Relationships between plant height and yield (A), harvest index (B); between yield and harvest index (C); between N accumulation at anthesis and plant height (D), days from sowing to flowering (E), N accumulation rate (F) in two wheat cropping systems. All values were measured with three replications (n = 3), two-year data were pooled. SW, soybean-wheat cropping system; RW, rice-wheat cropping system; N, nitrogen. nsrepresents non-significant at P > 0.05, while * and **represent significant at P < 0.05 and P < 0.01 from ANOVA, respectively. Solid and dashed lines indicate significant and insignificant differences at P < 0.05 and P > 0.05, respectively.
Results from correlation analysis (Figure 6) revealed that when averaged across the two cropping years, grain yield in the SW cropping system were positively correlated with grain number per spike (R2 = 0.48, P < 0.01), NUtE (R2 = 0.51, P < 0.01) and negatively correlated with grain protein content (R2 = 0.52, P < 0.01). Grain yield in the RW cropping system were positively correlated with fertile spikes (R2 = 0.30, P < 0.05), grain number per spike (R2 = 0.26, P < 0.05), 1,000-kernel weight (R2 = 0.42, P < 0.01), post anthesis N uptake (R2 = 0.29, P < 0.05), N accumulation at maturity (R2 = 0.31, P < 0.05) and NUpE (R2 = 0.75, P < 0.01). In addition, wet gluten content was negatively correlated with fertile spikes in the RW cropping system (R2 = 0.26, P < 0.05) and gluten index in the RW cropping system (R2 = 0.32, P < 0.05).
Figure 6
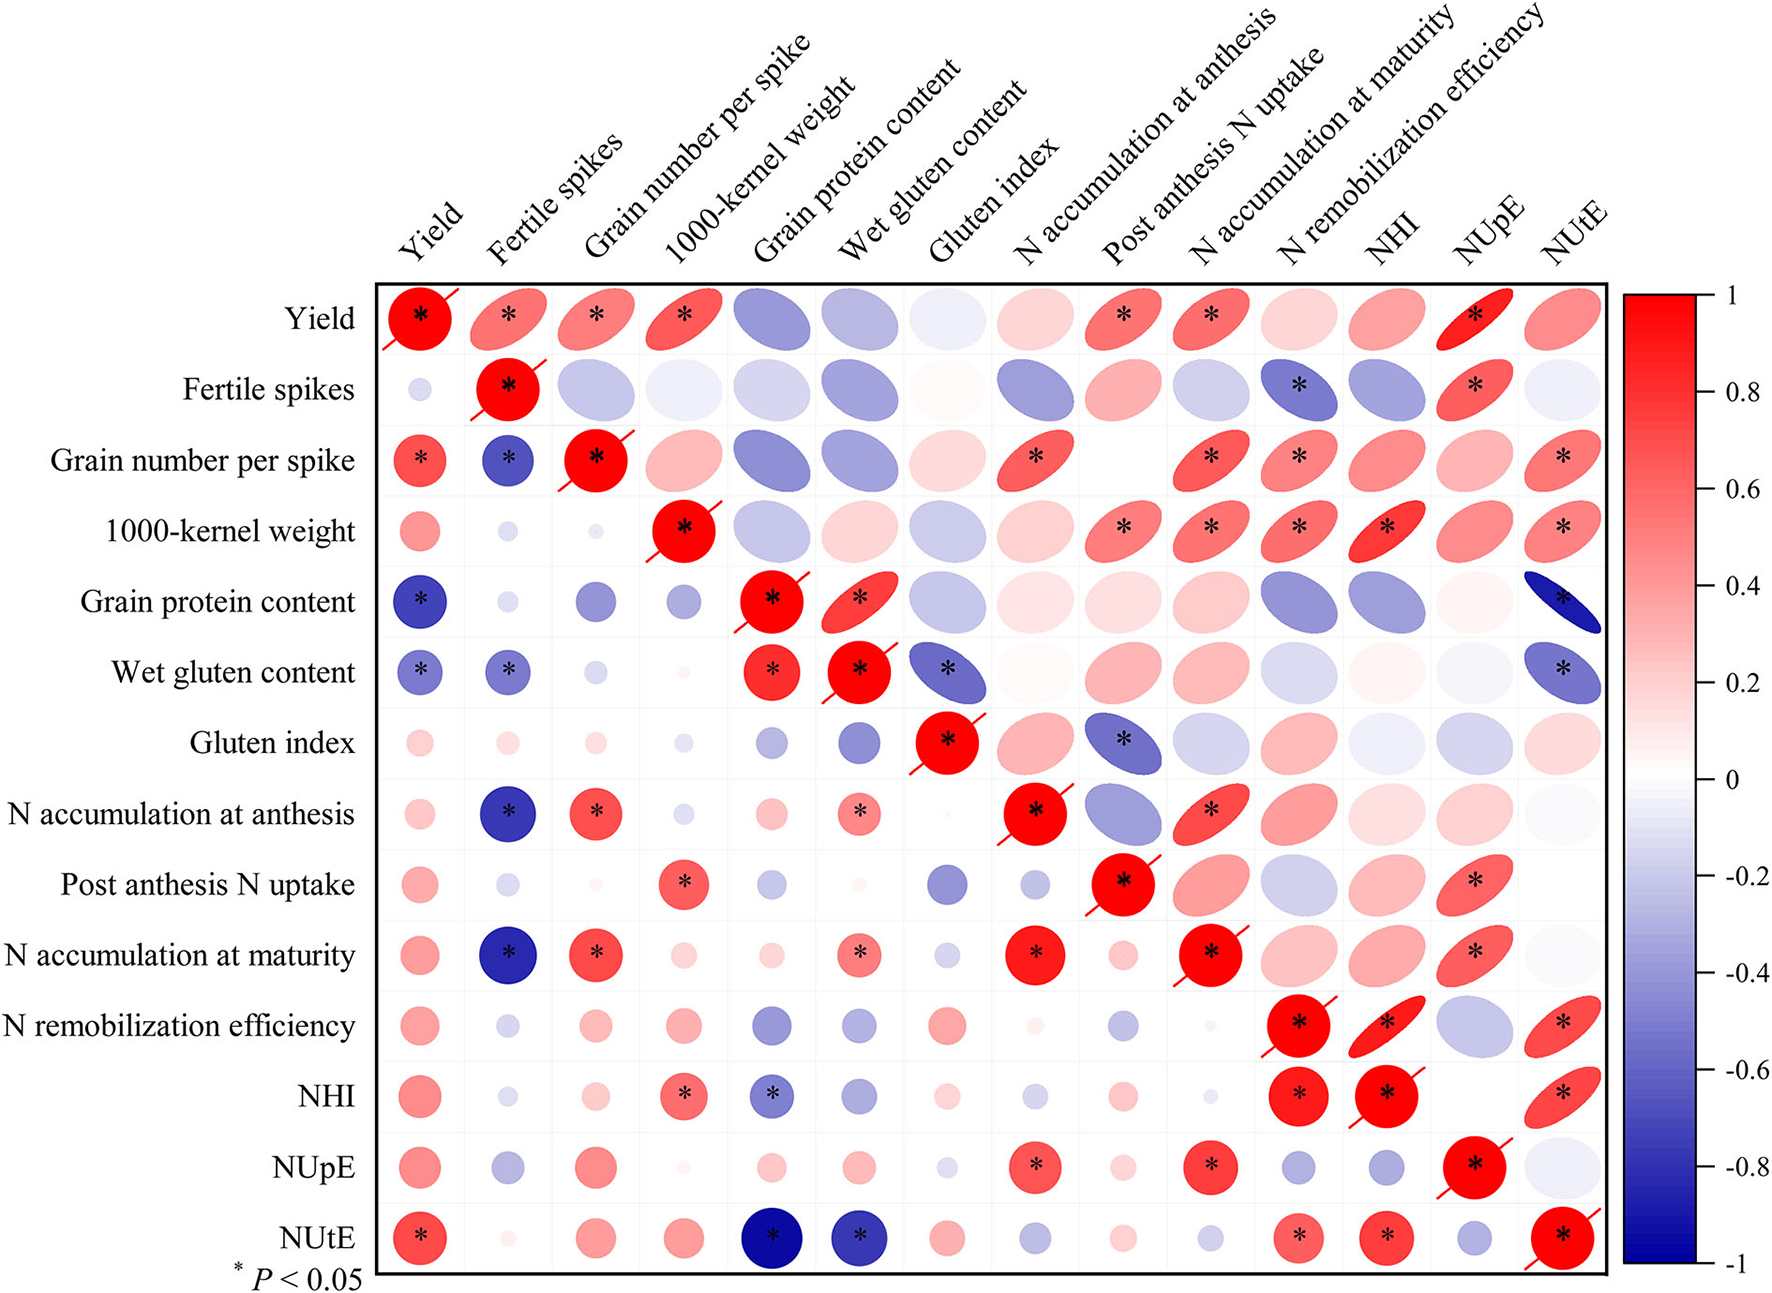
The Pearson's correlation analysis on yield, grain protein quality, and NUE-related traits. All values were measured with three replications (n = 3), two-year data were pooled. N, nitrogen; NUpE, N uptake efficiency; NUtE, N utilization efficiency; NHI, N harvest index; R, Pearson's R. *P < 0.05. Circles and ellipses represent SW and RW cropping systems, respectively.
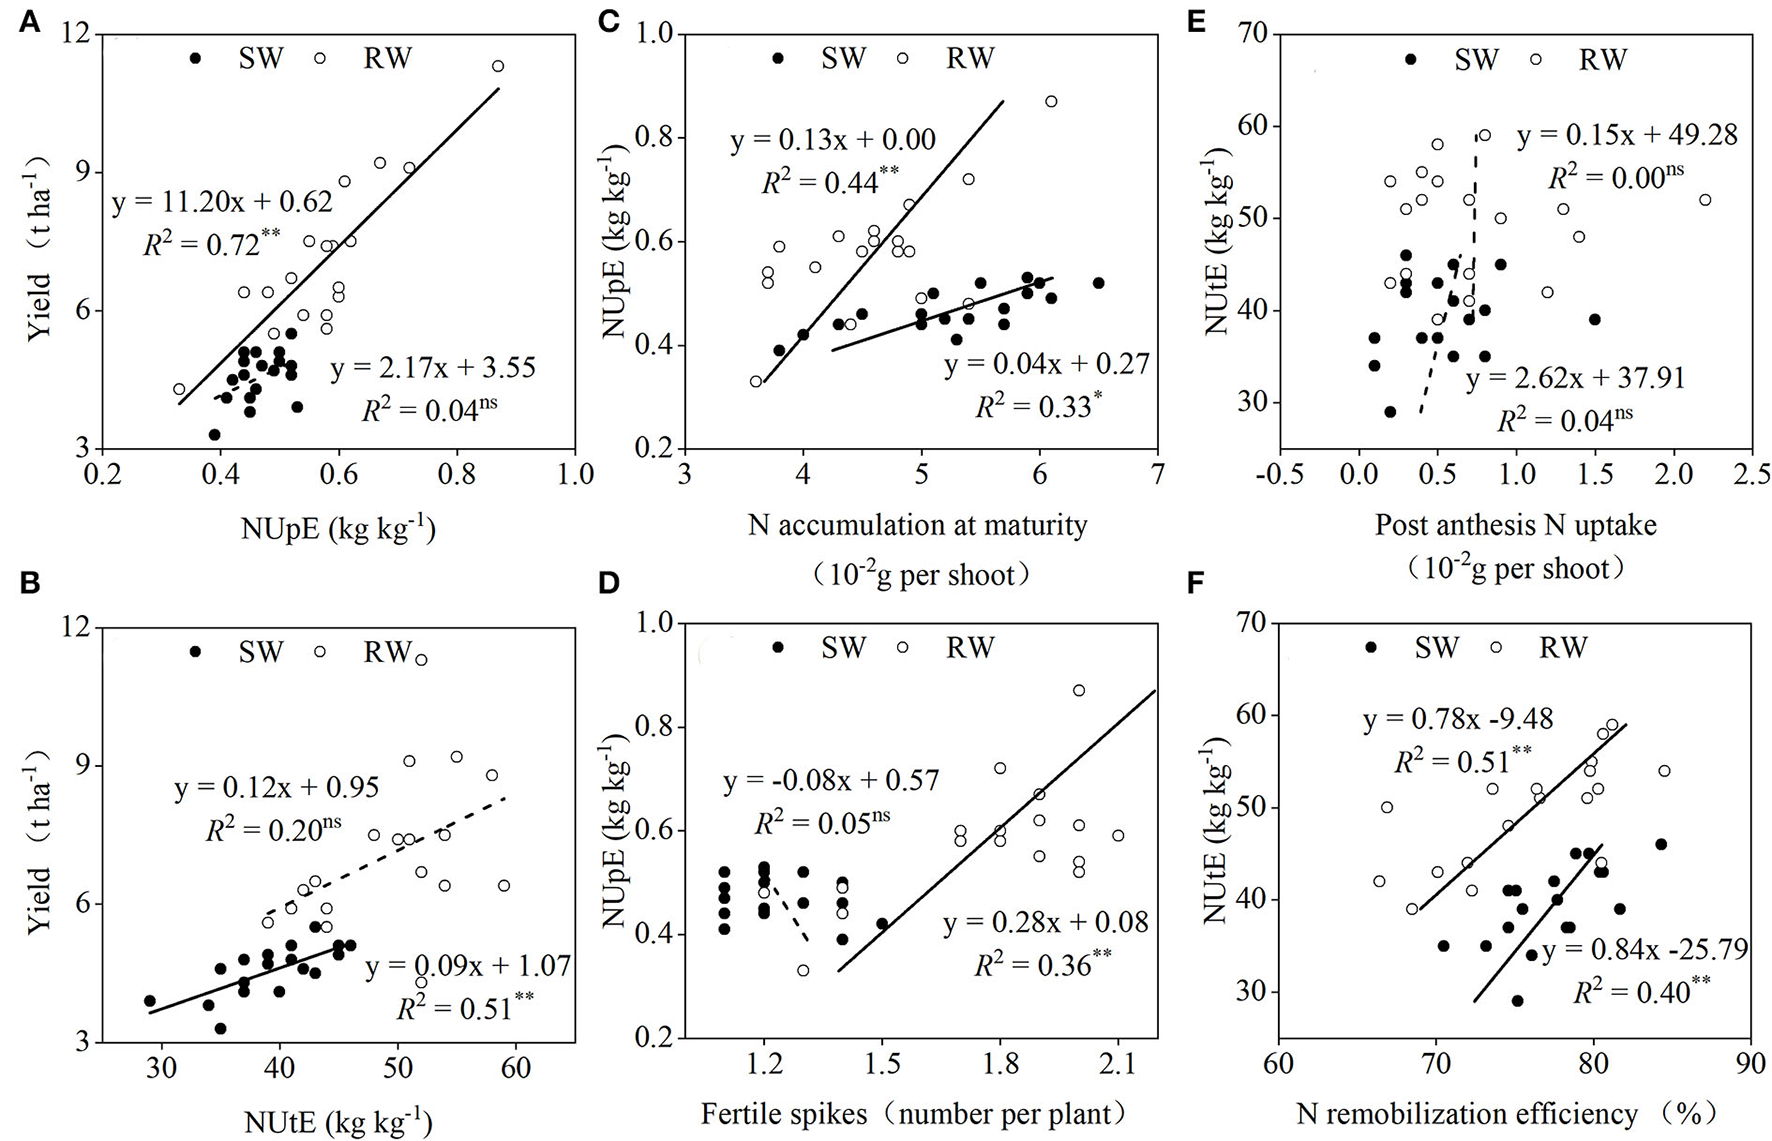
Dominance analysis revealed that when averaged across the two cropping years, NUpE (Figure 7A) and NUtE (Figure 7B) in the SW and RW cropping systems accounted for 34.3 and 65.2% and 77.6 and 22.1% of grain yield variations, respectively. The NUpE in the two wheat cropping systems showed a significant linear correlation with N accumulation at maturity (Figure 7C), whereas a significant linear correlation between NUpE and fertile spikes was only recorded in the RW cropping system (Figure 7D). In both wheat cropping systems, the NUtE showed an insignificant linear correlation with post-anthesis N uptake (Figure 7E) but a significant linear correlation with N remobilization efficiency (Figure 7F).
Figure 7
Relationships between yield and NUpE (A), NUtE (B); between NUpE and N accumulation at maturity (C), fertile spikes (D); between NUtE and post-anthesis N uptake (E), N remobilization efficiency (F) in two wheat cropping systems. All values were measured with three replications (n = 3), two-year data were pooled. SW, soybean-wheat cropping system; RW, rice-wheat cropping system; N, nitrogen; NUpE, N uptake efficiency; NUtE, N utilization efficiency. nsrepresents non-significant at P > 0.05, while * and **represent significant at P < 0.05 and P < 0.01 from ANOVA, respectively. Solid and dashed lines indicate significant and insignificant differences at P < 0.05 and P > 0.05, respectively.
Discussion
NUpE and NUtE played different roles in grain yield variation in two wheat cropping systems due to varied water and N environment
In rotation systems, preceding crops significantly affect subsequent crop growth and development (Ibrahim et al., 2018; Ren et al., 2019). In the present study, significantly higher grain yield was observed in the RW cropping system rather than the SW cropping system, which can be attributed to variations in soil water and N conditions. Soil water deficiency is the primary limiting factor in the SW cropping system, and a decrease in soil water leads to reductions in N uptake, tiller population, fertile spikes, and ultimately decreases grain yield (Lin et al., 2020). However, in the present study, fertile spikes and grain number per spike explained greater variation of yield in RW and SW cropping systems, respectively, which was consistent with the finding that the contribution of yield components to yield varied in different ecological regions (Wu et al., 2014; Qin et al., 2015). These results also confirmed that under favorable soil conditions, the genetic gain of wheat yield was primarily attributed to fertile spikes, followed by grain number per spike and 1,000-kernel weight (Sobczyński et al., 2020). We found that grain number per spike is the limiting factor in the SW cropping system restricting grain yield in super high yield levels rather than fertile spikes, which was inconsistent with the study by Moragues et al. (2006) which observed that wheat grain yield was mainly determined by fertile spikes under water stress, and is in agreement with the finding that wheat grain yield was mainly contributed by main stem under rain fed or drought conditions (Elhani et al., 2007). In addition, our results also showed that the different contribution of fertile spikes to yield in RW and SW may be related to tiller occurrence (Samarah, 2005) and tiller survival (Sadras and Slafer, 2012), respectively.
The contribution of NUpE and NUtE to grain yield varied in the two wheat cropping systems, which was related to the variant contribution of yield components to grain yield. The NUpE represents the capability of roots to capture soil water and N from the soil (Hawkesford, 2014; Aziz et al., 2017; Wang et al., 2018). In this study, a higher total N uptake in the RW cropping system reduced the competitive advantage of the main stem, thus achieving higher fertile spikes (Guo et al., 2013). However, the NUpE explained more significant yield variation in the RW cropping system resulting from variation in fertile spikes, which was due to the reduction in maximum tiller population rather than tiller survival rate (Jalota et al., 2013). Future studies still require investigating the contribution of root morphological traits to the genetic variation of NUpE in RW cropping systems.
In contrast, soil water deficiency in the SW cropping system decreased the capability of roots to capture soil water and N (Harrison et al., 2011), resulting in the death of tillers when N demands increase after stem elongation stage (GS31). Therefore, NUtE in the SW cropping system explained more significant yield variation resulting from grain number per spike and (or) kernel weight (Driever et al., 2014; Jagadish et al., 2015; Prins et al., 2016). The results of this study also supported the above finding. The NUtE represents the capability of crops to convert the absorbed N into grain yield (De Oliveira Silva et al., 2020). Previous results showed that an increase in the grain number per spike was attributed to increased spike DM, fruiting efficiency, and reduced tiller population (Reynolds et al., 2012; Ittersum and Martin, 2016; Carolina et al., 2019). The introduction of tiller suppressor gene (tin) increased grain number per spike (Kumar et al., 2015), due to increased roots in deeper soil layers (Houshmandfar et al., 2020) and increased biomass partitioning to spike, which increased the fruiting efficiency, ultimately increasing the grain yield. This explanation is similar to previous results (Acreche et al., 2008; Lo Valvo et al., 2018). In our study, wheat genotypes with high grain number per spike also present high plant height, leaf area index (NM-101), and erect canopy structures (MM-51). These traits were reported as determining factors for improving the efficiency in the light interception and solar energy conversion and fruiting efficiency (Shearman et al., 2005; Reynolds et al., 2015; Chen et al., 2018). This is because wheat cultivars with high light energy interception and photosynthesis (Ghiglione et al., 2010) contributed to a higher differentiated and fertile florets (González et al., 2005; Ferrante et al., 2013). In addition, soil water deficiency in the SW cropping system decreased Pn resulting from non-stomatal limitation (Friso et al., 2004; Gómez-Bellot et al., 2020), primarily due to decreased rubisco activity (Bertheloot et al., 2008). The decrease in grain number per spike (Borrás et al., 2004) reduced the photosynthetic capacity of leaves (Reynolds et al., 2015) and kernel weight, indicating that grain yield in the SW cropping system was affected by both sink and source restrictions (Serrago and Alzueta, 2013). Another hypothesis is that sink improvement caused by the combined effect of grain number per spike and 1,000-kernel weight contributes to the biomass remobilization efficiency (Zhang et al., 2019), thereby improving the N remobilization efficiency. Therefore, further improvements in NUtE can be achieved by increasing post-anthesis N uptake and N remobilization efficiency.
N accumulation at maturity and N remobilization affected grain protein quality
Grain protein content is one of the most important traits affecting wheat processing quality (Ma et al., 2019), and is the product of N accumulation at maturity, grain weight per spike, and NHI (Gaju et al., 2011; Marti and Slafer, 2014; Wang et al., 2017). In the present study, grain protein content in the SW cropping system was higher than that in the RW cropping system, due to higher N accumulation at maturity resulting from competitive advantage of the main stem to N resources (Tamang et al., 2017), which was in agreement with previous study (Zhang et al., 2017). In contrast, low grain protein content in the RW cropping system may be linked to the dilution effect of carbon on N caused by improved water conditions and increased fertile spikes (Giuliani et al., 2011). Our study also implies the importance of grain weight per spike and N accumulation at maturity on simultaneous improvements in grain yield and protein content, rather than the NHI. This explanation is due to the fact that the NHI of modern wheat varieties is already near the highest value attributed to high mobility of N in plants (Kichey et al., 2007; Barraclough et al., 2010; Reynolds et al., 2012). Our results also confirmed the previous findings that fertile tillers affected root growth, N uptake, partitioning and utilization, resulting in variation of the equilibrium relationship between grain yield and protein content (Allard et al., 2013; Fernanda et al., 2013). Previous study has shown that only about 50% of N in ineffective tillers was remobilized in developing plants (Berry et al., 2003). Therefore, further improvements in N accumulation at maturity and grain protein content can be achieved by reducing ineffective tillers and selecting wheat varieties with high plant height, especially in the SW cropping system.
The grain protein quality of wheat is also heavily influenced by wet gluten content, gluten index, and their interactions (Williams et al., 2008). An improvement in the gluten index is of great importance for achieving high-yield and good-quality (Peng C. et al., 2022). In the present study, some wheat cultivars maintained a high gluten index without being influenced by changes in the environment, confirming that gluten index is mainly affected by genotype (Gil et al., 2011). Moreover, a significantly lower gluten index was recorded in MY-26 and CY-25, due to their high post anthesis N uptake. Previous studies attributed decreased gluten index resulting from increased post-anthesis N uptake to a decrease in N remobilization efficiency (Oosterom et al., 2010) and extension of the grain filling period (Gao et al., 2010; Hajas et al., 2018). In our study, the negative and positive correlations of post-anthesis N uptake with gluten index and 1,000-kernel weight, respectively, suggested that the decrease in gluten index resulted from simultaneous increases in post-anthesis N uptake and 1,000-kernel weight rather than post-anthesis N uptake alone. These results also supported the findings that both kernel weight (Slafer et al., 2014; Madry et al., 2015) and post- anthesis N uptake (Taulemesse et al., 2015; Worland et al., 2017) were determined by genotype. Therefore, we proposed a hypothesis that improved water conditions in the RW cropping system may decrease the gluten index of wheat varieties with high kernel weight by increasing their post-anthesis N uptake.
In addition, the interaction effects of environment and genotype on gluten index have also been reported (Mutwali et al., 2016; Sakr et al., 2021). Previous studies have demonstrated that the variation in gluten index was affected by soil water environments (Flagella et al., 2010). Soil water deficiency promotes the biosynthesis of storage proteins (Dong et al., 2012), dehydration (Shewry and Halford, 2002), and polymerizes glutenin to form glutenin macropolymer (Lerna et al., 2016), which will improve wheat protein quality (Ferreira et al., 2012). In the present study, higher N remobilization efficiency and gluten index in the SW cropping system in 2019–20 cropping year compared to 2018–19 cropping year were caused by a decrease in rainfall. Therefore, our results agreed with a finding that the improvement in gluten index can primarily be attributed to increased N remobilization efficiency under drought condition during grain filling stage (Moldestad et al., 2011). The novel findings of the present study were that the decreased N remobilization efficiency in relation to low grain number per spike in the SW cropping system was associated with the decrease in gluten index. Our study also confirmed that N remobilization in SW and RW cropping systems were regulated by source N supply and N demand of sink organs, respectively (Fischer, 2008; Serrago and Alzueta, 2013; Slimane et al., 2013). Future research will be focused on the onset of canopy and leaf senescence regulated by N remobilization, due to senescence which is the main factor that affects wheat grain yield and protein quality in the RW cropping system.
Post-anthesis N uptake contributed to simultaneous improvements in grain yield and wet gluten content
In this study, the negative relationship between grain yield and grain protein content was observed in both wheat cropping systems, which was in agreement with previous results (Lollato et al., 2019; Nigro et al., 2019; Crosta et al., 2021). However, this negatively linear relationship in the RW cropping system was weaker than that in the SW cropping system, which confirmed previous findings that this negative correlation was affected by soil water and N environment (Dupont et al., 2006; Triboi et al., 2006). Genetic improvement in grain protein content was achieved at the expense of grain yield (Oury and Godin, 2007), which was consistent with our research results from the SW cropping system. Identifying wheat cultivars deviating from the negative relationship is essential to achieve both high grain yield and good protein quality. Previous studies have shown that genetic variation in grain protein deviation was linked to increases in N accumulation, N remobilization efficiency, and NHI (Jain et al., 2011; Suprayogi et al., 2011; Mosleth et al., 2015). In the present study, wheat cultivars with high plant height and late flowering date confer crops with high plant biomass and grain number per spike (Gaju et al., 2014), diluting the grain protein content. On the contrary, our research suggested that genetic selection for high post-anthesis N uptake and kernel weight contributed to increases in grain yield and wet gluten content by prolonging the photosynthetic duration and increasing the N accumulation at maturity (Bogard et al., 2010; Merah and Monneveux, 2015). Similar results were also observed elsewhere (Triboi and Triboi-Blondel, 2002; Brevis et al., 2010). Our results also confirmed these findings that the increased kernel weight could balance the decrease in grain number per unit area (Giunta et al., 2019), and the genetic variation in grain protein deviation was mainly determined by post-anthesis N uptake, rather than N remobilization efficiency (Mosleth et al., 2015). Furthermore, previous results have shown that post-anthesis N uptake was determined by genotype, and correlated positively with the root nitrate reductase gene (Zhao et al., 2013) and root system vigor (Nigro et al., 2019; Li et al., 2020; Lamichhane et al., 2021). Further analysis is required to analyze the contribution of N capture genes to grain protein deviation.
Conclusion
In summary, genetic variation of grain yield in RW and SW cropping systems can be attributed to NUpE and NUtE, respectively. Fertile spikes in the RW cropping system and grain number per spike in the SW cropping system contributed to grain yield variation by 77.6 and 65.2%, respectively, due to variation in soil water and N availability. In both wheat cropping systems, the dwarf breeding strategy improved the NHI and HI of modern wheat, resulting in simultaneous improvements in grain yield and protein content. Improved water conditions in the RW cropping system increased post-anthesis N uptake, resulting in a decrease in the gluten index of wheat varieties with high kernel weight. Water deficit in the SW cropping system limited the N uptake and post-anthesis photosynthesis, resulting in a decreased contribution of fertile spikes and kernel weight to yield. Reducing ineffective tillers in the SW cropping system may be an effective strategy to increase grain number per spike and grain protein content maintaining high gluten index by improving the canopy structure and increasing the N accumulation of main stem and N remobilization efficiency. From these results, we concluded that plant height, kernel weight, and post-anthesis N uptake were the critically agronomic and NUE-related traits for the simultaneous selection of grain yield and protein quality. Our research results provided useful guidelines for improving both grain yield and protein quality by identifying desirable N-efficient genotypes in the two rotation systems.
Funding
We acknowledge our laboratory members for help with field management and data collection. We are grateful for financial support from Sichuan Science and Technology Program (2022ZDZX0014), National Natural Science Foundation of China (32201904), National Key Research and Development Program of China (2016YFD0300406), Sichuan Science and Technology Program (2021YFYZ0002, 2021YJ0504), Agro-scientific Research in the Public Interest (20150312705) and Crops Breeding Project in Sichuan Province (2016NYZ0051).
Publisher's note
All claims expressed in this article are solely those of the authors and do not necessarily represent those of their affiliated organizations, or those of the publisher, the editors and the reviewers. Any product that may be evaluated in this article, or claim that may be made by its manufacturer, is not guaranteed or endorsed by the publisher.
Statements
Data availability statement
The original contributions presented in the study are included in the article/supplementary material, further inquiries can be directed to the corresponding authors.
Author contributions
YC: conceptualization, methodology, field management, data collection, data curation, and writing. KW: field management, data collection, and data curation. HC: field management and data collection. HY: conceptualization, methodology, writing review and editing, and supervision. TZ: conceptualization, methodology, writing review and editing, and supervision. XH: field management, data collection, and supervision. GF: funding acquisition, project administration, writing review and editing, and supervision. All authors contributed to the article and approved the submitted version.
Conflict of interest
The authors declare that the research was conducted in the absence of any commercial or financial relationships that could be construed as a potential conflict of interest.
- Abbreviations: N
nitrogen
- NUpE
N uptake efficiency
- NUtE
N utilization efficiency
- NUE
N use efficiency
- NHI
N harvest index.
Abbreviations
References
1
Acreche M. M. Briceño-Félix G. Sánchez J. A. M. Slafer G. A. (2008). Physiological bases of genetic gains in Mediterranean bread wheat yield in Spain. Eur. J. Agron.28, 162–170. 10.1016/j.eja.2007.07.001
2
Allard V. Martre P. Gouis J. L. (2013). Genetic variability in biomass allocation to roots in wheat is mainly related to crop tillering dynamics and nitrogen status. Eur. J. Agron.46, 68–76. 10.1016/j.eja.2012.12.004
3
Aziz M. M. Palta J. A. Siddique K. Sadras V. O. (2017). Five decades of selection for yield reduced root length density and increased nitrogen uptake per unit root length in Australian wheat varieties. Plant Soil.413, 181–192. 10.1007/s11104-016-3059-y
4
Barraclough P. B. Howarth J. R. Jones J. Lopez-Bellido R. Parmar S. Shepherd C. E. et al . (2010). Nitrogen efficiency of wheat: genotypic and environmental variation and prospects for improvement. Eur. J. Agron.33, 1–11. 10.1016/j.eja.2010.01.005
5
Barraclough P. B. Lopez-Bellido R. Hawkesford M. J. (2014). Genotypic variation in the uptake, partitioning and remobilisation of nitrogen during grain-filling in wheat. Field Crop. Res.156, 242–248. 10.1016/j.fcr.2013.10.004
6
Berry P. M. Spink J. H. Foulkes M. J. Wade A. (2003). Quantifying the contributions and losses of dry matter from non-surviving shoots in four cultivars of winter wheat. Field Crop. Res.80, 111–121. 10.1016/S0378-4290(02)00174-0
7
Bertheloot J. J. Martre P. P. Andrieu B. B. (2008). Dynamics of light and nitrogen distribution during grain filling within wheat canopy [OA]. Plant Physiol.148, 1707–1720. 10.1104/pp.108.124156
8
Bogard M. Allard V. Brancourt-Hulmel M. Heumez E. Machet J. Jeuffroy M. et al . (2010). Deviation from the grain protein concentration-grain yield negative relationship is highly correlated to post-anthesis N uptake in winter wheat. J. Exp. Bot.61, 4303–4312. 10.1093/jxb/erq238
9
Borrás L. Slafer G. A. Otegui M. A. E. (2004). Seed dry weight response to source-sink manipulations in wheat, maize and soybean: a quantitative reappraisal. Field Crop. Res.86, 131–146. 10.1016/j.fcr.2003.08.002
10
Brevis J. C. Morris C. F. Manthey F. Dubcovsky J. (2010). Effect of the grain protein content locus Gpc-B1 on bread and pasta quality. J. Cereal Sci.51, 357–365. 10.1016/j.jcs.2010.02.004
11
Bryant Schlobohm R. Dhillon J. Wehmeyer G. B. Raun W. R. (2020). Wheat grain yield and nitrogen uptake as influenced by fertilizer placement depth. Agrosyst. Geosci. Environ.3, e20025. 10.1002/agg2.20025
12
Carolina R. Eliseo T. Gemma M. Matthew P. R. Roger S. M. John F. (2019). Optimizing dry-matter partitioning for increased spike growth, grain number and harvest index in spring wheat. Field Crop. Res.240, 154–167. 10.1016/j.fcr.2019.04.016
13
Chandna R. Hakeem K. R. Khan F. Ahmad A. Iqbal M. (2012). Variability of nitrogen uptake and assimilation among N-efficient and N-inefficient wheat (Triticum aestivum L.) genotypes. J. Plant Interact.7, 367–375. 10.1080/17429145.2011.641229
14
Chen D. Chu Z. Wang M. Qin Y. Yi Z. (2018). Influence of nitrogen source and concentrations on wheat growth and production inside Lunar Palace-1. Acta Astronaut.18, 371–379. 10.1016/j.actaastro.2017.12.043
15
Crosta M. Nazzicari N. Ferrari B. Pecetti L. Russi L. Romani M. et al . (2021). Pea grain protein content across italian environments: genetic relationship with grain yield, and opportunities for genome-enabled selection for protein yield. Front. Plant Sci.12, 718713. 10.3389/fpls.2021.718713
16
De Oliveira Silva A. Ciampitti I. A. Slafer G. A. Lollato R. P. (2020). Nitrogen utilization efficiency in wheat: a global perspective. Eur. J. Agron.114, 126008. 10.1016/j.eja.2020.126008
17
Ding J. Zi Y. Li C. Peng Y. Zhu X. Guo W. (2016). Dry matter accumulation, partitioning, and remobilization in high-yielding wheat under rice-wheat rotation in China. Agron. J.108, 604–614. 10.2134/agronj2015.0114
18
Dong K. Pei G. Ma C. Ke W. Yan Y. (2012). Albumin and globulin dynamics during grain development of elite Chinese wheat cultivar Xiaoyan 6. J. Cereal Sci.56, 615–622. 10.1016/j.jcs.2012.08.016
19
Driever S. M. Lawson T. Andralojc P. J. Raines C. A. Parry M. (2014). Natural variation in photosynthetic capacity, growth, and yield in 64 field-grown wheat genotypes. J. Exp. Bot.65, 4959–4973. 10.1093/jxb/eru253
20
Dupont F. M. Hurkman W. J. Vensel W. H. Tanaka C. Kothari K. M. Chung O. K. et al . (2006). Protein accumulation and composition in wheat grains: effects of mineral nutrients and high temperature. Eur. J. Agron.25, 96–107. 10.1016/j.eja.2006.04.003
21
Elhani S. Martos V. Rharrabti Y. Royo C. Moral L. F. G. D. (2007). Contribution of main stem and tillers to durum wheat (Triticum turgidum L. Var. Durum) grain yield and its components grown in Mediterranean environments. Field Crop. Res.103, 25–35. 10.1016/j.fcr.2007.05.008
22
Faostat F. (2016). FAOSTAT: FAO statistical databases. Food and Agriculture Organization of the United Nations Rome. Available online at: http://faostat.fao.org/
23
Fernanda D. M. Chapman S. C. Rattey A. R. Jodi N. Song Y. Christopher J. T. et al . (2013). Developmental and growth controls of tillering and water-soluble carbohydrate accumulation in contrasting wheat (Triticum aestivum L.) genotypes: can we dissect them?J. Exp. Bot.64, 143–160. 10.1093/jxb/ers317
24
Ferrante A. Savin R. Slafer G. A. (2013). Floret development and grain setting differences between modern durum wheats under contrasting nitrogen availability. J. Exp. Bot.64, 169–184. 10.1093/jxb/ers320
25
Ferreira M. S. L. Martre P. Mangavel C. Girousse C. Rosa N. N. Samson M. F. O. et al . (2012). Physicochemical control of durum wheat grain filling and glutenin polymer assembly under different temperature regimes. J. Cereal Sci.56, 58–66. 10.1016/j.jcs.2011.11.001
26
Fischer R. A. (1985). Number of kernels in wheat crops and the influence of solar radiation and temperature. J. Agric. Sci.105, 447–461. 10.1017/S0021859600056495
27
Fischer R. A. (2008). The importance of grain or kernel number in wheat: a reply to Sinclair and Jamieson. Field Crop. Res.105, 15–21. 10.1016/j.fcr.2007.04.002
28
Flagella Z. Giuliani M. M. Giuzio L. Volpi C. Masci S. (2010). Influence of water deficit on durum wheat storage protein composition and technological quality. Eur. J. Agron.33, 197–207. 10.1016/j.eja.2010.05.006
29
Friso G. Giacomelli L. Ytterberg A. J. Peltier J. B. Rudella A. Sun Q. et al . (2004). In-depth analysis of the thylakoid membrane proteome of arabidopsis thaliana chloroplasts: New proteins, new functions, and a plastid proteome database. Plant Cell Online16, 478–499. 10.1105/tpc.017814
30
Gaju O. Allard V. Martre P. Gouis J.L. Moreau D. Bogard M. et al . (2014). Nitrogen partitioning and remobilization in relation to leaf senescence, grain yield and grain nitrogen concentration in wheat cultivars. Field Crop. Res.155, 213–223. 10.1016/j.fcr.2013.09.003
31
Gaju O. Allard V. Martre P. Snape J. W. Heumez E. LeGouis J. et al . (2011). Identification of traits to improve the nitrogen-use efficiency of wheat genotypes. Field Crop. Res.123, 139–152. 10.1016/j.fcr.2011.05.010
32
Gao L. Ma W. Chen J. Wang K. Li J. Wang S. et al . (2010). Characterization and comparative analysis of wheat high molecular weight glutenin subunits by SDS-PAGE, RP-HPLC, HPCE, and MALDI-TOF-MS. J. Agr. Food Chem.58, 2777–2786. 10.1021/jf903363z
33
Gao Y. Li Y. Zhang J. Liu W. Dang Z. Cao W. et al . (2009). Effects of mulch, N fertilizer, and plant density on wheat yield, wheat nitrogen uptake, and residual soil nitrate in a dryland area of China. Nutr. Cycl. Agroecosys.85, 109–121. 10.1007/s10705-009-9252-0
34
Ghiglione H. O. Gonzalez F. G. Serrago R. Maldonado S. B. Casal J. J. (2010). Autophagy regulated by day length determines the number of fertile florets in wheat. Plant J.55, 1010–1024. 10.1111/j.1365-313X.2008.03570.x
35
Gil D. H. Bonfil D. J. Svoray T. (2011). Multi scale analysis of the factors influencing wheat quality as determined by gluten index. Field Crop. Res.123, 1–9. 10.1016/j.fcr.2011.04.001
36
Giuliani M. M. Giuzio L. De C. A. Flagella Z. (2011). Relationships between nitrogen utilization and grain technological quality in durum wheat: II. Grain yield and quality. Agron. J.103, 1668–1675. 10.2134/agronj2011.0154
37
Giunta F. Pruneddu G. Motzo R. (2019). Grain yield and grain protein of old and modern durum wheat cultivars grown under different cropping systems. Field Crop. Res.230, 107–120. 10.1016/j.fcr.2018.10.012
38
Gómez-Bellot M. J. Lorente B. Sánchez-Blanco M. J. Ortuo M. F. Nortes P. A. Alarcón J. J. (2020). Influence of mixed substrate and arbuscular mycorrhizal fungi on photosynthetic efficiency, nutrient and water status and yield in tomato plants irrigated with saline reclaimed waters. Water-Sui.12, 438–449. 10.3390/w12020438
39
González F. G. Slafer G. A. Miralles D. J. (2005). Photoperiod during stem elongation in wheat: Is its impact on fertile floret and grain number determination similar to that of radiation?Funct. Plant Biol.32, 181–188. 10.1071/FP04103
40
Guo J. Chen E. Yin Y. Wang P. Li Y. Chen X. et al . (2013). Nitric oxide content in wheat leaves and its relation to programmed cell death of main stem and tillers under different nitrogen levels. J. Integr. Agr.12, 239–250. 10.1016/S2095-3119(13)60223-3
41
Hajas L. Scherf K. A. Török K. Bugyi Z. Schall E. Poms R. E. et al . (2018). Variation in protein composition among wheat (Triticum aestivum L.) cultivars to identify cultivars suitable as reference material for wheat gluten analysis. Food Chem.267, 387–394. 10.1016/j.foodchem.2017.05.005
42
Harrison M. T. Evans J. R. Dove H. Moore A. D. (2011). Recovery dynamics of rainfed winter wheat after livestock grazing 2. Light interception, radiation use efficiency and dry matter partitioning. Crop Pasture Sci.62, 960–971. 10.1071/CP11235
43
Hawkesford M. J. (2014). Reducing the reliance on nitrogen fertilizer for wheat production. J. Cereal Sci.59, 276–283. 10.1016/j.jcs.2013.12.001
44
Hawkesford M. J. (2017). Genetic variation in traits for nitrogen use efficiency in wheat. J. Exp. Bot.68, 2627–2632. 10.1093/jxb/erx079
45
Houshmandfar A. Ota N. O'Leary G. J. Zheng B. Chen Y. Tausz-Posch S. et al . (2020). A reduced-tillering trait shows small but important yield gains in dryland wheat production. Glob Change Biol.26, 4056–4067. 10.1111/gcb.15105
46
Hu C. Xia X. Chen Y. Qiao Y. Liu D. Fan J. et al . (2019). Yield, nitrogen use efficiency and balance response to thirty-five years of fertilization in paddy rice-upland wheat cropping system. Plant Soil Environ.65, 55–62. 10.17221/576/2018-PSE
47
Ibrahim A. Harrison M. Meinke H. Fan Y. Johnson P. Zhou M. et al . (2018). A regulator of early flowering in barley (Hordeum vulgare L.). PLoS ONE13, e200722. 10.1371/journal.pone.0200722
48
Ittersum V. Martin K. (2016). Crop yields and global food security. Will yield increase continue to feed the world?Eur. Rev. Agric. Econ.97, 191–192. 10.1093/erae/jbv034
49
Jagadish K. S. V. Kavi K. P. B. Bahuguna R. N. Nese S. (2015). Staying alive or going to die during terminal senescence-an enigma surrounding yield stability. Front. Plant Sci.6, 1070. 10.3389/fpls.2015.01070
50
Jain V. Khetarpal S. Das R. Abrol Y. P. (2011). Nitrate assimilation in contrasting wheat genotypes. Physiol. Mol. Biol. Plants.17, 137–144. 10.1007/s12298-011-0061-y
51
Jalota S. K. Kaur H. Kaur S. Vashisht B. B. (2013). Impact of climate change scenarios on yield, water and nitrogen-balance and -use efficiency of rice-wheat cropping system. Agr. Water Manage.116, 29–38. 10.1016/j.agwat.2012.10.010
52
Kayan N. Ayter Arpacioglu N. G. Kutlu I. Adak M. S. (2020). Effects of different tillage, rotation systems and nitrogen levels on wheat yield and nitrogen use efficiency. Turk. J. Agric.8, 1603–1611. 10.24925/turjaf.v8i8.1603-1611.2849
53
Kichey T. Hirel B. Heumez E. Dubois F. Gouis J. L. (2007). In winter wheat (Triticum aestivum L.), post-anthesis nitrogen uptake and remobilisation to the grain correlates with agronomic traits and nitrogen physiological markers. Field Crop. Res.102, 22–32. 10.1016/j.fcr.2007.01.002
54
Kjeldahl C. (1883). A new method for the determination of nitrogen in organic matter. Z Anal Chem.22, 366–375. 10.1007/BF01338151
55
Kong L. Sun M. Yan X. Wang F. Zhao Z. (2015). Photochemical and anti-oxidative responses of the glume and flag leaf to seasonal senescence in wheat. Front. Plant Sci.6, 358. 10.3389/fpls.2015.00358
56
Kumar S. Singh S. S. Mishra C. N. Saroha M. Gupta V. Sharma P. et al . (2015). Assessment of tiller inhibition (tin) gene molecular marker for its application in marker-assisted breeding in wheat. Natl. Acad. Sci. Lett.38, 457–460. 10.1007/s40009-015-0372-6
57
Lamichhane S. Murata C. Griffey C. A. Thomason W. E. Fukao T. (2021). Physiological and molecular traits associated with nitrogen uptake under limited nitrogen in soft red winter wheat. Plants.10, 165. 10.3390/plants10010165
58
Latshaw S. P. Vigil M. F. Haley S. D. (2016). Genotypic differences for nitrogen use efficiency and grain protein deviation in hard winter wheat. Agron. J.108, 2201–2213. 10.2134/agronj2016.02.0070
59
Lemaire G. Ciampitti I. (2020). Crop mass and N status as prerequisite covariables for unraveling nitrogen use efficiency across genotype-by-environment-by-management scenarios: a review. Plants.9, 1309. 10.3390/plants9101309
60
Lerna A. Lombardo G. M. Mauromicale G. (2016). Yield, nitrogen use efficiency and grain quality in durum wheat as affected by nitrogen fertilization under a Mediterranean environment. Exp. Agr.52, 314–329. 10.1017/S0014479715000113
61
Li J. Wang Y. Zhang M. Liu Y. Xu X. Lin G. et al . (2019). Optimized micro-sprinkling irrigation scheduling improves grain yield by increasing the uptake and utilization of water and nitrogen during grain filling in winter wheat. Agr. Water Manage.211, 59–69. 10.1016/j.agwat.2018.09.047
62
Li W. He X. Chen Y. Jing Y. Shen C. Yang J. et al . (2020). A wheat transcription factor positively sets seed vigour by regulating the grain nitrate signal. New Phytol.225, 1667–1680. 10.1111/nph.16234
63
Lian H. Qin C. He Z. Niu J. Zhang C. Sang T. et al . (2020). A synergistic increase in water and nitrogen use efficiencies in winter wheat cultivars released between the 1940s and the 2010s for cultivation in the drylands of the Shanxi Province in China. Agr. Water Manage.240, 106308. 10.1016/j.agwat.2020.106308
64
Lin X. Li P. Shang Y. Liu S. Wang S. Hu X. et al . (2020). Spike formation and seed setting of the main stem and tillers under post-jointing drought in winter wheat. J. Agron. Crop Sci.206, 694–710. 10.1111/jac.12432
65
Lo Valvo P. J. Miralles D. J. Serrago R. A. (2018). Genetic progress in Argentine bread wheat varieties released between 1918 and 2011: Changes in physiological and numerical yield components. Field Crop. Res.221, 314–321. 10.1016/j.fcr.2017.08.014
66
Lollato R. P. Figueiredo B. M. Dhillon J. S. Arnall D. B. Raun W. R. (2019). Wheat grain yield and grain-nitrogen relationships as affected by N, P, and K fertilization: a synthesis of long-term experiments. Field Crop. Res.236, 42–57. 10.1016/j.fcr.2019.03.005
67
Luo C. Guo Z. Xiao J. Dong K. Dong Y. (2021). Effects of applied ratio of nitrogen on the light environment in the canopy and growth, development and yield of wheat when intercropped. Front. Plant Sci.12, 719850. 10.3389/fpls.2021.719850
68
Ma P. Lan Y. Liu T. Li F. Yang Z. Sun Y. et al . (2021). Nitrogen fate and efficiency of fertilizer application under a rapeseed-wheat-rice rotation system in southwest China. Agronomy.11, 258. 10.3390/agronomy11020258
69
Ma W. Yu Z. She M. Zhao Y. Islam S. (2019). Wheat gluten protein and its impacts on wheat processing quality. Frontiers of Agricultural Science and Engineering.6, 279–287. 10.15302/J-FASE-2019267
70
Madry W. Studnicki M. Rozbicki J. (2015). Ontogenetic-based sequential path analysis of grain yield and its related traits in several winter wheat cultivars. Acta Agric. Scand.65, 605–618. 10.1080/09064710.2015.1039053
71
Marti J. Slafer G. A. (2014). Bread and durum wheat yields under a wide range of environmental conditions. Field Crop. Res.156, 258–271. 10.1016/j.fcr.2013.10.008
72
Merah O. Monneveux P. (2015). Contribution of different organs to grain filling in durum wheat under mediterranean conditions I. Contribution of post-anthesis photosynthesis and remobilization. J. Agron. Crop Sci.201, 344–352. 10.1111/jac.12109
73
Moldestad A. Fergestad E. M. Hoel B. Skjelvåg A. O. Uhlen A. K. (2011). Effect of temperature variation during grain filling on wheat gluten resistance. J. Cereal Sci.53, 347–354. 10.1016/j.jcs.2011.02.005
74
Moragues M. Garcia Del Moral L. F. Moralejo M. Royo C. (2006). Yield formation strategies of durum wheat landraces with distinct pattern of dispersal within the Mediterranean basin: II. Biomass production and allocation. Field Crop. Res.95, 194–205. 10.1016/j.fcr.2005.02.009
75
Mosleth E. F. Wan Y. Lysenko A. Chope G. A. Penson S. P. Shewry P. R. et al . (2015). A novel approach to identify genes that determine grain protein deviation in cereals. Plant Biotechnol. J.13, 625–635. 10.1111/pbi.12285
76
Mutwali N. I. A. Mustafa A. I. Gorafi Y. S. A. Mohamed-Ahmed I. A. (2016). Effect of environment and genotypes on the physicochemical quality of the grains of newly developed wheat inbred lines. Food Sci. Nutr.4, 508–520. 10.1002/fsn3.313
77
Nigro D. Gadaleta A. Mangini G. Colasuonno P. Marcotuli I. Giancaspro A. et al . (2019). Candidate genes and genome-wide association study of grain protein content and protein deviation in durum wheat. Planta249, 1157–1175. 10.1007/s00425-018-03075-1
78
Olszewski J. Pszczółkowska A. Kulik T. Fordoński G. Wasielewska J. (2008). Rate of photosynthesis and transpiration of winter wheat leaves and ears under water deficit conditions. Pol. J. Nat. Sci.23, 326–335. 10.2478/v10020-008-0025-z
79
Oosterom E. Borrell A. K. Chapman S. C. Broad I. J. Hammer G. L. (2010). Functional dynamics of the nitrogen balance of sorghum: I. N demand of vegetative plant parts. Field Crop. Res.115, 19–28. 10.1016/j.fcr.2009.09.018
80
Oury F. Godin C. (2007). Yield and grain protein concentration in bread wheat : How to use the negative relationship between the two characters to identify favourable genotypes?Euphytica157, 45–57. 10.1007/s10681-007-9395-5
81
Peng C. Zhang Z. Li Y. Zhang Y. Dong H. Fang Y. et al . (2022). Genetic improvement analysis of nitrogen uptake, utilization, translocation, and distribution in Chinese wheat in Henan Province. Field Crop. Res.277, 108406. 10.1016/j.fcr.2021.108406
82
Peng Q. Zheng H. Meng K. Zhu Y. Zhu W. Zhu H. et al . (2022). The way of Qu-making significantly affected the volatile flavor compounds in Huangjiu (Chinese rice wine) during different brewing stages. Food Sci. Nutr.10, 2255–2270. 10.1002/fsn3.2835
83
Pompa M. Giuliani M. M. Giuzio L. Gagliardi A. Fonzo N. D. Flagella Z. (2011). Effect of sulphur fertilization on grain quality and protein composition of durum wheat (Triticum durum Desf.). Ital. J. Agron.4, 4–17. 10.4081/ija.2009.4.159
84
Prins A. Orr D. J. Andralojc P. J. Reynolds M. P. Carmo-Silva E. Parry M. A. J. (2016). Rubisco catalytic properties of wild and domesticated relatives provide scope for improving wheat photosynthesis. J. Exp. Bot.67, 1827–1838. 10.1093/jxb/erv574
85
Qin X. Zhang F. Liu C. Yu H. Cao B. Tian S. et al . (2015). Wheat yield improvements in China: past trends and future directions. Field Crop. Res.177, 117–124. 10.1016/j.fcr.2015.03.013
86
Rapp M. Lein V. Lacoudre F. Lafferty J. Müller E. Vida G. et al . (2018). Simultaneous improvement of grain yield and protein content in durum wheat by different phenotypic indices and genomic selection. Theor. Appl. Genet.131, 1315–1329. 10.1007/s00122-018-3080-z
87
Ren T. Bu R. Liao S. Zhang M. Li X. Cong R. et al . (2019). Differences in soil nitrogen transformation and the related seed yield of winter oilseed rape (Brassica napus L.) under paddy-upland and continuous upland rotations. Soil Till. Res.192, 206–214. 10.1016/j.still.2019.05.008
88
Reynolds M. Foulkes J. Furbank R. Griffiths S. King J. Murchie E. et al . (2012). Achieving yield gains in wheat. Plant Cell Environ.35, 1799–1823. 10.1111/j.1365-3040.2012.02588.x
89
Reynolds M. P. Pellegrineschi A. Skovmand B. (2015). Sink-limitation to yield and biomass: a summary of some investigations in spring wheat. Ann. Appl. Biol.146, 39–49. 10.1111/j.1744-7348.2005.03100.x
90
Sadras V. O. Slafer G. A. (2012). Environmental modulation of yield components in cereals: heritabilities reveal a hierarchy of phenotypic plasticities. Field Crop. Res.127, 215–224. 10.1016/j.fcr.2011.11.014
91
Sakr N. Rhazi L. Aussenac T. (2021). Bread wheat quality under limiting environmental conditions: II-rheological properties of Lebanese wheat genotypes. J. Saudi Soc. Agric. Sci.20, 235–242. 10.1016/j.jssas.2021.02.002
92
Saleem N. Ahmad M. A. Wani S. Vashnavi R. A. Dar Z. (2015). Genotype-environment interaction and stability analysis in wheat (Triticum aestivum L.) for protein and gluten contents. Sci. Res. Essays10, 260–265. 10.5897/SRE2015.6180
93
Samarah N. H. (2005). Effects of drought stress on growth and yield of barley. Agron. Sustain. Dev.25, 145–149. 10.1051/agro:2004064
94
Sekularac A. Torbica A. Zivancev D. Tomic J. Knezevic D. (2018). The influence of wheat genotype and environmental factors on gluten index and the possibility of its use as bread quality predictor. Genetika (Beograd)50, 85–93. 10.2298/GENSR1801085S
95
Serrago R. A. Alzueta S. avin Slafer G. A. (2013). Understanding grain yield responses to source-sink ratios during grain filling in wheat and barley under contrasting environments. Field Crop. Res.150, 42–51. 10.1016/j.fcr.2013.05.016
96
Sharma S. Singh P. Choudhary O. P. Neemisha (2021). Nitrogen and rice straw incorporation impact nitrogen use efficiency, soil nitrogen pools and enzyme activity in rice-wheat system in north-western India. Field Crop. Res.266, 108131. 10.1016/j.fcr.2021.108131
97
Shearman V. J. Sylvester-Bradley R. Scott R. K. Foulkes M. J. (2005). Physiological processes associated with wheat yield progress in the UK. Crop Sci.45, 175–185. 10.2135/cropsci2005.0175a
98
Shewry P. R. Halford N. G. (2002). Cereal seed storage proteins: Structures, properties and role in grain utilization. J. Exp. Bot.53, 947. 10.1093/jexbot/53.370.947
99
Singh Y.-S. Gupta R. K. Singh G. Singh J. Sidhu H. S. Singh B. (2008). Nitrogen and residue management effects on agronomic productivity and nitrogen use efficiency in rice-wheat system in Indian Punjab. Nutr. Cycl. Agroecosys.84, 141–154. 10.1007/s10705-008-9233-8
100
Slafer G. A. Savin R. Sadras V. O. (2014). Coarse and fine regulation of wheat yield components in response to genotype and environment. Field Crop. Res.157, 71–83. 10.1016/j.fcr.2013.12.004
101
Slimane R. B. Bancal P. Bancal M. (2013). Down-regulation by stems and sheaths of grain filling with mobilized nitrogen in wheat. Field Crop. Res.140, 59–68. 10.1016/j.fcr.2012.10.006
102
Sobczyński G. Studnicki M. Madry W. Wijata M. Gozdowski D. Noras K. et al . (2020). Impact of cultivar and environment soil suitability on the contribution of yield components to grain yield variation in spring wheat. Crop Sci.60, 428–440. 10.1002/csc2.20065
103
Suprayogi Y. Clarke J. M. Bueckert R. Clarke F. R. Pozniak C. J. (2011). Nitrogen remobilization and post-anthesis nitrogen uptake in relation to elevated grain protein concentration in durum wheat. Can. J. Plant Sci.91, 273–282. 10.4141/CJPS10185
104
Tamang B. G. Brasier K. G. Thomason W. E. Griffey C. A. Fukao T. (2017). Differential responses of grain yield, grain protein, and their associated traits to nitrogen supply in soft red winter wheat. J. Plant Nutr. Soil Sci.180, 316–325. 10.1002/jpln.201600312
105
Taulemesse F. Le Gouis J. Gouache D. Gibon Y. Allard V. Yang H. (2015). Post-flowering nitrate uptake in wheat is controlled by N status at flowering, with a putative major role of root nitrate transporter NRT2.1. PLoS ONE10, e120291. 10.1371/journal.pone.0120291
106
Thorwarth P. Piepho H. P. Zhao Y. Ebmeyer E. Schacht J. Schachschneider R. et al . (2018). Higher grain yield and higher grain protein deviation underline the potential of hybrid wheat for a sustainable agriculture. Plant Breed.137, 326–337. 10.1111/pbr.12588
107
Triboi E. Martre P. Girousse C. Ravel C. Triboi-Blondel A. M. (2006). Unravelling environmental and genetic relationships between grain yield and nitrogen concentration for wheat. Eur. J. Agron.25, 108–118. 10.1016/j.eja.2006.04.004
108
Triboi E. Triboi-Blondel A. M. (2002). Productivity and grain or seed composition: a new approach to an old problem-invited paper. Eur. J. Agron.16, 163–186. 10.1016/S1161-0301(01)00146-0
109
Vashisht B. B. Jalota S. K. Ramteke P. Kaur R. Jayeswal D. K. (2021). Impact of rice (O. Sativa L.) straw incorporation induced changes in soil physical and chemical properties on yield, water and nitrogen-balance and -use efficiency of wheat (T. Aestivum L.) in rice–wheat cropping system: Field and simulation studies. Agr. Syst. 194, 103279. 10.1016/j.agsy.2021.103279
110
Wang W. Hao Q. Wang W. Li Q. Chen F. Ni F. et al . (2018). The involvement of cytokinin and nitrogen metabolism in delayed flag leaf senescence in a wheat stay-green mutant, tasg1. Plant Sci.278, 70–79. 10.1016/j.plantsci.2018.10.024
111
Wang Z. Sadras V. O. Hoogmoed M. Yang X. Huang F. Han X. et al . (2017). Shifts in nitrogen and phosphorus uptake and allocation in response to selection for yield in Chinese winter wheat. Crop Past. Sci.68, 807–816. 10.1071/CP17220
112
Williams P. Lindhauer M. G. Poms R. E. Wehling R. L. Bergthaller W. Gaines C. S. (2008). The joint AACC International-ICC methods harmonization project. Cereal Food. World.53, 99–102. 10.1094/CFW-53-2-0099
113
Worland B. Robinson N. Jordan D. Schmidt S. Godwin I. (2017). Post-anthesis nitrate uptake is critical to yield and grain protein content in Sorghum bicolor. J. Plant Physiol.216, 118–124. 10.1016/j.jplph.2017.05.026
114
Wu H. Xiang J. Zhang Y. Zhang Y. Peng S. Chen H. et al . (2018). Effects of post-anthesis nitrogen uptake and translocation on photosynthetic production and rice yield. Sci. Rep.-UK.8, 12811–12891. 10.1038/s41598-018-31267-y
115
Wu W. Li C. Ma B. Shah F. Liu Y. Liao Y. (2014). Genetic progress in wheat yield and associated traits in China since 1945 and future prospects. Euphytica196, 155–168. 10.1007/s10681-013-1033-9
116
Yang H. Mo P. Chen Y. Chen R. Wei T. Xie W. et al . (2021). Genetic progress in grain yield radiation and nitrogen use efficiency of dryland winter wheat in Southwest China since 1965: progress and prospect for improvements. Crop Sci.61, 4255–4272. 10.1002/csc2.20608
117
Zhang H. Richards R. Riffkin P. Berger J. Christy B. O Leary G. et al . (2019). Wheat grain number and yield: The relative importance of physiological traits and source-sink balance in Southern Australia. Eur. J. Agron.110, 125935. 10.1016/j.eja.2019.125935
118
Zhang R. Yu Z. Zhang Y. Shi Y. Zhao J. (2017). Effects of supplemental irrigation by by measuring soil moisture on water consumption characteristics and radiation utilization in wheat. Ying Yong Sheng Tai Xue Bao.28, 877–884.
119
Zhang X. Xiao G. Bol R. Wang L. Zhuge Y. Wu W. et al . (2021). Influences of irrigation and fertilization on soil N cycle and losses from wheat–maize cropping system in northern China. Environ. Pollut.278, 116852. 10.1016/j.envpol.2021.116852
120
Zhao X. Nie X. Xiao X. Yang H. (2013). Over-expression of a tobacco nitrate reductase gene in wheat (Triticum aestivum L.) increases seed protein content and weight without augmenting nitrogen supplying. PLoS ONE8, e74678. 10.1371/journal.pone.0074678
Summary
Keywords
grain yield, grain protein content (GPC), gluten index, nitrogen use efficiency (NUE), genetic selection
Citation
Chen Y, Wang K, Chen H, Yang H, Zheng T, Huang X and Fan G (2022) Simultaneously genetic selection of wheat yield and grain protein quality in rice–wheat and soybean–wheat cropping systems through critical nitrogen efficiency-related traits. Front. Plant Sci. 13:899387. doi: 10.3389/fpls.2022.899387
Received
18 March 2022
Accepted
29 August 2022
Published
29 September 2022
Volume
13 - 2022
Edited by
Adnan Noor Shah, Khwaja Fareed University of Engineering and Information Technology (KFUEIT), Pakistan
Reviewed by
Ralf Uptmoor, University of Rostock, Germany; Baizhao Ren, Shandong Agricultural University, China; M. Fernanda Dreccer, Commonwealth Scientific and Industrial Research Organisation (CSIRO), Australia
Updates
Copyright
© 2022 Chen, Wang, Chen, Yang, Zheng, Huang and Fan.
This is an open-access article distributed under the terms of the Creative Commons Attribution License (CC BY). The use, distribution or reproduction in other forums is permitted, provided the original author(s) and the copyright owner(s) are credited and that the original publication in this journal is cited, in accordance with accepted academic practice. No use, distribution or reproduction is permitted which does not comply with these terms.
*Correspondence: Gaoqiong Fan fangao20056@126.comHongkun Yang yhk159357@163.com
†These authors have contributed equally to this work
This article was submitted to Crop and Product Physiology, a section of the journal Frontiers in Plant Science
Disclaimer
All claims expressed in this article are solely those of the authors and do not necessarily represent those of their affiliated organizations, or those of the publisher, the editors and the reviewers. Any product that may be evaluated in this article or claim that may be made by its manufacturer is not guaranteed or endorsed by the publisher.