 Jing Wu1†
 Lili Mao1†
 Jincai Tao1,2†
 Xiuxiu Wang1†Haijun Zhang1Ming Xin1Yongqi Shang1Yanan Zhang1Guihua Zhang3Zhongting Zhao3Yiming Wang1Mingshuo Cui1Liming Wei1
 Xianliang Song1*Xuezhen Sun1*
- 1State Key Laboratory of Crop Biology, Agronomy College, Shandong Agricultural University, Taian, China
- 2State Key Laboratory of Crop Stress Biology for Arid Areas, College of Agronomy, Northwest Agriculture and Forestry University, Xianyang, China
- 3Heze Academy of Agricultural Sciences, Heze, China
Plant height (PH) is a key plant architecture trait for improving the biological productivity of cotton. Ideal PH of cotton is conducive to lodging resistance and mechanized harvesting. To detect quantitative trait loci (QTL) and candidate genes of PH in cotton, a genetic map was constructed with a recombinant inbred line (RIL) population of upland cotton. PH phenotype data under nine environments and three best linear unbiased predictions (BLUPs) were used for QTL analyses. Based on restriction-site-associated DNA sequence (RAD-seq), the genetic map contained 5,850 single-nucleotide polymorphism (SNP) markers, covering 2,747.12 cM with an average genetic distance of 0.47 cM. Thirty-seven unconditional QTL explaining 1.03–12.50% of phenotypic variance, including four major QTL and seven stable QTL, were identified. Twenty-eight conditional QTL explaining 3.27–28.87% of phenotypic variance, including 1 major QTL, were identified. Importantly, five QTL, including 4 stable QTL, were both unconditional and conditional QTL. Among the 60 PH QTL (including 39 newly identified), none of them were involved in the whole period of PH growth, indicating that QTL related to cotton PH development have dynamic expression characteristics. Based on the functional annotation of Arabidopsis homologous genes and transcriptome data of upland cotton TM-1, 14 candidate genes were predicted within 10 QTL. Our research provides valuable information for understanding the genetic mechanism of PH development, which also increases the economic production of cotton.
Introduction
As the most important natural textile fiber, cotton (Gossypium spp.) supplies about 35% of global fiber consumption, which is also used to make feed and oilseeds, and upland cotton (Gossypium hirsutum L.) accounts for more than 90% of global cotton production (Chen et al., 2007; Wang et al., 2015; Zhang et al., 2015; Ma et al., 2018b). Cotton production is a part of the cash crop industry (Li, 2021). With the change of the cotton industry trade situation and the promotion of mechanization, it is very important to cultivate high-yield and good-quality cotton varieties. Plant architecture breeding can effectively increase cotton yield and improve the fiber quality, thereby affecting the economic production of cotton (Li et al., 1998, 2015; Song and Zhang, 2009; Shang et al., 2015b; Fu et al., 2019). Plant architecture refers to the three-dimensional structure of the aerial part of the plant, which is a comprehensive agronomic trait, including many factors such as PH, fruit branch number, angle between stem and fruit branch, morphological characters and distribution of boll and leaf, and so forth (Yang et al., 1996; Wang and Li, 2006; Wu et al., 2021). It is worth noting that the Green Revolution that emerged in the 1960s changed the plant architecture by transferring dwarf genes into crops, resulting in a significant increase in yields (Khush, 2001). For example, reducing PH enhanced resistance and significantly increased yield of wheat and rice (Peng et al., 1999; Sasaki et al., 2002). Besides, using the compact and medium dwarf corn varieties increased planting density and significantly improved the production (Peiffer et al., 2014).
Plant height (PH) is a main factor affecting the plant architecture (Jiao et al., 2010; Zhang et al., 2019). In addition, the appropriate PH of cotton (80–90 cm) is also beneficial for lodging resistance and mechanical harvesting (Chen, 2013; Pei et al., 2021). Therefore, a study on PH of cotton will be helpful for cotton plant architecture breeding. However, PH is a quantitative trait controlled by multiple genes and affected by the environment easily (Cui et al., 2011; Wurschum et al., 2015; Liu et al., 2018). With the rapid development of molecular marker technology, the molecular genetic mechanism of quantitative trait can be studied by the linkage analysis and association analysis. QTL-seq and QTL mapping techniques were used to identify the main PH QTL on the A10 chromosome in two F2 populations of Brassica napus (Dong et al., 2021). In maize, a major QTL controlling PH was mapped by three different methods, including genome wide association study (GWAS), and was located in a 600 kb region (Pan et al., 2017). In wheat, seven stable PH QTL were detected on six chromosomes, among which QPht.cau-3D1 explaining 28.36–38.08% of phenotypic variance was stable QTL (Chen et al., 2020). In rice, a PH QTL qPH7-2 explaining 36.77–56.82% of phenotypic variance was detected in an RIL population under three environments (Lei et al., 2018). The molecular genetic mechanism of cotton PH is mainly studied by the linkage analysis. Fourteen PH QTL were identified on 11 chromosomes of an upland cotton F2 population, with 9.64% of the contribution rate of qPH-D12-1 (Jia et al., 2021). A stable QTL qPH-Dt1-1, as well as a gene GhPIN3 regulating cotton PH, was identified in an interspecific G. hirsutum × G. barbadense BIL population using the SLAF-seq technology (Ma et al., 2019). Twenty-seven PH QTL were mapped on 18 chromosomes using an RIL population of upland cotton, with 3.81–8.54% of phenotypic variance (Liu et al., 2018). In addition, naturally dwarfing cotton mutants are very important for identifying PH genes of cotton. A gene EXTR-DWARF related to dwarfing was screened from a natural dwarf mutant of cotton (Ji, 2018).
Cotton PH QTL previously reported were mainly mapped on phenotypic PH data of mature plants, which largely ignored the dynamic development process of PH. The net effect of QTL expression in the time period from t-1 to t may be evaluated based on the time-related genetic model of quantitative traits (Zhu, 1995). Forty-one unconditional QTL and 23 conditional QTL were detected using an intraspecific recombinant inbred line population of upland cotton, and some QTL could not be detected at the later stage of maturity (Shang et al., 2015b). Recently, thirty-two unconditional QTL and 24 conditional QTL for PH were detected using an intraspecific testcross population of upland cotton (Ma et al., 2018a). These results indicated that the expression of PH QTL during plant growth has temporal characteristics.
At present, there are relatively few studies on the dynamic QTL mapping of cotton PH. In this study, unconditional QTL and conditional QTL for PH in different environments and developmental stages were detected, and candidate genes affecting PH development in cotton were predicted. Our results shed substantial light on the genetic basis of cotton PH, will lay a foundation for further functional verification of candidate genes, and enable molecular selection toward ideal plant architecture.
Materials and Methods
Plant Materials
An F2:7 RIL population, containing 201 lines coming from an intraspecific upland cotton cross of WCT-4 (female) × NK-4 (male), was constructed using a single seed descent method. The WCT-4 has short PH and super fiber quality, and the NK-4 is tall with average fiber quality. Both parents were developed by the Cotton Breeding & Cultivation team of Shandong Agricultural University. The WCT-4 is a strain from the cross of Shannong269//(Bersiruo/Xinhai2hao) F4. The NK-4 is a strain from the cross Shannong6/Shiyuan321//shannong6. The RIL population with two parents were grown in nine environments across two locations and 5 years in Shandong Province, China, including Heze from 2017 to 2021 (17HZ, 18HZ, 19HZ, 20HZ, 21HZ), and Dezhou from 2018 to 2021 (18DZ, 19DZ, 20DZ, and 21DZ). The materials planting followed a randomized complete block design with two replications at each location under all environments. Each replicate had one row of 5 m. The row width and average plant space were 0.9 and 0.23 m in HZ in all 5 years and were 0.8 and 0.25 m in DZ in all 4 years. Planting dates for all environments were April 24–28. Local cultivation management methods were used in each location.
Phenotypic Measurements and Analysis
Plant height refers to the length from the cotyledonary node to the main stem growth point. Dynamic PH was investigated four times during cotton growth, with an interval of about 10 days, in all environments except for in 17HZ, 19DZ, 21HZ, and 21DZ, of which only three times array were carried out. The investigation time points were t1: June 25th, t2: July 5th, t3: July 15 in 19DZ, 21HZ, and 21DZ, and t2: July 5th, t3: July 15th, t4: July 25th in 17HZ, and t1: June 25, t2: July 5, t3: July 15, t4: July 25 in other environments. △t1-2 referred to the net increase of PH between t1 and t2, △t2-3 was the net increase of PH from t2 to t3, and △t3-4 was the net increase of PH from t3 to t4.
The descriptive data of RIL population PH traits were sorted out and calculated by IBM SPSS Statistics 25. Trait variance and generalized heritability (H2) were calculated with the QTL IciMapping 4.2 (Meng et al., 2015; Ma et al., 2019). Generalized heritability above 40%, between 20 and 40%, and less than 20% were regarded as high, medium, and low heritability, respectively (Wang et al., 2018).
Genetic Map Construction
Sample DNA was extracted using a plant genomic DNA extraction kit. SNP markers were developed through RAD-seq at ROI-BIO Co., Ltd. The parental NK-4 and WCT-4 obtained 41.09 and 38.94 Gb clean reads, respectively. For each RIL line, 2.22–15.68 Gb clean reads were obtained. The genetic map was constructed with an RIL population (F2:8 generation), and the SNP markers were filtered according to the sequencing results. First, the parental heterozygous markers, no polymorphic markers between the two parents, the bi-allelic markers, and the markers with a deletion rate of greater than 50% were eliminated. Then, the linkage group was constructed on the LOD value, and then the markers that were too far to be used to construct the genetic map were deleted. The genetic map was constructed with the Kosambi mapping function in JoinMap 4.0 (Ooijen, 2006) and created by MapChart 2.2 (Voorrips, 2002). The TM-1 genome sequence of Zhejiang University (Hu et al., 2019) was downloaded from the CottonFGD.1 TBtools was used to extract the genome chromosome length information and draw the collinearity relationship diagram (Chen et al., 2018). IBM SPSS Statistics 25 was used to calculate the Spearman coefficient.
Quantitative Trait Loci Analysis
The PH data of the RIL population under nine environments and their BLUPs (named as BLUP3) across all the tests were used for QTL analysis. Two other BLUPs, namely, BLUP1 for HZ experimental site and BLUP2 for DZ site, were also estimated and used for QTL analysis to detect specific QTL of the experimental site. The lme4 package in the R software was used to estimate the BLUPs (de Los Campos et al., 2013; Huang et al., 2017). Unconditional QTL was the cumulative effect from the initial time to t (Liu, 2011), which was detected by t1, t2, t3, and t4, respectively. The net genetic effect of PH increase from t-1 to t was revealed by the conditional genetic analysis (Zhu, 1995). The growth of PH in the past adjacent time period (△t1-2, △t2-3, and △t3-4) were used to identify conditional QTL. Consistent QTL were determined by integrating unconditional QTL and conditional QTL. QTL were identified based on the PH value of nine environments and three BLUPs by the ICIM-ADD method in QTL IciMapping 4.2 (Meng et al., 2015), with 1 cM of the parameter step value, 0.05 value of P of type I error, and 0.01 value of the PIN; meanwhile, the threshold was calculated in 1,000 permutations for each trait. The QTL confidence interval (95%) was set as the mapping distance interval corresponding to reduce 1 LOD on either side of the peak (Yu et al., 2012; Liu et al., 2019). When the QTL confidence intervals partially or completely overlap, it was regarded as the same QTL. QTL detected in two or more tests or environments with LOD value greater than 2.5 and phenotypic variation explanation rate greater than 10% were defined as major QTL. It was regarded as stable QTL, which was detected in at least three environments (Sun et al., 2012; Fan et al., 2015; Liu et al., 2018). The name of QTL starts with q, followed by the trait name, chromosome, and QTL number (McCouch et al., 1997), and the names of unconditional QTL and conditional QTL were respectively prefixed with U and C. If a conditional QTL shared confidence interval with an unconditional QTL, these two QTL were renamed as one QTL without prefixed both U and C in the name. The QTL were displayed on the genetic map by MapChart 2.2 (Voorrips, 2002). GraphPad Prism 9 was used to do boxplot of QTL with phenotypic data of BLUP3. The positive additive effect of QTL indicated that the positive allele was derived from the female parent WCT-4; otherwise, the positive allele was derived from the male parent NK-4.
Candidate Gene Analysis
To annotate the gene function, we used the COTTONOMICS database2 to extract candidate genes from the confidence intervals of QTL with large effect. TBtools and omicstudio3 were used to do the Gene Ontology (GO) enrichment analysis on genes, while novomagic4 was utilized to perform the Kyoto Encyclopedia of Genes and Genomes (KEGG) analysis on genes. To uncover the general expression patterns of candidate genes, the transcriptome data of TM-1 roots, stems, and leaves were used as a reference (Hu et al., 2019). TBtools was used to create the genes expression heatmap (Chen et al., 2018).
Results
Plant Height Variation of Parents and the Recombinant Inbred Line Population
The PH of male parent NK-4 was higher than that of female parent WCT-4 at all the time points (i.e., t1, t2, t3, and t4) and most time periods (18/23) in the nine environments. The PH of the RIL population showed a two-way transgressive segregation in all time points under all environments except for the t1 in 17HZ with a one-way transgressive segregation (Table 1). The values of skewness and kurtosis in each environment were close to 0, and the PH of the RIL population showed a normal distribution. Under the nine environments, the PH of the parents and RIL population increased rapidly in the △t1-2 and △t2-3, with an average growth of 19.48 and 13.90 cm, and slowed down in the △t3-4, with an average increase of 5.97 cm (Table 1). The results showed that the PH of parents and RIL population had dynamic developmental characteristics. The analysis of ANOVA on the RIL population showed that the environment, genotype, and genotype × environment had significant variations on PH at t1, t2, t3, and t4 (P < 0.01) (Supplementary Table 1). Furthermore, the generalized heritability estimates (H2) were 78.19, 83.62, 85.57, and 84.78% at t1, t2, t3, and t4, respectively, suggesting that PH was highly heritable in this RIL population (Supplementary Table 1).
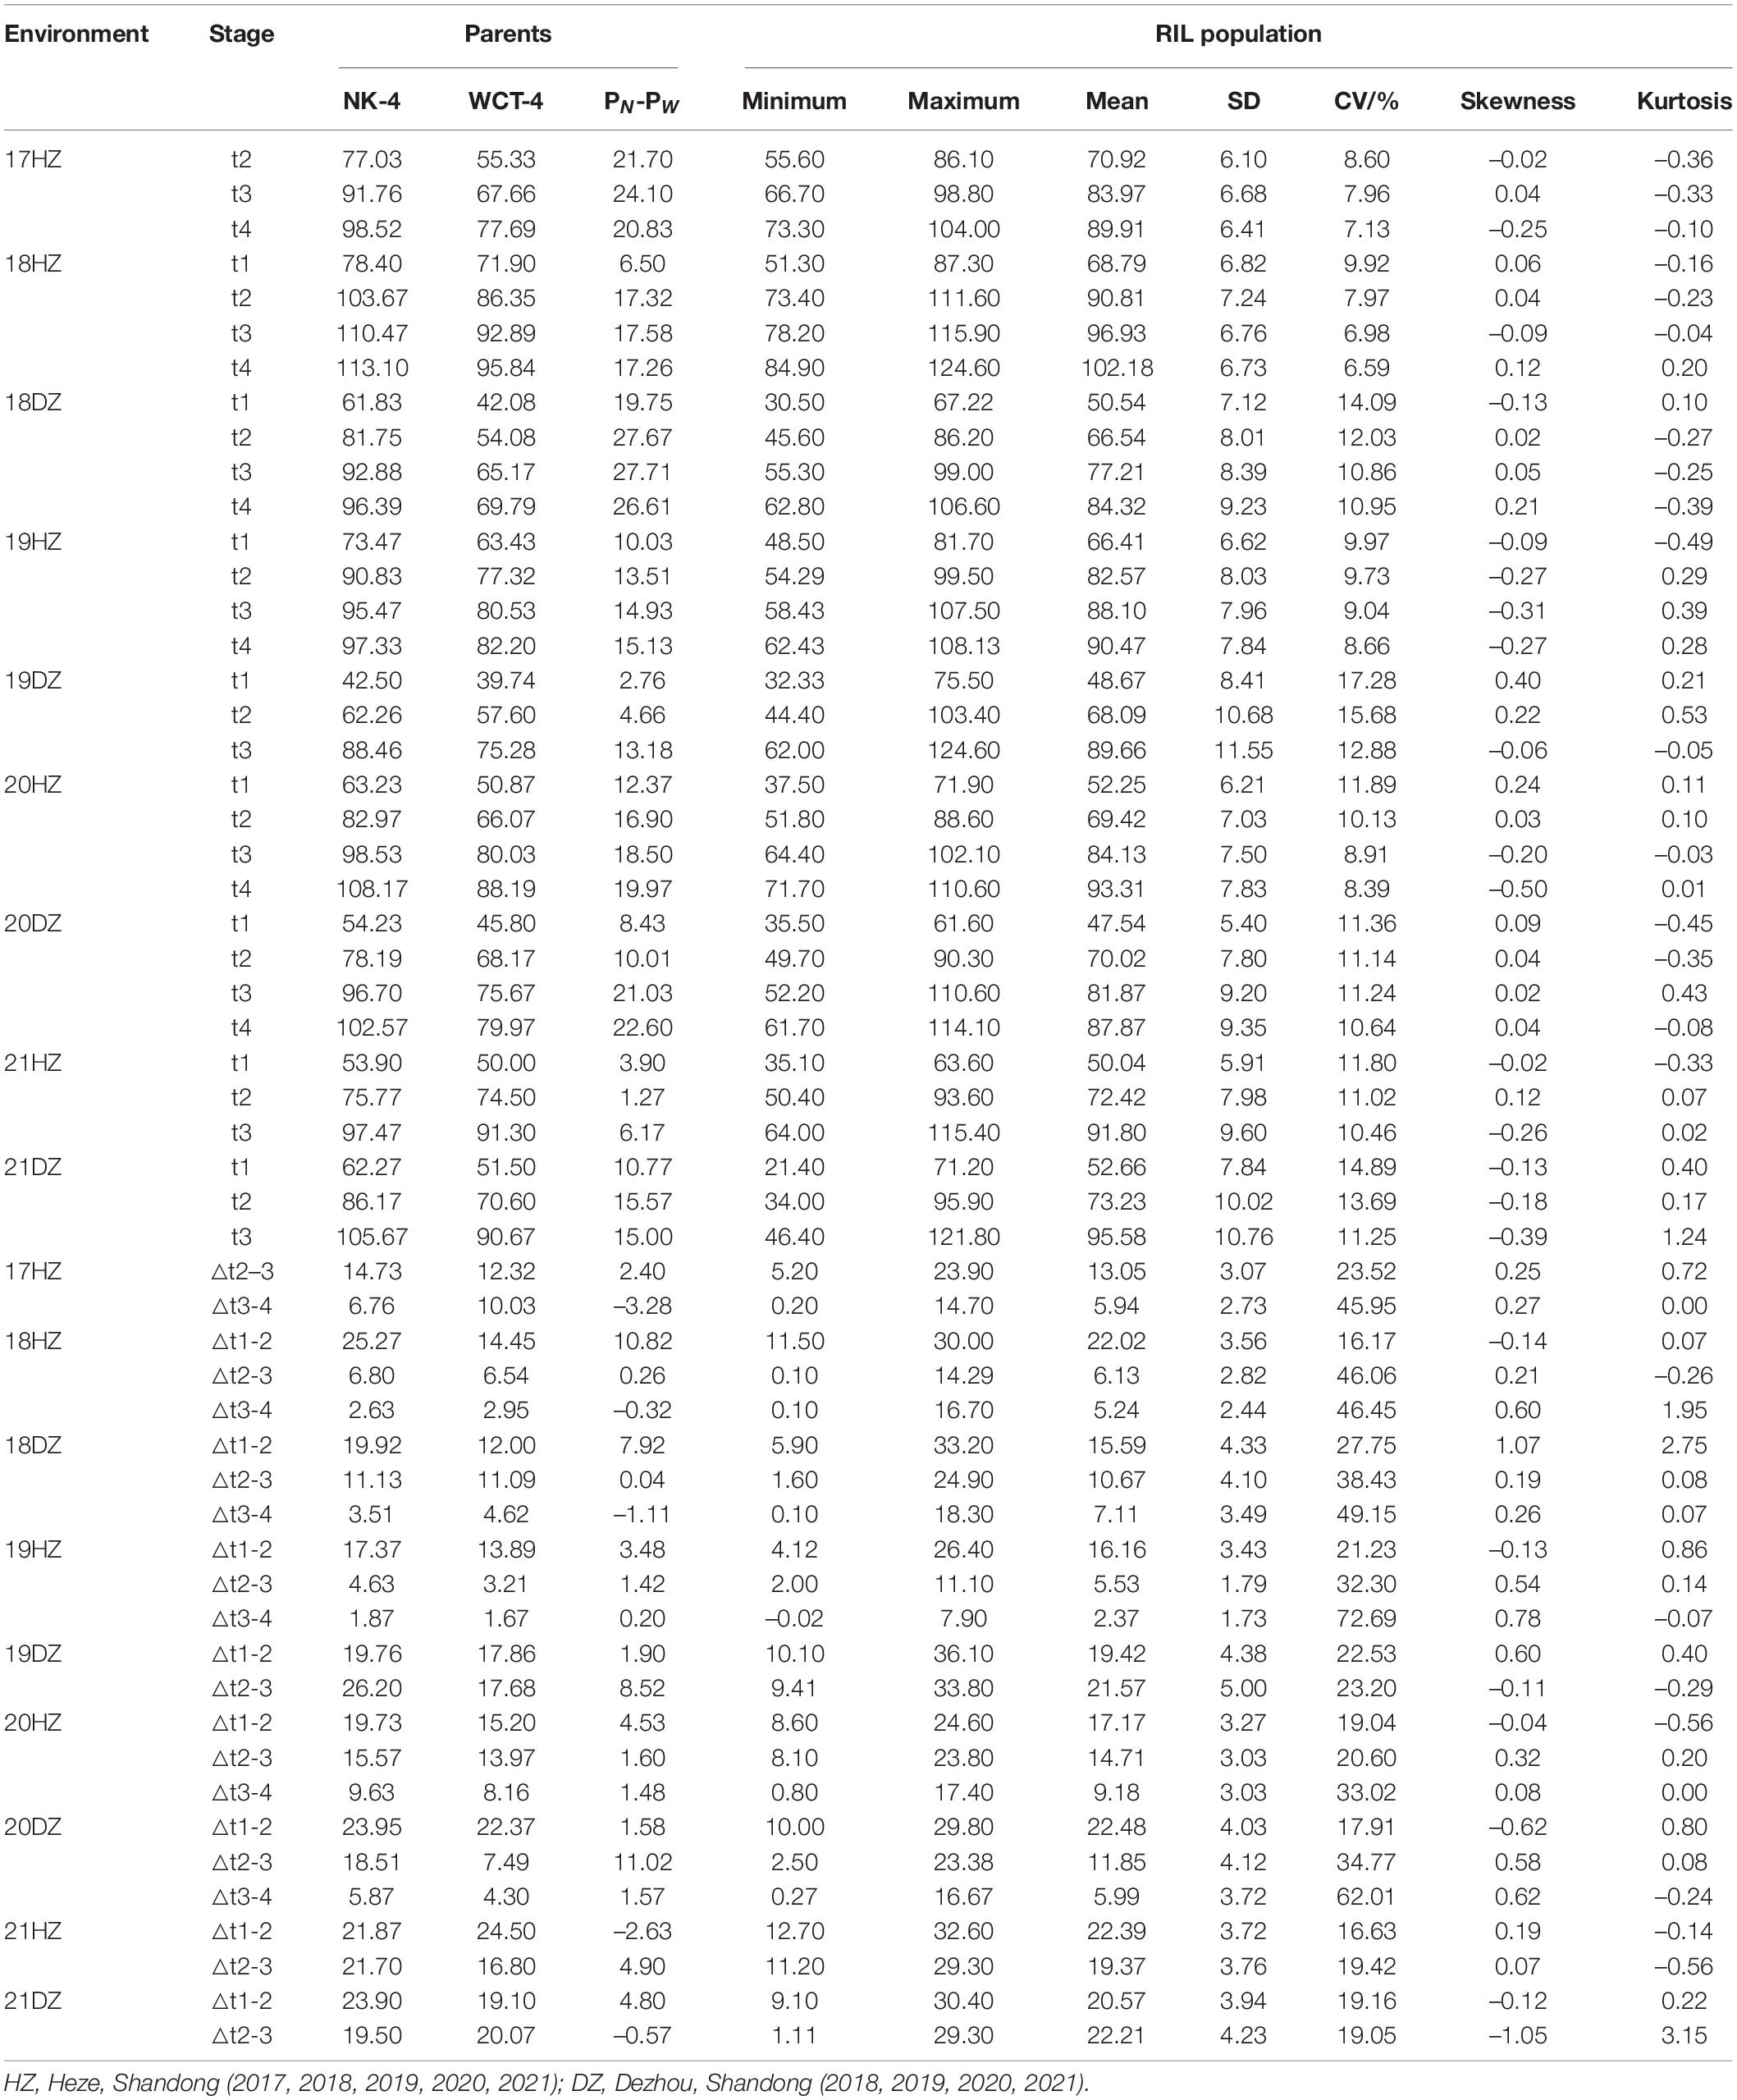
Table 1. Plant height performance of recombinant inbred lines (RILs) and their parents.
Genetic Map Construction
By comparing the RAD-seq sequencing results with the reference genome of TM-1, a total of 555,699 SNP markers were obtained. According to the genotyping criteria, SNP marker filtering was performed. First, 87,613 SNP markers remained after filtering out SNP markers that were heterozygous and non-polymorphic between parents, and then, 87,596 SNP markers remained after filtering out SNP markers of diallelic sites. Finally, after filtering out SNP markers with a deletion rate greater than 50%, 10,054 SNP markers were used for genetic map construction (Supplementary Table 2). A high-density genetic map of 5,850 SNP markers was consequently constructed. The genetic map included 52 linkage groups (LGs), and A13 contained the most SNP markers (1,067), followed by D01 (730) (Supplementary Table 3). The total length of the genetic map was 2,747.12 cM with an average genetic distance of 0.47 cM between adjacent markers (Figure 1 and Supplementary Table 3). The longest LG was D07-1, which spanned 162.45 cM and contained 290 SNP markers with an average of 0.56 cM. The shortest LG was D11-1, which spanned 6.21 cM and contained 26 SNP markers with an average of 0.24 cM.
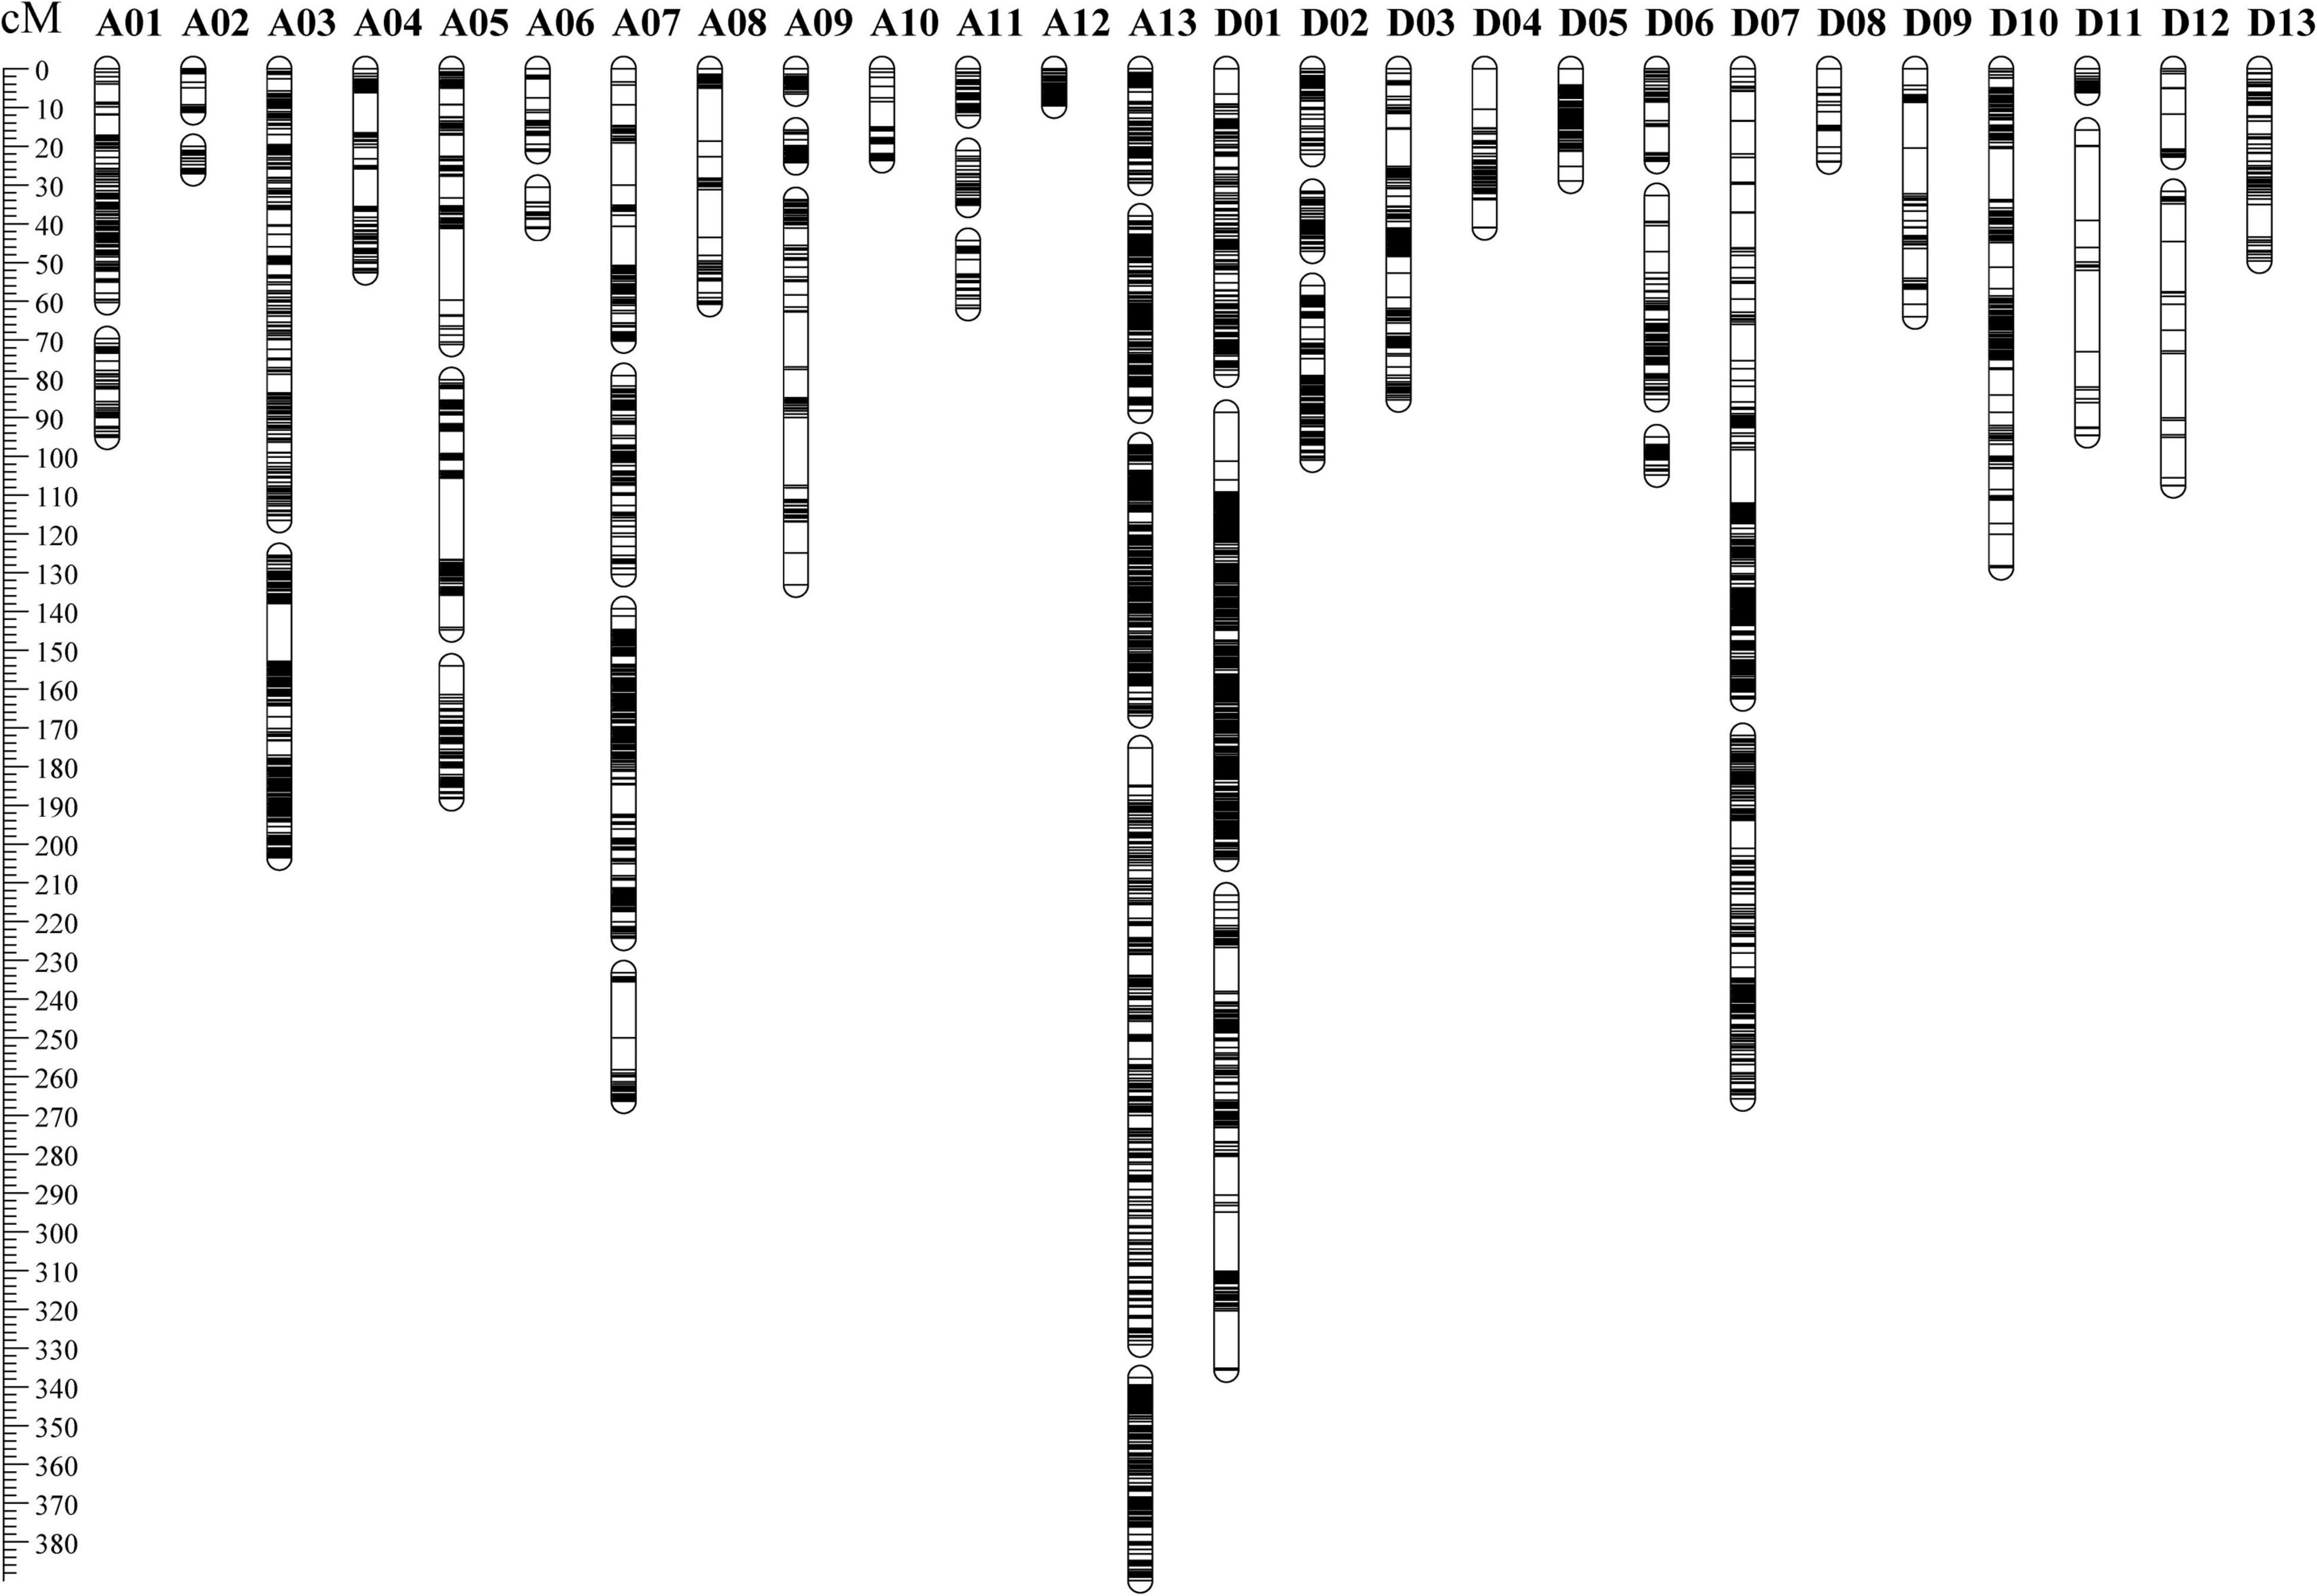
Figure 1. The distribution of polymorphic markers in the genetic map constructed by the recombinant inbred line population.
Among the 52 LGs, 24 LGs had Spearman coefficient greater than 0.80, and 26 LGs had Spearman coefficient greater than 0.70 (Supplementary Table 3). Spearman coefficient of each LG was found to have an average value of 0.80, indicating a high degree of collinearity between the genetic map and the physical map. It indicated that the order of most markers in the genetic map was consistent with the order in the physical map, according to the collinearity analysis based on the physical location on the TM-1 reference genome and the position in the linkage group of the genetic map (Figure 2 and Supplementary Table 3).
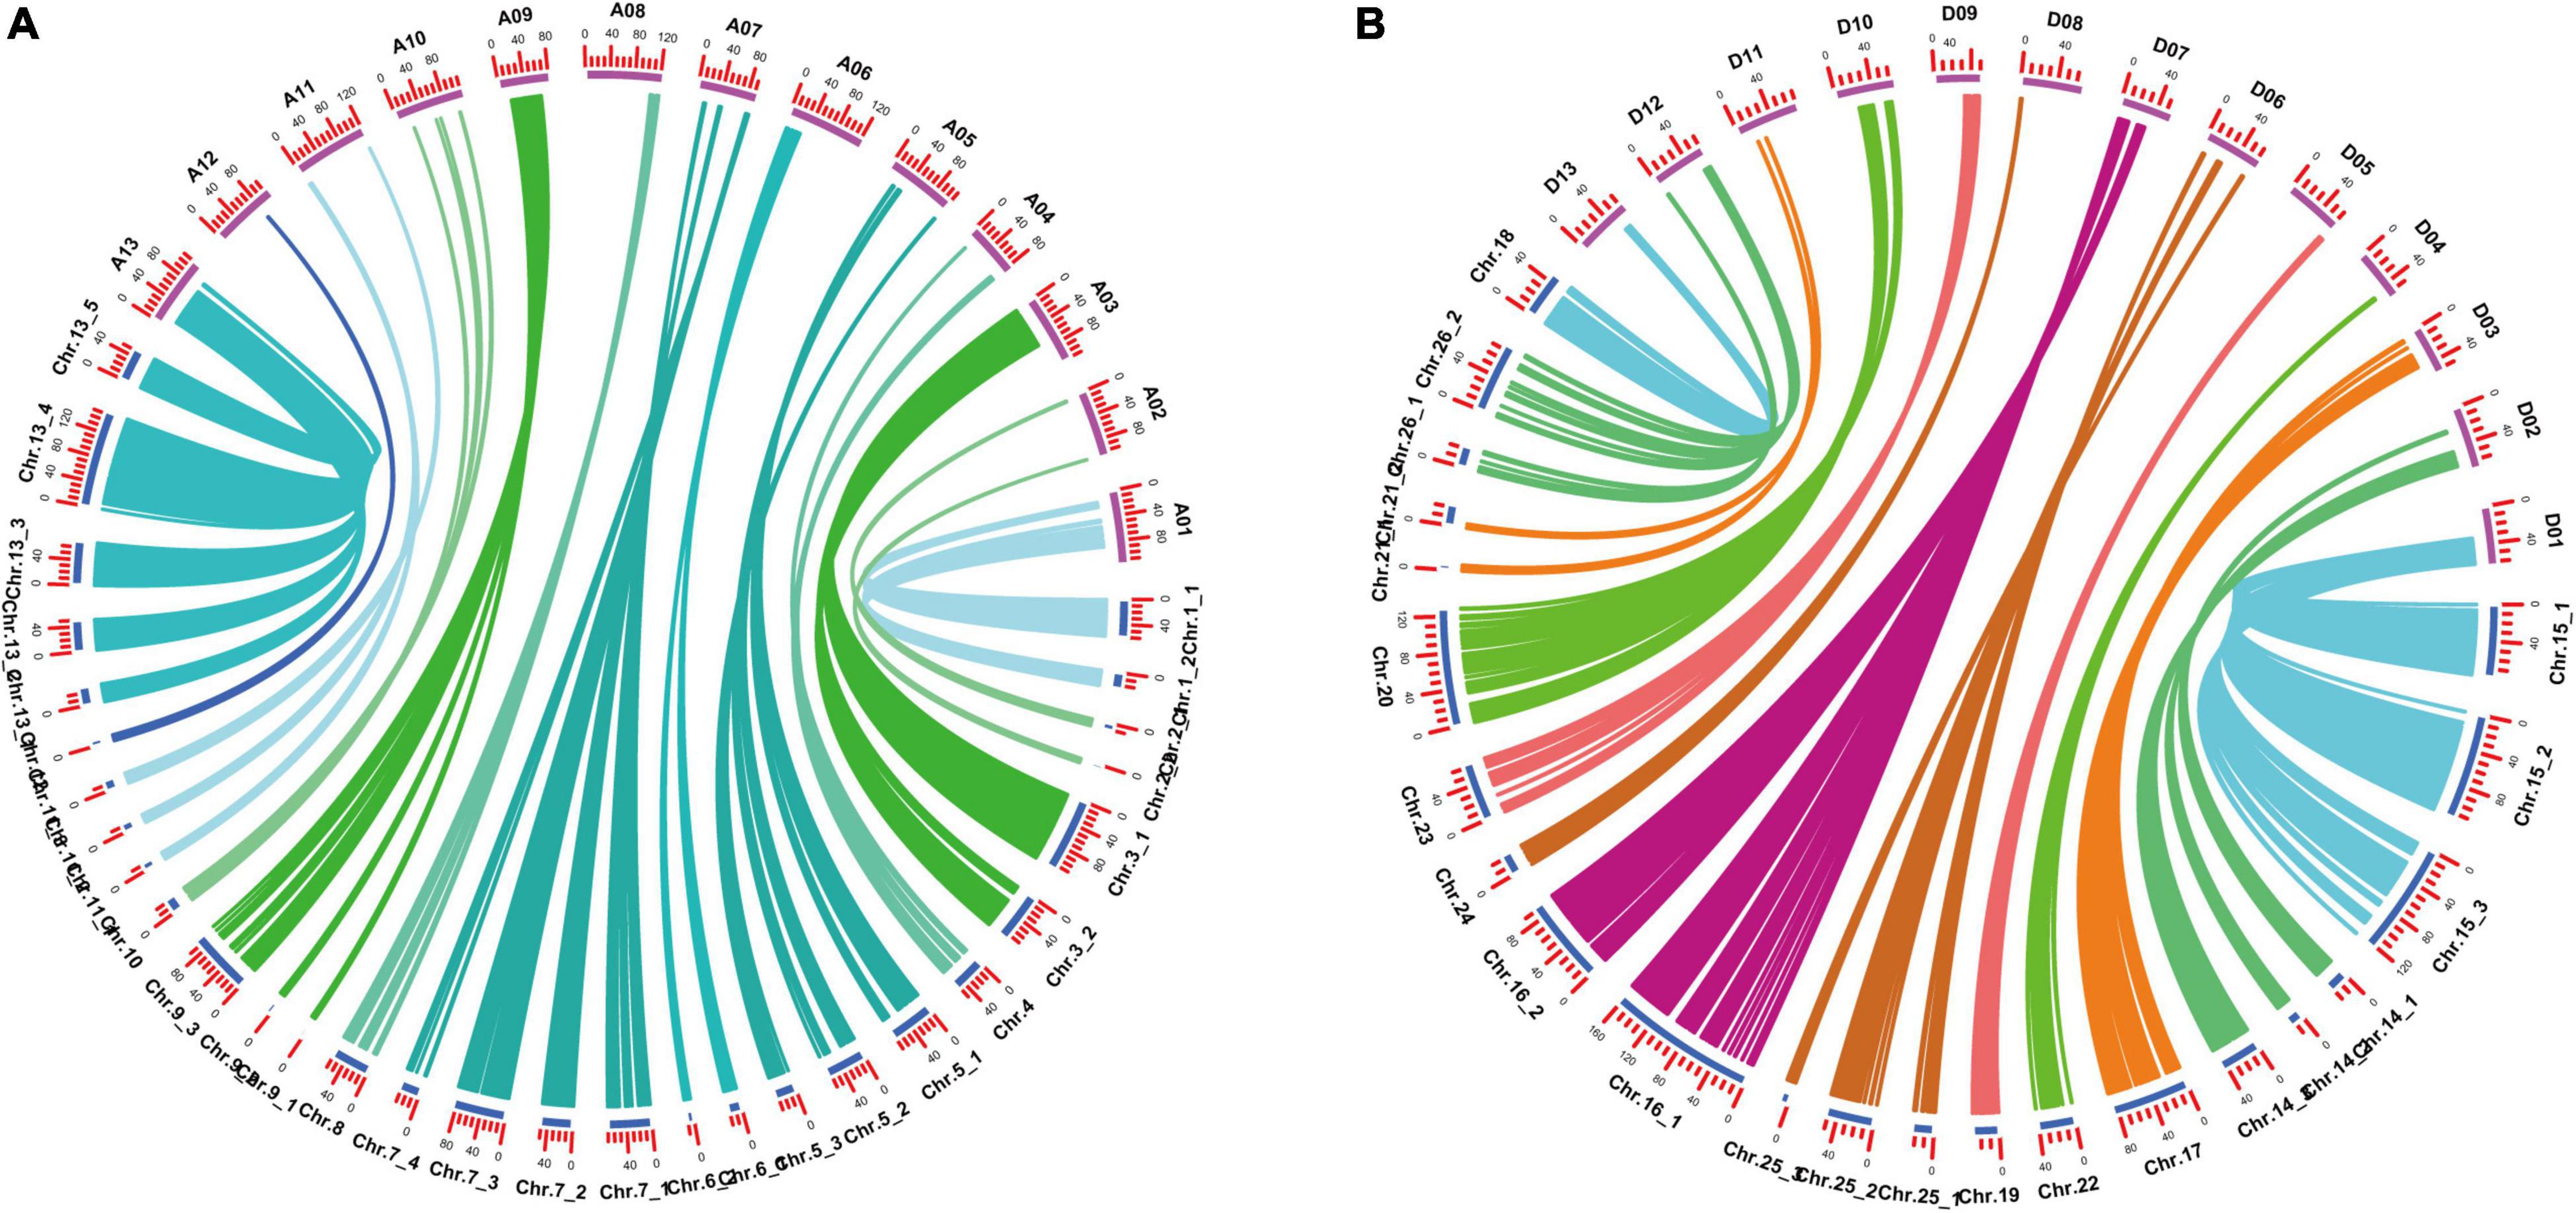
Figure 2. Collinearity analysis of genetic map and physical map. (A) A subgenomic chromosome collinearity. (B) D subgenomic chromosome collinearity.
Unconditional Quantitative Trait Loci Mapping
In total, 12 sets of phenotypic data of PH, including phenotypic data from nine testing environments and three BLUPs (i.e., BLUP1, BLUP2, and BLUP3) were used to detect QTL. At four time points (i.e., t1, t2, t3, and t4), a total of 37 unconditional QTL (20 on the A subgenome and 17 on the D subgenome) were identified on 14 chromosomes, and each QTL explained 1.03–12.50% of phenotypic variance with LOD value varying from 3.33 to 27.26 (Supplementary Table 4). Among the 37 QTL, WCT-4 contributed positive additive alleles for 19 QTL, while NK-4 provided positive additive alleles for the rest 18 QTL. Importantly, 7 QTL (i.e., UqPH-A03-1, UqPH-A03-3, UqPH-A08-2, UqPH-A09-1, UqPH-D02-1, UqPH-D09-2, and UqPH-D11-1) were simultaneously detected at least in 3 tests and considered to be stable QTL (Table 2 and Figure 3). Moreover, other 30 QTL were identified in one or two tests, including four major QTL (i.e., UqPH-A11-2, UqPH-D07-2, UqPH-D09-1, and UqPH-D13-2). There were 16, 24, 19, and 14 QTL detected at t1, t2, t3, and t4, respectively, suggesting that there were different QTL at different stages of PH development.
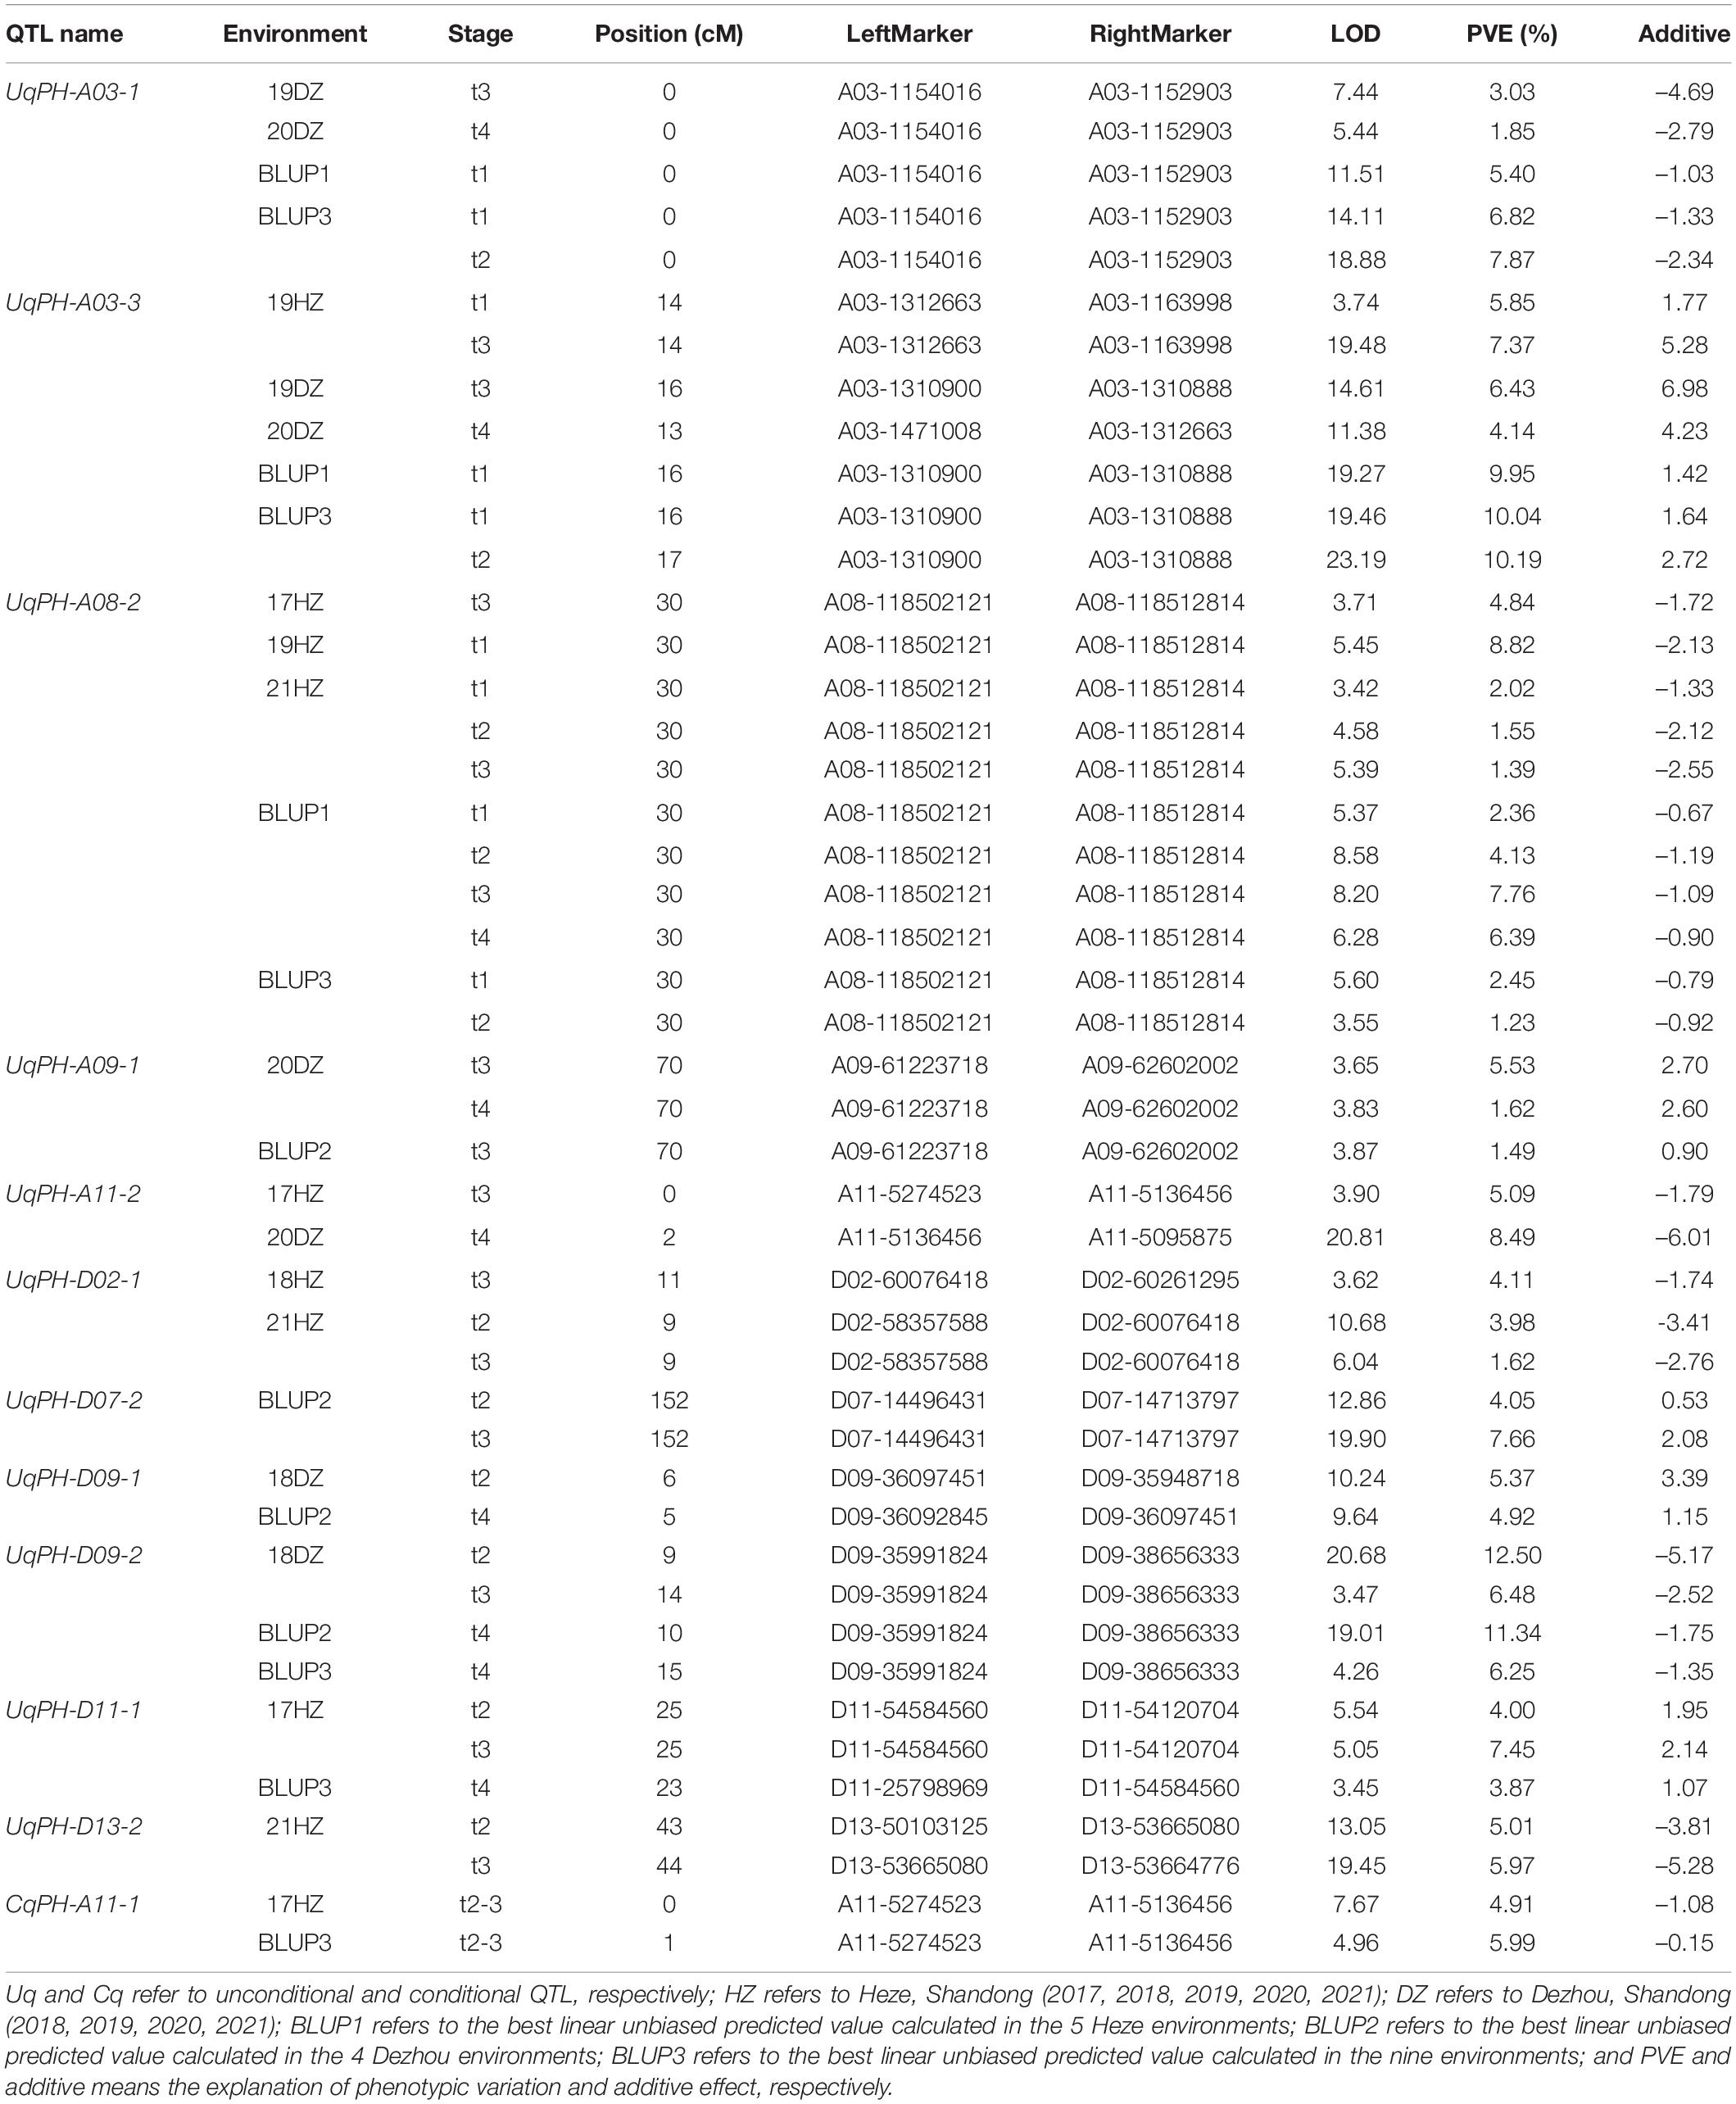
Table 2. Major and stable quantitative trait loci (QTL) detected for plant height in different environments.
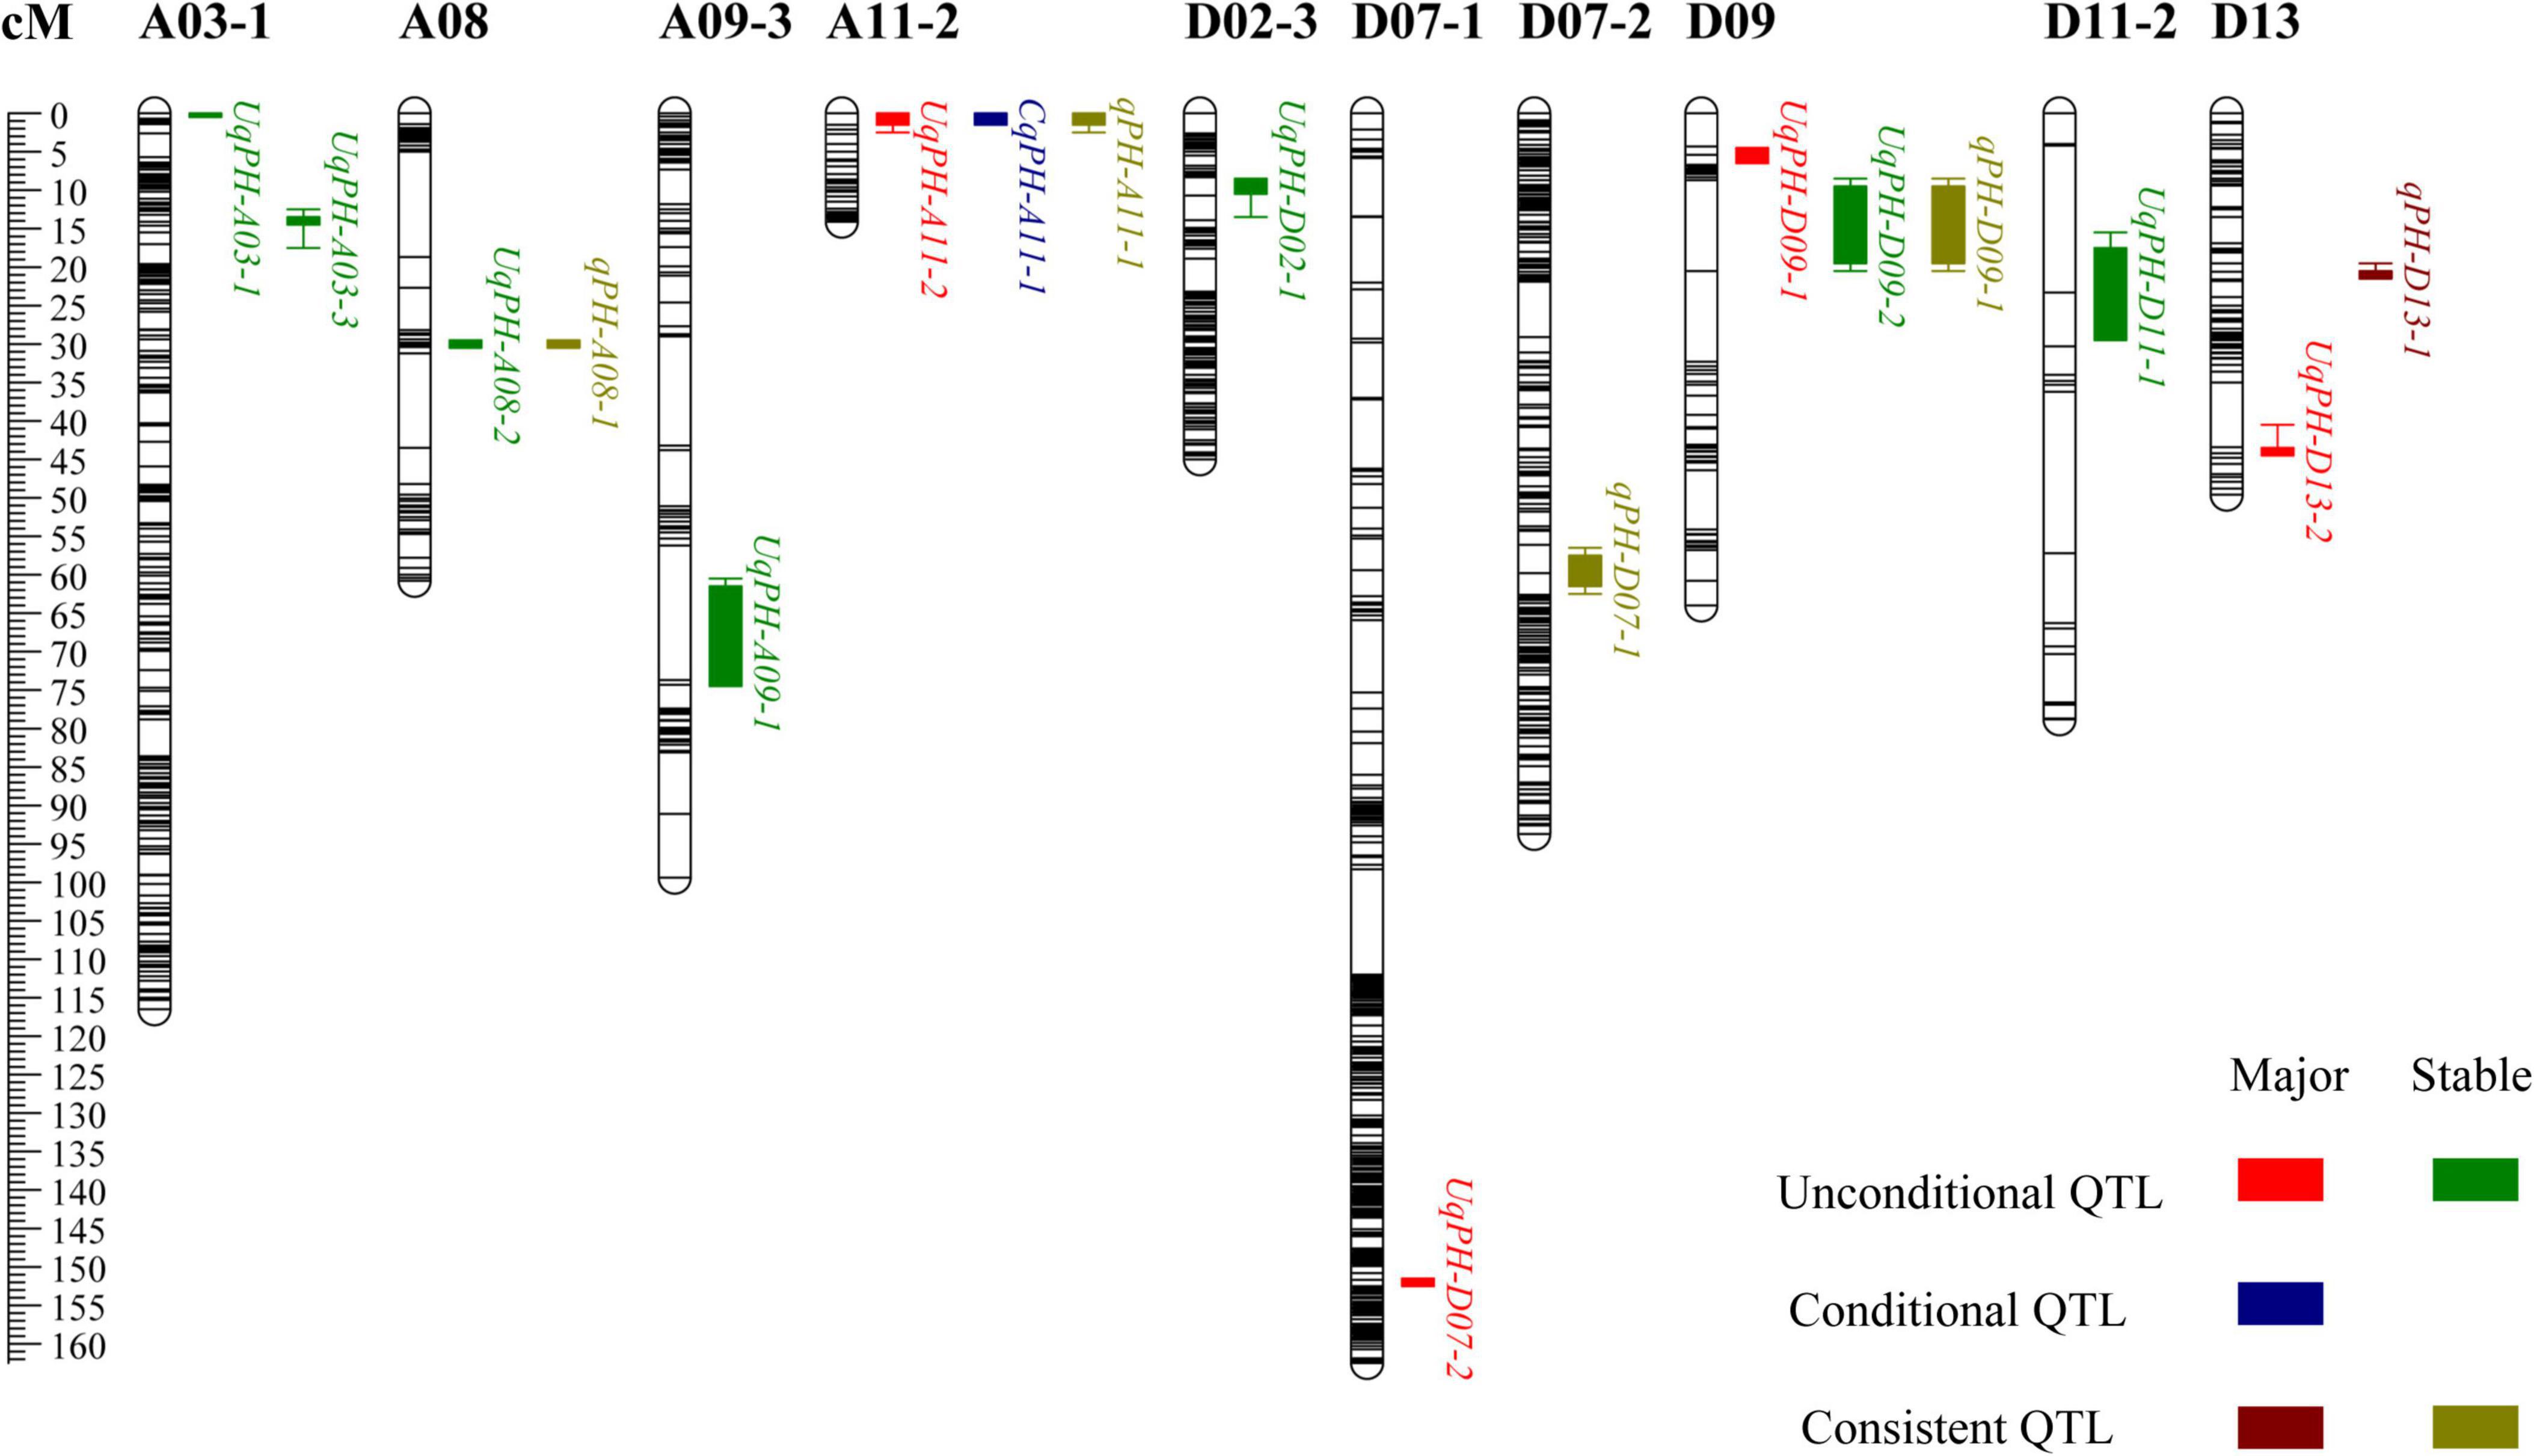
Figure 3. The chromosome-wise distribution of plant height quantitative trait loci (QTL).
Conditional Quantitative Trait Loci Mapping
In 3 time periods (i.e., △t1-2, △t2-3, and △t3-4) across the 12 sets of phenotypic data of PH, a total of 28 conditional QTL were identified on 17 chromosomes, which explained 3.27–28.87% of phenotypic variance with LOD value ranging from 3.18 to 28.78 (Supplementary Table 5). Among the 28 QTL, 13 and 15 QTL were detected on the A subgenome and the D subgenome, respectively. The alleles from WCT-4 for 15 QTL had positive additive effects on PH, while alleles from NK-4 for other 13 QTL had positive additive effects on PH. Furthermore, CqPH-A11-1 was identified in 2 tests as the major QTL explaining 4.91–5.99% of phenotypic variance with an LOD value ranging from 4.96 to 7.67 (Table 2 and Figure 3). Seven QTL and 23 QTL were detected in △t1-2 and △t2-3, respectively, and no QTL was detected in △t3-4, indicating that conditional QTL were more positively expressed in △t2-3.
Consistent Quantitative Trait Loci Mapping
By compared 37 unconditional QTL with 28 conditional QTL, 5 QTL (i.e., qPH-A08-1, qPH-A11-1, qPH-D07-1, qPH-D09-1, and qPH-D13-1) shared overlapping or common confidence intervals and were regarded as consistent QTL (Table 3 and Figure 3). In summary, a total of 60 QTL (31 on the A subgenome and 29 on the D subgenome) were identified across the 12 sets of phenotypic data of PH (Supplementary Table 6). In addition, no QTL could be detected at all stages in the same environment, which accorded with the characteristics of PH dynamic development.
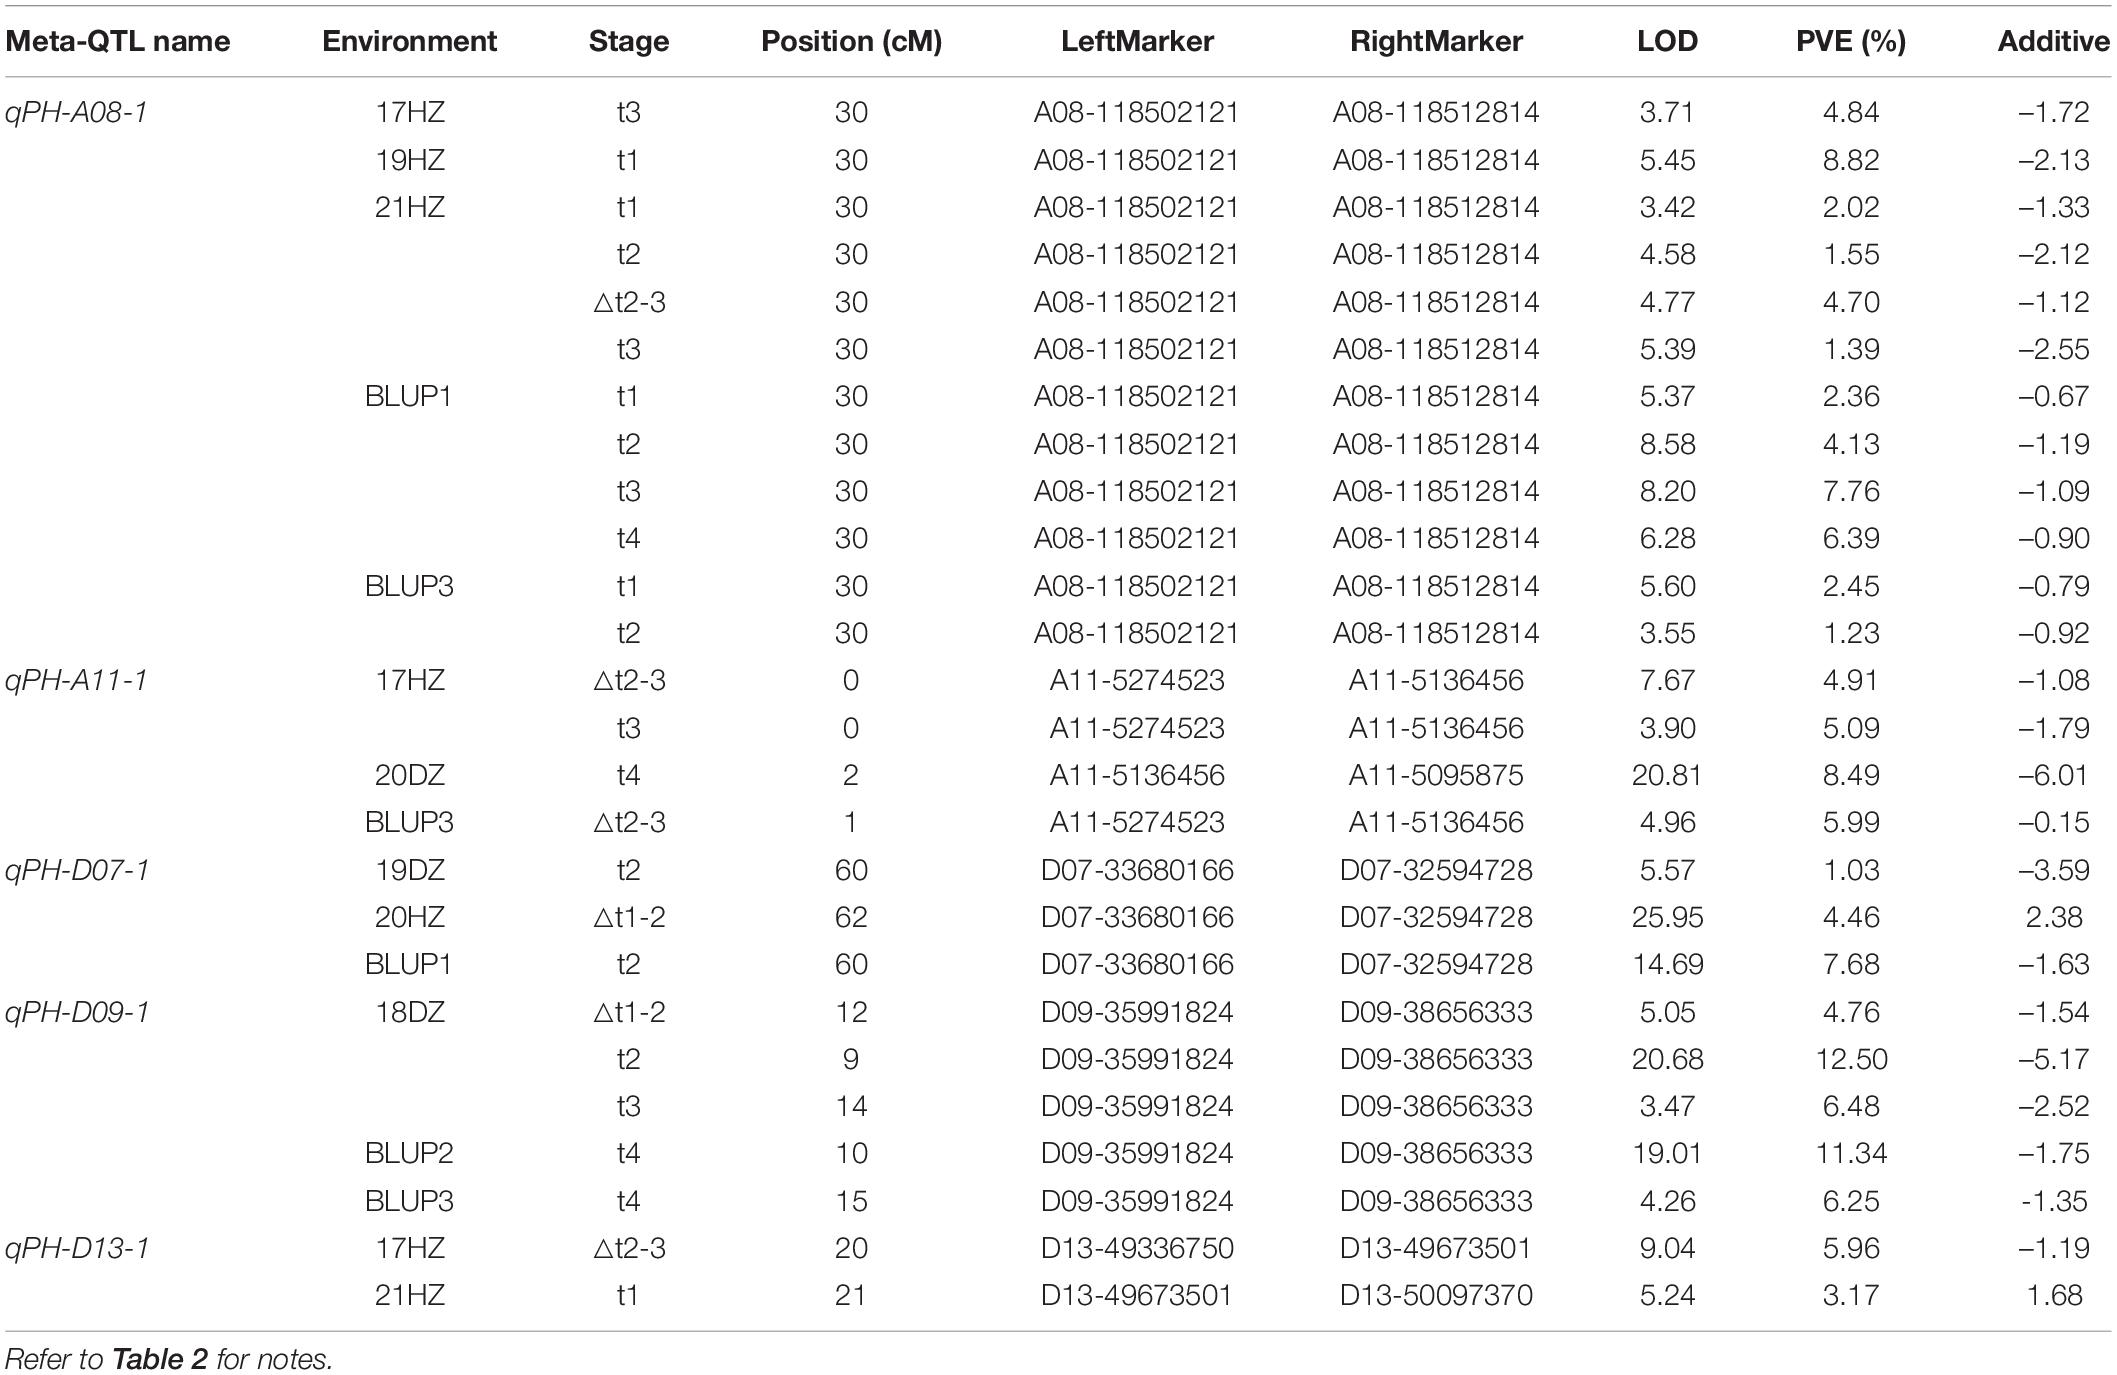
Table 3. Consistent quantitative trait loci (QTL) of plant height detected in different environments.
Stable and reliable QTL/alleles across different periods are of great value in marker assisted breeding. For the five consistent QTL, qPH-A08-1, qPH-A11-1, qPH-D07-1, qPH-D09-1, and qPH-D13-1, markers A08-118512814, A11-5136456, D07-33680166, D09-35991824, and D13-49673501 were the nearest linked SNP markers, respectively (Table 3 and Supplementary Figure 1). For SNP marker A08-118512814 for qPH-A08-1, RIL lines with SNP allele genotype (bb) from NK-4 had significantly higher PH than RIL lines with SNP allele genotype (aa) from WCT-4 in 3 of 5 periods (P < 0.05) (Supplementary Figure 1a). For SNP marker A11-5136456 for qPH-A11-1, the average PH of RIL lines with SNP allele genotype (bb) from NK-4 was significantly higher than that of RIL lines with SNP allele genotype (aa) from WCT-4 in 2 of 3 periods (P < 0.05) (Supplementary Figure 1b). For SNP marker D09-35991824 for qPH-D09-1, the average PH of RIL lines with SNP allele genotype (bb) from NK-4 was significantly higher than that of RIL lines with SNP allele genotype (aa) from WCT-4 in 1 of 4 periods (P < 0.05) (Supplementary Figure 1d). However, for D07-33680166 (qPH-D07-1) and D13-49673501 (qPH-D13-1), the difference between the average PH of RIL lines with the SNP allele genotype (aa) from WCT-4 and with SNP allele genotype (bb) from NK-4 was not significant (Supplementary Figures 1c,e). These results indicated that qPH-A08-1, qPH-A11-1, and qPH-D09-1 had relatively reliable effects on PH.
Gene Enrichment
A total of 948 genes were identified within the physical interval of the 5 stable unconditional QTL (i.e., UqPH-A03-1, UqPH-A03-3, UqPH-A09-1, UqPH-D02-1, and UqPH-D11-1) and five consistent QTL (i.e., qPH-A08-1, qPH-A11-1, qPH-D07-1, qPH-D09-1, and qPH-D13-1) (Supplementary Tables 6, 7). The GO enrichment results (P < 0.05) showed that 317 genes were enriched in the biological process category, with 302 genes participated in cellular processes, 186 genes participated in macromolecule metabolic processes, and 158 genes participated in cellular macromolecule metabolic processes, respectively. A total of 371 genes were enriched in the molecular function category, with 274 genes were associated with catalytic activity, 203 genes were associated with heterocyclic compound binding and organic cyclic compound binding respectively, and 126 genes were associated with transferase activity (Figure 4 and Supplementary Table 8). The KEGG enrichment results (P < 0.05) showed that the most likely pathway was SNARE interactions in vesicular transport (enriched in six genes) (Supplementary Table 9).
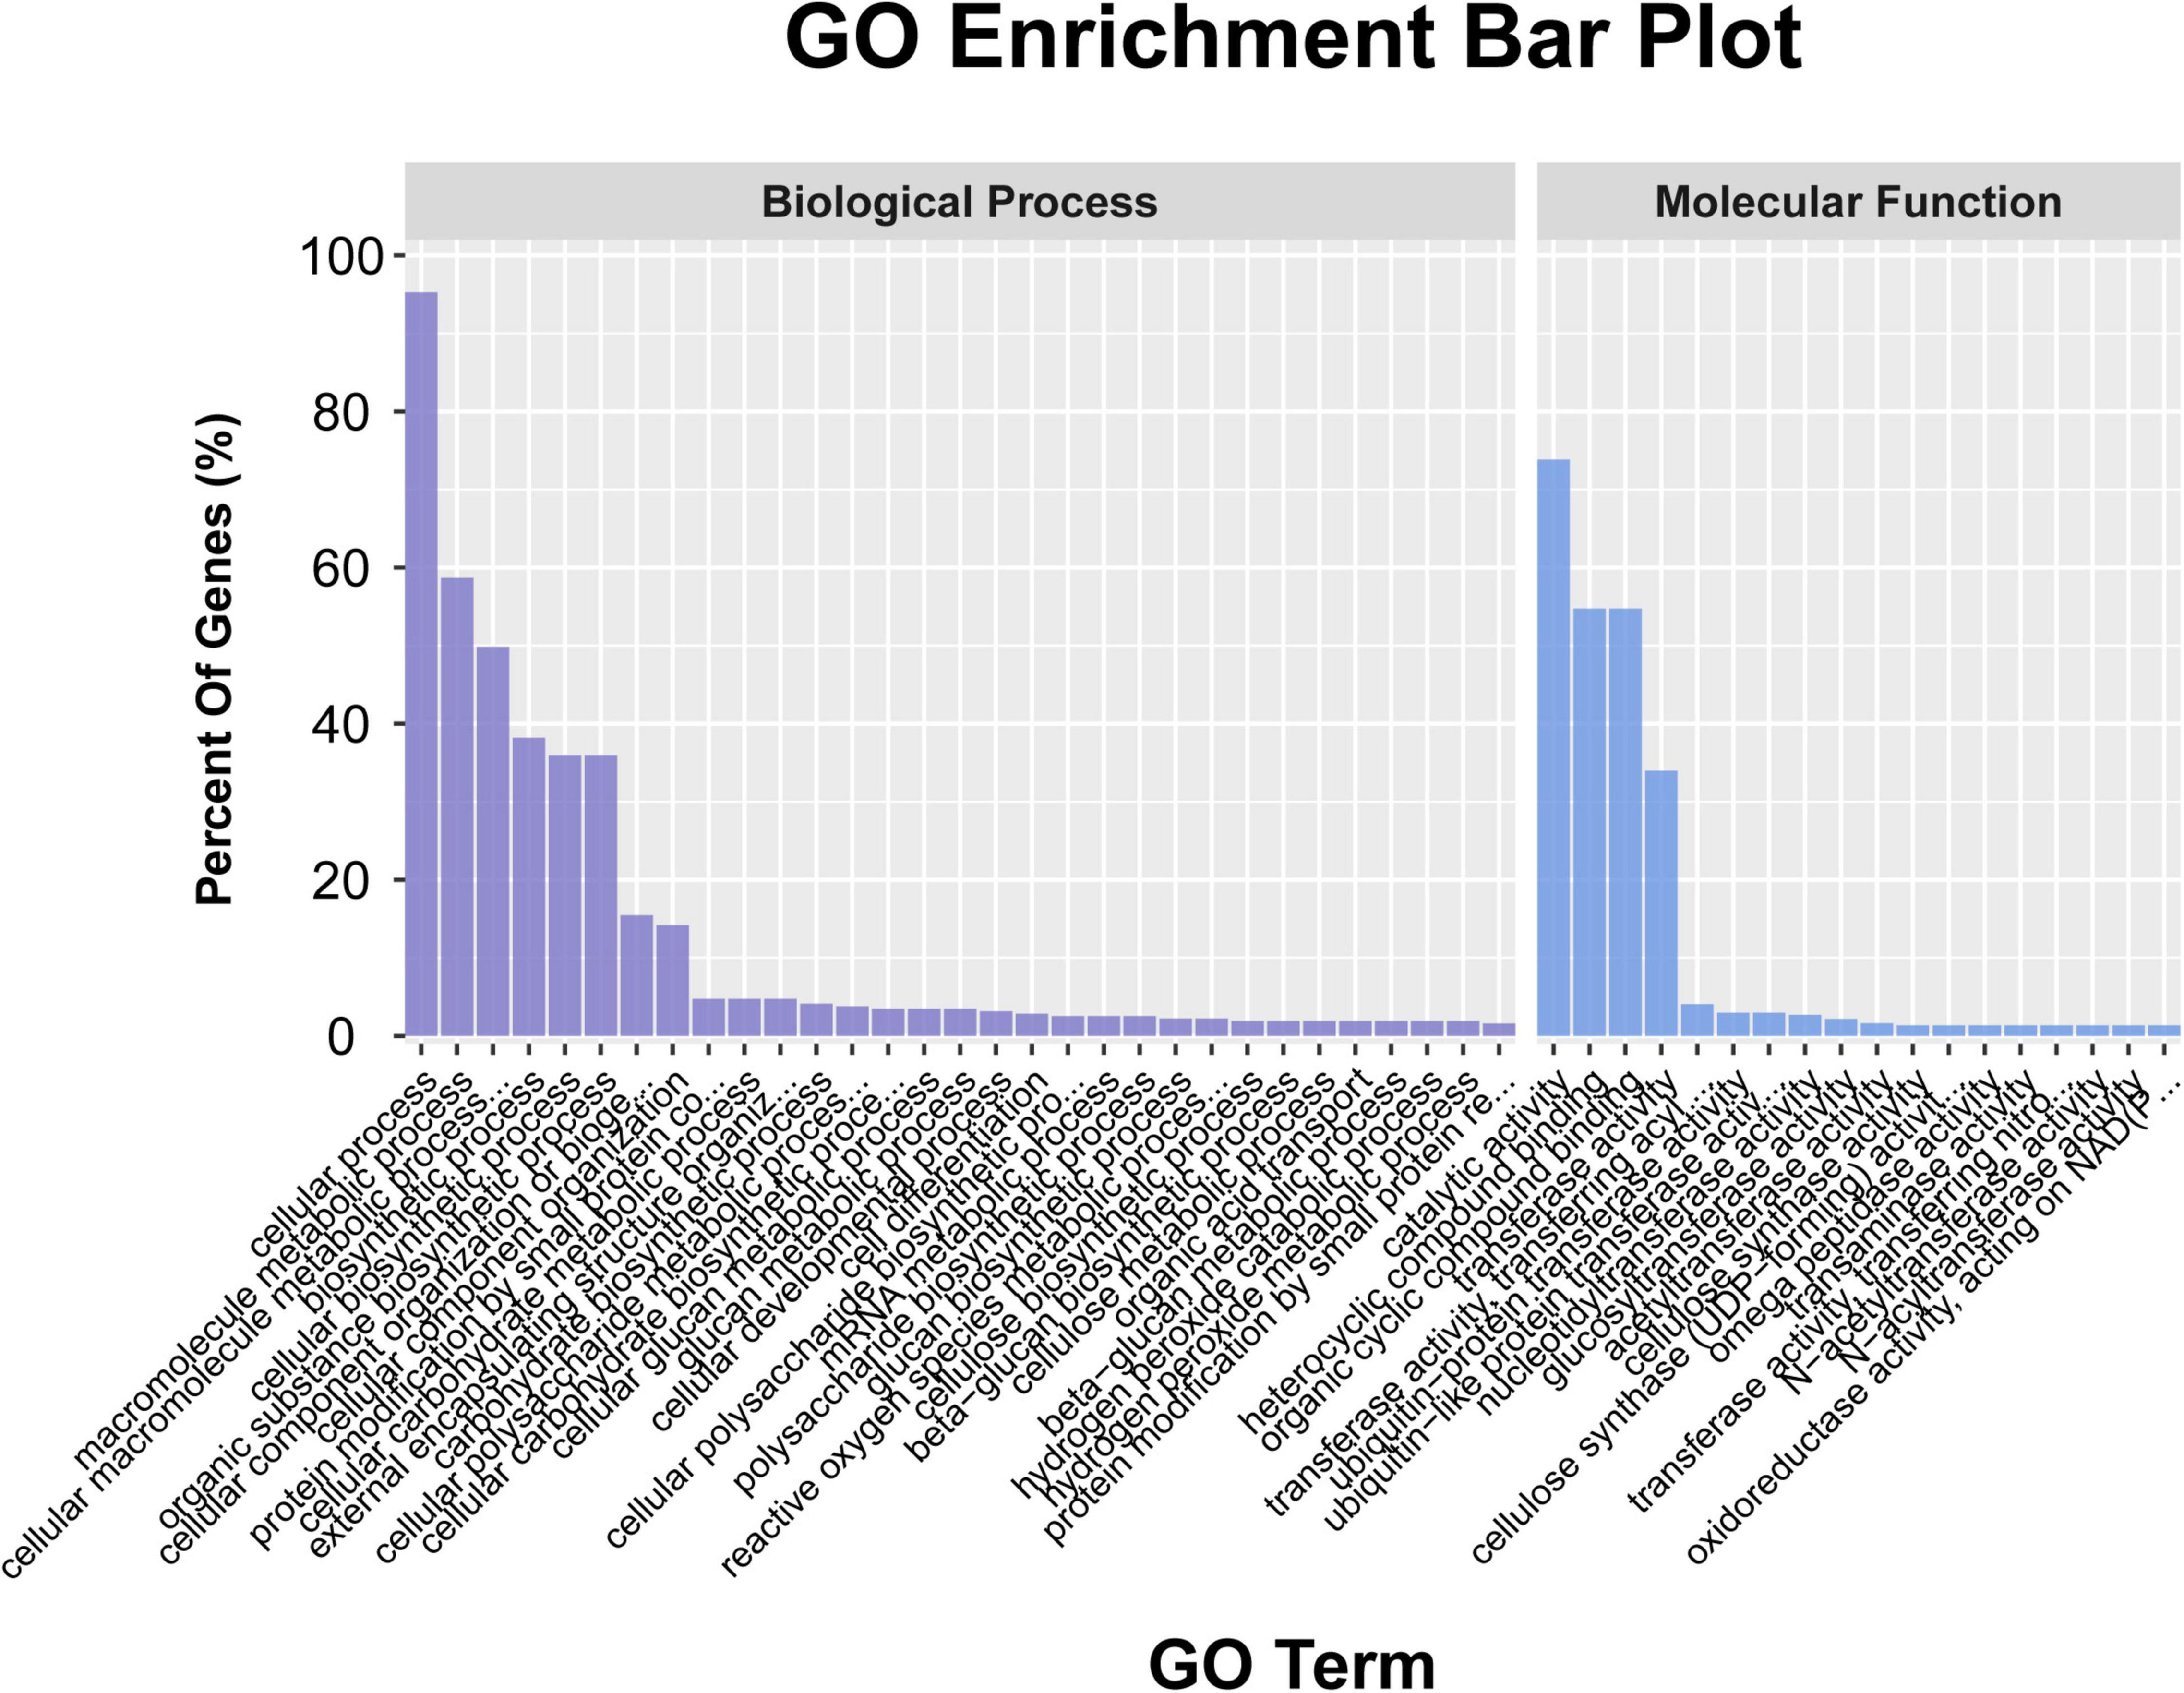
Figure 4. The annotation of the candidate genes in the ten quantitative trait loci (QTL) through gene ontology (GO) analysis.
Plant Height Candidate Genes Prediction
To predict candidate genes associated with cotton PH, homologous genes functional annotation of Arabidopsis were performed on these 948 genes within the physical interval of five stable unconditional QTL and five consistent QTL. Among the 778 genes with functional annotation information of homologous genes in Arabidopsis, to reduce candidate genes prediction errors, only genes whose homologous genes in Arabidopsis have been annotated to be involved in PH regulation, or genes that were previously proved to regulate PH, were included in the predicted candidate genes. Then, we finally predicted 14 candidate genes for cotton PH (Supplementary Table 10).
In this study, the gene GH_D11G2212 was annotated as AGAMOUS-like 29 in Arabidopsis, and the genes GH_D11G2122 and GH_D11G2351 were annotated as AGAMOUS-like 104 in Arabidopsis (Supplementary Table 10). The homologous gene Gh_D03G0922 of Arabidopsis was annotated as AGAMOUS-like 8, which had been proved to be related to cotton PH development (Su et al., 2018). The gene GH_D11G2128 is annotated as gibberellin-regulated family protein in Arabidopsis (Supplementary Table 10). Gibberellin can regulate plant stem elongation and other developmental processes (Braun et al., 2019; Li and Li, 2019). The gene GH_D09G1177 was annotated as auxin response factor 4 in Arabidopsis, and the gene GH_D11G2121 was annotated as auxin-responsive GH3 family protein in Arabidopsis (Supplementary Table 10). The gene GH3 couples IAA to amino acids to maintain auxin homeostasis. It was indicated that the GH3 gene participated in PH regulation and its high expression resulted in shorter plant (Yu et al., 2002; Staswick et al., 2005). The gene GH_D11G2197 is annotated as squalene epoxidase 2 in Arabidopsis (Supplementary Table 10) and may be involved in sterol biosynthesis (Laranjeira et al., 2015). The genes GH_D09G1074, GH_D11G2118, GH_D11G2301, GH_D11G2302, GH_D11G2303, GH_D11G2399, and GH_D11G2415 were annotated as cytochrome P450 in Arabidopsis (Supplementary Table 10). Cytochrome P450-related gene mutations may hinder the synthesis of brassinolide and cause plants to become shorter (Yang et al., 2014; Wu et al., 2016; Qi et al., 2017).
The gene expression heatmap indicated that the gene GH_D09G1177 was specifically expressed in the stem and root of TM-1, the genes GH_D11G2121, GH_D09G1074, and GH_D11G2118 were specifically expressed in the root of TM-1, and the gene GH_D11G2399 was specifically expressed in the stem of TM-1 (Hu et al., 2019; Figure 5). Since the PH is mainly determined by the growth of the stem, we can give priority to the gene GH_D11G2399, which is preferentially expressed in the stem, and its expression level is significantly higher than that in other important tissues (leaf and root) of TM-1.
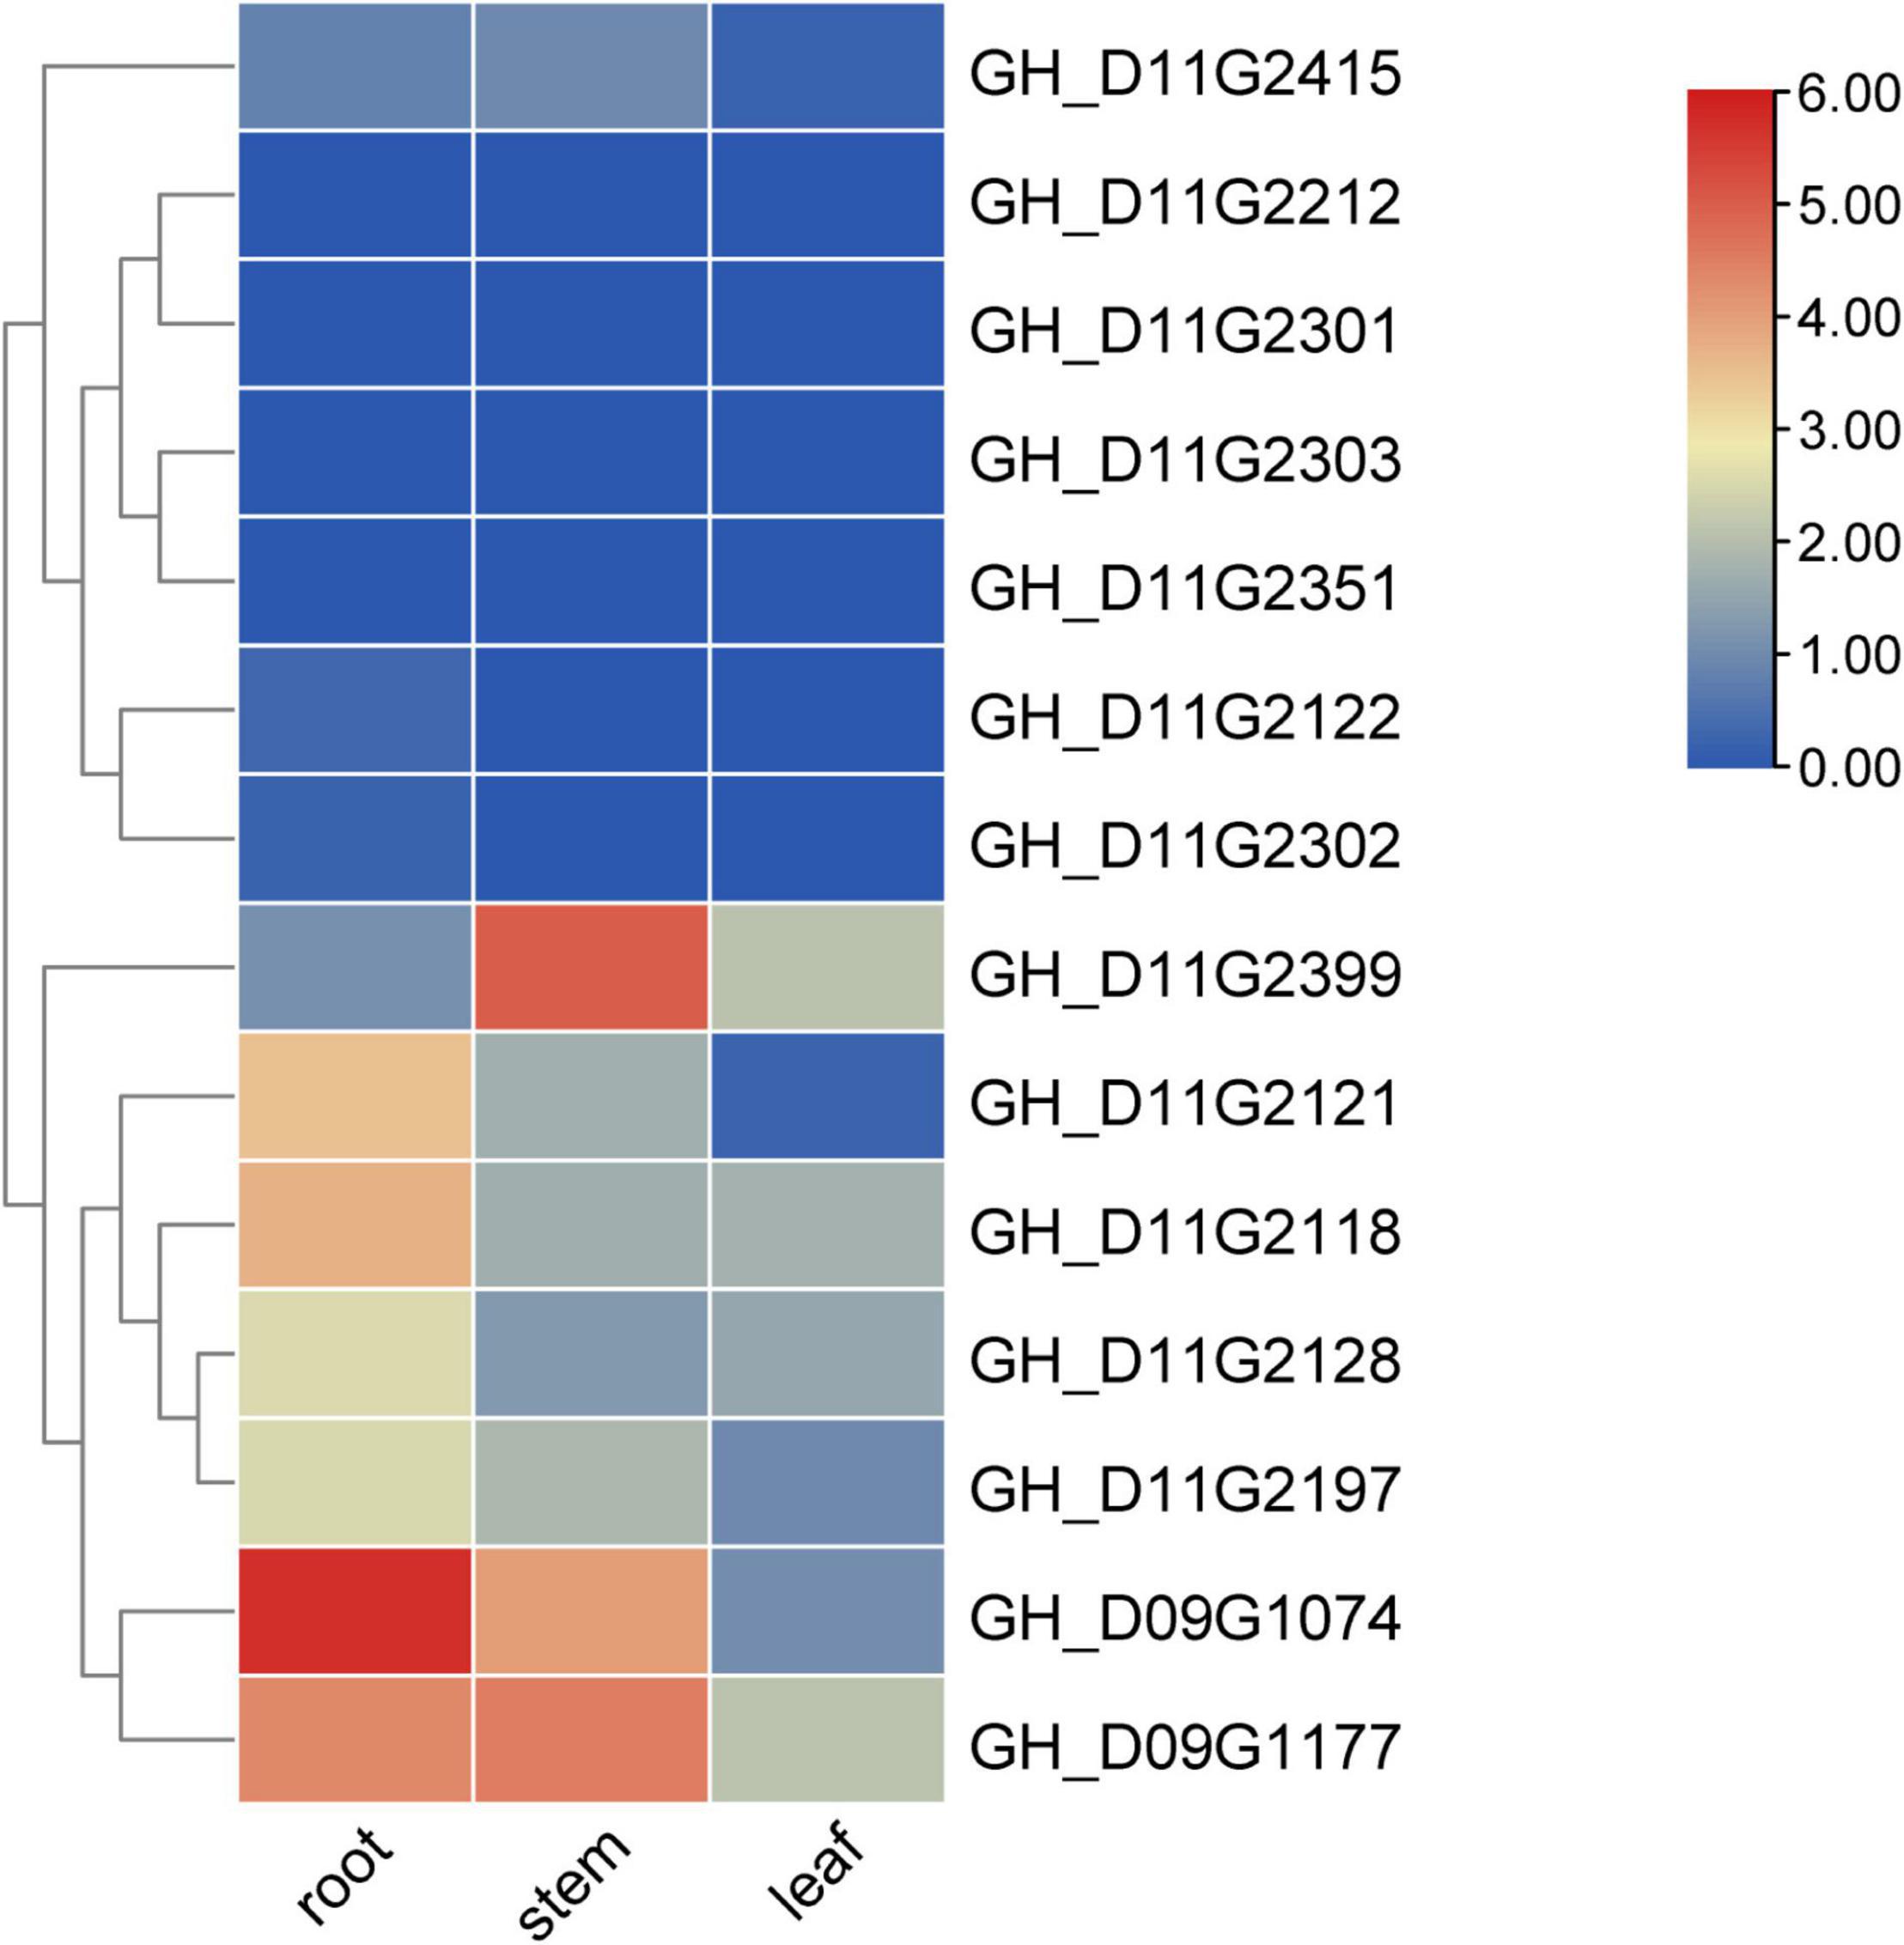
Figure 5. Expression information of candidate genes in TM-1. The value shown in the heatmap is log2(1+RPKM) based on RNA-seq data of TM-1. The data are the original expression data in the expression mode.
Discussion
Comparison With Previously Reported Plant Height Quantitative Trait Loci
Since quantitative traits are easily affected by the interaction between genes and the environments, the phenotypic data were usually collected from various environments to reduce the effect of environments. It can improve the accuracy of prediction by the phenotypic regression analysis on hundreds of thousands of mutations through a genome-wide regression model at the same time (de Los Campos et al., 2013). BLUP is a genome regression model method that is commonly used in animal and plant populations to improve prediction accuracy (de Los Campos et al., 2013; Huang et al., 2017). In this study, the BLUPs of 5 HZ environments, 4 DZ environments, and all environments were calculated for QTL mapping to improve the accuracy of QTL mapping. Among the 60 unconditional and conditional QTL detected in this study, 10 QTL were regarded as stable or consistent QTL. Furthermore, the annotation of homologous genes in Arabidopsis detected candidate genes with proved gene function involving PH regulation in these stable QTL confidence intervals. In addition, stable QTL detected at specific location was valuable for developing cultivars suitable to that location. The results of this study showed that 27 QTL were only detected in the HZ environment including a stable QTL (UqPH-D02-1) and a consistent QTL (qPH-D13-1), and 21 QTL were only detected in the DZ environment including a stable QTL (UqPH-A09-1).
Plant architecture is related to traits such as yield and fiber quality and has an important impact on high yield and good quality (Fu et al., 2019). Moreover, there are few QTL detected for PH in cotton, so it is necessary to use high-density genetic map to detect QTL for PH (Li et al., 2013; Liu et al., 2020). In this study, we used the constructed high-density genetic map and QTL mapping based on the PH phenotype data of the five generations of F9–F13, and a total of 60 PH QTL were mapped. To identify the newly discovered QTL in this study, the upland cotton PH QTL included in CottonGen5 (Huang et al., 2017; Liu et al., 2020; Yu et al., 2021), and PH QTL identified in recent years (Said et al., 2013; Huang, 2018; Su et al., 2018; Ma et al., 2019) were compared with the QTL of this work. The physical location of QTL is determined according to markers of confidence interval. If the physical intervals between QTL shared partially or fully overlapped, they are considered to be the same QTL. Due to the difference of marker types used in previous QTL mapping research, only QTL mapped with SNP markers were included in QTL comparison. It was found that 21 QTL (35.0%) mapped in this study were previously reported (Supplementary Table 6), including 12 unconditional QTL, eight conditional QTL, and one consistent QTL. The rest 39 QTL detected here were preliminarily considered as new cotton PH QTL. In addition, seven QTL were detected by BLUP, suggesting that using BLUP to detected QTL was reliable.
Conditional Quantitative Trait Loci Mapping
The phenotypic changes of dynamic traits are characterized by the time, indicating that the genetic mechanism of these traits may also change over time (Wurschum et al., 2014). PH is a dynamic development trait, unconditional QTL is the cumulative effect from the initial time to t, conditional QTL can reveal the net expression effect of QTL from t-1 to t (Liu, 2011). In this study, QTL mapping was performed on nine environments and 3 BLUPs, with a total of 37 unconditional QTL and 28 conditional QTL mapped, and found that five QTL were both unconditional QTL and conditional QTL after the comparison. The number of QTL varies at different stages of PH development, most unconditional QTL were detected in the early and middle stages, while most conditional QTL were detected in the middle stages, indicating that PH QTL have spatiotemporal expression characteristics (Shang et al., 2015a,2016; Wang et al., 2019). The same QTL can also be expressed in different periods, for example, consistent and stable QTL qPH-A08-1 was detected in 12 periods of t1, t2, t3, t4, and △t2-t3 of 5 environments, and qPH-D09-1 was detected in five periods of t2, t3, t4, and △t1-t2 of 3 environments (Table 3). However, no QTL was found to be expressed in all stages of an environment, indicating that different QTL are expressed at different stages in the process of PH development.
Conclusion
Plant height is a key plant architecture factor affecting cotton fiber yield and other traits. A high-density genetic map of 5,850 SNP markers was constructed using an upland cotton intraspecific recombinant inbred line (RIL) population. Based on phenotypic PH data from nine environments and three BLUPs, 37 unconditional QTL and 28 conditional QTL sharing five common QTL were identified for PH, including 21 previously detected PH QTL. Fourteen candidate genes for PH were predicted within 10 stable QTL intervals. This study shed substantial light on the genetic basis of cotton PH, will lay a foundation for further functional verification of candidate genes, and enable molecular selection toward ideal plant architecture.
Data Availability Statement
The original contributions presented in the study are included in the article/Supplementary Material, further inquiries can be directed to the corresponding authors.
Author Contributions
JW completed the phenotypic data collection, analyzed and summarized all the data, and wrote the manuscript. LM and JT participated in the phenotypic data collection. XW completed the candidate genes enrichment and wrote the results section. HZ, MX, YS, YZ, GZ, ZZ, YW, MC, and LW managed and collected the phenotype data. XLS and XZS designed the research. XLS revised the manuscript. All authors read and approved the final manuscript.
Funding
This work was mainly supported by the Agricultural Seed Projects of Shandong Province [2020LZGC002] and Modern Agro-industry Technology Research System of Shandong Province [SDAIT-03-03/05].
Conflict of Interest
The authors declare that the research was conducted in the absence of any commercial or financial relationships that could be construed as a potential conflict of interest.
Publisher’s Note
All claims expressed in this article are solely those of the authors and do not necessarily represent those of their affiliated organizations, or those of the publisher, the editors and the reviewers. Any product that may be evaluated in this article, or claim that may be made by its manufacturer, is not guaranteed or endorsed by the publisher.
Acknowledgments
We are grateful to the laboratory members for help, advice, and discussion.
Supplementary Material
The Supplementary Material for this article can be found online at: https://www.frontiersin.org/articles/10.3389/fpls.2022.914140/full#supplementary-material
Supplementary Figure 1 | The quantitative trait loci (QTL) allele effect for the qPH-A08-1, qPH-A11-1, qPH-D07-1, qPH-D09-1 and qPH-D13-1related to PH. (a) Box plots for the qPH-A08-1 related to PH. (b) Box plots for the qPH-A11-1 related to PH. (c) Box plots for the qPH-D07-1 related to PH. (d) Box plots for the qPH-D09-1 related to PH. (e) Box plots for the qPH-D13-1 related to PH.
Footnotes
- ^ https://cottonfgd.org/
- ^ http://cotton.zju.edu.cn/
- ^ https://www.omicstudio.cn/tool
- ^ https://magic.novogene.com/customer/main#/login
- ^ https://www.cottongen.org/
References
Braun, E. M., Tsvetkova, N., Rotter, B., Siekmann, D., Schwefel, K., Krezdorn, N., et al. (2019). Gene expression profiling and fine mapping identifies a gibberellin 2-oxidase gene co-segregating with the dominant dwarfing gene Ddw1 in rye (Secale cereale L.). Front. Plant Sci. 10:857. doi: 10.3389/fpls.2019.00857
Chen, C., Xia, R., Chen, H., and He, Y. (2018). TBtools, a Toolkit for Biologists integrating various HTS-data handling tools with a user-friendly interface. bioRxiv [preprint]. doi: 10.1101/289660
Chen, M. (2013). Several countermeasures to improve the quality of machine-picked cotton. China Cotton Process. 4, 19–20.
Chen, Z., Cheng, X., Chai, L., Wang, Z., Bian, R., Li, J., et al. (2020). Dissection of genetic factors underlying grain size and fine mapping of QTgw.cau-7D in common wheat (Triticum aestivum L.). Theor. Appl. Genet. 133, 149–162. doi: 10.1007/s00122-019-03447-5
Chen, Z. J., Scheffler, B. E., Dennis, E., Triplett, B. A., Zhang, T., Guo, W., et al. (2007). Toward sequencing cotton (Gossypium) genomes. Plant Physiol. 145, 1303–1310. doi: 10.1104/pp.107.107672
Cui, F., Li, J., Ding, A., Zhao, C., Wang, L., Wang, X., et al. (2011). Conditional QTL mapping for plant height with respect to the length of the spike and internode in two mapping populations of wheat. Theor. Appl. Genet. 122, 1517–1536. doi: 10.1007/s00122-011-1551-6
de Los Campos, G., Vazquez, A. I., Fernando, R., Klimentidis, Y. C., and Sorensen, D. (2013). Prediction of complex human traits using the genomic best linear unbiased predictor. PLoS Genet. 9:e1003608. doi: 10.1371/journal.pgen.1003608
Dong, Z., Alam, M. K., Xie, M., Yang, L., Liu, J., Helal, M. M. U., et al. (2021). Mapping of a major QTL controlling plant height using a high-density genetic map and QTL-seq methods based on whole-genome resequencing in Brassica napus. G3 11:jkab118. doi: 10.1093/g3journal/jkab118
Fan, X., Cui, F., Zhao, C., Zhang, W., Yang, L., Zhao, X., et al. (2015). QTLs for flag leaf size and their influence on yield-related traits in wheat (Triticum aestivum L.). Mol. Breed. 35:24. doi: 10.1007/s11032-015-0205-9
Fu, Y., Xue, H., Hu, G., Chao, M., and Li, C. (2019). Research progress on genetics and breeding of cotton plant traits in my country. Jiangsu Agri. Sci. 47, 16–19. doi: 10.15889/j.issn.1002-1302.2019.05.005
Hu, Y., Chen, J., Fang, L., Zhang, Z., Ma, W., Niu, Y., et al. (2019). Gossypium barbadense and Gossypium hirsutum genomes provide insights into the origin and evolution of allotetraploid cotton. Nat. Genet. 51, 739–748. doi: 10.1038/s41588-019-0371-5
Huang, C. (2018). Analyzing the genetic basis of important agronomic traits of upland cotton based on association analysis of natural populations and MAGIC populations. [Ph.D thesis] Wuhan: Huazhong Agricultural University.
Huang, C., Nie, X., Shen, C., You, C., Li, W., Zhao, W., et al. (2017). Population structure and genetic basis of the agronomic traits of upland cotton in China revealed by a genome-wide association study using high-density SNPs. Plant Biotechnol. J. 15, 1374–1386. doi: 10.1111/pbi.12722
Ji, G. (2018). Fine Mapping and Preliminary Functional Verification of a New Cotton Dwarf Mutant Gene. [Ph.D thesis] Beijing: Chinese Academy of Agricultural Sciences.
Jia, X., Wang, S., Zhao, H., Zhu, J., Li, M., and Wang, G. (2021). QTL mapping for traits related to plant type and growth period of upland cotton. Cotton Sci. 33, 124–133.
Jiao, Y., Wang, Y., Xue, D., Wang, J., Yan, M., Liu, G., et al. (2010). Regulation of OsSPL14 by OsmiR156 defines ideal plant architecture in rice. Nat. Genet. 42, 541–544. doi: 10.1038/ng.591
Khush, G. S. (2001). Green revolution: the way forward. Nat. Rev. Genet. 2, 815–822. doi: 10.1038/35093585
Laranjeira, S., Amorim-Silva, V., Esteban, A., Arro, M., Ferrer, A., Tavares, R. M., et al. (2015). Arabidopsis Squalene Epoxidase 3 (SQE3) Complements SQE1 and Is Important for Embryo Development and Bulk Squalene Epoxidase Activity. Mol. Plant 8, 1090–1102. doi: 10.1016/j.molp.2015.02.007
Lei, L., Zheng, H. L., Wang, J. G., Liu, H. L., Sun, J., Zhao, H. W., et al. (2018). Genetic dissection of rice (Oryza sativa L.) tiller, plant height, and grain yield based on QTL mapping and metaanalysis. Euphytica 214:109. doi: 10.1007/s10681-018-2187-2
Li, C., Song, L., Zhao, H., Xia, Z., Jia, Z., Wang, X., et al. (2013). Quantitative trait loci mapping for plant architecture traits across two upland cotton populations using SSR markers. J. Agri. Sci. 152, 275–287. doi: 10.1017/s0021859613000063
Li, C. Q., Ai, N. J., Zhu, Y. J., Wang, Y. Q., Chen, X. D., Li, F., et al. (2015). Association mapping and favourable allele exploration for plant architecture traits in upland cotton (Gossypium hirsutum L.) accessions. J. Agri. Sci. 154, 567–583. doi: 10.1017/s0021859615000428
Li, J., and Li, C. (2019). Research progress of plant hormones since the founding of New China 70 years ago. Sci. China 49, 1227–1281.
Li, X., Chen, Y., Yan, Z., and Wang, R. (1998). The relationship between plant type, plant height, stem diameter and boll formation per plant in high-yielding cotton. J. Tarim Agri. Univ. 1, 34–36.
Li, Y. (2021). The cotton industry trade situation and the problems that need to be solved urgently in my country. Cotton Sci. 43, 3–8.
Liu, B. (2011). Conditional and unconditional QTL mapping of major agronomic traits in wheat. [Ph.D thesis] Taian: Shandong Agricultural University.
Liu, G., Pei, W., Li, D., Ma, J., Cui, Y., Wang, N., et al. (2019). A targeted QTL analysis for fiber length using a genetic population between two introgressed backcrossed inbred lines in upland cotton (Gossypium hirsutum). Crop J. 7, 273–282. doi: 10.1016/j.cj.2018.11.005
Liu, R., Gong, J., Xiao, X., Zhang, Z., Li, J., Liu, A., et al. (2018). GWAS analysis and QTL identification of fiber quality traits and yield components in upland cotton using enriched high-density SNP markers. Front. Plant Sci. 9:1067. doi: 10.3389/fpls.2018.01067
Liu, R., Xiao, X., Gong, J., Li, J., Zhang, Z., Liu, A., et al. (2020). QTL mapping for plant height and fruit branch number based on RIL population of upland cotton. J. Cotton Res. 3, 54–63. doi: 10.1186/s42397-020-0046-x
Ma, J., Pei, W., Ma, Q., Geng, Y., Liu, G., Liu, J., et al. (2019). QTL analysis and candidate gene identification for plant height in cotton based on an interspecific backcross inbred line population of Gossypium hirsutum x Gossypium barbadense. Theor. Appl. Genet. 132, 2663–2676. doi: 10.1007/s00122-019-03380-7
Ma, Z., He, S., Wang, X., Sun, J., Zhang, Y., Zhang, G., et al. (2018b). Resequencing a core collection of upland cotton identifies genomic variation and loci influencing fiber quality and yield. Nat. Genet. 50, 803–813. doi: 10.1038/s41588-018-0119-7
Ma, L.-L., Ijaz, B., Wang, Y.-M., and Hua, J.-P. (2018a). Dynamic QTL analysis and validation for plant height using maternal and paternal backcrossing populations in Upland cotton. Euphytica 214:167. doi: 10.1007/s10681-018-2243-y
McCouch, S. R., Chen, X., Panaud, O., Temnykh, S., Xu, Y., Cho, Y. G., et al. (1997). Microsatellite marker development, mapping and applications in rice genetics and breeding. Plant Mol. Biol. 35, 89–99.
Meng, L., Li, H., Zhang, L., and Wang, J. (2015). QTL IciMapping: Integrated software for genetic linkage map construction and quantitative trait locus mapping in biparental populations. Crop J. 3, 269–283. doi: 10.1016/j.cj.2015.01.001
Ooijen, J. (2006). Joinmap 4.0: software for the Calculation of Genetic Linkage Maps in Experimental Population. Kyazma bv.Netherlands:Wageningen
Pan, Q., Xu, Y., Li, K., Peng, Y., Zhan, W., Li, W., et al. (2017). The genetic basis of plant architecture in 10 maize recombinant inbred line population. Plant Physiol. 175, 858–873. doi: 10.1104/pp.17.00709
Pei, X., Wang, X., Fu, G., Chen, B., Nazir, M. F., Pan, Z., et al. (2021). Identification and functional analysis of 9-cis-epoxy carotenoid dioxygenase (NCED) homologs in G. hirsutum. Int. J. Biol. Macromol. 182, 298–310. doi: 10.1016/j.ijbiomac.2021.03.154
Peiffer, J. A., Romay, M. C., Gore, M. A., Flint-Garcia, S. A., Zhang, Z., Millard, M. J., et al. (2014). The genetic architecture of maize height. Genetics 196, 1337–1356. doi: 10.1534/genetics.113.159152
Peng, J., Richards, D. E., Hartley, N. M., Murphy, G. P., Devos, K. M., Flintham, J. E., et al. (1999). ‘Green revolution’ genes encode mutant gibberellin response modulators. Nature 400, 256–261. doi: 10.1038/22307
Qi, H., Wang, N., Qiao, W., Xu, Q., Zhou, H., Shi, J., et al. (2017). Construction of a high-density genetic map using genotyping by sequencing (GBS) for quantitative trait loci (QTL) analysis of three plant morphological traits in upland cotton (Gossypium hirsutum L.). Euphytica 213:83. doi: 10.1007/s10681-017-1867-7
Said, J. I., Lin, Z., Zhang, X., Song, M., and Zhang, J. (2013). A comprehensive meta QTL analysis for fiber quality, yield, yield related and morphological traits, drought tolerance, and disease resistance in tetraploid cotton. BMC Genomics 14:776. doi: 10.1186/1471-2164-14-776
Sasaki, A., Ashikari, M., Ueguchi-Tanaka, M., Itoh, H., Nishimura, A., Swapan, D., et al. (2002). A mutant gibberellin-synthesis gene in rice. Nature 416, 701–702. doi: 10.1038/416701a
Shang, L., Liu, F., Wang, Y., Abduweli, A., Cai, S., Wang, K., et al. (2015b). Dynamic QTL mapping for plant height in Upland cotton (Gossypium hirsutum). Plant Breed. 134, 703–712. doi: 10.1111/pbr.12316
Shang, L., Cai, S., Ma, L., Wang, Y., Abduweli, A., Wang, M., et al. (2015a). Seedling root QTLs analysis on dynamic development and upon nitrogen deficiency stress in Upland cotton. Euphytica 207, 645–663. doi: 10.1007/s10681-015-1564-3
Zhang, Z., Liu, A., Huang, Z., Fan, S., Zou, X., Deng, X., et al. (2019). Quantitative trait locus mapping for plant height and branch number in an upland cotton recombinant inbred line with an SNP-based high-density genetic map. Euphytica 215:110. doi: 10.1007/s10681-019-2428-z
Shang, L., Wang, Y., Cai, S., Ma, L., Liu, F., Chen, Z., et al. (2016). Genetic analysis of Upland cotton dynamic heterosis for boll number per plant at multiple developmental stages. Sci. Rep. 6:35515. doi: 10.1038/srep35515
Song, X., and Zhang, T. (2009). Quantitative trait loci controlling plant architectural traits in cotton. Plant Sci. 177, 317–323. doi: 10.1016/j.plantsci.2009.05.015
Staswick, P. E., Serban, B., Rowe, M., Tiryaki, I., Maldonado, M. T., Maldonado, M. C., et al. (2005). Characterization of an Arabidopsis enzyme family that conjugates amino acids to indole-3-acetic acid. Plant Cell 17, 616–627. doi: 10.1105/tpc.104.026690
Su, J., Li, L., Zhang, C., Wang, C., Gu, L., Wang, H., et al. (2018). Genome-wide association study identified genetic variations and candidate genes for plant architecture component traits in Chinese upland cotton. Theor. Appl. Genet. 131, 1299–1314. doi: 10.1007/s00122-018-3079-5
Sun, F. D., Zhang, J. H., Wang, S. F., Gong, W. K., Shi, Y. Z., Liu, A. Y., et al. (2012). QTL mapping for fiber quality traits across multiple generations and environments in upland cotton. Mol. Breed. 30, 569–582. doi: 10.1007/s11032-011-9645-z
Voorrips, R. E. (2002). MapChart: software for the graphical presentation of linkage maps and QTLs. J. Hered. 93, 77–78. doi: 10.1093/jhered/93.1.77
Wang, C., Wang, X., Wu, Q., Wang, Z., Tang, Y., Du, Z., et al. (2018). Dominant analysis of sensory quality, screening of excellent strains and estimation of heritability in fresh peanuts. Chinese J. Peanuts 47, 71–74. doi: 10.14001/j.issn.1002-4093.2018.04.012
Wang, S., Chen, J., Zhang, W., Hu, Y., Chang, L., Fang, L., et al. (2015). Sequence-based ultra-dense genetic and physical maps reveal structural variations of allopolyploid cotton genomes. Genome Biol. 16:108. doi: 10.1186/s13059-015-0678-1
Wang, X., Zhang, R., Song, W., Han, L., Liu, X., Sun, X., et al. (2019). Dynamic plant height QTL revealed in maize through remote sensing phenotyping using a high-throughput unmanned aerial vehicle (UAV). Sci. Rep. 9:3458. doi: 10.1038/s41598-019-39448-z
Wang, Y., and Li, J. (2006). Genes controlling plant architecture. Curr. Opin. Biotechnol. 17, 123–129. doi: 10.1016/j.copbio.2006.02.004
Wu, H., Ren, Z., Zheng, L., Guo, M., Yang, J., Hou, L., et al. (2021). The bHLH transcription factor GhPAS1 mediates BR signaling to regulate plant development and architecture in cotton. Crop J. 9, 1049–1059. doi: 10.1016/j.cj.2020.10.014
Wu, Y., Fu, Y., Zhao, S., Gu, P., Zhu, Z., Sun, C., et al. (2016). CLUSTERED PRIMARY BRANCH 1, a new allele of DWARF11, controls panicle architecture and seed size in rice. Plant Biotechnol. J. 14, 377–386. doi: 10.1111/pbi.12391
Wurschum, T., Langer, S. M., and Longin, C. F. (2015). Genetic control of plant height in European winter wheat cultivars. Theor. Appl. Genet. 128, 865–874. doi: 10.1007/s00122-015-2476-2
Wurschum, T., Liu, W., Busemeyer, L., Tucker, M. R., Reif, J. C., Weissmann, E. A., et al. (2014). Mapping dynamic QTL for plant height in triticale. BMC Genet. 15:59. doi: 10.1186/1471-2156-15-59
Yang, S., Zhang, L., Chen, W., Xu, Z., and Wang, J. (1996). Theories and methods of super-high-yielding rice breeding. China Rice Sci. 22, 295–304. doi: 10.16819/j.1001-7216.1996.02.009
Yang, Z., Zhang, C., Yang, X., Liu, K., Wu, Z., Zhang, X., et al. (2014). PAG1, a cotton brassinosteroid catabolism gene, modulates fiber elongation. New Phytol. 203, 437–448. doi: 10.1111/nph.12824
Yu, H., Cao, J., and Wang, Y. (2002). Hormone regulation of plant dwarf mutants. Life Science. 2, 85–88.
Yu, J., Jung, S., Cheng, C. H., Lee, T., Zheng, P., Buble, K., et al. (2021). CottonGen: the community database for cotton genomics, genetics, and breeding research. Plants 10:2805. doi: 10.3390/plants10122805
Yu, J., Yu, S., Fan, S., Song, M., Zhai, H., Li, X., et al. (2012). Mapping quantitative trait loci for cottonseed oil, protein and gossypol content in a Gossypium hirsutum × Gossypium barbadense backcross inbred line population. Euphytica 187, 191–201. doi: 10.1007/s10681-012-0630-3
Zhang, T., Hu, Y., Jiang, W., Fang, L., Guan, X., Chen, J., et al. (2015). Sequencing of allotetraploid cotton (Gossypium hirsutum L. acc. TM-1) provides a resource for fiber improvement. Nat. Biotechnol. 33, 531–537. doi: 10.1038/nbt.3207
Keywords: Gossypium hirsutum, recombinant inbred line, plant height, genetic map, quantitative trait loci, candidate gene
Citation: Wu J, Mao L, Tao J, Wang X, Zhang H, Xin M, Shang Y, Zhang Y, Zhang G, Zhao Z, Wang Y, Cui M, Wei L, Song X and Sun X (2022) Dynamic Quantitative Trait Loci Mapping for Plant Height in Recombinant Inbred Line Population of Upland Cotton. Front. Plant Sci. 13:914140. doi: 10.3389/fpls.2022.914140
Received: 06 April 2022; Accepted: 06 May 2022;
Published: 09 June 2022.
Edited by:
Xuecai Zhang, International Maize and Wheat Improvement Center, MexicoReviewed by:
Wenfeng Pei, Cotton Research Institute (CAAS), ChinaDesalegn D. Serba, U.S. Arid Land Agricultural Research Center (USDA-ARS), United States
Xing Fen Wang, Hebei Agricultural University, China
Copyright © 2022 Wu, Mao, Tao, Wang, Zhang, Xin, Shang, Zhang, Zhang, Zhao, Wang, Cui, Wei, Song and Sun. This is an open-access article distributed under the terms of the Creative Commons Attribution License (CC BY). The use, distribution or reproduction in other forums is permitted, provided the original author(s) and the copyright owner(s) are credited and that the original publication in this journal is cited, in accordance with accepted academic practice. No use, distribution or reproduction is permitted which does not comply with these terms.
*Correspondence: Xianliang Song, c29uZ3hsOTk5QDE2My5jb20=; Xuezhen Sun, c3VueHpAc2RhdS5lZHUuY24=
†These authors have contributed equally to this work