 Kun Zhang1,2,3†Jing Ma2,4†
 Sunil S. Gangurde5,6Lei Hou2,4
 Han Xia2,4Nana Li2Jiaowen Pan2Ruizheng Tian2Huailing Huang2,4
 Xingjun Wang2,4Yindong Zhang1,7*
 Chuanzhi Zhao2,4*
- 1College of Tropical Crops, Hainan University, Haikou, China
- 2Institute of Crop Germplasm Resources (Institute of Biotechnology), Shandong Academy of Agricultural Sciences, Shandong Provincial Key Laboratory of Crop Genetic Improvement, Ecology and Physiology, Jinan, China
- 3College of Agricultural Science and Technology, Shandong Agriculture and Engineering University, Jinan, China
- 4College of Life Sciences, Shandong Normal University, Jinan, China
- 5Crop Protection and Management Research Unit, USDA-ARS, Tifton, GA, United States
- 6Department of Plant Pathology, University of Georgia, Tifton, GA, United States
- 7Hainan Academy of Agricultural Sciences, Haikou, China
Cultivated peanut (Arachis hypogaea L.) is an important source of edible oil and protein. Peanut testa (seed coat) provides protection for seeds and serves as a carrier for diversity metabolites necessary for human health. There is significant diversity available for testa color in peanut germplasms. However, the kinds and type of metabolites in peanut testa has not been comprehensively investigated. In this study, we performed metabolite profiling using UPLC-MS/MS for four peanut germplasm lines with different testa colors, including pink, purple, red, and white. A total of 85 metabolites were identified in four peanuts. Comparative metabolomics analysis identified 78 differentially accumulated metabolites (DAMs). Some metabolites showed significant correlation with other metabolites. For instance, proanthocyanidins were positively correlated with cyanidin 3-O-rutinoside and malvin, and negatively correlated with pelargonidin-3-glucoside. We observed that the total proanthocyanidins are most abundant in pink peanut variety WH10. The red testa accumulated more isoflavones, flavonols and anthocyanidins compared with that in pink testa. These results provided valuable information about differential accumulation of metabolites in testa with different color, which are helpful for further investigation of the molecular mechanism underlying biosynthesis and accumulation of these metabolites in peanut.
Introduction
Cultivated peanut (Arachis hypogaea L.) is rich in protein, oil, and nutrients. Peanut is an important oilseed crop of Asia, Africa, and Americas (FAOSTAT 20201). The edible portion of the peanut consists of both kernel and the seed coat also called as peanut testa (Christman et al., 2018). Previous studies reported that the peanut testa is rich in nutrients, including 12.3% protein, 16.6% oil, 2.8% ash, and approximately 140∼150 mg/g phenolic compounds (Nepote et al., 2007). Phenolic compounds are usually enriched on the exosphere of plant tissue to protect the internal cells. Peanut testa is rich in such phenolic compounds (Ma et al., 2014). In recent years, with the deepening of research on the important role of plant polyphenols in human health, more attentions have been paid to the nutritional value and function of peanut testa (Yu et al., 2006; Constanza et al., 2012; Liu et al., 2020; Oliveira et al., 2021).
Flavonoids and non-flavonoids are the major polyphenols in peanut testa. Flavonoids have the basic structure which consists of a C6-C3-C6 carbon skeleton comprising two 6-carbon benzene rings (rings A and B) linked by a 3-carbon heterocyclic ring (ring C) (Nabavi et al., 2020). Based on the degree of oxidation of the ring C and the number of methyl or hydroxyl groups on the rings A and B, flavonoids are mainly divided into 12 subgroups: flavanones, flavones, isoflavones, flavonols, anthocyanidins, proanthocyanidins, chalcones, dihydrochalcones, dihydroflavonols, coumarins, aurones, and phlobaphenes (Winkel-Shirley, 2001; Yu et al., 2005; Sasaki and Nakayama, 2015). With the diversity of molecular polymerization and modification (glycosylation, acylation, and others), there are more than 9,000 kinds of flavonoids present in higher plants (Tanaka et al., 2009; Noda et al., 2017; Sun et al., 2020). Non-flavonoids have the basic structural skeletons different from that of flavonoids, such as stilbenes (C6-C2-C6), phenolic acids (C6-C1), and hydroxycinnamic acids (C6-C3), all of which have dietary and medical significance. Different from the flavonoid pathway, the non-flavonoids are formed through the shikimic and phenylpropanoid pathways (Crozier et al., 2009). The scope of flavonoids and non-flavonoids is still controversial. For example, one view is that stilbene belongs to flavonoids. And resveratrol, an important member of stilbenes, is considered to have great potential in the treatment of cancer (Winkel-Shirley, 2001; Sirerol et al., 2016).
As one of the most important secondary metabolites in plants, flavonoids play an important role in plant growth, development and resistance to biotic, and abiotic stresses. Anthocyanidins are water-soluble pigments and important member of flavonoids in plants. They are important coloring substances of plant tissues, such as fruits and flowers with red, orange, blue, and purple colors (Grotewold, 2006; Dong et al., 2019), which can attract animals and insects, thus promoting pollination (Bradshaw and Schemske, 2003). Moreover, anthocyanidins have reactive oxygen species (ROS) scavenging ability and protect plants against damage from biotic and abiotic stresses (Cavaiuolo et al., 2013). Proanthocyanidins are the flavonoids with stronger antioxidant capacity than anthocyanidins, and their content is as high as 17% (w/w) of the dry weight of peanut testa (Karchesy and Hemingway, 1986; Park et al., 2011). Many other flavonoids, as phytoalexins or antioxidants, have properties similar to anthocyanidins and play important roles in resistance to drought stress, cold, ultraviolet radiations, and resistance to microorganisms, pathogens and insects (Iwashina, 2003; Pourcel et al., 2007; Zhang et al., 2020). Flavonoids can provide protection against oxidative stress, which has been implicated in some human diseases (Karadag et al., 2009). For example, flavonoid play a positive role in the treatment of atherosclerosis, diabetes mellitus, chronic inflammation, and some types of cancers in humans (Pinent et al., 2004; Osakabe and Yamagishi, 2009; Liu et al., 2020; Oliveira et al., 2021). Due to these bioactivities for flavonoids in peanut testa, attempts have been made to use them in some form as functional food ingredients or purified drug (Francisco and Resurreccion, 2009; Hathorn and Sanders, 2012; Christman et al., 2018). Flavonoids are generated from phenylalanine through the phenylpropanoid pathway, which has been clearly elucidated in model plants. With a series of enzyme reactions, metabolites flow to flavonols, flavanols, isoflavones, anthocyanidins and other branches, forming flavonoids substance with great differences in structure and content (Dong and Lin, 2021).
Testa color is an important qualitative trait of peanut. There are abundant phenotypic variations available in peanut testa color including pink, red, purple (black), white, tan, and multicolor, pink is most common in peanut germplasm. The composition and content of anthocyanidins are closely related to the color intensity of peanut testa. For instance, cyanidin-3-O-sambubioside which is a main anthocyanidin presents in black testa peanut cultivars (Kuang et al., 2017). With the completion of genome sequencing of cultivated peanut, great progress has been made in the research on the molecular mechanism of peanut seed coat color formation and gene identification. The candidate gene AhTc1 that controls the color of peanut purple testa has been mapped on chromosome 10 and encodes for R2R3-MYB transcription factor (Zhao et al., 2019). Two independently inherited genes controlling peanut red testa, AhRt1 and AhRt2, were identified on chromosomes 3 and 12, respectively (Chen et al., 2021; Zhang et al., 2022). Some other candidate genes and critical pathway were also predicted by combining transcriptome and metabolome methods between testa of two different colors, which enriched the study of gene function and the relationship between genes and metabolites in peanut testa (Wan et al., 2020; Xue et al., 2021). However, there are very few reports on the metabolomics studies of multiple testa colors of peanut. The metabolic pathways involved in flavonoid biosynthesis and molecular mechanism underlying testa color formation in peanut is still unclear.
Therefore, in this study, flavonoids content in various peanut testa color differences were investigated with the help of metabolomics profiling of four different colored peanut testas. The results provided insights on characteristics and direction of flavonoids accumulation in different colored peanut testa and supported for improving cultivated peanut with target color and flavonoid quality.
Materials and methods
Plant materials and treatments
The four peanut cultivars namely Yuhua 29 (YH29) with purple testa, Zhonghua 12 (ZH12) with red testa, Weihua 10 (WH10) with pink testa, Kainongbai (KNB) with white testa were planted at Jiyang Experimental Station of Shandong Academy of Agricultural Sciences (SAAS), Shandong, China (36°58′34.53″ N, 116°59′1.29″ E) during 2020. The peanut testa samples were peeled carefully and collected when the seeds were on the period of 70 days after pegging (DAP 70). Three biological replicates were performed for each peanut cultivar and each replicate contained the testa of 10 seeds from many plants of this variety. Then samples were rapidly frozen in liquid nitrogen and stored at −80°C.
Chemicals and reagents
HPLC-grade methanol, water, acetonitrile was purchased from Thermo Scientific (Rockford, IL, USA), AR-grade chloroform was purchased from Titan (Shanghai, China), HPLC-grade flavonoid standards was purchased from Sigma-Aldrich (Shanghai) Trading Co., Ltd., (Shanghai, China) and Yuanye (Shanghai, China). All the other chemicals were of analytical grade.
Sample extraction
The powdered sample (50 mg) was extracted with 600°μl of aqueous methanol (v:v = 1:2, containing succinic acid-2,2,3,3-d4, 50°ng/mL) using a rapid grinder (JXFSTPRP-24/32; Shanghai, China) at a frequency of 60 Hz for 2 min, followed by 20 min of sonication at 4°C (SB-5200DT, Ningbo, China). Subsequently, the samples were centrifuged at 13,000 rpm for 10 min at 4°C. 500°μl supernatant was transferred into new centrifuge tube. The residue added 400°μl methanol, extracted and centrifuged through the same steps as above, got 300°μl supernatant. The two extraction supernatants were mixed to obtain a total of 800°μl. Took 200°μl of supernatant and evaporated, then redissoluted with 200°μl aqueous methanol (v:v = 18:7, containing standard l-2-chlorophenylalanine, 10°ng/ml). Centrifuged at 13,000 rpm for 5 min at 4°C, the supernatants were filtered using 0.22-μm organic phase pinhole filter. Transfer them to brown LC injection vial and store at −80°C until LC-MS/MS analysis.
Flavonoids-metabolites detection and multiple reaction monitoring
Metabolite quantification was analyzed by multiple reaction detection (MRM) mode of triple quadrupole mass spectrometry (MS). Flavonoids-metabolites identification and quantification was carried out by Shanghai Luming Biological Technology Co., Ltd., (Shanghai, China) using UPLC-ESI-MS/MS system (UPLC, AB ExionLC, Applied Biosystems Sciex; MS, Qtrap 6500+, Applied Biosystems Sciex). The analytical conditions were as follows: HPLC: column, Waters UPLC HSS T3 (100*2.1 mm, 1.8 μm); solvent system, mobile phase A (0.01% formic acid): mobile phase B (acetonitrile); gradient program, 100:0 V/V at 0°min, 5:95 V/V at 11.0 min, 5:95 V/V at 12.0 min, 95:5 V/V at 12.1 min, 95:5 V/V at 15.0 min; flow rate, 0.40 mL/min; temperature, 40°C; injection volume: 5°μL. The effluent was alternatively connected to an ESI-triple quadrupole-linear ion trap (Q TRAP)-MS system. Linear ion trap (LIT) and triple quadrupole (QQQ) scans were acquired on an API 4500 Q TRAP LC/MS/MS system, equipped with an ESI Turbo Ion-Spray interface, analyst software (AB Sciex, version 1.6) was used for instrument control, data acquisition, and subsequent quantification. A combination of both ionization modes (positive and negative) in MS full scan mode was applied for the molecular mass determination of the compounds in samples of peanut testa. The MS conditions for positive ionization modes optimized are as follows: the column oven was set at 35°C; curtain gas, 30°psi; ion spray voltage, 5,500 V; temperature, 600°C; ion source gas 1, 60°psi; and ion source gas 2, 50°psi. The MS conditions for negative ionization modes are as follows: the column oven was set at 35°C; curtain gas, 30°psi; ion spray voltage, −4,500 V; temperature, 600°C; ion source gas 1, 60°psi; and ion source gas 2, 50°psi. QQQ scans were acquired during MRM experiments with collision gas (nitrogen) set to 5°psi. DP and CE for individual MRM transitions were done with further DP and CE optimization. A specific set of MRM transitions was monitored for each period according to the metabolites eluted within the period. The MRM for each cultivar was performed in triplicate. Three technical replicates per sample were also analyzed in each series to assess technical reproducibility (Quality Controls: QCs). Through the overlapping display analysis of the total ions current (TIC) of MS detection and analysis of quality controls (QCs), the average variation in metabolite abundance within the QCs (RSD) was < 20%. It shows that the signal stability of LC-MS/MS in different time periods is good.
Statistical analysis
All experiments were performed in triplicates and the results were presented as mean ± standard deviation. Student’s t-test and fold change analysis were used to compare the differential metabolites between the two groups. The significant differences [p < 0.05 and | log2(FC) | > 1] among the mean values of different samples were analyzed by performing the Duncan test using IBM SPSS Statistics version 25 (IBM Corporation, New York, NY, USA). Correlation analysis used Pearson correlation coefficient, which measured the degree of linear correlation between two quantitative variables. The KEGG ID of different metabolites was used for pathway enrichment analysis to obtain the enrichment results of metabolic pathways.
Results and discussion
Phenotypic and extractive differences among the four peanut germplasms
The four peanut cultivars including Yuhua29 (YH29), Zhonghua12 (ZH12), Weihua10 (WH10), and Kainongbai (KNB) showed purple, red, pink, and white, testa colors respectively (Figure 1). The variation of metabolic components in these four peanut genotypes with different testa colors was investigated using targeted metabolomics analysis. The target metabolites were detected qualitatively and quantitatively by the method of UPLC-ESI-MS/MS (Ultra performance liquid chromatography-electrospray ionization-tandem mass spectrometry). Clear quantitative and qualitative differences were revealed with a first inspection of the raw data plotted as TIC (Total ions current) and base peak chromatograms, respectively (Supplementary Figure 1A). Raw data was processed in a target manner based on the dedicated analysis package which included absolute quantitative data of 130 phenolic substances in 13 categories, namely anthocyanidins, flavones, flavonols, flavanones, isoflavones, coumarins, dihydrochalcones, phenylpropanoids, proanthocyanidins, benzoic acid derivatives, catechin derivatives, stilbenes, and terpenoids. Most of the above substances were belong to flavonoids, and the rest were polyphenols closely related to flavonoids. A total of 85 metabolites were identified in four peanuts (Supplementary Table 1). These identified metabolites belonged to different subgroups, including 9 phenylpropanoids, 13 benzoic acid derivatives, 7 catechin derivatives, 3 stilbenes, 2 dihydrochalcones, 5 anthocyanidins, 5 flavones, 16 flavonols, 9 flavanones, 2 terpenoids, 4 coumarins, 6 isoflavones, and 4 proanthocyanidins.
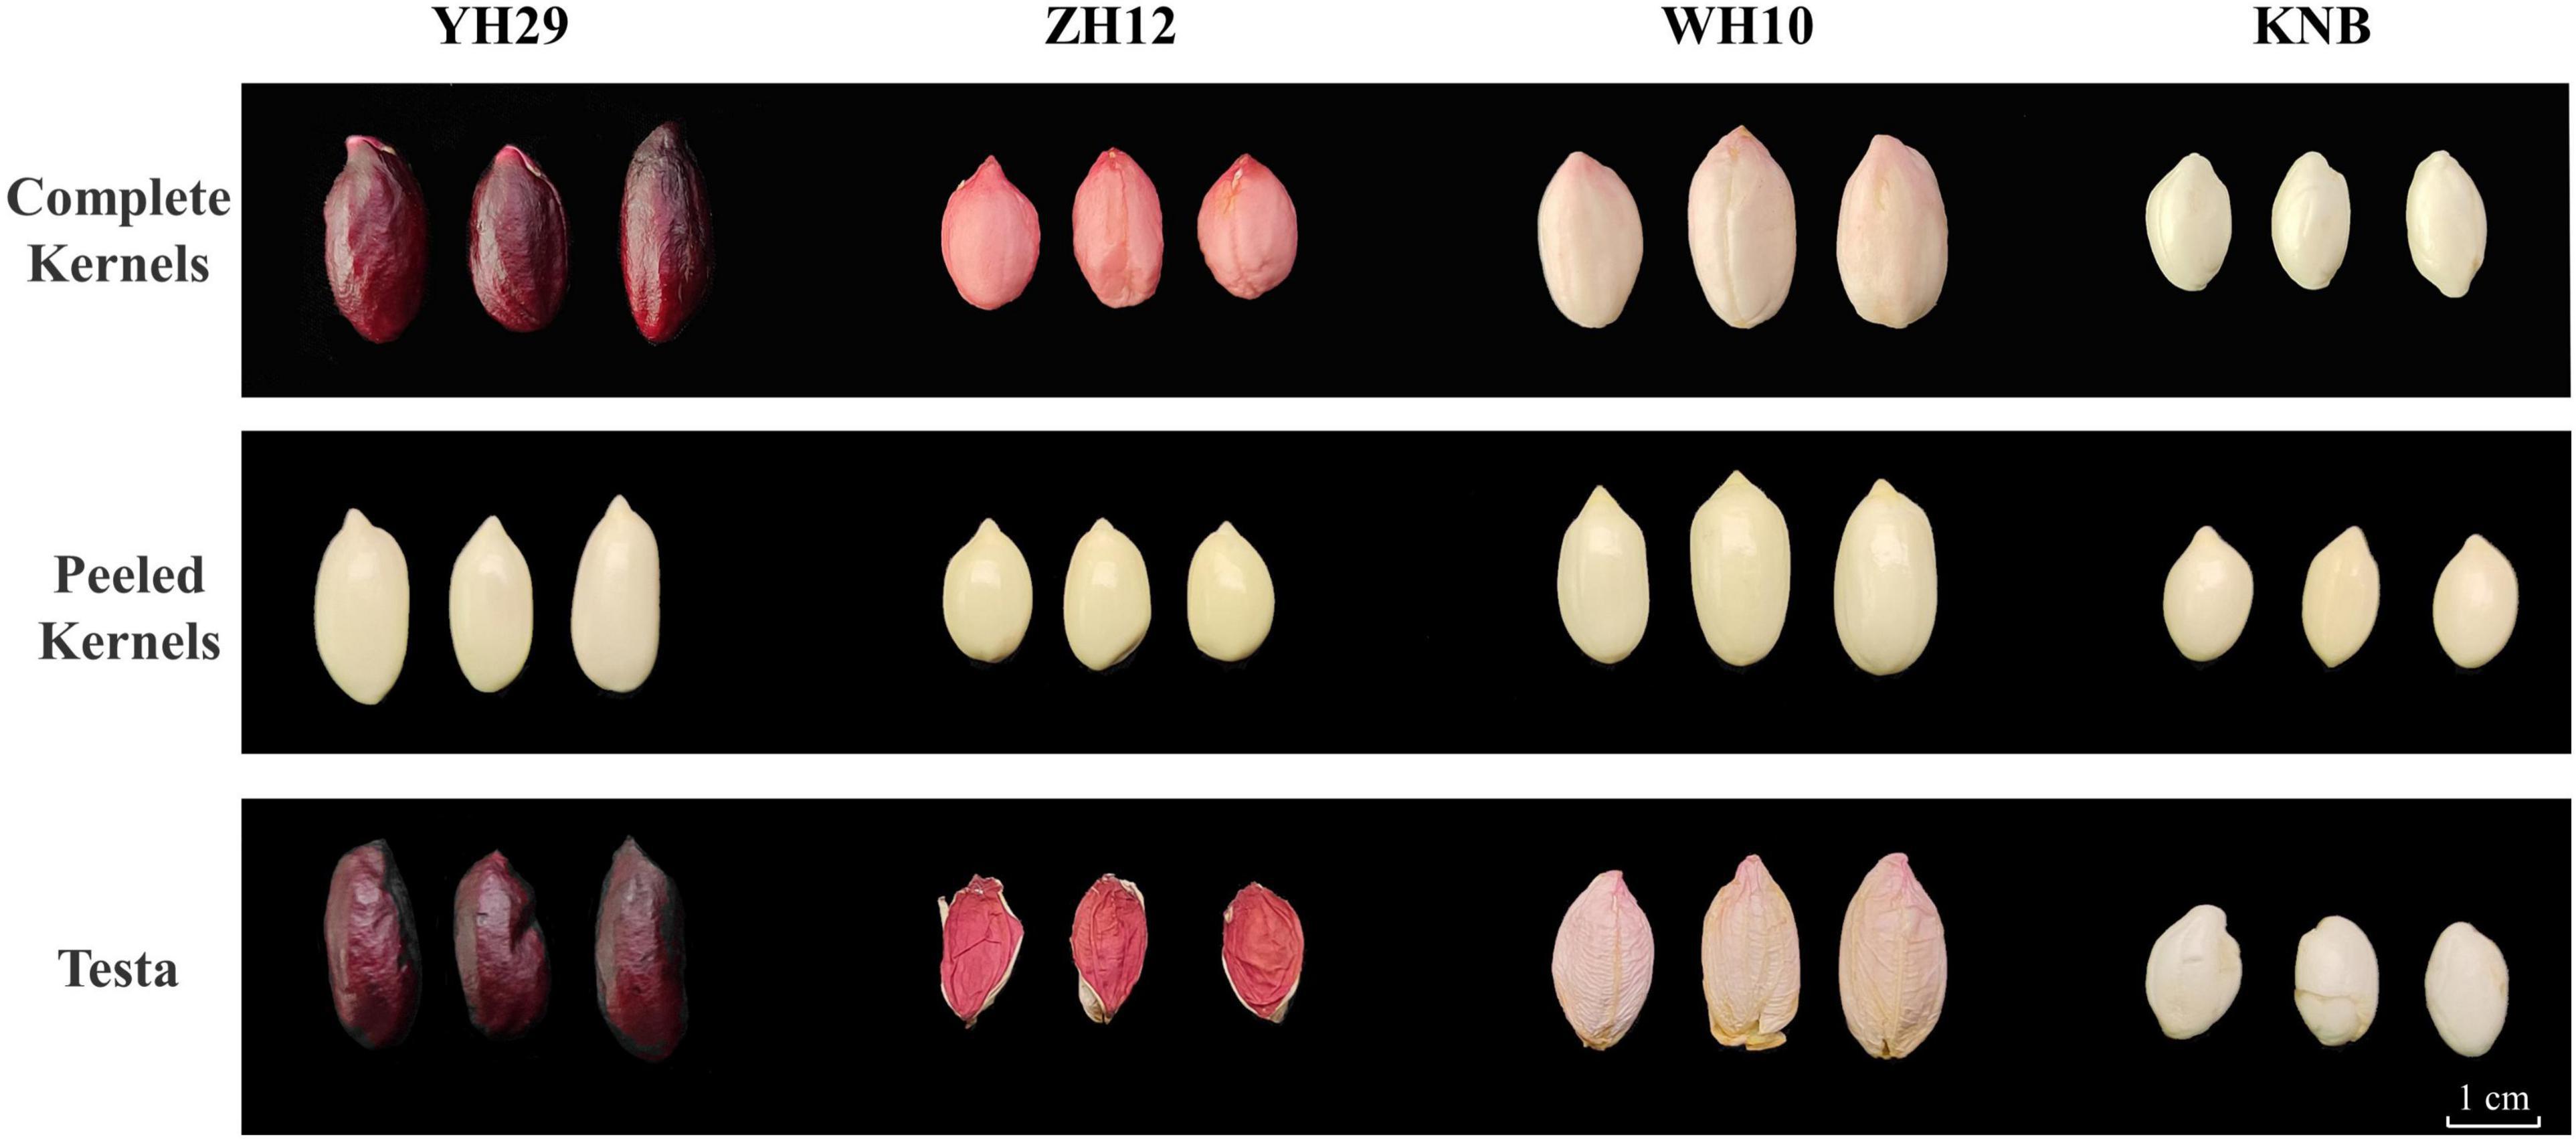
Figure 1. Phenotypic differences in the four color testa of peanut. Differences of complete kernels, peeled kernels, and testa color phenotypes among four varieties on the period of DAP 70.
Principal Component Analysis (PCA) confirmed that the biological replicates of each sample were well-correlated. Moreover, there were obvious differences between the four testa with different colors, which also demonstrated the different metabolite composition among the four samples (Figure 2A). We found that 46 metabolites were present in all four samples, and 2, 5, 2, and 3 metabolites were specific in YH29, ZH12, WH10, and KNB, respectively (Figure 2B).
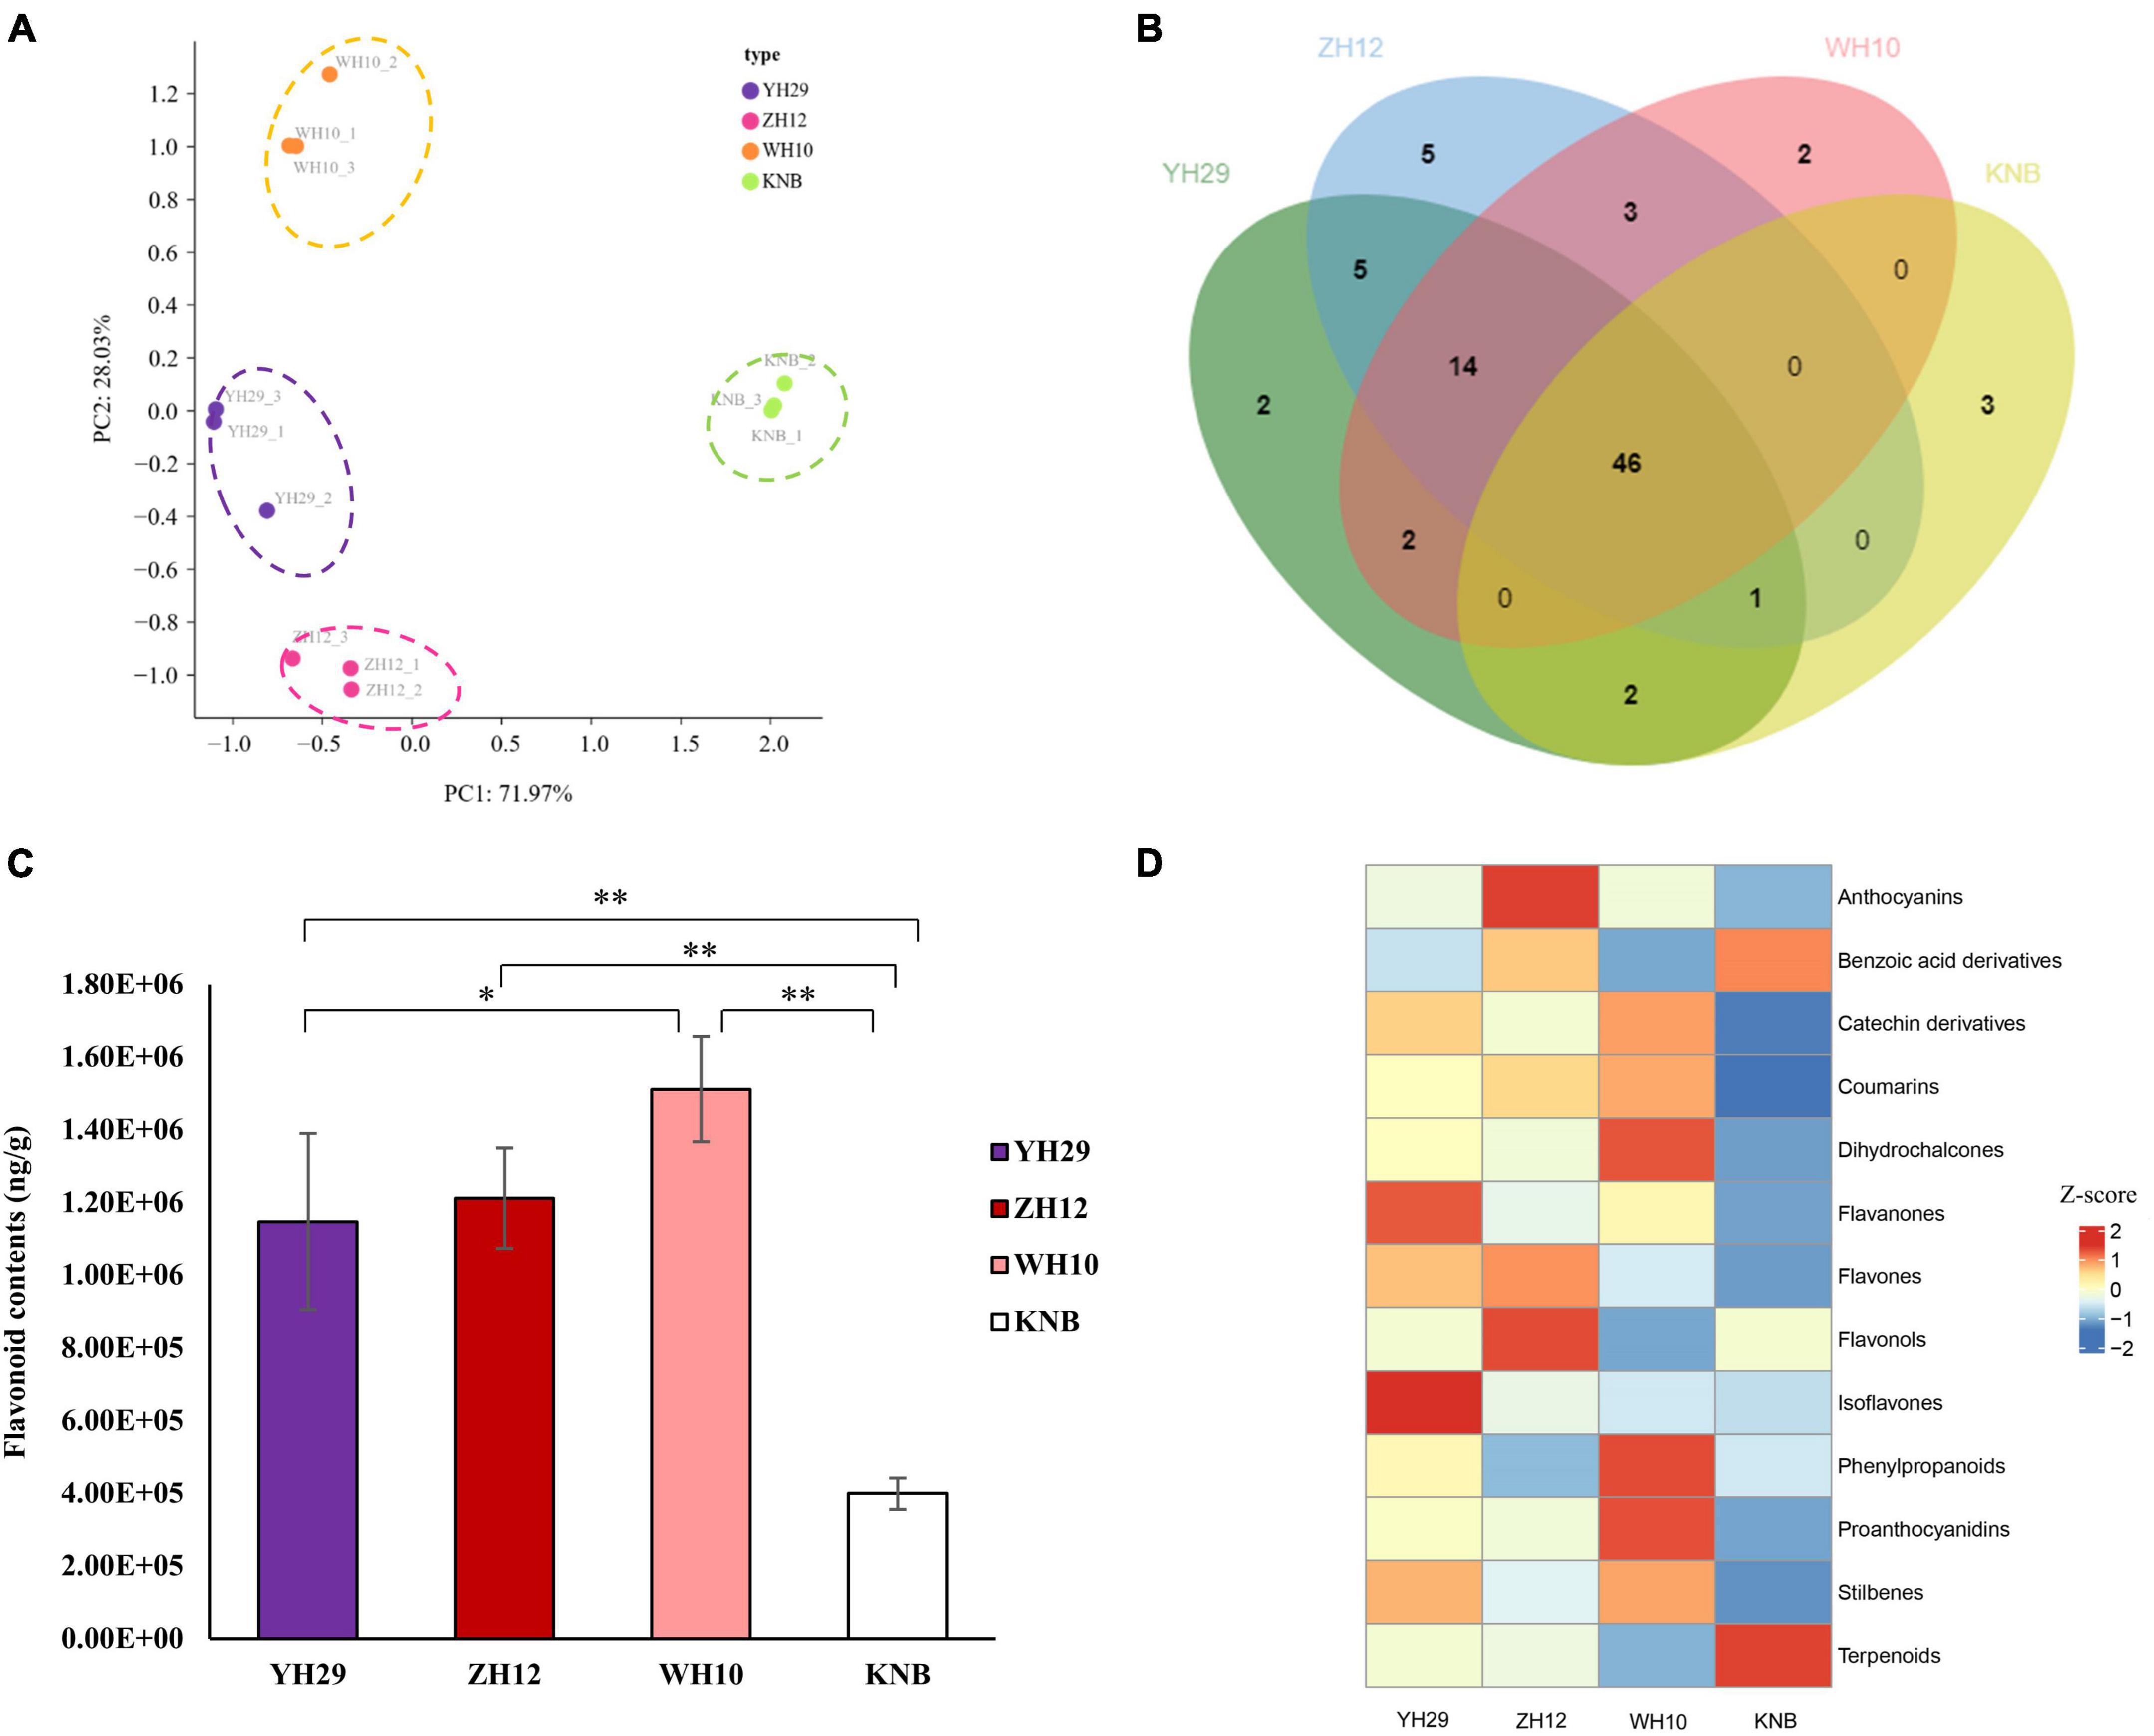
Figure 2. Extractive composition differences in type and content among the four samples. (A) Principal component analysis (PCA) score plots for metabolites in four types of peanut testa based on LC-MS/MS. (B) Distribution of the 85 flavonoids in the different colored testa. (C) The total content of flavonoids detected in the four samples. (D) The comparison of the relative contents of different type of flavonoids in the four samples. Row data is normalized into Z-score.
We found that the total content of flavonoids was highest in the pink testa of WH10, and lowest in the white testa of KNB (Figure 2C). The absolute content of various types of flavonoids revealed that proanthocyanidins, flavourols, catechin derivatives, phylpropanoids, and anthocyanins were the main flavonoids in peanut testa, while proanthocyanidins contributed more than half of the total flavonoids in the pink which contained the most flavonoids in four samples (Supplementary Figure 1B). The comparison of the relative contents of different groups of flavonoids in the four samples showed that the isoflavones and flavanones were abundant in YH29, anthocyanins, and flavourols were abundant in ZH12, phenopropanoids, proanthocyanidins, and dihydrochalcones were abundant in WH10, and terpenoids and benzoic acid derivatives were abundant in KNB, respectively (Figure 2D).
Distinguished metabolites in four peanut testa samples with different colors
In total, 78 differentially accumulated metabolites (DAMs) were identified across four testa colors (Supplementary Figure 2). Among them, 64 DAMs were differentially accumulated between the red (ZH12) and white (KNB) peanut testa colors, including 52 up-regulated and 12 down-regulated flavonoids (Supplementary Figure 3A). However, only 27 differentially expressed flavonoids were identified between purple (YH29) and pink (WH10) peanut testa colors (Figure 3A). We also observed that there was more kind of flavonoids in red testa peanut (ZH12) which had a total of 74 kinds, while there were only 52 kinds of flavonoids were identified in white (KNB) testa.
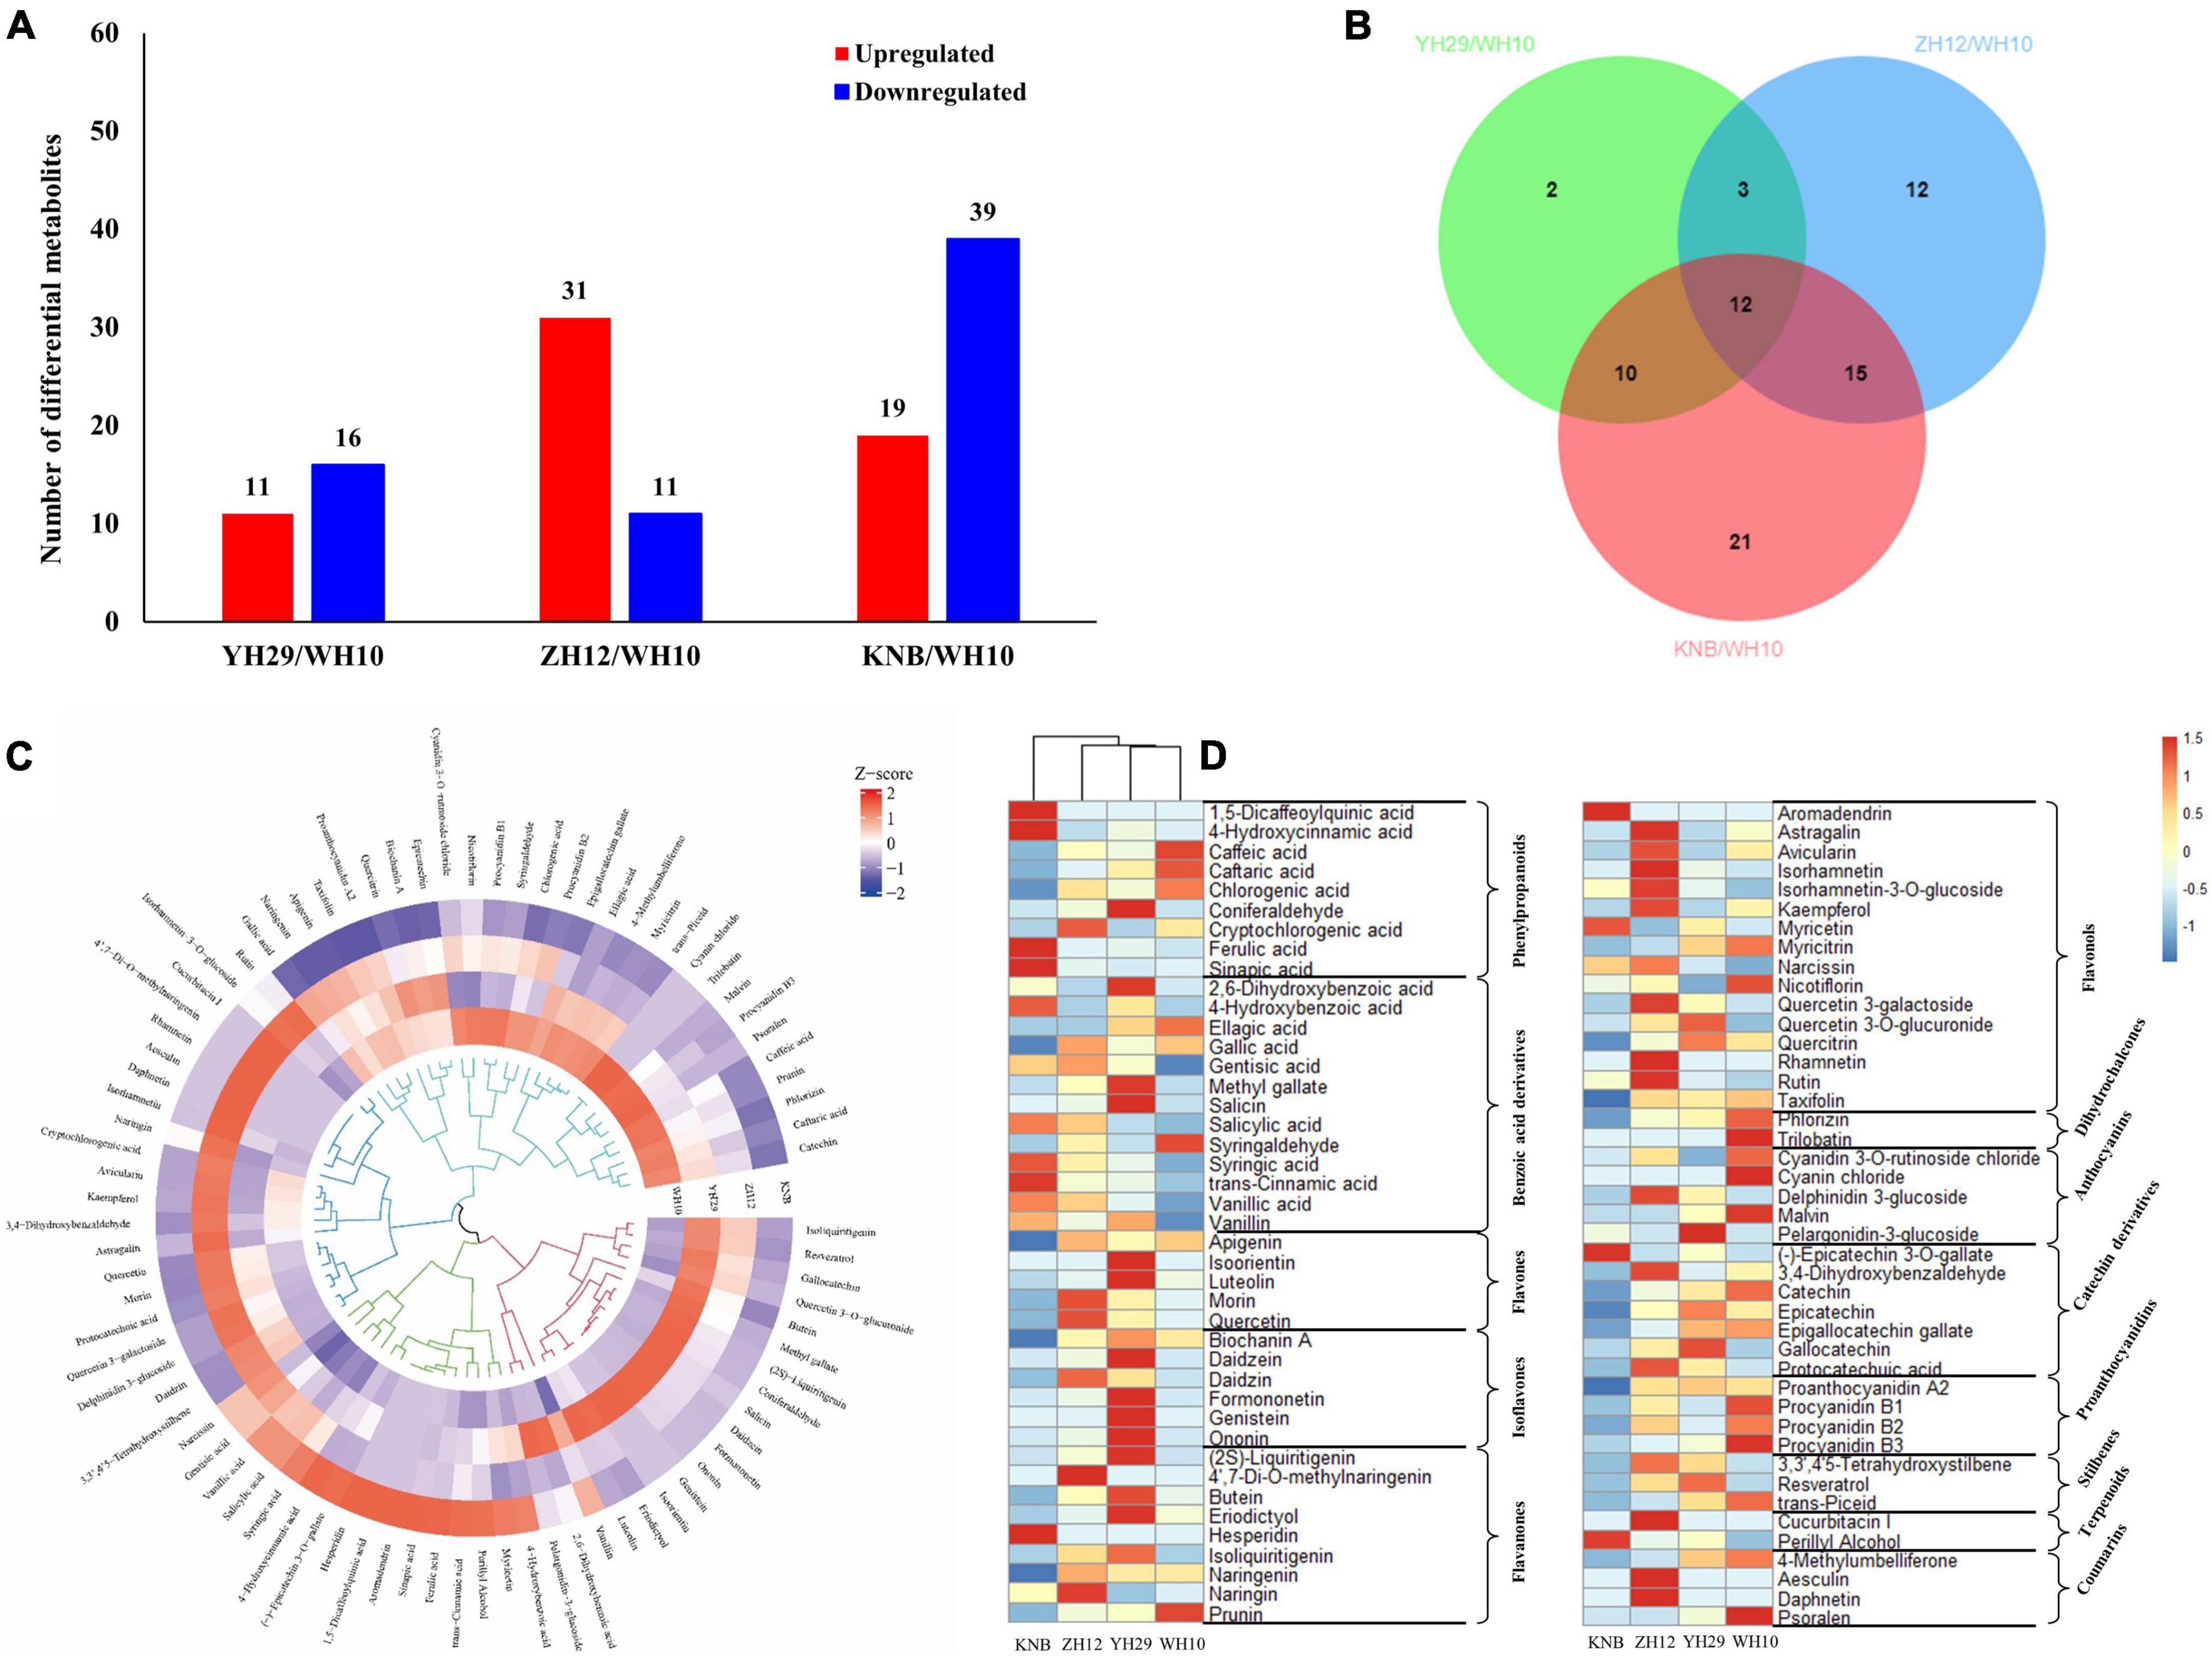
Figure 3. Statistics of distinguished metabolites in four peanut testa samples with different colors. (A) Differential accumulated metabolites (DAMs) between WH10 of the most common pink testa and other three. The blue color represents down-regulated metabolites, and the red color represents up-regulated metabolites. The significant difference conforms to p < 0.05 and | log2(FC) | > 1. (B) Venn diagram exhibiting the number of the key flavonoids related to the pink testa color. (C) The circular plot of hierarchical cluster analysis illustrating the classification of flavonoids. (D) The heatmap of differential metabolite divided into 13 subgroups. Row data is normalized into Z-score.
To find the key flavonoids in the formation of pink testa, Venn analysis was performed among the differential metabolites between YH29 and WH10, ZH12 and WH10, and KNB, and WH10 (Figure 3B). The result revealed that there were 12 overlapping significantly differential flavonoids among the three pairwise comparisons. Similarly, we compared the YH29, ZH12, and KNB against the other testa and detected 10, 15, and 30 overlapping differential metabolites, respectively (Supplementary Figure 3). In total, 49 overlapping different flavonoids were obtained (Table 1). These overlapping flavonoids may play an important role in the development of different colors of peanut testa.
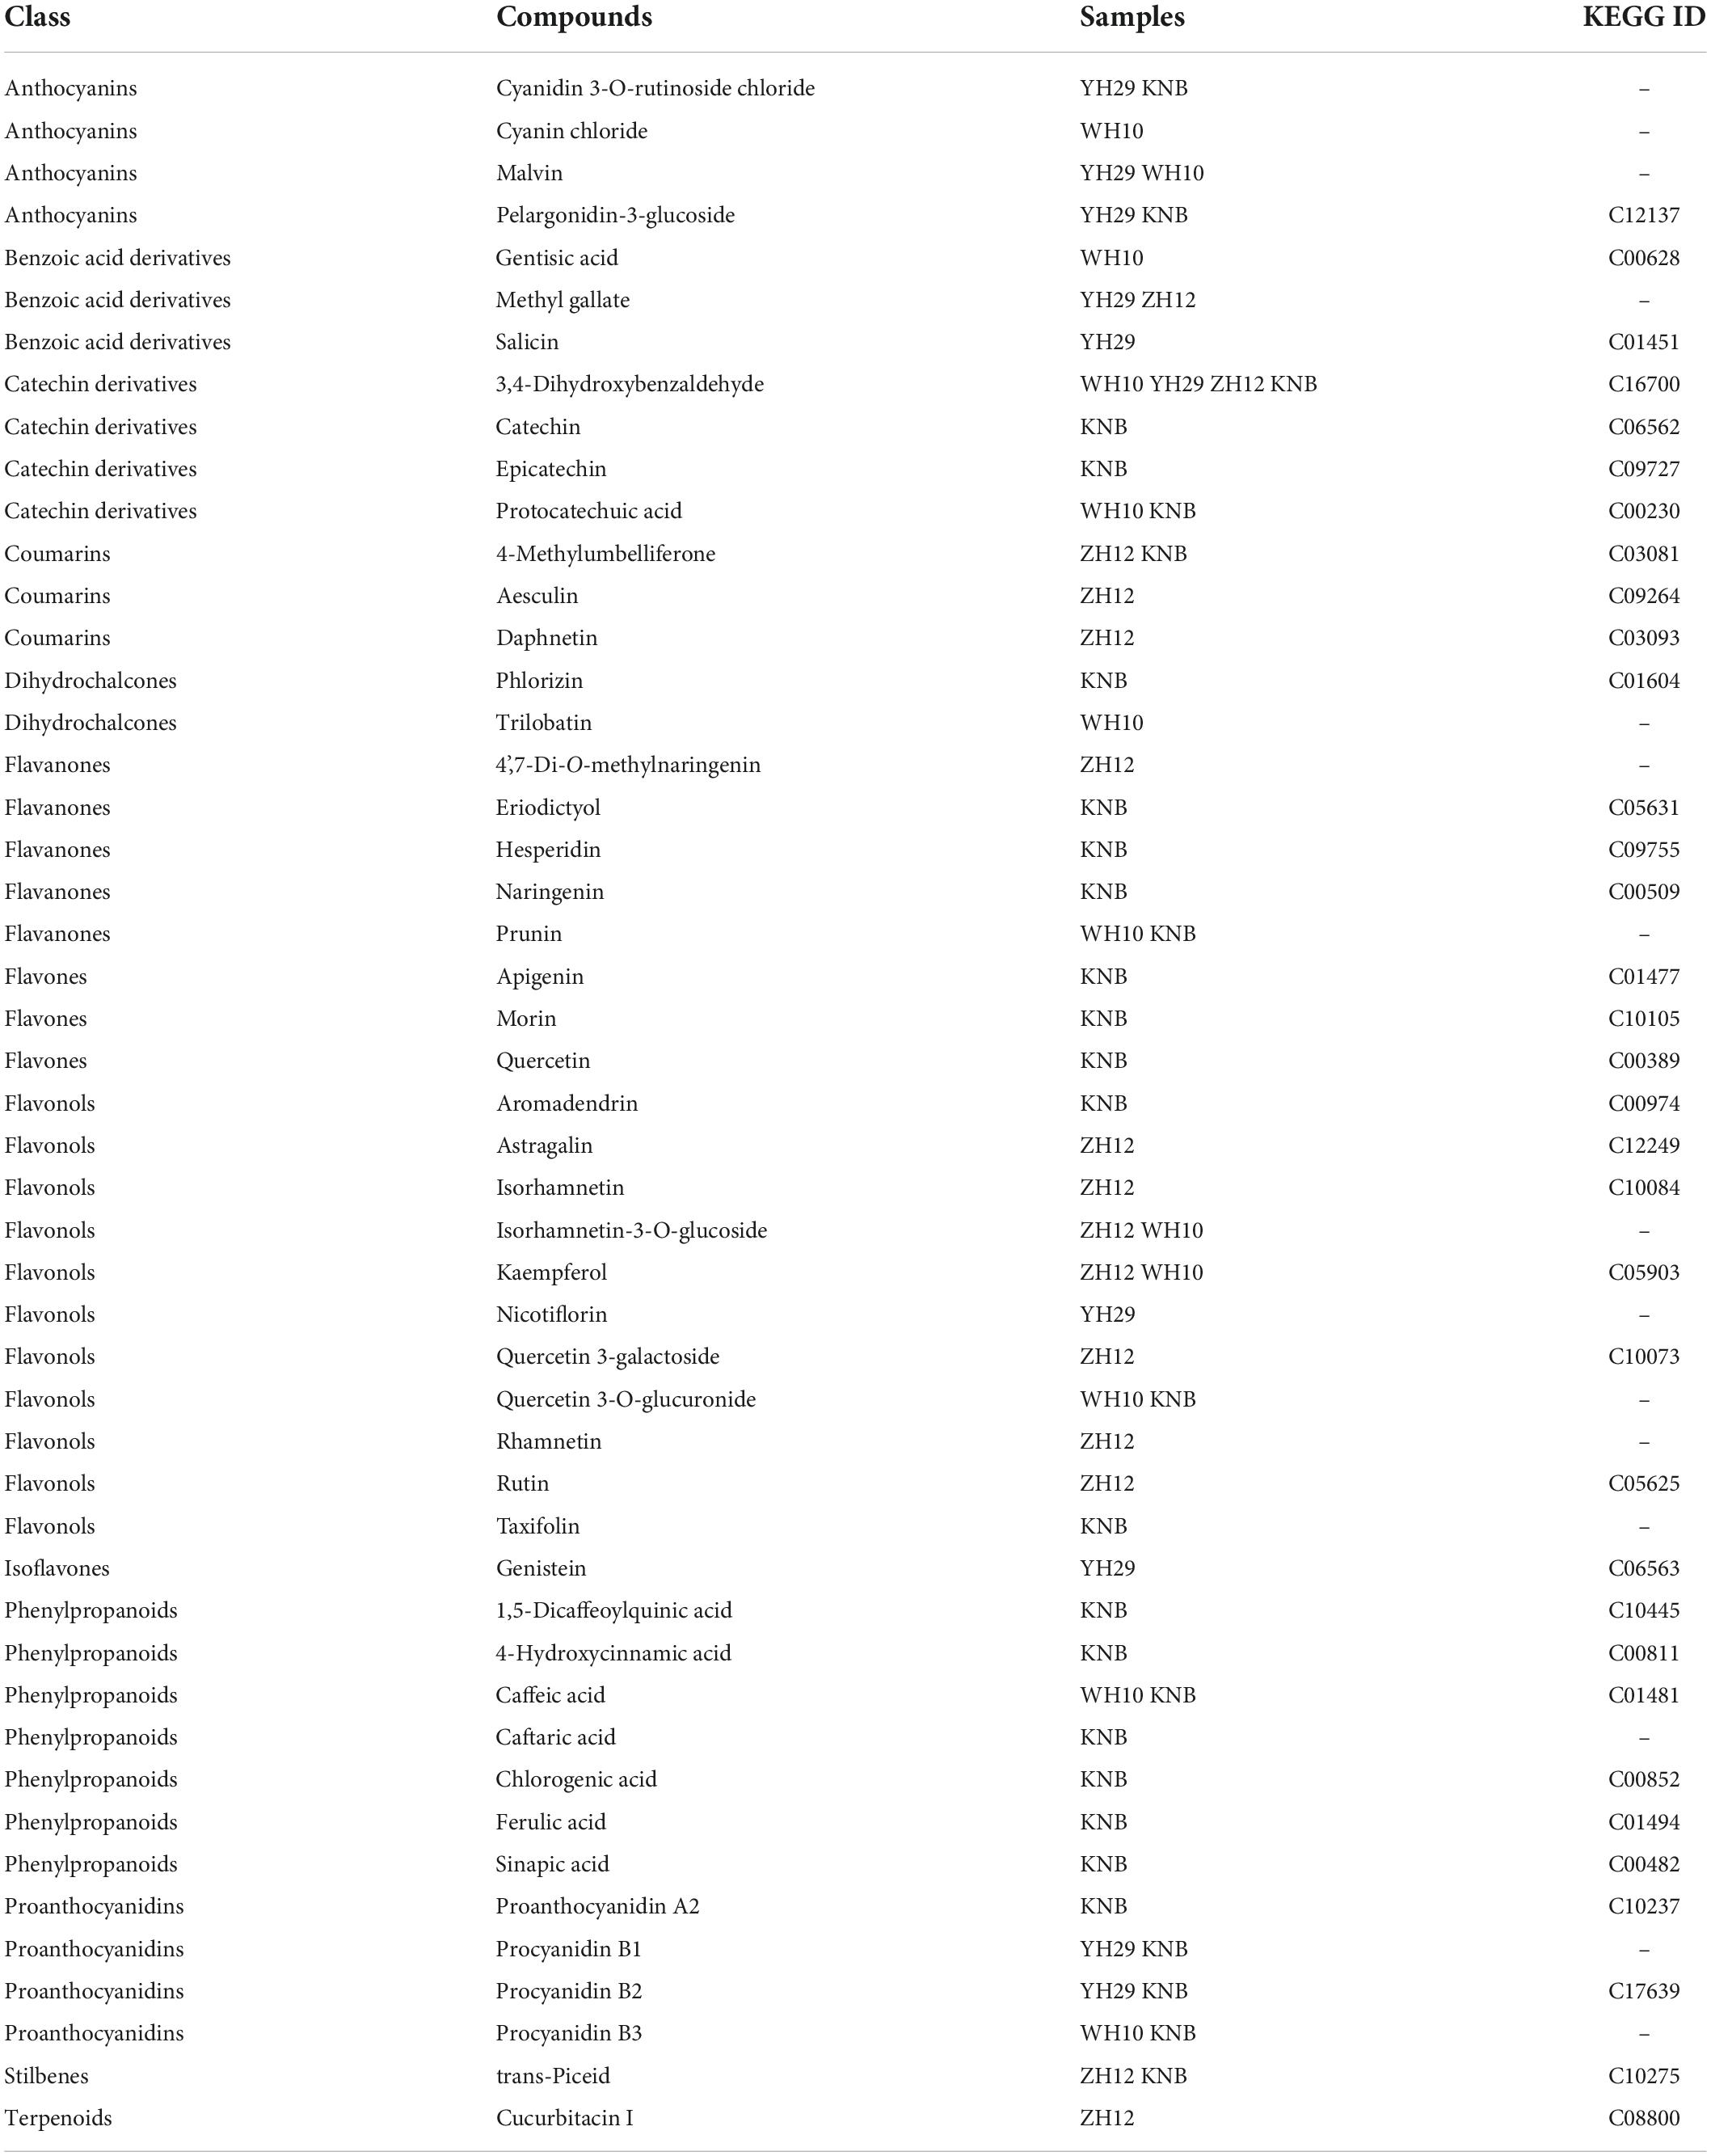
Table 1. Key 49 significantly differential metabolites between the different colored samples.
In order to visualize the accumulation patterns of metabolites in peanut testa with different colors, multivariate data analysis was performed (Figure 3C). Many specific metabolites were identified in different peanut testa colors, suggesting that the testa tissues might different metabolic pathways synthesizing different pigments. In addition, we also found that each testa had higher accumulation of specific metabolites as compare to other testa colors, implying different metabolic directions of flavonoids existing in differently colored testa of peanuts (Figure 3D). For instance, the phenylpropanoids and benzoic acid derivatives content were higher in white testa (KNB) than other three peanut testa colors. Moreover, the content of secondary metabolites in white testa of KNB after entering in the flavonoid pathway was significantly lower than that of the other samples. Some of the ultimate products like anthocyanidins and proanthocyanidins were not detected in KNB, indicating that the metabolites of white testa of KNB did not enter in the flavonoid production after phenylalanine biosynthesis pathway which is primary stage of flavonoid production.
Moreover, we found that the red testa of ZH12 had a higher content of flavonols. The purple testa of YH29 had a high level of flavonoids, flavanones and isoflavones, while pink testa of WH10 contained more downstream metabolites, such as dihydrochalcones, catechin derivatives, and proanthocyanidins (Figure 3D). Recently, the proanthocyanidins extracted from peanut testa were identified as a novel allosteric AKT inhibitor with potent anti-tumor efficacy beyond its antioxidant and anti-inflammatory properties (Liu et al., 2020). Here, we also observed that the total amount and types of proanthocyanidins which are terminal metabolites in flavonoid biosynthesis pathway were significantly higher in pink testa as compare to other peanut testa colors.
To better understand the variation of metabolic components between different peanut testa colors, we performed a pairwise comparison and identified top 20 various significant metabolites (Figure 4). The procyanidins content in pink testa (WH10) was significantly higher as compare to other testa colors. The purple testa (YH29) consistently showed higher anthocyanidin content. The red testa (ZH12) contained more coumarins and flavonols, such as daphnetin, aesculetin, kaempferol and avicularin. Meanwhile, phenylpropanoid, and benzoic acid derivatives were higher in white testa (KNB), for example 4-hydroxybenzoic acid, sinapic acid, 4-hydroxycinnamic acid, and ferulic acid.
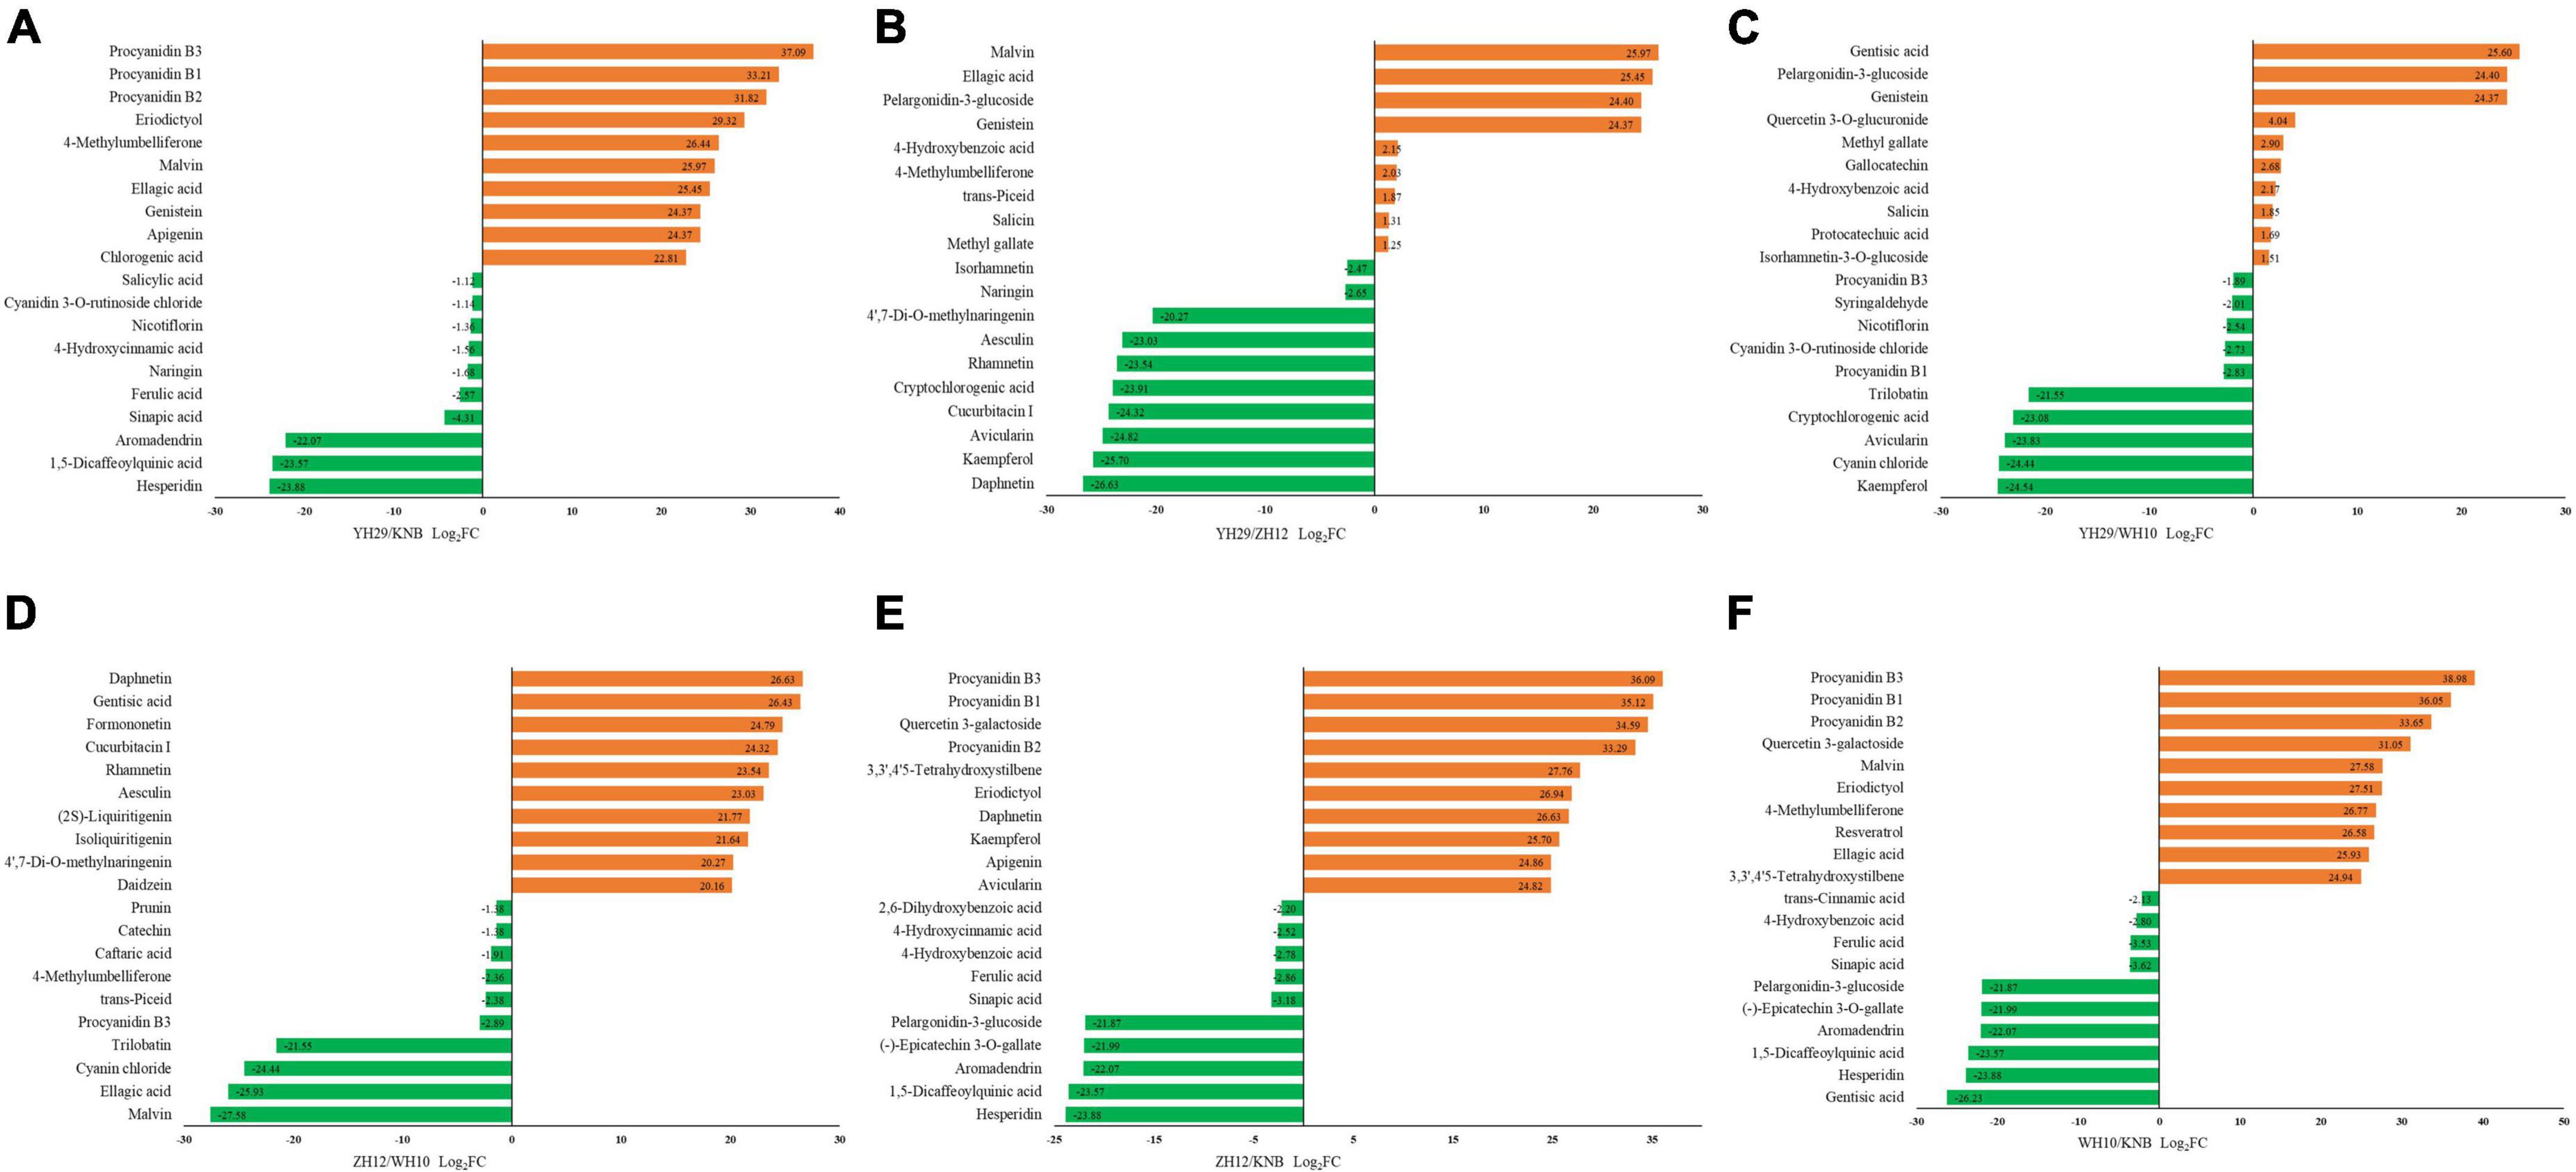
Figure 4. Top 20 differentially accumulated metabolites (DAMs) among the six pairwise groups of the fold change. (A) YH29 and KNB; (B) YH29 and ZH12; (C) YH29 and WH10; (D) ZH12 and WH10; (E) ZH12 and KNB; and (F) WH10 and KNB.
An increasing amount of evidence has showed that many flavonoids had biological activities, and the functions of flavonoids in nutrition and health care have been excavated (Supplementary Table 2). For example, the hydroxyl and carbonyl groups in the structure of most of the flavonoids could avoid oxidative damage by preventing the production of free radicals and scavenging their antioxidant activity (Rice-evans et al., 1995; Burda and Oleszek, 2001). Along with the antioxidant function, some flavonoids had anticancer (Imran et al., 2019), antitumor (Selvendiran et al., 2006), anti-inflammatory (Lee et al., 2011), antibacterial (Comalada et al., 2005), analgesic (Khan, 2017), antiallergic (Baghel et al., 2012), and many other health benefits. In addition, some compounds could also be used as nutritional additives, spices or essence (Raskin, 1992; Suresh et al., 2009). We can use these findings to deploy targeted and precise breeding of peanuts, and develop peanut varieties with high-quality, high content of target metabolites to develop the peanuts as functional foods.
Correlation analysis of differential metabolites in peanut testa
Since there are diverse metabolites present in various colors of peanut testa, it is an interesting to analyze the association between different metabolic compounds. Pearson correlation analysis showed significant (p < 0.05) pairwise correlation based on 26 flavonoids between purple (YH29)/pink (WH10) testa colors (Figure 5A). While, pairwise correlation based on 41 flavonoids between red testa (ZH12)/pink testa (WH10), and 57 flavonoids between pink testa (WH10)/white (KNB) (Figures 5B,C). The performance of some flavonoids in different correlation comparison groups was consistent. For instance, proanthocyanidins B1, B2, and B3 in pairs were consistently showed positive correlation. Proanthocyanidins were positively correlated with cyanidin 3-O-rutinoside and malvin, but negatively correlated with pelargonidin-3-glucoside (Figure 5D). Interestingly, these are all anthocyanidins. There were also some flavonoids with different correlations in different groups. For instance, proanthocyanidins were positively correlated with kaempferol and astragalin in YH29/WH10, WH10/KNB, YH29/ZH12, and ZH12/KNB, while negatively correlated in ZH12/WH10 (Supplementary Figure 4). These results indicated that the flavonoid metabolic pathway is basically same in different testa color varieties, however some changes might occur due to individual gene variations in the pathway.
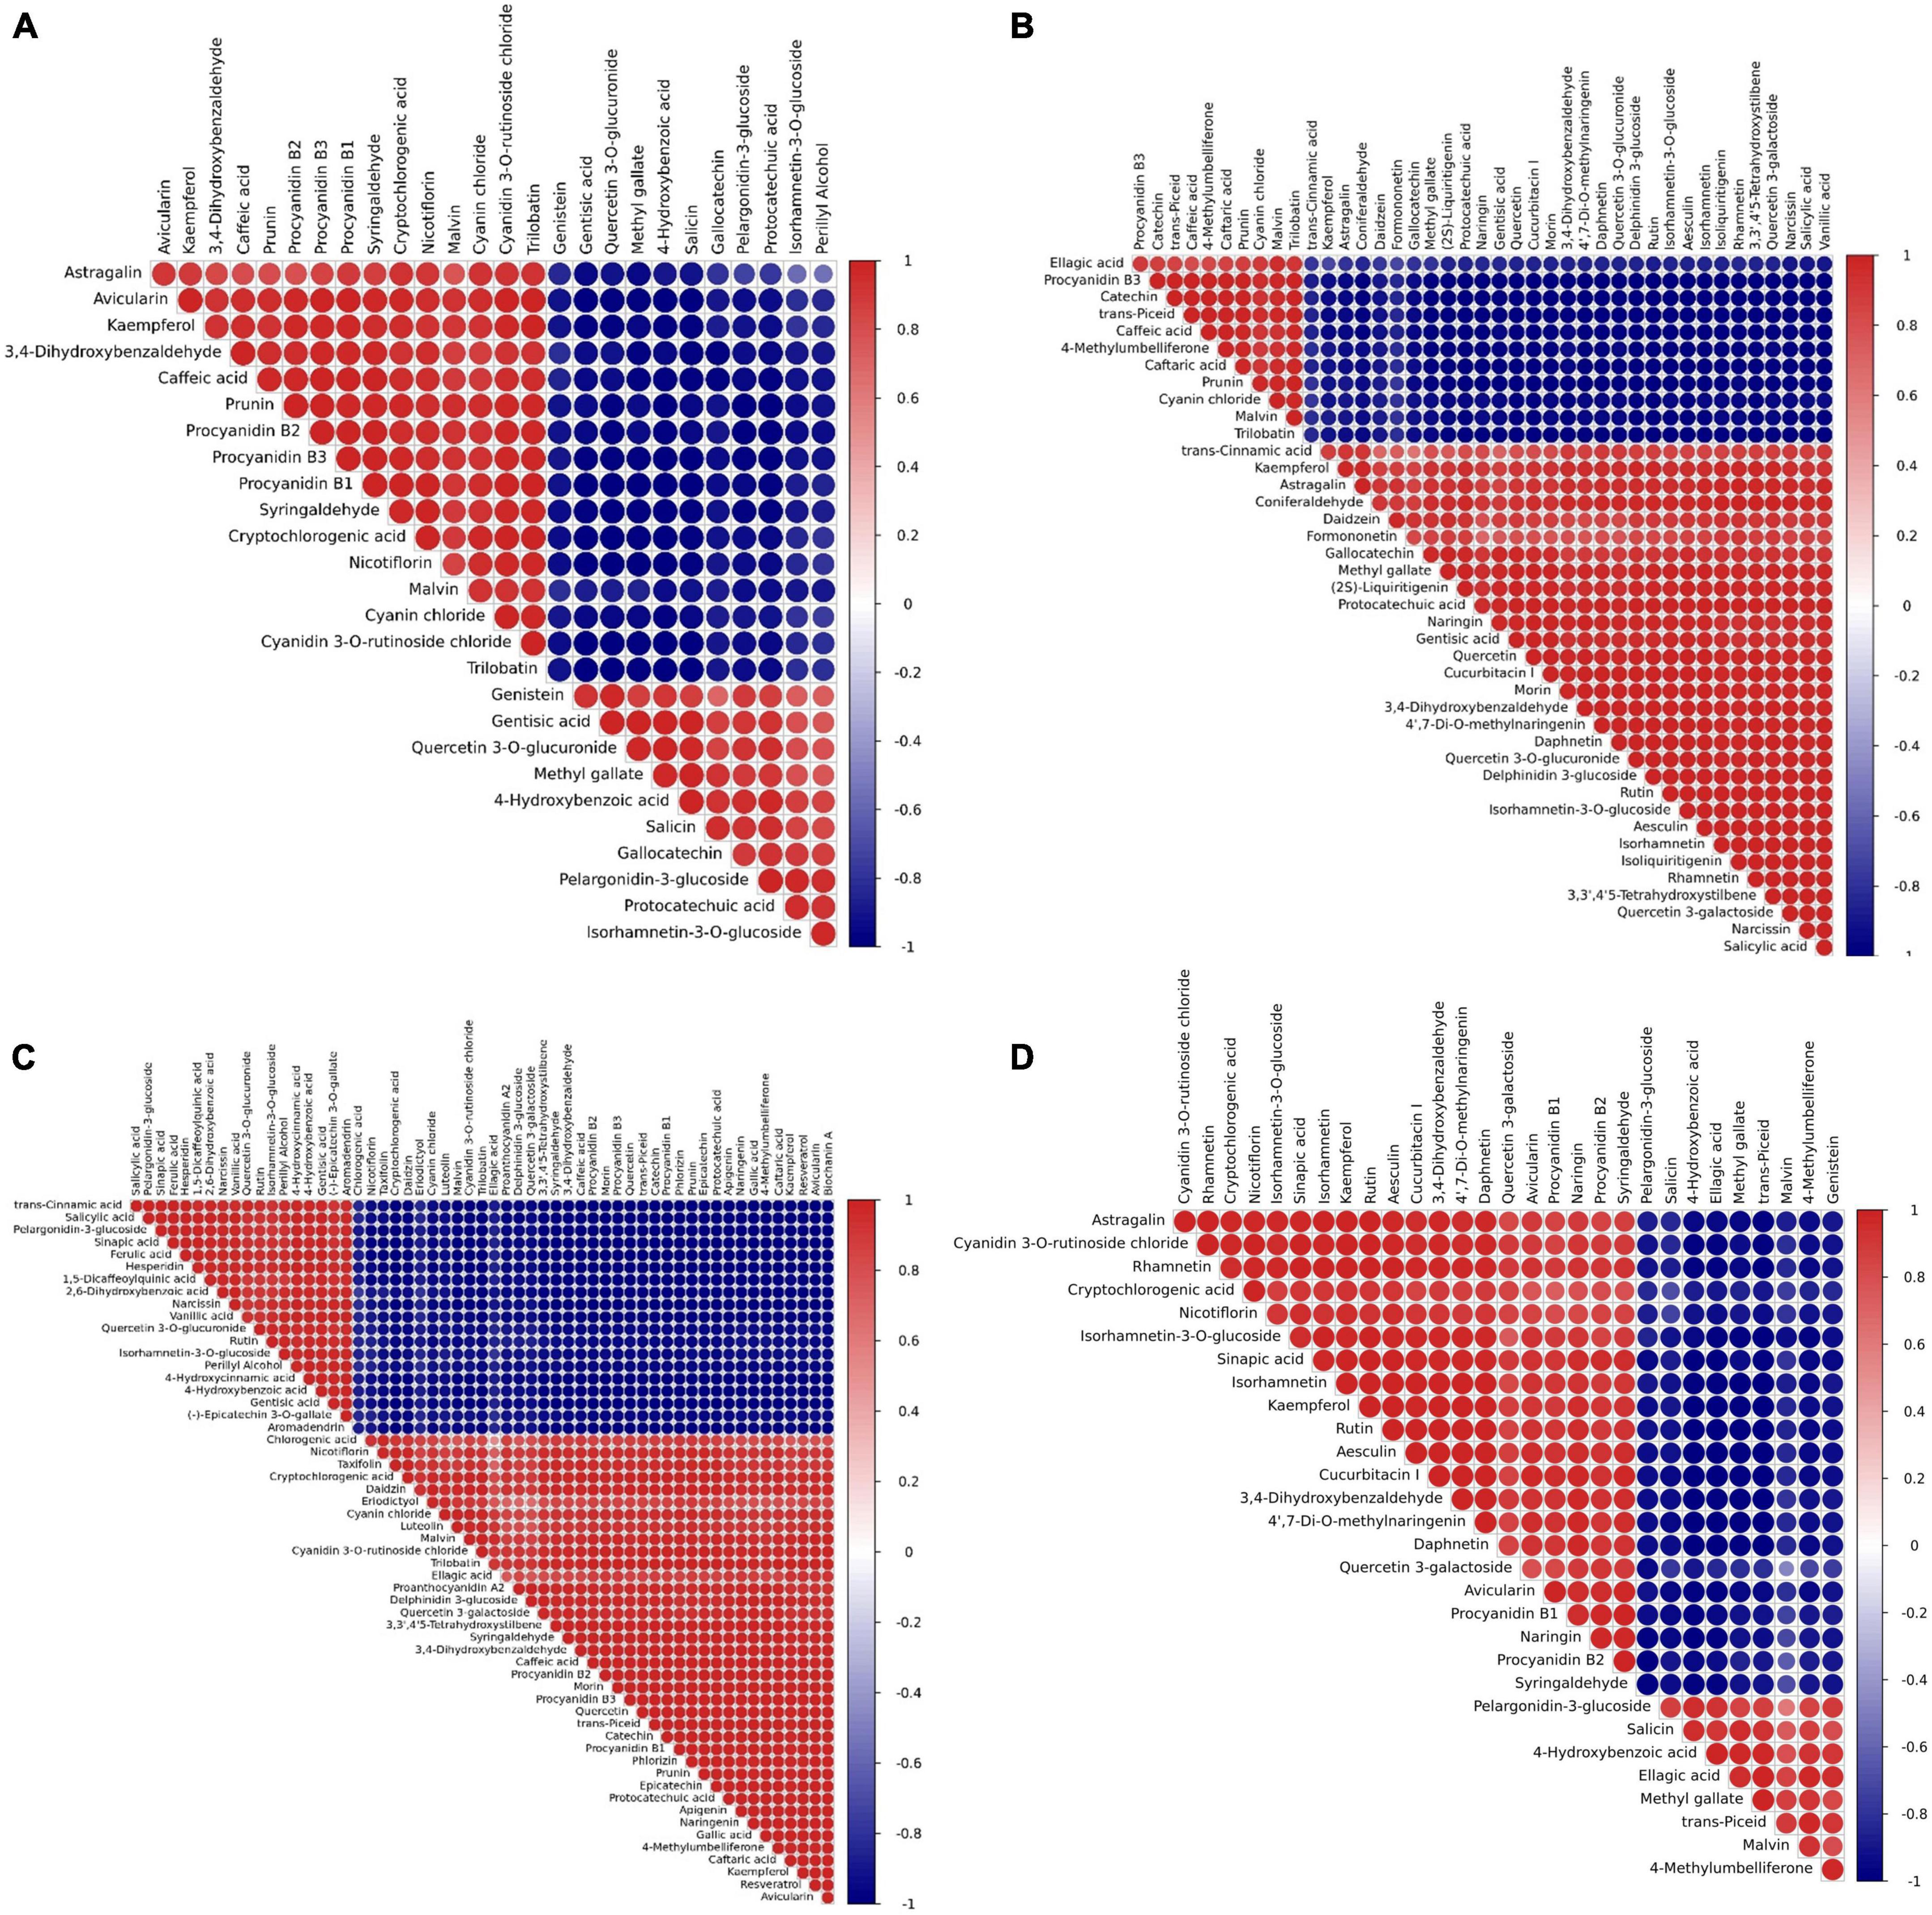
Figure 5. Pearson correlation analysis results for differential metabolites by pairwise. (A) YH29 and WH10; (B) ZH12 and WH10; (C) WH10 and KNB; and (D) YH29 and ZH12. Dark red represents a significant positive correlation. Dark blue represents a significant negative correlation.
Enrichment analysis of metabolic pathways and flow direction of metabolites
In the pink testa peanut WH10, the pathways of “Flavone and flavonol biosynthesis” and “Flavonoid biosynthesis” were highly enriched (Figure 6A). Flavonoid biosynthesis, flavone and flavonol biosynthesis were significantly differential metabolites between red (ZH12) and pink (WH10) were mostly involved in flavonoid biosynthesis, (Figure 6B). The differential metabolites between white (KNB) and pink (WH10) were involved flavonoid biosynthesis, flavone and flavonol biosynthesis (Figure 6C). Our data indicated that the differential metabolites between YH29 and ZH12 were enriched mainly in flavone and flavonol biosynthesis (Figure 6D). The KEGG between YH29/KNB and ZH12/KNB enriched mainly in flavonoid biosynthesis, flavone and flavonol biosynthesis, isoflavonoid biosynthesis, and phenylpropanoid biosynthesis (Supplementary Figure 5).
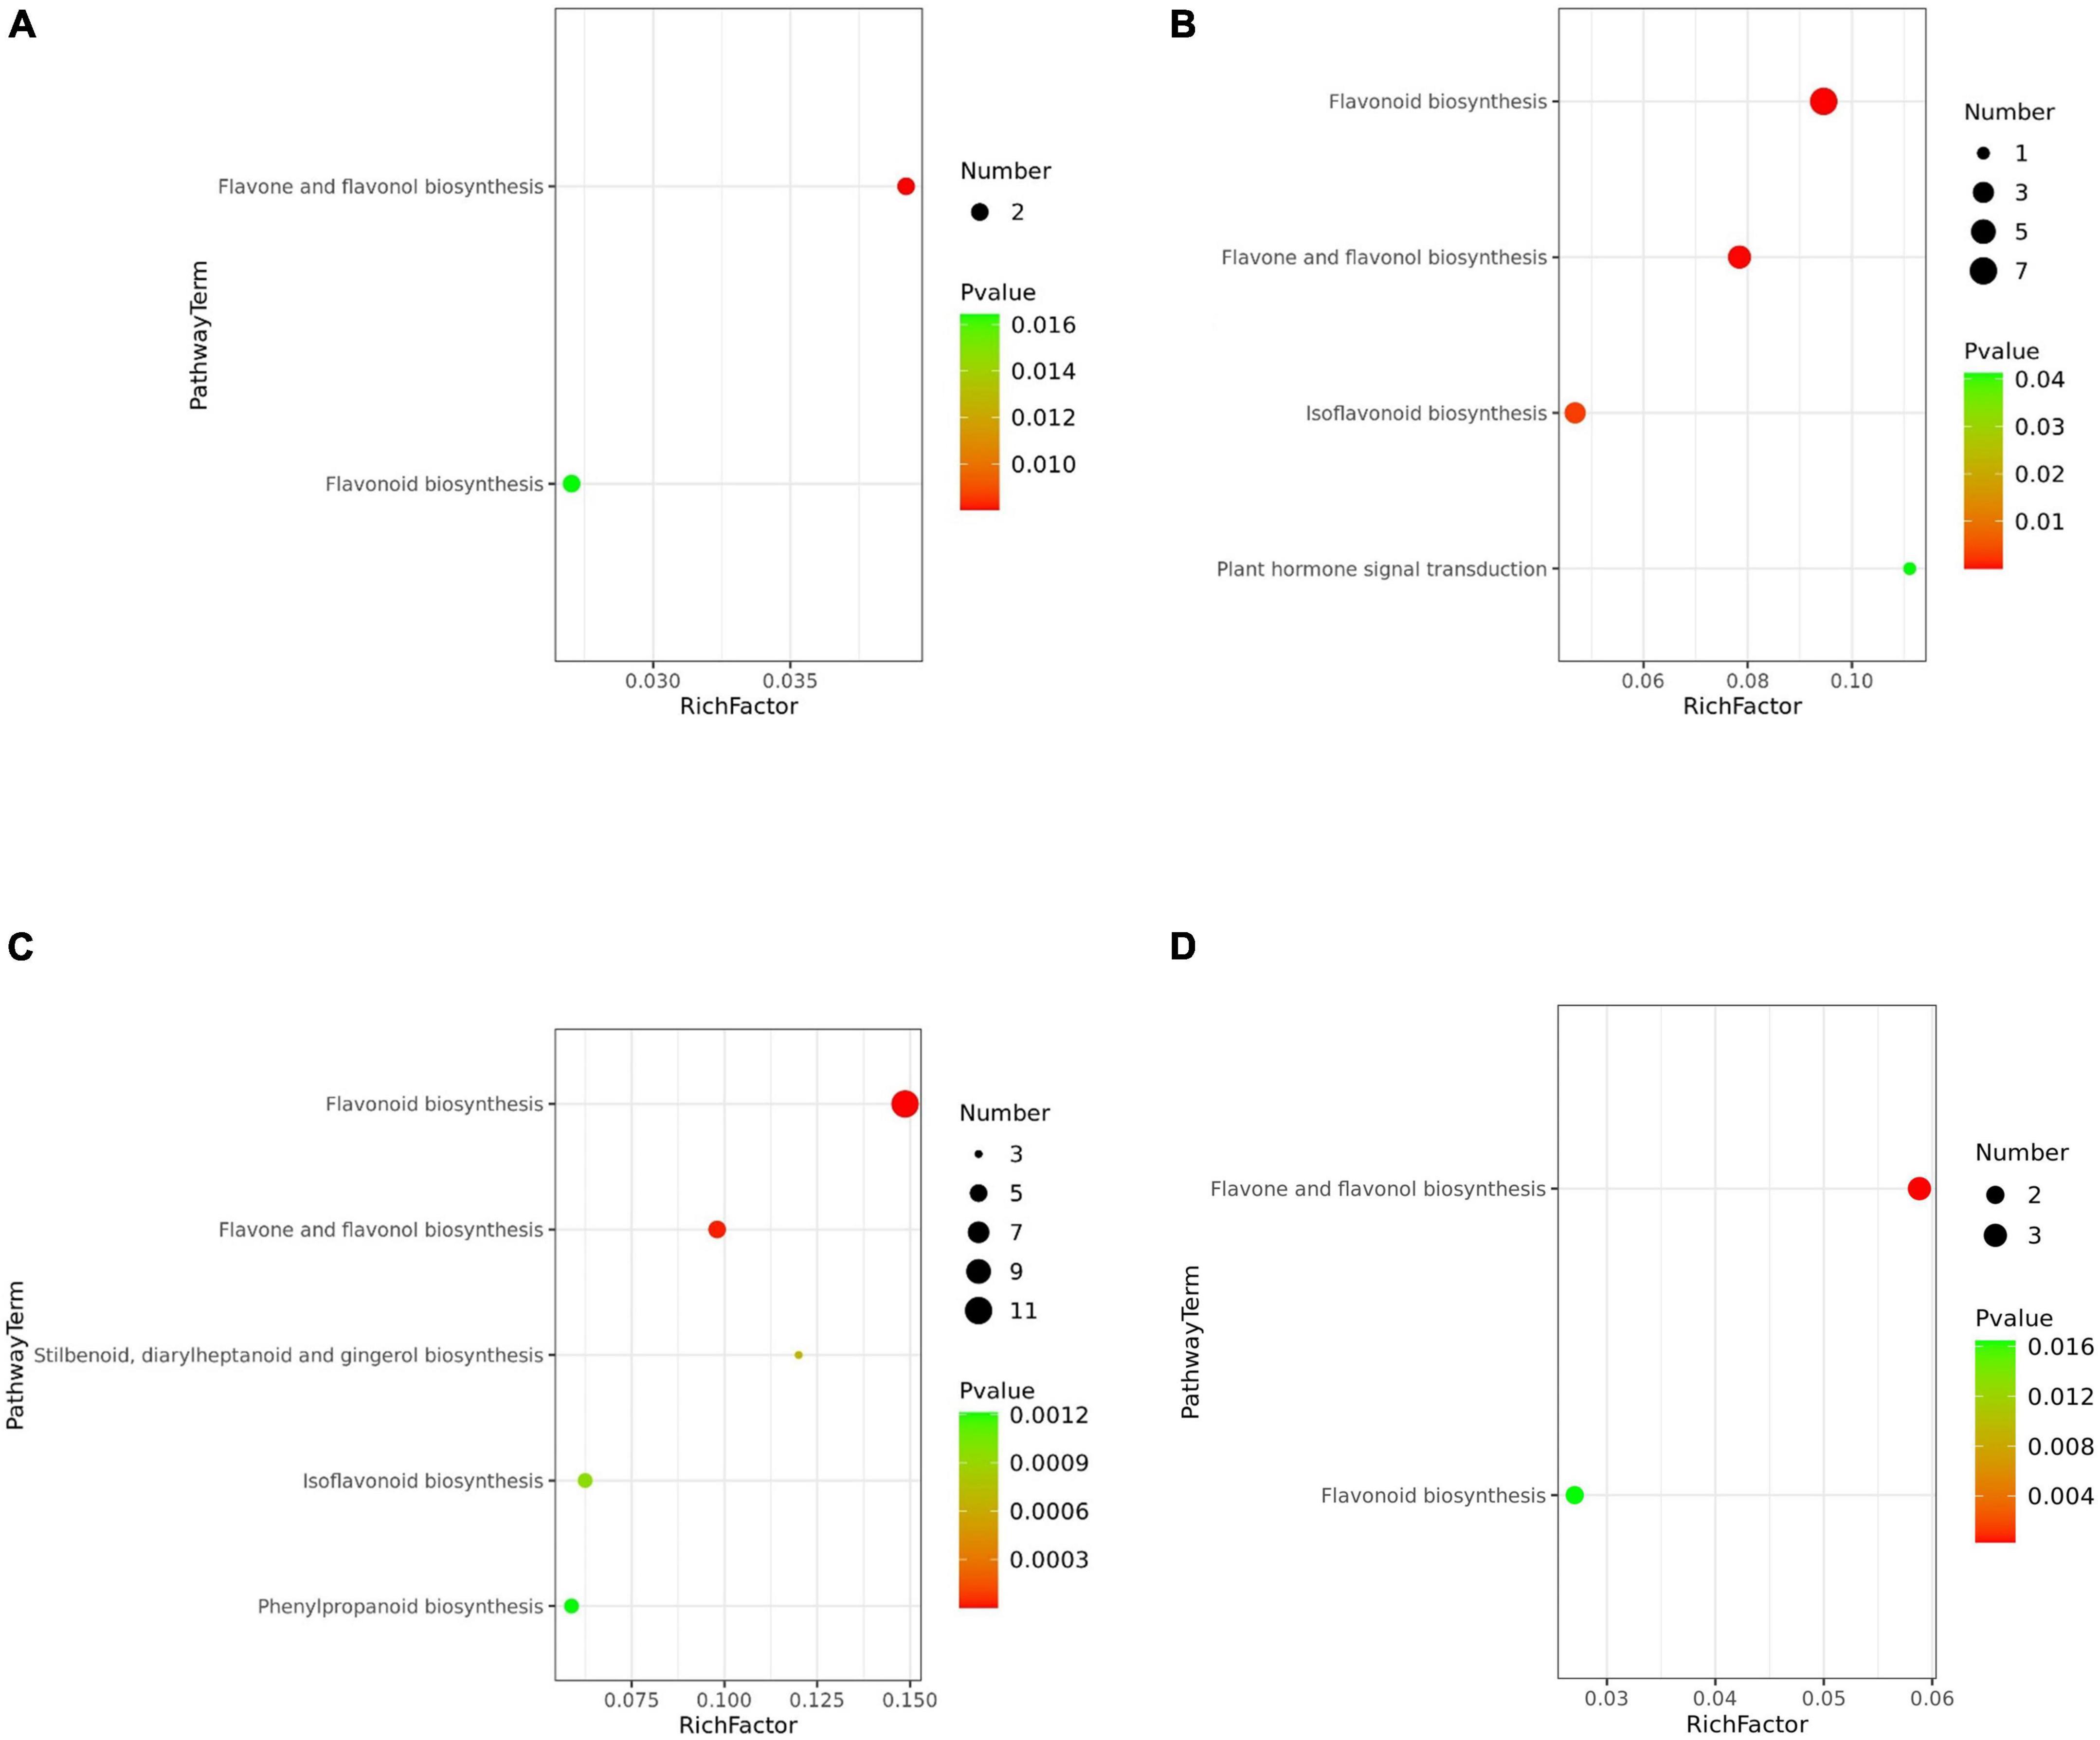
Figure 6. Bubble plot of KEGG metabolic pathway enrichment analysis. (A) YH29 and WH10; (B) ZH12 and WH10; (C) WH10 and KNB; and (D) YH29 and ZH12. The p-value in the metabolic pathway is the significance of the enrichment of the metabolic pathway, and the significant enrichment pathway is selected for bubble plot. The ordinate is the name of metabolic pathway. The abscissa is the enrichment factor (rich factor means number of significantly different metabolites/number of total metabolites in the pathway). The larger the rich factor, the greater the enrichment degree. The color from red to green indicates that p-value decreases in turn. The larger the point, the more metabolites enriched on the pathway.
A schematic diagram was deduced to illustrate the selected differential metabolites among the six pairwise comparisons in the flavonoid biosynthesis pathway (Figure 7). Compared with the pink (WH10), the flavonoids in the testa of red (ZH12) obviously flowed to the isoflavone, flavonol and anthocyanin synthesis pathways. In contrast, the content of proanthocyanidin and catechin, which was the proanthocyanidin synthetic monomers, in WH10 is significantly higher than that in ZH12. Therefore, we concluded that there are several “key nodes” or “switches” in the pink and red testa peanut varieties, which controlled the accumulation and flow direction of flavonoids which results in significant differences in flavonoids metabolites in testa of red and pink color. We speculated that the most likely “key nodes” between red (ZH12) and pink (WH10) were the branches from the main flavonoid biosynthesis pathway to the isoflavone pathway, to the flavonol pathway and to the proanthocyanidin pathway.
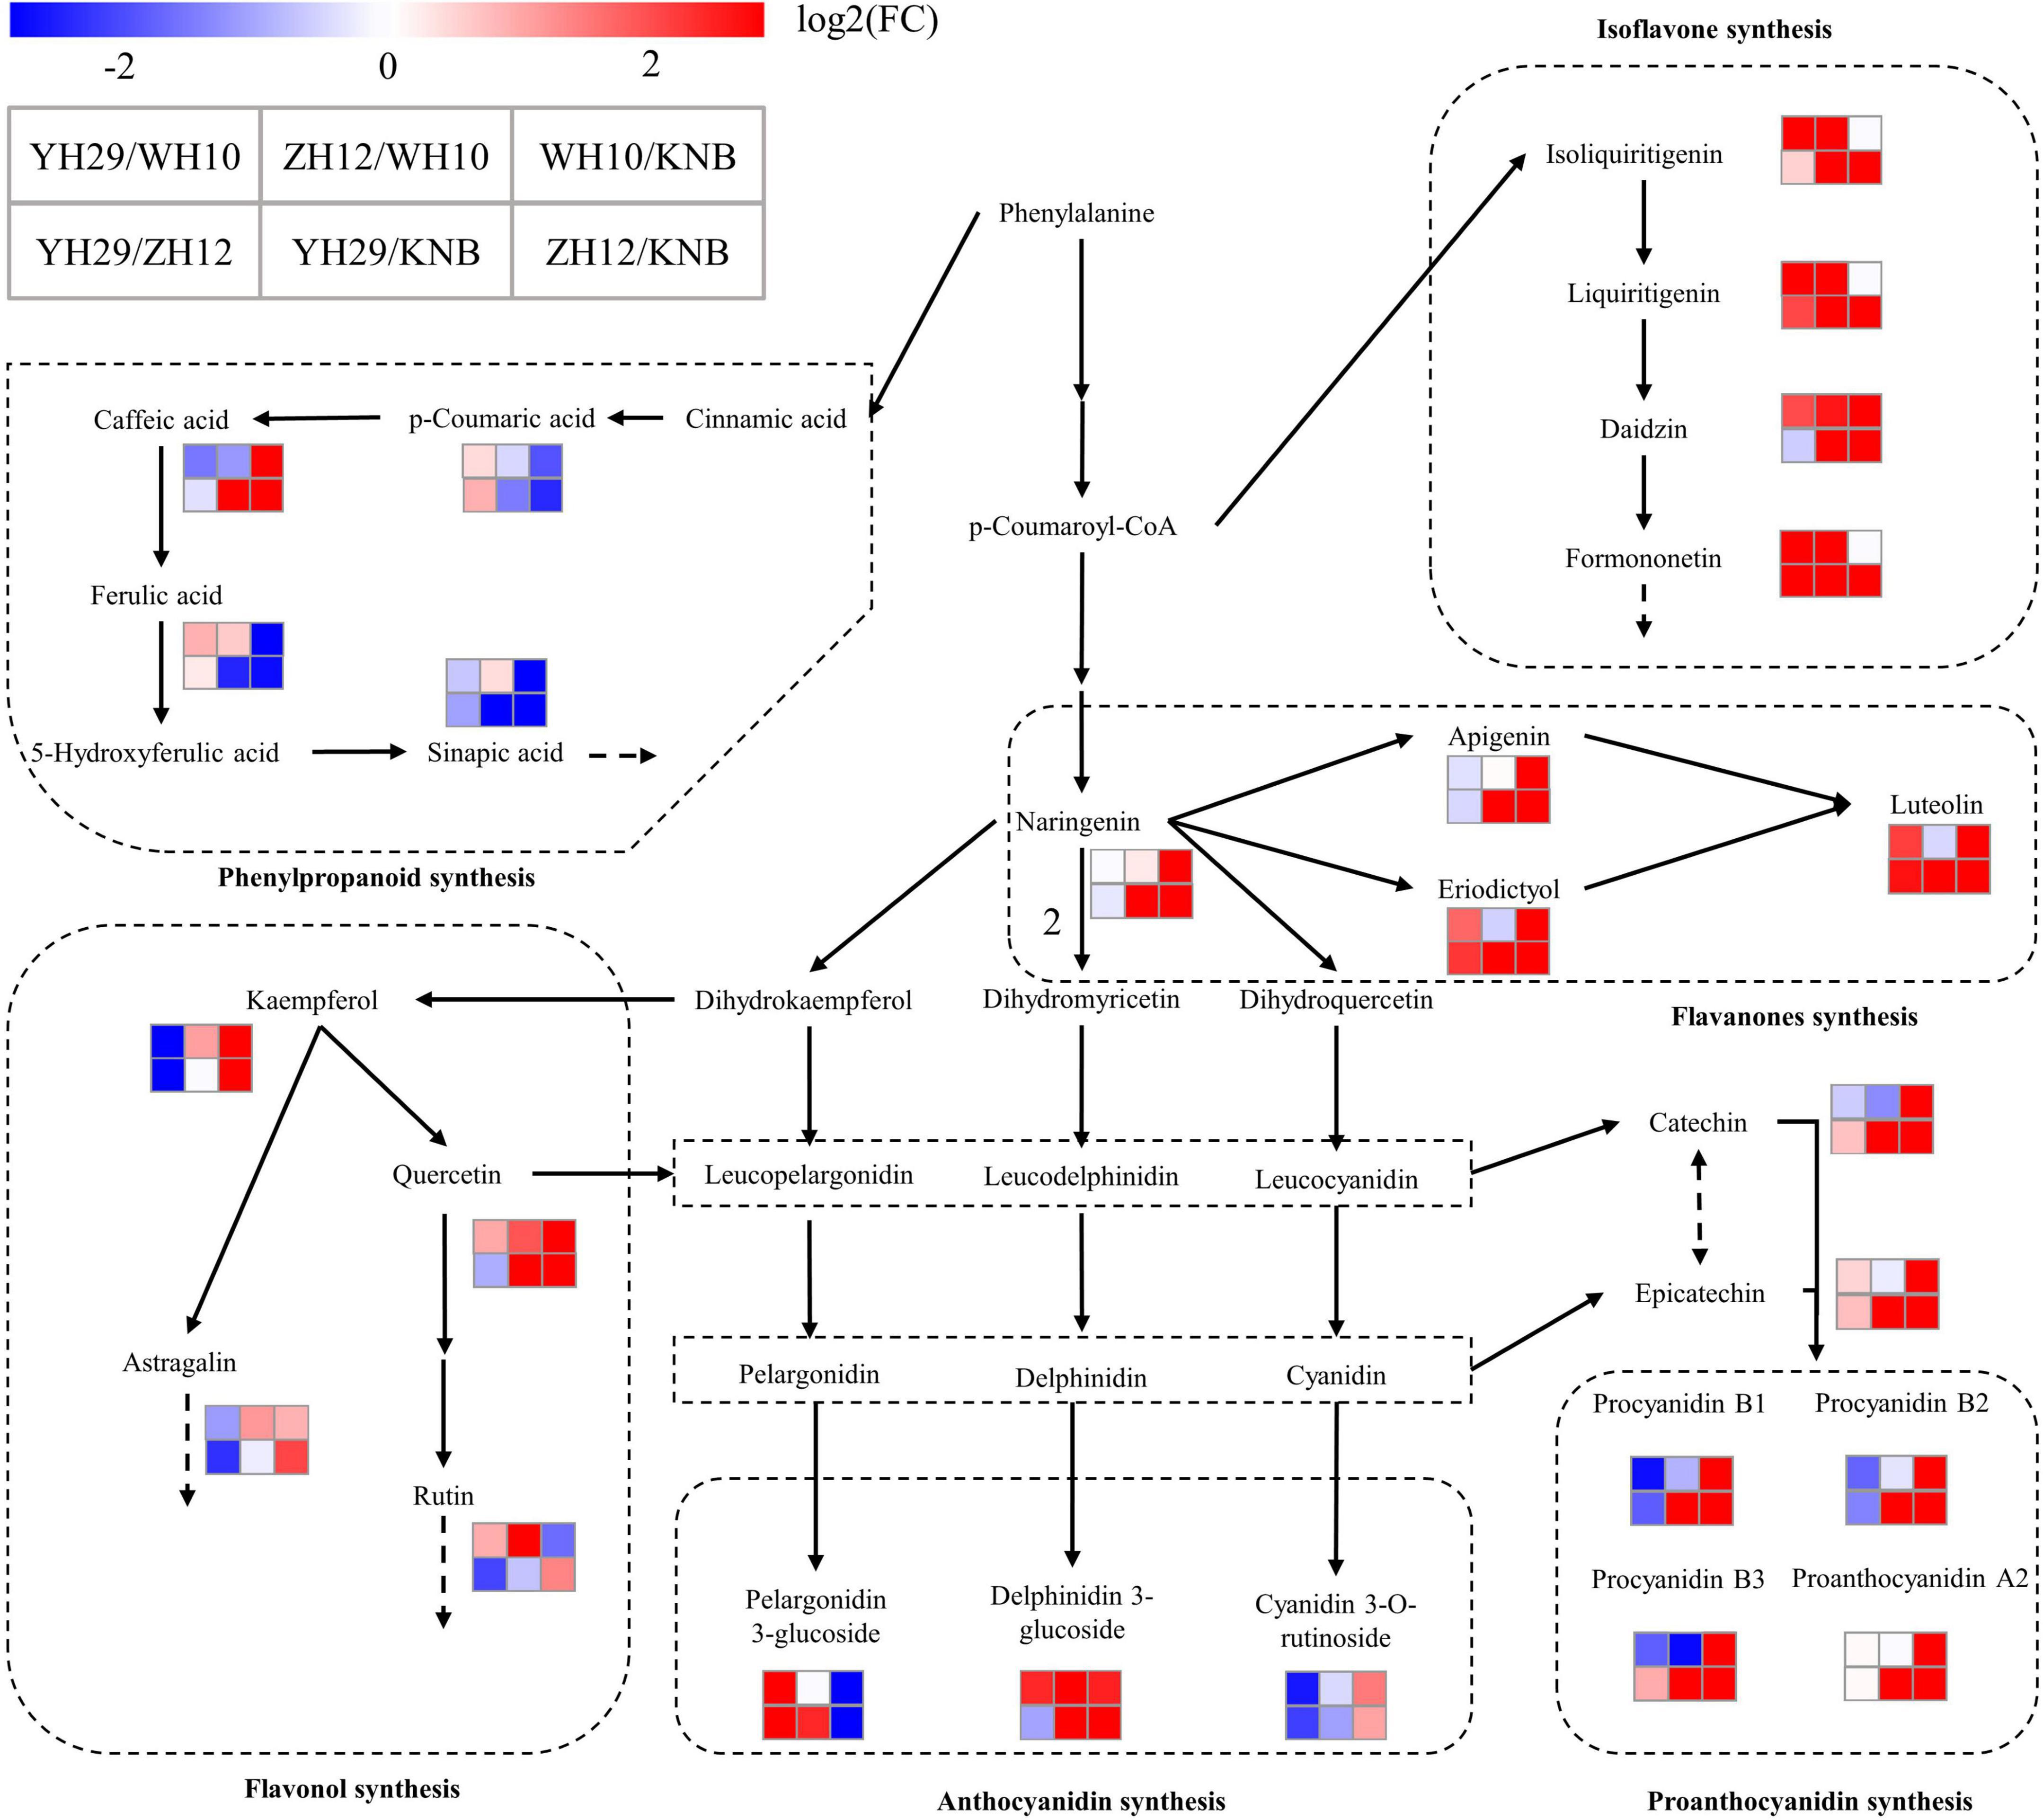
Figure 7. Schematic diagram of the metabolic pathway and relative content of metabolites. (A) ZH12 and WH10; (B) WH10 and KNB. The absolute content is shown in the small histogram next to the compound using the average of all values. The metabolic pathway was modified based on the KEGG database (http://www.genome.jp/kegg/).
The obviously different flavonoid accumulation patterns were also observed between pink (WH10) and white (KNB) testa colors (Figure 7). The compounds in the middle and downstream of flavonoid synthesis pathway accumulated significantly in pink (WH10) testa, while in white (KNB) testa, the derivative content of phenylalanine, which were the flavonoid pathway starting substance, was much higher than that in pink (WH10) testa. The content of naringin in pink peanut was also much higher compare to white testa peanut, we speculated that this “key nodes” should be before the synthesis of naringin, or even at the initiation of phenylalanine biosynthesis.
In previous studies, some key genes have been found to regulate anthocyanin accumulation in peanut testa. The candidate gene controlling peanut purple testa was considered to be one of two MYB transcription factors (Zhao et al., 2019; Huang et al., 2020). Two independently inherited genes might be controlling peanut red testa, One encoded bHLH transcription factor and the other encoded anthocyanin reductase (Chen et al., 2021; Zhang et al., 2022). By analyzing the pink and red testa of peanut by transcriptome and metabolome, some CHS, F3′H, DFR, MYB, bHLH, and WD40 genes may be the key formation and regulatory genes controlling the formation of pink and red testa in peanut (Xue et al., 2021). FLS, DFR, and WD40 transcription factor gene might be the key responsible for the white testa phenotype (Wan et al., 2020). Combined with our research, these key genes may be the structural genes at the node, or regulatory factors (for example, some transcription factors) acting at the node, which the changes of these might be the root cause behind the difference in metabolite accumulation in various peanut testa colors. Our study is helpful to determine the function of these genes and the molecular mechanism of regulation.
Conclusion
In this study, we performed accurately targeted metabolite profiling by UPLC-MS/MS of four types peanut testa colors to evaluate the metabolite differences. We observed that the different accumulation patterns of flavonoids in peanut testa of different colors are related to the flow of flavonoid metabolites across the pathways. The different effects of structural genes or regulatory factors near nodes in different testa color peanuts might lead to the final flavonoid metabolome differences. Moreover, we also discussed the nutritional and health care effects of flavonoids, and the prospect of breeding of peanut varieties high flavonoids content.
Data availability statement
The original contributions presented in this study are included in the article/Supplementary material, further inquiries can be directed to the corresponding authors.
Author contributions
YZ and CZ conceived the project. KZ, JM, SG, LH, HX, NL, JP, RT, and HH carried out the experiments and analyzed the experimental results. KZ and JM wrote the original draft. CZ, XW, YZ, and SG helped to review and revise the original draft. All authors have read and approved the final manuscript.
Funding
This research was supported by National Natural Science Foundation of China (32072090 and 31861143009), Key Research and Development Project of Shandong Province (2020LZGC001 and 2021LZGC025), Shandong Province Natural Science Foundation (ZR2020MC104 and ZR2020MC105), Famous subjects construction project of Shandong Agricultural and Engineering University, Agricultural scientific and technological innovation project of Shandong Academy of Agricultural Sciences, and Taishan Scholar Project of Shandong Province (ts20190964).
Conflict of interest
The authors declare that the research was conducted in the absence of any commercial or financial relationships that could be construed as a potential conflict of interest.
Publisher’s note
All claims expressed in this article are solely those of the authors and do not necessarily represent those of their affiliated organizations, or those of the publisher, the editors and the reviewers. Any product that may be evaluated in this article, or claim that may be made by its manufacturer, is not guaranteed or endorsed by the publisher.
Supplementary material
The Supplementary Material for this article can be found online at: https://www.frontiersin.org/articles/10.3389/fpls.2022.992124/full#supplementary-material
Supplementary Figure 1 | Extractive composition differences in type and content among the four samples. (A) The total ions current (TIC) of the samples. The abscissa is the retention time (RT) of the metabolite detection, and the ordinate is the ionic strength (count per second, CPS) of the ion detection. (B) The absolute content of various types of flavonoids.
Supplementary Figure 2 | Volcano plots of differential metabolites in the pairwise comparison between: (A) YH29 and KNB; (B) YH29 and ZH12; (C) YH29 and WH10; (D) ZH12 and WH10; (E) ZH12 and KNB; and (F) WH10 and KNB. Each point in the volcano map represents a metabolite, the abscissa represents the logarithmic value of the difference of relative content of a certain metabolite in the two samples, the ordinate represents the VIP value. The greater the absolute value of the abscissa, the greater the multiple difference in the expression level between the two samples; the greater the ordinate value, the more significant the differential expression, and the more reliable the differentially expressed metabolites screened. In the figure, the blue dots represent down-regulated differentially metabolites, the red dots represent up-regulated differentially metabolites, and gray represents detected but not significantly different metabolites.
Supplementary Figure 3 | Statistics of distinguished metabolites in four peanut testa samples with different colors. (A) Differential accumulated metabolites (DAMs) among YH29/KNB, ZH12/KNB, and YH29/ZH12. The blue color represents down-regulated metabolites, and the red color represents up-regulated metabolites. The significant difference conforms to p < 0.05 and | log2(FC) | > 1. Venn diagram exhibiting the number of the key flavonoids related to (B) YH29; (C) ZH12; and (D) KNB.
Supplementary Figure 4 | Pearson correlation analysis results for differential metabolites by pairwise. (A) YH29 and KNB; (B) ZH12 and KNB. Dark red represents a significant positive correlation. Dark blue represents a significant negative correlation.
Supplementary Figure 5 | Bubble plot of KEGG metabolic pathway enrichment analysis. (A) YH29 and KNB; (B) ZH12 and KNB. The p-value in the metabolic pathway is the significance of the enrichment of the metabolic pathway, and the significant enrichment pathway is selected for bubble plot. The ordinate is the name of metabolic pathway. The abscissa is the enrichment factor (rich factor means number of significantly different metabolites/number of total metabolites in the pathway). The larger the rich factor, the greater the enrichment degree. The color from red to green indicates that p-value decreases in turn. The larger the point, the more metabolites enriched on the pathway.
Footnotes
References
Baghel, S. S., Shrivastava, N., Baghel, R. S., Agrawal, P., and Rajput, S. (2012). A review of quercetin: Antioxidant and anticancer properties. World J. Pharm. Pharmaceutical. Sci. 1, 146–160.
Bradshaw, H., and Schemske, D. W. (2003). Allele substitution at a flower colour locus produces a pollinator shift in monkeyflowers. Nature 426, 176–178. doi: 10.1038/nature02106
Burda, S., and Oleszek, W. (2001). Antioxidant and antiradical activities of flavonoids. J. Agric. Food Chem. 49, 2774–2779. doi: 10.1021/jf001413m
Cavaiuolo, M., Cocetta, G., and Ferrante, A. (2013). The antioxidants changes in ornamental flowers during development and senescence. Antioxidants 2, 132–155. doi: 10.3390/antiox2030132
Chen, H., Chen, X., Xu, R., Liu, W., Liu, N., Huang, L., et al. (2021). Fine-mapping and gene candidate analysis for AhRt1, a major dominant locus responsible for testa color in cultivated peanut. Theor. Appl. Genet. 134, 3721–3730. doi: 10.1007/s00122-021-03924-w
Christman, L. M., Dean, L. L., Bueno Almeida, C., and Weissburg, J. R. (2018). Acceptability of peanut skins as a natural antioxidant in flavored coated peanuts. J. Food Sci. 83, 2571–2577. doi: 10.1111/1750-3841.14323
Comalada, M., Camuesco, D., Sierra, S., Ballester, I., Xaus, J., Gálvez, J., et al. (2005). In vivo quercitrin anti-inflammatory effect involves release of quercetin, which inhibits inflammation through down-regulation of the NF−κB pathway. Eur. J. Immunol. 35, 584–592. doi: 10.1002/eji.200425778
Constanza, K. E., White, B. L., Davis, J. P., Sanders, T. H., and Dean, L. L. (2012). Value-added processing of peanut skins: Antioxidant capacity, total phenolics, and procyanidin content of spray-dried extracts. J. Agric. Food Chem. 60, 10776–10783. doi: 10.1021/jf3035258
Crozier, A., Jaganath, I. B., and Clifford, M. N. (2009). Dietary phenolics: Chemistry, bioavailability and effects on health. Nat. Prod. Rep. 26, 1001–1043. doi: 10.1039/b802662a
Dong, N. Q., and Lin, H. X. (2021). Contribution of phenylpropanoid metabolism to plant development and plant–environment interactions. Integr. Plant Biol. 63, 180–209. doi: 10.1111/jipb.13054
Dong, T., Han, R., Yu, J., Zhu, M., Zhang, Y., Gong, Y., et al. (2019). Anthocyanins accumulation and molecular analysis of correlated genes by metabolome and transcriptome in green and purple asparaguses (Asparagus officinalis. L.). Food Chem. 271, 18–28. doi: 10.1016/j.foodchem.2018.07.120
Francisco, M. L. L. D., and Resurreccion, A. (2009). Total phenolics and antioxidant capacity of heat-treated peanut skins. J. Food Composit. Anal. 22, 16–24. doi: 10.1016/j.jfca.2008.05.012
Grotewold, E. (2006). The genetics and biochemistry of floral pigments. Annu. Rev. Plant Biol. 57, 761–780. doi: 10.1146/annurev.arplant.57.032905.105248
Hathorn, C. S., and Sanders, T. H. (2012). Flavor and antioxidant capacity of peanut paste and peanut butter supplemented with peanut skins. J. Food Sci. 77, S407–S411. doi: 10.1111/j.1750-3841.2012.02953.x
Huang, L., Liu, X., Pandey, M. K., Ren, X., Chen, H., Xue, X., et al. (2020). Genome-wide expression quantitative trait locus analysis in a recombinant inbred line population for trait dissection in peanut. Plant Biotechnol. J. 18, 779–790. doi: 10.1111/pbi.13246
Imran, M., Salehi, B., Sharifi-Rad, J., Aslam Gondal, T., Saeed, F., Imran, A., et al. (2019). Kaempferol: A key emphasis to its anticancer potential. Molecules 24:2277. doi: 10.3390/molecules24122277
Iwashina, T. (2003). Flavonoid function and activity to plants and other organisms. Biol. Sci. Space 17, 24–44. doi: 10.2187/bss.17.24
Karadag, A., Ozcelik, B., and Saner, S. (2009). Review of methods to determine antioxidant capacities. Food Anal. Methods 2, 41–60. doi: 10.1007/s12161-008-9067-7
Karchesy, J. J., and Hemingway, R. W. (1986). Condensed tannins:(4. beta. fwdarw. 8; 2. beta. fwdarw. O. fwdarw. 7)-linked procyanidins in Arachis hypogea L. J. Agric. Food Chem. 34, 966–970. doi: 10.1021/jf00072a009
Khan, A. S. (2017). “Antipyretic and analgesic activities of some economically important woody plants,” in Medicinally important trees, doi: 10.1007/978-3-319-56777-8_7 (Berlin: Springer), 159–185.
Kuang, Q., Yu, Y., Attree, R., and Xu, B. (2017). A comparative study on anthocyanin, saponin, and oil profiles of black and red seed coat peanut (Arachis hypogacea) grown in China. Int. J. Food Properties 20(sup1), S131–S140. doi: 10.1080/10942912.2017.1291676
Lee, H. B., Kim, E. K., Park, S. J., Bang, S.g, Kim, T. G., and Chung, D.w (2011). Isolation and anti-inflammatory effect of astragalin synthesized by enzymatic hydrolysis of tea seed extract. J. Sci. Food Agric. 91, 2315–2321. doi: 10.1002/jsfa.4457
Liu, G., Shi, A., Wang, N., Li, M., He, X., Yin, C., et al. (2020). Polyphenolic Proanthocyanidin-B2 suppresses proliferation of liver cancer cells and hepatocellular carcinogenesis through directly binding and inhibiting AKT activity. Redox Biol. 37:101701. doi: 10.1016/j.redox.2020.101701
Ma, Y., Kerr, W. L., Swanson, R. B., Hargrove, J. L., and Pegg, R. B. (2014). Peanut skins-fortified peanut butters: Effect of processing on the phenolics content, fibre content and antioxidant activity. Food Chem. 145, 883–891. doi: 10.1016/j.foodchem.2013.08.125
Nabavi, S. M., Samec, D., Tomczyk, M., Milella, L., Russo, D., Habtemariam, S., et al. (2020). Flavonoid biosynthetic pathways in plants: Versatile targets for metabolic engineering. Biotechnol. Adv. 38:107316. doi: 10.1016/j.biotechadv.2018.11.005
Nepote, V., Grosso, N., and Guzman, C. A. (2007). Extraction of antioxidant components from peanut skins. Grasas Aceites 53, 391–395. doi: 10.3989/gya.2002.v53.i4.335
Noda, N., Yoshioka, S., Kishimoto, S., Nakayama, M., Douzono, M., Tanaka, Y., et al. (2017). Generation of blue chrysanthemums by anthocyanin B-ring hydroxylation and glucosylation and its coloration mechanism. Sci. Adv. 3:e1602785. doi: 10.1126/sciadv.1602785
Oliveira, T.K.B.d, Gomes, J. P., Silva Júnior, P.R.d, Lima, A. R. N., Jordão, A.J.J.M.d.L, Ramos, K.R.d.L.P, et al. (2021). Morphological, biochemical and histological effects of aqueous extracts of peanut (Arachis hypogaea) on swiss mice in different diets. Acta Cirúrgica Brasileira 36:e360905. doi: 10.1590/ACB360905
Osakabe, N., and Yamagishi, M. (2009). Procyanidins in Theobroma cacao reduce plasma cholesterol levels in high cholesterol-fed rats. J. Clin. Biochem. Nutr. 45, 131–136. doi: 10.3164/jcbn.07-34
Park, Y. S., Jeon, M. H., Hwang, H. J., Park, M. R., Lee, S.-H., Kim, S. G., et al. (2011). Antioxidant activity and analysis of proanthocyanidins from pine (Pinus densiflora) needles. Nutr. Res. Pract. 5, 281–287. doi: 10.4162/nrp.2011.5.4.281
Pinent, M., Blay, M., Bladé, M., Salvado, M., Arola, L., and Ardevol, A. (2004). Grape seed-derived procyanidins have an antihyperglycemic effect in streptozotocin-induced diabetic rats and insulinomimetic activity in insulin-sensitive cell lines. Endocrinology 145, 4985–4990. doi: 10.1210/en.2004-0764
Pourcel, L., Routaboul, J.-M., Cheynier, V., Lepiniec, L., and Debeaujon, I. (2007). Flavonoid oxidation in plants: From biochemical properties to physiological functions. Trends Plant Sci. 12, 29–36. doi: 10.1016/j.tplants.2006.11.006
Raskin, I. (1992). Role of salicylic acid in plants. Annu. Rev. Plant Biol. 43, 439–463. doi: 10.1146/annurev.pp.43.060192.002255
Rice-evans, C. A., Miller, N. J., Bolwell, P. G., Bramley, P. M., and Pridham, J. B. (1995). The relative antioxidant activities of plant-derived polyphenolic flavonoids. Free Radical Res. 22, 375–383. doi: 10.3109/10715769509145649
Sasaki, N., and Nakayama, T. (2015). Achievements and perspectives in biochemistry concerning anthocyanin modification for blue flower coloration. Plant Cell Physiol. 56, 28–40. doi: 10.1093/pcp/pcu097
Selvendiran, K., Koga, H., Ueno, T., Yoshida, T., Maeyama, M., Torimura, T., et al. (2006). Luteolin promotes degradation in signal transducer and activator of transcription 3 in human hepatoma cells: An implication for the antitumor potential of flavonoids. Cancer Res. 66, 4826–4834. doi: 10.1158/0008-5472.CAN-05-4062
Sirerol, J. A., Rodríguez, M. L., Mena, S., Asensi, M. A., Estrela, J. M., and Ortega, A. L. (2016). Role of natural stilbenes in the prevention of cancer. Oxid. Med. Cell. Long. 2016, 3128951. doi: 10.1155/2016/3128951
Sun, C., Zhang, M., Dong, H., Liu, W., Guo, L., and Wang, X. (2020). A spatially-resolved approach to visualize the distribution and biosynthesis of flavones in Scutellaria baicalensis Georgi. J. Pharmaceutical Biomed. Anal. 179:113014. doi: 10.1016/j.jpba.2019.113014
Suresh, D., Gurudutt, K., and Srinivasan, K. (2009). Degradation of bioactive spice compound: Curcumin during domestic cooking. Eur. Food Res. Technol. 228, 807–812. doi: 10.1007/s00217-008-0993-9
Tanaka, Y., Brugliera, F., and Chandler, S. (2009). Recent progress of flower colour modification by biotechnology. Int. J. Mol. Sci. 10, 5350–5369. doi: 10.3390/ijms10125350
Wan, L., Lei, Y., Yan, L., Liu, Y., Pandey, M. K., Wan, X., et al. (2020). Transcriptome and metabolome reveal redirection of flavonoids in a white testa peanut mutant. BMC Plant Biol. 20:161. doi: 10.1186/s12870-020-02383-7
Winkel-Shirley, B. (2001). Flavonoid biosynthesis. A colorful model for genetics, biochemistry, cell biology, and biotechnology. Plant Physiol. 126, 485–493. doi: 10.1104/pp.126.2.485
Xue, Q., Zhang, X., Yang, H., Li, H., Lv, Y., Zhang, K., et al. (2021). Transcriptome and metabolome analysis unveil anthocyanin metabolism in pink and red testa of peanut (Arachis hypogaea L.). Int. J. Genom. 2021:5883901. doi: 10.1155/2021/5883901
Yu, J., Ahmedna, M., and Goktepe, I. (2005). Effects of processing methods and extraction solvents on concentration and antioxidant activity of peanut skin phenolics. Food Chem. 90, 199–206. doi: 10.1016/j.foodchem.2004.03.048
Yu, J., Ahmedna, M., Goktepe, I., and Dai, J. (2006). Peanut skin procyanidins: Composition and antioxidant activities as affected by processing. J. Food Composit. Anal. 19, 364–371. doi: 10.1016/j.jfca.2005.08.003
Zhang, K., Yuan, M., Xia, H., He, L., Ma, J., Wang, M., et al. (2022). BSA-seq and genetic mapping reveals AhRt2 as a candidate gene responsible for red testa of peanut. Theor. Appl. Genet. 135, 1529–1540. doi: 10.1007/s00122-022-04051-w
Zhang, P., Du, H., Wang, J., Pu, Y., Yang, C., Yan, R., et al. (2020). Multiplex CRISPR/Cas9-mediated metabolic engineering increases soya bean isoflavone content and resistance to soya bean mosaic virus. Plant Biotechnol. J. 18, 1384–1395. doi: 10.1111/pbi.13302
Keywords: testa color, flavonoids, LC-MS/MS, metabolome profiling, metabolic pathway
Citation: Zhang K, Ma J, Gangurde SS, Hou L, Xia H, Li N, Pan J, Tian R, Huang H, Wang X, Zhang Y and Zhao C (2022) Targeted metabolome analysis reveals accumulation of metabolites in testa of four peanut germplasms. Front. Plant Sci. 13:992124. doi: 10.3389/fpls.2022.992124
Received: 12 July 2022; Accepted: 29 August 2022;
Published: 16 September 2022.
Edited by:
Jihong Hu, Northwest A&F University, ChinaReviewed by:
Yin Li, Sun Yat-sen University, ChinaJianxin Shi, Shanghai Jiao Tong University, China
Copyright © 2022 Zhang, Ma, Gangurde, Hou, Xia, Li, Pan, Tian, Huang, Wang, Zhang and Zhao. This is an open-access article distributed under the terms of the Creative Commons Attribution License (CC BY). The use, distribution or reproduction in other forums is permitted, provided the original author(s) and the copyright owner(s) are credited and that the original publication in this journal is cited, in accordance with accepted academic practice. No use, distribution or reproduction is permitted which does not comply with these terms.
*Correspondence: Chuanzhi Zhao, Y2h1YW56aGl6QDEyNi5jb20=; Yindong Zhang, MjMzMDA1NThAMTYzLmNvbQ==
†These authors have contributed equally to this work