 Birgul Guden
 Engin Yol
 Cengiz Erdurmus
 Stuart James Lucas
 Bulent Uzun
- 1Department of Field Crops, Faculty of Agriculture, Akdeniz University, Antalya, Türkiye
- 2Department of Field Crops, West Mediterranean Agricultural Research Institute, Antalya, Türkiye
- 3Sabanci University Nanotechnology Research and Application Centre, Sabanci University, Istanbul, Türkiye
Sorghum is an important but arguably undervalued cereal crop, grown in large areas in Asia and Africa due to its natural resilience to drought and heat. There is growing demand for sweet sorghum as a source of bioethanol as well as food and feed. The improvement of bioenergy-related traits directly affects bioethanol production from sweet sorghum; therefore, understanding the genetic basis of these traits would enable new cultivars to be developed for bioenergy production. In order to reveal the genetic architecture behind bioenergy-related traits, we generated an F2 population from a cross between sweet sorghum cv. ‘Erdurmus’ and grain sorghum cv. ‘Ogretmenoglu’. This was used to construct a genetic map from SNPs discovered by double-digest restriction-site associated DNA sequencing (ddRAD-seq). F3 lines derived from each F2 individual were phenotyped for bioenergy-related traits in two different locations and their genotypes were analyzed with the SNPs to identify QTL regions. On chromosomes 1, 7, and 9, three major plant height (PH) QTLs (qPH1.1, qPH7.1, and qPH9.1) were identified, with phenotypic variation explained (PVE) ranging from 10.8 to 34.8%. One major QTL (qPJ6.1) on chromosome 6 was associated with the plant juice trait (PJ) and explained 35.2% of its phenotypic variation. For fresh biomass weight (FBW), four major QTLs (qFBW1.1, qFBW6.1, qFBW7.1, and qFBW9.1) were determined on chromosomes 1, 6, 7, and 9, which explained 12.3, 14.5, 10.6, and 11.9% of the phenotypic variation, respectively. Moreover, two minor QTLs (qBX3.1 and qBX7.1) of Brix (BX) were mapped on chromosomes 3 and 7, explaining 8.6 and 9.7% of the phenotypic variation, respectively. The QTLs in two clusters (qPH7.1/qBX7.1 and qPH7.1/qFBW7.1) overlapped for PH, FBW and BX. The QTL, qFBW6.1, has not been previously reported. In addition, eight SNPs were converted into cleaved amplified polymorphic sequences (CAPS) markers, which can be easily detected by agarose gel electrophoresis. These QTLs and molecular markers can be used for pyramiding and marker-assisted selection studies in sorghum, to develop advanced lines that include desirable bioenergy-related traits.
1 Introduction
Bioenergy is defined as energy obtained from biomass or its metabolic by-products (Calvin et al., 2021). Taking into consideration current global warming, climate change and energy security issues, it has important advantages over conventional fossil fuels (Prasad et al., 2021; Rather et al., 2022). Sweet sorghum [Sorghum bicolor (L.) Moench], as a first-generation energy crop (Yadav et al., 2019), offers a valuable potential source of sustainable bioenergy production (Olivera et al., 2020) due to its high water-use efficiency and resistance to heat and drought conditions (Abebe et al., 2020). Sorghum is also considered a “failsafe” in agroecosystems (Paterson, 2008), due to its resilience and productivity in conditions that are too hot and dry for most other cereals. Sweet sorghum has drawn attention not only for the production of bioenergy from directly fermentable sugars contained in its stalk, but also for its high biomass production capacity (Smith et al., 1987; Murray et al., 2009). Compared to other bioenergy sources such as sugarcane, sweet sorghum has a comparatively low input requirement, high water use efficiency, drought resistance and high yield, and furthermore also produces grain that can be used in food or feed; therefore, it is considered a better alternative for bioethanol production from stem sugars, as both energy and food can be produced simultaneously (Reddy et al., 2005).
Selection for bioenergy producing sorghum cultivars depends on the characterization of biomass-related traits like plant height, sugar content, and fresh biomass. Plant height is an important part of plant architecture (Guden et al., 2020a) that has a significant correlation with biomass production (Calvino and Messing, 2012). Because quantitative trait loci (QTL) for biomass have been identified to be co-localized with height QTLs (Brown et al., 2008), breeders usually target taller genotypes in their sorghum biomass development strategy. The Brix value, which also has a positive correlation with height (Wang et al., 2020a), is an indicator of the total sugar content in stem juice and so represents an important bioenergy trait. Extractable juice content, which can be directly fermented into ethanol, is another trait that contributes greatly to high bioenergy production (Takaki et al., 2015). Considering all these factors, recent breeding studies have focused on crop improvement by identifying and selecting for QTLs that control these traits (Regassa and Wortmann, 2014; Mace et al., 2019). Employing quantitative genetics and molecular-based technologies, several previous mapping studies have been conducted to determine associations between gene/QTL regions and bioenergy-related traits (Kajiya-Kanegae et al., 2020; de Souza et al., 2021). de Souza et al. (2021) used 272 RIL plants from a cross between two sweet sorghum lines (Brandes × Wray) to create a genetic map and mapped 33 QTLs for bioenergy traits, 14 of which were found in all three environments tested. Jin et al. (2021) constructed a genetic map and identified a total of 43 QTLs for biomass traits, several of which were stable across 2 years. However, the high variability of agronomic traits between different locations and years demands further studies, in order to identify stable QTLs that consistently improve traits in multiple environments and genetic backgrounds (Chen et al., 2020).
Single Nucleotide Polymorphism (SNP) markers have higher coverage in plant genomes than other marker types such as RFLP and SSRs (Kumar et al., 2009) and can be identified rapidly using next generation sequencing methods such as whole-genome sequencing, genotyping-by-sequencing (GBS), restriction site-associated DNA sequencing (RAD-seq), double digest restriction site-associated DNA sequencing (ddRAD-Seq), and specific-locus amplified fragment sequencing (SLAF-seq). Among these, ddRAD-seq is a popular and cost-effective method for SNP discovery that includes digesting the DNA with two defined restriction enzymes, pseudo-random sampling, and size-selection of fragments for sequencing (Peterson et al., 2012). It is inexpensive compared to whole-genome sequencing, and as many restriction sites are conserved between different genotypes, no reference genome is required for bioinformatic analysis (Andrews et al., 2016). The application of ddRAD-seq has been reported in many species, such as apple (Malus domestica Borkh.) (Ma et al., 2017), orchid (Orchis spp.) (Roy et al., 2017), onion (Allium cepa L.) (Lee et al., 2018), sesame (Sesamum indicum L.) (Basak et al., 2019) and hazelnut (Corylus avellana L.) (Oztolan-Erol et al., 2021). However, ddRAD-seq has not been applied in sorghum to date.
The objectives of this study were to (i) construct a genetic map for sorghum using ddRAD-seq, (ii) identify QTLs for bioenergy-related traits, and (iii) develop user-friendly PCR-based SNP markers and validate them on diverse genetic sources.
2 Materials and methods
2.1 Plant materials and experimental design
An F2 population, consisting of 175 individuals, was obtained from a cross between the cultivars Erdurmus and Ogretmenoglu, registered by the Western Mediterranean Agricultural Research Institute of Turkey (WMARI). Erdurmus (♀) is a sweet sorghum cultivar with high plant height, juice and Brix content. Moreover, it is known to have a high bioethanol yield (Guden et al., 2020b) and was used as the female parent. The male parent differs from the female cultivar in its bioenergy-related traits. Ogretmenoglu (♂) is a grain sorghum cultivar that has short plant height, low plant juice, low Brix content, and low bioethanol yield (Guden et al., 2020b). The parents were crossed in a greenhouse in 2016 and F1 plants were selfed in the experimental fields of Akdeniz University (36°53′ N, 38°30′ E and altitude of 15 m) in 2017. In the subsequent year, the F2 population was grown at the WMARI (36° 52′ N and 30° 50′ E, 41 m above sea level), Antalya, Turkey. Individual lines derived from the F2 population were advanced to F3 and this population was grown in two different locations, which are the WMARI in Antalya (lowland) and the Soil, Water and Deserting Control Research Institute in Konya (highland) (37° 48’ N and 32° 30’ E, 1072 m above sea level), using a randomized complete block design with three replicates, in the 2019 growing season. The climatic data for the fields is presented in Table 1. Plants were sown in two rows with a length of 5 m at a spacing of 0.7 m between rows and a plant spacing of 0.2 m. At both locations, chemical fertilizers were applied prior to seedling germination at rates of 60 kg/ha N and 60 kg/ha P2O5. A further application of 60 kg/ha N was added once the plants’ height reached 50 cm.
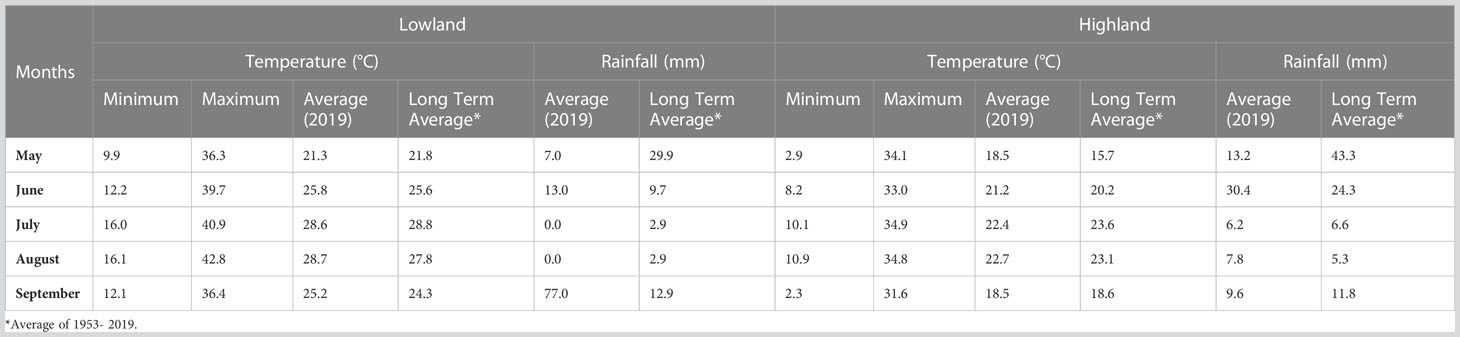
Table 1 Monthly temperature and rainfall values in the sorghum growing period of 2019.
2.2 Phenotypic observations
Bioenergy-related traits including plant height, plant stalk juice weight, Brix and fresh biomass weight were used to characterize plants from the F3 populations in both locations. Five plants representing each plot were selected and harvested manually. Plant height (PH) was identified as the distance between the ground and the top of the flag leaf after full panicle emergence (cm). The fresh biomass weight (FBW) was identified by cutting the stem of each plant just above ground level and weighing immediately (g). The other two observations were performed after the panicles, leaves, and leaf sheaths of the plants were removed. Plant juice (PJ), obtained by pressing the stems with a roller mill, was accumulated in a graduated cylinder. Juice content was calculated as % of total biomass using the formula: [juice weight (g)/biomass weight (g)] x 100. Brix (BX) was measured with a digital refractometer (Hanna, HI96801, USA) using the extracted juices (%).
2.3 Statistical analysis
The correlation analyses and analysis of variance (ANOVA, PROC GLM) were performed with Past 4.03 and SAS 9.0 software, respectively. Broad-sense heritability (Allard, 1960) of all traits was calculated by:
where: ; heritability in broad sense, σ2 G; genotypic variance and, σ2 P; phenotypic variance.
2.4 DNA extraction and sequencing
Young leaves from 175 F2 plants and their parents were collected and stored at -80°C. Genomic DNA was extracted with a modified CTAB method (Doyle and Doyle 1990). The modification was accomplished by adding ethanol and isopropanol, which were utilized to precipitate DNA. DNA concentration was measured with a Qubit 2.0 Fluorometer using a Qubit DNA Assay Kit (Life Technologies, Thermo Fisher Scientific), while agarose gel electrophoresis was used to check for degradation.
A modified version of the ddRAD-seq method was adapted for sequencing library construction. Briefly, all the DNAs from F2 lines and their parents were digested with the endonucleases VspI (ATTAAT) and MspI (CCGG) for 2 hours at 37°C. The double-digested samples were cleaned with Ampure XP beads (Beckman Coulter Genomics) followed by ligation with barcoded P1 and P2 adaptors using T4 DNA ligase buffer (Peterson et al., 2012). The P1 adapter’s 3’ end was modified to match the overhanging VspI restriction cut site, because of the selection of six-base cutter VspI instead of EcoRI, which is the enzyme used in the original ddRAD protocol. Following ligation, each reaction was subjected to PCR amplification (15 cycles) using genotype-specific indexed PCR primers. Amplified fragments were checked on an agarose gel and a size window of 400-500 bp fragments was selected. The selected products from each sample were pooled, and the resulting ddRAD-seq genomic library was sequenced using the Illumina Hi-Seq platform via 150-bp paired-end sequencing.
2.5 SNP calling
Single-nucleotide polymorphism (SNP) calling was performed using the following steps: the raw reads were demultiplexed with Je (v1.2.1) (Girardot et al., 2016). Adapters and restriction enzyme sequences were trimmed with the use of fastp (v0.20.1) (Chen et al., 2018), while bases were marked as ‘qualified’ if they had a phred-scale quality score >15; this parameter was used to discard low quality reads with >40% ‘unqualified’ bases. The other filtering options used were: minimum read length of 15, low complexity sequences comprise no more than 30% of read length; reads failing these thresholds were eliminated. Clean sequences of each individual were aligned to the sorghum BTx623 version 3 reference genome (McCormick et al., 2018) using Bowtie2 (v2.3.4.3) (Langmead and Salzberg, 2012) with default parameters. The individual BAM files were analyzed using freebayes (v13.1) (Garrison and Marth, 2012) with a simple diploid calling model and filtering. A minimum coverage value of 20 was used for the identification of sequence variants. To combine each individual variant file, Bcftools merge (v1.10) (Li et al., 2009) was used. This file was converted to BED (browser extensible data) (Quinlan and Hall, 2010) format for the purpose of storing the coordinates of the genomic regions that contained putative variants. After that, in order to improve detection of uncommon alleles, the previously created BAM files were re-analyzed with freebayes using 10x minimum coverage but limiting matches to regions included in the BED files, in order to identify reliable SNP alleles for each genotype. Then all variant files were merged into a single variant file. Putative SNPs were filtered with the following parameters: minimum site count 80, and minimum–maximum heterozygous proportion 0.3-0.8.
2.6 Construction of linkage map
Polymorphic SNPs identified between the parental lines were converted to ABH genotype format using Tassel V5.2.52 (Glaubitz et al., 2014). Sites with high missing data (> 20%) and segregation distortion (Chi-square, p< 0.001) were filtered out, and a genetic linkage map was constructed with the JoinMap 4.1 program (Van Ooijen, 2011). The linkage map was constructed with a minimum logarithm of odds (LOD) score of 10 and a maximum recombination fraction of 0.2 was estimated for the marker groups. The recombination rate was converted into map distance in cM (centiMorgans) by the Kosambi mapping function (Kosambi, 1944). We compared the genetic map to the reference genome (as a representative physical map) to determine alignment between the genome and the genetic map, and dot plots were created with Excel. We used a Multiple QTL Mapping (MQM) function which was equivalent to Composite Interval Mapping (CIM) approach to detect QTLs for bioenergy-related traits in MapQTL 6 (Van Ooijen, 2009) with combined phenotypic data. MapChart 2.32 (Voorrips, 2002) was used for the mapping of the positions of QTLs with LOD scores of at least 4.0 for all traits except BX (LOD ≥ 3.0).
2.7 Development of CAPS markers
We designed cleaved amplified polymorphic sequence (CAPS) markers to be associated with the bio-energy related trait loci identified in the F2 population. Flanking sequences with the criteria of predicted product size ranging from 200 to 500 bp either side of putative SNPs were transferred to the Primer3 program (Untergasser et al., 2012) and suitable markers containing the putative SNPs were developed. The suitable restriction endonucleases for these SNP regions were determined using NebCutter (Vincze et al., 2003).
These markers were validated in diverse genetic backgrounds including eight sweet sorghum lines (47, 69, 91, 325, 424, 456, 532, and 507), parental lines (Erdurmus and Ogretmenoglu) and one sweet sorghum cultivar (Uzun). PCR was performed in 15-μL PCR mixtures containing 100 ng genomic DNA, 1.5 μl 10 × PCR buffer, 2.5 mM MgCl2, 1.25 μL dNTP mix, 1 μL each of forward and reverse primers (10 pmol), 0.2 μL Taq DNA polymerase (5 U/ml), 1.5 μL genomic DNA, and Milli-Q water. Thermocycling started with 94°C initial denaturation for 5 min, and was followed by 30 cycles of 94°C denaturation for 30 s, 55°C annealing for 30 s, 72°C extension for 40 s, and 72°C final extension for 10 min. The amplicons were digested with the appropriate restriction enzyme identified from the SNP region for each primer (New England BioLabs, Beijing, China) in 21 μL reaction containing 10 μL PCR product, 2 μL 10 × NEBuffer, 1 μL restriction enzyme, and Milli-Q water, with the enzyme specific temperature incubated for 3 h. Finally, after the products were separated by electrophoresis on a 2.5% agarose gel, they were visualized with UV light.
3 Results
3.1 Phenotypic variation in bioenergy-related traits
Significant differences were recorded for all the bioenergy-related traits between genotypes and in both environments (Table 2). The plants grown in the highland location exhibited less variation than lowland for PH and FBW. The ANOVA showed that the variation within the F3 population between genotypes (σg2) and environments (σE2) were significantly different for all traits and locations, but the variation of the genotype × environment interaction (σGxE2) was only statistically significant (P< 0.01) for PH. Coefficients of variation (CV) for each trait ranged from 11.05 for PH at the highland site up to 30.35 for FBW at the lowland site. Across the environments, PH had the lowest CV, and FBW had the highest. Moreover, the broad-sense heritability for PH, PJ, and FBW were 0.87, 0.67, and 0.80, respectively, showing that genotypic variance accounted for a high proportion of the phenotypic variation. Correlation analysis indicated that PH was significantly and positively correlated with FBW and PJ with correlation coefficients of 0.54 and 0.30, respectively. Similarly, a significant positive correlation was observed between FBW and PJ (0.30), while BX was not significantly correlated with the other traits (Table 3).
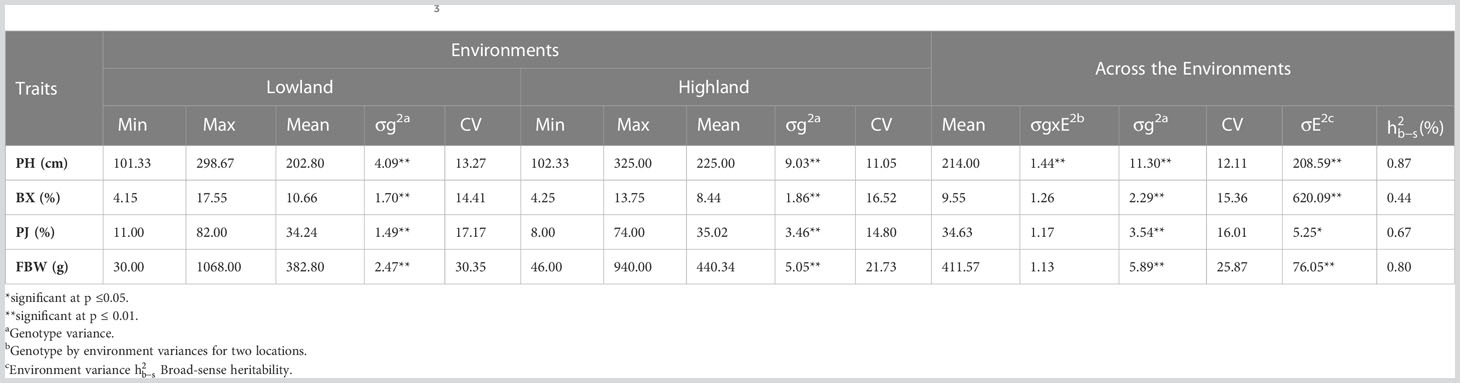
Table 2 Phenotypic variation for bioenergy-related traits in F3 population.
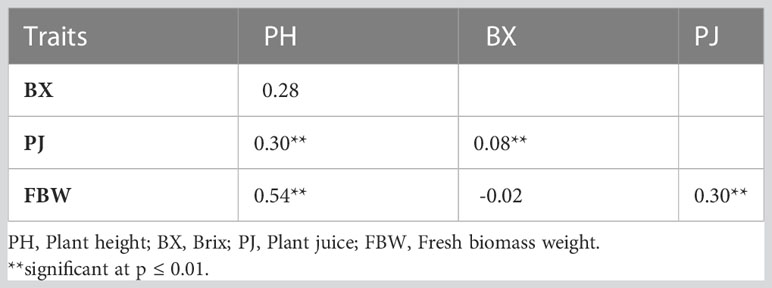
Table 3 Pearson correlation coefficients between traits across two environments.
3.2 Genotyping
A total of 177 individuals, including 175 F2 plants and two parents, were used in construction of the ddRAD-seq library. After quality filtering, 429.23 M reads were obtained for the analyses. The collection was represented by a mean of 2.425 M reads per genotype and average 41.17% guanine-cytosine (GC) content. The highest read counts and guanine-cytosine (GC) content were 5.96 M and 51.16% for the genotypes 147 and 171, respectively.
3.3 Linkage map construction
The SNPs called from the 175 F2 individuals were used to create the genetic map. After filtering, 1438 SNPs were assigned to 10 linkage groups (LGs) (Figure 1). The total length of the map was 1349.72 cM with an average marker interval of 0.94 cM. The length of each LG ranged from 77.46 cM to 176.36 cM. Among the LGs, the greatest number of markers was determined on LG3, which contained 193 markers with an average distance of 0.91 cM between markers. Conversely, LG8 had the fewest markers (86) with an average distance of 0.90 cM (Table 4). The largest gap was 17.98 cM in LG7, followed by gaps of 14.66 and 9.49 cM in LG2 and LG1, respectively. The LGs were then compared with the SNP positions mapped on to the S. bicolor BTx623 reference genome as a surrogate physical map (Figure S1). For most linkage groups, a highly consistent marker order was observed towards the end of the chromosome arms, but with some scattering in the middle of each chromosome. This is an expected result due to the low recombination rate in peri-centromeric regions, meaning that there have been too few recombination events to accurately resolve the marker order in the F2 population. Interestingly, a series of SNPs on LG8 and a second on LG10 mapped on the other side of the centromere in the Erdurmus x Ogretmenoglu population compared to the reference genome. This may indicate the presence of chromosome translocations in one of these cultivars, although further physical mapping of the parental lines would be required to confirm this.
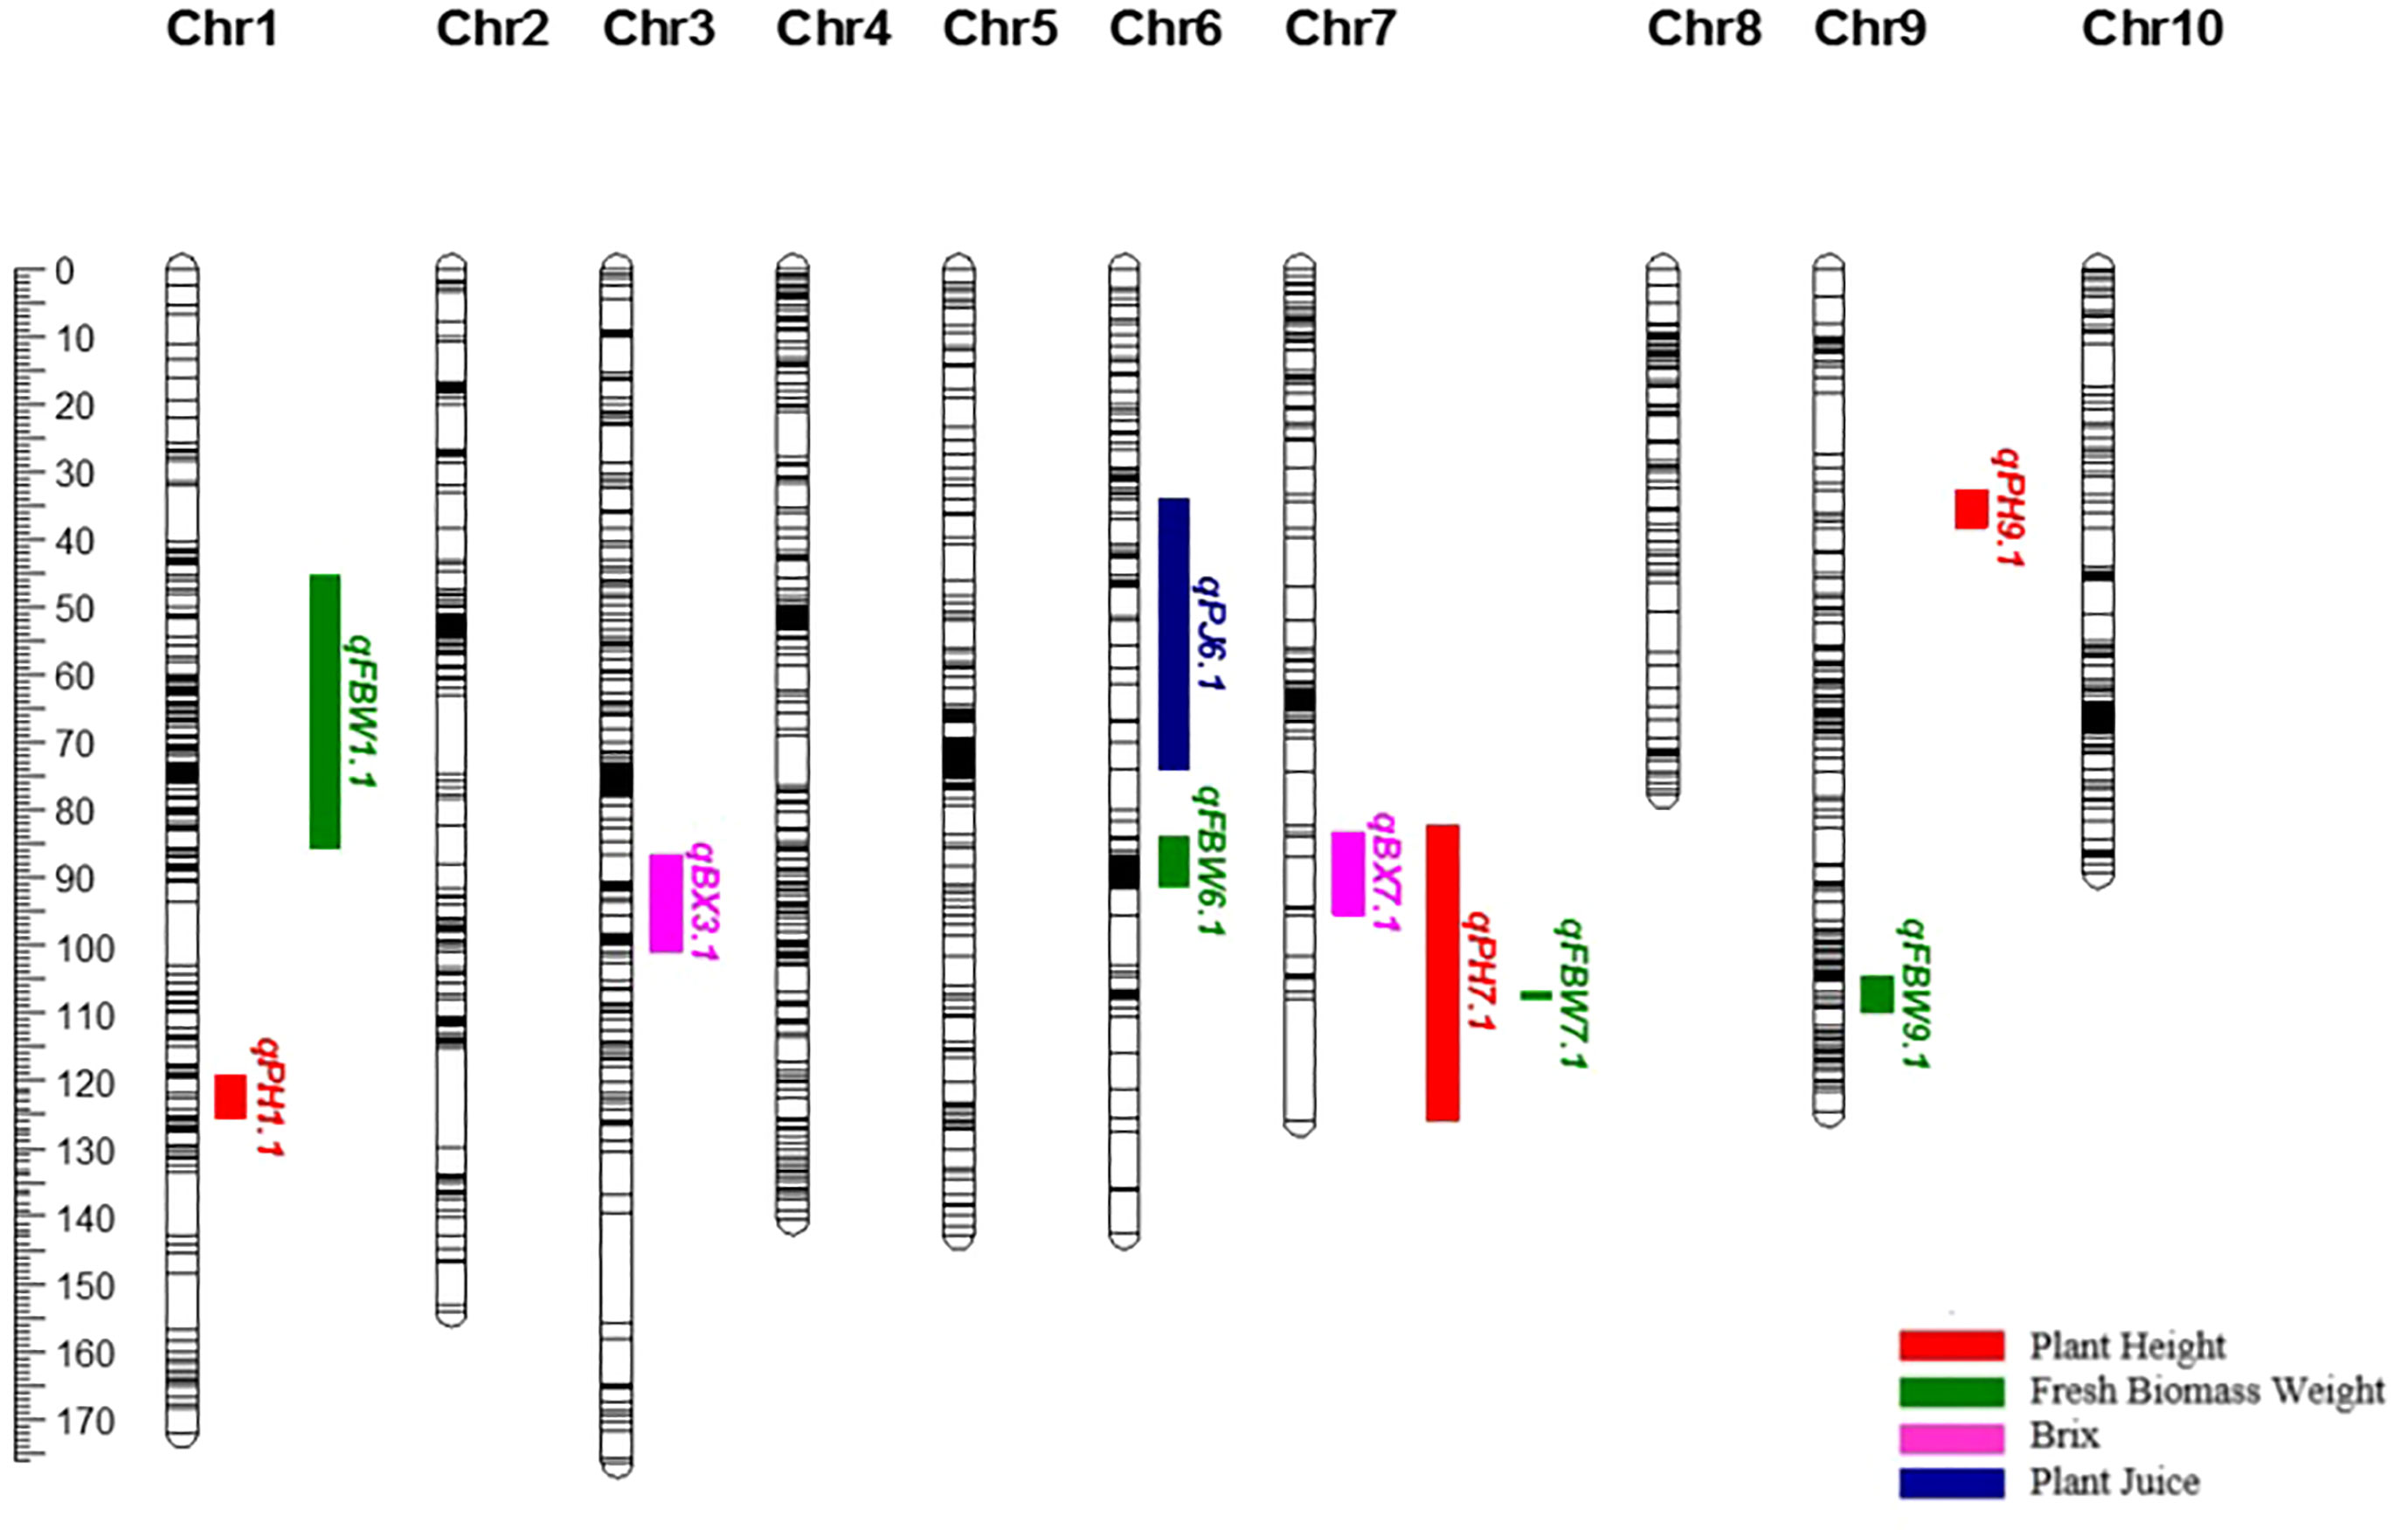
Figure 1 Genetic map, showing the locations of QTLs for bioenergy-related traits on chromosomes 1, 3, 6, 7 and 9.
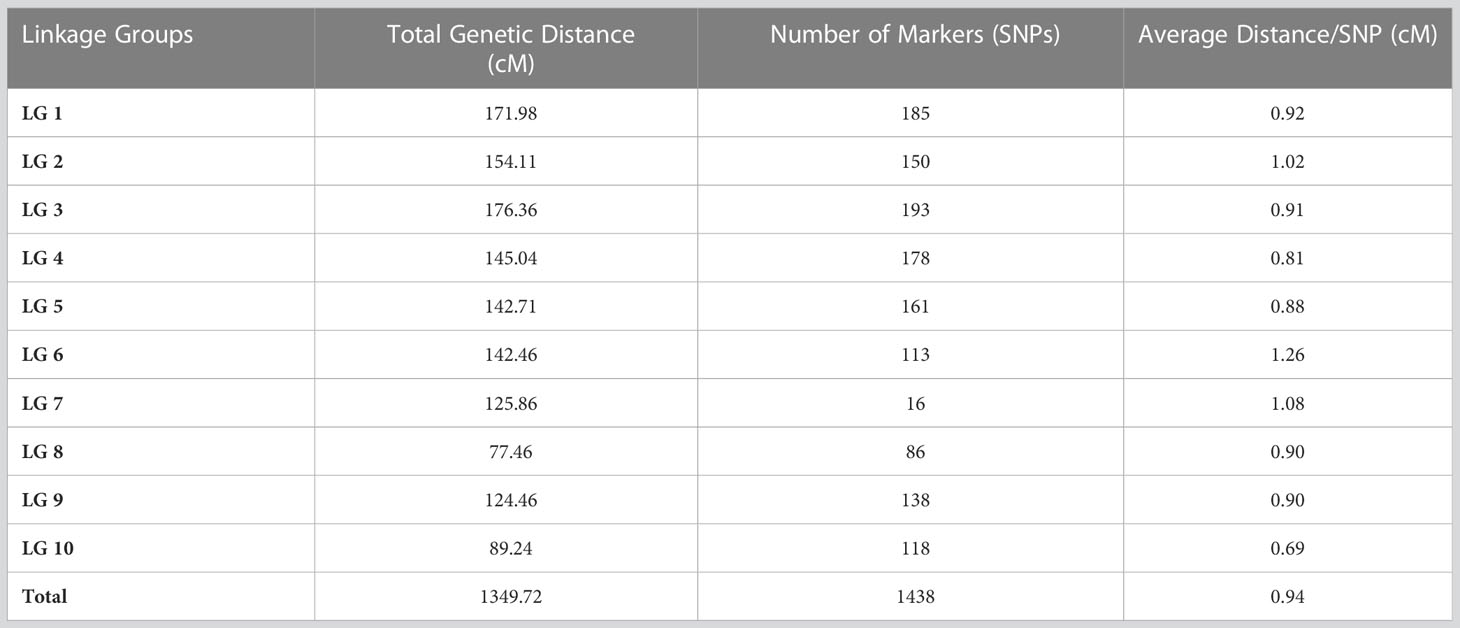
Table 4 SNP distribution on each chromosome.
3.4 QTL analysis for bioenergy-related traits
A total of ten QTLs were identified for all the traits (Table 5) (Figure 1). These are as follows:
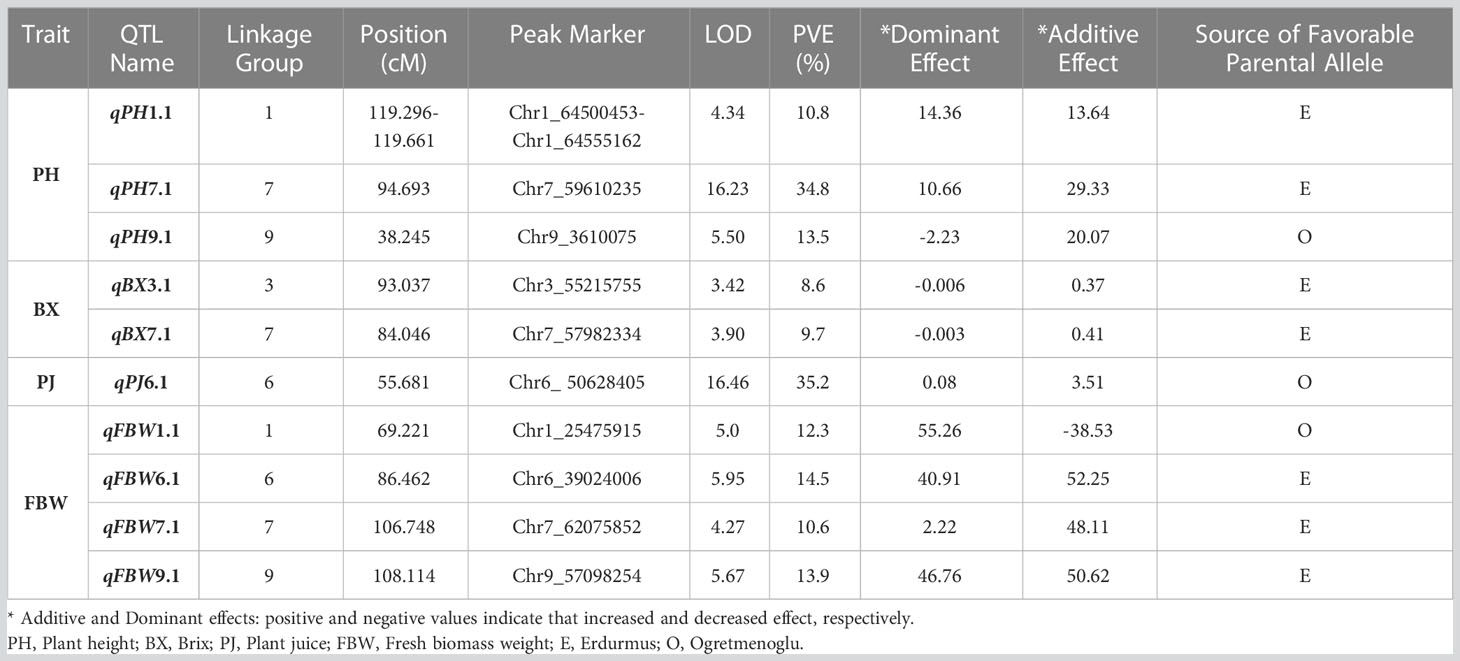
Table 5 QTL mapping for bioenergy-related traits in F3s.
PH: Three major QTLs were detected for PH on chromosomes 1, 7, and 9 (qPH1.1, qPH7.1, and qPH9.1). The logarithm of the odds (LOD) scores ranged from 4.34 to 16.23, and the percentage of phenotypic variation explained by each QTL ranged from 10.80 to 34.80%. The largest PVE, 34.8%, was for qPH7.1 at the position of 94.693 cM on LG7. The positive effects of qPH1.1 and qPH7.1 were conferred by the allele from Erdurmus, while the advantageous allele for the other QTL, qPH9.1, was from Ogretmenoglu.
After it was determined that GxE was significant for PH, QTLs were re-analyzed for the two environments, individually. For highland, three major QTLs were determined for PH on chromosomes 1, 7, and 9 (qPHK1.1, qPHK7.1, and qPHK9.1), which are in the same location with the QTL obtained with combined data. For lowland, four major QTLs (qPHA4.1, qPHA7.1, qPHA9.1 and qPHA9.2) were identified for PH. One QTL, qPHA4.1, was located on chromosome 4, and the LOD score and PVE were determined to be 5.11 and 12.6%, respectively. Two major QTLs, qPHA7.1 and qPHA9.1, were determined on chromosomes 7 and 9, which are located in the same position with the QTLs identified with the combined data. Another major QTL, qPHA9.2, on chromosome 9, was identified at position 107.38 cM with a LOD score of 4.26 (Figure 2).
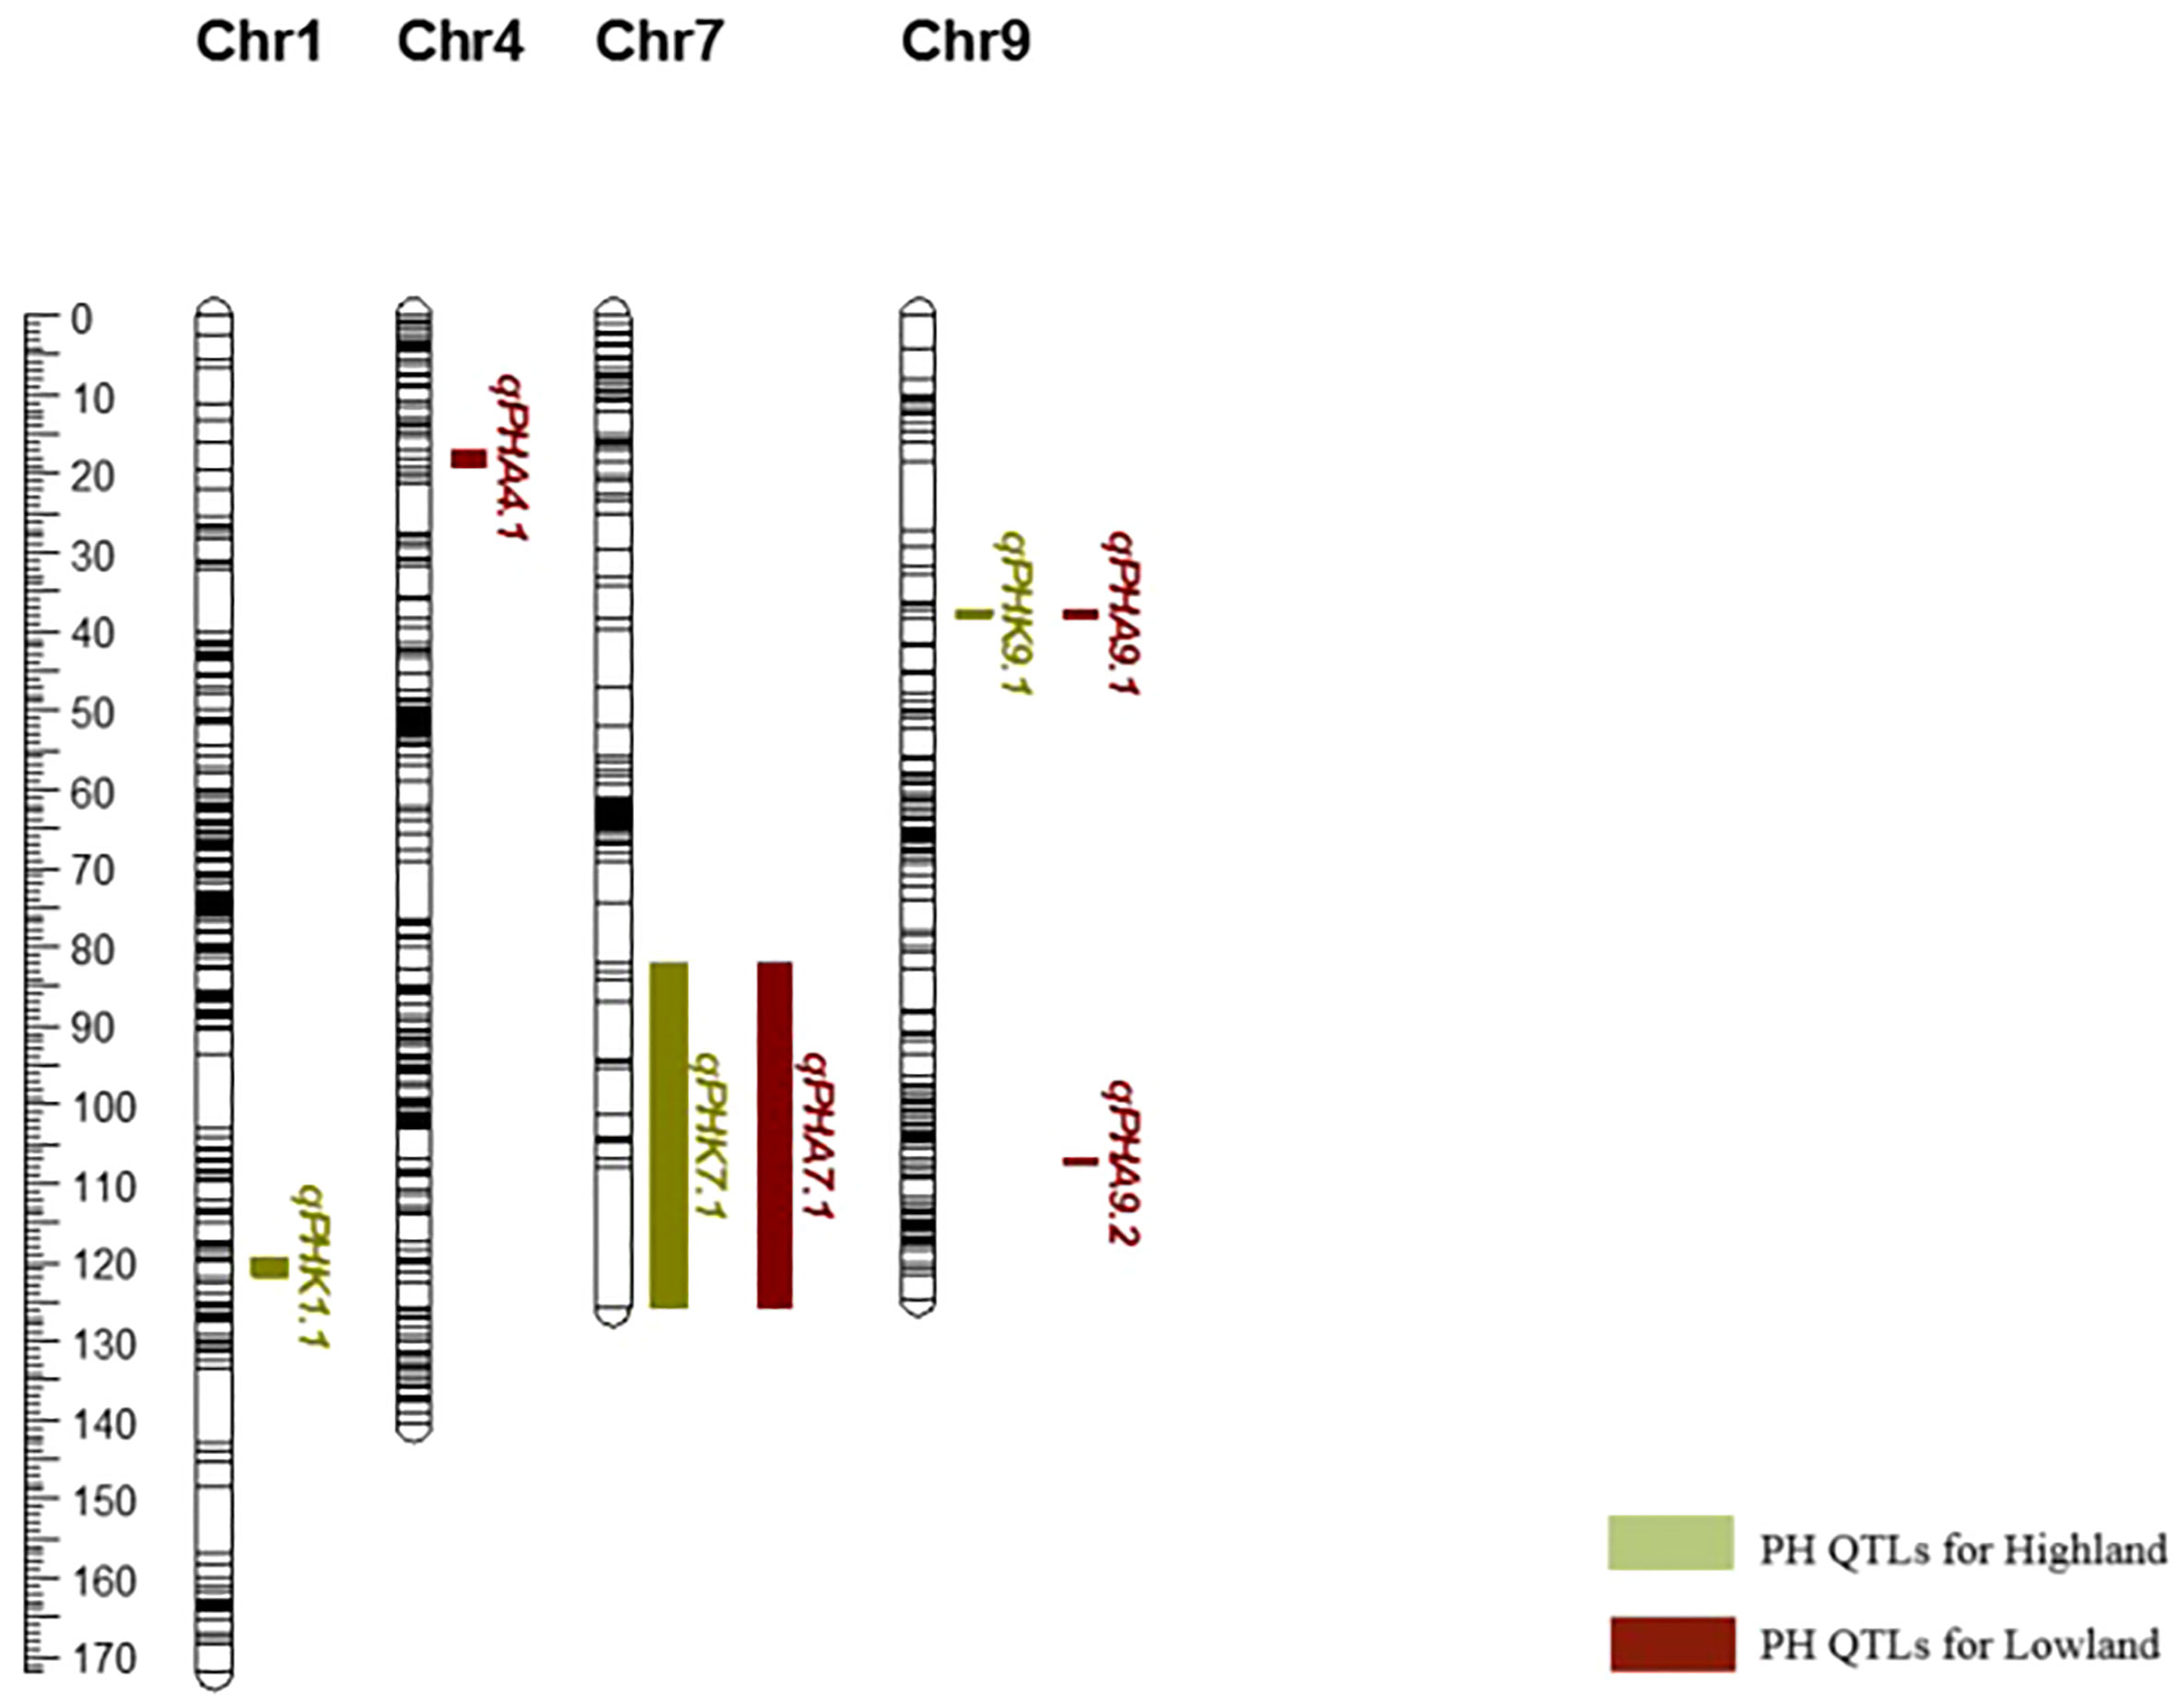
Figure 2 Genetic map of chromosomes 1, 4, 7 and 9 showing plant height QTLs determined individually for each environment.
BX: Two minor QTLs were identified for BX, namely qBX3.1 and qBX7.1. These were located on chromosomes 3 and 7. Their LOD scores ranged from 3.42 to 3.90 and the PVE values ranged from 8.6 to 9.7%. qBX7.1 showed the highest PVE value with 9.7%. The positive effects of qBX3.1 and qBX7.1 were both contributed by Erdurmus.
PJ: One major QTL was detected for PJ (qPJ6.1) on chromosome 6. The PVE value and LOD score were determined to be 35.2% and 16.46, respectively. The positive effect on increased PJ was attributed to the Ogretmenoglu allele at qPJ6.1.
FBW: Four major QTLs were detected for FBW (qFBW1.1, qFBW6.1, qFBW7.1 and qFBW9.1) and these were located on chromosomes 1, 6, 7 and 9. The LOD scores and PVE values ranged from 4.27 to 5.95 and 10.6 to 14.5%, respectively. qFBW6.1 had the largest PVE of 14.5% and a positive effect from Erdurmus. The effect of increased FBW was attributed to Erdurmus at qFBW7.1 and qFBW9.1, whereas reduced FBW was attributed to the Ogretmenoglu allele at qFBW1.1.
3.5 Overlapping QTLs
In this study, we identified two clusters of overlapping QTLs. qPH7.1/qFBW7.1, and qPH7.1/qBX7.1 contained QTLs for PH, FBW, and BX on chromosome 7, which were located at 106.748-107.873 and 83.204-95.407 cM, respectively (Figure 3).
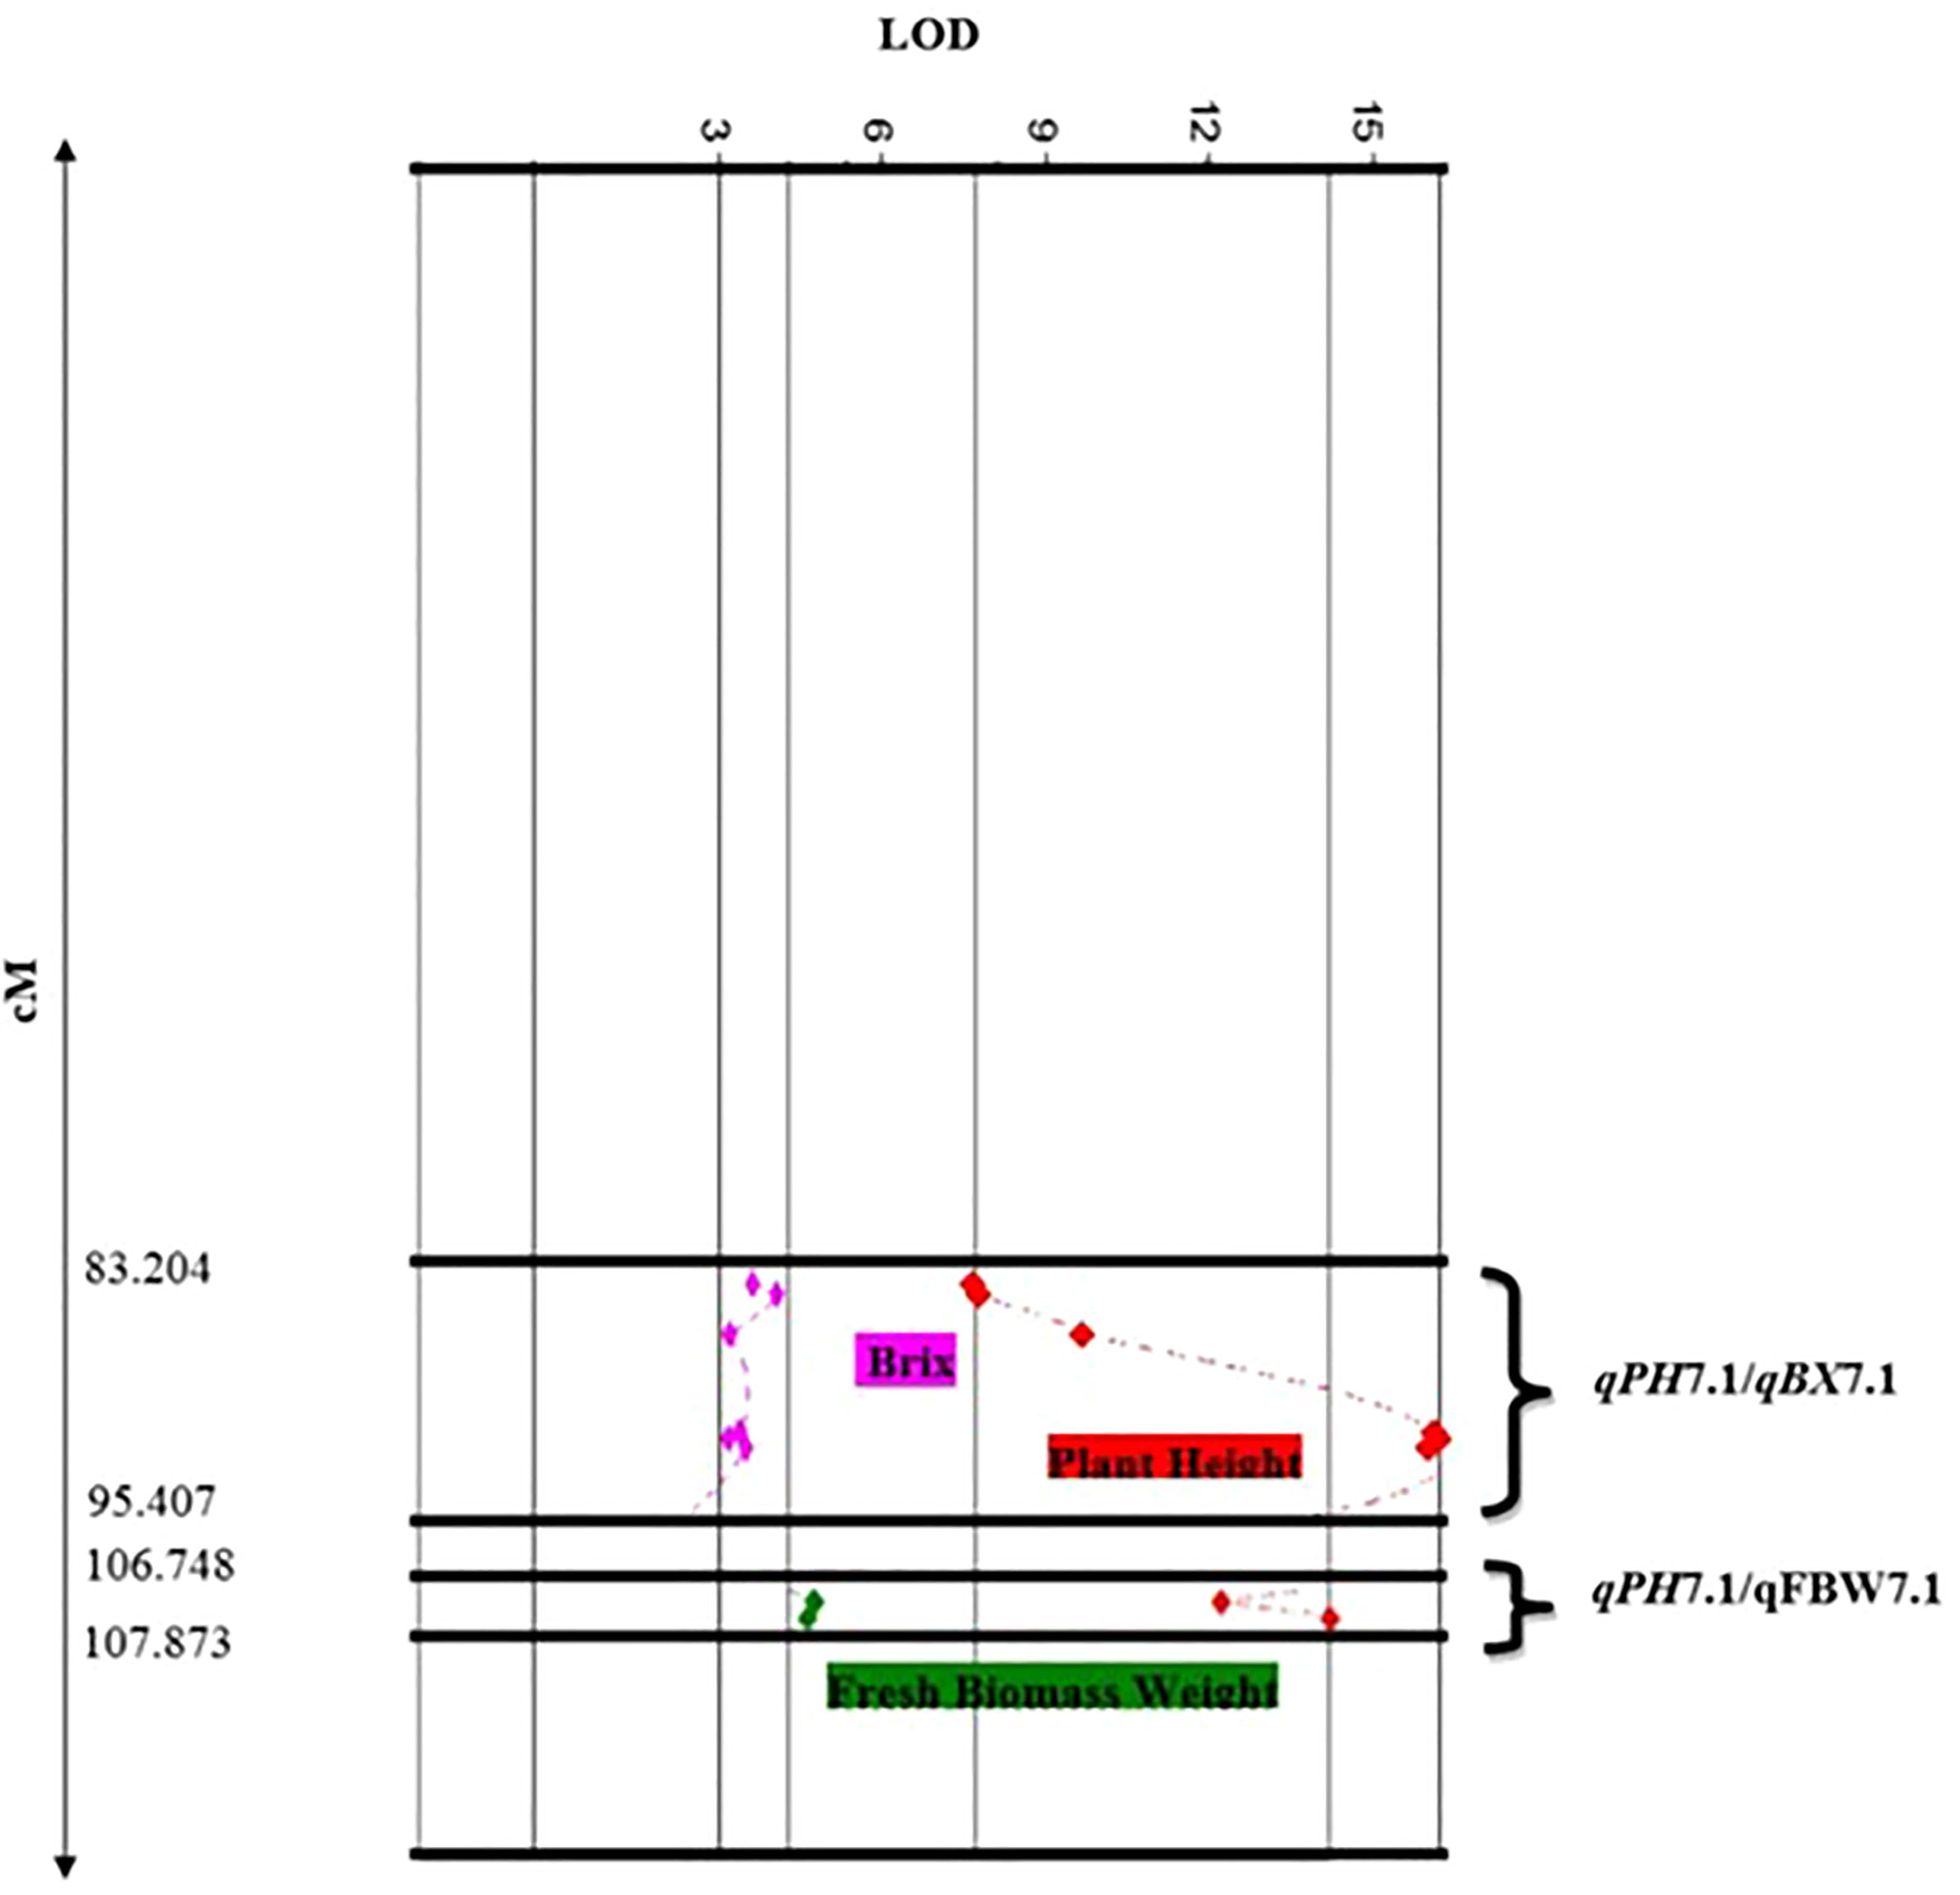
Figure 3 Close-up of QTL clusters showing LOD score distributions, for multiple traits with overlapping locations on the genetic map of chromosome 7.
3.6 Marker development and validation
Eight genome-specific CAPS markers associated with bioenergy-related traits were designed and developed. Forward and reverse sequences of the PCR primers for each marker, and their corresponding restriction enzymes, are given in Table 6. Eight sweet sorghum lines, one sweet sorghum cultivar and the two parents of our population were included in the validation. All amplified PCR and enzyme digested products generated fragments of the expected size for each CAPS marker. As an example, Figure 4 shows validation of FBW5, a potential fresh biomass weight CAPS marker. Only seven individuals provided the band of the digested PCR product, which contained two fragments of 209 and 165 bp each, whereas other individuals presented the pattern of the non-digested PCR amplification, which was 374 bp. All eight markers were consistent with the expected results, showing perfect matches between SNPs and CAPS cleavage (Table 7). Moreover, the phenotype scores for bioenergy-related traits in these lines are also submitted in Table 7.
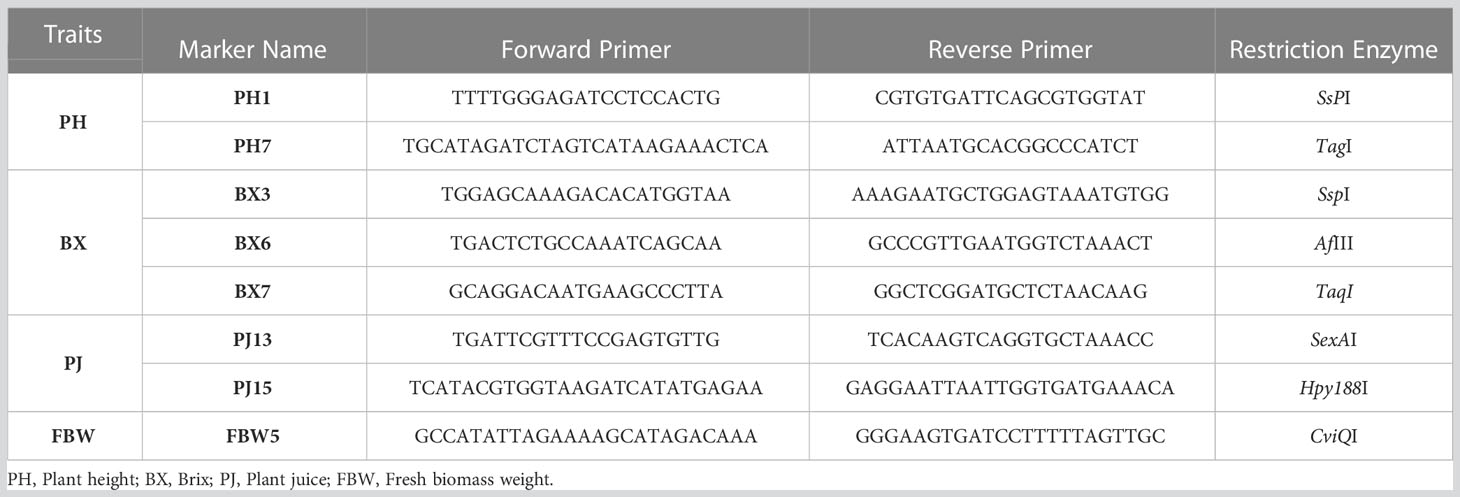
Table 6 Primer and enzyme combinations for genome-specific CAPS markers for the selected QTL-related regions.
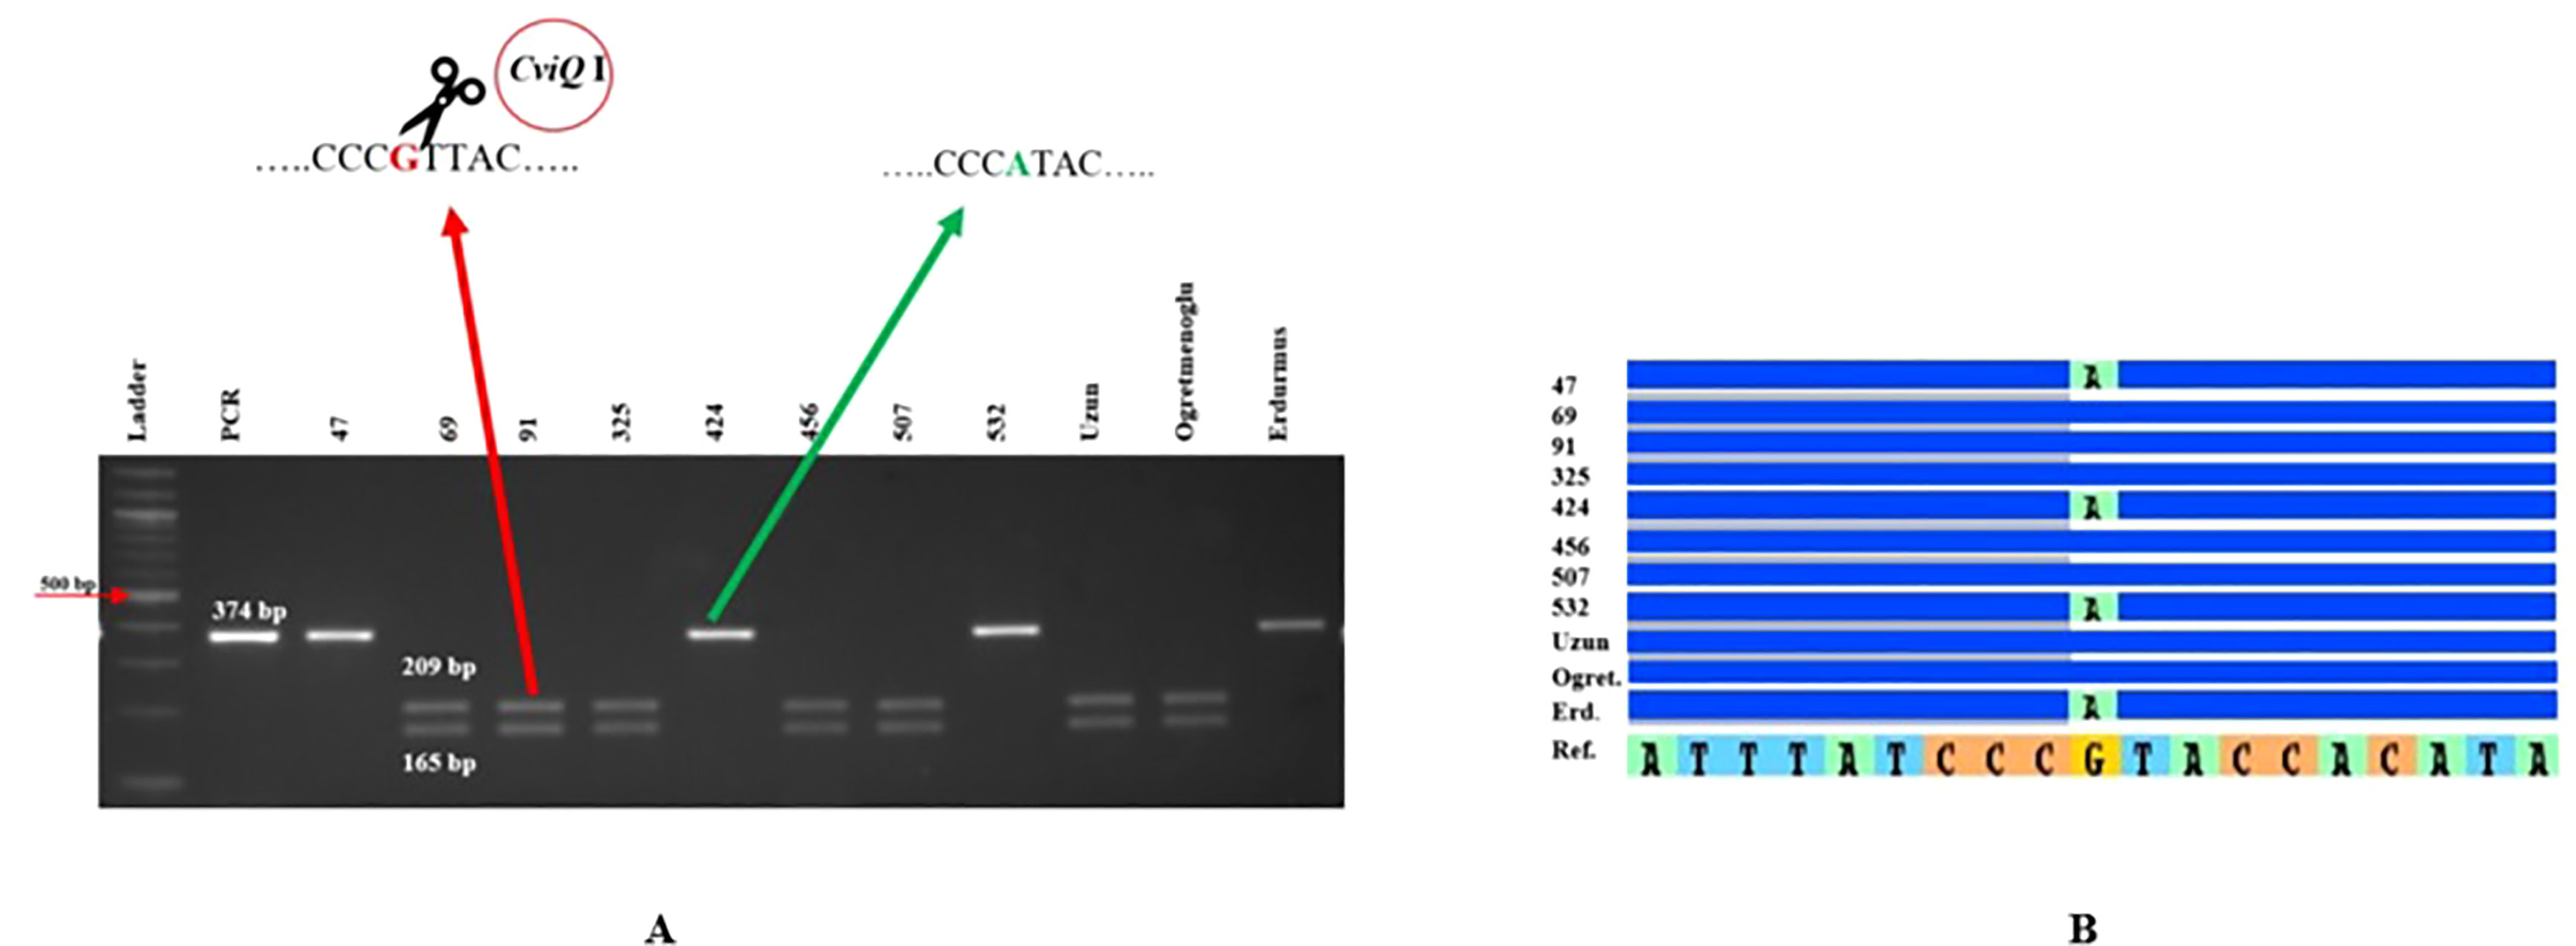
Figure 4 FBW5 CAPS marker validation. (A) Agarose gel electrophoresis for FBW5 after PCR amplification and CviQI digestion. (B) Sequence alignment showing SNPs in the relevant region for the lines tested. Erd: Erdurmus, Ogret: Ogretmenoglu, Ref: Sorghum reference genome, 47, 69, 91, 325, 424, 456, 507, 532 and Uzun are lines and cultivar, respectively. Ladder: 100 bp markers, PCR: non-digested amplification of FBW5 locus.
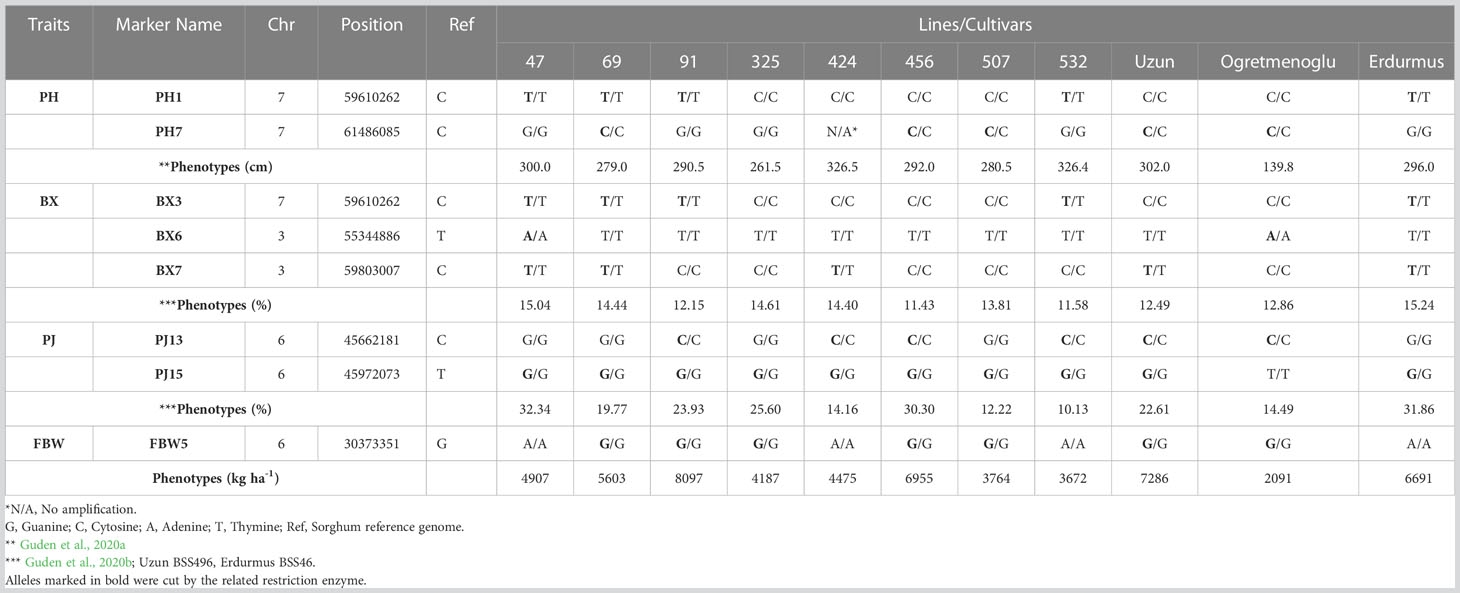
Table 7 CAPS marker validation and phenotypes in eight sweet sorghum lines, one sweet sorghum cultivar, and two parents.
4 Discussion
The ddRAD-Seq approach, a flexible diagnostic method for SNP-based genotyping, enabled the construction of a genetic map for an F2 population created by crossing high-sugar yielding (Erdurmus) and low-sugar yielding (Ogretmenoglu) sorghum genotypes. The obtained SNPs were distributed throughout the sorghum genome indicating the effectiveness of this technique, which made it possible to identify a large number of polymorphisms at a low cost (Peterson et al., 2012). The ddRAD-Seq technique has recently been utilized successfully in a variety of plants, including foxtail millet (Fukunaga et al., 2022), Brassica napus (Chen et al., 2017; Scheben et al., 2020), and sesame (Yol et al., 2021). To our knowledge, this study is the first to demonstrate that ddRAD-Seq is a suitable approach to detect variants at a genome-wide scale in the sorghum genome. We discovered 1438 SNP markers dispersed over 10 LGs (Figure 1), perfectly matching the number of chromosomes in S. bicolor (n = 10), demonstrating the power of the method. Despite the average interval distance being sufficient for precise mapping (Wang et al., 2020b), there were a few> 10 cM gaps in our map, especially on LG7 (Figure 1). Such gaps are occasionally observed in linkage maps in cases such as the mapping population being generated from two parents whose genetic backgrounds are similar in some regions, or due to divergence from the reference genome (Wang et al., 2020b). The total length of our map was 1349.72 cM, while the shortest and longest LGs were 77.46 and 176.36 cM respectively. Our results were compared with those by de Souza et al. (2021), who developed genetic maps for sorghum with GBS, which were similar in length (1368.8 cM) but with greater variance in SNP distribution across the LGs. A comparable GBS method was also used by Somegowda et al. (2022) to construct a genetic map of 1269.9 cM in length, with an average distance of 2.22 cM between adjacent markers. Jin et al. (2021) constructed a high-density genetic map with a length of 1191.7 cM with the single-digest RAD-seq method and the average distance between markers was 1.11 cM. In summary, the linkage map produced here is of very similar length to previously published maps for sweet sorghum, but slightly better in marker distribution and density.
One notable difference from the current work is that all of these previous studies used RILs, whereas the current genetic map was generated from the F2 lines; different computational approaches were also used in each case. In a comparable study to ours, using ddRAD-seq in a Brassica napus F2 population, the resulting linkage map (3981.3 cM) was noted to be significantly longer than maps generated using B. napus RILs (Scheben et al., 2020). It was suggested that the heterozygosity of F2 lines can lead to genotyping errors, inflating the length of LGs; however, in our study the map length was consistent with those generated from RILs, suggesting that any such genotyping errors were successfully filtered out during SNP selection and linkage mapping. We did observe some differences in marker order between the genetic map and the reference genome, especially in the peri-centromeric regions, as well as two putative translocations. While the type of mapping population, number of individuals (Li et al., 2017), choice of parental lines and sequencing methods (Yol et al., 2021) might all cause differences in mapping, the high density and consistency of marker order across the large majority of the ddRAD-seq linkage maps presented here make them useful for localizing QTLs (Scheben et al., 2020). Furthermore, the QTLs identified below were all in regions for which the marker order was closely conserved with the reference genome, indicating that they are likely to be consistent with other sorghum genotypes.
A total of ten QTLs related to bioenergy traits were determined in our population, and PVEs ranged from 8.6% to 35.2% across the environments. Three major QTLs (qPH1.1, qPH7.1 and qPH9.1) associated with PH were found on chromosomes 1, 7, and 9. These QTLs had additive effects that ranged from 13.64 to 29.33 and dominance effects that ranged from -2.23 to 14.36. Previously, four dwarfism genes influencing PH in sorghum, referred to as Dw1, Dw2, Dw3, and Dw4, were described (Quinby and Karper, 1954; Upadhyaya et al., 2013). GA2-oxidase is encoded by the gene Dw1 (Sobic.009G230800; Chr09:57093313–57095643) (Yamaguchi et al., 2016); overexpression of GA2-oxidase lowers active GA levels and shortens plant height (Wang et al., 2020c). Dw2 (Sobic.006G067700; Chr06:42803037–42807134) encodes a protein kinase that is homologous to KIPK, a member of the AGCVIII subgroup protein kinase family which affects endomembrane function and cell division during the formation of sorghum internodes (Hilley et al., 2017; Olivera et al., 2020). The Dw3 (Sobic.007G163800; Chr07:59821905–59829910 (Multani et al., 2003) gene is located on chromosome 7 and encodes an ABCB1 auxin efflux transporter. Other recently reported dwarfism genes include Dw5, found in a mutagenesis library of BTx623 (Chen and Laza, 2019), which affects sorghum plant height similarly to Dw1-Dw4 and decreases plant height by 36-53% (Habyarimana et al., 2020), and similarly Dw7a (Sobic.007G137101) can reduce sorghum height by 40–50% (Hashimoto et al., 2021). However, no protein-coding gene has yet been identified for Dw4 (Hashimoto et al., 2021). In present study, the SNP identified at Chr7_59610235 on QTL qPH7.1 had the largest contribution (34.8%) to PH and is located 220 kb away from the Dw3 a priori candidate gene (Multani et al., 2003). A second putative SNP at Chr7_59803007 was identified 30 kb away from Dw3 (Table 8). Various studies have also presented QTLs controlling plant height in sorghum near this location (Kajiya-Kanegae et al., 2020; Faye et al., 2021) (Table 8). Moreover, we found that the major QTL associated with plant height on chromosome 7, located between 83.204–107.873 cM, overlapped with two smaller QTLs for other bioenergy-related traits, Brix, and fresh biomass weight. This region also contains the Dw3 gene, and while it is possible that this gene also regulates biomass through limitation of plant height, the presence of the additional QTL for Brix suggests that this region may be a hot spot for genetic control of bioenergy production in sorghum. We also mapped qPH9.1 (Chr9_3610075) on chromosome 9 across both environments, but this QTL is distinct from the previously reported Dw1 gene (Sobic.009G230800, Chr09:57093313–57095643) (Hilley et al., 2016; Yamaguchi et al., 2016). It may demonstrate the presence of another candidate PH gene because QTL overlapping with qPH9.1 were also mapped to this position in a study by Wang et al. (2014). When we evaluated the environments individually, qPHA4.1 was colocalized with previous QTLs (Phuong et al., 2013; Zhang et al., 2015) on chromosome 4, qPHA9.2 was determined to be 33 kb away from Dw1 on chromosome 9 (Hilley et al., 2016).

Table 8 QTL regions and SNPs associated with genes published in previous studies.
The stalk sugar yield of sweet sorghum, which is influenced by sugar content and stalk juice, determines its potential for ethanol production (Guan et al., 2011). Although stem juice yield is a key factor in this regard, limited studies have been conducted to identify related genes/QTLs (Murray et al., 2008a; Murray et al., 2008b; Guan et al., 2011). In this study, one major QTL (qPJ6.1) for PJ was determined on chromosome 6, which explained 35.2% of the phenotypic variance. In recent years, a few studies have reported QTLs associated with PJ in sorghum that overlap with this position (de Souza et al., 2021; Ji et al., 2022). Mocoeur et al. (2015) identified a QTL with a high PVE (37.5%) located on chromosome 6 (48787617-50907017) associated with juice yield. Moreover, Burks et al. (2015) also determined a QTL associated with juice yield, and this QTL had a significant association with midrib color, sugar yield, sugar yield by weight, moisture, juice volume, and juiciness. These two QTLs also were found to colocalize with our QTL, qPJ6.1, on chromosome 6. Moreover, the qPJ6.1 QTL for PJ was located at 267 kb from the D-gene (Sobic.006G147400, which encodes a plant-specific NAC transcription factor that controls the juiciness of the stem (Zhang et al., 2018). Surprisingly, the positive effect on juice content at qPJ6.1 was associated with the allele from the ‘low-juice’ parent (Ogretmenoglu). This reflects the fact that juice yield is a complicated quantitative trait linked to plant height, biological yield, and sugar content (Burks et al., 2015; Han et al., 2015); it can be assumed that one of these other traits masks the effect of the beneficial qPJ6.1 allele in Ogretmenoglu. We also mapped four major QTLs associated with FBW; one of them, qFBW6.1 (Chr6_39024006), had a PVE of 14.5% and can be considered a novel QTL, because it did not overlap with any previously determined QTLs on chromosome 6.
Common QTLs determined across more than one environment or population are defined as stable QTLs, which may be more useful in breeding (Qu et al., 2021). Using variance analysis, the G × E interaction is determined as a QTL-by-environment (Q × E) interaction in QTL mapping studies (Chen et al., 2010). In the present study, variance analysis revealed that environmental effects play an important role in the development of bioenergy-related traits, especially for PH. Ten QTLs in total and three QTLs for PH were identified from combined data from two environments, including both lowland and highland sites. During the vegetative period, the lowland site had a much higher maximum temperature (39.7-40.9°C) than highland (33.0-34.9°C), and very little rain (Table 1). In this period, the optimal temperature range for sorghum is 26-34°C (Hammer et al., 1993). This situation may have caused variation in bioenergy-related traits; therefore, the QTLs detected across both environments are more likely to be stable under different conditions, although this should be confirmed with additional phenotyping data from different years. This was supported by the finding of two plant height major QTLs (qPHA4.1 and qPHA9.2) that were only evident when data from the two environments were analyzed individually, and do not co-localize with those determined using combined data (Figure 2).
Phenotypic traits are highly influenced by both environmental changes and growth stage. Therefore, molecular markers should be integrated into breeding programs to allow desired traits to be selected rapidly and independently of environment effects. In the present study, CAPS markers closely linked with several QTLs for pH, BX, PJ, and FBW traits were developed. Two markers, PH1 and BX3, were positioned in the same region of chromosome 7 because of their overlapping QTLs. PH1, PH7, BX3, BX6, PJ13, PJ15, and FBW5 markers were each strongly linked to their respective QTL regions. Moreover, the PH1 marker was approximately 220 kb from the Dw3 gene, while FBW5 was derived from the novel QTL (qFBW6.1) for FBW identified on chromosome 6. All markers, which were validated on eight lines and three cultivars, showed perfect matches with the detected SNPs. Although CAPS markers have been widely used in genetic analysis, there is only one study in which genome-specific CAPS markers have been developed in sorghum. Burow et al. (2019) developed CAPS markers to identify the genotype of bmr6-12 lines and determined that the GA 340 cultivar was classified as bmr6 while BTx623-bmr and B03288bmr were classified as bmr12. Several SNP markers closely linked with the eight major and two minor QTLs reported here can supply beneficial information to facilitate fine mapping of bioenergy-related traits. CAPS markers converted from these SNPs could also be readily used for pyramiding genes for bioenergy-related traits in breeding programs in the near future.
5 Conclusion
We used the ddRAD-seq approach to construct a high-density linkage map developed from an F2 population in sweet sorghum, and to screen the linkage map for bioenergy-related traits. Ten QTLs associated with plant height, Brix, fresh biomass weight, and plant juice were identified from combined data from two contrasting environments, including lowland and highland sites. In addition to the identified major QTLs, a novel QTL for effective fresh biomass weight and newly improved CAPS markers, one of which was from this region, add to the current knowledge about these traits and provide additional capacity for the improvement of bioenergy production in sorghum.
Data availability statement
The datasets presented in this study can be found in online repositories. The names of the repository/repositories and accession number(s) can be found below: https://www.ncbi.nlm.nih.gov/, PRJNA894980.
Author contributions
BU designed and supervised the experiments. EY, BU and SL contributed final editing of manuscript. BU analyzed the data of map and QTL. BG, EY, and BU conducted the experiments and analyzed the data. BG, EY, CE and BU conducted the field trials. All authors contributed to the article and approved the submitted version.
Funding
This study was supported by the Scientific and Technological Research Council of Turkey (TUBITAK) [grant numbers of 118O169].
Acknowledgments
The authors acknowledge West Mediterranean Agricultural Research Institute and Soil, Water and Deserting Control Research Institute for supplying their infrastructure to the project, and Scientific and Technological Research Council of Turkey (TUBITAK) for funding under the grant number of 118O169.
Conflict of interest
The authors declare that the research was conducted in the absence of any commercial or financial relationships that could be construed as a potential conflict of interest.
Publisher’s note
All claims expressed in this article are solely those of the authors and do not necessarily represent those of their affiliated organizations, or those of the publisher, the editors and the reviewers. Any product that may be evaluated in this article, or claim that may be made by its manufacturer, is not guaranteed or endorsed by the publisher.
Supplementary material
The Supplementary Material for this article can be found online at: https://www.frontiersin.org/articles/10.3389/fpls.2023.1081931/full#supplementary-material
Supplementary Figure 1 | Dot plot comparison of the genetic positions of SNPs in each linkage group (horizontal axis) with their mapped position on the corresponding chromosome in the reference genome (vertical axis)
References
Abebe, T., Belay, G., Tadesse, T., Keneni, G. (2020). Selection efficiency of yield-based drought tolerance indices to identify superior sorghum [Sorghum bicolor (L.) moench] genotypes under two-contrasting environments. Afr J. Agric. Res. 15, 379–392. doi: 10.5897/AJAR2020.14699
Andrews, K. R., Good, J. M., Miller, M. R., Luikart, G., Hohenlohe, P. A. (2016). Harnessing the power of RADseq for ecological and evolutionary genomics. Nat. Rev. Genet. 17, 81–92. doi: 10.1038/nrg.2015.28
Basak, M., Uzun, B., Yol, E. (2019). Genetic diversity and population structure of the Mediterranean sesame core collection with use of genome-wide SNPs developed by double digest RAD-seq. PloS One 14, e0223757. doi: 10.1371/journal.pone.0223757
Brown, P. J., Rooney, W. L., Franks, C., Kresovich, S. (2008). Efficient mapping of plant height quantitative trait loci in a sorghum association population with introgressed dwarfing genes. Genetics 180, 629–637. doi: 10.1534/genetics.108.092239
Burks, P. S., Kaiser, C. M., Hawkins, E. M., Brown, P. J. (2015). Genomewide association for sugar yield in sweet sorghum. Crop Sci. 55, 2138–2148. doi: 10.2135/cropsci2015.01.0057
Burow, G., Chopra, R., Sattler, S., Burke, J., Acosta-Martinez, V., Xin, Z. (2019). Deployment of SNP (CAPS and KASP) markers for allelic discrimination and easy access to functional variants for brown midrib genes bmr6 and bmr12 in sorghum bicolor. Mol. Breed. 39, 115. doi: 10.1007/s11032-019-1010-7
Calvin, K., Cowie, A., Berndes, G., Arneth, A., Cherubini, F., Portugal-Pereira, J., et al. (2021). Bioenergy for climate change mitigation: scale and sustainability. GCB Bioenergy. 13, 1346–1371. doi: 10.1111/gcbb.12863
Calvino, M., Messing, J. (2012). Sweet sorghum as a model system for bioenergy crops. Curr. Opin. Biotechnol. 23, 323–329. doi: 10.1016/j.copbio.2011.12.002
Chen, J., Laza, H. (2019). Registration of BTx623dw5, a new sorghum dwarf mutant. J. Plant Regist. 13, 254–257. doi: 10.3198/jpr2018.09.0058crgs
Chen, W., Sun, D., Li, R., Wang, S., Shi, Y., Zhang, W., et al. (2020). Mining the stable quantitative trait loci for agronomic traits in wheat (Triticum aestivum l.) based on an introgression line population. BMC Plant Biol. 20, 275. doi: 10.1186/s12870-020-02488-z
Chen, J., Wang, B., Zhang, Y., Yue, X., Li, Z., Liu, K. (2017). High-density ddRAD linkage and yield-related QTL mapping delimits a chromosomal region responsible for oil content in rapeseed (Brassica napus l.). Breed Sci. 67, 296–306. doi: 10.1270/jsbbs.16116
Chen, X., Zhao, F., Xu, S. (2010). Mapping environment-specific quantitative trait loci. Genetics 186, 1053–1066. doi: 10.1534/genetics.110.120311
Chen, S., Zhou, Y., Chen, Y., Gu, J. (2018). Fastp: an ultra-fast all-in-one FASTQ preprocessor. Bioinformatics 34, 884–890. doi: 10.1093/bioinformatics/bty560
de Souza, V. F., da Silva Pereira, G., Pastina, M. M., da Costa Parrella, R. A., Ferreira Simeone, M. L., de Almeida Barros, B., et al. (2021). QTL mapping for bioenergy traits in sweet sorghum recombinant inbred lines. G3: Genes Genomes Genet. 11, jkab314. doi: 10.1093/g3journal/jkab314
Faye, J. M., Maina, F., Akata, E. A., Sine, B., Diatta, C., Mamadou, A., et al. (2021). A genomics resource for genetics, physiology, and breeding of West African sorghum. Plant Genome. 14, e20075. doi: 10.1002/tpg2.20075
Fukunaga, K., Abe, A., Mukainari, Y., Komori, K., Tanaka, K., Fujihara, A., et al. (2022). Recombinant inbred lines and next-generation sequencing enable rapid identification of candidate genes involved in morphological and agronomic traits in foxtail millet. Sci. Rep. 12, 218. doi: 10.1038/s41598-021-04012-1
Garrison, E., Marth, G. (2012). Haplotype-based variant detection from shortread sequencing. arXiv, arXiv,1207.3907. doi: 10.48550/arXiv.1207.3907
Girardot, C., Scholtalbers, J., Sauer, S., Su, S., Furlong, E. (2016). Je a versatile suite to handle multiplexed NGS libraries with unique molecular identifiers. BMC Bioinform. 17, 419. doi: 10.1186/s12859-016-1284-2
Glaubitz, J. C., Casstevens, T. M., Lu, F., Harriman, J., Elshire, R. J. (2014). TASSEL-GBS: a high capacity genotyping by sequencing analysis pipeline. PloS One 9, e90346. doi: 10.1371/journal.pone.0090346
Guan, Y., Wang, Hl., Qin, L., Zhang, H.-w., Yang, Y.-b., Gao, F.-j., et al. (2011). QTL mapping of bio-energy related traits in sorghum. Euphytica 182, 431. doi: 10.1007/s10681-011-0528-5
Guden, B., Erdurmus, S., Uzun, B. (2020b). Evaluation of sweet sorghum genotypes for bioethanol yield and related traits. Biofuels Bioprod. Biorefining. 15, 545–562. doi: 10.1002/bbb.2169
Guden, B., Yol, E., Erdurmus, C., Uzun, B. (2020a). SSR marker analysis of plant height in sweet sorghum [Sorghum bicolor (L.) moench]. Mediterr. Agric. Science. 33, 405–410. doi: 10.29136/mediterranean.780085
Habyarimana, E., De Franceschi, P., Ercisli, S., Baloch, F. S., Dall’Agata, M. (2020). Genome-wide association study for biomass related traits in a panel of Sorghum bicolor and s. bicolor × S. halepense populations. Front. Plant Sci. 11, 551305. doi: 10.3389/fpls.2020.551305
Hammer, G. L., Carberry, P. S., Muchow, R. C. (1993). Modeling genotypic and environmental control of leaf area dynamics in grain sorghum. whole plant level. Field Crops Res. 33, 293–310. doi: 10.1016/0378-4290(93)90087-4
Han, Y., Lv, P., Hou, S., Li, S., Ji, G., Ma, X., et al. (2015). Combining next generation sequencing with bulked segregant analysis to fine map a stem moisture locus in sorghum (Sorghum bicolor l. moench). PloS One 10, 371–385. doi: 10.1371/journal.pone.0127065
Hashimoto, S., Wake, T., Nakamura, H., Minamiyama, M., Araki-Nakamura, S., Ohmae-Shinohara, K., et al. (2021). The dominance model for heterosis explains culm length genetics in a hybrid sorghum variety. Sci. Rep. 11, 4532. doi: 10.1038/s41598-021-84020-3
Hilley, J., Truong, S., Olson, S., Morishige, D., Mullet, J. (2016). Identification of Dw1, a regulator of sorghum stem internode length. PloS One 11, e0151271. doi: 10.1371/journal.pone.0151271
Hilley, J. L., Weers, B. D., Truong, S. K., McCormick, R. F., Mattison, A. J., McKinley, B. A., et al. (2017). Sorghum Dw2 encodes a protein kinase regulator of stem internode length. Sci. Rep. 7, 1–13. doi: 10.1038/s41598-017-04609-5
Ji, G., Wang, J., Zhang, Z., Shi, Y., Du, R., Jiang, Y., et al. (2022). Identification of QTLs associated with multiple agronomic traits in sorghum. Euphytica 218, 140. doi: 10.1007/s10681-022-03089-7
Jin, P., Wang, L., Zhao, W., Zheng, J., Wang, Y.-H., Liu, Y., et al. (2021). Construction of high-density genetic map and QTL mapping in sorghum × sudangrass. Euphytica 217, 162. doi: 10.1007/s10681-021-02895-9
Kajiya-Kanegae, H., Takanashi, H., Fujimoto, M., Ishimori, M., Norikazu, O., Fiona, W. W., et al. (2020). RAD-seq-based high-density linkage map construction and QTL mapping of biomass-related traits in sorghum using the Japanese landrace takakibi NOG. Plant Cell Physiol. 61, 1262–1272. doi: 10.1093/pcp/pcaa056
Kosambi, D. D. (1944). The estimation of map distance from recombination values. Ann. Eugen. 12, 12172–12175. doi: 10.1111/j.1469-1809.1943.tb02321.x
Kumar, P., Gupta, V., Misra, A., Modi, D., Pandey, B. (2009). Potential of molecular markers in plant biotechnology. Plant Omics. 2, 141.
Langmead, B., Salzberg, S. L. (2012). Fast gapped-read alignment with bowtie 2. Nat. Methods 9, 357–359. doi: 10.1038/nmeth.1923
Lee, J.-H., Natarajan, S., Biswas, M. K., Shirasawa, K., Isobe, S., Kim, H.-T., et al. (2018). SNP discovery of Korean short day onion inbred lines using double digest restriction site-associated DNA sequencing. PloS One 13, e0201229. doi: 10.1371/journal.pone.0201229
Li, H., Handsaker, B., Wysoker, A., Fennell, T., Ruan, J., Homer, N., et al. (2009). The sequence alignment/map format and SAMtools. Bioinformatics 25, 2078–2079. doi: 10.1093/bioinformatics/btp352
Li, L., Zhao, S., Su, J., Fan, S., Pang, C., Wei, H., et al. (2017). High-density genetic linkage map construction by F2 populations and QTL analysis of early-maturity traits in upland cotton (Gossypium hirsutum l.). PloS One 12, e0182918. doi: 10.1371/journal.pone.0182918
Ma, B., Liao, L., Peng, Q., Fang, T., Zhou, H., Korban, S. S., et al. (2017). Reduced representation genome sequencing reveals patterns of genetic diversity and selection in apple. J. Integr. Plant Biol. 59, 190–204. doi: 10.1111/jipb.12522
Mace, E., Innes, D., Hunt, C., Wang, X., Tao, Y., Baxter, J., et al. (2019). The sorghum QTL atlas: a powerful tool for trait dissection, comparative genomics and crop improvement. Theor. Appl. Genet. 132, 751–766. doi: 10.1007/s00122-018-3212-5
McCormick, R. F., Truong, S. K., Sreedasyam, A., Jenkins, J., Shu, S., Sims, D., et al. (2018). The sorghum bicolor reference genome: improved assembly, gene annotations, a transcriptome atlas, and signatures of genome organization. Plant J. 93, 338–354. doi: 10.1111/tpj.13781
Mocoeur, A., Zhang, Y. M., Liu, Z. Q., Shen, X., Zhang, L.-M., Rasmussen, R. K., et al. (2015). Stability and genetic control of morphological, biomass and biofuel traits under temperate maritime and continental conditions in sweet sorghum (Sorghum bicolour). Theor. Appl. Genet. 128, 1685–1701. doi: 10.1007/s00122-015-2538-5
Multani, D. S., Briggs, S. P., Chamberlin, M. A., Blakeslee, J. J., Murphy, A. S., Johal, G. S. (2003). Loss of an MDR transporter in compact stalks of maize br2 and sorghum dw3 mutants. Science 302, 81–84. doi: 10.1126/science.1086072
Murray, S. C., Rooney, W. L., Hamblin, M. T., Mitchell, S. E., Kresovich, S. (2009). Sweet sorghum genetic diversity and association mapping for brix and height. Plant Gen. 2, 48. doi: 10.3835/plantgenome2008.10.0011
Murray, S. C., Rooney, W. L., Mitcell, S. E., Sharma, A., Klein, P. E., Mullet, J. E., et al. (2008b). Genetic improvement of sorghum as a biofuel feedstock: II. QTL for stem and leaf structural carbohydrates. Crop Sci. 48, 2180–2193. doi: 10.2135/cropsci2008.01.0068
Murray, S. C., Sharma, A., Rooney, W. L., Klein, P. E., Mullet, J. E., Mitchell, S. E., et al. (2008a). Genetic improvement of sorghum as a biofuel feedstock: i. QTL for stem sugar and grain nonstructural carbohydrates. Crop Sci. 48, 2165–2179. doi: 10.2135/cropsci2008.01.0016
Olivera, S. S., Kaliramesh, S., Vlada, B. V., Ivana, B. B., Marija, B. T., Ciampitti, I. A., et al. (2020). Production of biofuels from sorghum. Renewable Sustain. Energy Rev. 124, 109769. doi: 10.1016/j.rser.2020.109769
Oztolan-Erol, N., Helmstetter, A. J., İnan, A., Buggs, R. J., Lucas, S. J. (2021). Unraveling genetic diversity amongst European hazelnut (Corylus avellana l.) varieties in Turkey. Front. Plant Sci. 12, 661274. doi: 10.3389/fpls.2021.661274
Paterson, A. H. (2008). Genomics of sorghum. Int. J. Plant Genomics 5, 1–6. doi: 10.1155/2008/362451
Peterson, B. K., Weber, J. N., Kay, E. H., Fisher, H. S., Hoekstra, H. E. (2012). Double digest RADseq: an inexpensive method for de novo SNP discovery and genotyping in model and non-model species. PloS One 7, e37135. doi: 10.1371/journal.pone.0037135
Phuong, N., Stutzel, H., Uptmoor, R. (2013). Quantitative trait loci associated to agronomic traits and yield components in a sorghum bicolor l. moench RIL population cultivated under pre-flowering drought and well-watered conditions. Agric. Science. 4, 12. doi: 10.4236/as.2013.412107
Prasad, S., Venkatramanan, V., Singh, A. (2021). “Renewable energy for a low-carbon future: policy perspectives,” in Sustainable bioeconomy. Eds. Venkatramanan, V., Shah, S., Prasad, R. (Singapore: Springer).
Qu, P., Wang, J., Wen, W., Gao, F., Liu, J., Xia, X., et al. (2021). Construction of consensus genetic map with applications in gene mapping of wheat (Triticum aestivum l.) using 90K SNP array. Front. Plant Sci. 12, 727077. doi: 10.3389/fpls.2021.727077
Quinby, J. R., Karper, R. E. (1954). Inheritance of height in sorghum. Agron. J. 46, 211–216. doi: 10.2134/agronj1954.00021962004600050007x
Quinlan, A. R., Hall, I. M. (2010). BEDTool: a flexible suite of utilities for comparing genomic features. Bioinformatics 26, 841–842. doi: 10.1093/bioinformatics/btq033
Rather, R. A., Wani, A. W., Mumtaz, S., Padder, S. A., Khan, A. H., Almohana, A. I., et al. (2022). Bioenergy: a foundation to environmental sustainability in a changing global climate scenario. J. King Saud Univ. – Science. 34, 107134. doi: 10.1016/j.jksus.2021.101734
Reddy, B. V. S., Ramesh, S., Reddy, P. S., Ramaiah, V., Salimath, P. M., Kachapur, R. (2005). Sweet sorghum: a potential alternate raw material for bio-ethanol and bio-energy. J. SAT Agric. Res. 1, 1–8.
Regassa, T. H., Wortmann, C. S. (2014). Sweet sorghum as a bioenergy crop: literature review. Biomass Bioenerg. 64, 348–355. doi: 10.1016/j.biombioe.2014.03.052
Roy, S. C., Moitra, K., De Sarker, D. (2017). Assessment of genetic diversity among four orchids based on ddRAD sequencing data for conservation purposes. Physiol. Mol. Biol. Plants. 23, 169–183. doi: 10.1007/s12298-016-0401-z
Scheben, A., Severn-Ellis, A. A., Patel, D., Pradhan, A., Rae, S. J., Batley, J., et al. (2020). Linkage mapping and QTL analysis of flowering time using ddRAD sequencing with genotype error correction in Brassica napus. BMC Plant Biol. 20, 546. doi: 10.1186/s12870-020-02756-y
Smith, G. A., Bagby, M. O., Lewellan, R. T., Doney, D. L., Moore, P. H., Hills, F. J., et al. (1987). Evaluation of sweet sorghum for fermentable sugar production potential. Crop Sci. 27, 788–793. doi: 10.2135/cropsci1987.0011183X002700040037x
Somegowda, V. K., Prasad, K. V. S. V., Naravula, J., Vemula, A., Selvanayagam, S., Rathore, A., et al. (2022). Genetic dissection and quantitative trait loci mapping of agronomic and fodder quality traits in sorghum under different water regimes. Front. Plant Sci. 13, 810632. doi: 10.3389/fpls.2022.810632
Takaki, M., Tan, L., Murakami, T., Tang, Y.-Q., Sun, Z.-Y., Morimura, S., et al. (2015). Production of biofuels from sweet sorghum juice via ethanol-methane two-stage fermentation. Ind. Crops Prod. 63, 329–336. doi: 10.1016/j.indcrop.2014.10.009
Untergasser, A., Cutcutache, I., Koressaar, T., Ye, J., Faircloth, B. C., Remm, M., et al. (2012). Primer3–new capabilities and interfaces. Nucleic Acids Res. 40, e115–e115. doi: 10.1093/nar/gks596
Upadhyaya, H. D., Wang, Y. H., Gowda, C. L. L., Sharma, S. (2013). Association mapping of maturity and plant height using SNP markers with the sorghum mini core collection. Theor. Appl. Genet. 12, 2003–2015. doi: 10.1007/s00122-013-2113-x
Van Ooijen, J. W. (2009). MapQTL 6, software for the mapping of quantitative trait loci in experimental populations of diploid species (Wageningen, Netherlands: Kyazma BV).
Van Ooijen, J. W. (2011). Multipoint maximum likelihood mapping in a full-sib family of an outbreeding species. Genet. Res. 93, 343–349. doi: 10.1017/S0016672311000279
Vincze, T., Posfai, J., Roberts, R. J. (2003). NEBcutter: a program to cleave DNA with restriction enzymes. Nucleic Acids Res. 31, 3688–3691. doi: 10.1093/nar/gkg526
Voorrips, R. E. (2002). MapChart: software for the graphical presentation of linkage maps and QTLs. J. Hered. 93, 77–78. doi: 10.1093/jhered/93.1.77
Wang, J., Li, J., Liu, Z., Yuan, X., Wang, S., Chen, H., et al. (2020b). Construction of a high-density genetic map and its application for QTL mapping of leaflet shapes in mung bean (Vigna radiata l.). Front. Genet. 11, 1032. doi: 10.3389/fgene.2020.01032
Wang, X., Mace, E., Hunt, C., Cruickshank, A., Henzell, R., Parkes, H., et al. (2014). Two distinct classes of QTL determine rust resistance in sorghum. BMC Plant Biol. 14, 366. doi: 10.1186/s12870-014-0366-4
Wang, Y., Sun, J., Ali, S. S., Gao, L., Ni, X., Li, X., et al. (2020c). Identification and expression analysis of sorghum bicolor gibberellin oxidase genes with varied gibberellin levels involved in regulation of stem biomass. Ind. Crops Prod. 145, 111951. doi: 10.1016/j.indcrop.2019.111951
Wang, H., Wang, R., Liu, B., Yang, Y., Qin, L., Chen, E., et al. (2020a). QTL analysis of salt tolerance in sorghum bicolor during whole-plant growth stages. Plant Breed. 139, 455–465. doi: 10.1111/pbr.12805
Yadav, P., Priyanka, P., Kumar, D., Yadav, A., Yadav, K. (2019). “Bioenergy crops: recent advances and future outlook,” in Prospects of renewable bioprocessing in future energy systems. Eds. Rastegari, A., Yadav, A., Gupta, A. (Cham: Springer), 315–335.
Yamaguchi, M., Fujimoto, H., Hirano, K., Araki-Nakamura, S., Ohmae-Shinohara, K., Fujii, A., et al. (2016). Sorghum Dw1, an agronomically important gene for lodging resistance, encodes a novel protein involved in cell proliferation. Sci. Rep. 6, 28366. doi: 10.1038/srep28366
Yol, E., Basak, M., Kizil, S., Lucas, S. J., Uzun, B. (2021). A high-density SNP genetic map construction using ddRAD-seq and mapping of capsule shattering trait in sesame. Front. Plant Sci. 12, 679659. doi: 10.3389/fpls.2021.679659
Zhang, D., Kong, W., Robertson, J., Goff, V. H., Epps, E., Kerr, A., et al. (2015). Genetic analysis of inflorescence and plant height components in sorghum (Panicoidae) and comparative genetics with rice (Oryzoidae). BMC Plant Biol. 15, 107. doi: 10.1186/s12870-015-0477-6
Keywords: bioethanol, cereal, ddRAD-seq, pyramiding, QTL
Citation: Guden B, Yol E, Erdurmus C, Lucas SJ and Uzun B (2023) Construction of a high-density genetic linkage map and QTL mapping for bioenergy-related traits in sweet sorghum [Sorghum bicolor (L.) Moench]. Front. Plant Sci. 14:1081931. doi: 10.3389/fpls.2023.1081931
Received: 27 October 2022; Accepted: 15 May 2023;
Published: 05 June 2023.
Edited by:
Mulatu Geleta, Swedish University of Agricultural Sciences, SwedenReviewed by:
HongXiang Zheng, Shandong Normal University, ChinaJoseph Knoll, United States Department of Agriculture (USDA), United States
Copyright © 2023 Guden, Yol, Erdurmus, Lucas and Uzun. This is an open-access article distributed under the terms of the Creative Commons Attribution License (CC BY). The use, distribution or reproduction in other forums is permitted, provided the original author(s) and the copyright owner(s) are credited and that the original publication in this journal is cited, in accordance with accepted academic practice. No use, distribution or reproduction is permitted which does not comply with these terms.
*Correspondence: Bulent Uzun, YnVsZW50dXp1bkBha2Rlbml6LmVkdS50cg==