 Anja Holzhausen1,2*
 Petra Nowak1
 Andreas Ballot3Ralf Becker4†
 Jasmina Gebert1Thomas Gregor5
 Kenneth G. Karol6
 Elisabeth Lambert7
 William Pérez6Uwe Raabe8Susanne C. Schneider3Nick Stewart9
 Klaus van de Weyer10Volker Wilde11
 Hendrik Schubert1
- 1Institute of Biological Sciences, Aquatic Ecology, University Rostock, Rostock, Germany
- 2Department of Biology, Plant Cell Biology, University Marburg, Marburg, Germany
- 3Norwegian Institute for Water Research, Oslo, Norway
- 4Independent Researcher, Oldenburg, Germany
- 5Senckenberg Forschungsinstitut und Naturmuseum, Botanik und Molekulare Evolutionsforschung, Frankfurt am Main, Germany
- 6Program for Molecular Systematics Studies, The New York Botanical Garden, Bronx, NY, United States
- 7Département de Biologie Environnement, Faculté des Sciences, Université Catholique de l’Ouest, Angers, France
- 8Independent Researcher, Marl, Germany
- 9Independent Researcher, Glastonbury, United Kingdom
- 10lanaplan GbR, Nettetal, Germany
- 11Paläontologie und Historische Geologie, Paläobotanik, Senkenberg Forschungsinstitut und Naturmuseum, Frankfurt am Main, Germany
In Europe, the genus Tolypella (Characeae) comprises four to eight Tolypella taxa in sections Rothia and Tolypella that have been distinguished by vegetative morphology and gametangial characters such as antheridial size and oospore wall ornamentation. However, morphological differentiation is difficult in some cases due to overlapping and variable vegetative features, which in many cases are difficult to observe clearly. To clarify the taxonomic status of the five European taxa of Tolypella in section Tolypella, sequence data of the plastid genes atpB, rbcL and psbC for Tolypella glomerata (Desv.) Leonh., Tolypella hispanica Allen, Tolypella nidifica (O.F. Müll.) A. Braun, Tolypella normaniana (Nordst.) Nordst. and Tolypella salina Cor. were combined with data on oospore morphology, including oospore wall ornamentation. Gene sequence data identified five distinct clusters, but they were not consistent with the morphologically identified five taxa. T. glomerata consisted of some of the samples morphologically identified as T. glomerata and seven samples of T. normaniana, while the remaining T. glomerata samples clustered with specimens of unclear affiliation (Tolypella sp.). We identified two clusters of T. hispanica within the European material: cluster T. hispanica I consisted of samples from various locations, whereas the second cluster (T. hispanica II) consisted of samples of T. hispanica from Sardinia Island. The remaining cluster consisted of all the specimens that had been determined as T. salina or T. nidifica in addition to two specimens of T. normaniana. Oospore morphology was most clearly distinguishable for T. glomerata. Oospore characteristics for all other taxa were not as informative but showed some geographical and/or environmentally influenced differences, especially for T. nidifica and T. salina. Our results suggest the need to further check the different taxonomy of Tolypella sect. Tolypella in which specimens normally identified as T. glomerata might be two different taxa, T. glomerata and an unidentified taxon; T. nidifica and T. salina are not separate taxa; T. normaniana is a diminutive variant of two different Tolypella taxa; and T. hispanica comprises two different taxa, one from the Mediterranean island Sardinia.
1. Introduction
Charophytes, extant and fossil members of the order Charales plus the members of the extinct orders Sycidiales and Moellerinales (Schneider et al., 2015) are algae with a complex morphology, which are closely related to modern land plants (Nishiyama et al., 2018). Taxa delineation of charophytes is commonly based on morphological traits of the plant thallus, and accurate identification of charophytes is important for understanding their diversity and for documenting changes in distribution. Charophyte identification is, however, hampered because of morphological plasticity influenced by abiotic factors. This specifically applies to the genus Tolypella A. Braun, where morphological characters are in some cases difficult to use because of (1) their small size and fragility, which often makes characters hard to observe; (2) phenotypic plasticity due to environmental influences such as water level and salinity (Lambert et al., 2013; Mouronval et al., 2015); and (3) their short vegetative cycle that (a) often impede the use of characters derived from mature oospores (Wood, 1965) and (b) lead to fewer taxa collections due to their main development period being within a short time period that is easily missed. Some Characeae, particularly in the genus Tolypella, are ephemeral and seem to be rare. Most authors agree to split Tolypella into two sections, Tolypella and Rothia, differentiated mainly by the shape of end cells (obtuse for Tolypella and acute for Rothia, Krause, 1997) as well as habitat traits (Mouronval et al., 2015). Former Tolypella “unranked” Obtusifolia, described by Allen (1883) became a synonym of Tolypella sect. Tolypella by the choice of Tolypella nidifica as type of Tolypella by Wood (1965). This section includes taxa with evanescent and obtuse end cells, undivided sterile branchlets and a separated basal impression (Sawa and Frame, 1974). Eight taxa of Tolypella have been described from Europe (Krause, 1997): five taxa are included in section Tolypella and include Tolypella glomerata (Desv.) Leonh., Tolypella hispanica Allen, Tolypella nidifica (O.F. Müll.) A. Braun, Tolypella normaniana (Nordst.) Nordst., and Tolypella salina Cor. Taxa of the section Rothia are not considered in this study. There is no agreement about the taxonomic status of these taxa among different authors. For example, T. nidifica and T. salina were treated as distinct taxa by Krause (1997) or Mouronval et al. (2015) based on oospore features including ornamentation patterns, while Corillion (1960) described T. salina as new taxon based on morphological and cytological criteria.
Of all the taxa in section Tolypella, only T. hispanica can be unambiguously differentiated, because they are dioecious, while all other Tolypella taxa are monoecious. Identification of the remaining four taxa has been mainly based on vegetative morphological traits, including oospore characteristics (Krause, 1997) and ecological features (Wood, 1965). In order to aid identification of the genus Tolypella, the additional use of oospore characteristics (e.g. length, number of striae and membrane ornamentation) has been suggested as occasionally useful (e.g. Pérez et al., 2015). In addition, DNA barcoding, i. e. the use of short regions of DNA to identify taxa by assigning individuals to known taxa through comparison of their barcodes with a reference library, has become a popular means to improve identification (Mccourt et al., 1999; Sheth and Thaker, 2017). Moreover, DNA barcoding permits the identification of morphologically similar but genetically different (‘cryptic’) taxa (Bickford et al., 2007; Struck et al., 2018), a common phenomenon for algae (Díaz-Tapia et al., 2018). Pérez et al. (2016) used the genes, atpB, rbcL and psbC successfully for discrimination within the genus Tolypella in North America. Therefore, the same three plastid genes were also used in this study to investigate the diversity of section Tolypella.
The aim of this study is to gain new insights into European Tolypella taxa by means of oospore characters combined with genetic data. For this, specimens of T. glomerata, T. hispanica, T. normaniana, T. salina and T. nidifica were examined, with the latter two included in such an attempt for the first time.
2. Materials and methods
2.1. Vegetative morphology and gametangial characters
Fresh plant material was morphologically determined by the respective collector (Tables S1, S2) based on descriptions by various authors (Wood and Imahori, 1965; Corillion, 1975; Krause, 1997; Cirujano et al., 2008; Lambert et al., 2013; Pérez et al., 2016; Van De Weyer and Schmidt, 2018). According to those, all used T. hispanica were clearly identified by their dioecious character, whereas T. glomerata, T. salina and T. nidifica were first determined by antheridial sizes, habitat occurrences and oospore ornamentation.
Individuals that featured vegetative and antheridial characters of two taxa, e.g., T. nidifica and T. salina, were determined as T. sp.
2.2. Material
Specimens identified as T. glomerata, T. hispanica, T. nidifica, T. normaniana and T. salina by means of vegetative characters (mostly antheridia sizes) were obtained from herbarium collections and from field collections by the authors for a total of 157 specimens. The collections span the period between 1871 and 2020 from locations in nine European countries (Austria, France, Germany, Great Britain, Greece, Ireland, Italy, the Netherlands, Norway, Portugal, Sweden) and from Chile in South America (Table S1). In addition, 40 specimens (Denmark, Italy, Germany, Great Britain, Greece, France, Norway, Portugal, Sweden) could not be unambiguously assigned morphologically to any recognized taxon and are referred to as Tolypella sp. throughout the manuscript.
Specimens of T. nidifica and T. glomerata from deep water sites were collected by diving. In shallow waters, samples were gathered by snorkeling or wading. Some specimens of T. salina (France) and T. glomerata (Germany) originated from germination experiments under laboratory conditions (e.g., Holzhausen, 2016; Holzhausen et al., 2017). For all fresh material, oospores were harvested after release from cultured material in order to confidently assess oospore maturity. In addition, oospores of T. nidifica from Austria and Germany were collected from sediment samples. Herbarium specimens were sampled from collections deposited in the Herbarium Rostochiense (ROST), the New York Botanical Garden Sterre Herbarium (NY), UiO Vascular Plants Herbarium, Natural History Museum, University of Oslo (O) and private herbaria of the collectors (Table S1).
2.3. Genetic analyses
Dried plant material was obtained from a total of 193 individuals initially identified as T. glomerata (60 specimens), T. hispanica (15 specimens), T. nidifica (51 specimens), T. salina (50 specimens), T. normaniana (9 specimens), and 13 morphologically ambiguous Tolypella sp. Genetic data for the atpB, psbC and rbcL plastid genes presented in this study were obtained by three different working groups: A) the University of Rostock, B) the New York Botanical Garden and C) the Norwegian Institute for Water Research by the following methods.
Method A) Genomic DNA was extracted using the DNeasy Plant Mini Kit (Qiagen, Hilden, Germany), following the manufacturer’s protocol. Amplification of the plastid genes rbcL, psbC, and atpB was performed with 10 PCR cycles with one minute each of annealing at 94°C, extension at 55°C, and denaturation at 72°C, followed by one minute each for denaturation (94°C), annealing (52°C), and polymerisation (72°C) in 25 cycles. The amplified DNA was purified using the Biometra-innuPrep Gel ExtractionKit (Analytik Jena, Jena, Germany) according to the manufacturer’s instructions. Samples were sequenced using a 3130×L GeneticAnalyzer (Applied Biosystems, NY, USA) with sequencing primers identical to the primers that were used for PCR reactions (Table S3). Obtained sequences were checked visually and aligned using BioEdit v.7.0.5.2 (Hall, 1999).
Method B) Genomic DNA was extracted using the Nucleon Phytopure DNA extraction kit (GE Healthcare Gio-Sciences, Pittsburgh, PA, USA, Pérez et al., 2014). The atpB, psbC and rbcL genes were amplified by a nested PCR reaction using either a PTC-200 DNAEngine® Thermal Cycler (Bio-Rad, Hercules, CA, USA) or a Mastercycler® pro S (Eppendorf AG, Hamburg, Germany). Initial PCR amplicons were generated through the following cycling program: initial denaturation at 95 ˚C for 2 minutes; 35 cycles of 95 ˚C for 15 seconds; 48 ˚C for 15 seconds and 72 ˚C for 30 seconds; and followed by a final extension at 72 ˚C for five minutes. The resulting PCR product were used in a second round of PCR amplification to generate internal sequences using the same cycling program with the exception that the cycling was reduced to 30 cycles and the final extension time reduced to 30 seconds. Products from both PCR sets were sequenced at the University of Washington Genome Center (Seattle, WA, USA).
Method C) Genomic DNA from Tolypella material was isolated after (Schneider et al., 2016). PCR for the rbcl, atpB, and psbC genes was performed on a Bio-Rad CFX96 Real-Time PCR Detection System (Bio-Rad Laboratories, Oslo, Norway) using the iProof High-Fidelity PCR Kit (Bio-Rad Laboratories, Oslo, Norway). The following cycling protocol was used for all three genes: one cycle of 5 min at 94°C, and then 35 cycles each consisting of 10 s at 94°C, 20 s at 62°C, and 20 s at 72°C, followed by a final elongation step of 72°C for 5 min. PCR products were visualized by 1.5% agarose gel electrophoresis with GelRed staining (GelRed® Nucleic Acid Gel Stain, Biotium, Fremont, USA) and UV illumination. Amplification of the rbcL, atpB and psbC gene region was conducted using the primers listed in Table S3. In some cases, a nested PCR was conducted using the former PCR product as template and a second primer pair for a further PCR amplification. For sequencing the same primers and if necessary, intermediate primers were used (Table S3). Sequences were analyzed and aligned using Seqassem (version 04/2008) and Align (version 03/2007) MS Windows-based manual sequence alignment editor (SequentiX – DigitalDNA Processing, Klein Raden Germany) to obtain DNA sequence alignments, which were then corrected manually. For each PCR product, both strands were sequenced on an ABI 3730 Avant genetic analyzer using the BigDye terminator V.3.1 cycle sequencing kit (Biosystems, Applied Biosystems, Thermo Fisher Scientific Oslo, Norway) according to the manufacturer’s instructions.
Complete sequences of all three plastid genes could not be generated for every sample analyzed due to the differing qualities of the specimens (age, storing conditions, drying conditions after collection, etc.). Therefore, four different datasets were used for the phylogenetic analyses in order to obtain as much information as possible for all specimens. The first dataset included the three plastid gene sequences from 88 individuals, whereas three additional data sets were compiled for each plastid gene separately; the atpB dataset with a total of 1034 positions for 94 samples, the psbC dataset with a total of 1104 positions for 125 samples, and the rbcL dataset with a total of 1265 positions for 189 samples. As outgroup, which is defined as closely related taxon or group outside of the taxon investigated, two different sequences of T. porteri were used. In order to estimate evolutionary divergence, pair-wise uncorrected p-distances and the number of substitutions were conducted using MEGA version7 (Kumar et al., 2016). To uncover phylogenetic relationships, Bayesian inference (BI) and maximum likelihood (ML) trees were constructed, with evolutionary substitution models evaluated in MEGA v.7. The method selected the same best-fitting evolutionary model (GTR+G+I) for each of the four datasets. The ML algorithm was conducted in MEGA v.7 with 1000 bootstrap replicates. BI trees were performed with MrBayes 3.2.6 (e.g. Ronquist and Huelsenbeck, 2003) with a random starting tree and two independent runs of one cold and three heated chains, each using default parameters. Each analysis was run for 2 million generations with trees sampled every 1000 generations and the first 25% generations discarded as burn-in.
Due to small genetic distances among some taxa, intraspecific data often produce a variety of possible trees when using conventional tree building methods. In such cases, the relationship among taxa is best expressed by a network that is able to show alternative potential phylogenetic relationships within a single figure (Bandelt et al., 1999). Furthermore, networks allow the identification and illustration of ancestral alleles whereas phylogenetic trees treat all sequences as terminal taxa (Posada and Crandall, 2002). For that reason, Median-Joining (MJ) network analyses were performed using the PopART software v1.7 (Leigh et al., 2015).
2.4. Oospore analyses
The terminology of oospore characters in this study is based on Soulié-Märsche and García (2015). Descriptions of membrane ornamentation follow those of Frame (1977) and Urbaniak et al. (2012). Altogether, 712 mature oospores were harvested from herbarium specimens, fresh plant material and sediment samples. Oospores were collected from 12 specimens of T. glomerata, 19 of T. nidifica, 18 of T. salina and 10 of T. sp. The individual numbers of oospores examined and the appropriate pre-treatments are given in Table S2. Oospores were stored in well plates for eventual re-examination and are part of the Rostocker oospore database (Holzhausen et al., 2015).
For stereomicroscopic analysis, oospores were photographed in lateral, apical, and basal views with a mounted camera. Qualitative oospore characteristics that were examined included colour, shape and membrane ornamentation. To differentiate among the various brown hues of oospores, colour terms used in this study are clay brown, fawn brown, nut brown, chestnut brown, dark brown wine red and black brown (RAL COLOUR SYSTEM). Quantitative characteristics included: number of striae, expression of striae (prominence of striae), angle of striae with respect to the longitudinal axis, oospore length and width, fossa width (average of 4 fossae), and length of the outer lines of the pentagonal basal impression. Length measurements were calculated using ImageJ 1.50i. The ISI (isopolarity index; 100*(length/width)) was also calculated.
Scanning electron microscope (SEM) analyses of oospores were performed at the Senckenberg Forschungsinstitut und Naturmuseum Frankfurt. Prior to SEM observations, few oospores were pre-cleaned (HoAc 5%) and all were dried by lyophilisation. Dry specimens were later sputter-coated with gold. SEM images of the surface of oospores and fossa walls (magnification 200-2500X) were produced with a JEOL JSM-6490 LV in high-vacuum mode by using secondary electrons and routinely applying an acceleration voltage of 20kV.
Oospore characters were tested for normality using the Shapiro-Wilk Test. Pairwise tests were performed for different levels of analyses (taxon, country, region, type of location and plants) by the Kruskal-Wallis Test (SPSS). P ≤ 0.05 was used as statistical significance for oospore analyses.
To identify (a) the correlation between oospore characteristics and regionality and (b) parameter combinations that might provide reliable discrimination, combined analyses of all quantitative and qualitative oospore features as well as their ratios, with the exception of the membrane ornamentation, were performed by nonmetric multivariate techniques using the Primer7 software package (Clarke and Gorley, 2015). Principal component analysis (PCA) was based on standardised, square root transformed data and Euclidean distance matrices. Multiplot-Analysis based on non-treated raw data.
3. Results
3.1. Genetic analyses
The phylogenetic analyses of the plastid gene sequences in each dataset recovered the 196 Tolypella individuals into five general clades that were denoted as ‘T. glomerata’, ‘T. nidifica/salina’, ‘Tolypella sp.’, and two distinct ‘T. hispanica’ clades (‘T. hispanica I’ and ‘T. hispanica II’; Figure 1; Table S4). Supporting values for each cluster were given in the sections below. The gene sequence similarities of Tolypella individuals within each group were generally over 99.8% (Table 1). However, support for their phylogenetic placements were unresolved or weakly to moderately supported in the single gene analyses. Phylogenetic resolution and support were greatest in the three-gene analyses. The results of the network analyses were comparable to the phylogenetic trees, with the same clusters recovered in both approaches (Figures 1, 2; Table S1; Figures S1–S3). Results for the ML tree and the MJ network of concatenated gene sequences are shown in Figures 1, 2. Complete trees and networks for single gene analyses are shown in the supplement (Figures S1–S3). The labels used to identify genetic groups correspond to those in Table S1.
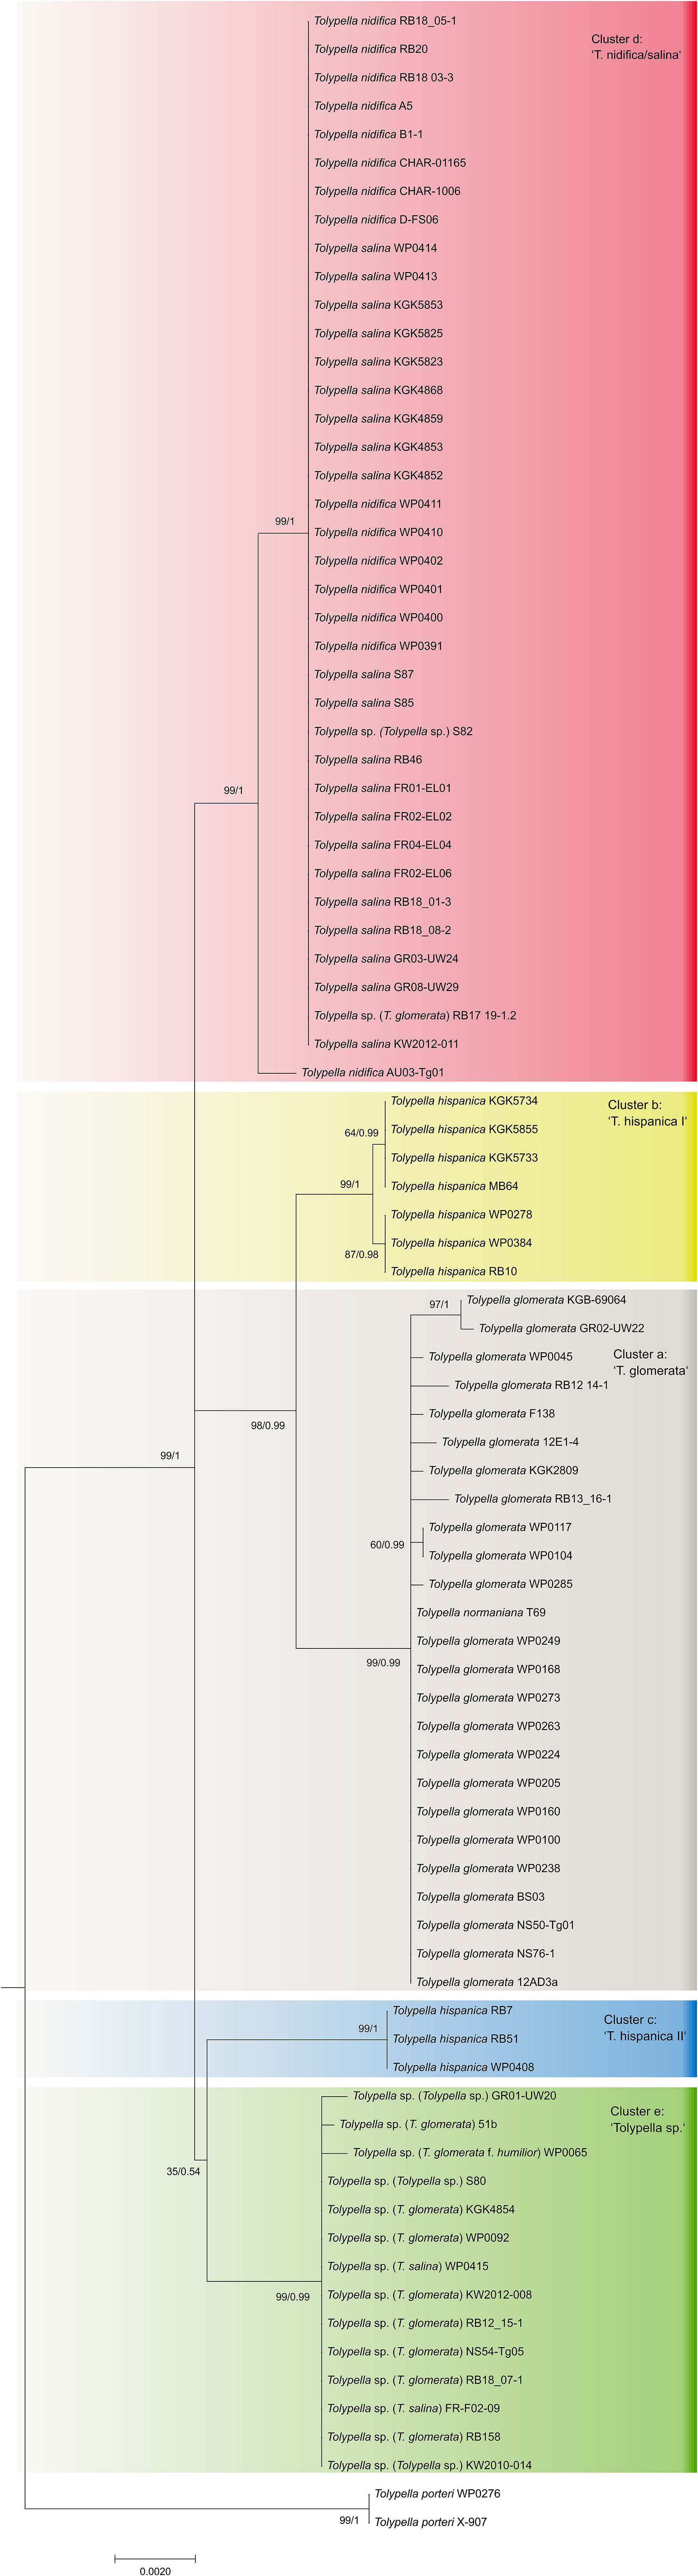
Figure 1 Maximum likelihood tree of genus Tolypella based on concatenated atpB, psbC, and rbcL sequence data. Phylogeny of Characeae based on combined atpB, psbC, and rbcL sequence data. Maximum likelihood tree with bootstrap values and posterior probabilities above branches (≥ 50%).
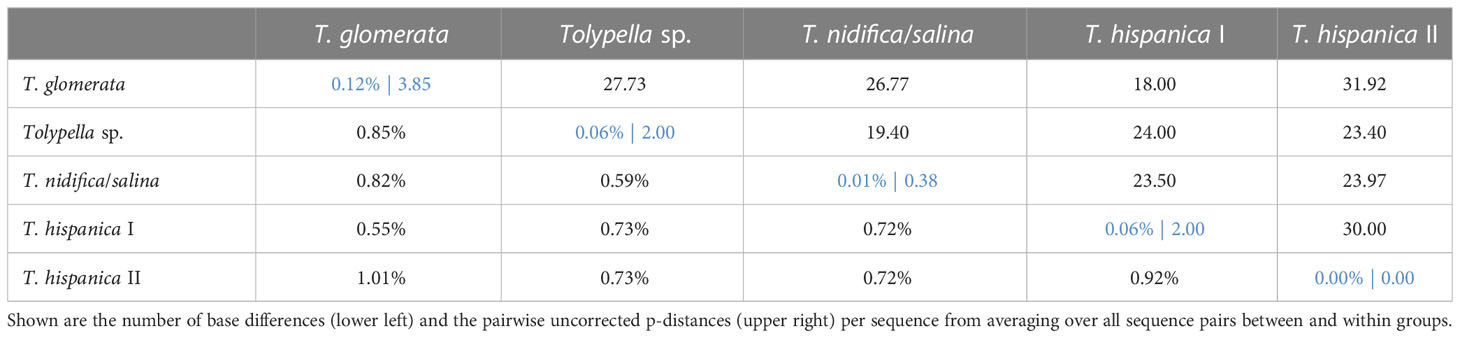
Table 1 Estimates of evolutionary divergence based on concatenated dataset over sequence pairs between (black) and within (blue) main groups.
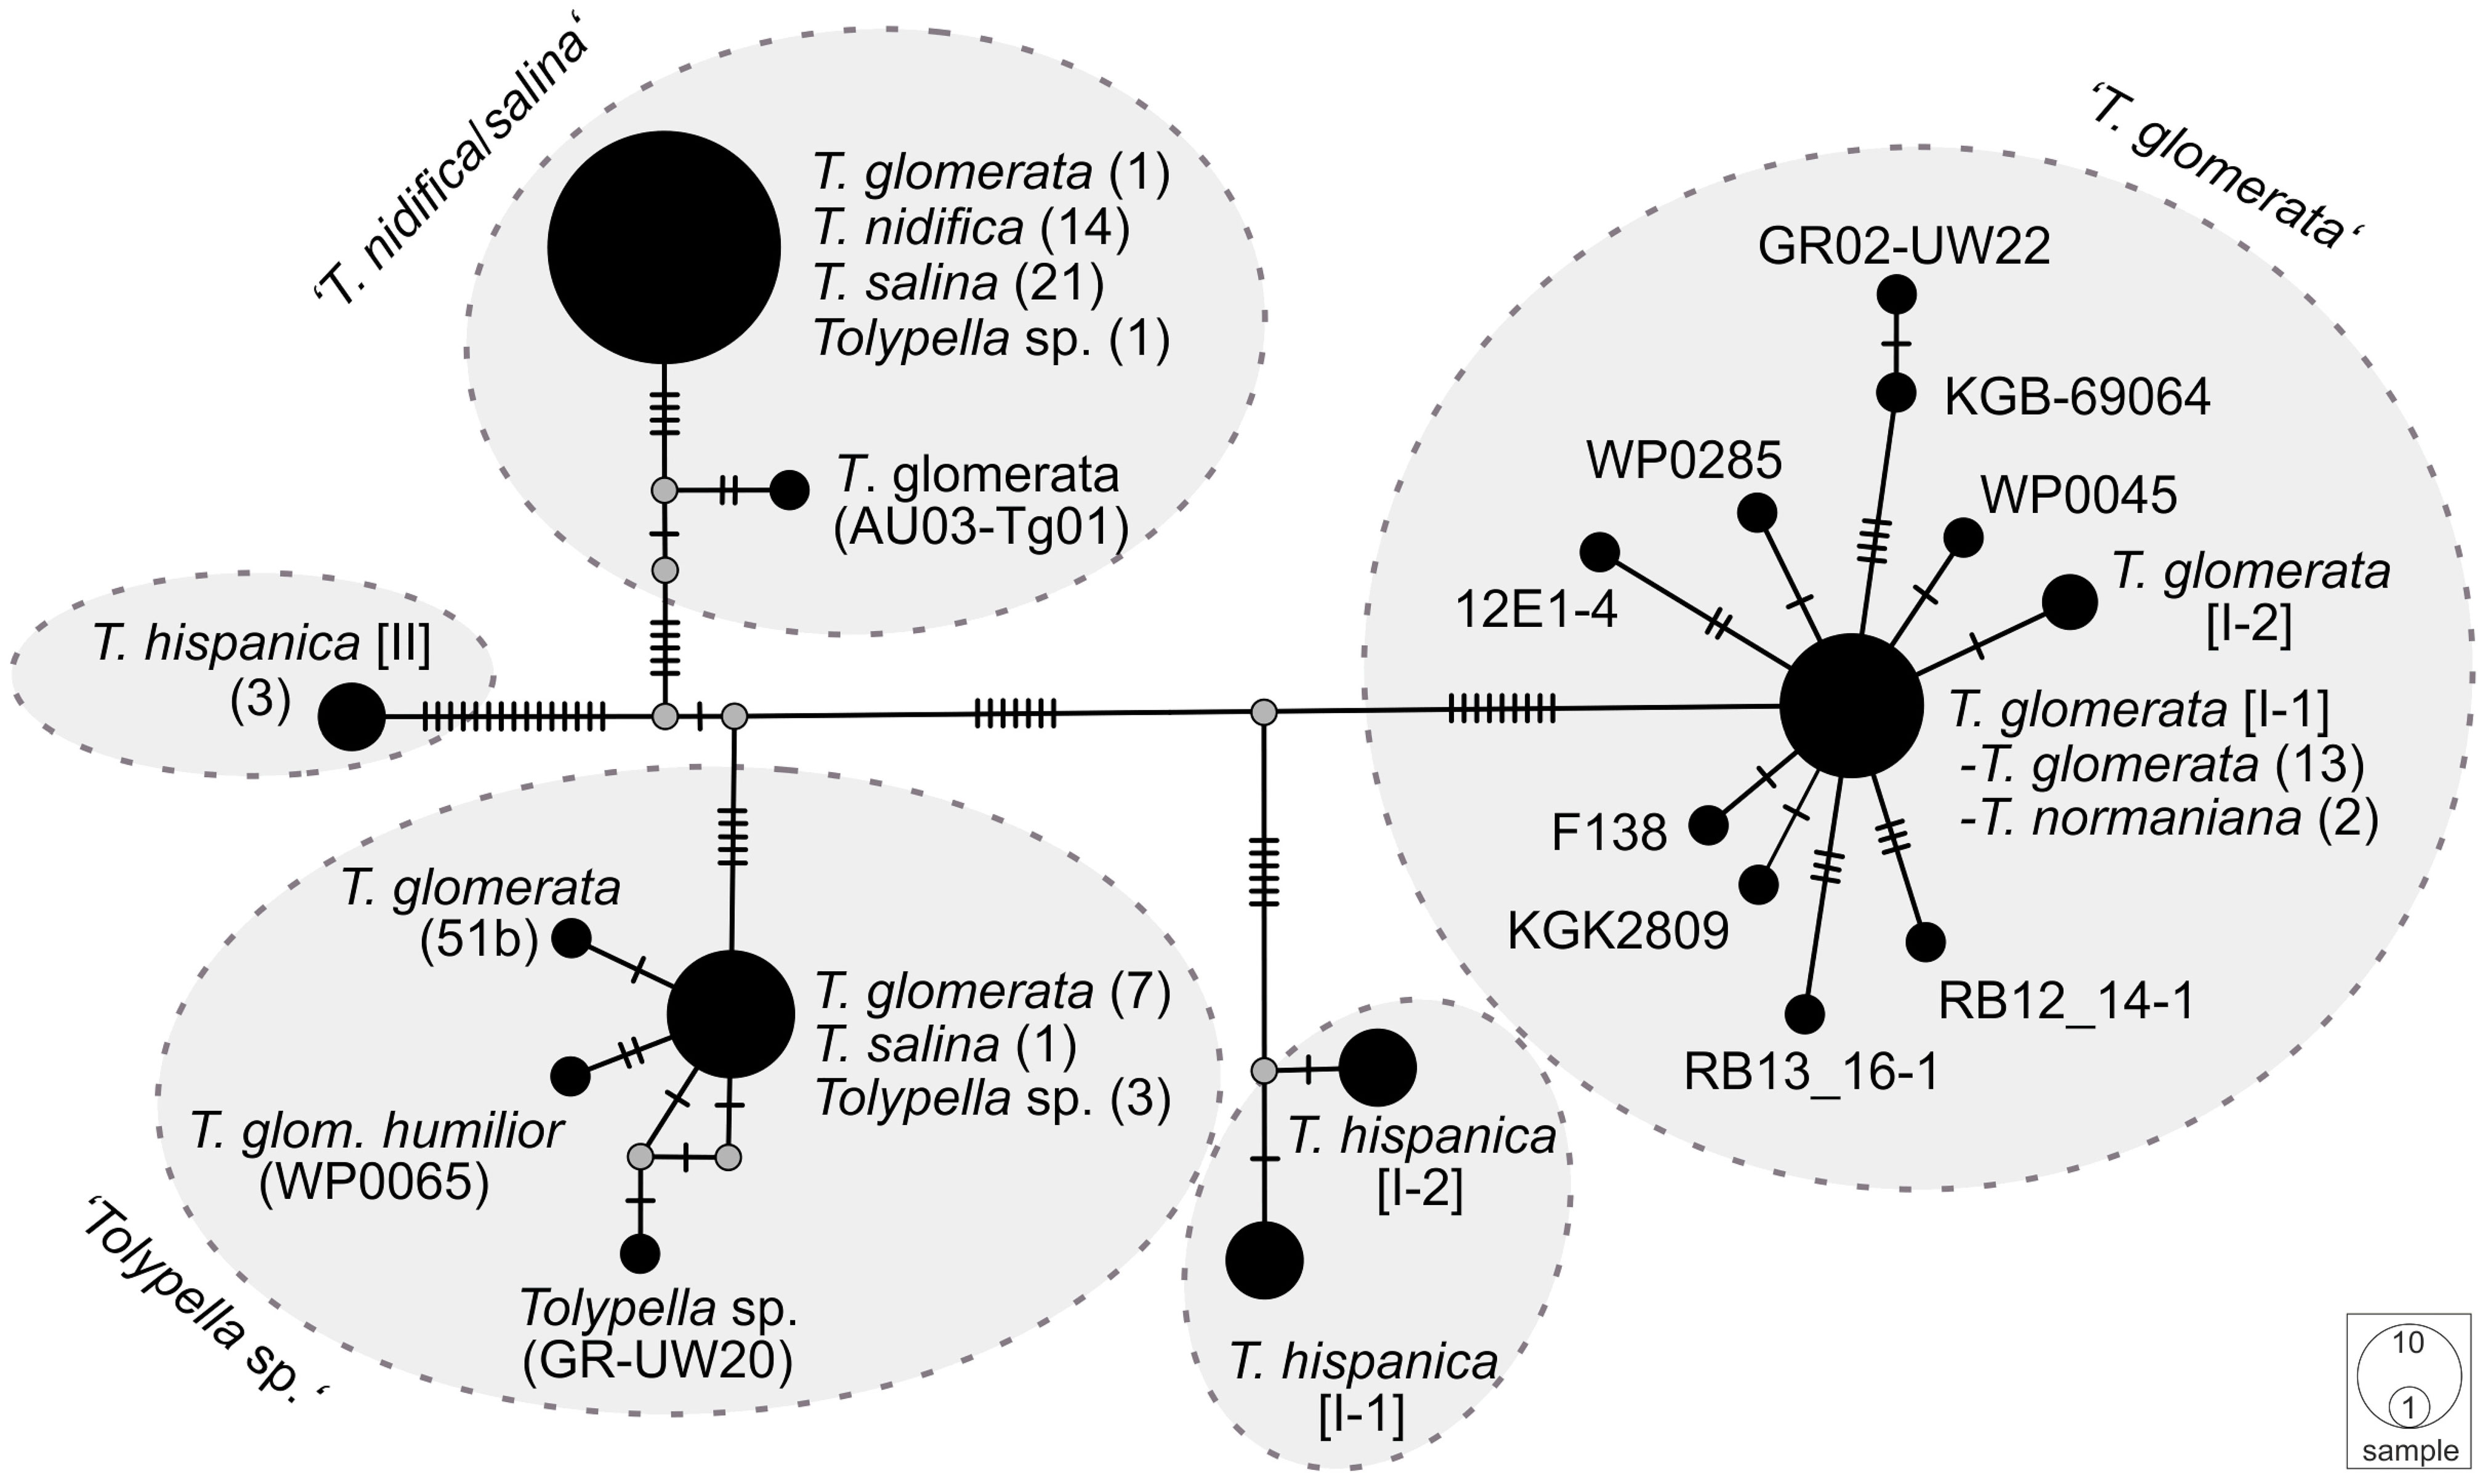
Figure 2 A Median Joining network of concatenated atpB, psbC, and rbcL sequences of sec. Tolypella. Circles represent haplotypes, with the size being proportional to their relative frequencies. The smallest circle corresponds to a single haplotype copy. A small black line at branches indicates one inferred mutational step. The small grey dot is a median vector and represents a possible extant unsampled haplotype or an extinct ancestral haplotype.
‘T. glomerata’
A first group comprising mostly T. glomerata contained 49 individuals that represented T. glomerata (39 specimens), T. normaniana (7 specimens), and T. sp. (1 specimen). Specimens originated from nine European countries (France, Germany, Great Britain, Greece, Ireland, Italy, Netherlands, Norway, Sweden), and from the United States, Canada, and Chile. The analysis of concatenated sequences of ‘T. glomerata’ identified a difference of ≥ 18 nucleotides with respect to other clusters of sect. Tolypella (Table 1). With an average of about 3.85 bp substitutions, the genetic variability within the group was relatively high compared to the intragroup variability shown by the other taxa. However, differences in their sequence data were not regionally correlated; European and North American specimens showed identical sequences. In contrast, 8 substitutions were observed between samples collected in Greece (GR02-UW22) and Italy (RB13_16-1 and RB12_14-1).
‘T. nidifica/salina’
A second cluster (labelled ‘T. nidifica/salina’) consisted of 110 individuals which have traditionally been assigned mainly to the taxa T. nidifica (44 specimens) and T. salina (50 specimens). Additionally, two T. normaniana, and 14 morphologically ambiguous T. sp. were found in this cluster (Table S4). They were collected in Austria, France, Germany, Greece, Italy, Norway and Sweden. Interestingly, the specimen originally determined as T. glomerata f. littorea from France (KGK4867) and two of nine sequenced T. normaniana (T70/T71) clustered within T. nidifica/salina. Sequence data for each of the atpB, psbC and rbcL genes could not be obtained for every specimen in this cluster. rbcL sequence data was obtained from 188 specimens, whereas sequences for atpB and psbC were obtained from 38 specimens (Table S4). Overall, however, there was little genetic variation within the ‘T. nidifica/salina’ cluster when comparing each of the gene sequences. Depending on the dataset, between 95.2 and 97.6% of the analysed specimens had identical sequences. Minor genetic differences were observed in this group; two T. sp. collected from Italy (rbcL, Figure S1), and a T. normaniana from Norway (psbC, Figure S3) differed by a single nucleotide substitution each. Regional differences were not reflected in the sequence data with identical haplotypes throughout Europe. Consistent nucleotide differences were found only among two T. sp. collected in Austria (AU03-Tg01, AU03-Tg03).
‘Tolypella sp.’
A third cluster (labelled ‘Tolypella sp.’) consisted of 21 individuals which have been classified as morphologically ambiguous specimens due to the presence of vegetative characters of more than one Tolypella taxon mentioned above. The specimens were partly originally determined as T. glomerata f. humilor. They were collected in Denmark, France, Germany, Great Britain, Greece, Italy, Norway, Portugal, and Sweden. ‘Tolypella sp.’ revealed unique sequence data and differed from ‘T. nidifica/salina’ and ‘T. glomerata’ by averaging 19.4 and 27.9 bp substitutions respectively (Table 1). Nucleotide differences within ‘Tolypella sp.’ ranged from 0 to 4 bp substitutions for concatenated sequences (mean 0.06%, Table 1; Figure 2).
‘T. hispanica’
Two clusters labelled as ‘T. hispanica I’ and ‘T. hispanica II’ consisted of ten and five individuals, respectively, which have traditionally been assigned to the dioecious T. hispanica. ‘T. hispanica I’ included ten individuals collected in France, Greece, Italy, and Algeria. The samples collected in France had two unique nucleotide substitutions for the combined sequences (0.06%, Table 1). ‘T. hispanica I’ formed a strongly supported clade together with ‘T. glomerata’ (Figure 1). ‘T. hispanica II’ contained five individuals from four field collections in Italy, Sardinia that shared identical rbcL sequences whereas three individuals had identical sequences for all three genes (Table 1). In the ML analysis, however, ‘T. hispanica I’ was sister to ‘Tolypella sp.’ in a weakly supported relationship (Figure 1).
3.2. Oospore analyses
Differences in quantitative and qualitative oospore characters were considered with respect to taxa determined by either vegetative morphology or genetically determined cluster. The results of oospores grouped in taxa determined by vegetative morphology are summarized in Table 2.
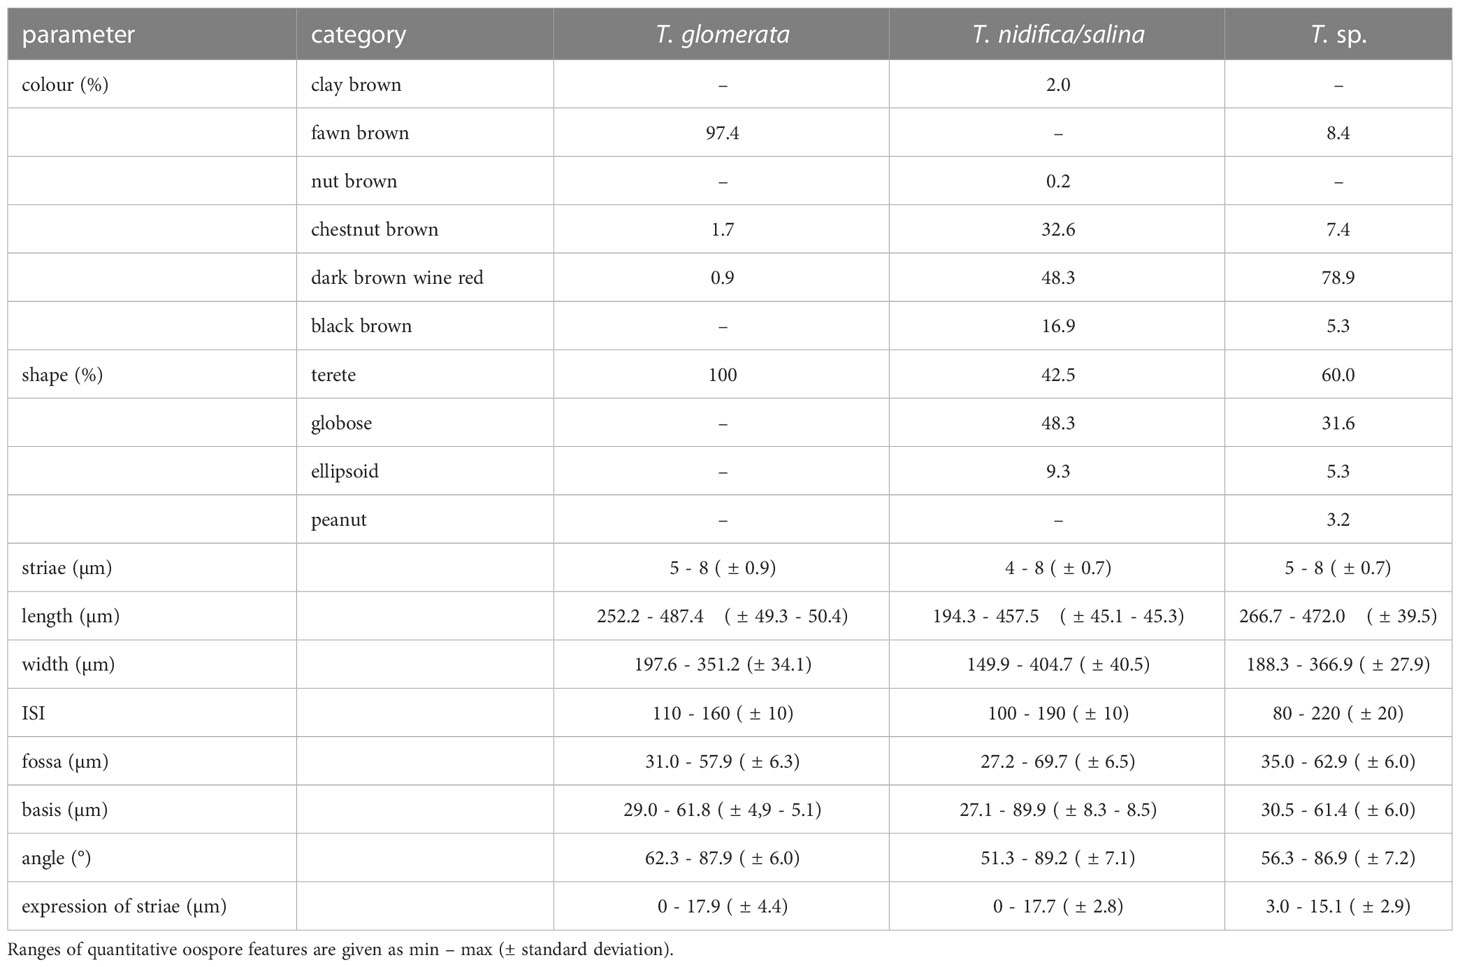
Table 2 Oospore characteristics of T. glomerata, T. nidifica/salina and the morphologically unconclusive T. sp.
T. glomerata
Oospores analysed in this study were usually fawn brown (97.4%), occasionally chestnut brown (1.7%) or dark brown wine red (0.9%), with an elongated rounded shape with 7-8 striae. The expression of striae is flat to prominent (0.0–17.9µm). Oospores showed lengths of 252.2 to 487.4 µm ( ± 49.8-50µm), widths from 197.6 to 351.2 µm ( ± 33.5-34.1µm), a mean fossa width of 31.0 to 57.9 µm, mean lengths of the outer basal impression from 29.0 to 61.8 µm and an ISI of 110–160. All oospores exhibited a reticulate ornamentation in varying expression and size (Figure 3; Table S2).
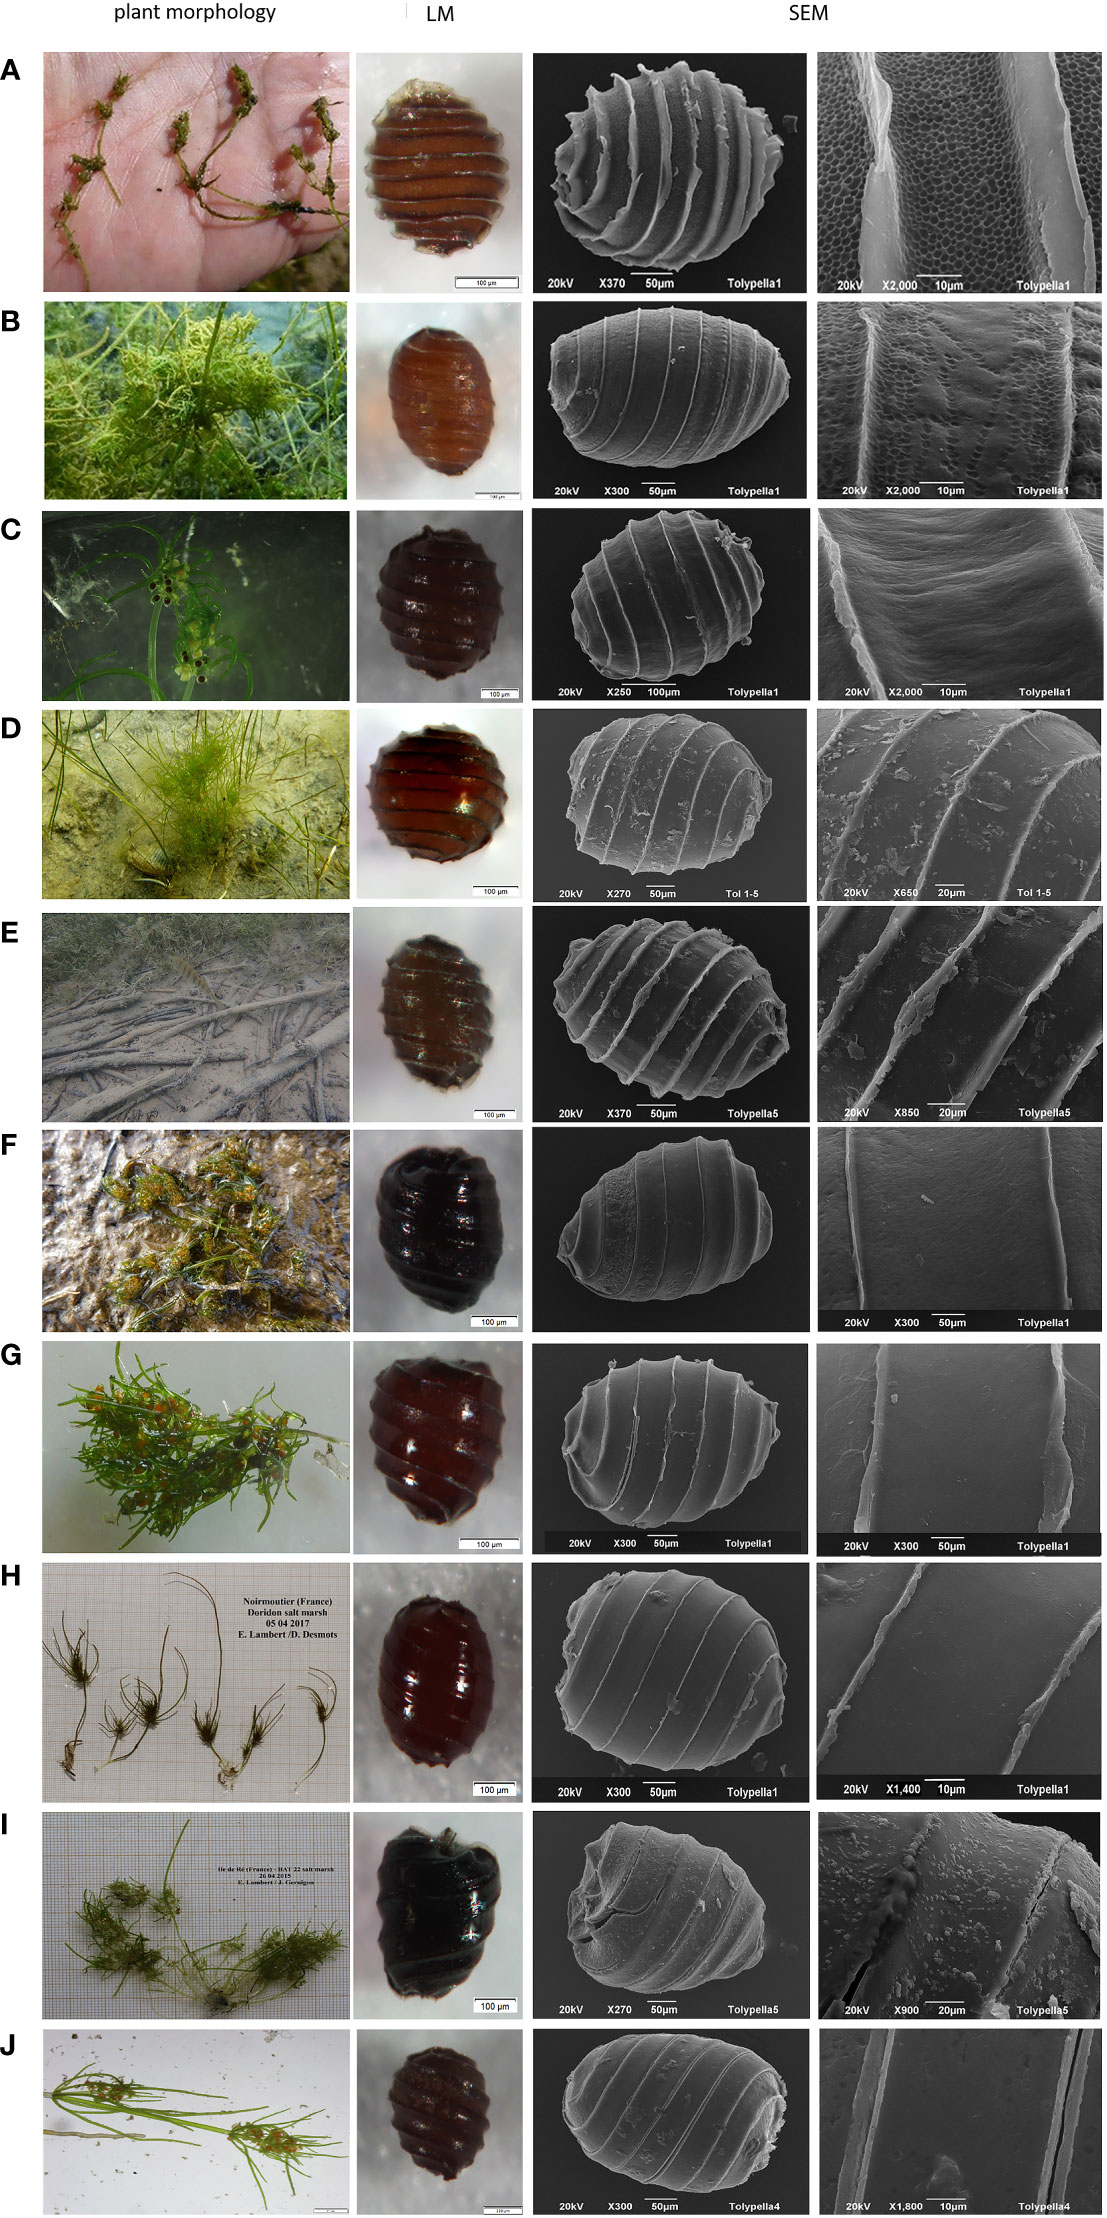
Figure 3 Habitus, LM and SEM of ‘T. glomerata’, ‘T. nidifica’, ‘T. salina’ and ‘T. sp’. 3A - Habitus, LM and SEM of ‘T. glomerata’ and ‘T. nidifica’. (A)-’T. glomerata’ RB13_16 (Italy, Cabras) with fully reticulate ornamentation pattern, (B)-’T. glomerata’ BS-Tol (Germany, Borkener See) with partially reticulate ornamentation of oospores. (C)-’T. nidifica’ TN3-1 (Germany, Fehmarn), (D)-’T. nidifica’ Tol04 (Germany, Lehmkenhafen), (E)-’T. nidifica’ Tol7 (Austria, Apetlon Badesee), 3B - Habitus, LM and SEM of ‘T. nidifica’, ‘T. salina’ and ‘T. sp’. (F)-’T. nidifica’ RB18_12 (Italy, Pittulongu). (G)-’T. salina’ RB18-01 (Italy, Pittulongu), (H)-’T. salina’ FR-EL/Sal1-07 (France, Île de Noirmoutiers), (I)-’T.salina’ FR-TS 687-01 (France, Île de Ré). (J)-’T. sp.’ FR-F02 (France, Kermadec).
T. nidifica/salina
Oospores of T. nidifica/salina were mainly dark brown wine red (48.3%), chestnut brown (32.6%) or black brown (16.7%) with a terete or broad rounded/globose shape and a flattened base. Oospores showed (4-)5-7(- 8) striae that were flat and prominent (0.0–17.7 µm), oospore lengths of 194.3–457.5 µm ( ± 45.2µm), oospore widths of 149.9–404.7 µm ( ± 40.4µm), mean fossa width of 27.2–69.7 µm and an outer mean basal impression length of 27.1 to 89.9 µm. The calculated ISIs ranges between 100 and 190. Ornamentation patterns of T. nidifica/salina were highly variable, from smooth to smooth with some pustules or with fine linear structures (Figure 3; Table S2).
Tolypella sp.
The oospores of the morphologically ambiguous specimens were dark brown wine red (78.9%), occasionally fawn brown (8.4%), chestnut brown (7.4%) or black brown (5.3%) with a broad range of shape variations (ellipsoid, elongate rounded, broad rounded/globose, or peanut- shaped). Oospores showed (5) 6–7 (-8) striae with widths between 3.0–11.2 µm, oospore lengths of 266.7–472.0 µm ( ± 38.7µm) and widths between 195.6–346.7 µm ( ± 27.9 µm). Fossae ranged from 37.2 µm to 62.2 µm and outer basal impression lengths from 33.1 up to 57.9 µm. Calculated ISIs ranges from 80 to 190 (-220). The membrane of T. sp. Oospores was smooth to smooth with some pustules or with fine linear structures (Figure 3; Table S2).
The analysis of taxon-related oospore characteristics shows that variations, especially with regard to the features colour, shape and length exist within each taxon (Figure 3; Tables 2, S2). Especially for T. glomerata, large discrepancies between oospores along a geographical gradient and between populations could be observed (Figure 4). The PCA shows that the two axes explain 64.8% of the cumulative variation of oospores (eigenvalue 1 = 6.72, eigenvalue 2 = 3; Table S5). The first component is determined by the characters length and width and the ratios of length/angle and width/angle, whereas the second component is defined by the striae and width/fossa ratio. Depending on the level of analysis, significant intraspecific differences between countries, regions, type of locations and plants can be detected. Oospores from Germany (length: 335µm – 487µm, width: 255µm – 351µm) and Austria (length: 378µm – 438µm, width: 241µm – 313µm) were significantly larger and wider than those from Greece (length: 294µm – 326µm, width: 197µm – 221µm; p ≤.001) and Italy (length: 252µm – 362µm, width: 203-µm – 274µm; p ≤.001). No significant differences could be detected between oospores from Germany and Austria or between those from Italy and Greece.
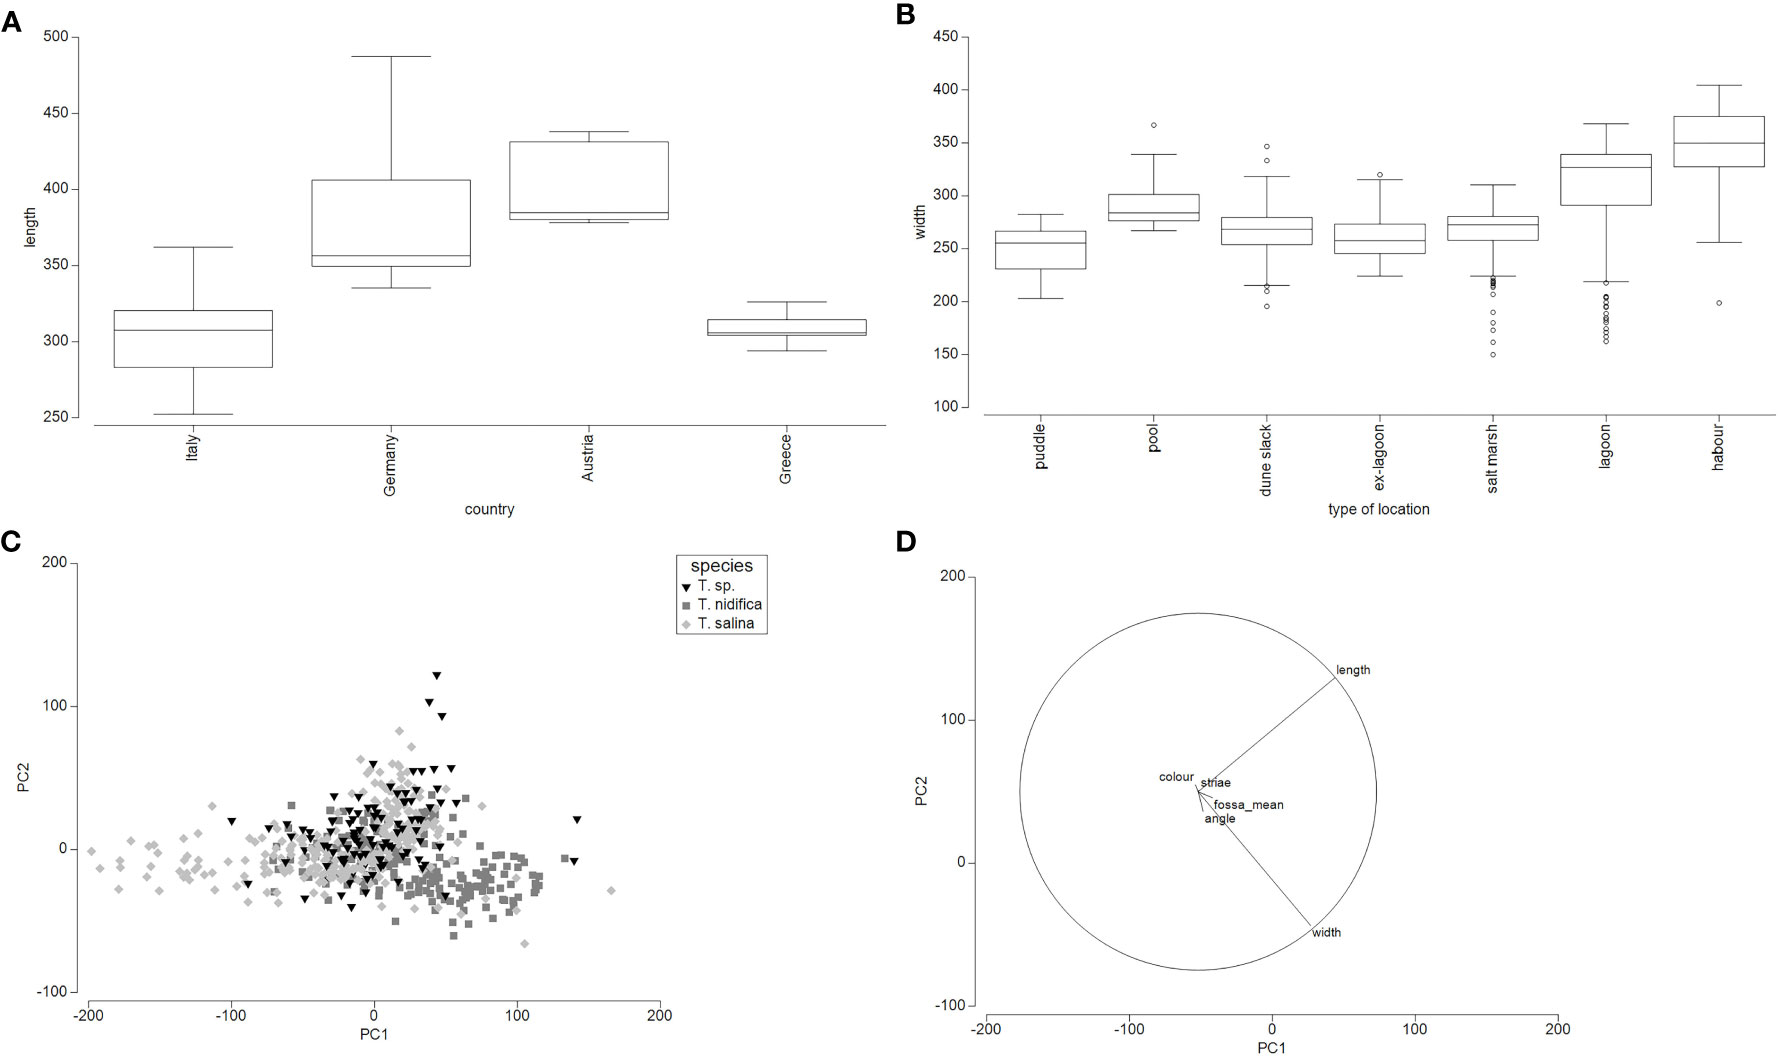
Figure 4 Analyses of oospore features. (A)- Box-Plot of oospore length in µm of T. glomerata depending on the country. (B)- Box-Plot of oospore widths (µm) of locally separated T. glomerata populations. (C) - PCA of vegetative determined T. nidifica, T. salina and T. sp. Oospores depending on the country. Included were 565 oospores from Germany, France and Italy. (D) – Oopsore characters of the PCA of vegetative determined T. nidifica, T. salina and T. sp.
Given the vegetative determination in T. nidifica, T. salina and T. sp., significant differences could be obtained for the oospore characters shape (p ≤.006), length (p ≤.005), fossa (p ≤.005) and width (p ≤.005) between T. nidifica and T. salina. Tolypella sp. could be separated from T. nidifica by the width, fossa (p ≤.006) or shape (p ≤.017) whereas T. sp. could be differentiated by oospore length (p ≤.005) and shape (p ≤.006) from T. salina although overlapping areas exist. However, these differences can only be obtained by means of statistical tests. Multiplot Analysis (Figure S4) on the other hand show the overlapping areas, which were partly caused by single plants or individual oospores. Due to the lack of statistical power, they should be seen only as trend.
Interestingly, depending on the type of location, oospores of permanent water bodies (lagoons, harbours and lakes) and pools are wider than oospores from temporary water bodies (Figure 4).
4. Discussion
The results of genetic analyses for European T. glomerata and T. salina/nidifica specimens can be confirmed only partly by oospore analyses. However, few examples showed that identified genetic differences could be confirmed by oospore features, especially wall ornamentation pattern. The results are only partially consistent with the current phenetic taxonomic concept (Groves and Bullock-Webster, 1920; Corillion, 1975; Krause, 1997; Cirujano et al., 2008; Mouronval et al., 2015). Both analyses can confirm differences of unambiguous Tolypella specimens to T. glomerata and T. nidifica/salina. Based on genetic analyses they are located within the ‘Tolypella sp.’ Cluster, whereas oospore analyses revealed significant differences in e.g., length and width. In contrast to the sequence data, significant differences could be detected between oospore lengths and widths of T. nidifica and T. salina. But these are mainly caused by local separations. However, Italian T. nidifica did not differ from French T. salina or Italian/French T. sp. This is in strong accordance with the results of sequence data. Differences in oospore ornamentation patterns were not reflected by sequence data of plastid genes (Table S2).
Tolypella hispanica is the only dioecious taxon in the section Tolypella and, by including sexuality as a taxonomically relevant parameter at species level, easily distinguished from all other European taxa. Several studies demonstrated that sex separation occurred independently in various groups of the Characeae (Proctor, 1980; Meiers et al., 1999; Pérez et al., 2016). Phylogenetic data of this study revealed that this taxon consists of two well-separated lineages, representing two cryptic taxa. One lineage (‘T. hispanica I’), in agreement with the results of Pérez et al. (2016), was related to T. glomerata. The second lineage (‘T. hispanica II’), identified for the first time in this study, was located very distant from ‘T. hispanica I’ and nearer to the cluster of ‘Tolypella sp.’ and ‘T. nidifica/salina’. The results of our analyses revealed the existence of two cryptic taxa, being united within the recent taxon T. hispanica. The existence of cryptic taxa is very common for about half of all marine eukaryotic organisms such as Rhodophyta (Payo et al., 2013), Chlorophyta (Cimino and Delwiche, 2002; Irisarri et al., 2021) or Phaeophyceae (Poong et al., 2013). In order to get a robust description of morphological characters for discrimination between the two dioecious taxa, detailed morphological and molecular analysis of a larger number of samples, including type specimens, are needed to resolve their taxonomic status. The herbarium material of T. hispanica did not exhibit fully mature oospores which could be included in this study. The use of unmature material is not reliable for such studies due to developmental differences of colour or ornamentation pattern, as it was shown for Nitella taxa by Casanova (1991).
Although wetland conservation is extremely important especially for Mediterranean islands such as Sardinia, Charophytes are not included in Sardinian conservation programmes so far. Becker (2019) highlighted the presence of 26 different charophyte taxa in Sardinia with respect to their habitat preference. Moreover, he suggested four different action plans for (I) Characeae of lagoons, temporary brackish pools, salt marshes and estuaries, (II) Nitella of temporary freshwater ponds and estuaries, (III) Chara connivens in temporary ponds and lakes and (IV) Chara of running waters in calcareous regions and water reservoirs to counteract the loss of taxa and habitats, including the new cryptic taxon belonging to T. hispanica II lineage.
Based on genetic analyses, we were unable to verify the rank of the morphologically determined T. normaniana (Langangen, 1994). Seven of nine specimens clustered within the T. glomerata cluster. One of the specimens from Nordland was sampled in 1870 and is genetically identified as dwarfed variant of T. glomerata. From the same region, a T. normaniana collected in 2005 (T69) is also genetically identified as T. glomerata. This indicates that T. glomerata, although not described from Norway yet, has occurred in this northern locality since at least 150 years (Langangen, 2021). Unfortunately, the available herbarium specimens do not have mature oospores, so that determination of wall ornamentation was not possible. Urbaniak et al. (2012) describes two types of ornamentation pattern with transitional forms, smooth and pitted, and concluded a strong relationship between T. nidifica and T. normaniana. In further studies, dwarf forms that morphological resemble T. normaniana should be analysed for oospore wall ornamentation, in order to assign to either T. glomerata or T. nidifica/salina.
For T. glomerata, a broad morphological variability within European specimens, comparable to the results published by Pérez et al. (2014) for North American specimens, was observed in this study. The shape of the whorls ranged from very compressed with short or long sterile branchlets to whorls which rather appear looser with long sterile branchlets (spike-like). This broad morphological variability is also reflected by oospore characters, exhibiting large regional differences (Figure 3). On the other hand, only small differences among gene sequences of European T. glomerata and those from North and South America could be detected (Figure 2). The results of this study show that even with a broader sampling range the ‘T. glomerata’ cluster remains stable. For North American specimens, Pérez et al. (2015) found a reticulate oospore ornamentation for T. glomerata, the most useful character for the distinction between T. porteri and T. glomerata. Antheridia size, on the other hand, seems not to be a suitable character for discrimination between T. glomerata and T. nidifica/salina. For example, eight individuals should be identified as T. glomerata using antherida sizes but were genetically determined as T. nidifica/salina. Although for T. glomerata smaller antheridia sizes in diameter (220–450µm) (Corillion, 1960; Krause, 1997) are reported than for T. salina (450–625µm (–1000µm) (Corillion, 1960; Krause, 1997; Cirujano et al., 2008; Lambert et al., 2013) and T. nidifica (450–550µm; (Krause, 1997; Urbaniak, 2003). This character is often used for discrimination between T. glomerata and T. nidifica in the field, but seems to be influenced by environmental conditions as reflected by a North-South gradient, resulting in a broad and overlapping size range for these taxa. Moreover, gametangial studies on C. hispida and C. aspera have shown that antheridia sizes depend on the whorl position (Calero and Rodrigo, 2022). Clear and unambiguous distinction between T. salina and T. nidifica could not be achieved by this study neither by means of genetic data nor by oospore morphology and ornamentation. The comparison of French and Italian T. salina (Lambert et al., 2013; Becker, 2019) with those of the Iberian Peninsula (Cirujano et al., 2008; Cirujano Bracamonte et al., 2013) depicts a large morphological variability, probably caused by environmental conditions. A correlation between habitat salinity and phenotypic plasticity/fructification has already been published for several halophytic charophytes (e.g., Winter and Kirst, 1991; Bonis et al., 1993).
Both T. salina phenotypes, (1) smaller plants with fewer and shorter fertile branchlets (Cirujano et al., 2008) and (2) bigger ones with a higher number and longer fertile branchlets and internodes (Lambert et al., 2013), have been identified in this study for France as well as Italy (Figure 3). Those interannual morphological variability is caused by environmental variability and well known for Characeae.
A similar large morphological variability appeared within T. nidifica. Specimens with very compact and compressed whorls, long branchlets and long internodes, as well as specimens with less compact and compressed whorls and shorter branchlets were observed (Figure 3). The same applies for oospore morphometry, also exhibiting large variability without being reflected by genetic differences of the standard marker genes investigated here.
Morphometric oospore characters exhibited site-specific and location-specific differences, but did not allow for discrimination between the two taxa. As for vegetative characters, the reason for this observed large variability might be habitat conditions such as (soil) salinity. Oospores from puddles could be clearly differentiated from higher saline locations such as salt marshes, lagoons or harbours. The Italian sites exhibited a salinity between 1.2 and 21.6g/L (Becker, 2019), the salinities of the French salt marshes ranged from 2.2 to up to 250g/L (Lambert et al., 2013). Large seasonal changes can be observed over the year and are mainly caused by drought and re-wetting of temporal ponds or puddles. In contrast, the salinity of the German location Lehmkenhafen (2020) shows lesser fluctuation with a salinity around 12.
T. salina was described by Corillion (1960) who distinguishes it from T. nidifica as the lower number of striae of the oospore (mostly 6 vs. 8) and smaller oospores (length 273–366 µm vs. 400–475 µm; width 258–312 µm vs. 350–450 µm). These differences could not be corroborated by us (Table 2).
Until now, besides the number of chromosomes (50 for T. salina and 20-42 for T. nidifica, (Corillion, 1960; Guerlesquin, 1967), the membrane ornamentation was found in this study as the most reliable character, although no clear distinction is possible. Whereas the oospores of T. salina showed a smooth ornamentation, excepting a few specimens with only few pustules, which is only partially in accordance with different authors (Corillion, 1960; Urbaniak et al., 2012), the membrane of T. nidifica exhibited in most cases pustules or linear structures, while only few specimens revealed smooth oospores. However, the number of oospores available for examination was rather low and, moreover, this result partly contradicts existing literature. Nordstedt (1889) described the oospore membrane of T. nidifica as smooth, Wood (1965); Ray et al. (2001) and Urbaniak et al. (2012) found a pit-like ornamentation for T. nidifica which ‘varied among populations’ and Corillion (1975) described both expressions. The results of this study also showed transitions between both ornamentation types which should be investigated in more detail as well as in correlation to the maturity status of oospores which was shown by Casanova (1991) for Nitella oospores.
In addition to overlapping morphological plant features, determinations may be hampered by the existence of intermediary forms between T. glomerata and T. nidifica as described for the French population from Herault (Hy, 1913; Corillion, 1957). So as for the vegetative characters, habitat-specific effects on oospore ornamentation needs to be investigated in more detail by physiological experiments before a definite conclusion about the reliability of ornamentation pattern for delineation can be made. However, a distinct genetic entity, until now represented just by one specimen, was detected. This specimen originated from a brackish lake near Apetlon in Austria/Burgenland (AU03-Tg01) and is the first record of T. nidifica/salina for Austria and should be investigated in more detail.
Consequently, a final conclusion about the taxonomic status of T. nidifica/salina cannot be made irrespective of the observed differences in ornamentation pattern. With respect to lacking genetic differences, Pérez et al. (2016) have shown that analyses based on ribosomal gene sequences support chloroplast data but are not reliable for discrimination between uncertain taxa.
Nevertheless, both analyses could be considered as appropriate, and imply possibilities for further investigations of the status of these European taxa such as analyses of geographically isolated Tolypella populations on the basis of Simple Sequence repeats as microsatellite studies have shown for the genus Chara (Schaible et al., 2009; Schaible et al., 2011; Noedoost et al., 2015). High-throughput sequencing techniques or multi-omic approaches including proteomics could be carried out to examine smallest genetic differences between populations as shown for Nitellopsis obtusa (Sleith and Karol, 2021).
5. Conclusions
This study showed that the combination of oospore morphology and sequence data are only partially consistent. Sequence data confirmed the taxonomic status of T. glomerata and T. hispanica. Besides this, a second dioecious T. hispanica lineage can be found.
Moreover, although T. nidifica and T. salina could not be separated by sequence data (`T. nidifica/salina´) and transitions in oospore ornamentation exist, this study reveals significant differences in oospore length and widths that are mainly caused by local differences. These results indicate that environmental factors affect oospore morphology. The rank of T. normaniana could not be confirmed by genetic results. Those individuals clustered within `T. glomerata´and `T. nidifica/salina´. Furthermore, the sequence data revealed a new genetic entity, currently named as T. sp. A final decision about the taxonomic status of T. nidifica/salina and T. sp. could not be done on the basis of these results. Nevertheless, all analyses could be considered useful, and imply possibilities for further investigations of the status of these European taxa.
Data availability statement
The datasets presented in this study can be found in online repositories. The names of the repository/repositories and accession number(s) can be found in the article/Supplementary material.
Author contributions
Conceptualization - AH; PN methodology – AH, AB, SS, TG, PN, KK, WP and VW; analysis/investigation: AH, AB, SS, TG, PN, KK, WP, VW, EL, UR, RB, JG and KvdW; resources – RB, EL, UR, NS, KvdW, and HS; original draft preparation - AH; review and editing – all authors, visualization - AH and PN. All authors contributed to the article and approved the submitted version.
Funding
Part of the work (author AH) was funded by the Förderverein Feldberg-Uckermärkische Seenlandschaft e.V. (E+E Projekt Chara- Seen) and by the framework of the Professorinnenprogramm II (University Rostock) of the German federal and state governments. We acknowledge Open Access Publication funding by Deutsche Forschungsgemeinschaft and Universität Rostock - 512855535.
Acknowledgments
The authors are thankful for the constructive suggestions of the two reviewer, Maria A. Rodrigo and Hidetoshi Sakayama, and the handling editor S. Pasta. The authors want to thank Peter Gisch from the Biological Station Neusiedler See for the provision of physico-chemical data. They are also grateful to Didier Desmots from the National Natural Reserve of the Müllembourg salt marshes, Isle of Noirmoutier, Barbara Tuner and Karl-Georg Bernhardt for collecting specimens and environmental data. Moreover, the authors are thankful to Claudia Lott (University of Rostock) for preparing genetic analyses in Rostock and Arne Schoor for laboratory and technical assistance. The laboratory equipment was partly supported by the European Fund for Regional Development (EFRD).
Conflict of interest
Author KvdW is employed by lanaplan GbR.
The remaining authors declare that the research was conducted in the absence of any commercial or financial relationships that could be construed as a potential conflict of interest.
Publisher’s note
All claims expressed in this article are solely those of the authors and do not necessarily represent those of their affiliated organizations, or those of the publisher, the editors and the reviewers. Any product that may be evaluated in this article, or claim that may be made by its manufacturer, is not guaranteed or endorsed by the publisher.
Supplementary material
The Supplementary Material for this article can be found online at: https://www.frontiersin.org/articles/10.3389/fpls.2023.1096181/full#supplementary-material
Supplementary Figure 1 | Phylogeny of Characeae based on rbcL sequence data. (A) Median Joining network of rbcL sequences of Tolypella. (B) Maximum likelihood tree of genus Tolypella based on rbcL sequence data with bootstrap values and posterior probabilities above branches (≥ 50%).
Supplementary Figure 2 | Phylogeny of Characeae based on atpB sequence data. (A) Median Joining network of atpB sequences of Tolypella. (B) Maximum likelihood tree of genus Tolypella based on atpB sequence data with bootstrap values and posterior probabilities above branches (≥ 50%).
Supplementary Figure 3 | Phylogeny of Characeae based on psbC sequence data. (A) Median Joining network of psbC sequences of Tolypella. (B) Maximum likelihood tree of genus Tolypella based on psbC sequence data with bootstrap values and posterior probabilities above branches (≥ 50%).
Supplementary Figure 4 | Multiplot Analysis of T. glomerata, T. nidifica, T. salina and T. sp. Qualitative parameter are measured in µm.
Supplementary Table 1 | List of the 195 Tolypella samples used for oospores and genetic analyses in the present study. The columns “oospore ornamentation” and “Genetics” columns indicate the results of oospore ornamental analysis as well as the DNA sequencing results. Detailed information is given in Table S2 (oospore analyses) and S4 (genetic analyses). The last columns show the accession numbers, with n.n. in case the genetic marker was not recovered. (Tglo=T. glomerata, Tni=T. nidifica, Tsal=T. salina, Tn/s=T. nidifica/salina, Thi=T. hispanica, Tsp=T. sp.). A - Nowak and Schubert, 2019, B -Pérez et al., 2014, C - Mccourt et al., 1999, D - Pérez et al., 2016; storage: 1 - Herbarium University Rostock, 2 New York Botanical Garden Steere herbarium, 3 - Vascular Plant Herbarium, National History Museum Oslo, 4 - Herbarium Vienna, 5 - Friener Herbarium, Butler University, 6 - United States National Herbarium) (Excel Data Sheet).
Supplementary Table 2 | List of oospores used for SEM and REM analyses including oospore morphology and ornamentation and the irrespective genetic cluster. Kind of material: F - fresh plant material, H - herbarium specimen, S - sediment sample, G - germination experiment (Excel Data Sheet).
Supplementary Table 3 | Oligonucleotide primers used in this study. “Method” refers to the method used for DNA-sequencing described in genetic analysis subsection in Materials and Methods (Excel Data Sheet).
Supplementary Table 4 | List of 195 Tolypella specimens used for genetic analyses in the present study. The first column indicates the genetic identification of the sample, while the second column contains the morphological determination according to the plant characteristics. “Method” refers to the method used for DNA-sequencing described in genetic analysis subsection in Materials and Methods. The last four colums display the genetic cluster observed by analysing single gene sequence data and a combined data set. Cluster names correspond to Figure S1 (rbcL), Figure S2 (atpB) and Figure S3 (psbC), and , (atpB + rbcL + psbC).
Supplementary Table 5 | List of eigenvalues and eigenvectors resulted from the principal component analysis of all Tolypella samples including absolute oospore values and their ratios.
References
Allen, T. F. (1883). Notes on the American species of Tolypella. Bull. Torrey Bot. Club 10, 109–117. doi: 10.2307/2476610
Bandelt, H.-J., Forster, P., Röhl, A. (1999). Median-joining networks for inferring intraspecific phylogenies. Mol. Biol. Evol. 16, 37–48. doi: 10.1093/oxfordjournals.molbev.a026036
Becker, R. (2019). The Characeae (Charales, Charophyceae) of Sardinia (Italy): Habitats, distribution and conservation. Webbia 74, 83–101. doi: 10.1080/00837792.2019.1607497
Bickford, D., Lohman, D. J., Sodhi, N. S., Ng, P. K., Meier, R., Winker, K., et al. (2007). Cryptic species as a window on diversity and conservation. Trends Ecol. Evol. 22, 148–155. doi: 10.1016/j.tree.2006.11.004
Bonis, A., Grillas, P., Van Wijck, C., Lepart, J. (1993). The effect of salinity on the reproduction of coastal submerged macrophytes in experimental communities. Veg Sci. 4, 461–468. doi: 10.2307/3236073
Calero, S., Rodrigo, M. A. (2022). A quantitative method to analyse the sexual development of charophytes (Charophyceae): A baseline for phenological studies. Phycologia 61, 354–362. doi: 10.1080/00318884.2022.2047489
Casanova, M. T. (1991). An SEM study of developmental variation in oospore wall ornamentation of three Nitella species (Charophyta) in Australia. Phycologia 30, 237–242. doi: 10.2216/i0031-8884-30-3-237.1
Cimino, M. T., Delwiche, C. F. (2002). Molecular and morphological data identify a cryptic species complex in endophytic members of the genus Coleochaete Bréb. (Charophyta: Coleochaetaceae). J. Phycol. 38, 1213–1221. doi: 10.1046/j.1529-8817.2002.02067.x
Cirujano, S., Chambra, J., Sánchez Castillo, P. M., Meco, A., Flor Arnau, N. (2008). “Flora ibérica algas continentales,” in Carófitos (Characeae) (Madrid, Real Jardín Botánico: CSIC).
Cirujano Bracamonte, S., Guerrero Maldonado, N., García Murillo, P. (2013). The genus Tolypella a Braun a Braun in the Iberian peninsula. Acta Bot. Gall 160, 121–129. doi: 10.1080/12538078.2013.801321
Clarke, K. R., Gorley, R. N. (2015). Getting started with PRIMER v7 (PRIMER-E Ltd). Available at: http://updates.primer-e.com/primer7/manuals/Getting_started_with_PRIMER_7.pdf.
Corillion, R. (1957). Les Charophycees de France et d' Europe occidentale. Bull. Soc Sci. Bretagne 32, 499.
Corillion, R. (1960). Tolypella salina sp. nov., chlorophycée nouvelle des marais de Croix-de-Vie (Vendée). Rev. Algologique n.s. 5, 198–207.
Corillion, R. (1975). Flore des charophytes du massif armoricain et des contrées voisines d'Europe occidentale (Paris, France: Jouve).
Díaz-Tapia, P., Maggs, C. A., Macaya, E. C., Verbruggen, H. (2018). Widely distributed red algae often represent hidden introductions, complexes of cryptic species or species with strong phylogeographic structure. J. Phycol 54, 829–839. doi: 10.1111/jpy.12778
Frame, P. W. (1977). Fine structural studies of oospore ornamentation and bulbil development in charophytes. phD (University of Toronto), p. 182.
Groves, J., Bullock-Webster, G. R. (1920). “The British charophyta,” in Nitellae (London: The Ray Society).
Guerlesquin, M. (1967). “Recherches caryotypiques et cytotaxinomiques chez les charophycées d’Europe occidentale et d’Afrique du nord,” in Thèse (Bullétin de Société Science Bretagne), 4, 1–265.
Hall, T. A. (1999). “BioEdit: A user-friendly biological sequence alignment editor and analysis program for windows 95/98/NT Nucleic Acids Symp. Ser. 41, 95–98.
Herbarium Rostochiense (ROST). Available at: https://www.garten.uni-rostock.de/studium%20-und-lehre/forschung/herbarium/.
Holzhausen, A. (2016). Resilienz aquatischer Ökosysteme - vitalitätsabschätzungen von diasporenbanken Ph. D. thesis, (Rostock: University Rostock). doi: 10.18453/rosdok_id00002020
Holzhausen, A., Nowak, P., Niedrig, C., Feike, M., Schubert, H. (2015). Morphometry of Chara aspera, C. canescens, C. baltica var. baltica, C. baltica var. liljebladii and C. intermedia oospores: Local variation versus taxonomic differences. Aquat Bot. 120, 60–66. doi: 10.1016/j.aquabot.2014.07.001
Holzhausen, A., Porsche, C., Schubert, H. (2017). Viability assessment and estimation of the germination potential of charophyte oospores: Testing for site and species specificity. Bot. Lett. 165, 147–158. doi: 10.1080/23818107.2017.1393460
Hy, M. (1913). Les Characées de France. Bull. Soc. Bot. Fr 60, 47. doi: 10.1080/00378941.1913.10839719
Irisarri, I., Darienko, T., Proschold, T., Furst-Jansen, J. M. R., Jamy, M., De Vries, J. (2021). Unexpected cryptic species among streptophyte algae most distant to land plants. Proc. Biol. Sci. 288, 20212168. doi: 10.1098/rspb.2021.2168
Krause, W. (1997). “Charales (Charophyceae),” in Süßwasserflora von mitteleuropa. Eds. Ettl, H., Gärtner, G., Heynig, H., Mollenhauer, D. (Stuttgart: Gustav Fischer Verlag).
Kumar, S., Stecher, G., Tamura, K. (2016). MEGA7: Molecular evolutionary genetics analysis version 7.0 for bigger datasets. Mol. Biol. Evol. 33, 1870–1874. doi: 10.1093/molbev/msw054
Lambert, E., Desmots, D., Le Bail, J., Mouronval, J.-B., Felzines, J.-C. (2013). Tolypella salina R. Cor. on the French Atlantic coast: Biology and ecology. Acta Bot. Gall 160, 107–119. doi: 10.1080/12538078.2013.823105
Langangen, A. (1994). Tolypella normaniana Nordstedt, a little known charophyte from northern Norway. Cryptogamie Algol. 15, 221–236.
Langangen, A. (2021). Lokalitetsliste 2021 Status pr. 1. Februar 2021. Norges Kransalger Hefte (Oslo, Norway), 13. doi: 10.13140/RG.2.2.27601.15202
Leigh, J. W., Bryant, D., Nakagawa, S. (2015). Popart: full-feature software for haplotype network construction. Meth Ecol. Evol. 6, 1110–1116. doi: 10.1111/2041-210x.12410
McCourt, R. M., Karol, K. G., Casanova, M. T., Feist, M. (1999). Monophyly of genera and species of characeae based on rbcL sequences, with special reference to Australian and European Lychnothamnus barbatus (Characeae: Charophyceae). Aust. J. Bot. 47, 361–369. doi: 10.1071/BT97100
Meiers, S. T., Proctor, V. W., Chapman, R. L. (1999). Phylogeny and biogeography of Chara (Charophyta) inferred from 18S rDNA sequences. Aust. J. Bot. 47, 347–360. doi: 10.1071/BT97089
Mouronval, J.-B., Baudouin, S., Borel, N., Soulié-Märsche, I., Klesczewski, M., Grillas, P. (2015). Guide des Characées de France Méditerranéenne. [Guide of Characeae of the French Mediterranean Region] (Paris, France: Office National de la Chasse et de la Faune Sauvage).
Nishiyama, T., Sakayama, H., De Vries, J., Buschmann, H., Saint-Marcoux, D., Ullrich, K. K., et al. (2018). The Chara genome: Secondary complexity and implications for plant terrestrialization. Cell 174, 448–464. doi: 10.1016/j.cell.2018.06.033
Noedoost, F., Sheidai, M., Riahi, H., Ahmadi, A. (2015). Genetic and morphological diversity in Chara vulgaris l. (Characeae). Acta Biol. Szegediensis 59, 127–137.
Nordstedt, O. (1889). “De algis et characeis,” in Lunds universitets års-skrift (Lund: Acta Universitatis Lundensis).
Payo, D. A., Leliaert, F., Verbruggen, H., D'hondt, S., Calumpong, H. P., De Clerck, O. (2013). Extensive cryptic species diversity and fine-scale endemism in the marine red alga Portieria in the Philippines. Proc. Biol. Sci. 280, 20122660. doi: 10.1098/rspb.2012.2660
Pérez, W., Casanova, M. T., Hall, J. D., Mccourt, R. M., Karol, K. G. (2016). Phylogenetic congruence of ribosomal operon and plastid gene sequences for the characeae with an emphasis on Tolypella (Characeae, charophyceae). Phycologia 56, 230–237. doi: 10.2216/16-16.1
Pérez, W., Hall, J. D., Mccourt, R. M., Karol, K. G. (2014). Phylogeny of north American Tolypella (Charophyceae, charophyta) based on plastid DNA sequences with a description of tolypella ramosissima sp. nov. J. Phycol 50, 776–789. doi: 10.1111/jpy.12219
Pérez, W., Hall, J. D., Mccourt, R. M., Karol, K. G. (2015). Oospore dimensions and morphology in North American Tolypella (Charophyceae, Charophyta). J. Phycol. 51, 310–320. doi: 10.1111/jpy.12275
Poong, S.-W., Lim, P.-E., Phang, S.-M., Gerung, G. S., Kawai, H. (2013). Mesospora elongata sp. nov. (Ralfsiales, phaeophyceae), a new crustose brown algal species from the indo-pacific region. Phycologia 52, 74–81. doi: 10.2216/12-42.1
Posada, D., Crandall, K. A. (2002). The effect of recombination on the accuracy of phylogeny estimation. J. Mol. Evol. 54, 396–402. doi: 10.1007/s00239-001-0034-9
Proctor, V. W. (1980). Historical biogeography of Chara (Charophyta): an appraisal of the Braun-Wood classification plus a falsifiable alternative for future consideration. J. Phycol. 16, 218–233. doi: 10.1111/j.1529-8817.1980.tb03023.x
RAL COLOUR SYSTEM. Available at: https://www.ralcolorchart.com/ral-classic/brown-hues.
Ray, S., Pekkari, S., Snoeijs, P. (2001). Oospore dimensions and wall ornamentation patterns in Swedish charophytes. Nordic Bot. 21, 207-224. doi: 10.1111/j.1756-1051.2001.tb01359.x
Ronquist, F., Huelsenbeck, J. P. (2003). MrBayes 3: Bayesian phylogenetic inference under mixed models. Bioinformatics 19, 1572–1574. doi: 10.1093/bioinformatics/btg180
Sawa, T., Frame, P. W. (1974). Comparative anatomy of charophyta: I. oogonia and oospores of Tolypella- with special reference to the sterile oogonial cell. Bull. Torrey Bot. Club 101, 136–144. doi: 10.2307/2484179
Schaible, R., Bergmann, I., Schubert, H. (2011). Genetic structure of sympatric sexually and parthenogenetically reproducing population of Chara canescens (Charophyta). ISRN Ecol. 2011, 1–13. doi: 10.5402/2011/501838
Schaible, R., Bergmann, I., Bögle, M., Schoor, A., Schubert, H. (2009). Genetic characterisation of sexually and parthenogenetically reproductive populations of Chara canescens (Charophyceae) using AFLP, rbcL, and SNP markers. Phycologia 48, 105–117. doi: 10.2216/08-58.1
Schneider, S. C., Nowak, P., Von Ammon, U., Ballot, A. (2016). Species differentiation in the genus Chara (Charophyceae): considerable phenotypic plasticity occurs within homogenous genetic groups. Eur. Phycol 51, 282–293. doi: 10.1080/09670262.2016.1147085
Schneider, S. C., Rodrigues, A., Moe, T. F., Ballot, A. (2015). DNA Barcoding the genus Chara: molecular evidence recovers fewer taxa than the classical morphological approach. J. Phycol 51, 367–380. doi: 10.1111/jpy.12282
Sheth, B. P., Thaker, V. S. (2017). DNA Barcoding and traditional taxonomy: An integrated approach for biodiversity conservation (Gujarat: Saurashtra University). doi: 10.1139/gen-2015-0167
Sleith, R. S., Karol, K. G. (2021). Global high-throughput genotyping of organellar genomes reveals insights into the origin and spread of invasive starry stonewort (Nitellopsis obtusa). Biol. Invasions 23, 3471–3482. doi: 10.1007/s10530-021-02591-8
Soulié-Märsche, I., García, A. (2015). Gyrogonites and oospores, complementary viewpoints to improve the study of the charophytes (Charales). Aquat Bot. 120, 7–17. doi: 10.1016/j.aquabot.2014.06.003
Struck, T. H., Feder, J. L., Bendiksby, M., Birkeland, S., Cerca, J., Gusarov, V. I., et al. (2018). Cryptic species - more than terminological chaos: A reply to heethoff. Trends Ecol. Evol. 33, 310–312. doi: 10.1016/j.tree.2018.02.008
Urbaniak, J. (2003). Tolypella nidifica (O. F. Müll.) a. Braun 1856 (Ruggell: A.R.G. Gantner Verlag Kommanditgesellschaft).
Urbaniak, J., Langangen, A., Van Raam, J. (2012). Oospore wall ornamentation in the genus Tolypella (Charales, Charophyceae). J. Phycol 48, 1538–1545. doi: 10.1111/jpy.12007
Van De Weyer, K., Schmidt, C. (2018). Bestimmungsschlüssel für die aquatischen Makrophyten (Gefäβpflanzen, Armleuchteralgen und Moose) in Deutschland. Band 1, 2. aktualisierte Auflage: Bestimmungsschlüssel [Determination key for aquatic macrophytes (vascular plants, characeaen and mosses) in germany. vol. 1: Determination key] (Potsdam: Landesamt für Umwelt (LfU) Brandenburg).
Winter, U., Kirst, G. O. (1991). Vacular sap composition during sexual reproduction and salinity stress in charophytes. Bull. Soc Bot. Fr. 138, 85–93. doi: 10.1080/01811789.1991.10827045
Wood, R. D. (1962). New combinations and taxa in the revision of characeae. Taxon 11, 7–25. doi: 10.2307/1216853
Wood, R. D. (1965). “Monograph of the characeae,” in A revision of the characeae. Ed. Wood, R. D. (Weinheim: J Cramer). I. K.
Keywords: charophytes, genetic diversity, oospore morphology, phylogeny, Tolypella, taxonomic concepts
Citation: Holzhausen A, Nowak P, Ballot A, Becker R, Gebert J, Gregor T, Karol KG, Lambert E, Pérez W, Raabe U, Schneider SC, Stewart N, van de Weyer K, Wilde V and Schubert H (2023) Plastid DNA sequences and oospore characters of some European taxa of Tolypella section Tolypella (Characeae) identify five clusters, including one new cryptic Tolypella taxon from Sardinia, but they do not coincide with current morphological descriptions. Front. Plant Sci. 14:1096181. doi: 10.3389/fpls.2023.1096181
Received: 11 November 2022; Accepted: 15 February 2023;
Published: 01 March 2023.
Edited by:
Salvatore Pasta, CNR Area della Ricerca di Palermo, ItalyCopyright © 2023 Holzhausen, Nowak, Ballot, Becker, Gebert, Gregor, Karol, Lambert, Pérez, Raabe, Schneider, Stewart, van de Weyer, Wilde and Schubert. This is an open-access article distributed under the terms of the Creative Commons Attribution License (CC BY). The use, distribution or reproduction in other forums is permitted, provided the original author(s) and the copyright owner(s) are credited and that the original publication in this journal is cited, in accordance with accepted academic practice. No use, distribution or reproduction is permitted which does not comply with these terms.
*Correspondence: Anja Holzhausen, YW5qYS5ob2x6aGF1c2VuQGJpb2xvZ2llLnVuaS1tYXJidXJnLmRl
†ORCID: Ralf Becker, orcid.org/0000-0001-5597-1398