 Georgina E. Barratt
 Erik H. Murchie
 Debbie L. Sparkes
- Division of Plant and Crop Sciences, School of Biosciences, University of Nottingham, Nottingham, United Kingdom
Many areas of sugar beet production will face hotter and drier summers as the climate changes. There has been much research on drought tolerance in sugar beet but water use efficiency (WUE) has been less of a focus. An experiment was undertaken to examine how fluctuating soil water deficits effect WUE from the leaf to the crop level and identify if sugar beet acclimates to water deficits to increase WUE in the longer term. Two commercial sugar beet varieties with contrasting upright and prostrate canopies were examined to identify if WUE differs due to contrasting canopy architecture. The sugar beet were grown under four different irrigation regimes (fully irrigated, single drought, double drought and continually water limited) in large 610 L soil boxes in an open ended polytunnel. Measurements of leaf gas exchange, chlorophyll fluorescence and relative water content (RWC) were regularly undertaken and stomatal density, sugar and biomass yields and the associated WUE, SLW and Δ13C were assessed. The results showed that water deficits generally increase intrinsic (WUEi) and dry matter (WUEDM) water use efficiency but reduce yield. Sugar beet recovered fully after severe water deficits, as assessed by leaf gas exchange and chlorophyll fluorescence parameters and, except for reducing canopy size, showed no other acclimation to drought, and therefore no changes in WUE or drought avoidance. Spot measurements of WUEi, showed no differences between the two varieties but the prostrate variety showed lower Δ13C values, and traits associated with more water conservative phenotypes of a lower stomatal density and greater leaf RWC. Leaf chlorophyll content was affected by water deficit but the relationship with WUE was unclear. The difference in Δ13C values between the two varieties suggests traits associated with greater WUEi may be linked to canopy architecture.
1 Introduction
Climate change is causing hotter and drier summers in many areas of Europe (Evans, 2017) with crop yields increasingly limited by water availability (Angert et al., 2005). A sufficient supply of water is crucial to maximizing plant yield because dry matter (DM) accumulation is directly proportional to water use in most environments. This is because solar radiation drives both photosynthesis and transpiration (Tanner and Sinclair, 1983). The relationship between photosynthesis and transpiration, known as water use efficiency (WUE) can be assessed at a range of scales. At the leaf level by assessing carbon uptake in relation to stomatal conductance (gs), known as intrinsic water use efficiency (WUEi) (Farquhar et al., 1989) and the crop level by calculating the ratio of DM accumulated to water used by the crop (WUEDM) (Boyer, 1996). In crops, WUE can be further defined to consider only the DM of the harvested product (Fageria et al., 2006). Increasing WUE can be achieved through manipulation of three key processes which operate from the leaf to the crop level, (i) reducing water loss, for example through soil evaporation and water passing beyond the root zone, (ii) reducing the rate of transpiration to carbon fixation and (iii) increasing the harvest index (Condon et al., 2002). A large number of traits are associated with these processes and those that influence photosynthesis and stomatal anatomy are of particular interest (Leakey et al., 2019). Environmental factors are also key to WUE with light, temperature and soil water availability affecting plant water use and carbon fixation (Hatfield and Dold, 2019). The relationship between carbon fixation and water use means that increasing crop WUE can be a trade-off between photosynthesis and transpiration (Blum, 2005). Despite this trade-off there has been success in breeding commercial wheat varieties which are more efficient in their use of water, without reducing yield potential under optimal conditions (Condon et al., 2002; Condon et al., 2004). This was achieved through identifying differences in carbon isotope discrimination (Δ13C) which is inversely related to WUEi (Farquhar and Richards, 1984) and allowed breeding for specific environments where water conservation or fast growth was required. As breeders move away from focusing solely on maximizing yield and look for traits which increase crop resilience, including those associated with WUE, it is important to understand if there are differences in such traits in sugar beet. Although there has been extensive work on drought tolerance in sugar beet (Ober and Luterbacher, 2002; Ober et al., 2004; Ober et al., 2005) WUEi was not assessed and may be a useful trait when developing more WUE varieties for the regions in which climate change is leading to reduced water availability.
Sugar beet varieties are developed for a range of markets around the world, from the dry climates of the Middle East to the temperate climates of Europe and North America (Morillo-Velarde and Ober, 2008). Although there are many studies looking at the effects of irrigation on sugar beet in drier climates (Mohammadian et al., 2005; Hassanli et al., 2010; Topak et al., 2011; Li et al., 2019), in much of Europe, irrigation is not economically feasible (Rezbova et al., 2013) and sugar beet WUE must be increased to maximize the use of rainfall to reach the crop’s full yield potential (Hoffmann and Kenter, 2018). Despite a maritime ancestry, which makes sugar beet more drought tolerant than many major crop species (Dunham, 1993), yield losses are still evident under drought with unirrigated losses in Europe ranging from 15-40% depending on the regional climate and soil type (Pidgeon et al., 2001). Significant variations in drought tolerance have been identified within the sugar beet germplasm and Beta gene bank accessions driving further work to understand the level of drought tolerance in breeders’ lines (Ober and Luterbacher, 2002). The work of Ober et al. (2004) compared sugar beet breeding lines and varieties grown for a range of climates to look at the drought tolerance index (DTI) (the fraction of irrigated yield maintained under drought, normalized by the mean yield across all genotypes in the trial) which was shown to be significantly different between genotypes. Genotype x environment interactions have been shown to significantly affect sugar beet yield (Hoffmann et al., 2009) and phenotypic differences related to drought tolerance, which may be observed when water is freely available, are not always as evident under drought (Ober et al., 2004). This highlights that traits must be tested under a range of conditions to fully understand how they may influence sugar beet WUE. The absence of distinctive stress sensitive developmental stages such as anthesis in the annual sugar beet crop cycle means that the relationship between water use and yield is consistent regardless of drought timing (Dunham, 1993). Indirect canopy traits have a strong influence on DTI with greater green canopy maintenance, low wilting and senescence score, specific leaf weight (DW/total sampled leaf area) and succulence index (FW-DW/total sampled leaf area) all enhancing DTI (Ober et al., 2005). WUE assessed at the crop level shows significant differences between genotypes, which is driven by increased biomass accumulation rather than reduced water use (Ober et al., 2005). There was no assessment in these studies of WUEi and associated traits, such as Δ13C, and whether these could be correlated with DTI. Δ13C is strongly correlated with WUEi and provides an integrated measure of WUEi over time. This makes it more reliable than direct leaf gas exchange measurements, which can be influenced by the environment at the time of measurement.
Few studies have considered Δ13C in sugar beet but Rajabi et al. (2008) found that a greater SLW was related to an increased Δ13C and WUEi in breeding lines and hybrids. SLW was also correlated with DTI, suggesting that there may be a relationship between drought tolerance traits and WUE. Additionally, it has been shown that variation in Δ13C is greater in conditions where water is not limiting as opposed to under drought (Rytter, 2005; Rajabi et al., 2009). This shows the importance of assessing Δ13C under both irrigated and droughted conditions to ensure that the relationship with WUEi is understood. Sugar beet Δ13C has also been used to show the increase of WUEi under drought as stomatal aperture is reduced. The decline in Δ13C between well-watered and droughted treatments equated to a 24% increase in WUE, and the same study highlighted that leaf Δ13C in sugar beet is a better measure of WUE than root Δ13C (Bloch et al., 2006).
Studies have shown that there is a range of drought tolerance and Δ13C values in sugar beet breeding lines. However, the relationship between WUEi and traits associated with drought tolerance has not been explored. The consistency of SLW in both increased DTI and Δ13C suggest that canopy traits are closely associated with sugar beet WUEi and should be a key area of focus. In cereal crops it has been shown that canopy architecture can also affect Δ13C with more erect leaves having a greater Δ13C and achieving greater yields but the effect on WUE was not assessed (Araus et al., 1993). Sugar beet canopies can be classed as upright or prostrate and research has shown that this drives differences in radiation use efficiency (RUE) (Tillier et al., 2023). Varieties with upright canopies were shown to have a higher RUE than the prostrate, potentially driven by the leaves being better able to intercept light later in the year as the sun is lower in the sky. As radiation drives transpiration as well as photosynthesis this could lead to differences in WUE between upright and prostrate varieties which is yet to be studied. It could be hypothesized that the prostrate variety would have a greater WUE because less leaves in the canopy are exposed to high levels of radiation reducing transpiration. However, this could come at a cost to yield as overall less light is intercepted by the canopy for photosynthesis. Additionally, the differences in canopy architecture could also drive differences in leaf physiology as leaves could be different in structure to enable them to sit in a more upright or prostrate position. They could also differ in stomatal physiology as the abaxial surface of a leaf in an upright canopy is more likely to intercept more light than in a prostrate variety. Previous work has been focused on the Beta genebank and breeders’ lines rather than elite commercial varieties. So far, differences in traits associated with greater WUEi have not been detected in elite varieties which, if identified, would show that greater WUEi in sugar beet is a commercially viable trait for breeders to target. Although work is being undertaken to identify traits in wild sea beet populations, which may be introgressed into commercial varieties (Ribeiro et al., 2016), progress is slow as it relies on traditional breeding techniques. Therefore, it is useful to explore whether differences in WUEi and associated traits are evident in commercial varieties. If differences are identified, this would show that increased WUEi is already a viable trait in commercial sugar beet crops. Therefore, in this study, two elite UK sugar beet varieties, with contrasting upright and prostrate canopies, have been selected to answer the research questions:
1. How is WUE affected by fluctuations in soil water availability in sugar beet?
2. Does sugar beet acclimate to water deficit by increasing WUE?
3. Are there differences in WUE between commercial sugar beet varieties with contrasting canopy architecture, and if so, is this related to stomatal morphology and leaf traits such as SLW and RWC?
2 Materials and methods
2.1 Box set up and plant materials
Two experiments were conducted in 2018 and 2019 using sugar beet varieties from different breeders with contrasting canopies (Figure 1), Cayman with a prostrate canopy (Prostrate) and Sabatina KWS with an upright canopy (Upright). To simulate a realistic canopy environment sugar beet were grown in plastic pallet boxes with a volume of 610 L, depth of 60 cm and surface area of 1.1 m2. Boxes had drainage holes drilled in the bottom with membrane overlaid and filled with a sandy clay loam, (Landscape20, Topsoil, Cambridgeshire, UK). The boxes were filled in four stages, with a minimum of 6 days between each stage, and hand watered to settle the soil. Volumetric water sensors (ECH20 EC-5, Meter group Inc, USA) were buried 15 cm from the bottom of the box in 2018 whilst in 2019 larger sensors (ECH20 10HS, Meter group Inc, USA) were buried at 30 cm to get a reading over a larger soil volume. Sensors were calibrated specifically to the soil used, as directed by the manufacturer’s protocol. Volumetric water content (VWC) was logged every hour (Em5b, Meter group Inc, USA). The boxes were placed in an open ended polytunnel without environmental controls orientated East to West and covered in a diffuse polythene (SunMaster Diffused, XL Horticulture LTD, Devon, UK) in 2018 and a clear polythene (SunMaster Clear, XL Horticulture LTD, Devon, UK) in 2019. In both years, the boxes were arranged in a split plot design, with irrigation regime on the main plot and variety on the sub plot. Measurements were taken on 32 boxes divided into four blocks of eight with discard boxes at the end of each row to minimise edge effects. A temperature and humidity sensor was suspended at canopy height and logged measurements every hour (TinyTag Ultra 2, Chichester, UK). In 2019, an additional sensor was suspended at the end of blocks 2 and 4 to identify if a temperature gradient was present but no differences were identified. Thermal time was higher in 2019 than 2018 with differences most evident in August and September (Supplementary Figure S1).
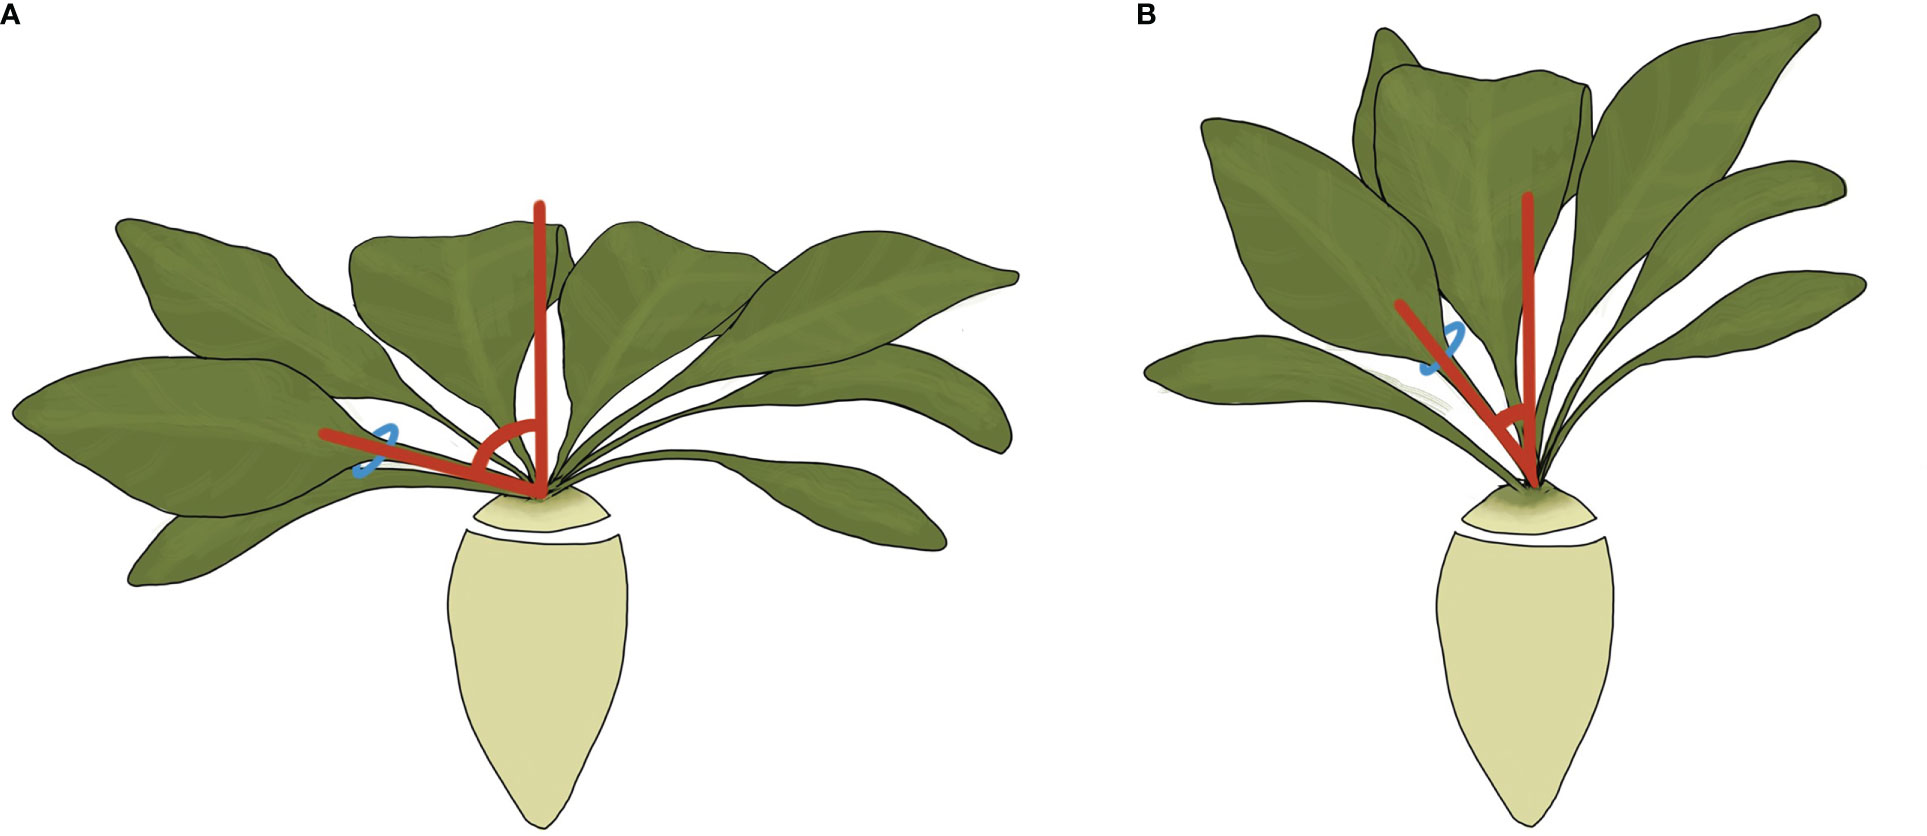
Figure 1 An illustration of a prostrate (A) and upright (B) sugar beet canopy. The petiole angle is shown in red and is greater in prostate varieties. Originally published in Tillier et al. (2023); reproduced under CC BY 4.0.
2.2 Sowing and establishment
To ensure an optimal seedbed the boxes were raked to produce a fine tilth. A plywood board with holes drilled for correct seed spacing (Supplementary Figure S2) was placed over the box and three seeds sown in each hole. Boxes were hand watered at regular intervals, and timed to ensure equal watering, to prevent soil drying and ensure good establishment. Plants were thinned once two true leaves were evident to give a total of 12 plants per box. Boxes were fertilised with ammonium nitrate in 2018 and ammonium sulphate in 2019, using a split application equating to 40 kg N ha-1 followed by 80 kg N ha-1. After each application of fertiliser, the boxes were watered equally. In both years the seeds were sown on 9 April, in 2018 fertiliser was applied at 15 and 29 DAS with thinning at 32 DAS, whilst in 2019 fertiliser was applied at 16 and 29 DAS with thinning at 29 DAS.
2.3 Irrigation
An irrigation system consisting of drip irrigation pipe was installed after emergence with three lengths of pipe running between the sugar beet rows (Supplementary Figure S2). Four irrigation treatments were applied; a fully irrigated control (Full), a single drought (SD), a double drought (DD) which had the SD treatment plus a second period of drought and a water limited treatment (Ltd) which was kept at approximately 50% field capacity. The second water withdrawal for the DD started when the maximum rate of assimilation (Amax) returned to a level similar to the fully irrigated plants. Boxes were irrigated back to field capacity immediately at the end of a water withdrawal period. Timings were comparable between the two years, except for the DD which was later in 2018 than 2019. The first water withdrawal was at 65-96 DAS in 2018 and 73-92 DAS in 2019 and the second at 151-200 DAS in 2018 and 129-148 DAS in 2019. In 2018, the total amount of water applied per box was; Full – 110.9 L, SD- 102.1 L, DD-75.9 L and Ltd- 41.3 L and in 2019; Full – 102 L, SD- 90.1 L, DD-83.6 L and Ltd- 28.9 L. Soil moisture was monitored using the VWC sensors in 2018 and 2019 (Supplementary Figures S3A, B) and irrigation adjusted accordingly.
2.4 Leaf gas exchange and chlorophyll fluorescence spot measurements
Spot measurements of gas exchange measurements of maximum assimilation (Amax) and stomatal conductance (gs) were taken using an infra-red gas analyser (LiCor Li6800, LiCor, USA) and used to calculate WUEi (Condon et al., 2002).
The two-sugar beet located centrally in the box (6 and 7, Supplementary Figure S2) were measured to avoid any potential edge effects. Settings were: flow 500 µmol s⁻¹, heat exchanger temperature 20°C (which gave a leaf temperature between 20°C and 28°C dependent on ambient conditions), RH 50%, light 1200 µmol m⁻² s⁻¹, and matched every 10 minutes. Chlorophyll fluorescence parameters of Fv’/Fm’ (maximum PSII efficiency in the light), ΦPSII (quantum efficiency of PSII electron transport in the light) and qp (photochemical quenching) were measured at the same time using a multiphase flash fluorometer (LiCor Li6800, LiCor, USA) and a dark pulse (Murchie and Lawson, 2013). Data was logged once A, gs, CO2 sample and H2O sample were stable, which took between 5-10 minutes per leaf. Two leaves from each plant, referred to as ‘measurement leaf 1’ and ‘measurement leaf 2’ were focused on each year. Measurements started once the leaves were fully expanded with measurement leaf 1 used from 77-133 DAS in 2018 (includes the first drought from 65-96 DAS) and in 2019 this leaf was used from 69-110 DAS (includes the drought at 73-92 DAS). Measurement leaf 2 was used from 105-210 DAS in 2018, (second drought 151-200 DAS) and from 118-182 DAS in 2019 (second drought 129-148 DAS).
In 2019 measurements were also taken of ‘measurement leaf 3’ at 162-182 DAS to correlate with Δ13C, which will be outlined later. Measurements were taken between 8:00 hr and 14:00 hr over 2 consecutive days with blocks one and two measured on the first day and blocks three and four on the second. The DAS of the first day of measurements is used to denote the timing of the measurement. When gas exchange measurements were completed, canopy temperature was assessed using thermal images of each box taken at a distance of 1 metre perpendicular to the edge of the box with a handheld camera (FLIR C2 thermal imaging camera, FLIR, USA) and analysed using thermal analysis and reporting software (FLIR Tools, FLIR, USA).
2.5 Chlorophyll extraction
In 2019, chlorophyll extraction was undertaken on leaf discs collected at 203 DAS from plants one, two and three (Supplementary Figure S2). Each leaf disc was wrapped in aluminium foil and placed in liquid nitrogen before storage in a -80°C freezer. At the same time three additional leaf discs were cut from each leaf and weighed together to determine FW and oven dried to record DW.
The frozen leaf discs were added to 2 ml microcentrifuge tubes with 1.5 ml 80% acetone and a ceramic bead before milling using a fast prep for two 20 sec cycles. The extracted chlorophyll was then transferred to 15 ml centrifuge tubes and topped up to 4 ml using 3 ml 80% acetone before centrifuging for 5 min at 3000 rpm. Chlorophyll a and b concentrations were then measured using a spectrophotometer (Cary 50, Agilent, Santa Clara, US) using the method of Porra (2002).
2.6 Relative water content
Relative water content (RWC) was measured at regular intervals from 66-213 DAS in 2018 and 74-177 DAS in 2019. Using a cork borer three 1 cm diameter leaf discs were cut from a leaf on plants 2 and 3 representative of the new measurement leaf on plants 6 and 7 (Supplementary Figure S2). The 6 leaf discs were processed using the method of Weatherley (1950) and RWC calculated using the following equation:
2.7 Stomatal impressions
Stomatal impressions of the abaxial and adaxial leaf surface of leaves of a similar age were taken at 219 DAS and 203 DAS in 2018 and 2019 respectively. Clear nail varnish was applied and left to dry for 20 minutes until no longer tacky, lifted using clear tape and mounted on a microscope sample slide. Three images were taken from each sample slide using a microscope (Leica 5000B, Wetzlar, Germany) with a light source (Leica CTR5000 Wetzlar, Germany) at 100x magnification and cropped to 1 mm2 using the microscope scale for reference in Fiji (Schindelin et al., 2012). The stomata in the cropped images were manually counted in Fiji using the Cell Counter plug in (Author: Kurt De Vos), with an average stomatal density (SD) for each sample calculated from the three 1 mm2 areas.
2.8 Harvest
Boxes were harvested at 226 DAS and 211 DAS in 2018 and 2019 respectively. The sugar beet were hand lifted with plants 6 and 7 taken for further analysis. The 10 remaining beet were topped and the leaves and roots weighed separately to determine FW. The canopy was then discarded, and the roots taken to the BBRO tare house at Wissington Sugar Beet factory, Norfolk, UK to determine sugar % using polarimetry. K and Na impurities were also measured using flame photometry and AN content using colorimetry as per standard methods (ICUMSA, 2022). The leaves and roots of plants 6 and 7 were combined and weighed to determine FW before oven drying at 70°C and weighed to determine leaf and root dry matter (DM). The %DM of leaves and roots from plants 6 and 7 in each box was used to calculate the total DM from the total FW. The white sugar yield (WS) was calculated by multiplying the total FW by the sugar percentage. The total DM and WS for each box and the total amount of irrigation applied was then used to calculate the box level total dry matter water use efficiency (WUEDM) and WS water use efficiency (WUEWS).
2.9 Specific leaf weight
Specific leaf weight (SLW) was calculated from measurement leaf 3, before processing to determine Δ13C, with the leaf passed through a leaf area meter (Li-3100, LiCor, USA) to determine leaf area with DW calculated from the FW multiplied by the %DW derived from beet 6 and 7 at harvest.
2.10 Carbon 13 isotope discrimination
In 2019, measurement leaf 2 and 3 were removed at 209 DAS and freeze dried to determine the ration of 12C to 13C (δ13C). Samples were milled (ZM200, RETSCH, Haan, Germany) to a fine homogenised powder and analysed at the British Geological Survey in Keyworth, Nottinghamshire. Leaf δ13C analyses were performed by combustion in a Costech Elemental Analyser (EA) on-line to a VG TripleTrap and Optima dual-inlet mass spectrometer, with δ13C values calculated to the VPDB scale using a within-run laboratory standards calibrated against NBS 18, NBS 19 and NBS 22. Replicate analysis of well-mixed samples indicated a precision of ±<0.1‰ (1 SD). δ13C was used to calculate carbon isotope discrimination (Δ13C), which is inversely proportional to WUE.
Where δp is the δ13C calculated from the leaf tissue and δa is the atmospheric ratio of 12C to 13C taken to be -8‰ Δ13C (Farquhar et al., 1989).
Δ13C was plotted against average WUEi on a per leaf basis, (calculated from the gas exchange values taken from measurement leaf 2 and 3), and WUEDM, WUEWS and SLW using averages calculated on a per box basis.
2.11 Statistical analysis
Repeated measures ANOVA for a split plot design was conducted on the Amax, gs, Ci/Ca, WUEi, Fv/’Fm’, ΦPSII, qp, canopy temperature and RWC data. There were four blocks and whole plots dictated by the irrigation regime with variety and irrigation as factors. For the total leaf chlorophyll content, leaf water content, stomatal density, WS yield, Total DM, WUEWS, WUEDM, SLW and Δ13C data a general split plot ANOVA with the same factors as the repeated measures ANOVA was used. All analysis was undertaken in GenStat 19th edition (VSN International Ltd., Hemel Hempstead, United Kingdom).
3 Results
3.1 Leaf gas exchange and WUEi
No leaf gas exchange interactions were observed between water availability x variety in the spot measurements, so the data was averaged across the two sugar beet varieties to examine the effect of water availability on WUE. Differences in some of the gas exchange parameters were observed in 2019 between the varieties and in Δ13C, which gives a longer-term measure of WUEi, and are presented later. Amax and gs were significantly reduced in all treatments over time as leaves aged (Figure 2). Drought reduced Amax and gs compared to the fully irrigated plants 92 DAS, 23 days after water withdrawal in 2018 (P<0.001; Figures 2A, B), in 2019 Amax was reduced 81 DAS, only 9 days after water withdrawal (P<0.001; Figure 2C) and gs was reduced, but not significantly, compared to the fully irrigated (Figure 2D). In 2018 the slight reduction in Amax and gs in the DD treatment compared to the fully irrigated at 196 DAS (Figures 2A, B) may be attributed to the drought being later in the year when the lower temperature reduced transpiration, as shown by the lower thermal time during the second drought in 2018 compared to 2019 (Supplementary Figure S1). During the second drought in 2019, Amax and gs were reduced in the DD treatment (P<0.001; Figures 2C, D) at 140 DAS, 11 days after water withdrawal. At 140 and 146 DAS the SD treatment had a higher Amax and gs than the fully irrigated (P<0.001; Figures 2C, D). During this period air temperatures exceeded 40°C from 136 – 140 DAS and the fully irrigated treatment saw a decline in VWC to levels similar to the water limited treatment before additional irrigation was applied at 141 and 142 DAS with this difference no longer evident at 153 DAS.
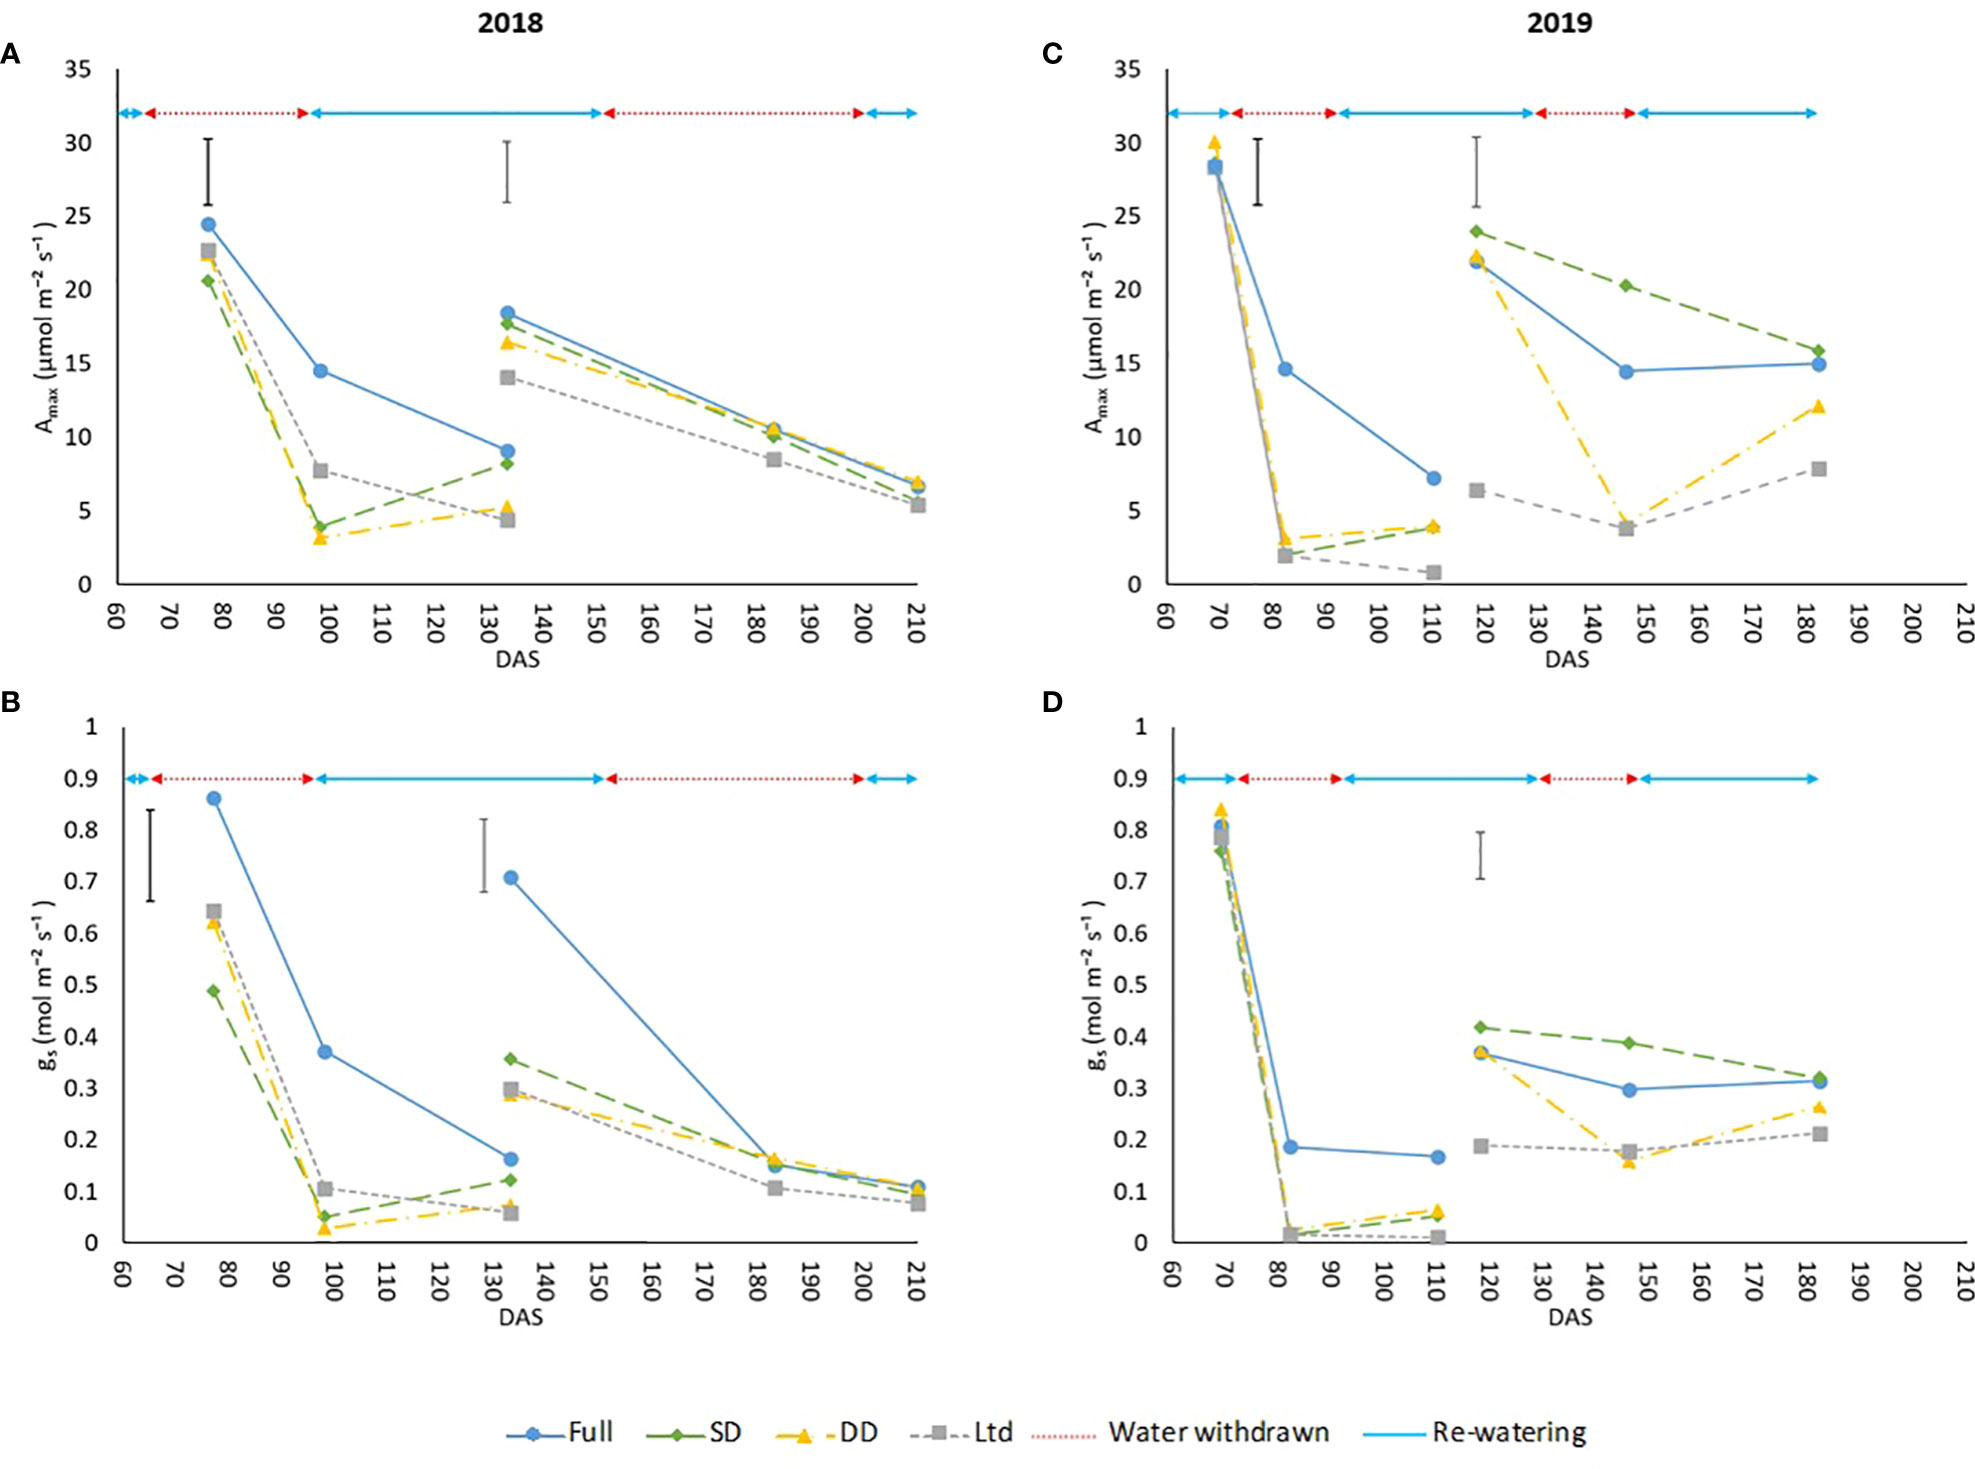
Figure 2 The maximum assimilation rate (Amax) and stomatal conductance (gs) of sugar beet grown under four irrigation regimes, measured using an infra-red gas analyser (Li6800, LiCor, Nebraska, US). Measurements were taken from 2 leaves Measurement leaf 1 covers the first drought and measurement leaf 2 the second drought in 2018 and 2019. (A) leaf 1 (LSD=4.54 DF=190 P<0.001), leaf 2 (LSD=4.16 DF=191 P=0.002). (B) leaf 1 (LSD=0.177 DF=190 P=0.005), leaf 2 (LSD=0.141 DF=191 P=0.002). (C) leaf 1 (LSD=4.45 DF=220 P<0.001), leaf 2 (LSD=4.75 DF=255 P<0.001). (D) leaf 1 (P=0.133), leaf 2 (LSD=0.136 DF=255 P<0.001). Error bars show time x irrigation LSD for all data points. ANOVA tables containing all the data points are available for Amax and gs in Supplementary Table S5 (2018) and Table S6 (2019). Irrigation regimes were a fully irrigated (Full), a continually water limited kept at approx. 50% field capacity (Ltd), a single drought (SD) (2018 65-96 DAS and 2019 73 -92 DAS) and a double drought (DD) which was exposed to the single drought treatment plus an additional drought (2018 151-200 DAS and 2019 118-182 DAS).
Recovery from the first drought, when Amax was no longer significantly different to the control, in 2018 was at 133 DAS, 37 days after rewatering (Figure 2A), and in 2019 was at 109 DAS, 18 days after rewatering (Figure 2C). Due to the lack of significant decline in A and gs under the second drought in 2018, recovery was only measured in 2019 and this was evidenced at 174 DAS, 46 days after rewatering. The close relationship between Amax and gs means that gs showed the same trends in recovery as Amax. The decline and recovery of Amax is further supported by the changes in chlorophyll fluorescence parameters (Supplementary Figures S4A–D) of maximum photochemical efficiency in the light, Fv/’Fm’ (Figures S4A, D), PSII operating efficiency, ΦPSII (Figures S4B, E), and photochemical quenching, qp (Figures S4C, F), which are largely consistent with those expected from a change in Amax as a result of stomatal closure.
The continually water limited treatment had a reduced Amax and gs comparable to the droughted treatments during water withdrawal, with the slower reduction in VWC in 2018 (Figures 2A, B) meaning the decline in Amax and gs was not as rapid as it was in 2019 (Figures 2C, D). Once VWC was maintained at approximately 50% field capacity Amax and gs were lower in the water limited treatment compared to the fully irrigated throughout the measurement periods in both years (P<0.001; Figure 2), except from 183 DAS onwards in 2018 (Figures 2A, B), and gs at 133 DAS as the fully irrigated leaf gs had also declined (Figure 2B).
WUEi was greater in the drought treatments of measurement leaf 1 in 2018 with all treatments having a higher WUEi than the fully irrigated until 133 DAS (P=0.004; Figure 3A), which could be attributed to a lower relative decline of Amax and gs in comparison as leaves age. The Ci/Ca values show a significant reduction compared the fully irrigated until 133 DAS (P=0.006; Figure 3B) as stomatal aperture is reduced to conserve water which is also driving the increased WUEi. In 2019, the difference in WUEi between treatments was not consistent and from 97-110 DAS the Ltd treatment had a lower WUEi than the fully irrigated, the only example of a water deficit treatment having a lower WUEi than the fully irrigated (P=0.003; Figure 3A). This was also reflected in the Ci/Ca values (Figure 3B). In 2018, the Ltd treatment had a higher WUEi at 105 and 113 DAS in measurement leaf 2 where it covers the first drought (P=0.004; Figure 3A). The Ci/Ca also reflects this with the Ltd treatment being lower than the SD and DD treatment which were themselves lower than the fully irrigated (P=0.004; Figure 3B). At 196 DAS a higher WUEi was also evident in the Ltd treatment (P=0.004; Figure 3A) alongside a reduced Ci/Ca (P=0.004; Figure 3B) compared to the other treatments. The DD treatment showed no increase in WUEi (Figure 3A) but Amax and gs were not significantly reduced as previously outlined. In 2019, the second drought increased the WUEi of the DD treatment at 153 and 163 DAS with this difference no longer significant at 169 DAS (P=0.022; Figure 3C), just before recovery of Amax and gs at 174 DAS. This also resulted in a decline in Ci/Ca compared to the fully irrigated and SD to levels similar to the Ltd treatment (P=0.027; Figure 3D). The increase in WUEi (P=0.022; Figure 3C) and decrease in Ci/Ca (P=0.027; Figure 3D) in the fully irrigated compared to the SD at 140 and 146 DAS can be attributed to the decline in VWC previously outlined.
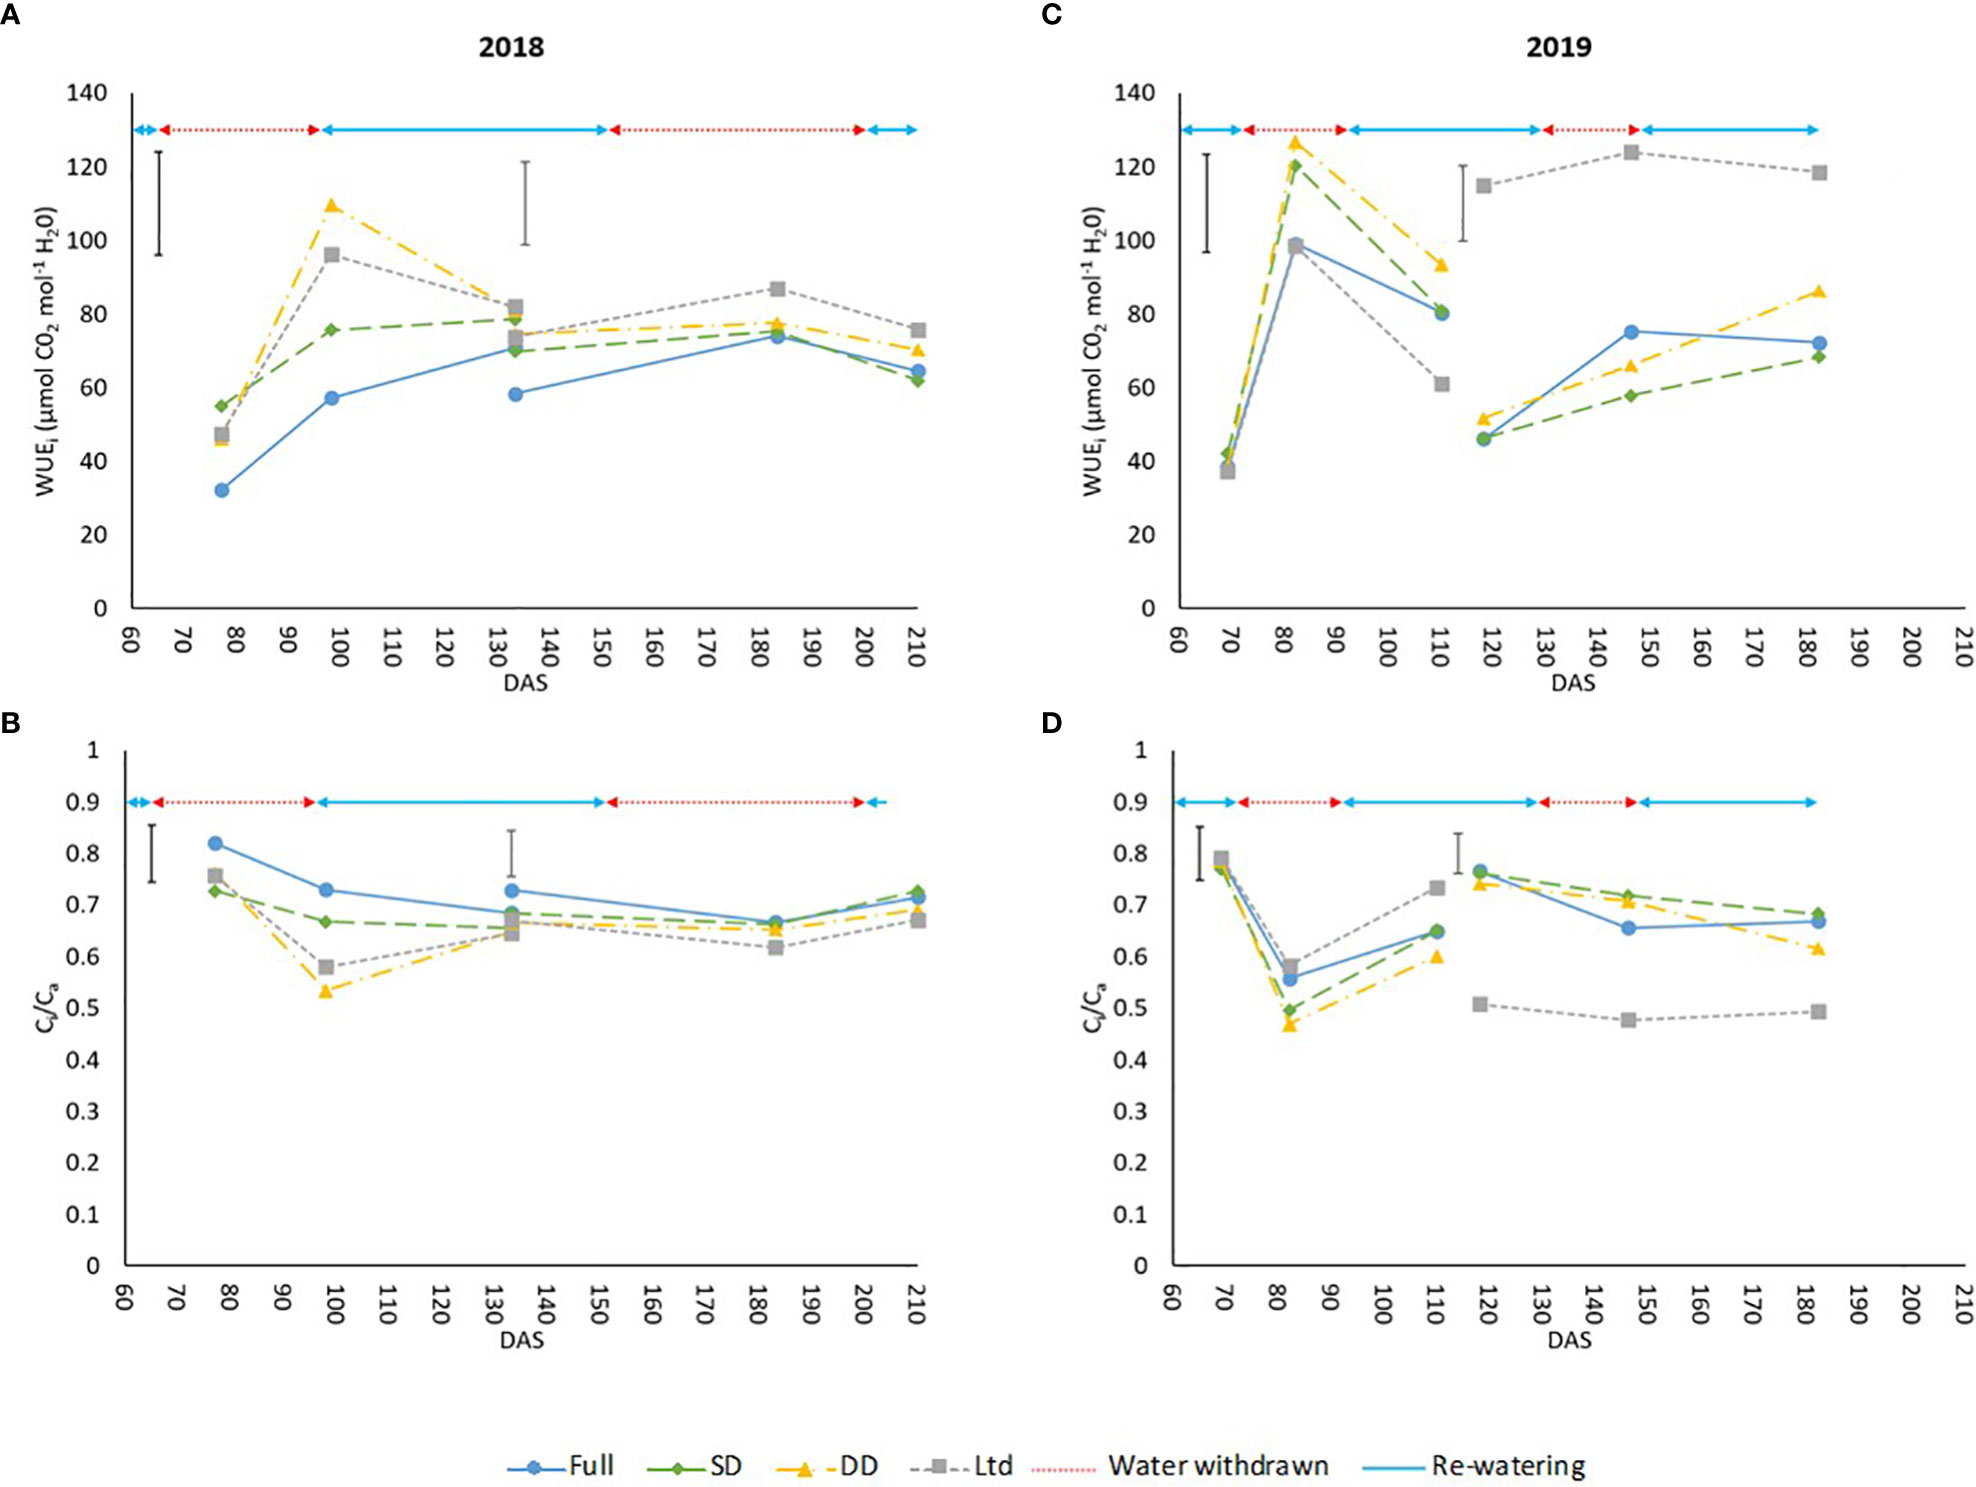
Figure 3 The intrinsic water use efficiency (WUEi) and ratio of intercellular to ambient CO2 (Ci/Ca) of sugar beet grown under four irrigation regimes, measured using an infra-red gas analyser (Li6800, LiCor, Nebraska, US). Measurements were taken from 2 leaves Measurement leaf 1 covers the first drought and measurement leaf 2 the second drought in 2018 and 2019. (A) leaf 1 (LSD=28.2 DF=190 P=0.004), leaf 2 (LSD=22.4 DF=191 P=0.004). (B) leaf 1 (LSD=0.110 DF=190 P=0.006), leaf 2 (LSD=0.088 DF=191 P=0.004). (C) leaf 1 (LSD=26.5 DF=220 P=0.003), leaf 2 (LSD=20.4 DF=255 P=0.022). (D) leaf 1 (LSD=0.104 DF=220 P=0.003), leaf 2 (LSD=0.079 DF=255 P=0.027). Error bars show time x irrigation LSD for all data points. ANOVA tables containing all the data points are available for WUEi and Ci/Ca in Supplementary Table S5 (2018) and Table S6 (2019). Irrigation regimes were a fully irrigated (Full), a continually water limited kept at approx. 50% field capacity (Ltd), a single drought (SD) (2018 65-96 DAS and 2019 73 -92 DAS) and a double drought (DD) which was exposed to the single drought treatment plus an additional drought (2018 151-200 DAS and 2019 118-182 DAS).
Averaged over all treatments at all measurement points there were no consistent differences in Amax, gs, WUEi and Ci/Ca between varieties in 2018. In 2019 there was no significant difference in Amax between the two sugar beet varieties, however gs was significantly higher in the upright variety of both measurement leaf 1: 0.284 µmol m⁻² s⁻¹ compared to 0.196 µmol m⁻² s⁻¹ (P=0.012) and 2: 0.279 µmol m⁻² s⁻¹ compared to 0.197 µmol m⁻² s⁻¹ (P=0.042). The non-significant difference in Amax between varieties coupled with a significantly lower gs resulted in a trend (P=0.072) of greater WUEi in the prostrate variety in measurement leaf 1 of 77.2 µmol CO2 mol-1 H2O compared to 70.4 µmol CO2 mol-1 H2O (P=0.072) and was significantly greater for measurement leaf 2 at 86.0 µmol CO2 mol-1 H2O compared to 75.8 µmol CO2 mol-1 H2O (P=0.011). This greater WUEi was also associated with a lower Ci/Ca for measurement leaf 2 of the prostrate variety of 0.655 compared to 0.681 (P=0.012) and a similar trend for measurement leaf 1 at 0.615 compared to 0.657 (P=0.069).
3.2 Canopy temperature
Canopy temperature can increase relative to air temperature as a result of reduced stomatal aperture and lowered transpiration. Looking at the effect of water availability across the two varieties during the first drought in 2018 and 2019 and the second drought in 2019 (not the second drought in 2018 due to the cool temperatures later in the season), an increase in absolute canopy temperature was evident (Supplementary Figure S7).
In 2019 there was a variety x treatment x time interaction of canopy temperature. In the fully irrigated sugar beet the prostrate variety had a warmer canopy compared to the upright at 104, 111, 140, 147, 163, 174 and 182 DAS (P=0.003; Figure 4A). In the SD (Figure 4B) and DD (Figure 4C) treatments there were no significant differences between varieties during the first drought but during the second drought at 140 DAS the prostrate variety had a significantly warmer canopy than the upright in the DD treatment (P=0.003; Figure 4C), although both were above air temperature suggesting they had closed stomata. In the Ltd treatment the upright variety had a warmer canopy than the prostrate (P=0.003; Figure 4D), at 104, 111, 140 and 163 DAS, opposite to the observations in the fully irrigated treatment.
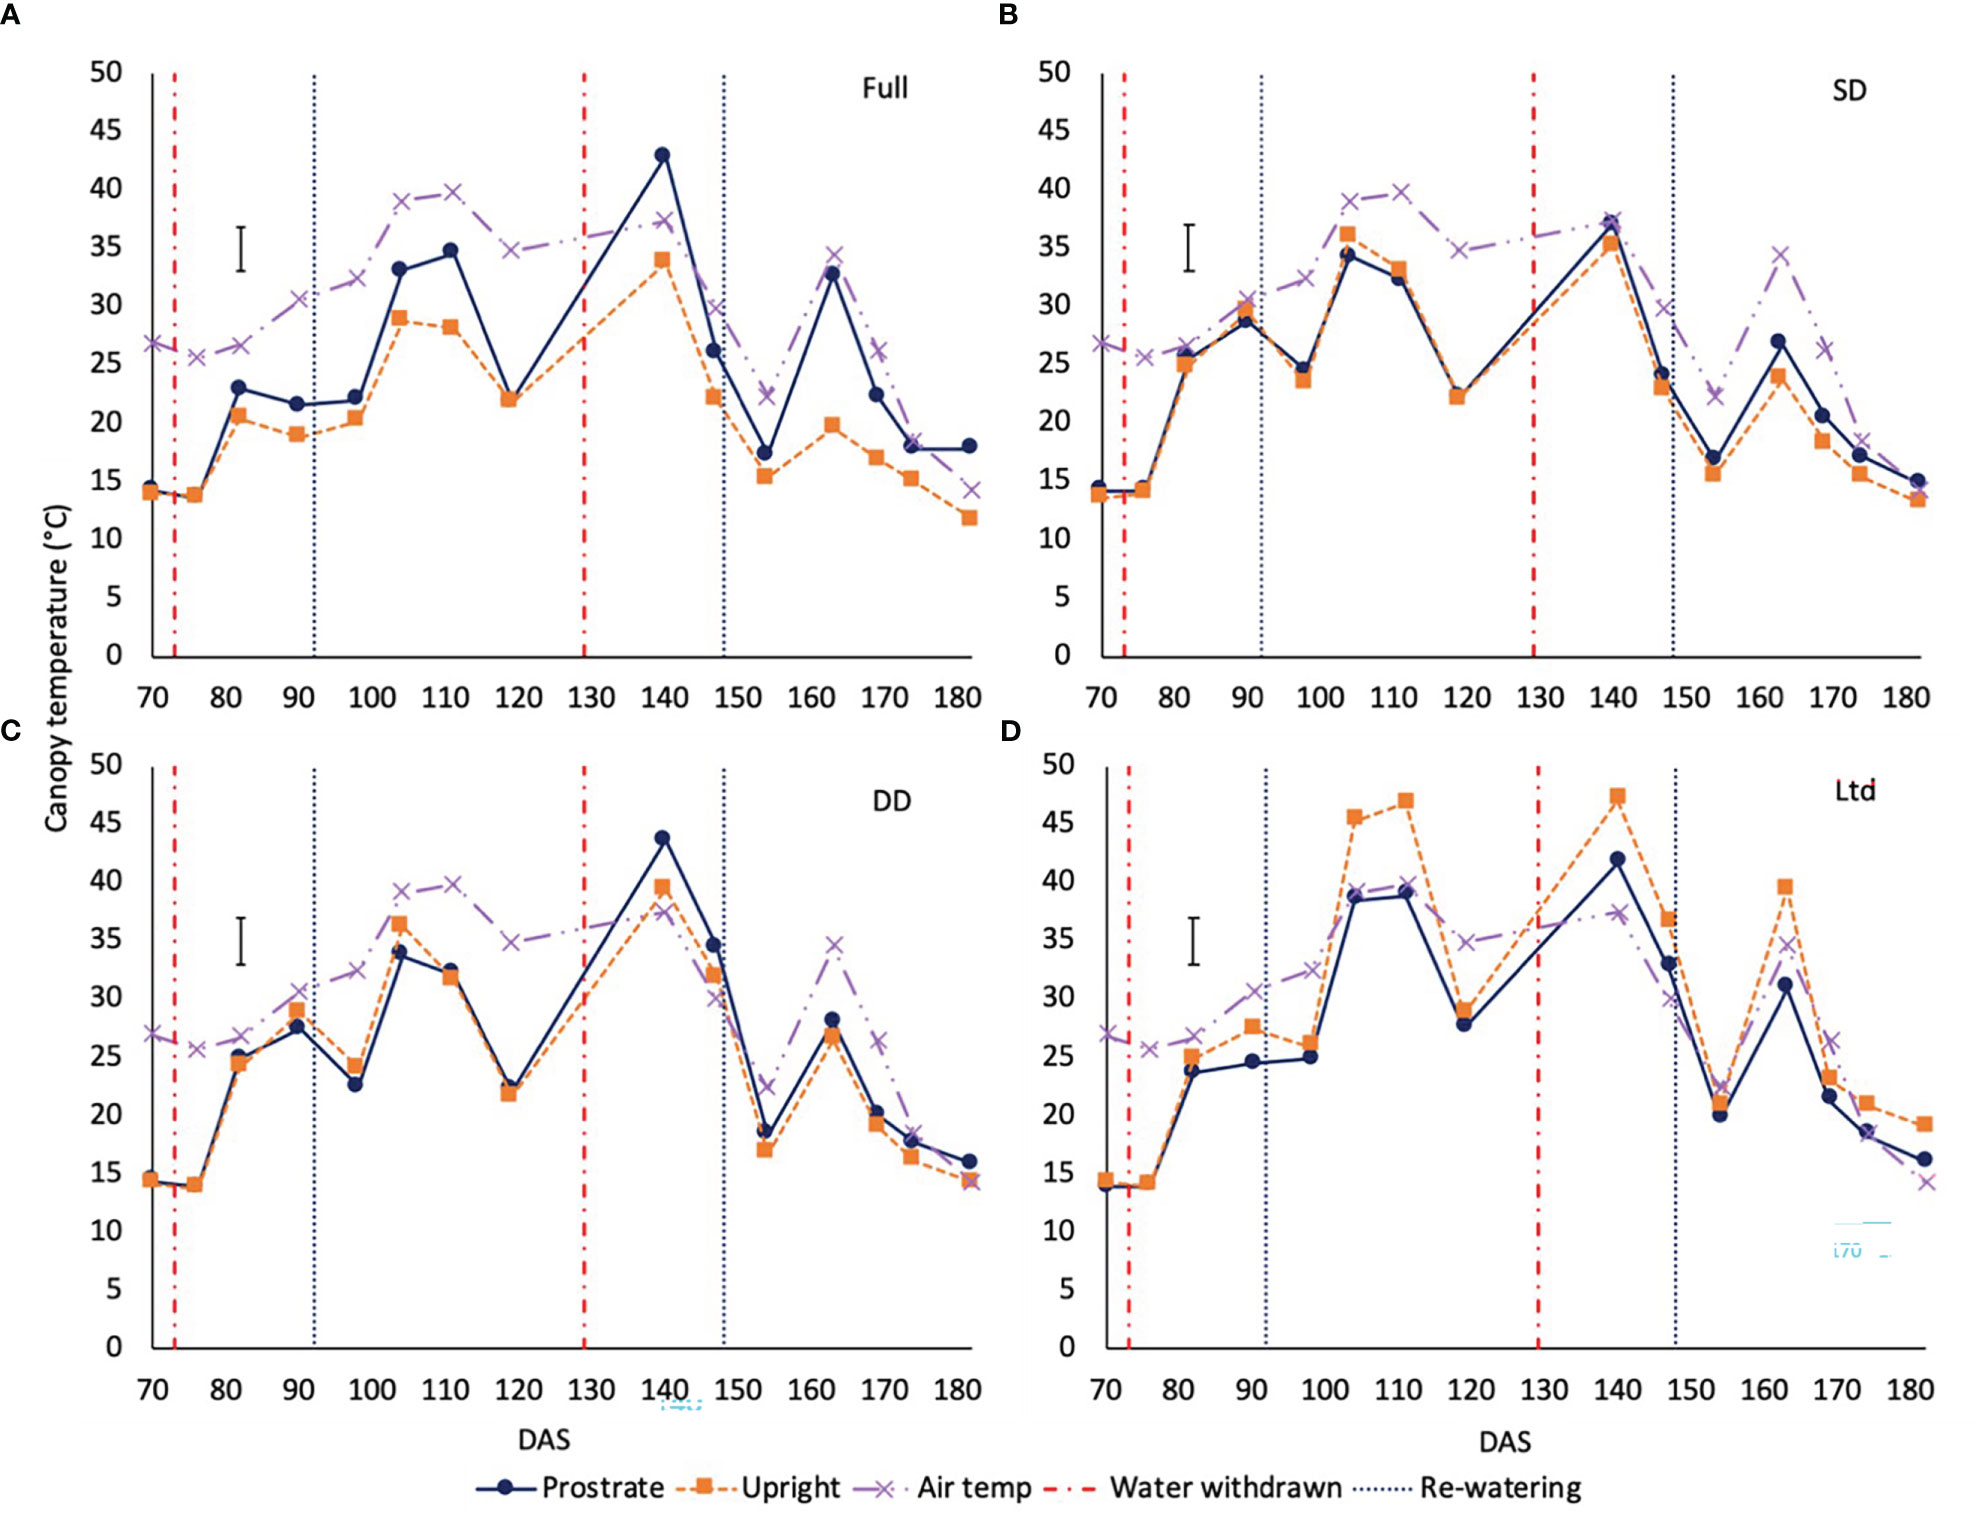
Figure 4 The canopy temperature of two sugar beet varieties with a prostrate and upright canopy grown under four different irrigation regimes. Error bars show variety x irrigation x time interaction (P=0.003 DF=42 LSD=3.88). Irrigation regimes were a fully irrigated (Full) (A), continually water limited kept at approx. 50% field capacity (Ltd) (B), a single drought (SD) (C) 73 -92 DAS and a double drought (DD) (D) which was exposed to the single drought treatment plus an additional drought 118-182 DAS.
3.3 Relative water content
RWC declined in the sugar beet under drought as water availability reduced. This was evident during the first drought in 2018 at 93 - 101 DAS with recovery by 108 DAS except in the SD which was lower than the fully irrigated but similar to the DD and Ltd treatments (P<0.001; Figure 5A). In 2019, the first drought reduced RWC from 84 – 106 DAS with recovery by 121 DAS (P<0.001; Figure 5B). The second drought had the same effect in 2019 reducing RWC from 141-148 DAS with recovery by 154 DAS (P<0.001; Figure 5A). In 2018, the late drought did not significantly reduce RWC (Figure 5B). The Ltd treatment had a lower RWC compared to the fully irrigated once VWC had declined from 101-108 DAS in 2018 (P<0.001; Figure 5A) and 84-170 DAS 2019 (P<0.001; Figure 5B). Despite the decline in VWC in the fully irrigated at 140-146 DAS in 2019 and the concurrent reduction in Amax and gs, RWC did not significantly decline.
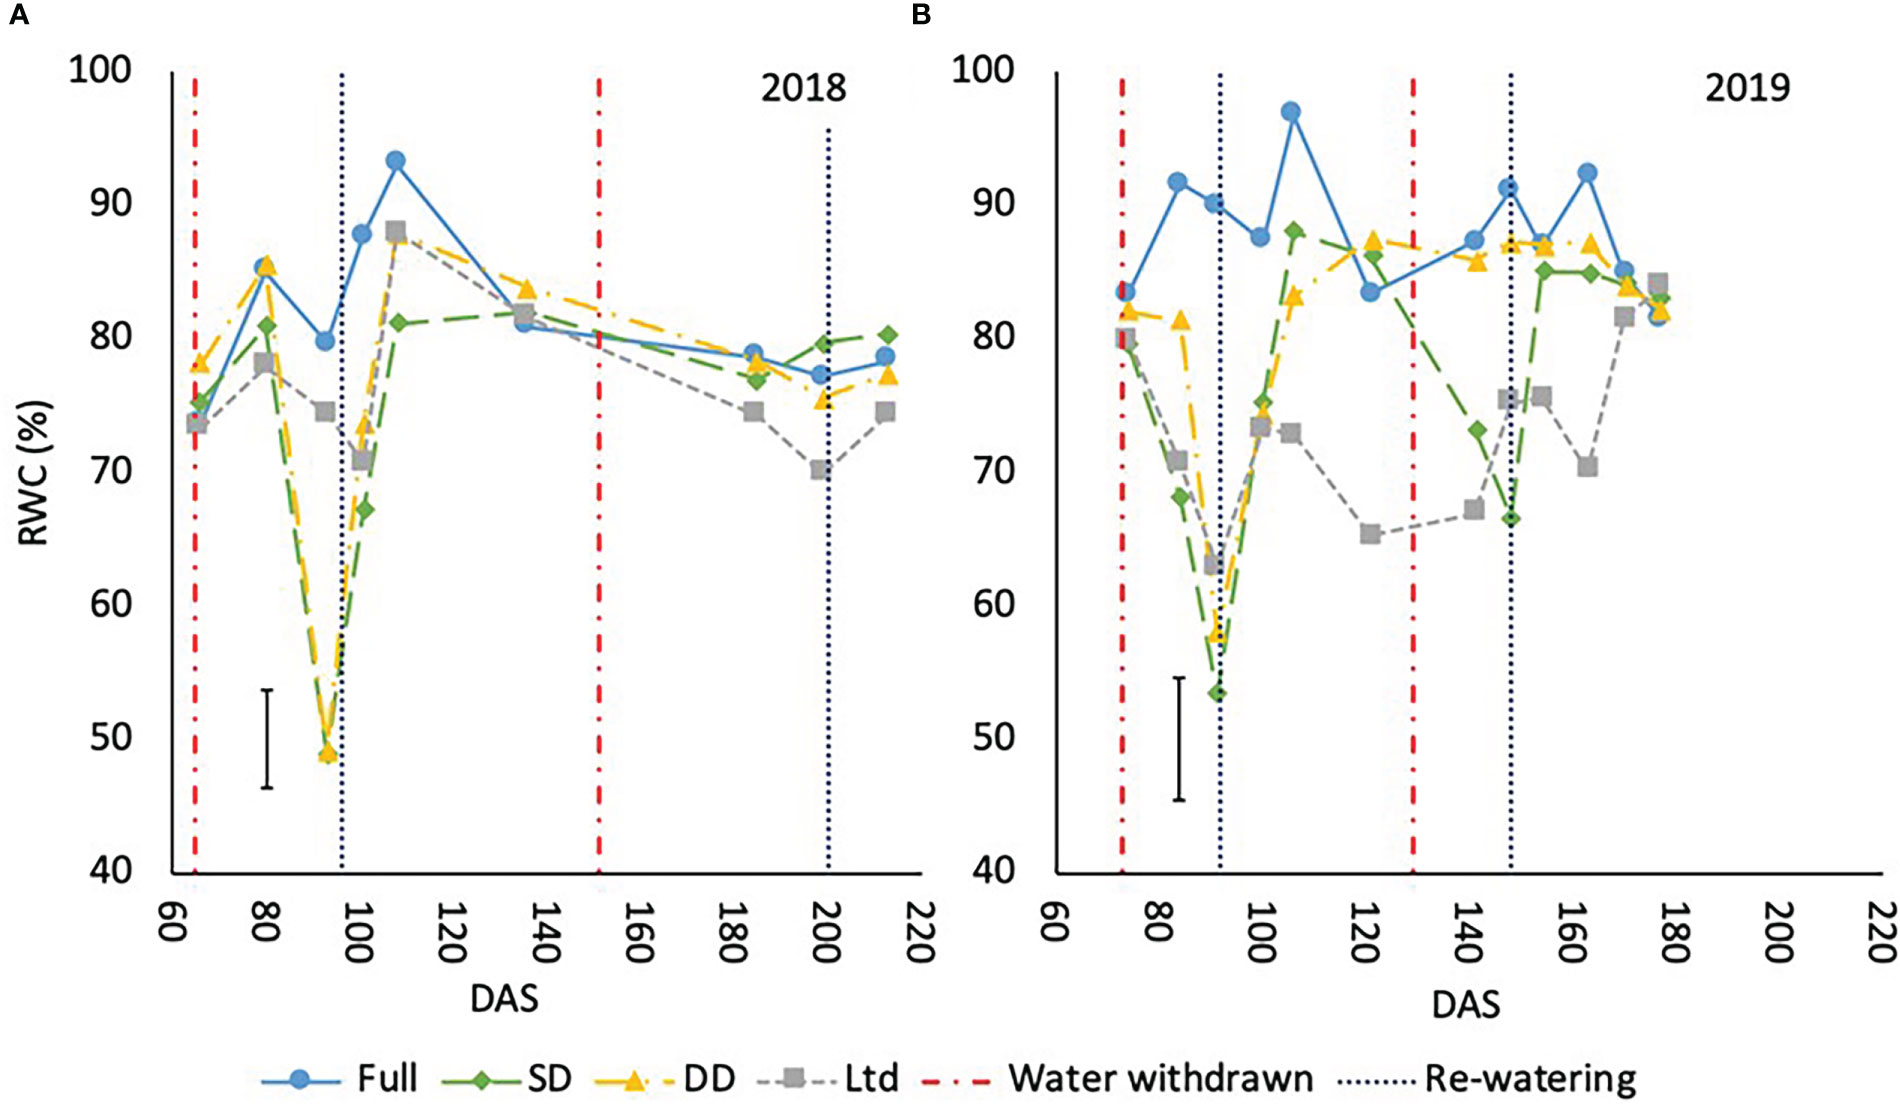
Figure 5 The relative water content (RWC) (%) of sugar beet grown under four different irrigation regimes in 2018 (A) (LSD=7.34 P<0.001) and 2019 (B) (LSD=9.16 P<0.001). Error bars shows irrigation x time LSD. Irrigation regimes were a fully irrigated (Full), a continually water limited kept at approx. 50% field capacity (Ltd), a single drought (SD) (2018 65-96 DAS and 2019 73 -92 DAS) and a double drought (DD) which was exposed to the single drought treatment plus an additional drought (2018 151-200 DAS and 2019 118-182 DAS).
The prostrate variety had a greater RWC than the upright variety when averaged across treatments in 2018 at 81.1% compared to 73.4% (P<0.001) and in 2019 84.8% compared to 75.5% (P<0.001).
3.4 Leaf chlorophyll and water content
The prostrate variety had greater total chlorophyll content on a per unit area basis in the Ltd treatment than all the other treatments, while in the upright variety, the fully irrigated and the DD had greater chlorophyll content than the SD and the Ltd (P=0.008; Figure 6A). The upright variety had greater chlorophyll content than the prostrate in the fully irrigated, SD and DD treatments whilst there was no significant difference in the Ltd treatment (P=0.008; Figure 6A). The ratio of chlorophyll a to b was not significantly different between irrigation treatments or variety. Leaf water content was also assessed to identify if this varied with chlorophyll content but the only difference was a greater water content in the prostrate variety compared to the upright in the full and Ltd, with the Ltd water content being significantly greater than that observed in any other treatment combination (P=0.016; Figure 6B).
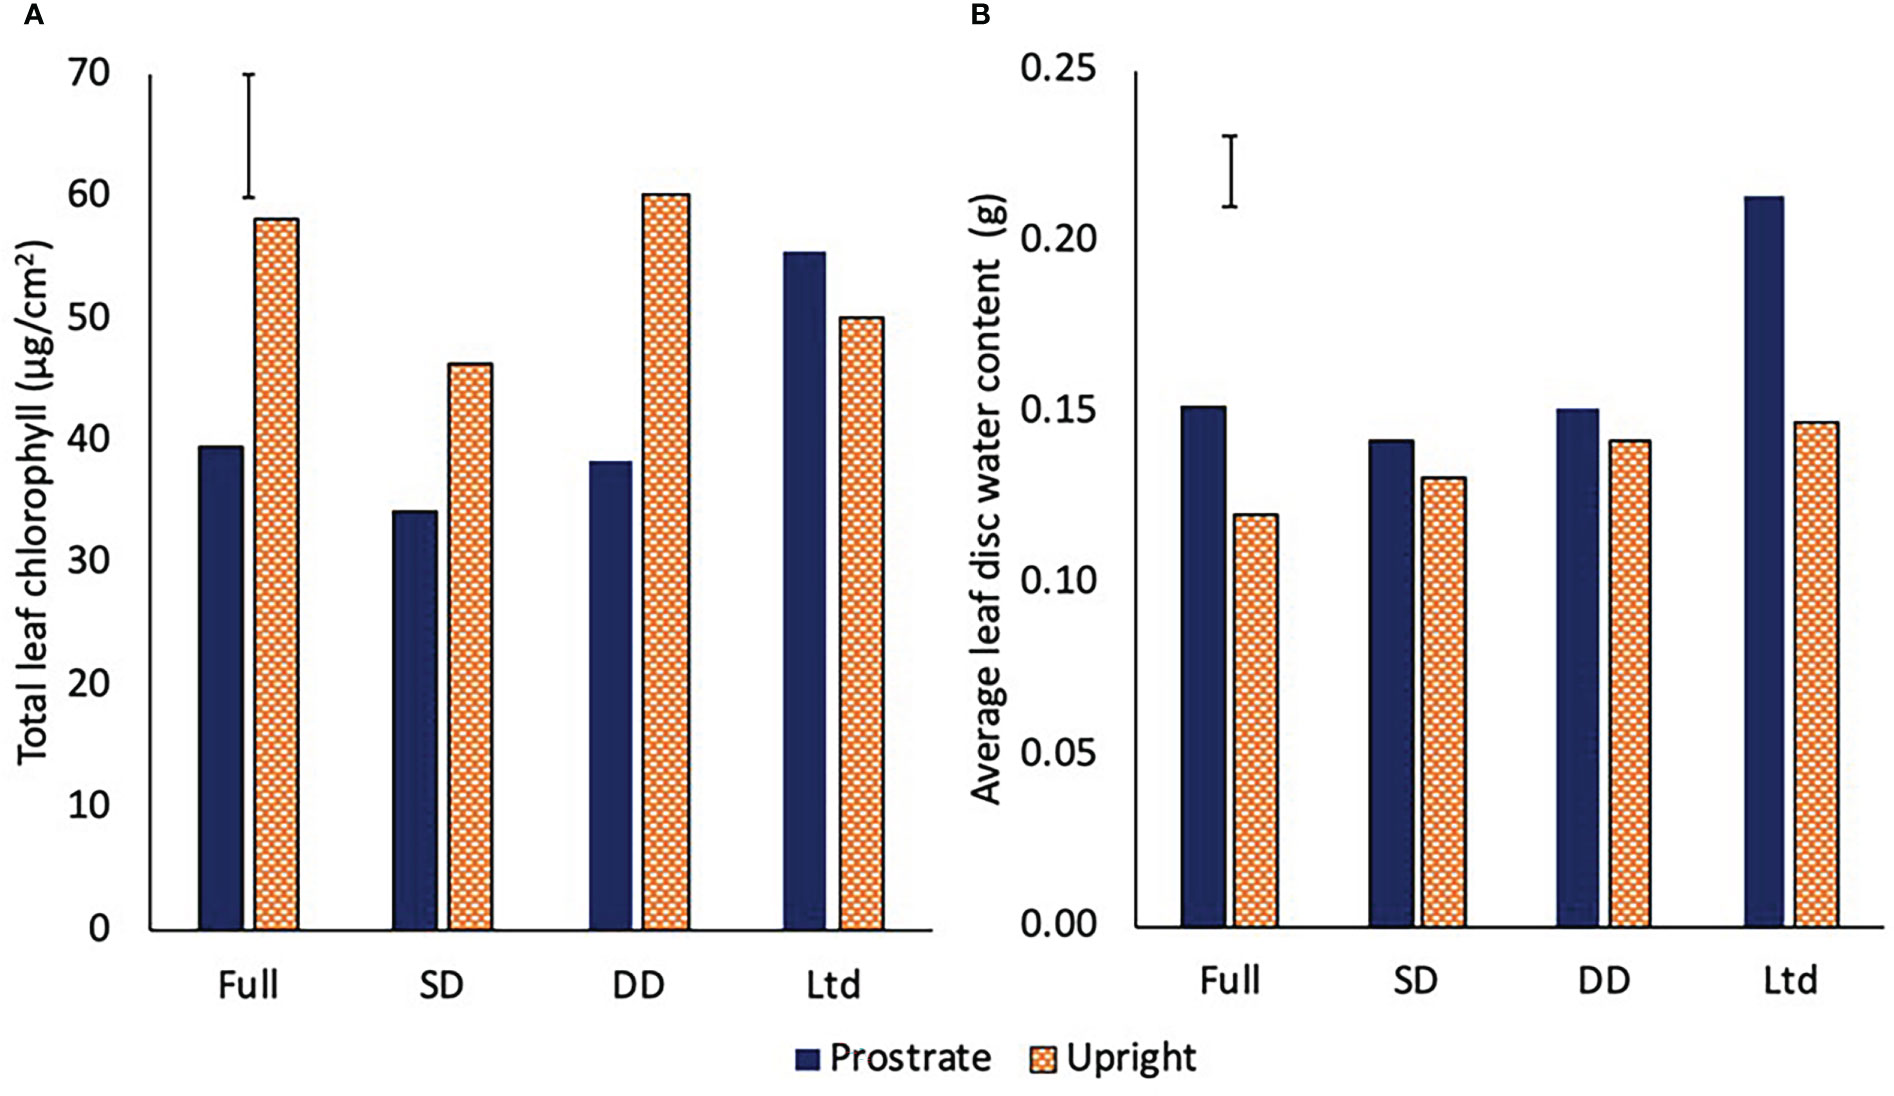
Figure 6 The total chlorophyll content (A) (P=0.008 DF=31 LSD=8.5) and leaf water content (B) (P=0.016 DF=31 LSD=0.021) of two sugar beet varieties with a prostrate and upright canopy grown under four different irrigation regimes, fully irrigated (Full), single drought (SD), double drought (DD) and continually water limited (Ltd). Error bar shows irrigation x variety LSD.
3.5 Stomatal density
The prostrate variety had a significantly lower stomatal density on both the adaxial and abaxial leaf surface in 2018 and 2019 (P<0.001; Figure 7). There was no consistent relationship between stomatal density and irrgation in either year.
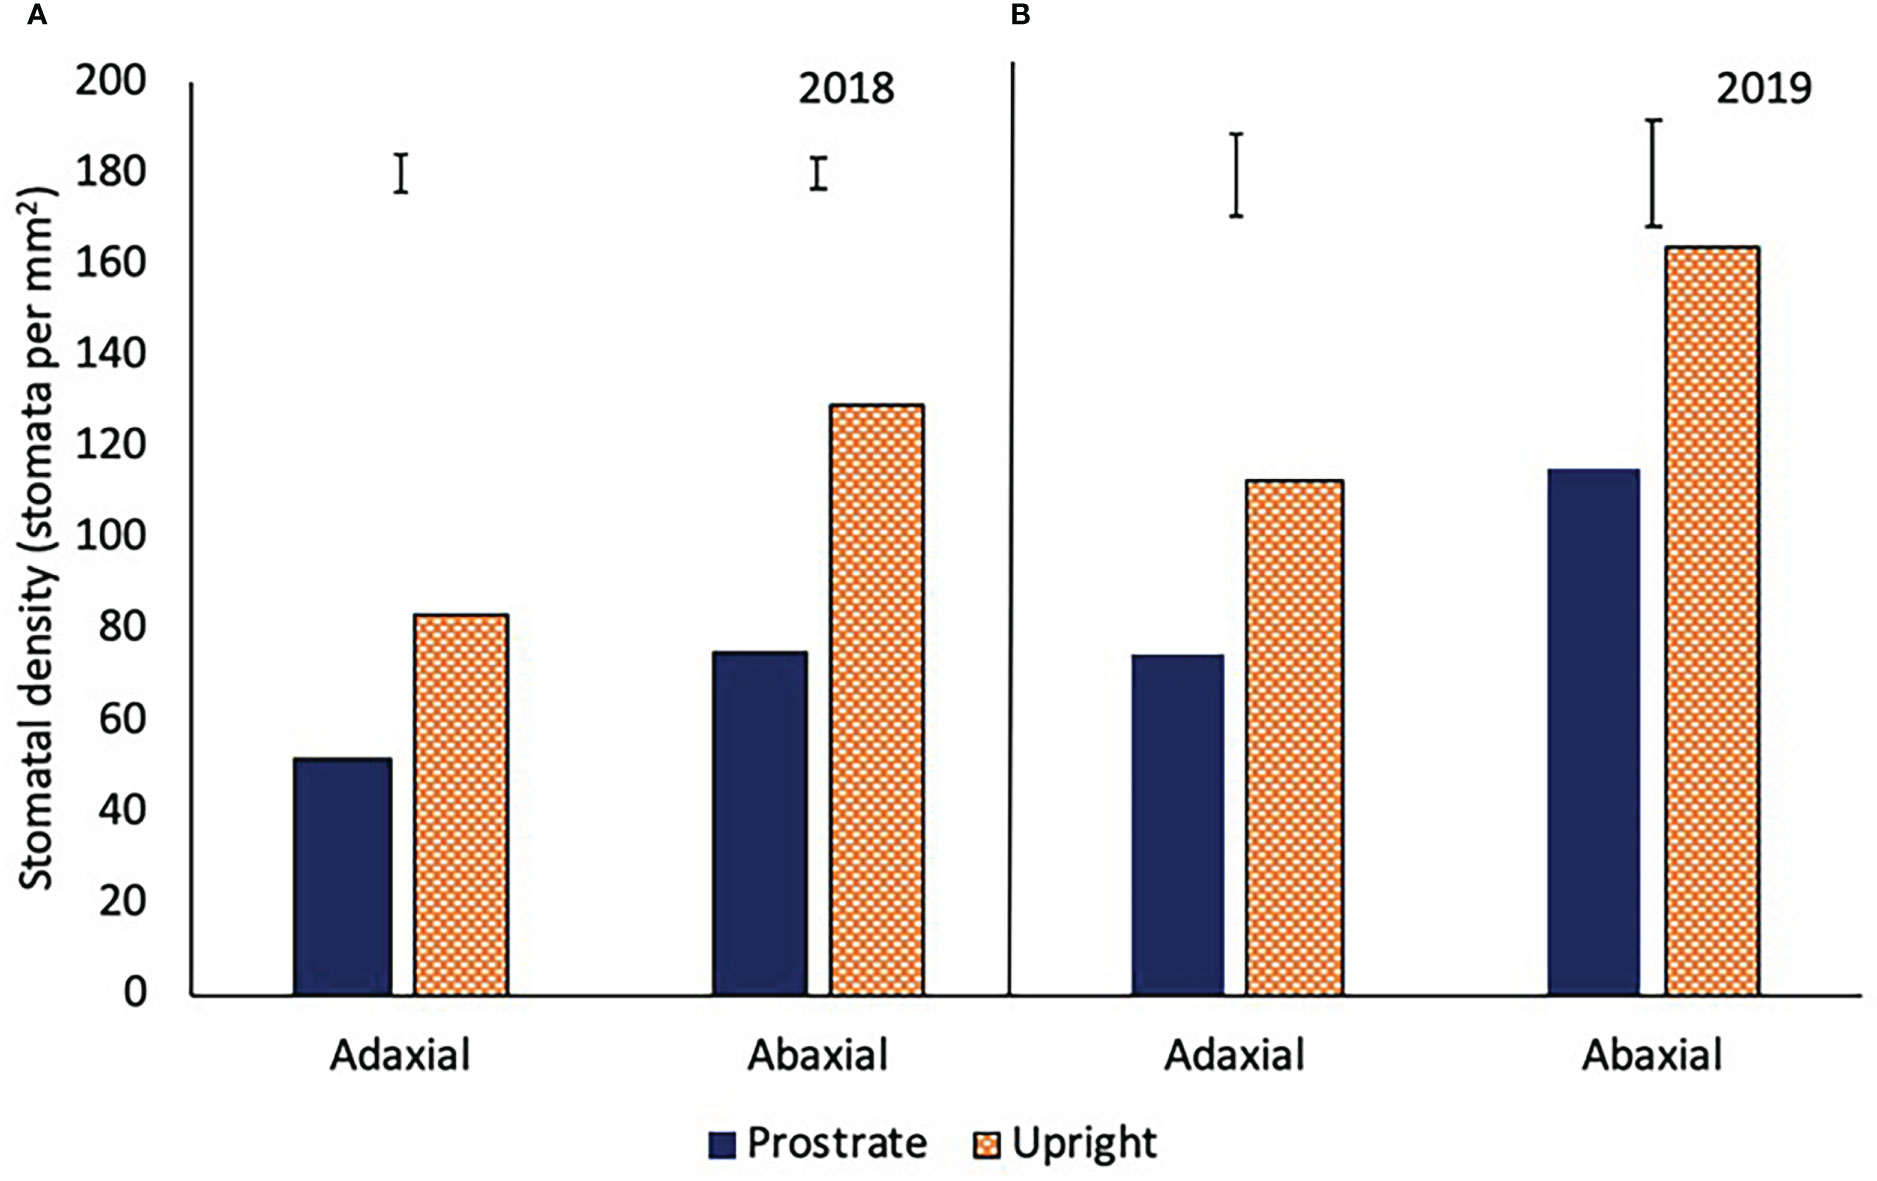
Figure 7 The stomatal density of the adaxial and abaxial leaves of two sugar beet varieties with a prostrate and upright canopy in 2018 (A) (adaxial LSD=7.7 DF=31 P<0.001, abaxial LSD=6.7 DF=31 P<0.001) and 2019 (B) (adaxial LSD=18.1 DF=31 P<0.001, abaxial LSD=23.1 DF=31 P<0.001). Sugar beet were grown under four different irrigation regimes, fully irrigated (Full), single drought (SD), double drought (DD) and continually water limited (Ltd) and averages over all the treatmetns are shown as there was no irrigation x variety interaction.
3.6 Yield and WUE of dry matter and white sugar yield and impurities
There were no varietal differences in the total dry matter or white sugar yields and the WUEDM and WUEWS so these observations were averaged across the two varieties to focus on the effect of water availability. The fully irrigated treatment had a greater total DM and WS yield in 2018 (P<0.001; Figure 8A) and 2019 (P<0.001; Figure 8B) than the other three treatments. In 2019, the Ltd treatment resulted in lower total DM and WS than the SD and DD (P<0.001; Figure 8B). In 2019 the sugar beet achieved a higher total DM and WS than 2018, except in the Ltd treatment, highlighting the differences in the crop’s growth between years.
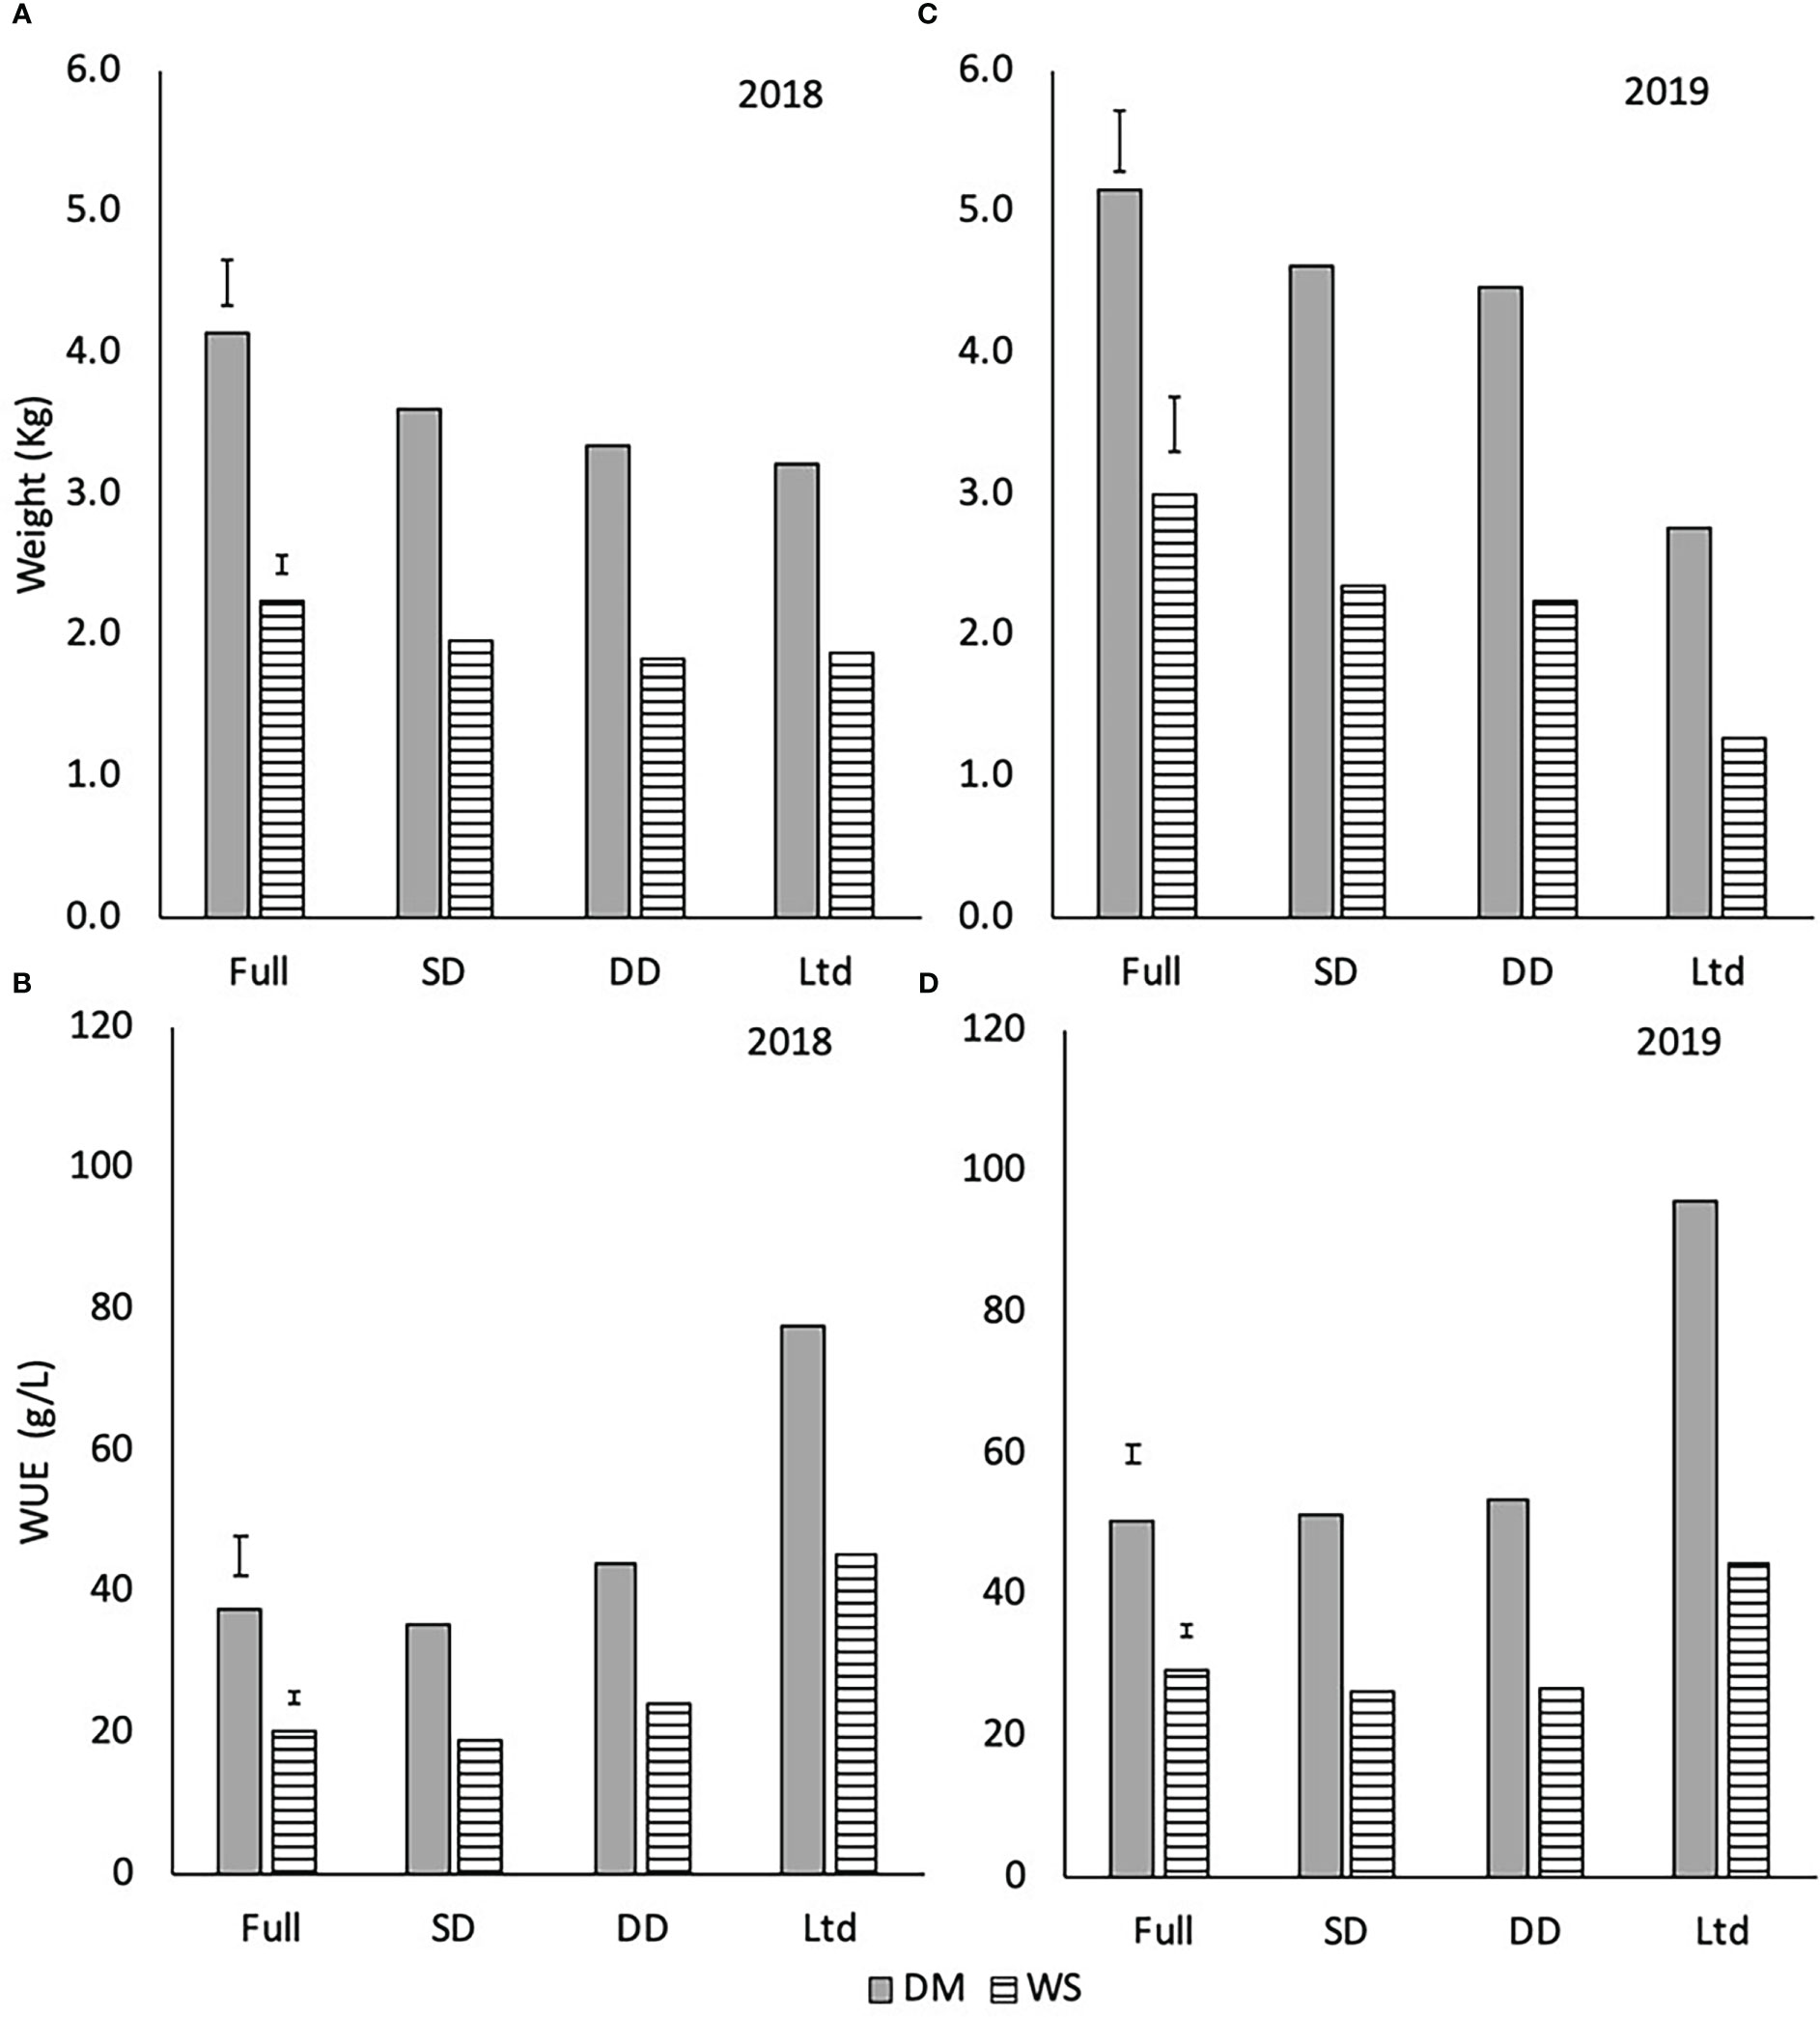
Figure 8 The amount of total dry matter (DM) and white sugar yield (WS) in 2018 (A) and 2019 (B) and dry matter water use efficiency (WUEDM) and white sugar yield water use efficiency (WUEWS) in 2018 (C) and 2019 (D) of sugar beet grown under four different irrigation regimes. (A) 2018 weights (DM LSD=0.322 DF=31 P<0.001 and WS LSD=0.142 DF=31 P<0.001). (B) 2019 weights (DM LSD=0.222 DF=31 P<0.001 and WS LSD=0.192 DF=31 P<0.001). (C) 2018 WUE (WUEDM LSD=5.76 DF=31 P<0.001 and WUEWS LSD=1.78 DF=31 P<0.001). (D) 2019 WUE (WUEDM LSD=2.52 DF=31 P<0.001, WUEWS LSD=2.09 DF=31 P<0.001). Error bars show irrigation LSD. Irrigation regimes were a fully irrigated (Full), a continually water limited kept at approx. 50% field capacity (Ltd), a single drought (SD) (2018 65-96 DAS and 2019 73 -92 DAS) and a double drought (DD) which was exposed to the single drought treatment plus an additional drought (2018 151-200 DAS and 2019 118-182 DAS).
The WUEDM and WUEWS was higher in the Ltd treatment than the other three treatments and nearly double that of the fully irrigated and SD treatments in 2018 (P<0.001; Figure 8C). The DD had a higher WUEDM and WUEWS compared with the fully irrigated and SD in 2018 (P<0.001; Figure 8C), despite having a similar total DM and WS. In 2019, the WUEDM of the Ltd treatment was higher than the other three treatments (Figure 8D; P<0.001). The WUEDM of the fully irrigated, SD and DD were similar but the WUEWS in the SD and DD was lower than the fully irrigated (Figure 8D; P<0.001). Overall, the extreme water deficit of the Ltd treatment increased WUE but the SD and DD treatments had inconsistent effects.
There were no differences in impurities (K, Na and AN) between the irrigation treatments in 2018. In 2019 impurities significantly increased in the SD, DD and Ltd treatments compared to the irrigated control (Supplementary Figure S8). The SD and DD had similar levels of K whilst NA was significantly (P<0.001) higher in the DD treatment than the SD and Ltd treatments. AN levels increased with declining water availability. There were also differences in impurities between the varieties (Supplementary Figure S9) with the upright variety having significantly higher K (P<0.001) and Na (P<0.001) than the prostrate whilst AN levels were similar.
3.7 Carbon 13 isotope discrimination
Δ13C was negatively related to the average WUEi (P<0.001; Figure 9A), WUEDM (P=0.001) (Figure 9B) and WUEWS (P=0.004) (Figure 9C).
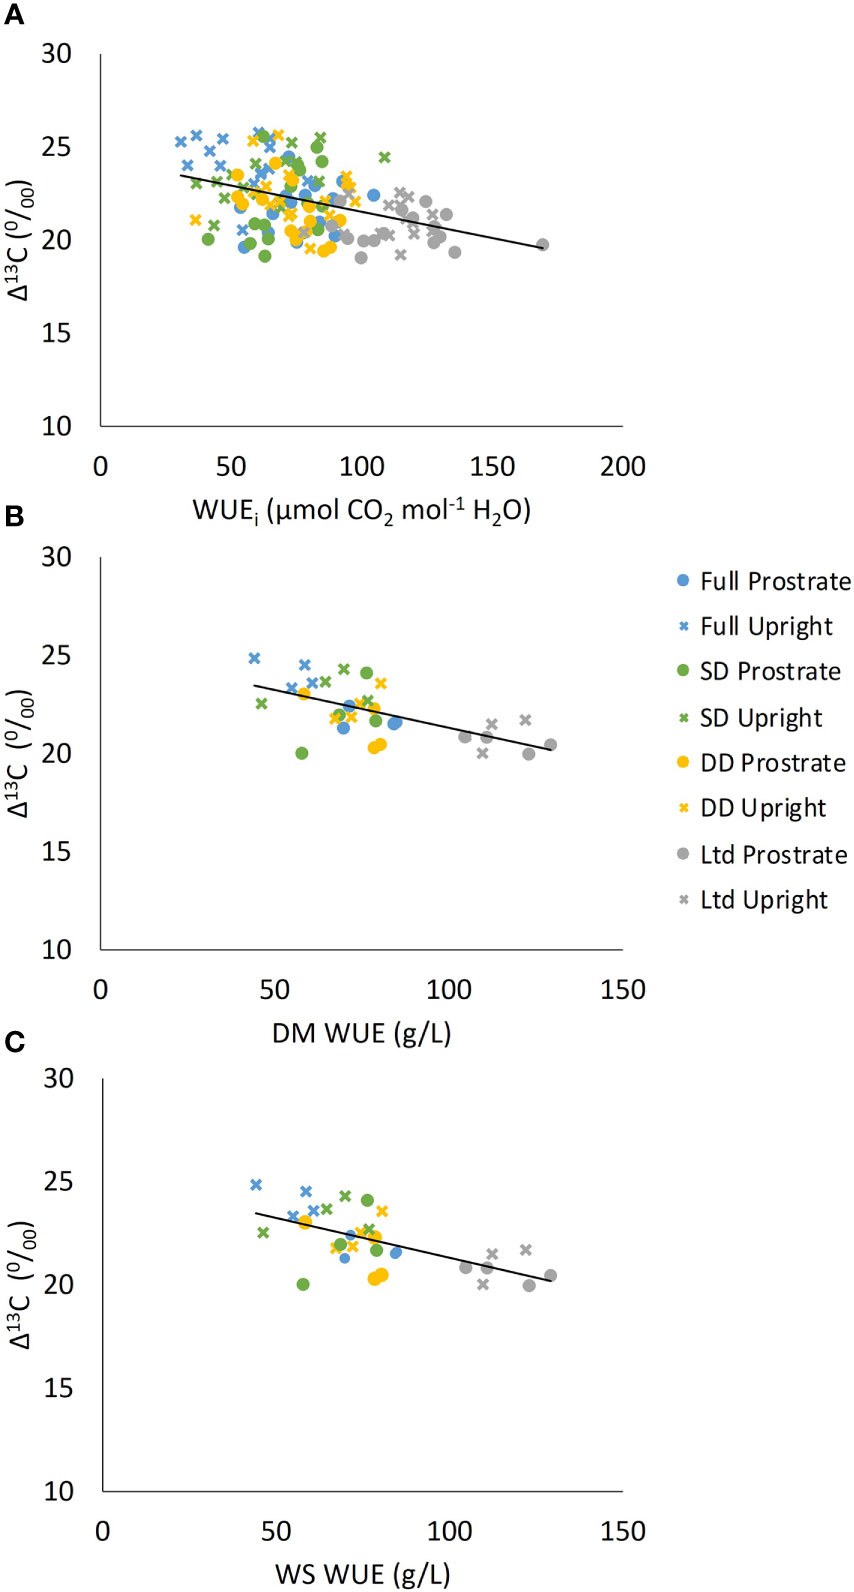
Figure 9 The relationship between carbon isotope discrimination (Δ13C) and (A) intrinsic water use efficiency (WUEi) (P<0.001 R2 = 0.17), (B) Dry matter water use efficiency (WUEDM) (P=0.001 R2 = 0.30) and (C) White sugar yield water use efficiency (WUEWS) (P=0.004 R2 = 0.24). Two sugar beet varieties were grown under four different irrigation regimes and are plotted as one data set but presented so that the different varieties and treatments can be identified.
Water deficit reduced Δ13C indicating increased WUEi. The Δ13C of measurement leaf 2, which was fully expanded at 118 DAS; before the second drought, was similar in the fully irrigated and SD treatments, with the DD lower, but not significantly (Figure 10A). The Ltd treatment had a lower Δ13C than the fully irrigated and SD but was not different to the DD treatment (Figure 10A; P=0.016).
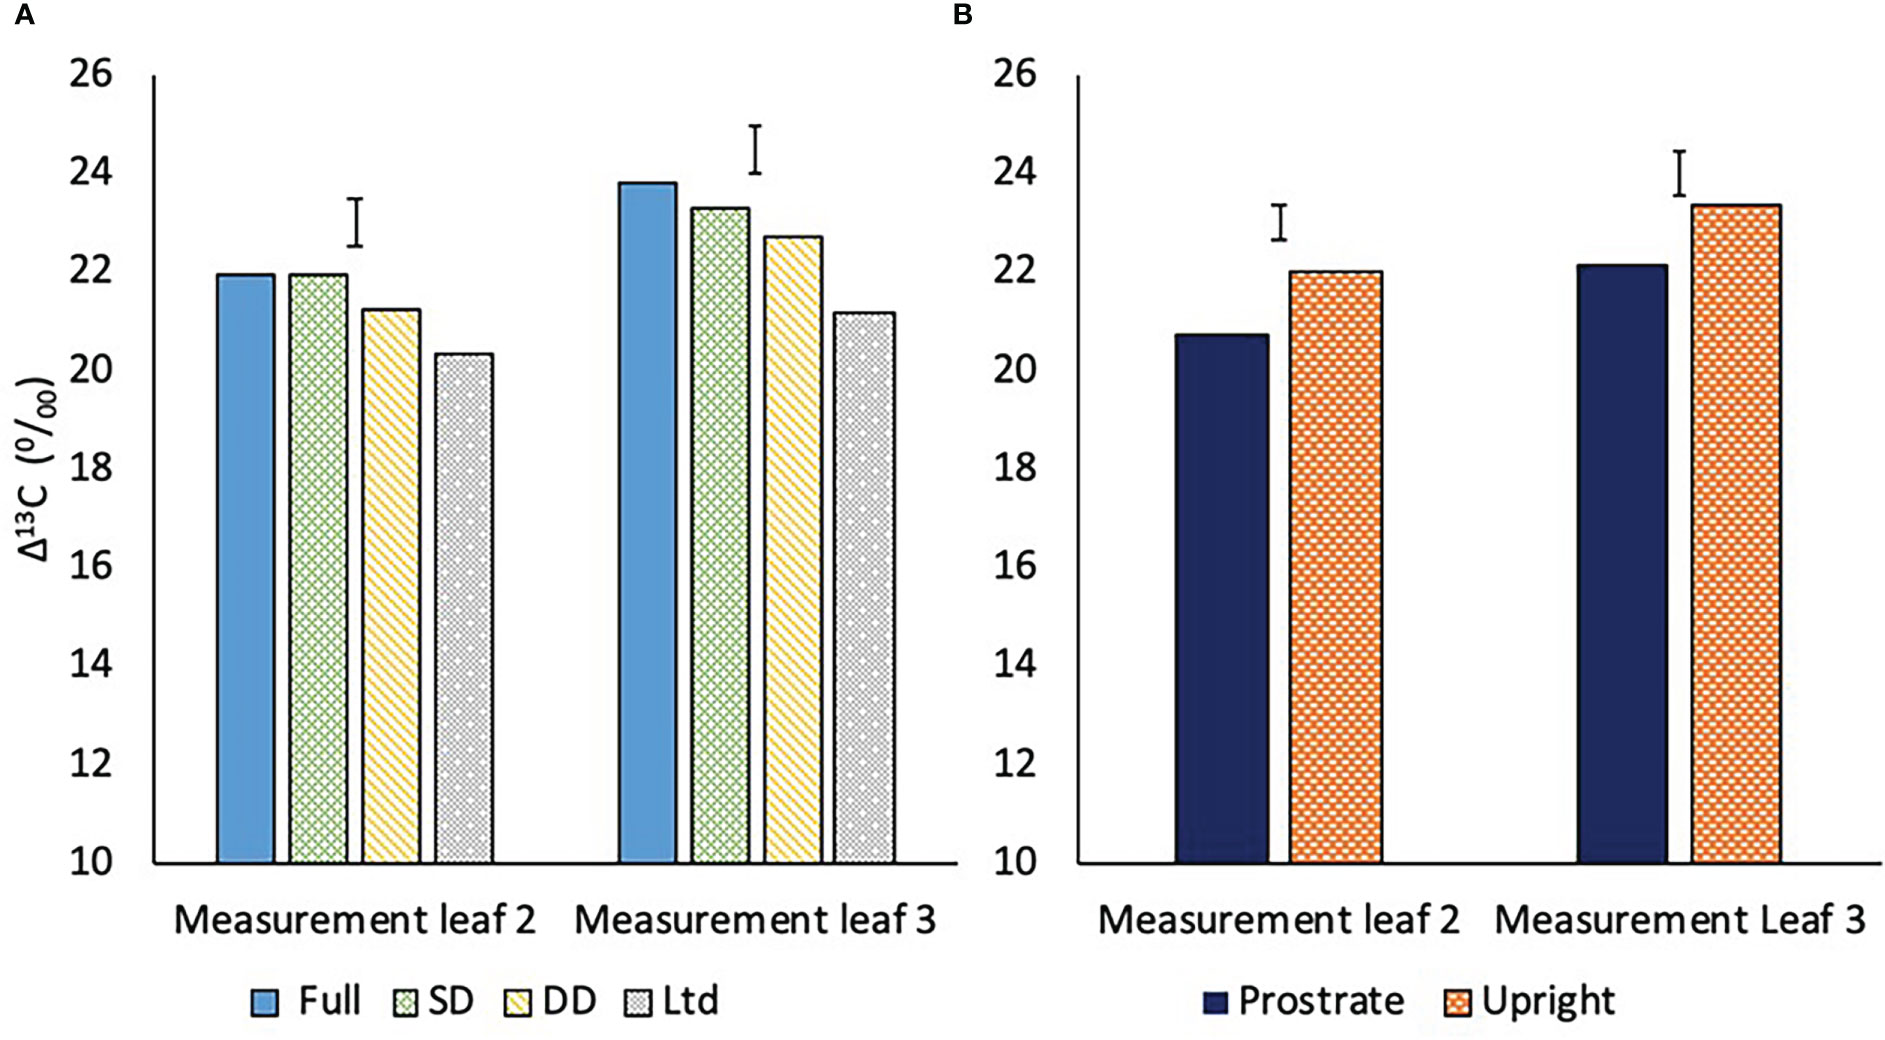
Figure 10 (A) The carbon isotope discrimination (Δ13C) of two measurement leaves of sugar beet grown under four different irrigation regimes, fully irrigated (Full), single drought (SD), double drought (DD) and continually water limited (Ltd). Error bar shows irrigation LSD of measurement leaf 2 (P=0.016 DF=31 LSD=0.975) and measurement leaf 3 (P=0.001 DF=31 LSD=0.984). (B) The Δ13C of two sugar beet varieties with a prostrate and upright canopy averaged across four watering regimes. Error bar shows variety LSD of measurement leaf 2 (P=0.001 DF=31 LSD=0.701) and measurement leaf 3 (P=0.012 DF=31 LSD=0.909).
Measurement leaf 3 was fully expanded at 162 DAS; after the second drought, with Δ13C generally higher than in measurement leaf 2 (Figure 10A). This can be attributed to younger leaves being more active with higher transpiration, as shown by the gas exchange measurements, resulting in reduced WUEi. The Δ13C of measurement leaf 3 was lower in the DD than the fully irrigated and the difference was significant, unlike in measurement leaf 2, showing that water deficit was reducing Δ13C and hence increasing WUEi at a greater magnitude in younger than older leaves (Figure 10A; P=0.016). The SD remained similar to the fully irrigated and the Ltd treatment Δ13C was lower than the fully irrigated and SD but not the DD (Figure 10A; P=0.016).
Averaged across the watering regimes, the prostrate variety had a lower Δ13C than the upright in both measurement leaf 2 (P=0.001) and measurement leaf 3 (P=0.012) (Figure 10B).
3.8 Specific leaf weight
Δ13C was negatively related to SLW (P=0.001; Figure 11A). There was no significant difference in SLW between the varieties but high levels of water deficit increased SLW with the DD having a greater SLW than the fully irrigated and SD (P=0.016; Figure 11B). The SLW of the Ltd treatment was almost double the next nearest SLW value in the DD.
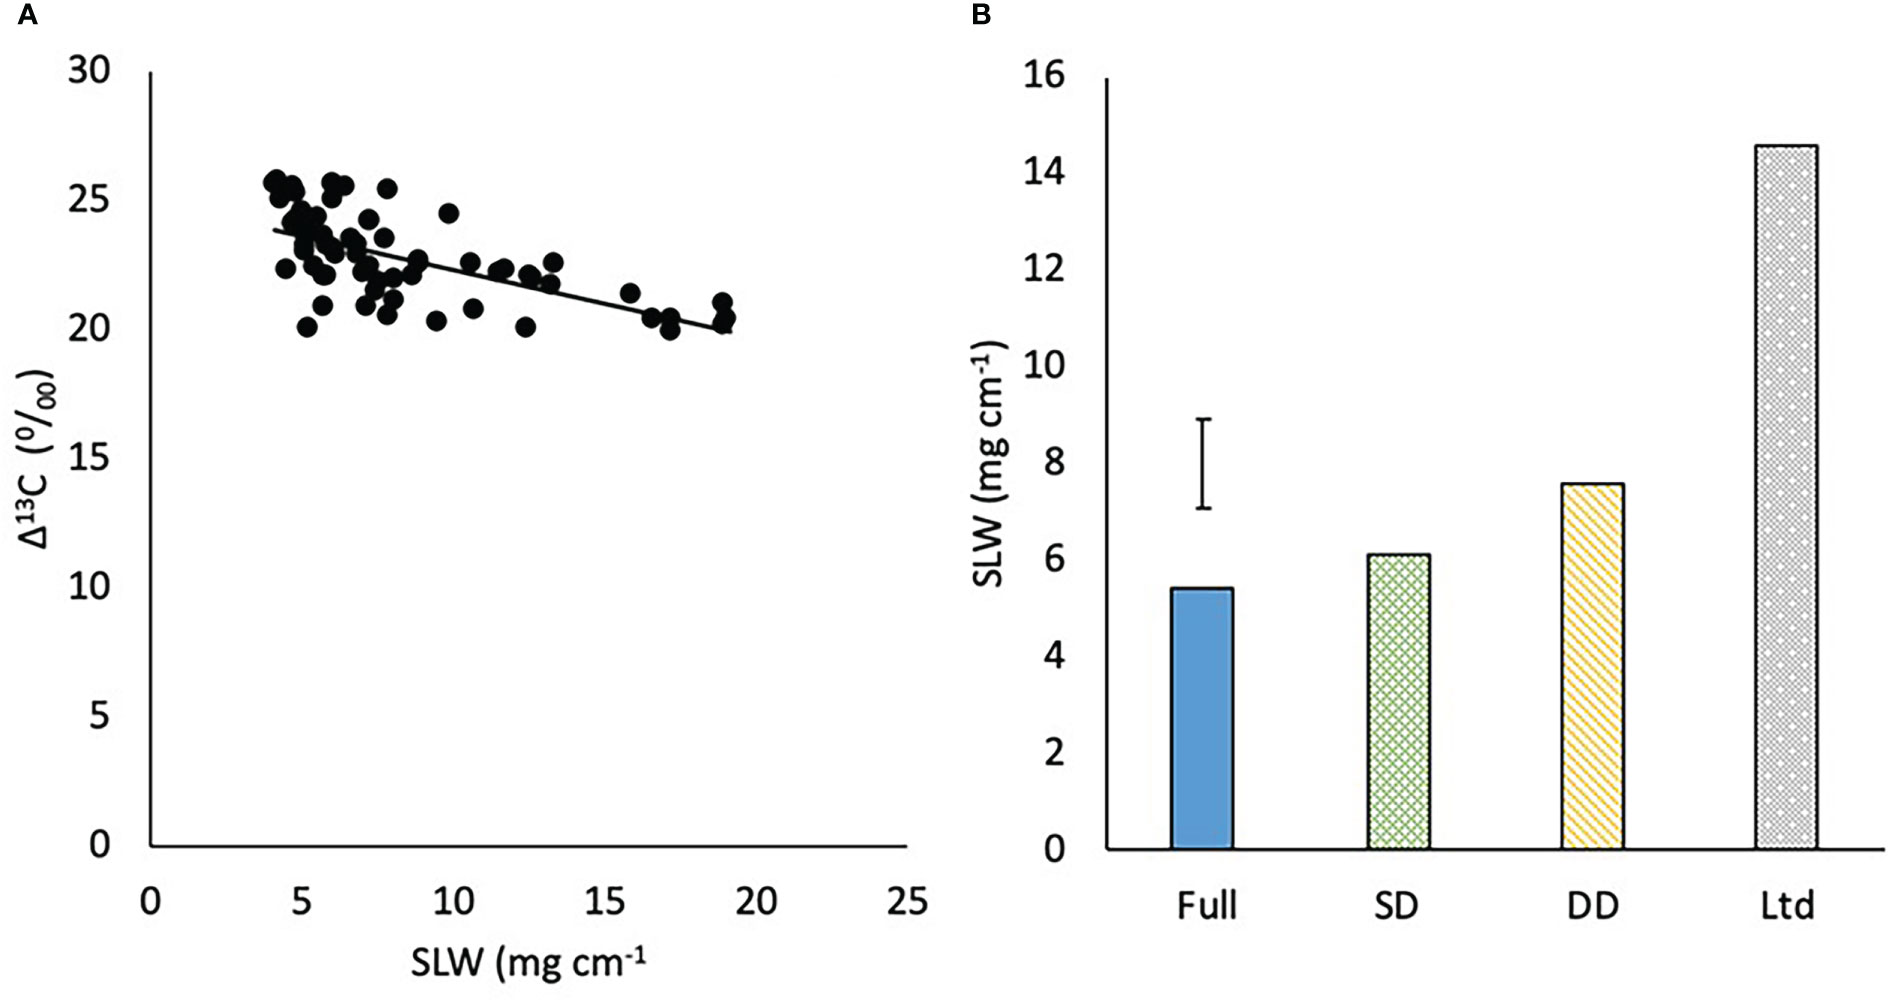
Figure 11 (A) The relationship between carbon isotope discrimination (Δ13C) and specific leaf weight (SLW) (P<0.001 R2 = 0.41) and (B) the specific leaf weight (SLW) of sugar beet grown under four different irrigation regimes, fully irrigated (Full), single drought (SD), double drought (DD) and continually water limited (Ltd). Error bar shows irrigation LSD (P=0.016 DF=31 LSD=1.83).
4 Discussion
The relationship between Δ13C, dry matter accumulation and WUEDM has previously been evidenced in sugar beet in response to drought (Rytter, 2005; Bloch et al., 2006). The difference between the levels of Δ13C in dry matter and soluble sugars (Monti et al., 2006) and leaf and root tissue (Bloch et al., 2006) have also been compared. However, this is the first time a difference in Δ13C has been identified in commercial sugar beet varieties and the relationship between WS yield and Δ13C demonstrated. Differences in WUEi between the varieties were not consistently observed in the spot measurements but Δ13C provides a measure of WUEi over a prolonged period of time so is a more reliable measure (Mairata et al., 2022). This shows that the objective of developing sugar beet varieties that are more efficient in their water use, without detriment to yield, is viable. The underlying plant metabolism and regulatory mechanisms were not studied and could be explored in a further study. This is because this study was aimed at producing information for breeders who use physiological traits for selection of sugar beet breeding lines in the field.
4.1 How is WUE affected by fluctuations in soil water availability in sugar beet?
Increased WUEi under water deficit, as evident in our results, has been shown previously in sugar beet (Bloch et al., 2006; Rinaldi and Vonella, 2006; Fitters et al., 2018). As the water deficit increased the stomata began to close to conserve water and gs declined with the reduction in transpiration causing an increased canopy temperature (Baker et al., 2007). The reduction in stomatal aperture also reduced Ci/Ca which is associated with a greater WUEi. This in turn is related to a lower Δ13C as the CO2 in the sub stomatal cavity is not replenished as readily leading to greater a proportion of 13C being fixed, thereby lowering the ratio of 13C to 12C (Seibt et al., 2008). There were two exceptions to this observation. Firstly in 2019 the fully irrigated, SD and DD had similar WUEDM but the fully irrigated had a higher WUEWS. This suggests that water deficit did not alter the relationship between DM accumulation and water use but reduced the proportion of the DM partitioned to sugar in the root. It has previously been identified that under drought phloem loading can be reduced, lowering the amount of sugar in the root but not in the plant overall (Mäck and Hoffmann, 2006). Secondly WUEi was reduced compared to the fully irrigated in the Ltd treatment of the first measurement leaf in 2019 whilst it was generally higher in all other observations. Across the same time period as the reduced WUEi the Ltd treatment also showed a greater Ci/Ca ratio, whilst Amax and gs were close to zero. An increase in Ci has been observed in extreme cases of water deficit previously and is driven by an increase in non-stomatal limitations to photosynthesis (Flexas and Medrano, 2002).
The measured gas exchange parameters recovered after drought, but only partially, due to the underlying leaf age related decline. Leaves respond differently to heat stress depending on age, with younger leaves showing responses of a greater magnitude compared to older leaves (Marias et al., 2017). This occurs because shading of older leaves drives reallocation of Nitrogen from Rubisco to light harvesting proteins reducing the maximum photosynthetic rate (Sims and Pearcy, 1991). However, when looking at the overlap of measurement leaf 1 and 2 from 105-133 DAS in 2018 it is evident that measurement leaf 1 reflected the trend of the response in measurement leaf 2 but not the magnitude. This means that, despite the overall decline in leaf activity with age, they still provided a reliable measure of the onset of drought and the subsequent recovery.
4.2 Does sugar beet acclimate to water deficit by increasing WUE?
Both sugar beet varieties responded similarly to the first and second drought, suggesting the crop did not acclimate to avoid or better cope with water deficit. This has also been observed in glasshouse studies where sugar beet was exposed to three temporary water deficits but no acclimation was evident in photosynthetic or biochemical responses (Leufen et al., 2016; Ebmeyer and Hoffmann, 2022). This recovery is mediated by a range of physiological and biochemical mechanisms. How these interact to enable plant survival and recovery under drought stress is not clear and requires further study (Chaves et al., 2009). The maritime ancestry of sugar beet (Ribeiro et al., 2016) may be a driver of this with the plants showing drought tolerance (Dunham, 1993) and the photosynthetic apparatus being able to withstand severe water deficit and recover rapidly (Monti et al., 2006). This resilience is partly driven by the accumulation of K, Na and AN, as observed in 2019, to maintain osmotic potential for longer to ensure cell function. This means there is no need to avoid a decline in leaf RWC, as the plant can continue to photosynthesize until the most severe levels of drought. Even then no long-term damage occurs to the PSII, as shown by the recovery of the Fv’/Fm’, ΦPSII and qp values which returned to levels similar to the fully irrigated once re watered. However, the recovery of maximum PSII efficiency in the light, and Amax, was not immediate and may have contributed to the reduced DM accumulation in the droughted treatments as evidenced in sugar beet by Bloch et al. (2006). It has been suggested that measuring photosynthetic induction coupled with Amax provides better data on photosynthesis and would have been a valuable approach in this study. This is because induction can provide a performance in the field under fluctuating light regimes whereas Amax is not always as sensitive to drought stress, especially during recovery (Sakoda et al., 2022).
The lack of acclimation from the first drought was also reflected in the decline in WUEi and increase in Ci/Ca as the sugar beet opened stomata and began to reach similar levels of gs and Amax to the fully irrigated treatment. The rapid recovery of leaf RWC, which recovered faster than PSII and leaf gas exchange, helps drive this recovery by ensuring the leaf has optimal conditions for photosynthesis (Lawlor, 2002), with the rapid recovery of RWC over daily cycles previously observed in sugar beet (Geiger et al., 1991). Not only was this recovery evident in these short-term measurements but also in the Δ13C results where the SD leaves showed no difference compared to the fully irrigated treatment and therefore no long-term change in WUEi.
Water deficit has been shown to alter the stomatal density of leaves which develop under drought (Xu and Zhou, 2008; Sun et al., 2014). There were no consistent changes in stomatal density highlighting further that sugar beet physiology changes little under water deficit. There is an exception to this which is the reduction in plant biomass which appears to have resulted in the crop having a reduced demand for water, likely due to a reduction in canopy size. Canopy size was not measured but water deficit has been shown to reduce leaf area in sugar beet (Fitters et al., 2017) which results in reduced radiation interception and DM accumulation (Brown et al., 1987). This was evidenced by the reduction in VWC in the fully irrigated treatment at 140 DAS which the SD did not encounter despite receiving the same amount of irrigation. This seems to have been beneficial under a slight water deficit but did not alter the response to the severe second drought in 2019. In the late second drought in 2018, the slight decline in Amax and gs was not reflected in any other parameter and shows how late season drought can be hard to detect as the forces driving transpiration are reduced.
4.3 Are there differences in WUE between commercial sugar beet varieties with contrasting canopy architecture, and if so, is this related to stomatal morphology and leaf traits such as SLW and RWC?
The difference in Δ13C and associated traits between the two varieties supports the findings of Ober et al. (2004); Ober et al. (2005) that there is variation in traits associated with drought tolerance and water use in sugar beet, despite suggestions that sugar beet varieties lack diverse traits due to being derived from a single population (Davis, 2006). The varieties also differed in leaf physiology, but it is not clear if this can be attributed to the differences in canopy architecture and requires further study with more varieties.
The traits identified differing between the varieties suggest that the prostrate variety is more conservative in its use of water. The greater RWC is linked with more drought resistant phenotypes as a greater RWC can enable plants to function for longer under water deficit (Xu et al., 2000). Ober et al. (2005) did not find RWC to be linked to DTI but leaf succulence was. This suggests there is a relationship between the water content of leaves and drought tolerance, which this study has further shown to be linked to a greater WUEi. RWC did not reduce the rate of carbon uptake and assimilation as has been observed in wheat (Farquhar et al., 1980). This is supported by the observation that RWC is not the driver for reduced Rubisco activity and that reduced CO2 concentrations in the chloroplast due to reduced stomatal conductance have a greater regulatory effect (Flexas et al., 2006). This shows that stomata have an important role to play in plant carbon dynamics and therefore WUE.
The lower stomatal density in the prostrate variety may be associated with WUEi but complex interactions between stomatal density and size and the speed of stomatal response means that the relationship between stomatal density and water use is debated. In potatoes a higher stomatal density, which developed under drought, led to a greater Δ13C and WUEi (Sun et al., 2014) and it has been suggested the smaller stomata are faster to close and reduce transpiration and increase WUEi (Drake et al., 2013; Barratt et al., 2021). However, in Arabidopsis a lower stomatal density was associated with reduced susceptibility to water deficit (Doheny-Adams et al., 2012), which could explain why the prostrate variety had a cooler canopy than the upright under extreme water deficit (Ltd treatment).
The difference in stomatal traits could be driven by the differences in canopy architecture. This is because the leaves of the upright variety are less shaded and intercept more light on the abaxial surface. This can result in a greater number of stomata on the abaxial surface of the upright variety to optimize CO2 uptake for photosynthesis (Harrison et al., 2020). This is supported by a study that used the same sugar beet varieties which showed that the upright sugar beet variety has a greater RUE than the prostrate (Tillier et al., 2023). Despite the difference in RUE, and as observed in this study, there was no significant difference in yield. The difference in stomatal number and potential link to photosynthetic performance was not supported by the spot gas exchange measurements as both varieties performed similarly. A difference could have been expected between the older measurement leaves as greater shading in the prostrate could result in a quicker decline in photosynthetic performance as N is reallocated from Rubisco as previously outlined. However, the observation that both varieties have similar photosynthetic performance has been made before (Tillier et al., 2023) and suggests that the prostrate variety performs as well as the upright despite intercepting less radiation to achieve an equal sugar yield.
Büssis et al. (2006) showed that increased stomatal aperture can compensate fewer stomata to enable similar levels of A and gs but that under high light intensities gs was reduced compared to the plants with a higher stomatal density. This may explain the higher canopy temperature in the prostrate variety in fully irrigated conditions as lower gs rate results in reduced cooling by transpiration. This reduction in gs was also observed in 2019, leading to a greater WUEi which highlights how different stomatal densities may be suited to different environments with a lower density making a plant more prone to heat stress under higher temperatures and irradiance (Lu et al., 1998) although such conditions are only present for short periods in much of the temperate beet growing area. This also highlights the importance of understanding the genotype x environment interaction of different traits, as environmental conditions can significantly affect how traits drive sugar beet yield (Hoffmann et al., 2009). In addition to this other factors that drive photosynthetic performance and linked to stomatal traits must also be considered such as stomatal size and leaf mesophyll conductance (Gago et al., 2014; Bertolino et al., 2019).
The varieties had a similar SLW despite observing that a higher SLW was associated with a lower Δ13C and greater WUEDM, and this relationship did not vary depending on water deficit as had been previously observed (Rajabi et al., 2008). In this study SLW was correlated with Δ13C but this was driven by difference in SLW due to water deficit, with plants exposed to a greater water deficit having a lower Δ13C and WUEDM. This suggests that the strong relationship between SLW, Δ13C and WUEDM observed by may not always be evident on a varietal basis and other factors may be more strongly correlated with WUEDM. Additionally, the observation of lower levels of K and Na in the prostrate variety suggest water regulation in the root was different to the upright which could be linked to the drought tolerant traits observed.
Overall, the prostrate variety was more efficient in its use of water and had a reduced stomatal density and greater RWC which are traits associated with increased WUE and drought tolerance. It is not known whether these traits are present in all sugar beet genotypes with prostate canopies, as only one was examined in this study, and this is an area for further research.
Leaf chlorophyll content was greater in the upright variety except in the Ltd treatment, where the prostrate variety had a similar chlorophyll content and a greater leaf water content suggesting that under severe and prolonged water deficit the leaf morphology had changed, which was not evident in the upright variety.
The increase in chlorophyll content was opposite to that typically observed under drought for many species such as maize (Din et al., 2011) and rice (Pirdashti et al., 2009) and there was no change in the ratio of chlorophyll a and b which is also sometimes observed (Saeidi and Zabihi-e-Mahmoodabad, 2009). However, an increase in chlorophyll content has previously been reported in sugar beet exposed to drought (Hussein et al., 2008) and increased SPAD values (a proxy for chlorophyll content) were observed in sugar beet exposed to high level water deficits by Fitters et al. (2018), although these differences were no longer present after re-watering and were attributed to a dilution effect. No such dilution effect is evident in this study as leaf water content was measured at the same time as collection of leaf discs for chlorophyll extraction. Additionally, the prostrate variety had a more stable chlorophyll content with an increase only evident in the Ltd treatment, whilst the upright variety was more variable, but this did not seem to affect the photosynthetic performance of the two varieties. In barley, varieties with a more stable chlorophyll content across varying moisture deficits were found to have greater drought tolerance (Li et al., 2006) but in wheat greater chlorophyll content was associated with greater drought tolerance (Talebi, 2011). The relationship between leaf chlorophyll content and WUE is therefore unclear in sugar beet and is an area for future research.
5 Conclusion
In conclusion, we have shown that water deficits tend to increase WUEi and WUEDM but reduce total yield. The recovery of sugar beet after drought has shown the crop’s resilience and ability to recover from even the most severe drought. It is evident that the crop does not acclimate after these events to increase WUE or avoid future water deficits, except for reducing its canopy size. The lower Δ13C of the prostrate variety and the difference in stomatal density and RWC compared to the upright suggests traits associated with greater WUEi may be linked to canopy architecture. This should be confirmed by further research utilizing more varieties that contrast in canopy architecture.
Data availability statement
The raw data supporting the conclusions of this article will be made available by the authors, without undue reservation.
Author contributions
GB, EM and DS designed the experiment. GB carried out the practical work, statistical analysis and wrote the manuscript with contributions from EM and DS. EM supported the gas exchange measurements and analysis and DS the other crop physiology assessments. All authors met regularly to review the results and discuss management of the trial. All authors contributed to the article and approved the submitted version.
Funding
The study was funded by the British Beet Research Organisation (50%) and The University of Nottingham (50%), with carbon isotope analysis provided free of cost by the British Geological Survey. Erik Murchie receives funding from the BBSRC [grant BB/X00595X/1].
Acknowledgments
We would like to thank Professor Barry Lomax, William Spracklen, Alistair Wright and Tamara Fitters for their technical assistance and John Alcock, Matt Tovey and Jake Richards for their practical assistance. Annabelle Buckley is acknowledged for providing the illustration of the prostate and upright sugar beet canopies in Figure 1.
Conflict of interest
The authors declare that the research was conducted in the absence of any commercial or financial relationships that could be construed as a potential conflict of interest.
Publisher’s note
All claims expressed in this article are solely those of the authors and do not necessarily represent those of their affiliated organizations, or those of the publisher, the editors and the reviewers. Any product that may be evaluated in this article, or claim that may be made by its manufacturer, is not guaranteed or endorsed by the publisher.
Supplementary material
The Supplementary Material for this article can be found online at: https://www.frontiersin.org/articles/10.3389/fpls.2023.1119321/full#supplementary-material
References
Angert, A., Biraud, S., Bonfils, C., Henning, C. C., Buermann, W., Pinzon, J., et al. (2005). Drier summers cancel out the CO2 uptake enhancement induced by warmer springs. Proc. Natl. Acad. Sci. U. S. A. 102, 10823–10827. doi: 10.1073/pnas.0501647102
Araus, J. L., Reynolds, M. P., Acevedo, E. (1993). Leaf posture, grain yield, growth, leaf structure, and carbon isotope discrimination in wheat. Crop Sci. 33, 1273–1279. doi: 10.2135/cropsci1993.0011183X003300060032x
Baker, J. T., Gitz, D. C., Payton, P., Wanjura, D. F., Upchurch, D. R. (2007). Using leaf gas exchange to quantify drought in cotton irrigated based on canopy temperature measurements. Agron. J. 99, 637–644. doi: 10.2134/agronj2006.0062
Barratt, G. E., Sparkes, D. L., McAusland, L., Murchie, E. H. (2021). Anisohydric sugar beet rapidly responds to light to optimize leaf water use efficiency utilizing numerous small stomata. AoB Plants 13, 1–12. doi: 10.1093/aobpla/plaa067
Bertolino, L. T., Caine, R. S., Gray, J. E. (2019). Impact of stomatal density and morphology on water-use efficiency in a changing world. Front. Plant Sci. 10. doi: 10.3389/fpls.2019.00225
Bloch, D., Hoffmann, C. M., Märländer, B. (2006). Impact of water supply on photosynthesis, water use and carbon isotope discrimination of sugar beet genotypes. Eur. J. Agron. 24, 218–225. doi: 10.1016/j.eja.2005.08.004
Blum, A. (2005). Drought resistance, water-use efficiency, and yield potential–are they compatible, dissonant, or mutually exclusive? Crop Pasture Sci. 56, 1159–1168. doi: 10.1071/AR05069
Brown, K. F., Messem, A. B., Dunham, R. J., Biscoe, P. V. (1987). Effect of drought on growth and water use of sugar beet. J. Agric. Sci. 109, 421–435. doi: 10.1017/S0021859600081636
Büssis, D., von Groll, U., Fisahn, J., Altmann, T. (2006). Stomatal aperture can compensate altered stomatal density in arabidopsis thaliana at growth light conditions. Funct. Plant Biol. 33, 1037–1043. doi: 10.1071/FP06078
Chaves, M. M., Flexas, J., Pinheiro, C. (2009). Photosynthesis under drought and salt stress: Regulation mechanisms from whole plant to cell. Ann. Bot. 103, 551–560. doi: 10.1093/aob/mcn125
Condon, A. G., Richards, R. A., Rebetzke, G. J., Farquhar, G. D. (2002). Improving intrinsic water-use efficiency and crop yield. Crop Sci. 42, 122–131. doi: 10.2135/cropsci2002.1110
Condon, A. G., Richards, R. A., Rebetzke, G. J., Farquhar, G. D. (2004). Breeding for high water-use efficiency. J. Exp. Bot. 55, 2447–2460.
Davis, S. A. (2006). “Development of sugar beet,” in Sugar beet. Ed. Draycott, A. P. (Oxford: Blackwell), 9–29. doi: 10.1002/9780470751114.ch2
Din, J., Khan, S. U., Ali, I., Gurmani, A. R. (2011). Physiological and agronomic response of canola varieties to drought stress. J. Anim. Plant Sci. 21, 78–82.
Doheny-Adams, T., Hunt, L., Franks, P. J., Beerling, D. J., Gray, J. E. (2012). Genetic manipulation of stomatal density influences stomatal size, plant growth and tolerance to restricted water supply across a growth carbon dioxide gradient. Philos. Trans. R. Soc B Biol. Sci. 367, 547–555. doi: 10.1098/rstb.2011.0272
Drake, P. L., Froend, R. H., Franks, P. J. (2013). Smaller, faster stomata: Scaling of stomatal size, rate of response, and stomatal conductance. J. Exp. Bot. 64, 495–505. doi: 10.1093/jxb/ers347
Dunham, R. J. (1993). “Water use and irrigation,” in The sugar beet crop. Eds. Cooke, D. A., Scott, R. K. (Dordrecht: Springer Netherlands), 279–309. doi: 10.1007/978-94-009-0373-9_8
Ebmeyer, H., Hoffmann, C. M. (2022). Water use efficiency of sugar beet genotypes: A relationship between growth rates and water consumption. J. Agron. Crop Sci. 208, 28–39. doi: 10.1111/jac.12569
Evans, D. (2017). The threat of drier summers to agriculture and the environment in eastern England. Proc. Inst. Civ. Eng. - Eng. Sustain. 170, 207–213. doi: 10.1680/jensu.15.00016
Fageria, N. K., Baligar, V. C., Clark, R. (2006). “Physiology of drought in crop plants,” in Physiology of crop production (Boca Raton, FL: CRC Press), 153–155.
Farquhar, G. D., Ehleringer, J. R., Hubick, K. T. (1989). Carbon isotope discrimination and photosynthesis. Annu. Rev. Plant Physiol. Plant Mol. Biol. 40, 503–537. doi: 10.1146/annurev.pp.40.060189.002443
Farquhar, G. D., Richards, R. A. (1984). Isotopic composition of plant carbon correlates with water-use efficiency of wheat genotypes. Funct. Plant Biol. 11, 539–552. doi: 10.1071/PP9840539
Farquhar, G. D., von Caemmerer, S., Berry, J. A. (1980). A biochemical model of photosynthetic CO2 assimilation in leaves of C3 species. Planta 149, 78–90. doi: 10.1007/BF00386231
Fitters, T. F. J. J., Bussell, J. S., Mooney, S. J., Sparkes, D. L. (2017). Assessing water uptake in sugar beet (Beta vulgaris) under different watering regimes. Environ. Exp. Bot. 144, 61–67. doi: 10.1016/j.envexpbot.2017.10.001
Fitters, T. F. J., Mooney, S. J., Sparkes, D. L. (2018). Sugar beet root growth under different watering regimes: A minirhizotron study. Environ. Exp. Bot. 155, 79–86. doi: 10.1016/j.envexpbot.2018.06.023
Flexas, J., Medrano, H. (2002). Drought-inhibition of photosynthesis in C3 plants: Stomatal and non-stomatal limitations revisited. Ann. Bot. 89, 183–189. doi: 10.1093/aob/mcf027
Flexas, J., Ribas-Carbó, M., Bota, J., Galmés, J., Henkle, M., Martínez-Cañellas, S., et al. (2006). Decreased rubisco activity during water stress is not induced by decreased relative water content but related to conditions of low stomatal conductance and chloroplast CO2 concentration. New Phytol. 172, 73–82. doi: 10.1111/j.1469-8137.2006.01794.x
Gago, J., Douthe, C., Florez-Sarasa, I., Escalona, J. M., Galmes, J., Fernie, A. R., et al. (2014). Opportunities for improving leaf water use efficiency under climate change conditions. Plant Sci. 226, 108–119. doi: 10.1016/j.plantsci.2014.04.007
Geiger, D. R., Shieh, W. J., Lu, L. S., Servaites, J. C. (1991). Carbon assimilation and leaf water status in sugar beet leaves during a simulated natural light regime. Plant Physiol. 97, 1103–1108. doi: 10.1104/pp.97.3.1103
Harrison, E. L., Arce Cubas, L., Gray, J. E., Hepworth, C. (2020). The influence of stomatal morphology and distribution on photosynthetic gas exchange. Plant J. 101, 768–779. doi: 10.1111/tpj.14560
Hassanli, A. M., Ahmadirad, S., Beecham, S. (2010). Evaluation of the influence of irrigation methods and water quality on sugar beet yield and water use efficiency. Agric. Water Manage. 97, 357–362. doi: 10.1016/j.agwat.2009.10.010
Hatfield, J. L., Dold, C. (2019). Water-use efficiency: Advances and challenges in a changing climate. Front. Plant Sci. 10. doi: 10.3389/fpls.2019.00103
Hoffmann, C. M., Huijbregts, T., van Swaaij, N., Jansen, R. (2009). Impact of different environments in Europe on yield and quality of sugar beet genotypes. Eur. J. Agron. 30, 17–26. doi: 10.1016/j.eja.2008.06.004
Hoffmann, C. M., Kenter, C. (2018). Yield potential of sugar beet – have we hit the ceiling? Front. Plant Sci. 9. doi: 10.3389/fpls.2018.00289
Hussein, M. M., Kassab, O. M., Ellil, A. A. (2008). Evaluating water stress influence on growth and photosynthetic pigments of two sugar beet varieties. Res. J. Agric. Biol. Sci. 4, 936–941.
Lawlor, D. W. (2002). Limitation to photosynthesis in water-stressed leaves: Stomata vs. metabolism and the role of ATP. Ann. Bot. 89, 871–885. doi: 10.1093/aob/mcf110
Leakey, A. D. B., Ferguson, J. N., Pignon, C. P., Wu, A., Jin, Z., Hammer, G. L., et al. (2019). Water use efficiency as a constraint and target for improving the resilience and productivity of C3 and C4 crops. Annu. Rev. Plant Biol. 70, 781–808. doi: 10.1146/annurev-arplant-042817-040305
Leufen, G., Noga, G., Hunsche, M. (2016). Drought stress memory in sugar beet: Mismatch between biochemical and physiological parameters. J. Plant Growth Regul. 35, 680–689. doi: 10.1007/s00344-016-9571-8
Li, Y., Fan, H., Su, J., Fei, C., Wang, K., Tian, X., et al. (2019). Regulated deficit irrigation at special development stages increases sugar beet yield. Agron. J. 111, 1293–1303. doi: 10.2134/agronj2018.05.0318
Li, R. R., Guo, P. P., Baum, M., Grando, S., Ceccarelli, S., Michael, B., et al. (2006). Evaluation of chlorophyll content and fluorescence parameters as indicators of drought tolerance in barley. Agric. Sci. China 5, 751–757. doi: 10.1016/S1671-2927(06)60120-X
Lu, Z. M., Percy, R., Qualset, C., Zeiger, E. (1998). Stomatal conductance predicts yields in irrigated pima cotton and bread wheat grown at high temperatures. J. Exp. Bot. 49, 453–460. doi: 10.1093/jxb/49.Special_Issue.453
Mäck, G., Hoffmann, C. M. (2006). Organ-specific adaptation to low precipitation in solute concentration of sugar beet (Beta vulgaris l.). Eur. J. Agron. 25, 270–279. doi: 10.1016/j.eja.2006.06.004
Mairata, A., Tortosa, I., Douthe, C., Escalona, J. M., Pou, A., Medrano, H. (2022). Comparing selection criteria to select grapevine clones by water use efficiency. Agronomy 12(8), 1963. doi: 10.3390/agronomy12081963
Marias, D. E., Meinzer, F. C., Still, C. (2017). Impacts of leaf age and heat stress duration on photosynthetic gas exchange and foliar nonstructural carbohydrates in coffea arabica. Ecol. Evol. 7, 1297–1310. doi: 10.1002/ece3.2681
Mohammadian, R., Moghaddam, M., Rahimian, H., Sadeghian, S. Y. (2005). Effect of early season drought stress on growth characteristics of sugar beet genotypes. Turkish J. Agric. For. 29, 357–368.
Monti, A., Brugnoli, E., Scartazza, A., Amaducci, M. T. (2006). The effect of transient and continuous drought on yield, photosynthesis and carbon isotope discrimination in sugar beet (Beta vulgaris l.). J. Exp. Bot. 57, 1253–1262. doi: 10.1093/jxb/erj091
Morillo-Velarde, R., Ober, E. S. (2008). “Water use and irrigation,” in Sugar beet. Ed. Draycott, A. P. (Oxford: Blackwell Publishing), 221–255.
Murchie, E. H., Lawson, T. (2013). Chlorophyll fluorescence analysis: A guide to good practice and understanding some new applications. J. Exp. Bot. 64, 3983–3998. doi: 10.1093/jxb/ert208
Ober, E. S., Bloa, M., Clark, C. J. A., Royal, A., Jaggard, K. W., Pidgeon, J. D. (2005). Evaluation of physiological traits as indirect selection criteria for drought tolerance in sugar beet. F. Crop Res. 91, 231–249. doi: 10.1016/j.fcr.2004.07.012
Ober, E. S., Clark, C. J. A., Bloa, M., Royal, A., Jaggard, K. W., Pidgeon, J. D. (2004). Assessing the genetic resources to improve drought tolerance in sugar beet: Agronomic traits of diverse genotypes under droughted and irrigated conditions. F. Crop Res. 90, 213–234. doi: 10.1016/j.fcr.2004.03.004
Ober, E. S., Luterbacher, M. C. (2002). Genotypic variation for drought tolerance in beta vulgaris. Ann. Bot. 89, 917–924. doi: 10.1093/aob/mcf093
Pidgeon, J. D., Werker, A. R., Jaggard, K. W., Richter, G. M., Lister, D. H., Jones, P. D. (2001). Climatic impact on the productivity of sugar beet in europe 1961–1995. Agric. For. Meteorol. 109, 27–37. doi: 10.1016/S0168-1923(01)00254-4
Pirdashti, H., Sarvestani, Z. T., Bahmanyar, M. A. (2009). Comparison of physiological responses among four contrast rice cultivars under drought stress conditions. World Acad. Sci. Eng. Technol. 49, 52–53.
Porra, R. J. (2002). The chequered history of the development and use of simultaneous equations for the accurate determination of chlorophylls a and b. Photosynth. Res. 73, 149–156. doi: 10.1023/A:1020470224740
Rajabi, A., Griffiths, H., Ober, E. S., Kromdijk, W., Pidgeon, J. D. (2008). Genetic characteristics of water-use related traits in sugar beet. Euphytica 160, 175–187. doi: 10.1007/s10681-007-9520-5
Rajabi, A., Ober, E. S., Griffiths, H. (2009). Genotypic variation for water use efficiency, carbon isotope discrimination, and potential surrogate measures in sugar beet. F. Crop Res. 112, 172–181. doi: 10.1016/j.fcr.2009.02.015
Rezbova, H., Belova, A., Skubna, O. (2013). Agris on-line papers in economics and informatics sugar beet production in the European union and their future trends. Agris on-line Pap. Econ. Inf. 5, 165–178. doi: 10.22004/ag.econ.162299
Ribeiro, I. C., Pinheiro, C., Ribeiro, C. M., Veloso, M. M., Simões-Costa, M. C., Evaristo, I., et al. (2016). Genetic diversity and physiological performance of Portuguese wild beet (Beta vulgaris spp. maritima) from three contrasting habitats. Front. Plant Sci. 7, 1293. doi: 10.3389/fpls.2016.01293
Rinaldi, M., Vonella, A. V. (2006). The response of autumn and spring sown sugar beet (Beta vulgaris l.) to irrigation in southern Italy: Water and radiation use efficiency. F. Crop Res. 95, 103–114. doi: 10.1016/j.fcr.2004.12.004
Rytter, R. M. (2005). Water use efficiency, carbon isotope discrimination and biomass production of two sugar beet varieties under well-watered and dry conditions. J. Agron. Crop Sci. 191, 426–438. doi: 10.1111/j.1439-037X.2005.00162.x
Saeidi, M., Zabihi-e-Mahmoodabad, R. (2009). Evaluation of drought stress on relative water content and chlorophyll content of sesame (Sesamum indicum l.) genotypes at early flowering stage. Res. J. Environ. Sci. 3, 345–350. doi: 10.3923/rjes.2009.345.350
Sakoda, K., Taniyoshi, K., Yamori, W., Tanaka, Y. (2022). Drought stress reduces crop carbon gain due to delayed photosynthetic induction under fluctuating light conditions. Physiol. Plant 174, e13603. doi: 10.1111/ppl.13603
Schindelin, J., Arganda-Carreras, I., Frise, E., Kaynig, V., Longair, M., Pietzsch, T., et al. (2012). Fiji: An open-source platform for biological-image analysis. Nat. Methods 9, 676–682. doi: 10.1038/nmeth.2019
Seibt, U., Rajabi, A., Griffiths, H., Berry, J. A. (2008). Carbon isotopes and water use efficiency: Sense and sensitivity. Oecologia 155, 441–454. doi: 10.1007/s00442-007-0932-7
Sims, D. A., Pearcy, R. W. (1991). Photosynthesis and respiration in alocasia macrorrhiza following transfers to high and low light. Oecologia 86, 447–453. doi: 10.1007/BF00317615
Sun, Y., Yan, F., Cui, X., Liu, F. (2014). Plasticity in stomatal size and density of potato leaves under different irrigation and phosphorus regimes. J. Plant Physiol. 171, 1248–1255. doi: 10.1016/j.jplph.2014.06.002
Talebi, R. (2011). Evaluation of chlorophyll content and canopy temperature as indicators for drought tolerance in durum wheat (Triticum durum desf.). Aust. J. Basic Appl. Sci. 5, 1457–1462.
Tanner, C. B., Sinclair, T. R. (1983). “Efficient water use in crop production: research or re-search?,” in Limitations to efficient water use in crop production. Eds. Taylor, H. M., Jordan, W. R., Sinclair, T. R. (Madison, WI: American Society of Agronomy), 1–27.
Tillier, L. C., Murchie, E. H., Sparkes, D. L. (2023). Does canopy angle influence radiation use efficiency of sugar beet? F. Crop Res. 293, 108841. doi: 10.1016/j.fcr.2023.108841
Topak, R., Süheri, S., Acar, B. (2011). Effect of different drip irrigation regimes on sugar beet (Beta vulgaris l.) yield, quality and water use efficiency in middle Anatolian, Turkey. Irrig. Sci. 29, 79–89. doi: 10.1007/s00271-010-0219-3
Weatherley, P. E. (1950). Studies in the water relations of the cotton plant. New Phytol. 49, 81–97. doi: 10.1111/j.1469-8137.1950.tb05146.x
Xu, W., Rosenow, D. T., Nguyen, H. T. (2000). Stay green trait in grain sorghum: relationship between visual rating and leaf chlorophyll concentration. Plant Breed. 119, 365–367. doi: 10.1046/j.1439-0523.2000.00506.x
Keywords: sugar beet, water use, drought, stomata, carbon isotopes, crop, yield, agriculture
Citation: Barratt GE, Murchie EH and Sparkes DL (2023) Water use efficiency responses to fluctuating soil water availability in contrasting commercial sugar beet varieties. Front. Plant Sci. 14:1119321. doi: 10.3389/fpls.2023.1119321
Received: 08 December 2022; Accepted: 22 February 2023;
Published: 09 March 2023.
Edited by:
Paolo Sabbatini, Michigan State University, United StatesReviewed by:
Ashutosh Mall, Indian Institute of Sugarcane Research (ICAR), IndiaClaudio Lovisolo, University of Turin, Italy
Christa M. Hoffmann, University of Göttingen, Germany
Copyright © 2023 Barratt, Murchie and Sparkes. This is an open-access article distributed under the terms of the Creative Commons Attribution License (CC BY). The use, distribution or reproduction in other forums is permitted, provided the original author(s) and the copyright owner(s) are credited and that the original publication in this journal is cited, in accordance with accepted academic practice. No use, distribution or reproduction is permitted which does not comply with these terms.
*Correspondence: Georgina E. Barratt, Z2VvcmdpbmEuYmFycmF0dEBiYnJvLmNvLnVr