 Revadi Padmashree1,2‡
 Kalyani M. Barbadikar1*‡
 Honnappa1,2
 Nakul D. Magar1,3
 Divya Balakrishnan1
 R. Lokesha2†
 C. Gireesh1Anantha M. Siddaiah1
 Maganti Sheshu Madhav1†Y. M Ramesha4Muralidhara Bharamappanavara2
 Amol S. Phule1†
 P. Senguttuvel1
 J. R. Diwan2D. Subrahmanyam1Raman Menakshi Sundaram1
- 1Indian Council of Agricultural Research (ICAR)-Indian Institute of Rice Research (IIRR), Hyderabad, India
- 2University of Agricultural Sciences (UAS), Raichur, India
- 3Chaudhary Charan Singh University, Meerut, India
- 4Agricultural Research Station (ARS) Dhadesugur, University of Agricultural Sciences (UAS), Raichur, India
The development of nutrient-use efficient rice lines is a priority amidst the changing climate and depleting resources viz., water, land, and labor for achieving sustainability in rice cultivation. Along with the traditional transplanted irrigated system of cultivation, the dry direct-seeded aerobic system is gaining ground nationwide. The root-related traits play a crucial role in nutrient acquisition, adaptation and need to be concentrated along with the yield-attributing traits. We phenotyped an association panel of 118 rice lines for seedling vigour index (SVI) traits at 14 and 21 days after sowing (DAS), root-related traits at panicle initiation (PI) stage in polythene bags under controlled aerobic condition, yield and yield-related traits under the irrigated condition at ICAR-IIRR, Hyderabad, Telangana; irrigated and aerobic conditions at ARS, Dhadesugur, Raichur, Karnataka. The panel was genotyped using simple sequence repeats (SSR) markers and genome-wide association studies were conducted for identifying marker–trait associations (MTAs). Significant correlations were recorded for root length, root dry weight with SVI, root volume at the PI stage, number of productive tillers per plant, spikelet fertility, the total number of grains per panicle with grain yield per plant under irrigated conditions, and the total number of grains per panicle with grain yield per plant under aerobic condition. The panel was divided into three sub-groups (K = 3) and correlated with the principal component analysis. The maximum number of MTAs were found on chromosomes 2, 3, and 12 with considerable phenotypic variability. Consistent MTAs were recorded for SVI traits at 14 and 21 DAS (RM25310, RM80, RM22961, RM1385), yield traits under irrigated conditions (RM2584, RM5179, RM410, RM20698, RM14753) across years at ICAR-IIRR, grain yield per plant (RM22961, RM1146) under the aerobic condition, grain yield per plant at irrigated ICAR-IIRR and SVI (RM5501), root traits at PI stage (RM2584, RM80, RM410, RM1146, RM18472). Functionally relevant genes near the MTAs through in-silico expression analysis in root and panicle tissues viz., HBF2 bZIP transcription factor, WD40 repeat-like domain, OsPILS6a auxin efflux carrier, WRKY108, OsSCP42, OsMADS80, nodulin-like domain-containing protein, amino acid transporter using various rice expression databases were identified. The identified MTAs and rice lines having high SVI traits (Langphou, TI-128, Mouli, TI-124, JBB-631-1), high yield under aerobic (Phouren, NPK-43, JBB-684, Ratnamudi, TI-112), irrigated conditions (KR-209, KR-262, Phouren, Keibi-Phou, TI-17), robust root traits like root length (MoirangPhou-Angouba, Wangoo-Phou, JBB-661, Dissi, NPK-45), root volume (Ratnachudi, KJ-221, Mow, Heimang-Phou, PUP-229) can be further employed in breeding programs for the targeted environments aimed at improving seedling vigour, yield-related traits under irrigated condition, aerobic condition as adaptability to water-saving technology.
1 Introduction
In the present scenario of changing climatic conditions, water scarcity poses a major challenge to Indian agriculture, especially for rice (Oryza sativa L.), a major staple food crop. The dry-direct seeded aerobic system of rice cultivation has been identified as an alternative system to the traditional transplanted irrigated system of rice cultivation (Chauhan and Abugho, 2013; Mahender et al., 2015). The seeds are directly sown in the non-puddled soil and moisture is maintained throughout the cultivation period without excess standing water. It is comparatively economic with a saving of approximately 73% in land preparation and 56% during crop growth (Kahani and Hittalmani, 2015; Mahender et al., 2015; Anandan et al., 2016). The establishment of a crop is critically dependent on seedling development and has been shown to correlate with yield. The seedling vigour, expressed in terms of the seedling vigour index (SVI) is majorly required for rapid and uniform emergence, especially under the declining moisture content of the upper soil layer. The root-related traits like deep rooting, branching, root volume, number of roots, root angle, root hair density, and the thickness of the xylem, contribute to the establishment and adaptation under a particular soil–water environment. The root system architecture (RSA) is a complex trait contributed by the root volume, root length, root mass, number of roots, angle of roots, number of lateral roots and root hair density etc. (Sandhu et al., 2019a; Sandhu et al., 2016). Rightly known as the hidden half, the root system architecture plays a major role in such adaptation by rapidly responding the external cues. The RSA has implications in plant development, anchorage, nutrient uptake and stress response to specific conditions based on its plasticity. The root system having robust roots and potential branching ability is crucial under the aerobic condition in rice, enabling the plants to extract water from deep soil layers (Khodaeiaminjan et al., 2023). Nevertheless, different soil conditions greatly affect the varietal ability to develop a deep root system (Sagare et al., 2020). The root dry weight, root length density, and percentage lateral roots have been found to relate with yield stability and thus its role in root adaptation to different systems of cultivation needs to be emphasized. Yield and yield-related traits are complex and depend on genetic and environmental factors (Xing and Zhang, 2010; Singh et al., 2017). The yield-related traits viz., panicle number, number of grains per panicle, grain weight, and harvest index are very crucial for selection as well as for understanding its association as per the genotype-environment interaction. There exists a correlation between nutrient uptake and root traits, yield, and yield-related traits in rice. Reports have mentioned that there exists a relationship and positive correlation between root growth parameters viz., root length, root number, root volume, root dry weight and shoot dry weight and yield of aerobic rice (Sandhu et al., 2013; Sunil and Shankaralingappa, 2014; Meena et al., 2019). Thus, the selection of rice lines having robust root systems, early seedling vigor and high yield potential under irrigated and direct seeded aerobic conditions is essential towards the climate-resilience breeding programmes.
Association mapping (AM) also known as linkage disequilibrium (LD) mapping is a rapid approach for the identification of quantitative trait loci (QTL), genes/alleles associated with agronomically economic traits. The LD is defined as non-random association of alleles at two or more different loci. This mapping is based on historic recombination events and LD by the strength of the correlation between a trait and a marker in natural populations or panels with diverse lines to identify marker–trait associations (MTAs) (Flint-Garcia et al., 2005; Zhu et al., 2008; Korte and Farlow, 2013). It has been widely deployed in various rice accessions, and core collections for the identification of MTAs for traits like yield, nutrient use efficiency, biotic/abiotic stress biofortification, nutritional parameters, etc. Genomic regions and QTLs have been identified in rice for early seedling vigor (Dixit et al., 2015; Zhang et al., 2017; Chen et al., 2019; Sandhu et al., 2019b), root traits (Sandhu et al., 2013; Sandhu et al., 2019a; Vinarao et al., 2021), yield under aerobic condition (Sandhu et al., 2015), yield under drought (Bernier et al., 2007; Venuprasad et al., 2012; Mishra et al., 2013) etc. Nevertheless, a consolidated study focusing on the seedling vigor, root system, and yield under aerobic and irrigated conditions for identification of common, consistent MTAs across years, crop growing seasons and locations along with lines suitable or adaptable for such traits needs to be investigated. In the present study, genome-wide association studies (GWAS) in a rice association panel consisting of 118 rice lines using the polymorphic simple sequence repeats (SSR) markers distributed across all the chromosomes were executed. We identified the significant marker-trait associations (MTAs) for root-related traits at seedling and panicle initiation stages under aerobic controlled conditions and yield-related traits at reproductive maturity under aerobic and irrigated field conditions at two locations and two seasons viz., wet season (Kharif) and dry season (Rabi).
2 Materials and methods
2.1 Plant material and experimental sites
The experimental plant material for the study comprised 118 rice lines consisting of North-Eastern landraces, popularly cultivated varieties, aerobic released varieties, basmati rice, aromatic short grain lines, advanced breeding lines, introgression lines, soft rice lines, ethyl methanesulfonate (EMS) mutants of BPT-5204, and Nagina 22 (N22), wild introgression lines, tropical japonica accessions, Oryza glaberrima accessions. This panel was formed based on the genetic diversity among the lines and, prior information on yield-related traits and will be hereafter referred to as an association panel (AP). These lines were collected from the breeders of ICAR-Indian Institute of Rice Research (IIRR), Hyderabad (Supplementary Table S1). The experimental design and strategy along with locations have been illustrated in Figure 1.
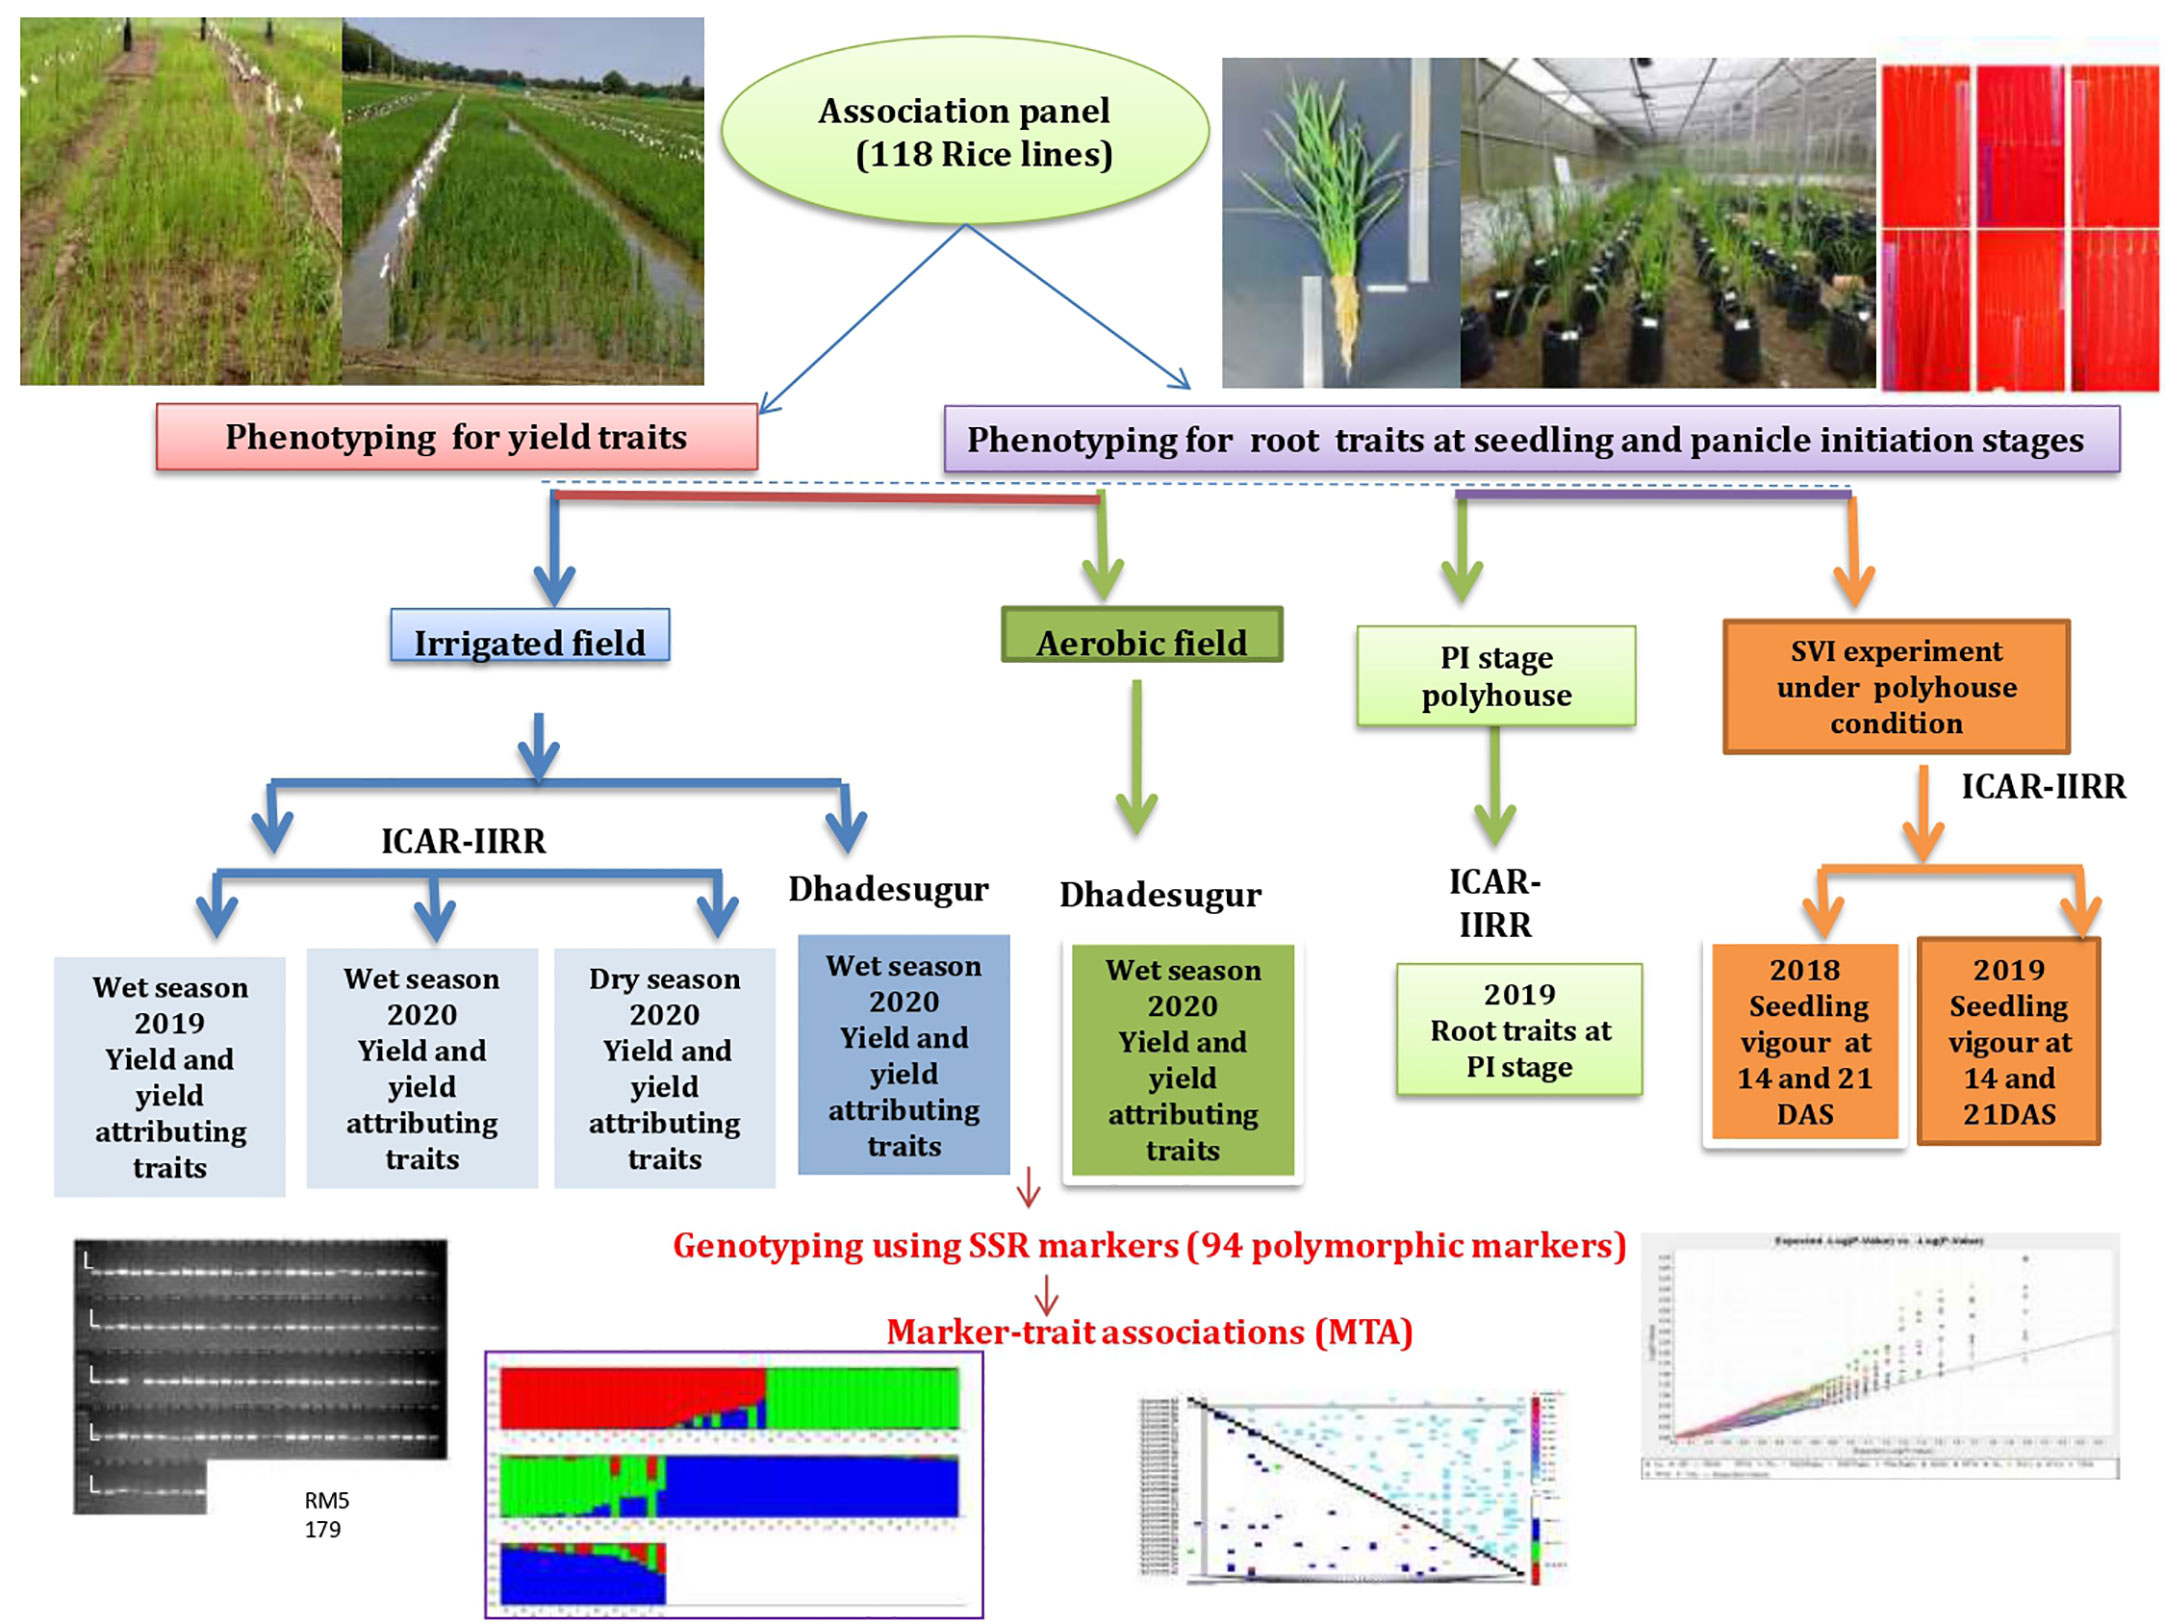
Figure 1 Experimental flow chart. The phenotypic traits recorded over seasons, locations, conditions, genotyping, and genome-wide association studies have been represented.
2.2 Phenotyping
Experiment 1: Evaluation of rice association panel for root-related traits in polyhouse under aerobic condition
a) At the seedling stage for seedling vigour traits (SVI_P)
Phenotyping of seedling vigour traits at 14 and 21 days after sowing (DAS) was carried out in polyhouse under aerobic condition at ICAR-IIRR Hyderabad for two years 2018 and 2019 (Supplementary Figure S1A). The lines of the association panel were directly sown in black polythene covers of 80 cm length containing 15 Kg soil in two replications. To maintain the aerobic condition, need-based irrigation was given (water in a measured volume of 150 ml). The soil macro, micronutrients, pH were maintained throughout the experiment, and recommended dose of fertilizer was provided. The seedlings were removed carefully from each polythene cover in replications at two seedling growth stages (14th, 21st DAS), to record seedling vigour traits viz., germination per cent (G %), shoot length (SL), root length (RL), total seedling length (TSL). The SL, RL, TSL were recorded manually using a centimeter scale. The shoot fresh weight (SFW), root fresh weight (RFW), total fresh weight (TFW), shoot dry weight (SDW), root dry weight (RDW), and total dry weight (TDW) were recorded using an electronic balance (iGene, India). The root to shoot length ratio (RSLR), root to shoot fresh weight and dry weight ratios (RSFWR and RSDWR) were derivative parameters calculated by division. The root surface area (RSA), root average diameter (RAD), root length per volume (RLPV) and root volume (RV) were recorded using WinRHIZO Pro software (version 4) (Arsenault et al., 1995). The Seedling Vigour Index-I (SVI-I) and Seedling Vigour Index-II (SVI-II) were calculated using the below-given formulae by Addanki et al., 2019 viz., Seedling Vigour Index-I = germination percentage × seedling length(cm), Seedling Vigour Index-II = germination percentage × total dry weight (mg). After 21 days single plant per/polythene bag was maintained till the panicle initiation (PI) stage (Supplementary Figure S1B).
b) At the panicle initiation (PI) stage for root architecture traits (Root_PI)
The panicle initiation stage differed considerably in the association panel for each line and according to the PI stage/booting stage of each line, the whole plant in each polythene bag was carefully removed by cutting the polythene cover without damaging the roots (Supplementary Figure S2). The roots were washed carefully using a high-pressure water pump (Barbadikar et al., 2016), and the same samples were phenotyped for traits like SL, RL, total plant length (TPL), SFW, RFW, TFW, SDW, RDW, TDW, RSLR, tiller number (TN), RSFWR and RSDWR were measured manually (Supplementary Figure S3). The RAD, RLPV and RV were analyzed and recorded in WinRHIZO Pro software (version 4) (Arsenault et al., 1995) (Supplementary Figure S4). Chlorophyll content was recorded using the Soil Plant Analysis Development (SPAD) chlorophyll meter (SPAD-502 plus Minolta, New Jersey, USA) in the morning hours between 7 to 9 am (Yugandhar et al., 2018).
Experiment 2
Field evaluation under the irrigated condition at ICAR-IIRR, Rajendranagar Hyderabad for yield and yield-related traits (Irri_RJN))
The seeds of the association panel were grown under irrigated conditions during the wet season 2019 and 2020 and dry season 2020 at ICAR-IIRR, Rajendranagar, Hyderabad. The experiment was laid out in Augmented Randomized Complete Block Design (RCBD) wherein, each block comprised of 23 rice lines along with checks (BPT-5204, Swarna, MTU-1010, RNR-15048) under irrigated conditions. The seeds were sown on the nursery beds and 30 days after sowing, the plants were transplanted under irrigated conditions (Supplementary Figures S5A, B). The agronomic practices were followed as recommended for irrigated rice cultivation. The data was recorded for three plants per line for the traits, viz., plant height (PH), panicle length (PL), number of tillers per plant (NTP), number of panicles per plant (NPP), the total number of grains per panicle (TNG), per cent spikelet fertility (SF), test weight (TW), grain yield per plant (GYP), straw weight (SW). The ratio of the number of filled spikelets per panicle to the total number of spikelets per panicle was expressed in percentage as spikelet fertility.
Experiment 3
Field evaluation under irrigated and aerobic conditions at Dhadesugur for yield and yield-related traits (Irri_DSG-Irrigated, Dhadesugur, Aero_DSG, Dhadesugur)
Irrigated, Dhadesugur
The rice association panel was evaluated for yield and yield-related traits under irrigated and aerobic conditions in the wet season 2020 at the Agricultural Research Station (ARS), Dhadesugur, University of Agricultural Sciences, Raichur. The irrigated field design and maintenance were similar to experiment 2 with a recommended package of practices.
Aerobic, Dhadesugur
For the aerobic condition, the experiment was laid out in Augmented Randomized Complete Block Design with five blocks; each block consisting of 30 diverse rice lines along with checks (viz., Sabita, Sahbhagi Dhan, MAS 946-1, DRR Dhan-41, DRR Dhan-42, DRR Dhan-44, CR Dhan-201, and CR Dhan-202). The seeds were dry directly sown (each line was sown in two rows of two-meter length at a spacing of 20 cm x 15 cm) and 15 days after sowing extra seedlings were thinned manually and a single plant per hill was maintained (Supplementary Figures S6A, B). Surface irrigation was provided need-based as per the soil and weather conditions. Agronomic practices were followed as recommended for aerobic rice cultivation along with timely weeding (Ramyajit et al., 2019). The traits were recorded as mentioned in experiment 2. Straw weight in three biological replications was measured on a balance and harvest index (HI) (ratio of economic yield to the biological yield) was calculated in percentage (Balakrishnan et al., 2016; Veronica et al., 2019).
2.3 Statistical analysis
The augmented analysis of variance (ANOVA) for yield-related traits and completely randomized design (CRD) ANOVA for root-related traits, estimation of the genotypic coefficient of variability, phenotypic coefficient of variability, broad-sense heritability and genetic advance as per cent mean were executed in R Studio (version 4.0.2) (https://cloud.r-project.org/package=augmented RCBD) using the R script. This package also provided histograms and box plots for each trait. Correlation analysis and correlation plots were plotted using past3 V 3.22 (https://past.en.lo4d.com/windows).
2.4 Genotyping
Genomic DNA was isolated from the leaves at 21 days old seedlings using the CTAB method of the association panel (Murray and Thompson, 1980). The quality of DNA was assessed on agarose gel (0.8%) and quantified using a Nanodrop spectrophotometer (ND1000) (Thermo Scientific, USA). The association panel was genotyped using 154 SSR markers (84-hyper variable markers, 30-trait linked, 40-QTL linked markers) covering the 12 chromosomes of rice. Related information of 94 polymorphic SSR markers has been provided in Supplementary Table S2. The alleles were scored as ABCD, the lowermost or first allele is considered as A, the second as B, third allele as C and the uppermost as D, according to amplicon sizes and also in 1010 format for genetic diversity estimates and marker–trait associations.
The genetic diversity among the lines of the association panel was calculated using DARwin 5.0 (https://darwin.cirad.frunweightedeighted) Neighbor-joining (NJ) tree was constructed based on a dissimilarity matrix for a distance-based approach. The principal component analysis (PCA) bi-plot was generated based on the principal components and Eigen values in DARwin. The polymorphic information content (PIC) of each marker was calculated (Anderson and Sullivan, 1993). The hierarchical distribution of the molecular variance (AMOVA) within and between subgroups defined by Structure and Shannon’s information was executed using GenAlEx 6.503.
2.5 Population structure
The population structure of the association panel was determined using STRUCTURE V.2.3.4 (Pritchard et al., 2000). A series of models with K values ranging from 1 to 10 with a burn-in period of 50,000 and a running length of 10,000 was executed for reliable results. For visualizing the results of STRUCTURE, the results were fed in the Structure Harvester (Earl and vonHoldt, 2012) to plot the mean likelihood values per K and exported as a tab-delimited table of the Evanno results. Two independent runs for each K were performed twice for the reproducibility and accuracy of the results. The K value with the maximum likelihood over the runs was considered as the most probable number of clusters i.e. sub-populations of the association panel. The pair-wise fixation index FST histograms were plotted for each of the clusters or the sub-populations according to the alpha values.
2.6 Genome-wide association studies for marker–trait associations
Association between the recorded phenotypic traits and SSR-derived genotypic data was carried out using TASSEL 4 (https://bitbucket.org/tasseladmAn/tassel-4source/wiki/UserManual) for seedling vigour traits at 14 and 21 DAS under polyhouse conditions, for root traits at PI stage, yield and yield-related traits under aerobic and irrigated conditions. The allelic data of the polymorphic SSR markers along with the phenotyping data were used as input in the TASSEL 4. The statistical models mixed linear model (MLM) that considers the kinship K and population structure Q (K+Q) and generalized linear model (GLM) were used for assessing the marker-trait associations. The corresponding p-values were corrected based on the marker F test; a false discovery rate (FDR) of 0.05 was selected as a threshold for significant associations, according to Benjamini and Hochberg (1995). The statistically significant marker–trait associations (MTAs) were considered at p-value of <0.05 and R2 value of >0.1. The corresponding markers pair-wise LD plots were plotted. The Manhattan plots were plotted for phenotypic traits based on the negative log value of p. The rooted tree diagram was plotted based on the genetic distance PCA in TASSEL 4 function. The markers having significant associations with the traits under both MLM and GLM were considered. A stringent criterion was followed for filtering the significant MTAs (R2>0.1 and p<0.05) by considering only the markers having significant association with more than two traits in all the data using Microsoft excel.
2.7 In-silico identification of genes
The significantly linked SSR markers associated with more than two phenotypic traits were selected for mining the nearby genes in the 1Mb spanning region using MSU v.7 rice genome browser (http://rice.plantbiology.msu.edu/cgi-bin/gbrowse/rice/#search). The genes were selected and thoroughly checked for their function, expression using the locus search and gene information available at the Rice Annotation Project Database (RAP-DB) (https://rapdb.dna.affrc.go.jp/) and Rice Genome Annotation Project (RGAP) (http://rice.plantbiology.msu.edu/cgi-bin/) data putative functions and gene annotation assignments (GO assignments). In depth in silico analysis of the genes associated with the marker was executed using the available expression databases viz., Rice Expression Database (RED) IC4R (http://expression.ic4r.org/), RiceXpro (https://ricexpro.dna.affrc.go.jp/), RGI Rice Gene Index (https://riceome.hzau.edu.cn), NetREx Network-based Rice Expression Analysis (https://bioinf.iiit.ac.in/netrex/index.html). The expression of the genes was checked in the specific databases based on the respective database’s specifications, tissues, experimental conditions, etc. The expression of genes was recorded specifically in the roots, and panicles at the seedling and reproductive stage according to the available information in the database. A set of specific genes expressed in the roots and panicles were further considered and an apparent score was given to each gene on the basis of the expression values in all the databases. The scores were represented as a heat map using Microsoft Excel.
3 Results
3.1 Phenotyping and trait correlation in polyhouse under aerobic condition
At the seedling stage for seedling vigour traits (SVI_P)
Analysis of variance for SVI traits viz., G (%), SL, RL, TSL, SFW, RFW, TFW, SDW, RDW, TDW, SRLR, RSFWR, RSDWR, RAD, RLPV, SVI-I, SVI-II showed significant variation except for the traits RSA, RV at 14 DAS during 2018 and G (%) at 14 DAS during 2019 respectively (Supplementary Table S3A). Root dry weight ranged from (1.24 to 9.57 mg) and (2.16 to 19.20 mg), (1.33 to 11.32 mg) and (2.50 to 21.92 mg) and TDW ranged from (4.48 to 48.20 mg) and (8.15 to 90 mg), (5.71 to 47.72 mg) and (10.42 to 88.08 mg) at 14 and 21 DAS during 2018 and 2019 respectively, RDW and TDW exhibited the highest GCV and PCV coupled with high heritability and high GAM, followed by RSA, RAD, RLPV, and RV. Moderate to high GCV and PCV with moderate heritability coupled with high GAM was exhibited by the trait RL at 14DAS consistently in both seasons (Supplementary Table S3B; Additional File 1 Figures 1, 2). The RL also showed a significant positive correlation with RLPV (0.122 and 0.203) at 14 and 21 DAS during 2018, and it is positively correlated with SVI-1 in 2019 (Figure 2). Based on the mean performance of the early seedling vigour traits like SL, RL, RDW and RV, lines viz., Langphou, Mouli, TI-128, TI-124, JBB-631-1, Ratnamudi, Tellahamsa and KR-262 performed better as compared to the popular seedling vigour check Sabita.
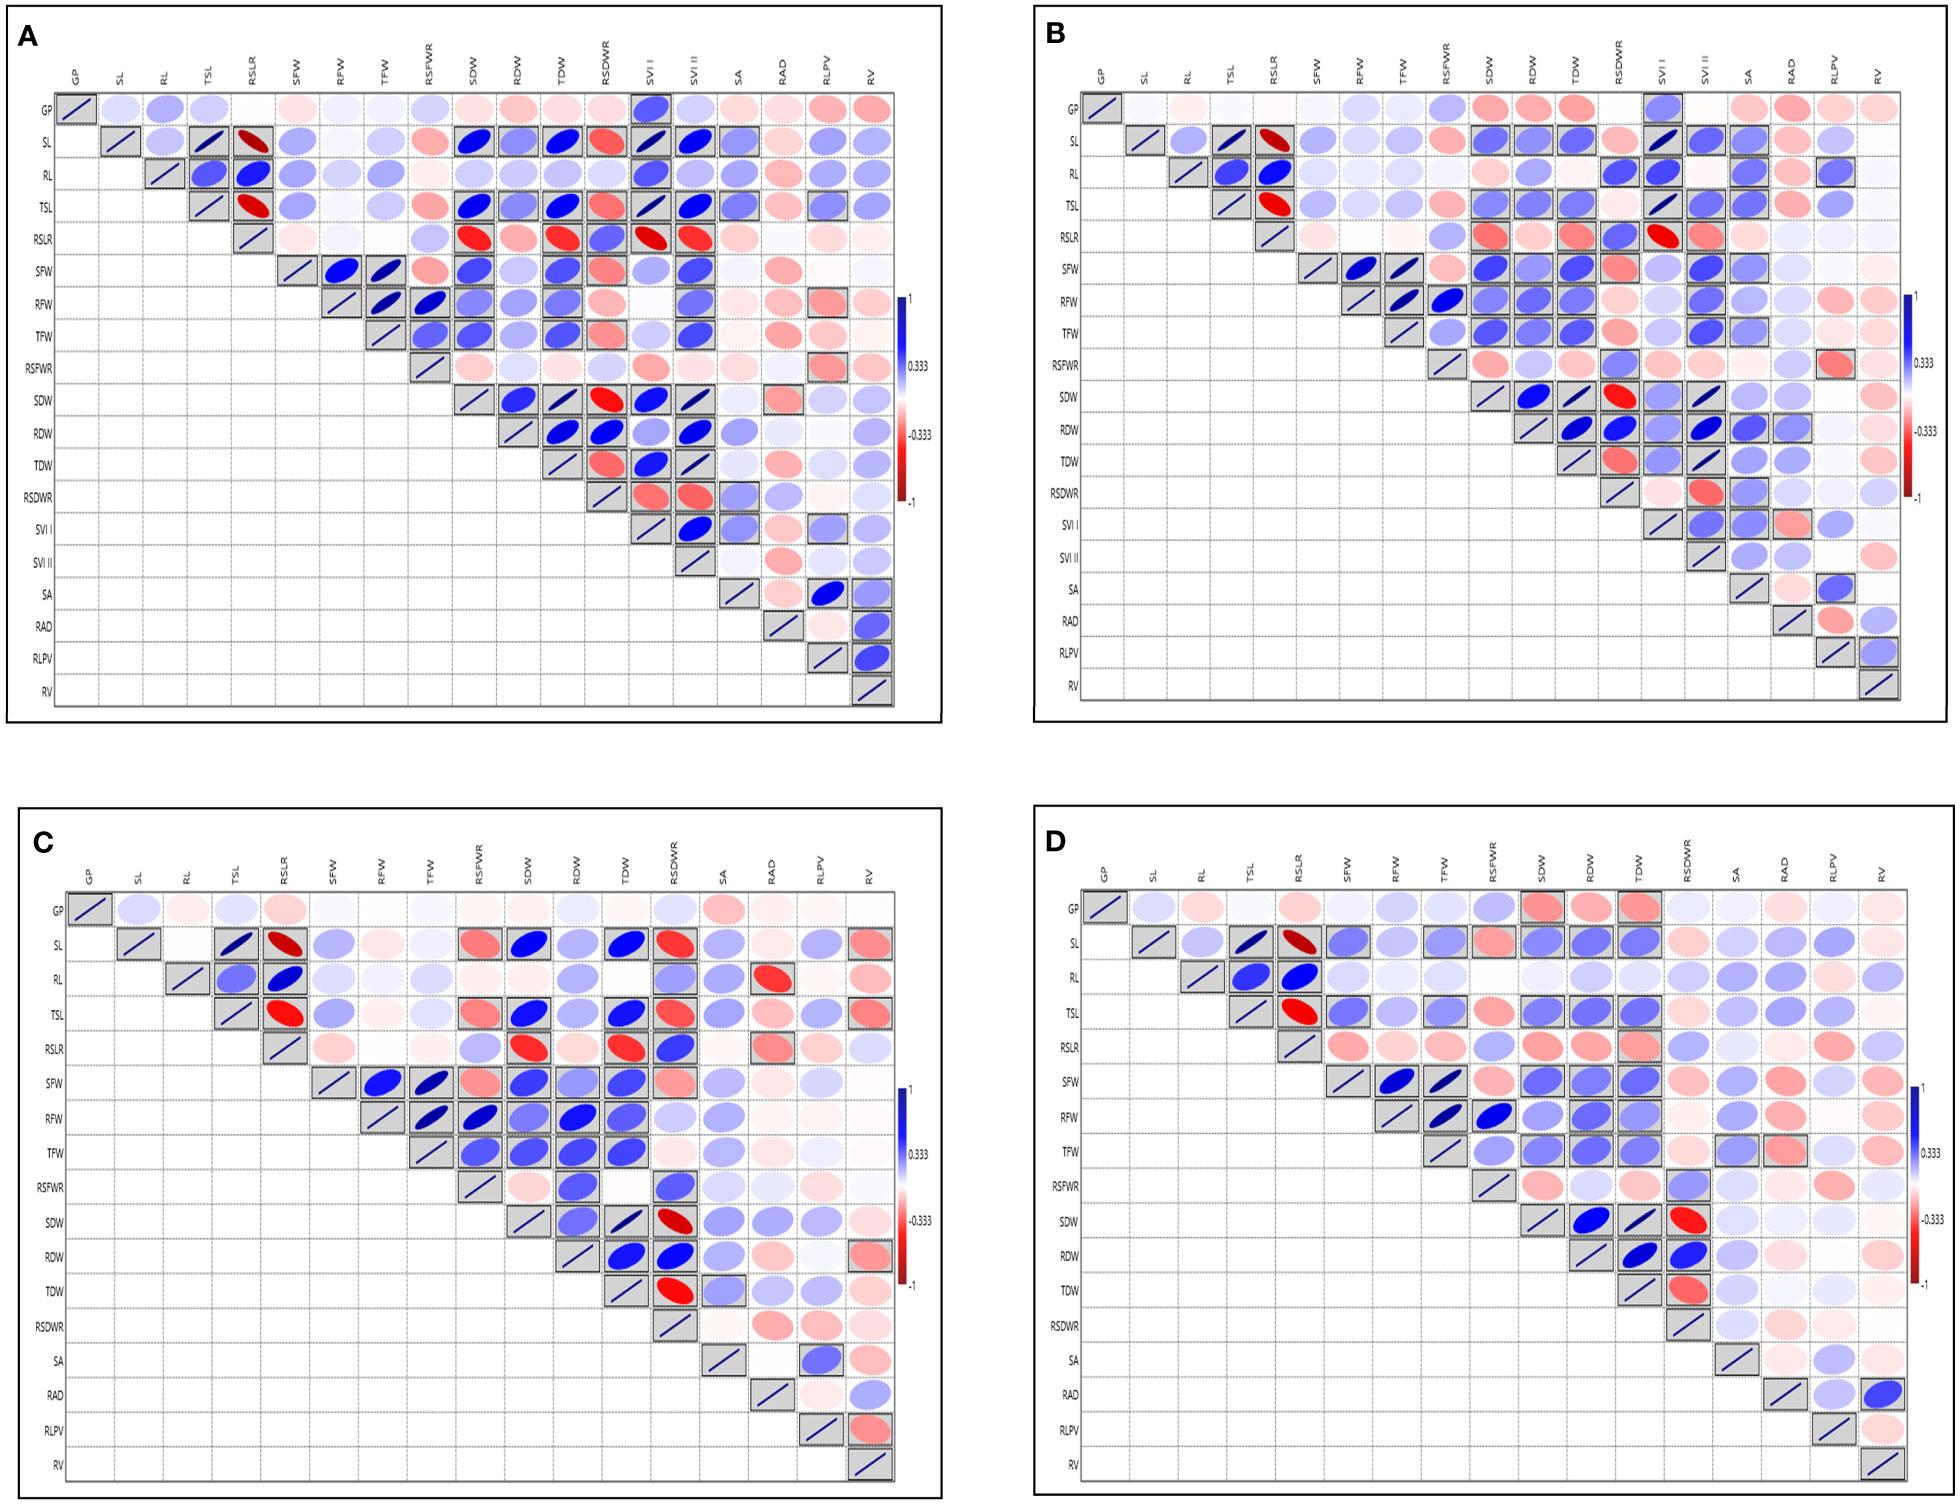
Figure 2 Graphical representation of correlation coefficients in rice association panel for seedling vigour index traits under polyhouse (A) 14 DAS 2018, (B) 21 DAS 2018, (C) 14 DAS 2019, (D) 21 DAS 2019. GP, Germination (%); SL, Shoot length (cm); RL, Root length (cm); TSL, Total seedling length (cm); RSLR, Root to shoot length ratio; SFW, Shoot fresh weight (mg); RFW, Root fresh weight (mg); TFW, Total fresh weight (mg); RSFWR, Root to shoot fresh weight ratio; SDW, Shoot dry weight (mg); RDW, Root dry weight (mg); TDW, Total dry weight (mg); RSDWR, Root to shoot dry weight ratio; SVI-I, Seedling vigour index-I and SVI-II, Seedling vigour index-II; RSA, Root surface area (cm2); RAD, Root average diameter (mm); RLPV, Root length per volume (cm/m3); RV, Root volume (cm3). Red box: Indicates negative correlation; Blue box: Indicates positive correlation; Clockwise direction of the boxes indicates the intensity of positive correlation; anticlockwise direction of the boxes indicates the intensity of negative correlation.
At the panicle initiation stage for root architecture traits
Root architecture traits like SL, RL, TPL, RSLR, TN, SPAD, SFW, RFW, TFW, SDW, and TDW, displayed significant variation among the lines at the PI stage under aerobic condition during 2019 (Supplementary Table S3C). The RV ranged from (3.36 to 133.49 cm3) showed the highest GCV and PCV coupled with high heritability and high GAM, followed by RAD with the range 1.05 to 15.40 mm (Supplementary Table S3D, Additional File 1 Figure 3). The highest correlation was observed for SFW with TFW (0.946). The RL ranged from (21.50 to 73.60 cm) and exhibited the highest positive and significant correlation with TPL (0.659), high correlation with TDW, RFW, RDW and SPAD. The SPAD meter reading showed the highest correlation with RAD (0.135) and RDW (0.134 mg) (Figure 3). Based on the overall mean performances of traits viz., RL, RDW and RV the lines viz., NPK-45, MoirangPhou-Angouba, JBB-661, Wangoo-Phou, GNV-1109, NPK-13, Dissi, SM-686 and TI-166 performed better than aerobic adapted checks viz., MAS-946-1, CR Dhan-201 and CR Dhan-202 under aerobic condition.
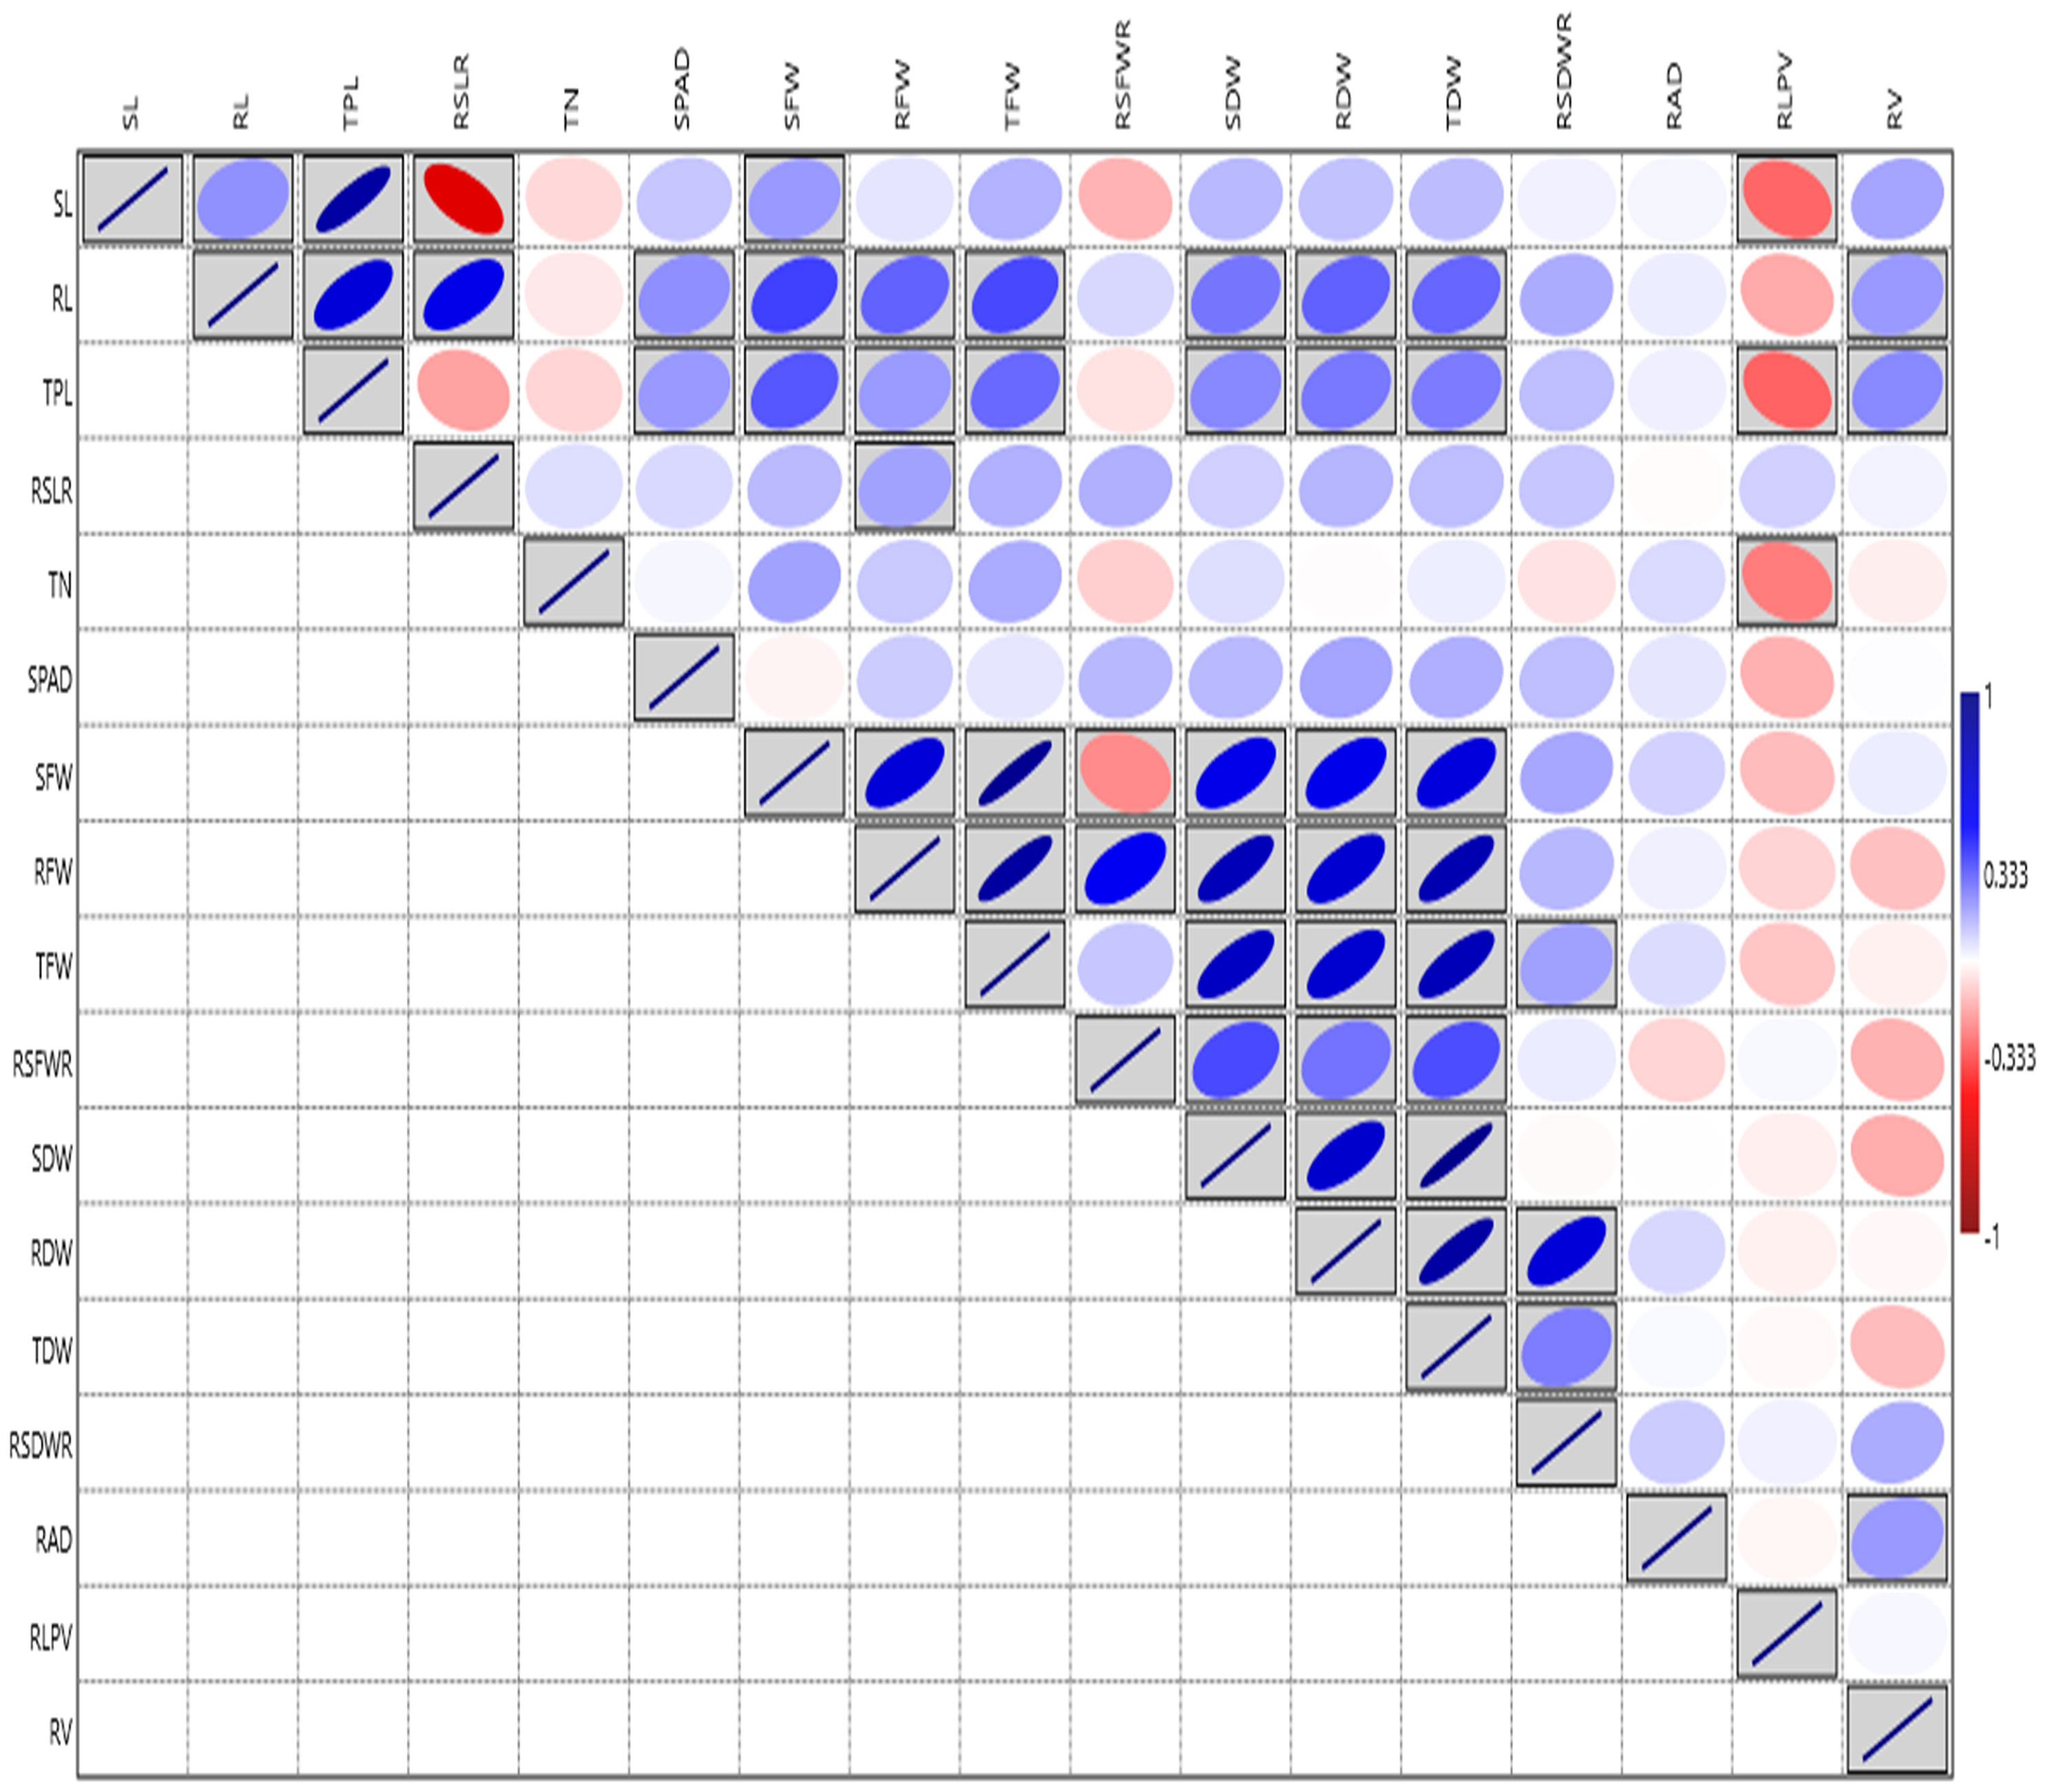
Figure 3 Graphical representation of correlation coefficients in rice association panel for root-related traits at panicle initiation stage under polyhouse condition. SL, Shoot length (cm); RL, Root length (cm); TPL, Total Plant length (cm); RSLR, Root to shoot length ratio; TN, Tiller number; SPAD, Soil Plant Analysis Development; SFW, Shoot fresh weight (g); RFW, Root fresh weight (g); TFW, Total fresh weight (g); RSFWR, Root to shoot fresh weight ratio; SDW, Shoot dry weight (g); RDW, Root dry weight (g); TDW, Total dry weight (g); RSDWR, Root to shoot dry weight ratio; RAD, Root average diameter (mm); RLPV, Root length per volume (cm/m3); RV, Root volume(cm3). Red box: Indicates negative correlation; Blue box: Indicates positive correlation; Clockwise direction of the boxes indicates the intensity of positive correlation; anticlockwise direction of the boxes indicates the intensity of a negative correlation.
3.2 Yield and yield-related traits under irrigated field conditions at ICAR-IIRR Hyderabad (Irri_RJN-Irrigated, Rajendranagar)
The analysis of variance for the traits viz., PH, PL, NTP, TNG, SF and TW showed a significant variation except for NPP in test vs check under irrigated conditions during the wet season 2019. Similarly, test lines exhibited significant variability for all the above-mentioned traits except for NPP (Supplementary Table S3E). High GCV and PCV coupled with high heritability and high GAM were exhibited by the traits GYP, PH, TW, SF and TNG (Supplementary Table S3F Additional File 1 Figure 4). The GYP exhibited a significant correlation with NTP (0.318), NPP (0.276) and SF (0.119). The NPP exhibited a significant correlation with the NTP (0.79). The analysis of variance for the traits viz., PH, PL, NTP, NPP, TNG, SF and TW under irrigated showed a significant variation except for PL in dry season 2020 and SF in both wet and dry seasons 2020 in the test vs check under irrigated condition. Similarly, test lines exhibited significant variability for all the above-mentioned traits except for NTP in both the conditions and the NPP only in the wet season 2020 (Supplementary Table S3G). High GCV, and PCV coupled with high heritability and high GAM were exhibited by the traits GYP, TW and TNG considering both the seasons (Supplementary Table S3H and Additional File 1 Figure 5). The NPP exhibited a significant correlation with the NTP (0.886 and 0.878) in both wet and dry season 2020 respectively, followed by GYP with TNG under both the seasons (Figures 4A, B). Based on the mean performance of GYP, TW, SF, and NPP the lines viz., KR-209, KR-262, Phouren, and TI-17 performed better than the checks namely BPT-5204, Swarna, MTU-1010, RNR-15048.
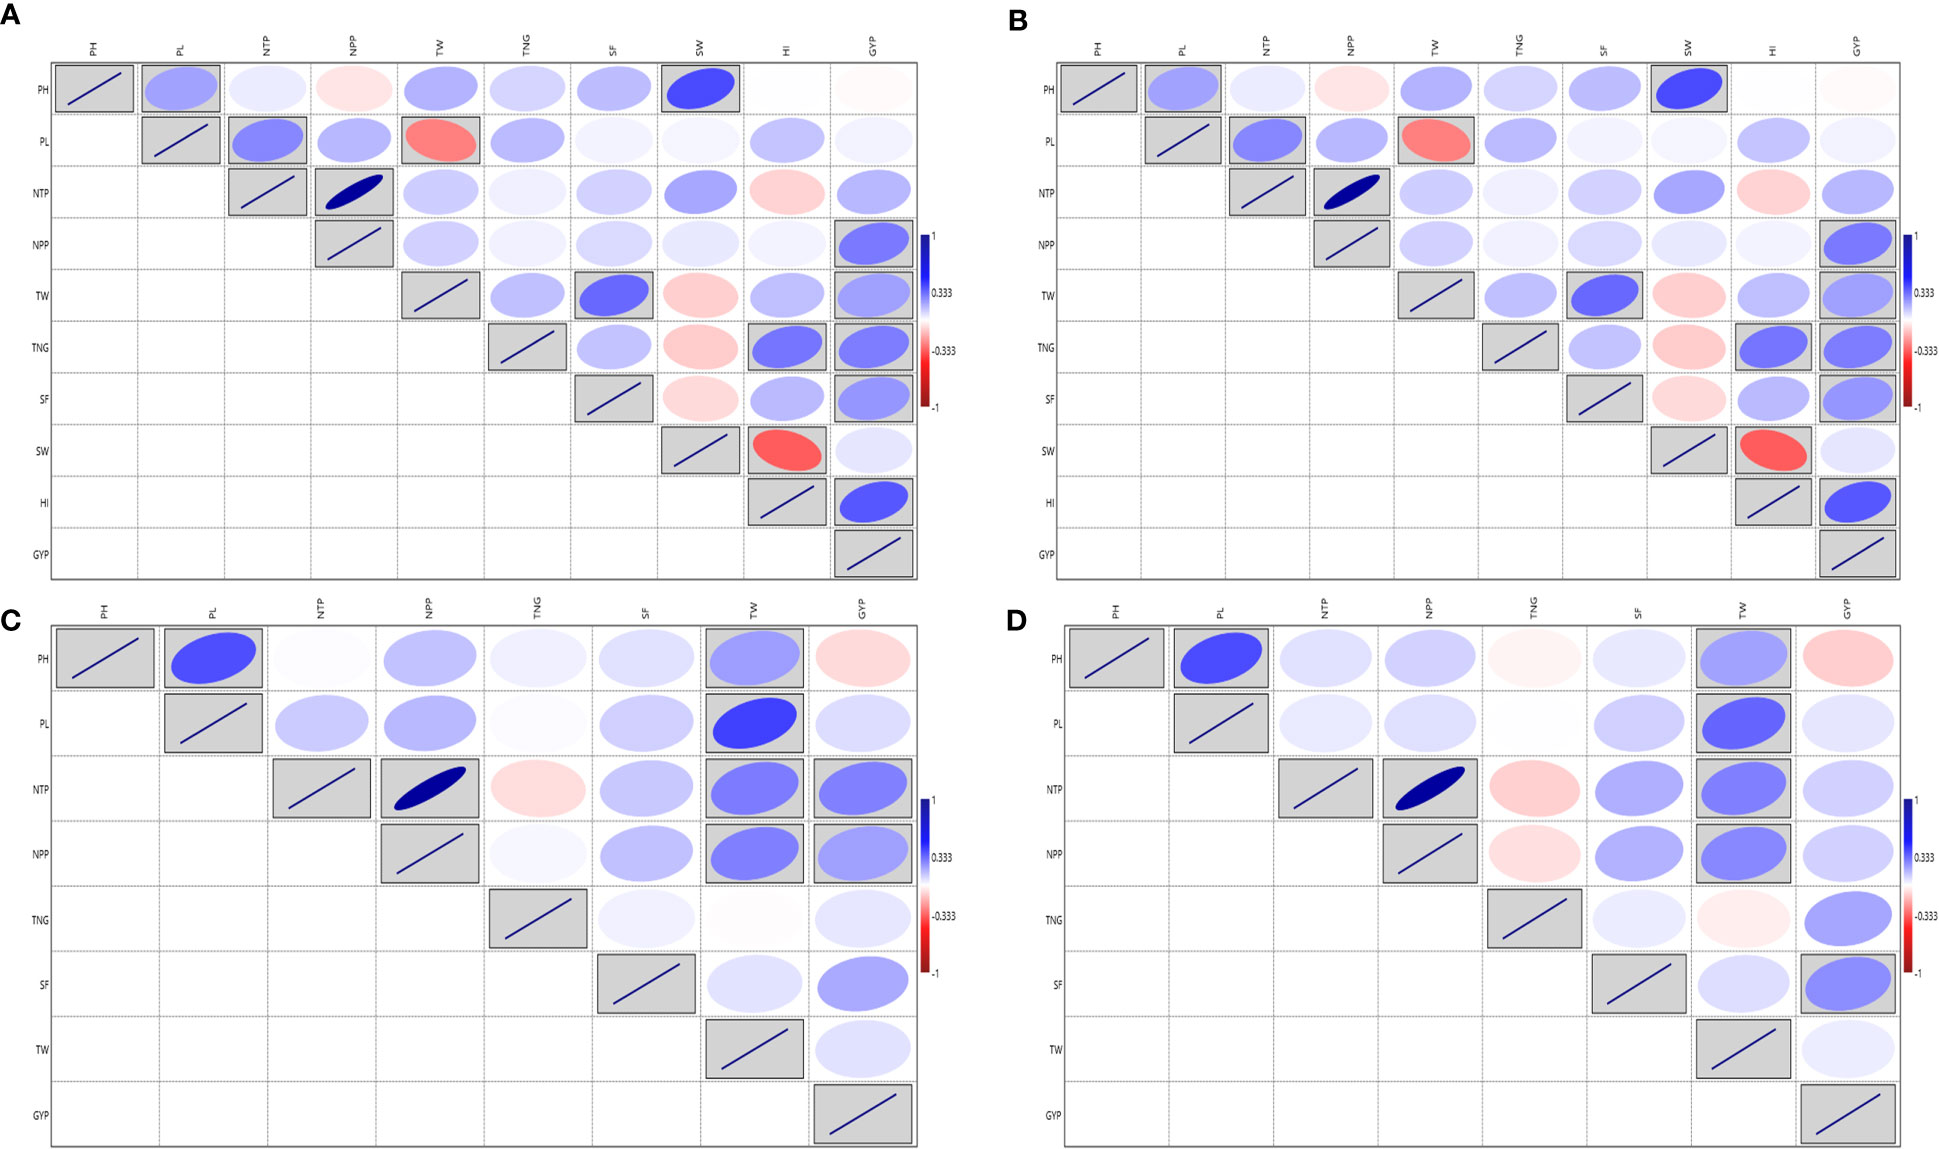
Figure 4 Correlation for the yield and yield-related traits in rice association panel. (A) ICAR-IIRR during Wet season 2020, (B) ICAR-IIRR during Dry season 2020, (C) Dhadesugur during Wet season 2020, (D) Aerobic condition Dhadesugur during Wet season 2020. PH, Plant height (cm); PL, Panicle length (cm); NTP, Number of tillers per plant; NPP, Number of panicle per plant; TNG, total number of grains per panicle; SF, Per cent spikelet fertility; TW, Test weight (g); SW, Straw weight (g); HI, Harvest index (%); GYP, Grain yield per plant (g). Red box: Indicates negative correlation and Blue box: Indicates positive correlation; Clockwise direction of the boxes indicates intensity of positive correlation; the anticlockwise direction of the boxes indicates intensity of negative correlation.
3.3 Yield and yield-related traits under irrigated and aerobic field conditions at Dhadesugur (Irri_DSG-Irrigated, Dhadesugur, Aero_DSG, Dhadesugur)
Irrigated Dhadesugur
The augmented ANOVA for yield and yield-related traits under the irrigated condition during wet season 2020 for the traits, PL, NTP, NPP, TNG, SF and TW exhibited high variability in test vs checks. All the traits recorded significant variation among the test lines except NTP and NPP (Supplementary Table S3I). The NPP exhibited the highest GCV and PCV coupled with high heritability and high GAM followed by NTP (Supplementary Table S3J and Additional File 1 Figure 6) and NPP also exhibited the highest positive and significant association with the NTP (0.882) and GYP (Figure 4C). Based on the mean performance of GYP, TW, SF and NPP the lines viz., Langphou, KR-209, JBB-631-1 and GNV-14-96-1 performed better than the irrigated checks BPT-5204, Swarna, MTU-1010, RNR-15048.
Aerobic Dhadesugur
The augmented analysis of variance for yield and yield-related traits during wet season 2020 for the traits viz., PH, PL, NTP, NPP, SF, TW, SW, HI and GYP, showed significant variability among the lines, similarly, significant variability was observed for test vs checks except for the SW under aerobic condition (Supplementary Table S3K). The HI exhibited the highest GCV and PCV coupled with high heritability and high GAM, followed by PL, GYP and TW (Supplementary Table S3L and Additional File 1 Figure 7). The highest significant correlation was observed for NPP with NTP (0.88). The GYP ranged from 3.32 to 21.12 g and exhibited the highest positive and significant correlation value with HI followed by the NPP, TNG and SF (Figure 4D). Based on the mean performance of GYP, TW, SF and NPP the lines viz., JBB-631-1, Phouren, Ratnamudi, NPK-43, TI-112, TI-87 and JBB-684 performed better under aerobic conditions than the aerobic adapted checks Sabita, Sahbhagi Dhan, MAS 946-1, DRR Dhan-41, DRR Dhan-42, DRR Dhan-44, CR Dhan-201, CR Dhan-202.
3.4 Genotyping and diversity analysis
The analysis of molecular variance (AMOVA) exhibited genetic variations of 2% among the populations and 98% among individuals of the population (Supplementary Table S4A). Shannon index was calculated and Shannon statistics summary is mentioned in Supplementary Table S4B. The PIC value in the association panel ranged from 0.0496 (RM280) to 0.7497(RM20698). The number of alleles per loci varied from two to four with an average of two alleles per locus. The highest number of alleles (tetra-allelic) was detected for the six loci viz., RM5933, RM14753, RM20698, RM25310, RM80 and RM13962. Out of the 94 polymorphic SSR markers, 21 were triallelic and 70 were biallelic. The highest PIC values were observed for the markers RM20698 (0.749), RM25310 (0.7480), RM14753 (0.7381) and RM5933 (0.7296) with the mean PIC value of 0.412, more than 37% of markers showed PIC value >0.5 (Supplementary Table S5). The diversity analysis clustered the panel into three major clusters having a different number of lines per cluster (Figure 5). The PCA and bi-plot also divided the whole population into three components with acceptable Eigen values and Eigen vectors (Supplementary Figure S7), which accounted for 31.50% of the total variance.
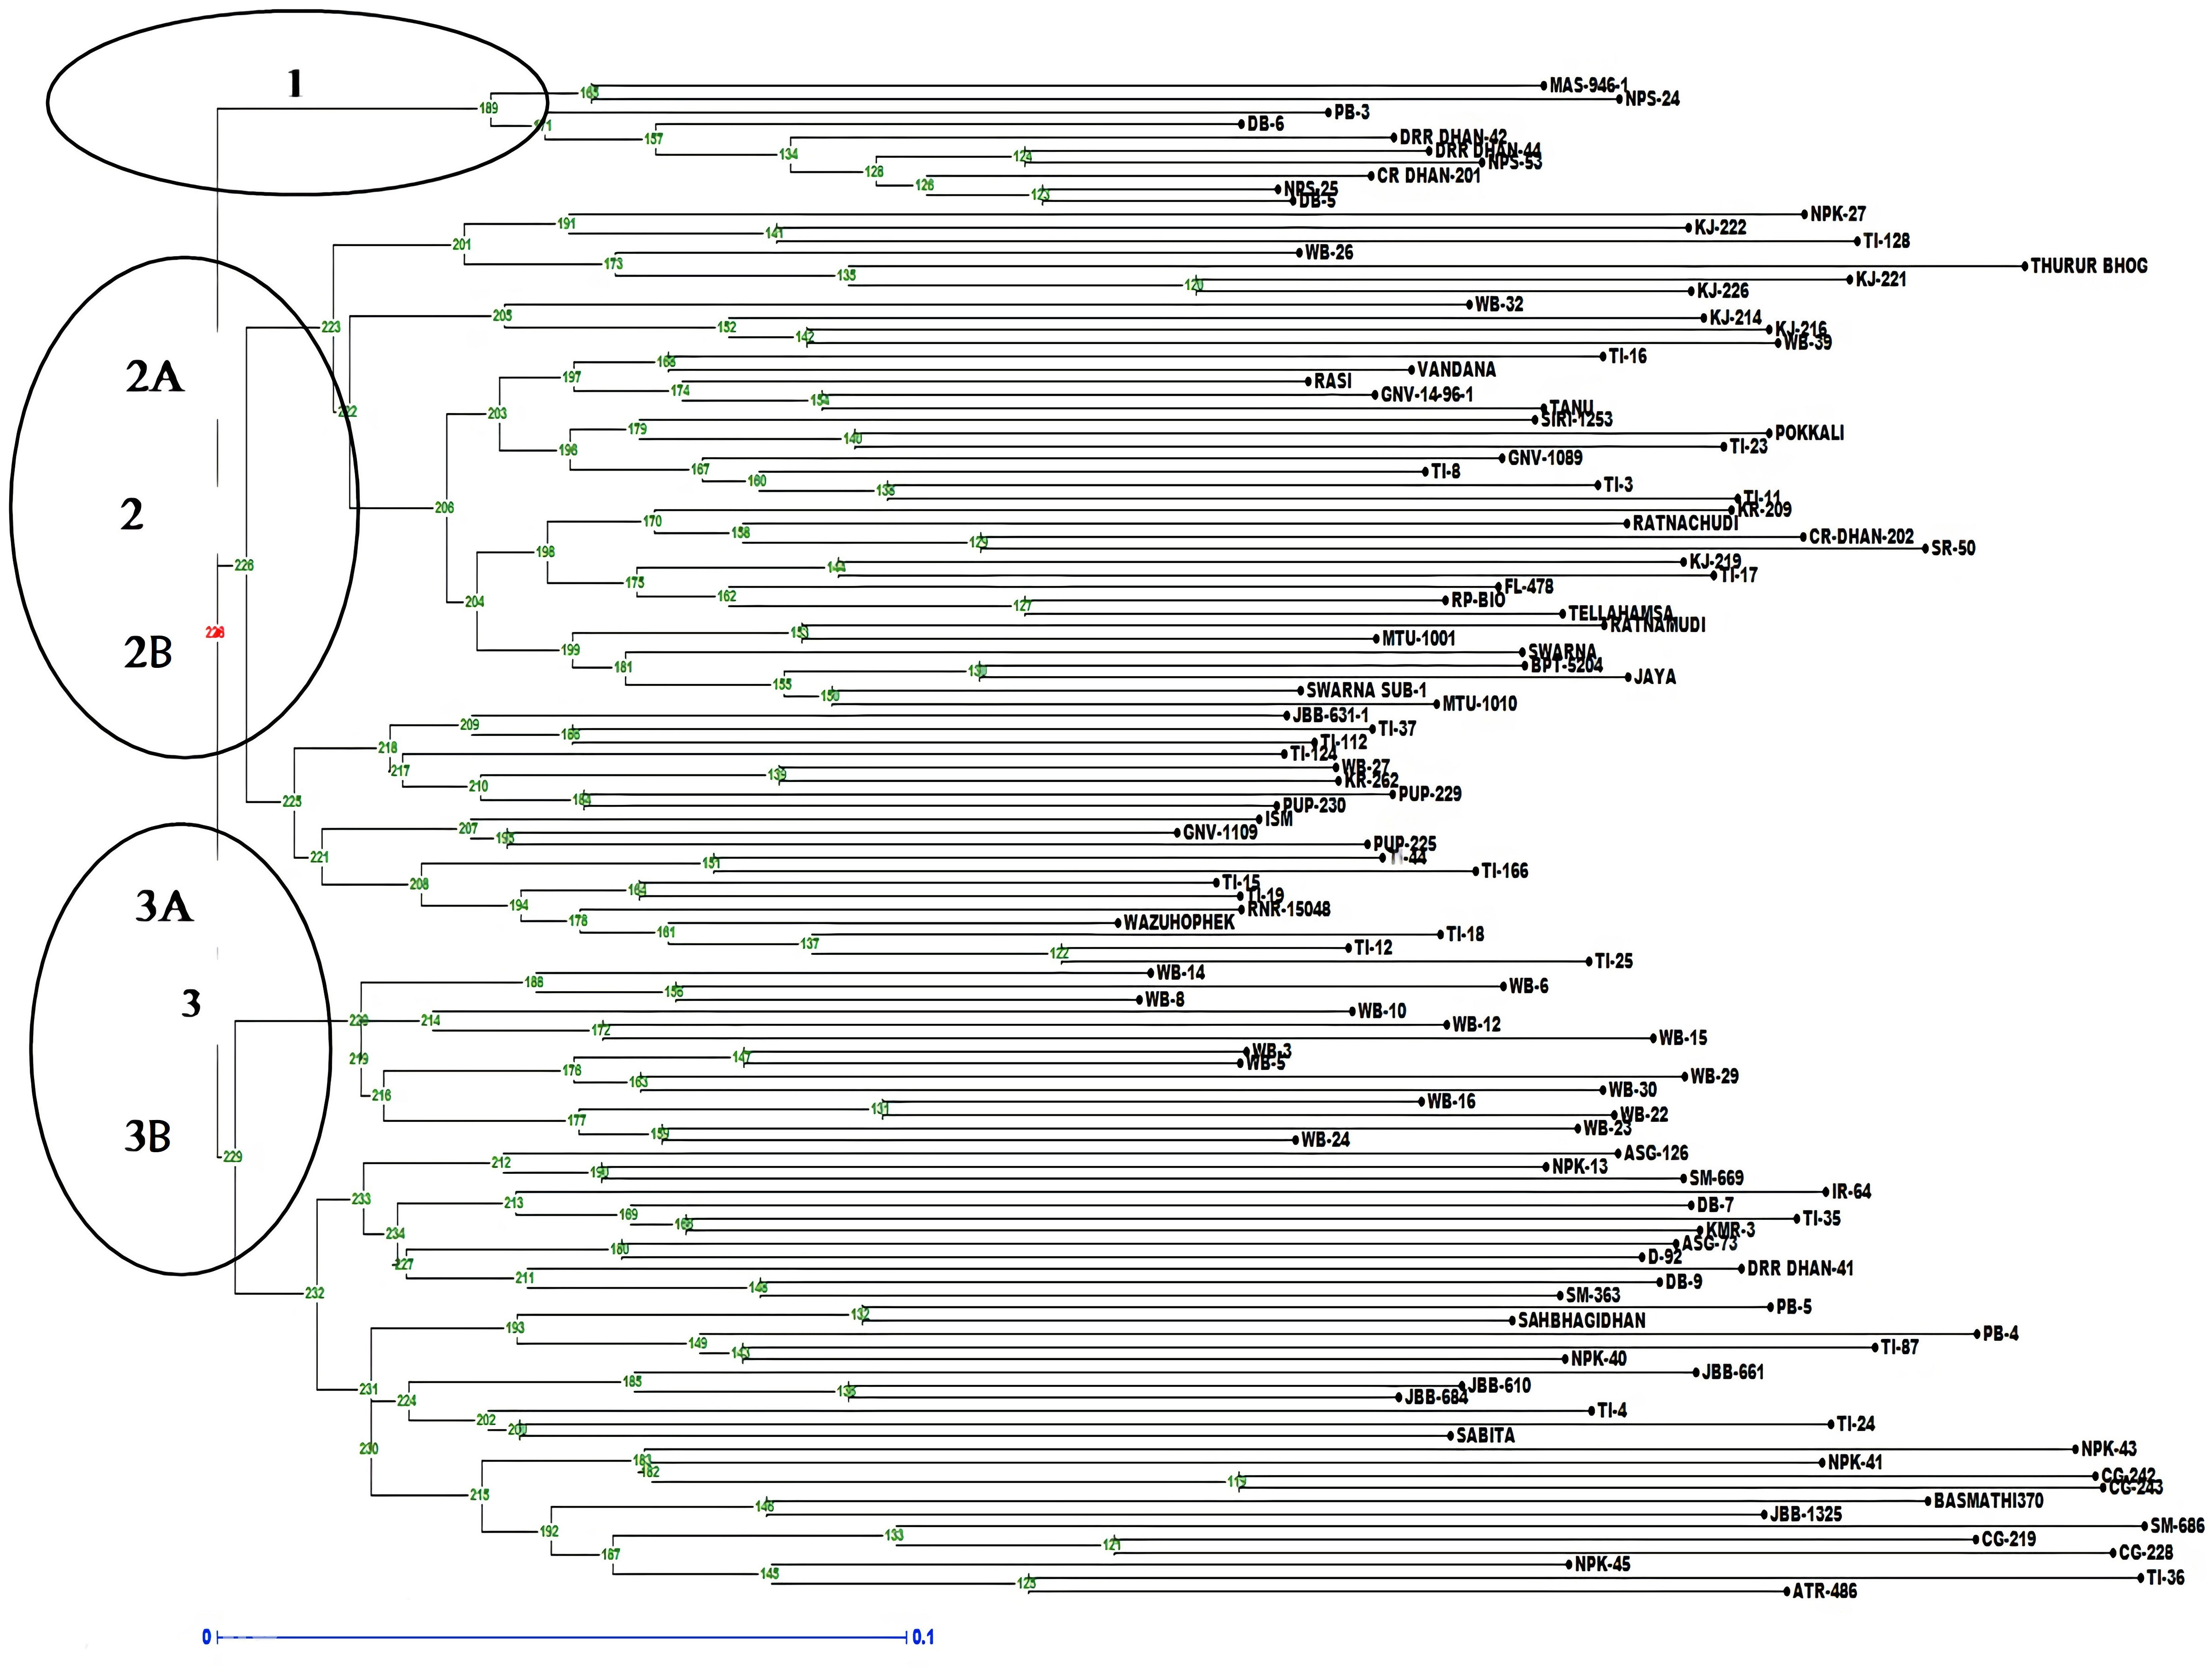
Figure 5 Dendrogram representing clustering of 118 lines constructed by using UPGMA in Darwin 6.0. The numbers above branches represent bootstrap values. The scale indicates the edge length.
3.5 Population structure
When the number of clusters was plotted against ΔK, Model-based population structure showed a sharp peak at K = 3, which displayed three sub-populations in the panel. The highest ΔK of 148.49 and LnP(K) of −13,265.40, as per the Evano table output was obtained in Structure harvester (Figures 6A, B). The composition of lines indicated that the association panel was divided into three subpopulations (P1, P2 and P3). Lines with a probability of 80% or higher were regarded pure and assigned to appropriate subgroups, whereas those with a probability of less than 80% were classified as admixture. The fixation index (Fst) for sub-populations P1, P2 and P3 was 0.34, 0.18 and 0.31 with an average value of 0.28 that indicated a moderate population structure with a mean alpha value of 0.14 (Supplementary Figure S8). These results coincided with the result of the un-weighted neighbour-joining (NJ) tree and PCA.
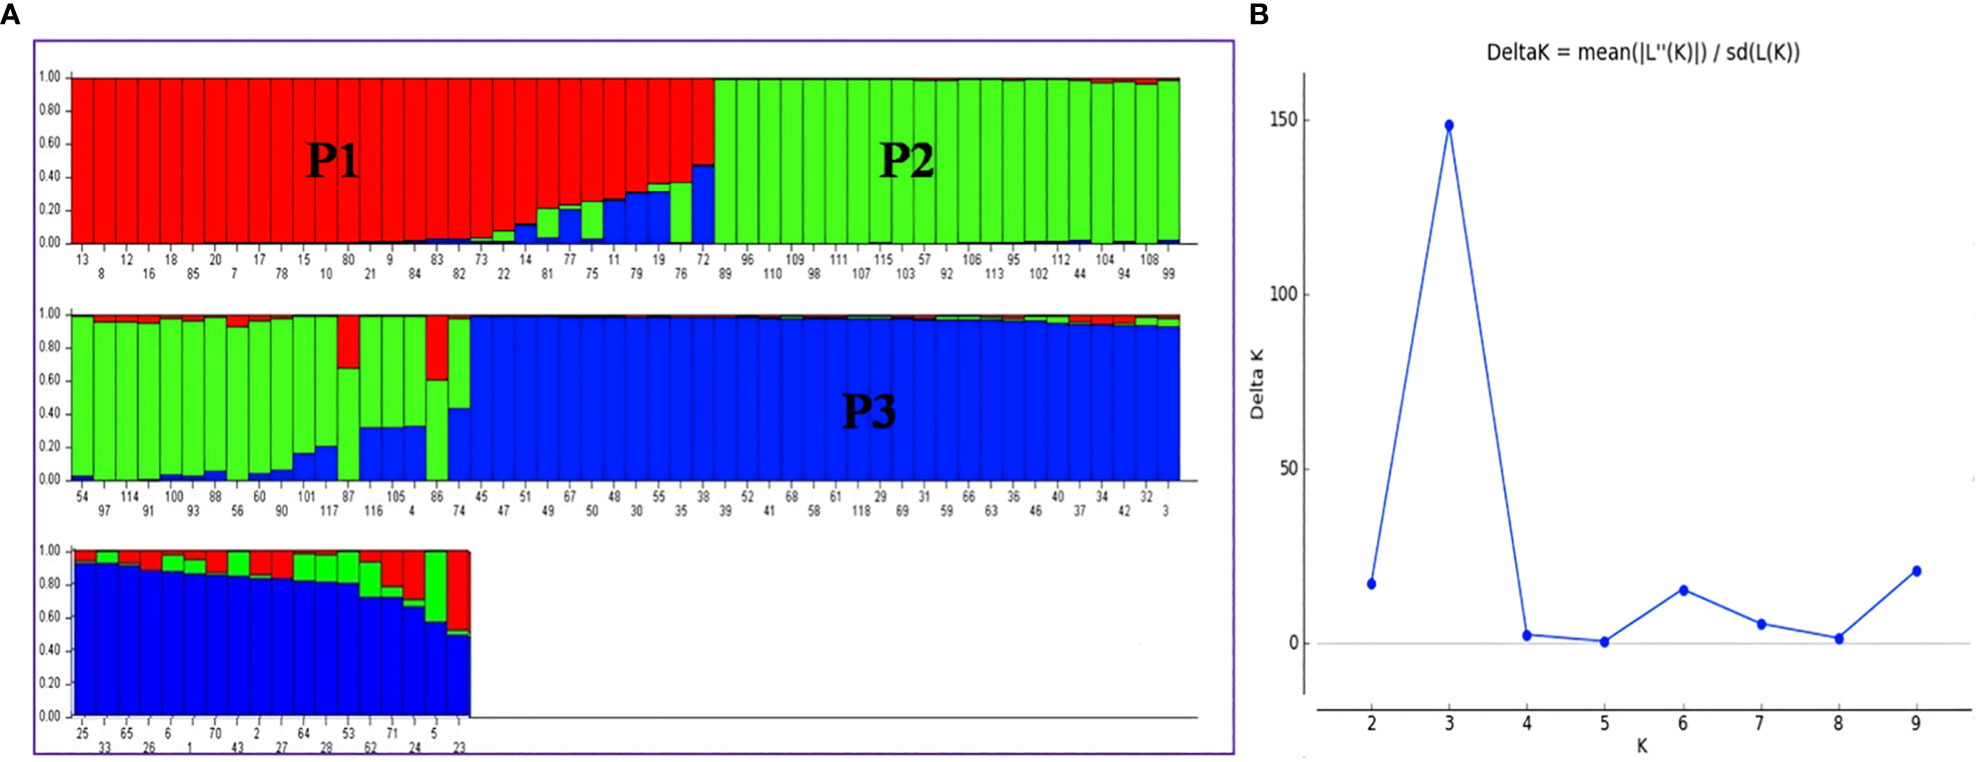
Figure 6 (A) Population structure of association mapping in a panel of 118 rice lines (K = 3), (B) Graph of ΔK value to the rate of change in the log probability between (−LnPK) successive K values (K = 3). P1, Population 1; P2, Population 2; P3, Population 3. The bar plot represents the sub-populations, where each bar indicates a single line and each color represents the ancestry or recombination. A single bar with single color indicates the same ancestry; a single bar with more than one color indicates admixture/two populations.
3.6 Common and consistent marker–trait associations across years and seasons
A total of 59 common significant marker–trait associations (MTAs) (R2>0.1 with p<0.05) were detected when analyzed by both GLM and MLM, whereas 78 significant MTAs were detected when analyzed only in MLM, in all seedling traits, root- related traits, yield and yield related traits. For SVI with 19 seedling vigour traits at 14 and 21 DAS R2 and p-values are given in Tables 1, 2 and Figures 7A–D. The marker, RM3188 associated with the trait RSA showed the highest R2 (0.336), with the corresponding p-value of 2.83E-07 followed by RM80 with RSA (R2 = 0.232, p = 0.0019) and RM22961 with SL (R2 = 0.192, p = 7.94E-04) at 14 DAS. At 21DAS, RM25310 associated with TDW exhibited the highest R2 (0.224) and p (0.010), followed by RM25310 with SDW (R2 = 0.205, p = 0.018) and RM13962 with RL (R2 = 0.181, p = 0.016). Three common significant MTAs were observed viz. RM22961 with SL and TSL, RM28157 with RLPV and RM1385 with SL consistently at both 14 and 21 DAS during 2018 and 2019.
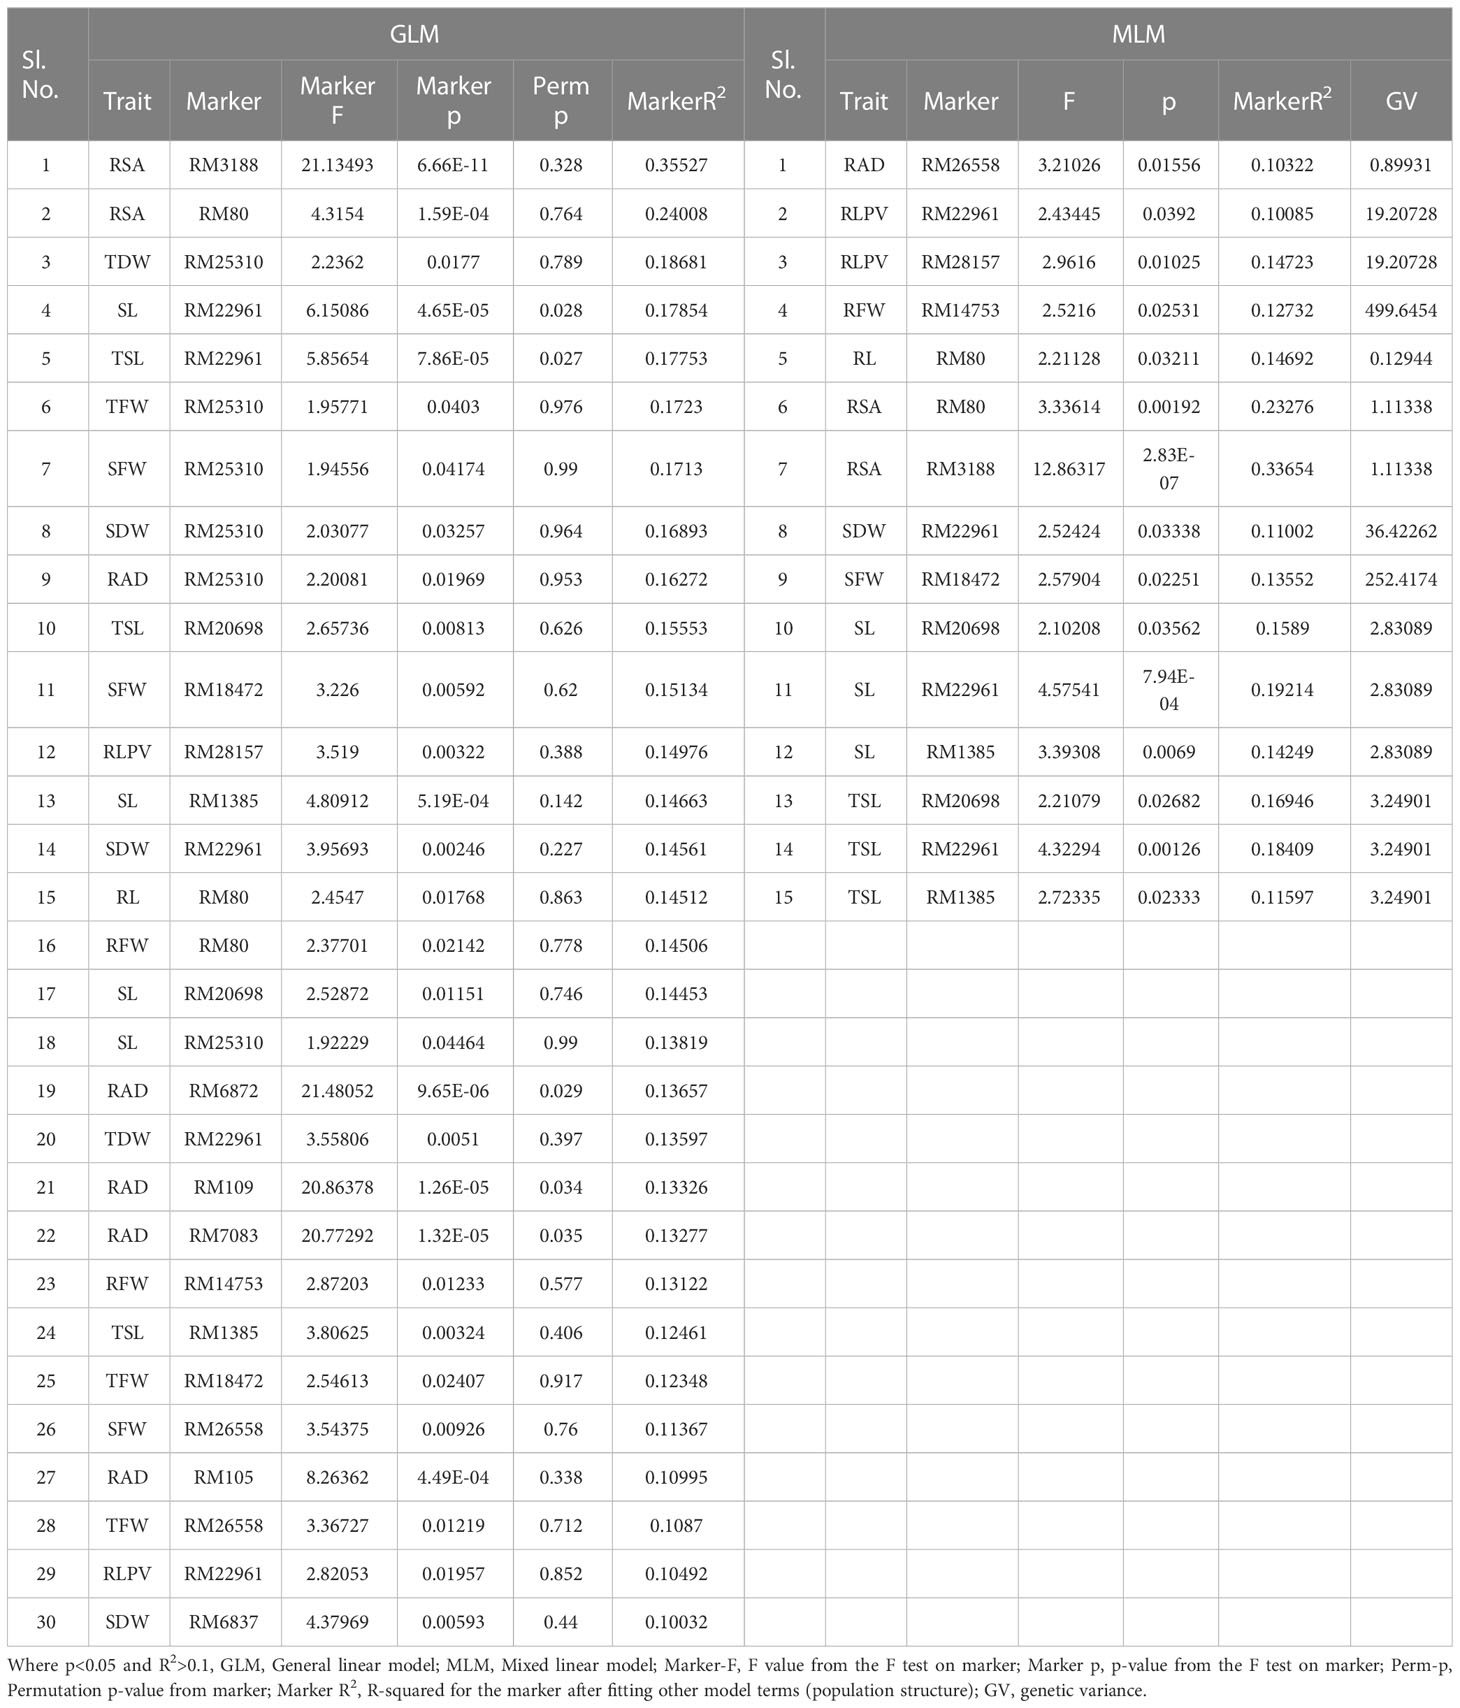
Table 1 Marker–trait associations for SVI 14 DAS under polyhouse 2018 and 2019 (GLM and MLM) (SVI_P).
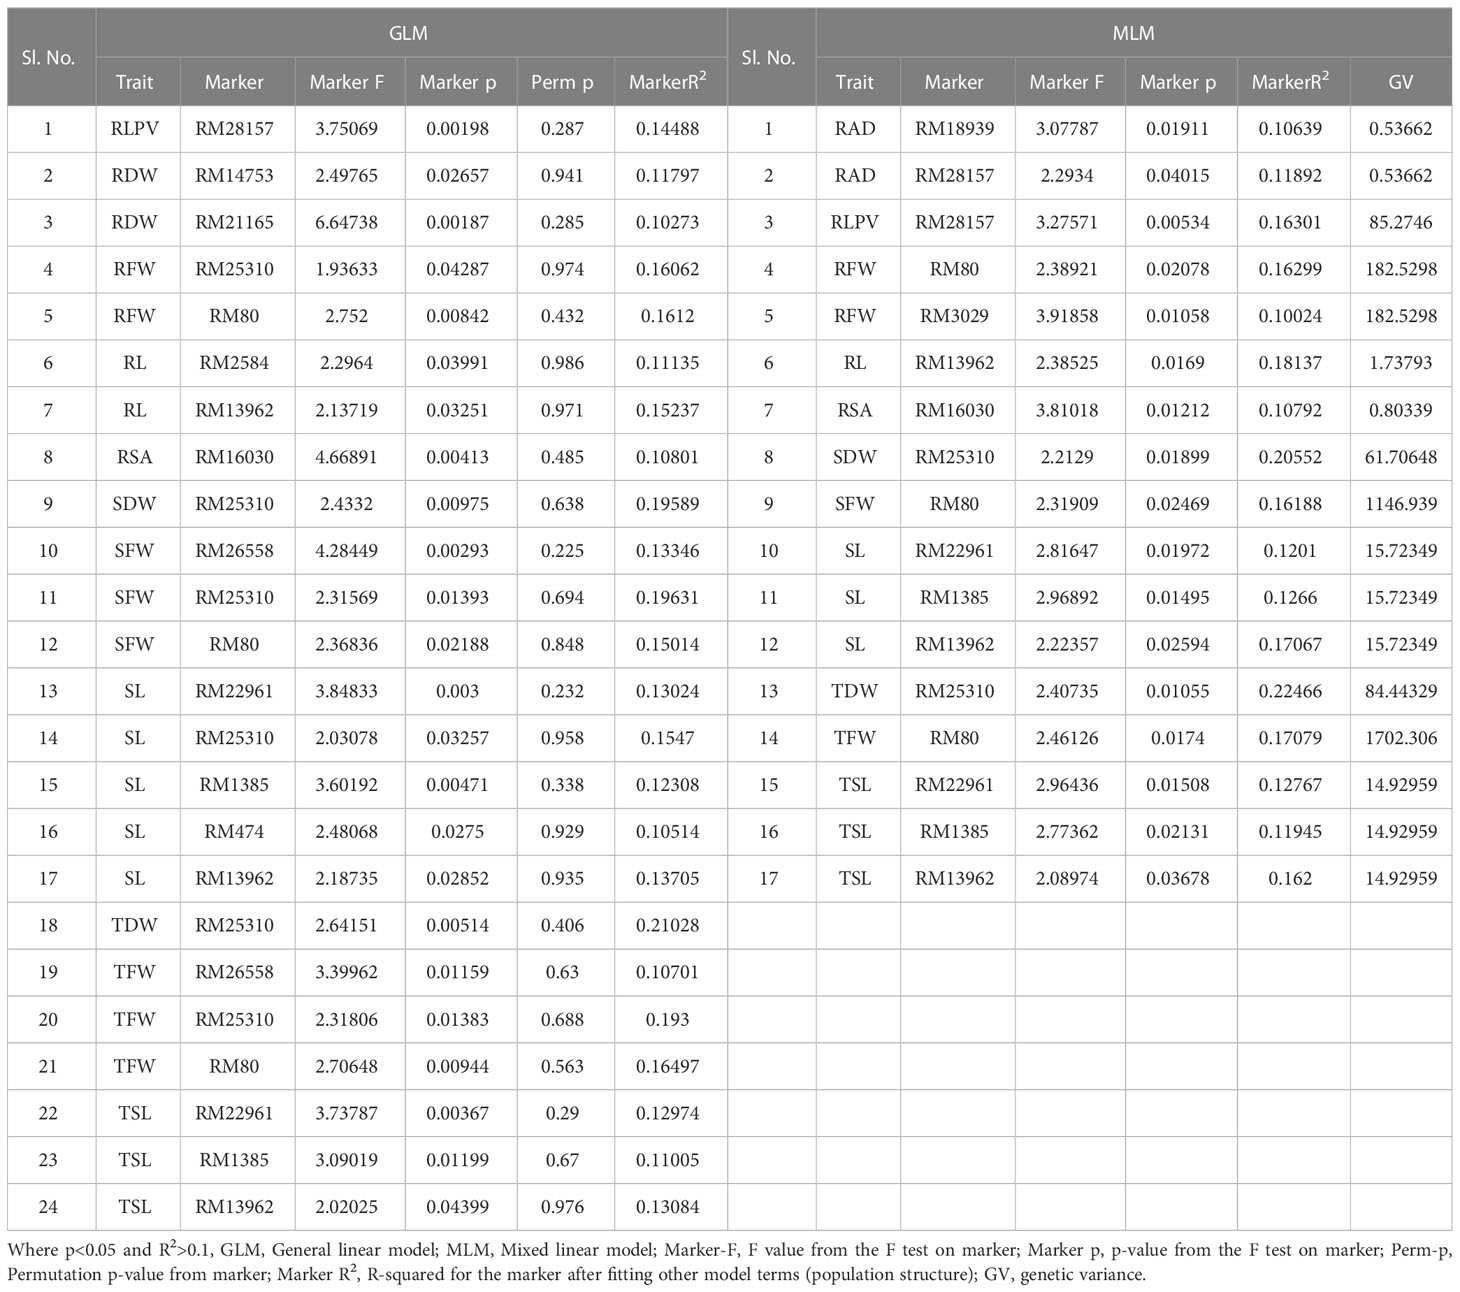
Table 2 Marker–trait associations for SVI 21 DAS under polyhouse 2018 and 2019 (GLM and MLM) (SVI_P).
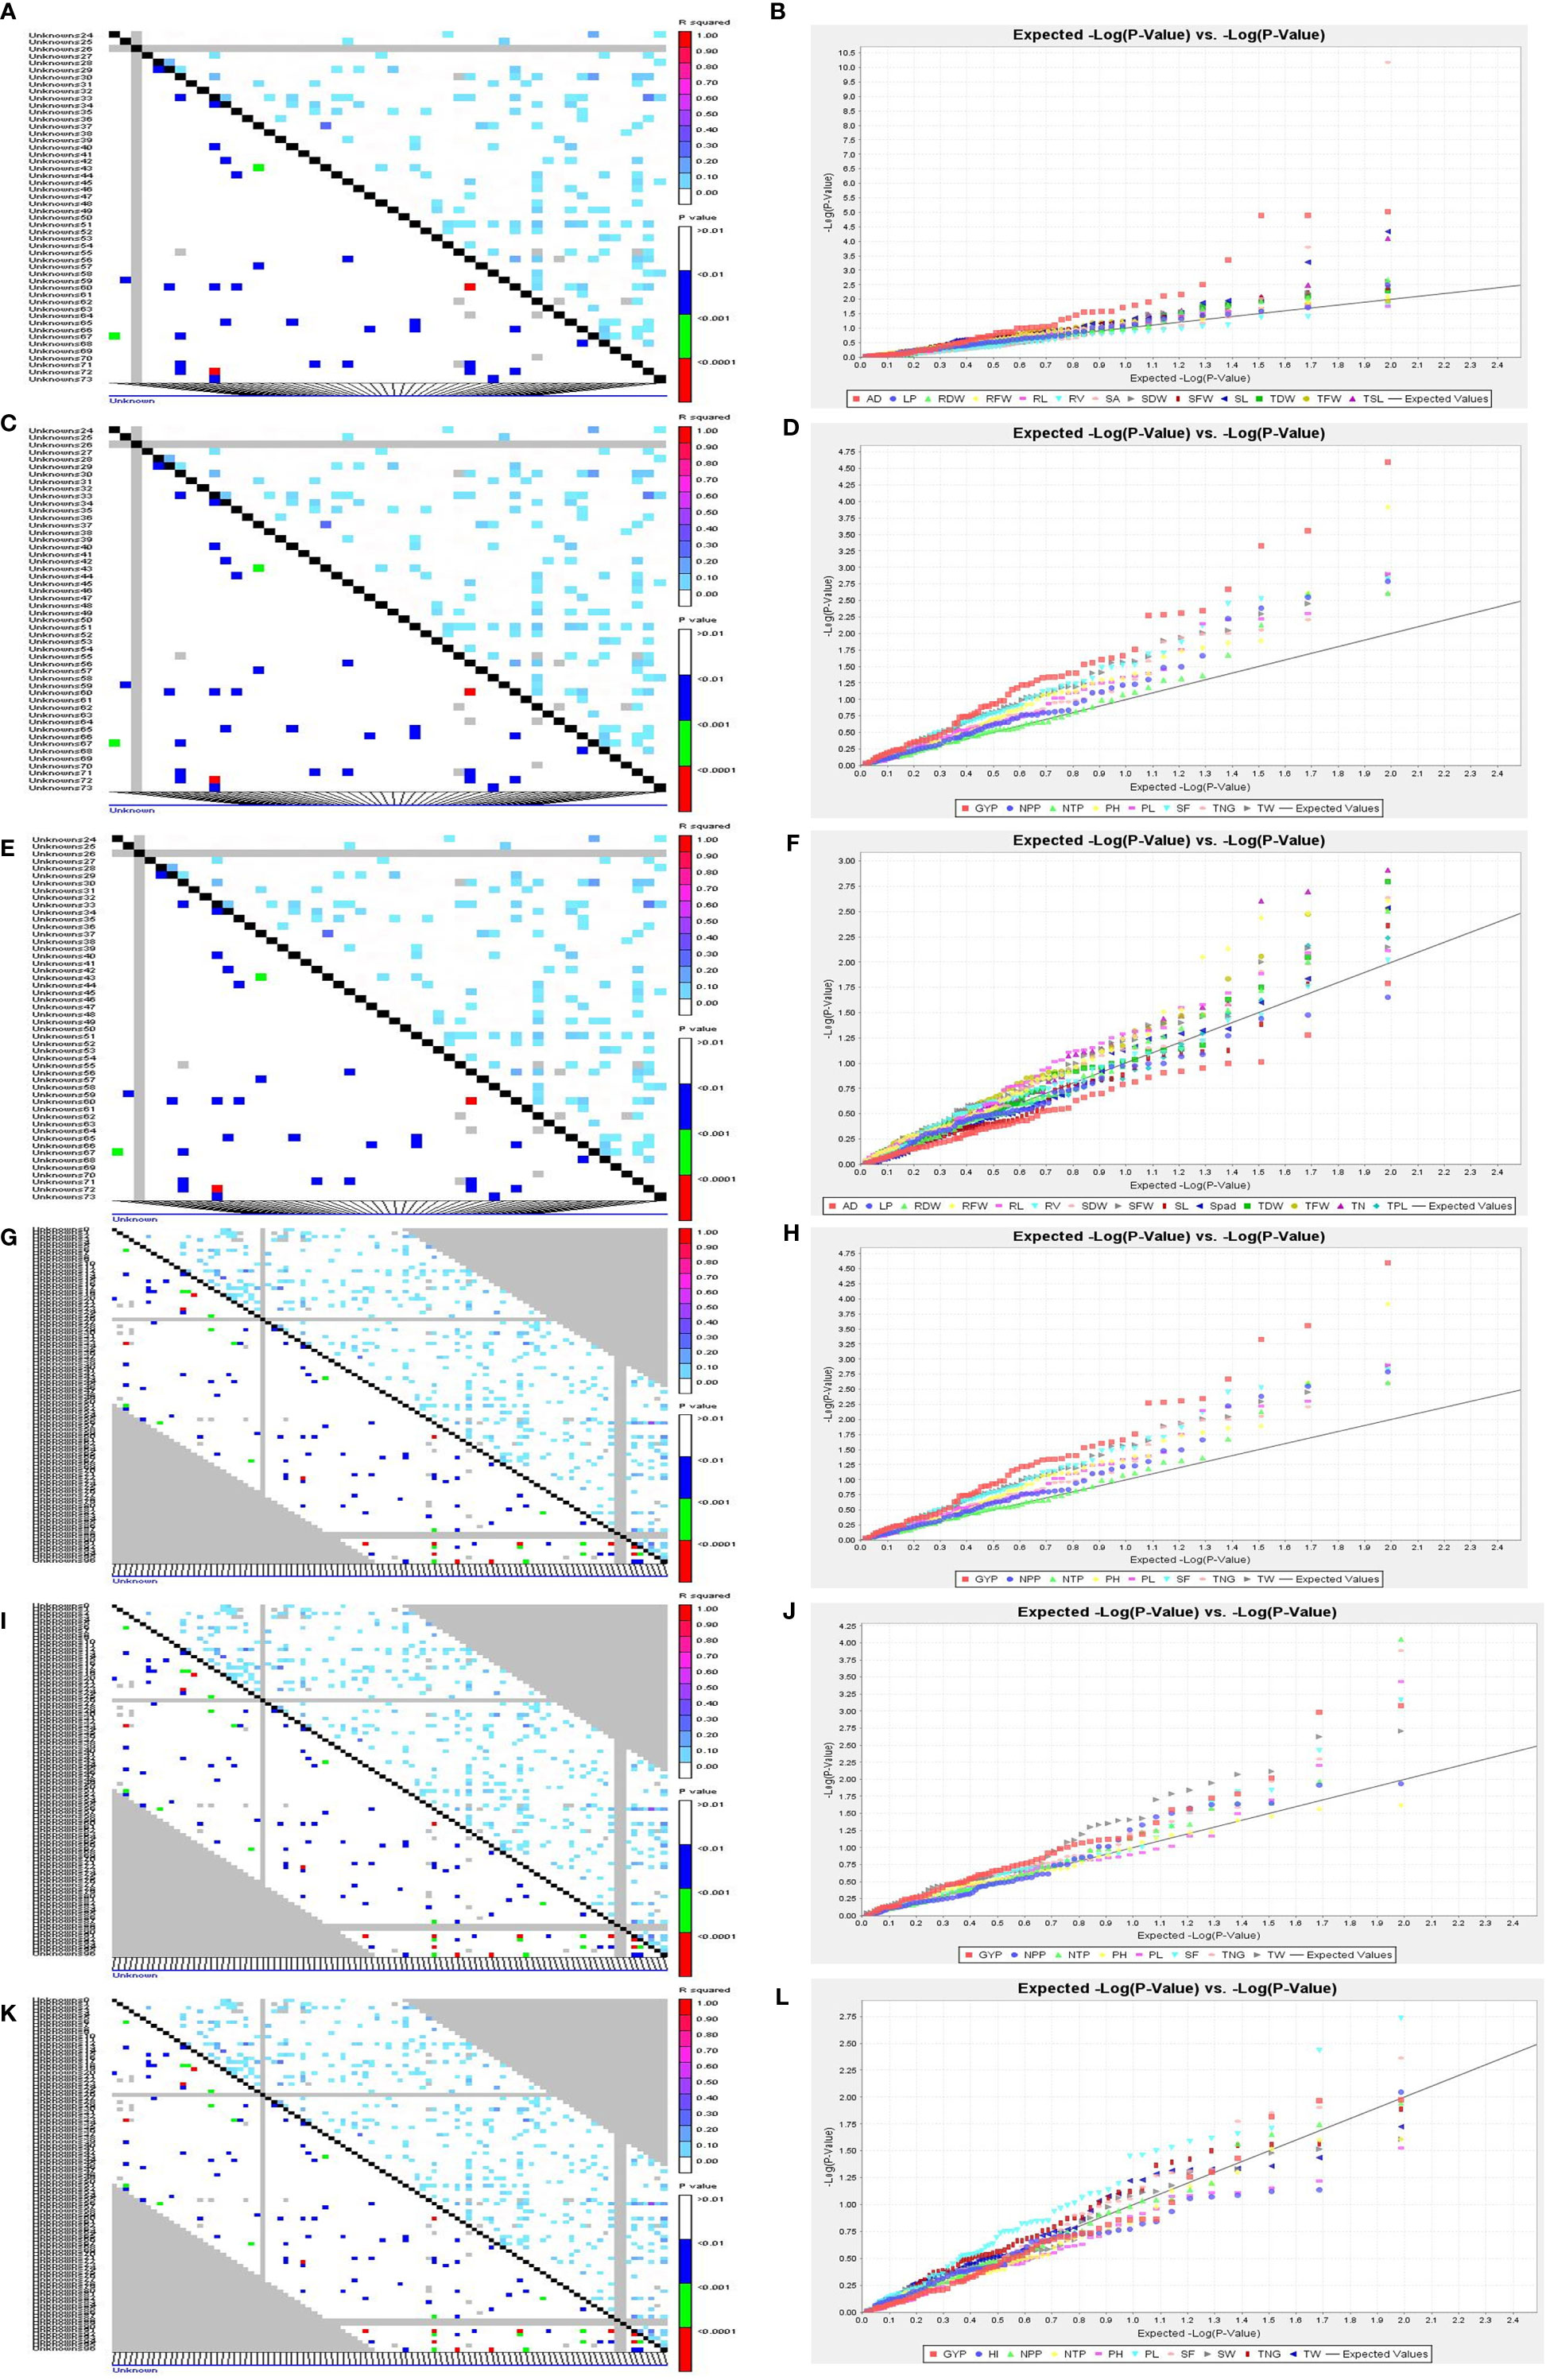
Figure 7 LD and QQ-Plot for SVI traits in the rice association panel. (A) LD plot 14 DAS polyhouse, (B) QQ-Plot 14 DAS polyhouse, (C) LD plot 21 DAS polyhouse, (D) QQ-Plot 21 DAS polyhouse, (E) LD-plot PI stage aerobic, (F) QQ-Plot PI stage aerobic, (G) LD-plot irrigated-IIRR, (H) QQ-plot irrigated-IIRR, (I) LD plot irrigated Dhadesugur, (J) QQ-plot irrigated Dhadesugur, (K) LD-plot aerobic Dhadesugur, (L) QQ-plot aerobic Dhadesugur.
At the PI stage association of molecular markers with root traits under the polyhouse, conditions were recorded (Table 3 and Figures 7E, F). The marker RM80 associated with TN showed the highest R2 = 0.177 and p = 0.009 followed by RM2584 with R2 = 0.168 and the corresponding p = 0.003, followed by the marker RM410 associated with RL having R2 = 0.121 and p = 0.03 (Supplementary Figure S9).
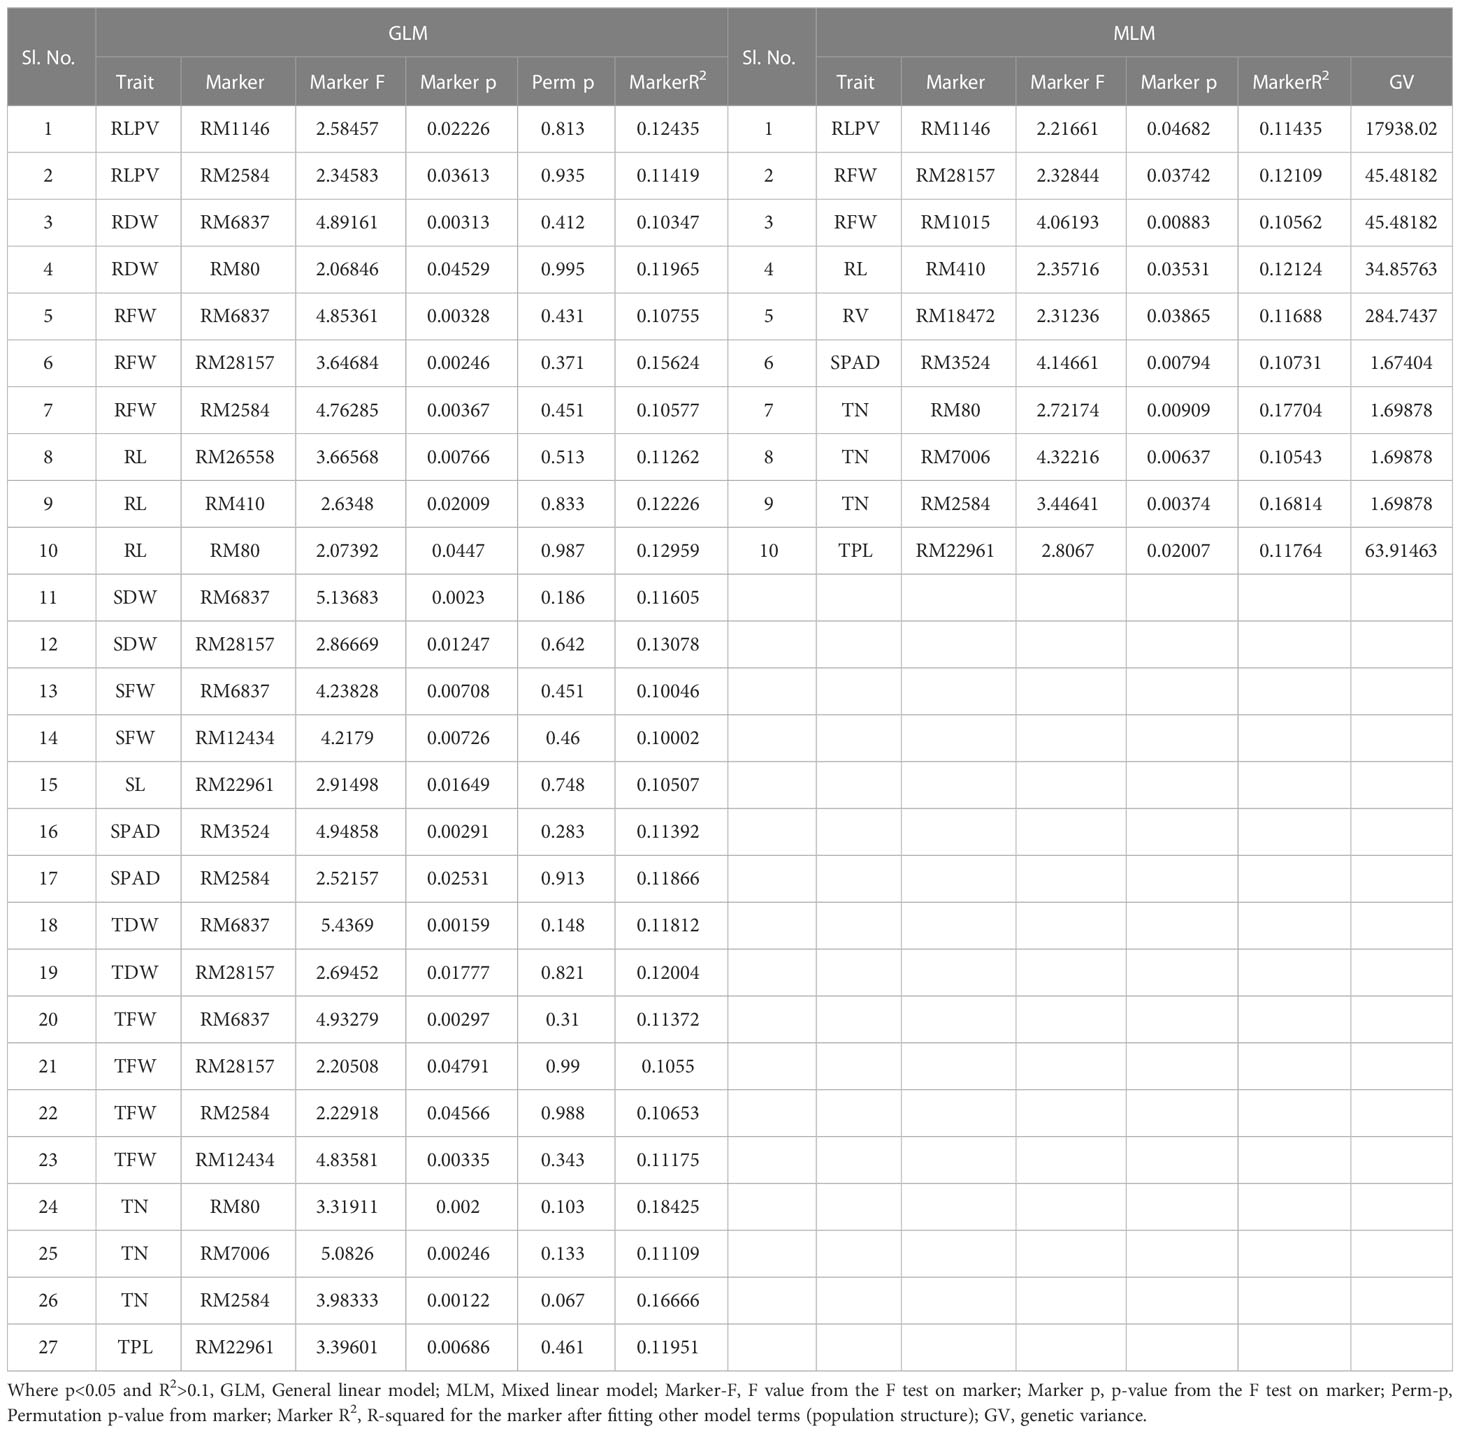
Table 3 Marker–trait associations for root traits at panicle initiation (PI) stage under aerobic condition 2019 (GLM and MLM) (Root_PI).
The associations of molecular markers with yield and yield-related traits in rice under irrigated conditions at ICAR-IIRR (Table 4 and Additional File 2 and Figures 7G, H) have been mentioned. The marker RM20698 associated with PH exhibited the highest R2 (R2 = 0.22751, p = 0.0013), (R2 = 0.243, p = 0.0015) for the years 2019 and 2020 respectively, followed by PL with the R2 = 0.177 and p = 0.009, the markers RM13962 associated with PH and TNG also showed high R2 values 0.167 and 0.157, p-values of 0.025 and 0.038 respectively.
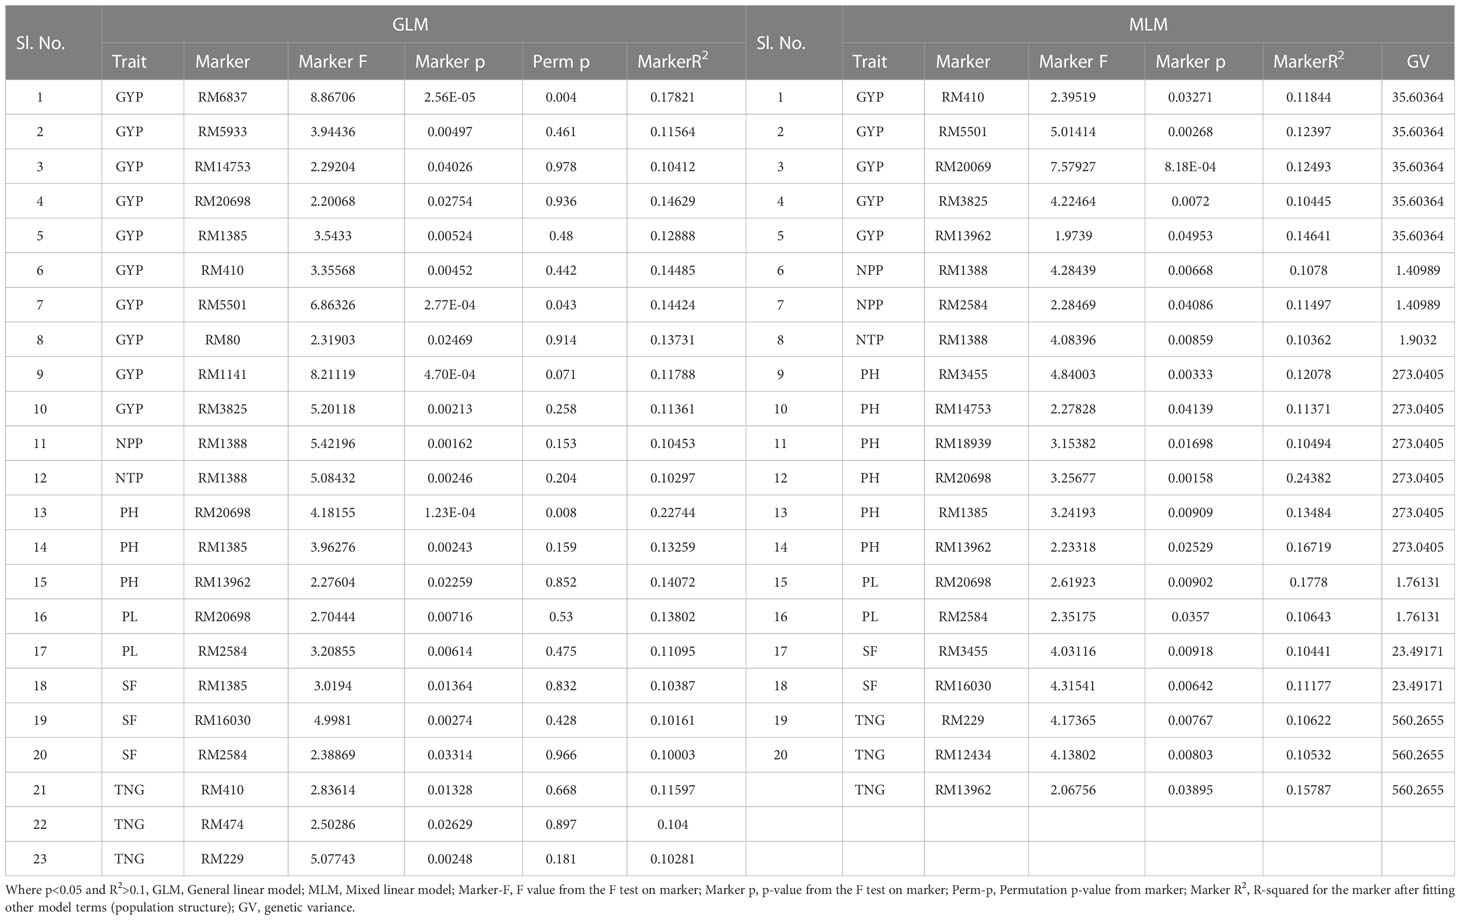
Table 4 Marker–trait associations for yield and yield-related traits under irrigated condition at ICAR-IIRR, wet season and dry season 2020 (GLM and MLM) (Irri_RJN).
The association of molecular markers with yield and yield-related traits in rice under irrigated conditions at Dhadesugur (Table 5; Figures 7I, J) showed the highest association for the traits. The highest association was observed for the traits NPP, SF, and TNT with the markers RM25310 (R2 = 0.189, p = 0.03), RM18472 (R2 = 0.174, p = 0.004) and RM2584 (R2 = 0.163, p = 0.005) respectively. The association of molecular markers with yield and yield-related traits in rice under aerobic conditions at Dhadesugur is given in Table 6; Figures 7K, L. A total of four significant MTAs were identified among them RM22961 and RM1146 were associated with GYP (R2 = 0.101, 0.128 and p-value = 0.042, 0.025 respectively), RM4455 with PL (R2 = 0.114 and p-value = 0.005) and RM3188 with SF (R2 = 0.101 and p-value = 0.01). The marker RM1146 showed the highest R2 value of (0.128) with GYP. The Q-Q plot, Manhattan plot and LD plots obtained from TASSEL 4 also confirmed the significant association of markers with the traits. The Q-Q plot distribution depicted that the data is symmetric and the distributions of p-values according to the traits were normally distributed and also considered the type of error (Type I and II) in deciphering the MTAs.
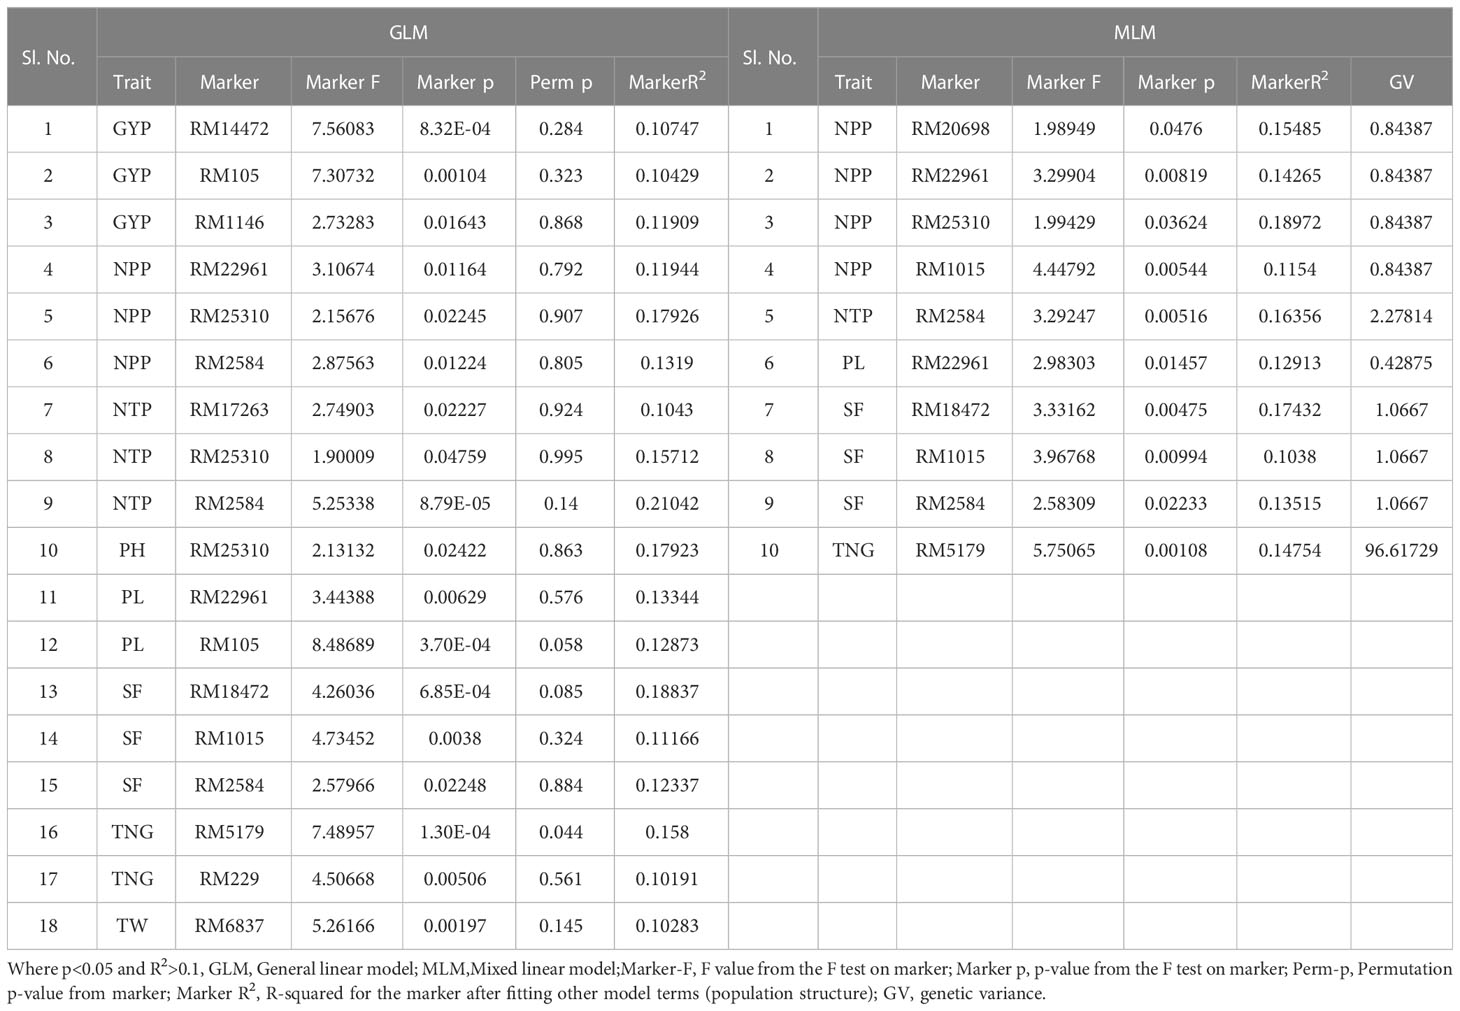
Table 5 Marker–trait associations for yield and yield-related traits under irrigated condition at Dhadesugur wet season 2020 (GLM and MLM) (Irri_DSG).
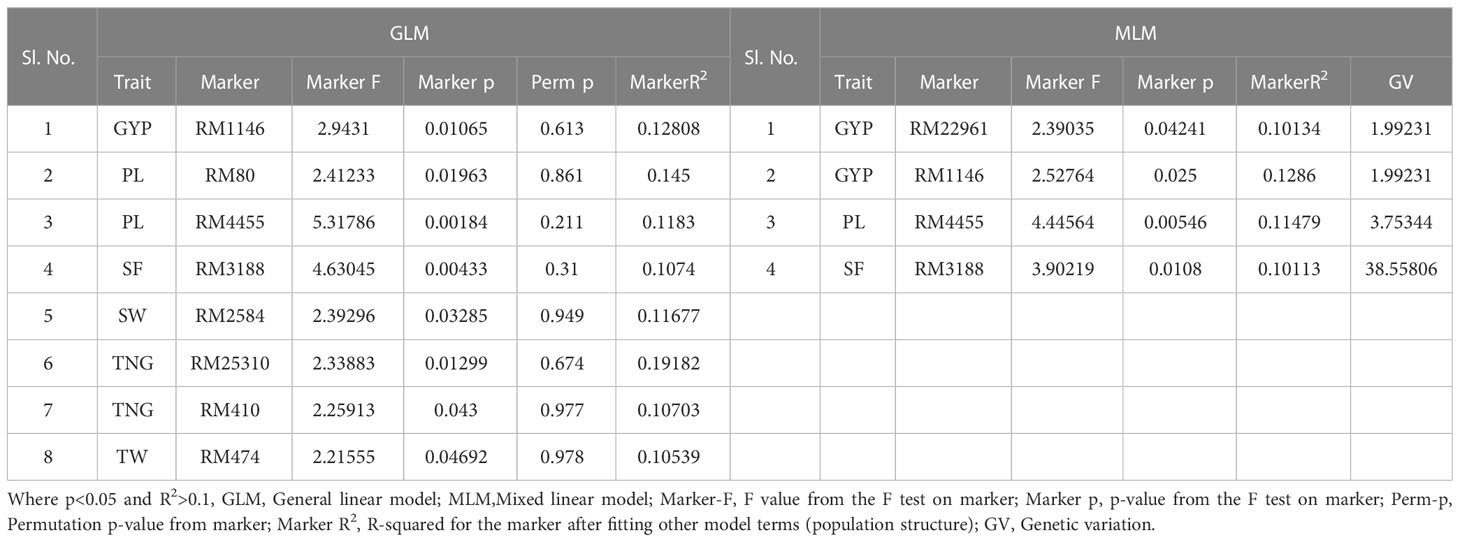
Table 6 Marker–trait associations for yield and yield-related traits under aerobic condition at Dhadesugur wet season 2020 (GLM and MLM) (Aero_DSG).
Seven significant MTAs were consistent over the years 14 DAS in 2018 and 2019 for SVI under polyhouse conditions the marker RM25310 was significantly associated with the trait GP and TDW, RM2584 with GP, markers RM14753 and RM80 were significantly associated with the trait RFW, RM22961 was significantly associated with the traits SDW, SL, SVI, TSL, RM18472 with SFW, TFW and the marker RM1385 was significantly associated with the traits SVI-I, TSL. There were four significant MTAs which were consistent over the years for 21 DAS in 2018 and 2019 SVI-II under polyhouse conditions. The marker RM25310 was significantly associated with the traits GP, SDW, SVI-II, TDW and TFW. The marker RM80 was associated with the RFW, SFW and TFW, RM22961 with SL, SVI-I, TSL and RM1385 was significantly associated with the traits SL and TSL. Four significant MTAs were consistent over years both 14 and 21 DAS in 2018 and 2019 for SVI under polyhouse conditions. The marker RM25310 was significantly associated with the traits GP and TDW. The marker RM80 was associated with the RFW, RM22961 with SL, SVI-I, TSL and the marker RM1385 was significantly associated with TSL (Additional File 2).
Two MTAs viz., RM410 associated with GYP and RM20698 associated with PH were consistent over the years under irrigated conditions at IIRR. Two MTAs viz., RM2584 associated with spikelet fertility and RM5179 associated with TNG were consistent under irrigated conditions at IIRR and DSG. The marker RM2584 was significantly associated with the trait SW and GYP under aerobic and irrigated conditions at DSG respectively (Additional File 2).
3.7 In silico identification of genes spanning 1Mb of highly significant markers
In total eighteen markers associated with more than two traits in GLM and MLM were selected for in-silico identification of genes spanning the 1 Mb region upstream and downstream of the marker (Table 7). The maximum significant MTAs were found on the chromosomes number 2, 3 and 12.
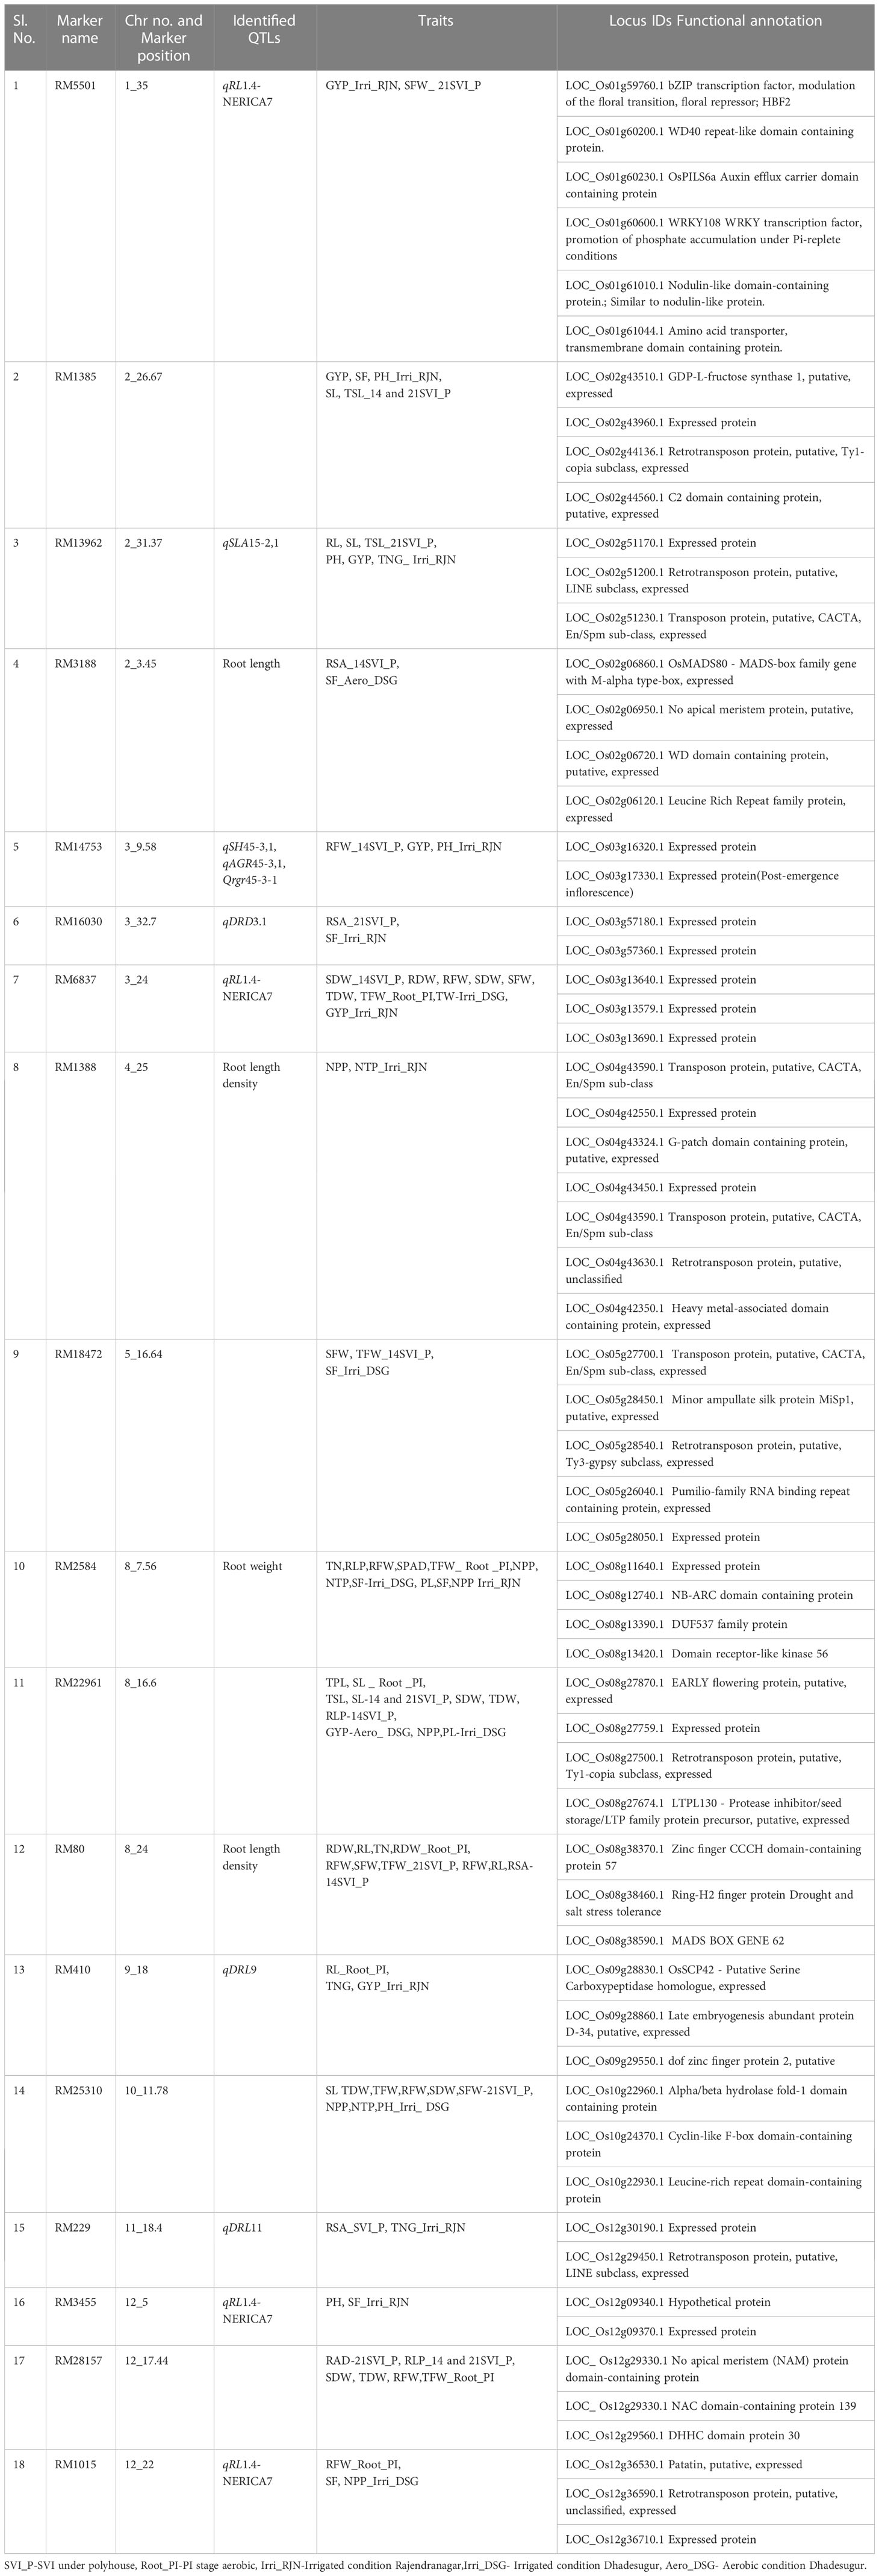
Table 7 In-silico identification of genes spanning 1 Mb of highly significant marker (having two or more associations).
The gene information was fetched from all the databases for root and panicle tissues at seedling and reproductive stages (Additional File 3). Based on the functional relevance of the genes, twelve genes were shortlisted and proposed to be promising candidates associated with the traits recorded in the present study (Figure 8).
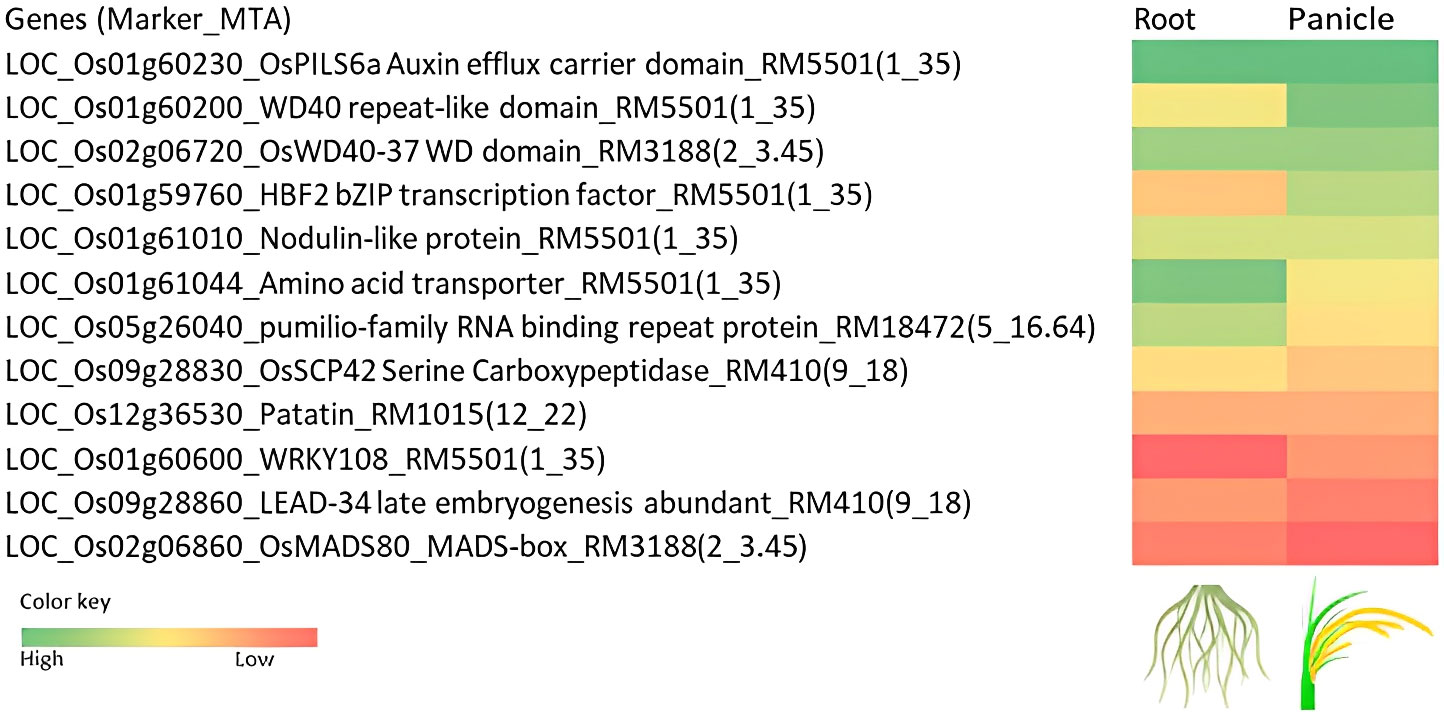
Figure 8 Heat map showing the scores based on the in-silico expression of genes associated with the marker–trait associations (MTAs) in the root and panicle tissues. The in-silico expression is based on the rice expression databases viz., Rice Expression Database (RED) IC4R (http://expression.ic4r.org/), RiceXpro (https://ricexpro.dna.affrc.go.jp/), RGAP Rice Genome Annotation Project (http://rice.uga.edu/cgi-bin/ORF_infopage.cgi), RGI Rice Gene Index (https://riceome.hzau.edu.cn), NetREx Network-based Rice Expression Analysis (https://bioinf.iiit.ac.in/netrex/index.html), RAPDB The Rice Annotation Project Database (https://rapdb.dna.affrc.go.jp/search/).
The marker RM5501(1_35) had six functionally significant genes encoding, HBF2 bZIP transcription factor involved in the modulation of the floral transition, WD40 repeat-like domain-containing protein, OsPILS6a Auxin efflux carrier domain-containing protein, WRKY108 WRKY transcription factor, Promotion of phosphate accumulation under Pi-replete conditions, nodulin-like domain-containing protein, amino acid transporter, transmembrane domain-containing protein. The gene LOC_Os01g60230 encoding OsPILS6a, a PIN-like gene family of rice auxin and cytokinin has been reported as a floral transition in rice. It displayed upregulation upon stress induction, expressed in roots (in the elongation zone) after drought induction. The gene, LOC_Os01g61044 encoding the amino acid transporter has been associated with the number of spikelets per panicle under direct seeding (Rebolledo et al., 2016). This gene has also been reported to express after drought and ABA, cytokinin treatment. The marker RM14753(3_9.58) associated with seedling vigor index had expressed protein and the in silico databases showed upregulation of the gene in root under abiotic stress. The pumilio-family RNA binding repeat-containing protein (RM18472(5_16.64), SFW, TFW_14SVI_P, SF_Irri_DSG), OsSCP42 serine carboxypeptidase (RM410(9_18), RL_Root_PI, TNG, GYP_Irri_RJN), patatin (RM1015(12_22) (RFW_Root_PI, SF, NPP_Irri_DSG) have been reported to be upregulated upon ABA treatment, drought, cold, and osmotic stresses. These genes are associated with the root traits at seedling and reproductive stages and can be further explored for gene expression in roots. The amino acid transporter (GYP_Irri_RJN) has been recorded to be expressed in roots, panicle tissues, and upon induction of abiotic stresses. The OsWD40-37 WD domain-containing protein (RM3188(2_3.45)) is proposed to be a promising candidate for further studies related to yield under aerobic conditions.
4 Discussion
The present study indicated the presence of significant genetic variability and a strong positive correlation for seedling vigour traits, root traits, and yield and yield-related traits at all the studied environments and conditions, revealing that sufficient variability was present in the association panel (Suralta et al., 2010; Dhanwani et al., 2013; Chen et al., 2019). Highly variable traits are preferred in breeding programmes for maximizing the genetic base (Barde et al., 2021). High GCV and PCV coupled with high heritability and high GAM were observed for maximum studied traits, the heritability of broad-sense (h2bs) was divided into three categories: high (above 60%), medium (30%–60%), and low (less than 10%). (Robinson et al., 1949). GAM is also divided into three categories: high (>20%), medium (10–20%), and low) (below 10 %) (Johnson et al., 1955). Estimates of genetic advance as per cent of mean (GAM) provide more trustworthy information on the effectiveness of selection in trait improvement (Islam et al., 2015). Broad sense heritability contains both additive and epistatic effects; it will only be trustworthy when combined with a high level of genetic advance. In forecasting the efficiency of selection, heritability estimates combined with genetic advances are more useful than heritability alone (Dhanwani et al., 2013). High GCV and PCV coupled with high heritability and high GAM were observed for the traits like the number of tillers per plant, the number of panicles per plant and grain yield per plant, these traits were controlled by additive gene action, which could be improved through simple selection methods. The characters with a high GCV and PCV, as well as a high heritability and GAM, indicate that the character is driven by additive gene action and the selection could be beneficial in improving it (Amegan et al., 2020; Demeke et al., 2023). The narrow difference between GCV and PCV implies that most features are less influenced by the environment. The heritability estimates for a given feature determine the reliability of the phenotypic value. As a result, high heritability aids in the efficient selection of a specific trait, hence quantitative trait genetic analysis is critical for breeding programmes.
Breeding for seedling vigour has been a major breeding target in rice and other crops under DSR (Zhao et al., 2006). Relatively, till now, the breeding efforts for aerobic dry direct seeded rice is sparse as compared to other traits in rice (Xu et al., 2020). Hence, the rice breeders need to exploit appropriate genetic differences among rice germplasm to determine the magnitude of genetic variation and to dissect the genetic basis of seedling vigour. Earlier reports on seedling vigour used higher germination percentage as an indicator of good seedling vigour. Seedling vigour with quantitative inheritance traits is significantly influenced by morphological, physiological and biochemical traits (Mahender et al., 2015). Correlated traits such as seedling height, seedling dry weight, rapid shoot growth, shoot dry weight, shoot length, coleoptile length and root length have been identified (Fujino et al., 2008; Trachsel et al., 2010; Yang et al., 2010; Singh et al., 2017). The correlation study identified a positive association between shoot dry weight and root dry weight 14 and 28 days (Kato and Okami, 2010; Anandan et al., 2022). Germination rate, root activity, leaf area and chlorophyll content (Cairns et al., 2009; Wang et al., 2010; Dang et al., 2014) have been reported. Rapid germination (Xie et al., 2014), anaerobic germination (Septiningsih et al., 2013) and shoot development improves seedling establishment (Lee et al., 2012) under direct seeding situations. The relative water content (RWC) of the susceptible and shallow rooting genotype reduced to 72% as compared to the tolerant and deep rooting genotype Azucena which showed the RWC of 80% when exposed to the 14 days water stress treatment (Abdirad et al., 2022).
Based on our findings, the lines viz., Langphou, Mouli, TI-128, JBB-631-1, Ratnachudi and Tellahamsa showed promising performance for seedling vigour traits. Lines namely, NPK-45, Moirangphou-Angouba, JBB-661, Wangoo-Phou, GNV-1109, NPK-13 and Dissi showed promising performance for root-related traits. Similarly, lines viz., KR-209, Pat-Phou, JBB-631-1, SM-363, Wangoo-Phou, PB-3 and MTU1010 showed promising performance for yield and yield-related traits under irrigated conditions. The lines Phouren, Ratnamudi, NPK-43, TI-112, TI-87, JBB-631-1 and JBB-684 showed promising performance for yield traits under aerobic conditions. From the overall field experiments considering all the environments and all the locations the lines Langphou, KR-209, JBB-631-1, Akut-Phou, TI-36, GNV-14-96-1 and NPK-43 exhibited consistent performance for yield and yield-related traits like GYP, TW, SF and NPP over the checks.
Genetic diversity is the key determinant of germplasm utilization in crop improvement. Population with a high level of genetic variation is a valuable resource for broadening the genetic base in any breeding program. The lines used in this study should have a complex breeding history, from diverse genetic backgrounds (Pandit et al., 2017; Sahu et al., 2020; Yadav et al., 2021). In this study, the landraces from North-Eastern India showed considerable features for root length, root volume and yield. Such Indian landraces harbour alleles of economic importance and can be explored further. The landraces are considered gold mines for improving economically important agronomic traits as they are adapted to local environments without any additional input while cultivating. They harbour regions that have not been utilized in the breeding programs and whatever association is expected is because of their evolutionary history and recombination (Rao et al., 2018). The North-Eastern landraces have been phenotyped for the very first time for the root traits under aerobic conditions and present a novel genetic source for utilizing in breeding programs for developing climate-resilient rice varieties.
The mutant lines, and introgression lines identified for yield (based on earlier reports) were selected for exploring the traits desirable for the aerobic system of cultivation, those lines also had desirable traits as well as co-relation with yield. The marker–trait associations reveal that robust MTAs identified could serve as a valuable resource for enhancing seedling vigour, root traits and yield-related traits indicating their feasibility to use in the marker-assisted breeding programme. We considered majorly the associations identified by the MLM over the associations identified by the GLM (Yu et al., 2006). The MLM considers both population structure and kinship, which is more suitable over GLM, where only population structure is considered for analyses especially when there is no prior information regarding the lines in the association panel (Rao et al., 2018). The false positives were well controlled by the MLM model which indicated the robustness of results obtained through statistical analysis. The significant SSR markers associated with the (R2 of >0.1 and p-value < 0.05) with more than two phenotypic traits were selected for searching the nearby genes in 1Mb spanning region. The genes identified were consistent with the associated phenotypes. Among the significant MTAs, six hypervariable markers viz., RM1385, RM18472, RM18939, RM22961, RM25310 and RM28157 on the chromosome numbers 2, 5, 5, 8, 10 and 12 respectively were found to be novel for the identified genes. Our results correlate with earlier report by Xu et al. (2020) and Zhang et al. (2020) where four QTLs have been identified on chromosomes 3, 6, and 8 whereas, two QTLs (LOC_Os03g08880 and LOC_Os06g13060) were linked to maximum root length and two were related to total root weight. The marker RM22961 associated with traits TSL and SL at the seedling stage at 14 and 21 DAS and also associated with TPL and SL at the PI stage and with grain yield per plant under aerobic conditions. Khodaeiaminjan et al., 2023 identified the MTAs viz., ‘BOPA1_1582-63’ on chromosome 5H for root/shoot ratio and ‘SCRI_RS_192761’ on chromosome 3H for shoot dry weight for control and osmotic stress conditions. In phenotypic correlation analysis also the trait total seedling length showed a significant correlation with the seedling vigour index traits. The marker RM22961 with the seedling height and grain yield trait under aerobic conditions can be taken up as a strong marker–trait association of this marker. In our study markers RM2069 associated with PL and NPP, and RM2584 with PL, NPP and NTP and SF for yield-related traits under the irrigated condition at two different locations at ICAR-IIRR and Dhadesugur respectively. However, consistent expression of these two markers can be strong evidence for association with the particular yield contributing traits hence these markers can be directly used for the selection of yield traits under irrigated conditions. The marker RM25310 was significantly associated with GP and TDW, RM2584 with GP, RM14753 and RM80 with RFW, RM22961 with SDW, SL, SVI-I, TSL, RM18472 with SFW, TFW and RM1385 with the traits SVI-II, TSL were consistent over year for seedling traits at 14DAS. The marker RM25310 was significantly associated with GP and TDW, RM80 with the RFW, RM22961 with SL, SVI-II, TSL and the marker RM1385 with the traits TSL were consistent over the year for seedling traits at 21DAS. The marker RM410 was significantly associated with the trait GYP and RM20698 with PH were consistent over the year for yield traits under irrigated conditions, whereas the marker RM2584 was significantly associated with the trait SW and GYP under the aerobic and irrigated condition at DSG respectively. The in-silico analysis identified abiotic stress-related genes viz., NAM, LEA, MADS, NAC, bZIP, WRKY, RING finger, spanning the nearby regions of the markers implying high co-relation of the marker with the root and yield traits contributing to aerobic adaptation, whereas Abdirad et al. (2022), identified the genes involved in root development and drought tolerance were identified viz., OsbHLH120 for root thickness, OsNAC10 for root thickness and drought tolerance, OsPHR3 for LR development, PIP1;3/RWC3 for root length and water stress avoidance, OsMADS18 for root elongation, and OsNLA1 for root length and growth through transcriptome study. Anandan et al., 2022., identified two important peptide transporters (PTR5 and PTR6) involved in mobilizing nitrogen in the root during the early vegetative stage on chromosome 4, (30 Mb), and at 14 days. A novel QTL from 21.12 to 21.46 Mb on chromosome 7 with two linkage disequilibrium (LD) blocks governing root length was identified. Rebolledo et al. (2016) identified six MTAs associated with panicle architecture and the number of spikelets per panicle, NECKLEAF1 (nl1) associated with NSPexp1. OsMADS6-5 was present within the LD block of q-25 which controls the floral organ identity and flowering time. Further linked markers can be utilized for aerobic breeding programs for the selection of SVI, root yield and yield-related traits under aerobic and irrigated conditions. The shortlisted promising candidates genes associated with the yield and root-related traits can be further analysed for quantitative gene expression and functional cloning.
5 Conclusion
The present study is novel and the first of its kind in India wherein the association panel has been studied concomitantly for seedling vigour, root traits, as well as yield and yield-related traits under aerobic conditions. The conglomeration of these traits at the seedling stage, panicle stage as well as reproductive stages in different environments have given key insights on the association of SSR markers with highly variable and correlated phenotypic traits and the identification of novel MTAs and regions. Consistent MTAs were identified for RM25310 (GP and TDW), RM2584 (GP), RM14753 and RM80 (RFW), RM22961 (SDW, SL, SVI, TSL), RM18472 (SFW, TFW), RM1385 (SVI-II, TSL), RM25310 (GP, SDW, SVI-II, TDW and TFW), RM80 (RFW, SFW and TFW), RM22961 (SL, SVI-I, TSL), RM1385 (SL, TSL), RM410 (GYP), RM20698 (PH), RM2584 (SF), RM5179 (TNG), RM2584 (SW and GYP) under aerobic conditions. Rice lines having better early seedling vigour, robust root traits, yield and yield-related traits can be utilized for improving early seedling vigour, root, yield and yield related traits in breeding programmes as a pre-breeding material and donor lines for the aerobic system of rice cultivation. The stable introgression lines and mutant lines identified for robust root traits, and can be proposed for further evaluation in the multi-location rice trials of All India Coordinated Research Project on Rice (AICRPR) trials. The novel marker traits associations identified in this study can be validated in mapping populations to deploy in the marker-assisted breeding programs. Identification of candidate genes in the MTA region needs to be validated using gene expression studies and can be functionally validated through over-expression or new breeding technologies like gene. The association panel used in this study can be a basis for haplotype breeding for developing climate-resilient rice lines. The development of high yield potential, seedling vigor lines suitable for the aerobic system of cultivation is a need of the hour and will be in line with the government policy to double farmer’s income and livelihood with low input costs and maximum yield.
Data availability statement
The original contributions presented in this study are included in the article/Supplementary Material; further inquiries can be directed to the corresponding author.
Author contributions
The study was conceptualized and planned by KB; phenotyping of the panel was executed by RP, H, NM, AP; phenotypic and genotypic data analysis were done by RP, MB, DB, KB, GC, AS, YR, PS, JD; supervision and critical editing were done by KB, MM, LR, DS and RS. All authors contributed to the article and approved the submitted version.
Funding
This work was supported by the funds provided under the ICAR-IIRR Institute Research Council Project Code ABR/CI/BT/15.
Acknowledgments
The authors acknowledge Drs. C. N. Neeraja (Principal Scientist), Suneetha Kota (Senior Scientist), Jyothi Badri (Senior Scientist), and Satendra Kumar Mangrauthia (Senior Scientist) from ICAR-IIRR for sharing the seeds of experimental plant materials. The authors are thankful to the Director, ICAR-IIRR for providing research facilities. The first author thanks Director of Research, University of Agricultural Sciences, Raichur and Directorate of Minorities Fellowship for PhD studies.
Conflict of interest
The authors declare that the research was conducted in the absence of any commercial or financial relationships that could be construed as a potential conflict of interest.
Publisher’s note
All claims expressed in this article are solely those of the authors and do not necessarily represent those of their affiliated organizations, or those of the publisher, the editors and the reviewers. Any product that may be evaluated in this article, or claim that may be made by its manufacturer, is not guaranteed or endorsed by the publisher.
Supplementary material
The Supplementary Material for this article can be found online at: https://www.frontiersin.org/articles/10.3389/fpls.2023.1143853/full#supplementary-material
References
Abdirad, S., Ghaffari, M. R., Majd, A., Irian, S., Soleymaniniya, A., Daryani, P., et al. (2022). Genome-wide expression analysis of root tips in contrasting rice genotypes revealed novel candidate genes for water stress adaptation. Front. Plant Sci. 13, 792079. doi: 10.3389/fpls.2022.792079
Addanki, K. R., Balakrishnan, D., Yadavalli, V. R., Surapaneni, M., Mesapogu, S., Beerelli, K., et al. (2019). Swarna× Oryza nivara introgression lines: a resource for seedling vigour traits in rice. Plant Genet. Resour. 17 (1), 12–23. doi: 10.1017/S1479262118000187
Amegan, E., Efisue, A., Akoroda, M., Shittu, A., Tonegnikes, F. (2020). Genetic diversity of korean rice (Oryza sativa l.) germplasm for yield and yield related traits for adoption in rice farming system in nigeria. Int. J. @ Gent. Genomics 8 (1), 19–28. doi: 10.11648/j.ijgg.20200801.13
Anandan, A., Anumalla, M., Pradhan, S. K., Ali, J. (2016). Population structure, diversity and trait association analysis in rice (Oryza sativa l.) germplasm for early seedling vigor (ESV) using trait linked SSR markers. PloS One 11 (3), 0152406. doi: 10.1371/journal.pone.0152406
Anandan, A., Panda, S., Sabarinathan, S., Travis, A. J., Norton, G. J., Price, A. H. (2022). Superior haplotypes for early root vigor traits in rice under dry direct seeded low nitrogen condition through genome wide association mapping. Front. Plant Sci. 13. doi: 10.3389/fpls.2022.911775
Anderson, E. W., Sullivan, M. W. (1993). The antecedents and consequences of customer satisfaction for firms. Marketing. Sci. 12 (2), 125–143. doi: 10.1287/mksc.12.2.125
Arsenault, J.-L., Poulcur, S., Messier, C., Guay, R. (1995). WinRHlZO™, a root-measuring system with a unique overlap correction method. HortSci 30 (4), 906D–9 906. doi: 10.21273/HORTSCI.30.4.906D
Balakrishnan, D., Subrahmanyam, D., Badri, J., Raju, A. K., Rao, Y. V., Beerelli, K., et al. (2016). Genotype× environment interactions of yield traits in backcross introgression lines derived from Oryza sativa cv. Swarna/Oryza nivara. Front. Plant Sci. 7, 1530. doi: 10.3389/fpls.2016.01530
Barbadikar, K. M., Phule, A. S., Sheshu Madhav, M., Senguttuvel, P., Subrahmanyam, D., Balachandran, S. M., et al. (2016). Water scarcity: driving force for root studies in rice. ICAR-IIRR. News Lett. 14 (1), 7.
Barde, M. A., Mohammed, M. S., Oyekunle, M., Usman, I. S., Shaahu, A. (2021). Estimation of genetic variability, heritability and genetic advance in rice (Oryza sativa l.) genotypes. Int. J. Res. Sci. Innov. Appl. Sci. 4, 5–90.
Benjamini, Y., Hochberg, Y. (1995). Controlling the false discovery rate: a practical and powerful approach to multiple testing. J.R. Stat. Soc.: Ser. B. (Methodological). 57 (1), 289–300. doi: 10.1111/j.2517-6161.1995.tb02031.x
Bernier, J., Kumar, A., Ramaiah, V., Spaner, D., Atlin, G. (2007). A large-effect QTL for grain yield under reproductive-stage drought stress in upland rice. Crop Sci. 47 (2), 507–516. doi: 10.2135/cropsci2006.07.0495
Cairns, J. E., Namuco, O. S., Torres, R., Simborio, F. A., Courtois, B., Aquino, G. A., et al. (2009). Investigating early vigour in upland rice (Oryza sativa l.): part II. identification of QTLs controlling early vigour under greenhouse and field conditions. Field Crops Res. 113 (3), 207–217. doi: 10.1016/j.fcr.2009.05.007
Chauhan, B. S., Abugho, S. B. (2013). Effect of crop residue on seedling emergence and growth of selected weed species in a sprinkler-irrigated zero-till dry-seeded rice system. Weed. Sci. 61 (3), 403–409. doi: 10.1614/WS-D-12-00147.1
Chen, K., Zhang, Q., Wang, C. C., Liu, Z. X., Jiang, Y. J., Zhai, L. Y., et al. (2019). Genetic dissection of seedling vigour in a diverse panel from the 3,000 rice (Oryza sativa l.) genome project. Sci. Rep. 9 (1), 1–15. doi: 10.1038/s41598-019-41217-x
Dang, X., Thi, T. G. T., Dong, G., Wang, H., Edzesi, W. M., Hong, D. (2014). Genetic diversity and association mapping of seed vigor in rice (Oryza sativa l.). Planta. 239(6), 1309-1319.degree of dominance in corn. Agron. J. 41, 353–359. doi: 10.1007/s00425-014-2060-z
Demeke, B., Dejene, T., Abebe, D. (2023). Genetic variability, heritability, and genetic advance of morphological, yield related and quality traits in upland rice (Oryza sativa l.) genotypes at pawe, northwestern Ethiopia. Cogent. Food Agri. 9 (1), 2157099. doi: 10.1080/23311932.2022.2157099
Dhanwani, R. K., Sarawgi, A. K., Solanki, A., Tiwari, J. K. (2013). Genetic variability analysis for various yield attributing and quality traits in rice (Oryza sativa l.). Bioscan. 8 (4), 1403–1407.
Dixit, S., Grondin, A., Lee, C. R., Henry, A., Olds, T. M., Kumar, A. (2015). Understanding rice adaptation to varying agro-ecosystems: trait interactions and quantitative trait loci. BMC Genet. 16 (1), 1–14. doi: 10.1186/s12863-015-0249-1
Earl, D. A., vonHoldt, B. M. (2012). STRUCTURE HARVESTER: a website and program for visualizing STRUCTURE output and implementing the evanno method. conservation genetics resources vol. 4 (2) pp. 359-361 doi: 10.1007/s12686-011-9548-7environment variability in soybean. Agron. J. 47, 314–318. doi: 10.1007/s12686-011-9548-7environment
Flint-Garcia, S. A., Thuillet, A., Yu, J., Pressoir, G., Romero, S. M., Mitchell, S. E., et al. (2005). Maize association population: a high-resolution platform for quantitative trait locus dissection. Plant J. 44 (6), 1054–1064. doi: 10.1111/j.1365-313X.2005.02591.x
Fujino, K., Sekiguchi, H., Matsuda, Y., Sugimoto, K., Ono, K., Yano, M. (2008). Molecular identification of a major quantitative trait locus, qLTG3–1, controlling low-temperature germinability in rice. Proc. Natl. Acad. Sci. 105 (34), 12623–12628. doi: 10.1073/pnas.0805303105
Islam, M. A., Raffi, S. A., Hossain, M. A., Hasan, A. K. (2015). Analysis of genetic variability, heritability and genetic advance for yield and yield associated traits in some promising advanced lines of rice. Progress. Agric. 26 (1), 26–31. doi: 10.3329/pa.v26i1.24511
Johnson, R. W., Robinson, H. F., Comstock, R. E. (1955). Estimates of genetic and environmental variability in soybeans. Agron. J. 47 (7), 314–318. doi: 10.2134/agronj1955.00021962004700070009x
Kahani, F., Hittalmani, S. (2015). Genetic analysis and traits association in F2 intervarietal populations in rice under aerobic condition. J. Rice Res. 3 (152), 2. doi: 10.4172/2375-4338.1000152
Kato, Y., Okami, M. (2010). Root growth dynamics and stomatal behavior of rice (Oryza sativa l.) grown under aerobic and flooded conditions. Field Crops Res. 117 (1), 9–17. doi: 10.1016/j.fcr.2009.12.003
Khodaeiaminjan, M., Knoch, D., Ndella Thiaw, M. R., Marchetti, C. F., Korinkova, N., Techer, A., et al. (2023). Genome-wide association study in two-row spring barley landraces identifies QTLs associated with plantlets root system architecture traits in well-watered and osmotic stress conditions. Front. Plant Sci. 14, 1120. doi: 10.3389/fpls.2023.1125672
Korte, A., Farlow, A. (2013). The advantages and limitations of trait analysis with GWAS: a review. Plant Methods 9 (1), 1–9. doi: 10.1186/1746-4811-9-29
Lee, H. S., Sasaki, K., Higashitani, A., Ahn, S. N., Sato, T. (2012). Mapping and characterization of quantitative trait loci for mesocotyl elongation in rice (Oryza sativa l.). Rice 5 (1), 1–10. doi: 10.1186/1939-8433-5-13
Mahender, A., Anandan, A., Pradhan, S. K. (2015). Early seedling vigour, an imperative trait for direct-seeded rice: an overview on physio-morphological parameters and molecular markers. Planta 241 (5), 1027–1050. doi: 10.1007/s00425-015-2273-9
Meena, R. K., Bhusal, N., Kumar, K., Jain, R., Jain, S. (2019). Intervention of molecular breeding in water saving rice production system: aerobic rice. 3 Biotech. 9, 1–12. doi: 10.1007/s13205-019-1657-0
Mishra, K. K., Vikram, P., Yadaw, R. B., Swamy, B. P., Dixit, S., Cruz, M. T. S., et al. (2013). qDTY12. 1: A locus with a consistent effect on grain yield under drought in rice. BMC Genet. 14 (1), pp.1–pp10. doi: 10.1186/1471-2156-14-12
Murray, M. G., Thompson, W. (1980). Rapid isolation of high molecular weight plant DNA. Nucleic AIDS Res. 8 (19), 4321–4326. doi: 10.1093/nar/8.19.4321
Pandit, E., Tasleem, S., Barik, S. R., Mohanty, D. P., Nayak, D. K., Mohanty, S. P., et al. (2017). Genome-wide association mapping reveals multiple QTLs governing tolerance response for seedling stage chilling stress in indica rice. Front. Plant Sci. 8, 552. doi: 10.3389/fpls.2017.00552
Pritchard, J. K., Stephens, M., Donnelly, P. (2000). Inference of population structure using multilocus genotype data. Genetics 155 (2), 945–959. doi: 10.1093/genetics/155.2.945
Ramyajit, M., Saumi, G., Krishnendu, M., Goswami, S. ,. B., Jana, K. (2019). Integrated nutrient management: its importance of sustainable yield and quality seed production of rice (Oryza Sativa l.). Prog. Agric. Sci. 1 (1), 89–97.
Rao, I. S., Neeraja, C. N., Srikanth, B., Subrahmanyam, D., Swamy, K. N., Rajesh, K., et al. (2018). Identification of rice landraces with promising yield and the associated genomic regions under low nitrogen. Sci. Rep. 8 (1), 1–13. doi: 10.1038/s41598-018-27484-0
Rebolledo, M. C., Pena, A. L., Duitama, J., Cruz, D. F., Dingkuhn, M., Grenier, C., et al. (2016). Combining image analysis, genome wide association studies and different field trials to reveal stable genetic regions related to panicle architecture and the number of spikelets per panicle in rice. Front. Plant Sci. 7, 1384. doi: 10.3389/fpls.2016.01384
Robinson, H. F., Comstock, R. E., Harvey, P. H. (1949). Estimates of heritability and the degree of dominance in corn. Agron. J. 41(8), 353–359. doi: 10.2134/agronj1949.00021962004100080005x
Sagare, D. B., Abbai, R., Jain, A., Jayadevappa, P. K., Dixit, S., Singh, A. K., et al. (2020). More and more of less and less: is genomics-based breeding of dry direct-seeded rice (DDSR) varieties the need of hour? Plant Biotechnol. J. 18 (11), 2173–2186. doi: 10.1111/pbi.13454
Sahu, P. K., Mondal, S., Sao, R., Vishwakarma, G., Kumar, V., Das, B. K., et al. (2020). Genome-wide association mapping revealed numerous novel genomic loci for grain nutritional and yield-related traits in rice (Oryza sativa l.) landraces. 3 Biotech. 10 (11), 1–22. doi: 10.1007/s13205-020-02467-z
Sandhu, N., Jain, S., Kumar, A., Mehla, B. S., Jain, R. (2013). Genetic variation, linkage mapping of QTL and correlation studies for yield, root, and agronomic traits for aerobic adaptation. BMC Genet. 14 (1), 1–16. doi: 10.1186/1471-2156-14-104
Sandhu, N., Raman, K. A., Torres, R. O., Audebert, A., Dardou, A., Kumar, A., et al. (2016). Rice root architectural plasticity traits and genetic regions for adaptability to variable cultivation and stress conditions. Plant Physiol. 171 (4), 2562–2576. doi: 10.1104/pp.16.00705
Sandhu, N., Subedi, S. R., Singh, V. K., Sinha, P., Kumar, S., Singh, S. P., et al. (2019a). Deciphering the genetic basis of root morphology, nutrient uptake, yield, and yield-related traits in rice under dry direct-seeded cultivation systems. Sci. Rep. 9 (1), pp.1–pp16. doi: 10.1038/s41598-019-45770-3
Sandhu, N., Torres, R. O., Sta Cruz, M. T., Maturan, P. C., Jain, R., Kumar, A., et al. (2015). Traits and QTLs for development of dry direct-seeded rainfed rice varieties. J. Exp. Bot. 66 (1), 225–244. doi: 10.1093/jxb/eru413
Sandhu, N., Yadaw, R. B., Chaudhary, B., Prasai, H., Iftekharuddaula, K., Venkateshwarlu, C., et al. (2019b). Evaluating the performance of rice genotypes for improving yield and adaptability under direct seeded aerobic cultivation conditions. Front. Plant Sci. 10, 159. doi: 10.3389/fpls.2019.00159
Septiningsih, E. M., Ignacio, J. C. I., Sendon, P., Sanchez, D. L., Ismail, A. M., Mackill, D. J. (2013). QTL mapping and confirmation for tolerance of anaerobic conditions during germination derived from the rice landrace ma-zhan red. Theor. Appl. Genet. 126 (5), 1357–1366. doi: 10.1007/s00122-013-2057-1
Singh, U. M., Yadav, S., Dixit, S., Ramayya, P. J., Devi, M. N., Raman, K. A., et al. (2017). QTL hotspots for early vigor and related traits under dry direct-seeded system in rice (Oryza sativa l.). Front. Plant Sci. 8, 286. doi: 10.3389/fpls.2017.00286
Sunil, C. M., Shankaralingappa, B. C. (2014). Rooting behaviour of aerobic rice under integrated package of agro-techniques. Asian J. Agric. Res. 8 (2), 105–113. doi: 10.3923/ajar.2014.105.113
Suralta, R. R., Inukai, Y., Yamauchi, A. (2010). Dry matter production in relation to root plastic development, oxygen transport, and water uptake of rice under transient soil moisture stresses. Plant Soil. 332 (1), 87–104. doi: 10.1007/s11104-009-0275-8
Trachsel, S., Messmer, R., Stamp, P., Ruta, N., Hund, A. (2010). QTLs for early vigor of tropical maize. Mol. Breed. 25 (1), 91–103. doi: 10.1007/s11032-009-9310-y
Venuprasad, R., Bool, M. E., Quiatchon, L., Cruz, M. T. S., Amante, M., Atlin, G. N. (2012). A large-effect QTL for rice grain yield under upland drought stress on chromosome 1. Mol. Breed. 30 (1), 535–547. doi: 10.1007/s11032-011-9642-2
Veronica, N., Rani, Y. A., Subrahmanyam, D., Rao, K. L. N., Ahamad, M. L., Rani, P. P., et al. (2019). Screening of rice germplasm with physiological traits for identification of heat tolerant genotypes. Int. J. bio-resour. Stress Manage. 10 (5), 472–480. doi: 10.23910/IJBSM/2019.10.5.2028
Vinarao, R., Proud, C., Zhang, X., Snell, P., Fukai, S., Mitchell, J. (2021). Stable and novel quantitative trait loci (QTL) confer narrow root cone angle in an aerobic rice (Oryza sativa l.) production system. Rice 14 (1), 1–12. doi: 10.1186/s12284-021-00471-2
Wang, Z. F., Wang, J. F., Bao, Y. M., Wang, F. H., Zhang, H. S. (2010). Quantitative trait loci analysis for rice seed vigor during the germination stage. J. Zhejiang. Univ. Sci. B. 11 (12), 958–964. doi: 10.1631/jzus.B1000238
Xie, L., Tan, Z., Zhou, Y., Xu, R., Feng, L., Xing, Y., et al. (2014). Identification and fine mapping of quantitative trait loci for seed vigor in germination and seedling establishment in rice. J. Integr. Plant Biol. 56 (8), 749–759. doi: 10.1111/jipb.12190
Xing, Y., Zhang, Q. (2010). Genetic and molecular bases of rice yield. Annu. Rev. Plant Biol. 61, 421–442. doi: 10.1146/annurev-arplant-042809-112209
Xu, P., Yang, J., Ma, Z., Yu, D., Zhou, J., Tao, D., et al. (2020). Identification and validation of aerobic adaptation QTLs in upland rice. Life 10 (5), 65. doi: 10.3390/life10050065
Yadav, A. K., Kumar, A., Grover, N., Ellur, R. K., Bollinedi, H., Krishnan, S. G., et al. (2021). Genome-wide association study reveals marker–trait associations for early vegetative stage salinity tolerance in rice. Plants 10 (3), p.559. doi: 10.3390/plants10030559
Yang, W. A. N. G., Yuan, G. U. O., De-Lin, H. O. N. G. (2010). Discovery of elite alleles for seed vigor traits in two populations of japonica rice in taihu lake region. Acta Agron. Sin. 36 (5), 754–763. doi: 10.1016/S1875-2780(09)60048-1
Yu, J., Pressoir, G., Briggs, W. H., Vroh, B. I., Yamasaki, M., Doebley, J. F., et al. (2006). A unifed mixed-model method for association mapping that accounts for multiple levels of relatedness. Nat. Genet. 38, 203–208. doi: 10.1038/ng1702
Yugandhar, P., Sun, Y., Liu, L., Negi, M., Nallamothu, V., Sun, S., et al. (2018). Characterization of the loss-of-function mutant NH101 for yield under phosphate deficiency from EMS-induced mutants of rice variety Nagina22. Plant Physiol. Biochem. 130, 1–13. doi: 10.1016/j.plaphy.2018.06.017
Zhang, A., Liu, C., Chen, G., Hong, K., Gao, Y., Tian, P., et al. (2017). Genetic analysis for rice seedling vigor and fine mapping of a major QTL qSSL1b for seedling shoot length. Breed. Sci. 67 (3), 307–315. doi: 10.1270/jsbbs.16195
Zhang, H., San, M. L., Jang, S. G., Lee, J. H., Kim, N. E., Lee, A. R., et al. (2020). Genome-wide association study of root system development at seedling stage in rice. Genes 11 (12), 1395. doi: 10.3390/genes11121395
Zhao, D. L., Atlin, G. N., Bastiaans, L., Spiertz, J. H. J. (2006). Cultivar weed-competitiveness in aerobic rice: heritability, correlated traits, and the potential for indirect selection in weed-free environments. Crop Sci. 46 (1), 372–380. doi: 10.2135/cropsci2005.0192
Keywords: aerobic rice, marker–trait association, root traits, yield-related traits, general linear model, mixed linear model, seedling vigour index
Citation: Padmashree R, Barbadikar KM, Honnappa, Magar ND, Balakrishnan D, Lokesha R, Gireesh C, Siddaiah AM, Madhav MS, Ramesha YM, Bharamappanavara M, Phule AS, Senguttuvel P, Diwan JR, Subrahmanyam D and Sundaram RM (2023) Genome-wide association studies in rice germplasm reveal significant genomic regions for root and yield-related traits under aerobic and irrigated conditions. Front. Plant Sci. 14:1143853. doi: 10.3389/fpls.2023.1143853
Received: 13 January 2023; Accepted: 19 April 2023;
Published: 18 July 2023.
Edited by:
Ping Lan, Chinese Academy of Sciences (CAS), ChinaReviewed by:
Kuldeep Kumar, Indian Institute of Pulses Research (ICAR), IndiaBalram Marathi, Professor Jayashankar Telangana State Agricultural University, India
Copyright © 2023 Padmashree, Barbadikar, Honnappa, Magar, Balakrishnan, Lokesha, Gireesh, Siddaiah, Madhav, Ramesha, Bharamappanavara, Phule, Senguttuvel, Diwan, Subrahmanyam and Sundaram. This is an open-access article distributed under the terms of the Creative Commons Attribution License (CC BY). The use, distribution or reproduction in other forums is permitted, provided the original author(s) and the copyright owner(s) are credited and that the original publication in this journal is cited, in accordance with accepted academic practice. No use, distribution or reproduction is permitted which does not comply with these terms.
*Correspondence: Kalyani M. Barbadikar, a2FseWFuaS5tYkBpY2FyLmdvdi5pbg==; a2FseWFuaWFhdUBnbWFpbC5jb20=
†Present addresses: Maganti Sheshu Madhav, ICAR-Central Tobacco Research Institute (CTRI), Rajahmundry, India
Amol S. Phule, Dr. D. Y. Patil Biotechnology and Bioinformatics Institute, Dr. D. Y. Patil Vidyapeeth, Pune, India
R. Lokesha, Keladi Shivappa Nayaka University of Agricultural and Horticultural Sciences, Shivamogga, India
‡These authors have contributed equally to this work