 Tianyi Chen1†Xiaoming Yang1†Zheng Zuo1
 Huijuan Xu1
 Xingjian Yang1Xiangjian Zheng1Shuran He2Xin Wu1Xueming Lin1Yongtao Li1*
 Zhen Zhang1*
- 1College of Natural Resources and Environment, Joint Institute for Environmental Research & Education, South China Agricultural University, Guangzhou, China
- 2College of Resources and Environment, Yunnan Agricultural University, Kunming, China
China consumes 35% of the world’s fertilizer every year; however, most of the nitrogen fertilizers, which are essential for rice cultivation, are not used effectively. In this study, factors affecting the nitrogen leaching loss rate were studied in typical soil and rice varieties in South China. The effects of various irrigation measures on rice growth and nitrogen leaching loss were investigated by conducting experiments with eight groups. These groups included traditional irrigation (TI) and shallow wet irrigation (SWI). The TI is a common irrigation method for farmers in South China, maintaining a water layer of 5-8 cm depth. For SWI, after establishing a shallow water layer usually maintaining at 1-2 cm, paddy is irrigated when the field water level falls to a certain depth, then this process is then repeat as necessary. The nitrogen distribution characteristics were determined using 15N isotope tracing. In addition, the effects of nitrification, denitrification, and microbial composition on soil nitrogen transformation at different depths were studied by microbial functional gene quantification and high-throughput sequencing. The results revealed that in the SWI groups, the total nitrogen leaching loss rate reduced by 0.3-0.8% and the nitrogen use efficiency (NUE) increased by 2.18-4.43% compared with those in the TI groups. After the 15N-labeled nitrogen fertilizer was applied, the main pathways of nitrogen were found to be related to plant absorption and nitrogen residues. Furthermore, paddy soil ammonia-oxidizing archaea were more effective than ammonia-oxidizing bacteria for soil ammonia oxidation by SWI groups. The SWI measures increased the relative abundance of Firmicutes in paddy soil, enhancing the ability of rice to fix nitrogen to produce ammonium nitrogen, thus reducing the dependence of rice on chemical fertilizers. Moreover, SWI enhanced the relative abundance of nirS and nosZ genes within surface soil bacteria, thereby promoting denitrification in the surface soil of paddy fields. SWI also promoted ammonia oxidation and denitrification by increasing the abundance and activity of Proteobacteria, Nitrospirae, and Bacteroidetes. Collectively, SWI effectively reduced the nitrogen leaching loss rate and increase NUE.
1 Introduction
China, as one of the major rice-producing countries, accounts for one-fifth of the rice planting area and one-third of the rice production globally (Zhuang et al., 2019). Nitrogen fertilizers play a crucial role in rice cultivation. However, excessive irrigation can lead to low fertilizer use efficiency, and crops can only use 30%-40% of nitrogen fertilizers. About 50% of the applied nitrogen is lost to the environment due to ammonia volatilization, denitrification, runoff, and leaching. This situation has resulted in a range of serious environmental problems, such as soil acidification (Guo et al., 2010), groundwater pollution (Zhang et al., 2017), water eutrophication (Zhao et al., 2014, 2016), and air pollution (Wang et al., 2018; Cheng et al., 2021). Owing to the different water requirements of crops in each growth period, farmland irrigation water control can save water and improve crop quality and yield. The increasing studies related to the water-saving irrigation techniques have investigated grain yield, nitrogen use efficiency (NUE), denitrification, N2O and NO gas emissions derived from fertilizer and water regimes. Islam et al. (2018b) reported that the urea deep placement (UDP) increased grain yields by 13% during the Aman season. Qi et al. (2020) found that the water-saving irrigation techniques can increase rice yield by reducing total infiltration water. Some studies found that the combination alternate wetting and drying (AWD) irrigation and UDP drastically reduced N losses and increases NUE (Gaihre et al., 2015; Islam et al., 2018a, Islam et al., 2018b). Several studies have demonstrated that water-saving irrigation techniques can significantly decrease nitrogen emissions and leaching loss in paddy fields (Mao, 2002; Peng et al., 2011, 2012; Tan et al., 2013; Qi et al., 2020). Some studies reported that the combination AWD and UDP reduced ammonia volatilization and N2O emissions (Gaihre et al., 2015, 2018; Islam et al., 2018a). Shallow wet irrigation (SWI) is also a water-saving irrigation technology, and whether the use of SWI can reduce nitrogen loss and improve NUE. Additionally, nitrogen loss in paddy fields is influenced by microbial regulation. Therefore, it is necessary to understand the distribution, diversity, and abundance of microbial communities under SWI conditions, which can provide insights into microorganisms involved in nitrification in agricultural ecosystems.
Previous research indicated that nitrogen loss in paddy fields was regulated by soil microorganisms. Liu et al. (2020) found that irrigation greatly affected bacterial diversity. Das et al. (2016) reported that flooding might affect the composition and activity of rhizosphere microorganisms, consequently influencing the formation and accumulation of nitrogen forms in both rhizosphere soil and pore water. Soil aerobic conditions are important factors in determining the abundance of ammonia-oxidizing bacteria (AOB). Xu et al. (2020) found that dry-wet alternations increased soil oxygen content and further increased AOB abundance, which directly affected soil nitrification. Nitrification is the reaction of ammonia being converted into nitrite, which is in turn converted into nitrate by soil microorganisms; it is the dominant process of the soil nitrogen cycle. These processes of the nitrogen cycle are intricately connected to nitrogen loss. Compared with traditional irrigation methods, SWI treatment can provide better aerobic conditions for paddy soils. Whether SWI treatment can also increase the abundance of AOB, thereby reducing nitrogen loss in paddy fields. Meanwhile, understanding the response mechanisms of microbial communities to irrigation practices is vital for effectively preventing and controlling nitrogen loss.
In South China, the paddy growing season aligns with the summer rainy season, with an average annual precipitation of more than 1000 mm. Thus, runoff and leaching are the main processes of nitrogen loss (Chen et al., 2022). Currently, numerous studies have examined nitrogen runoff loss in paddy fields of South China (Ding et al., 2016; Issaka et al., 2019; Zeng et al., 2021). In our previous study, we found a 31.7% reduction in nitrogen loss from paddy field runoff in the SWI groups compared to that in the traditional irrigation (TI) groups (Zeng et al., 2021). However, limited studies are available on nitrogen leaching loss from paddy fields in South China. Paddy is a submerged crop, and leaching is one of the main ways of nitrogen loss. Owing to the limited number of studies in South China, quantifying the amount of leaching is difficult. Therefore, in the present study, we used a farmland underground leaching water collection device to conduct experiments with the following aims: (i) to monitor the effects of SWI measures on rice growth and nitrogen leaching loss; (ii) to analyze the mechanisms of nitrogen transport, distribution, and loss using 15N isotope tracing; and (iii) to analyze the effects of microbial colony structures and functional gene compositions on soil nitrogen transformation using molecular biotechnology. In this study, the leaching loss of nitrogen in paddy was quantified. We believe that this study provides a scientific basis and data to reduce the risk of nitrogen loss in paddy fields.
2 Materials and methods
2.1 Experimental site and soil characteristics
The experimental site was located at the South China Agricultural University, Guangzhou, Guangdong Province, China (23°15’N, 113°35’E). The South China Agricultural University is in the South China area. And this area is a densely populated and intensively farm region with a high cropping index (i.e., the average number of annual crop seasons). The experimental soil used was acid red soil, with a depth of 0 cm to 60 cm, which is a typical soil type in South China (Zeng et al., 2021). The topsoil had the following physicochemical characteristics: bulk density of 1.26 g·cm-3, soil pH of 5.83, soil organic matter of 15.49 g·kg-1, total phosphorus of 0.16 g·kg-1, and total nitrogen (TN) of 1.05 g·kg-1, with alkali-hydrolyzed nitrogen of 35.16 g·kg-1.
2.2 Experimental device
The experimental device used to collect underground leaching water from the farmland included a soil column tube, rainproof cover, and leaching collection box (Figure 1). The experiment is a pot experiment and its device is made of 5mm thick PVC material. The specific size of the device has been given in Supplementary Data (Supplementary Figure S1). The rainproof cover was equipped with a through-hole corresponding to the soil column tube, and the lower end of the soil column tube was connected to the leaching collection box. There was a dense hole partition between the soil column tube and the leaching collection box. The bottom of the leaching collection box was connected to a base, and the side wall of the leaching collection box was equipped with leaching sampling valves. At least two depth sampling valves were installed on the side wall of the soil column tube. During sampling, the depth sampling valves at different depths were opened, and syringes were used to collect water samples at different depths of the leachate. The leaching sampling valve was opened, and a measuring cylinder was used to quantitatively collect the leaching water. During rice plant growth, flooding in the soil column tube was controlled by switching the field control valve to set different flooding depths and moisture patterns.
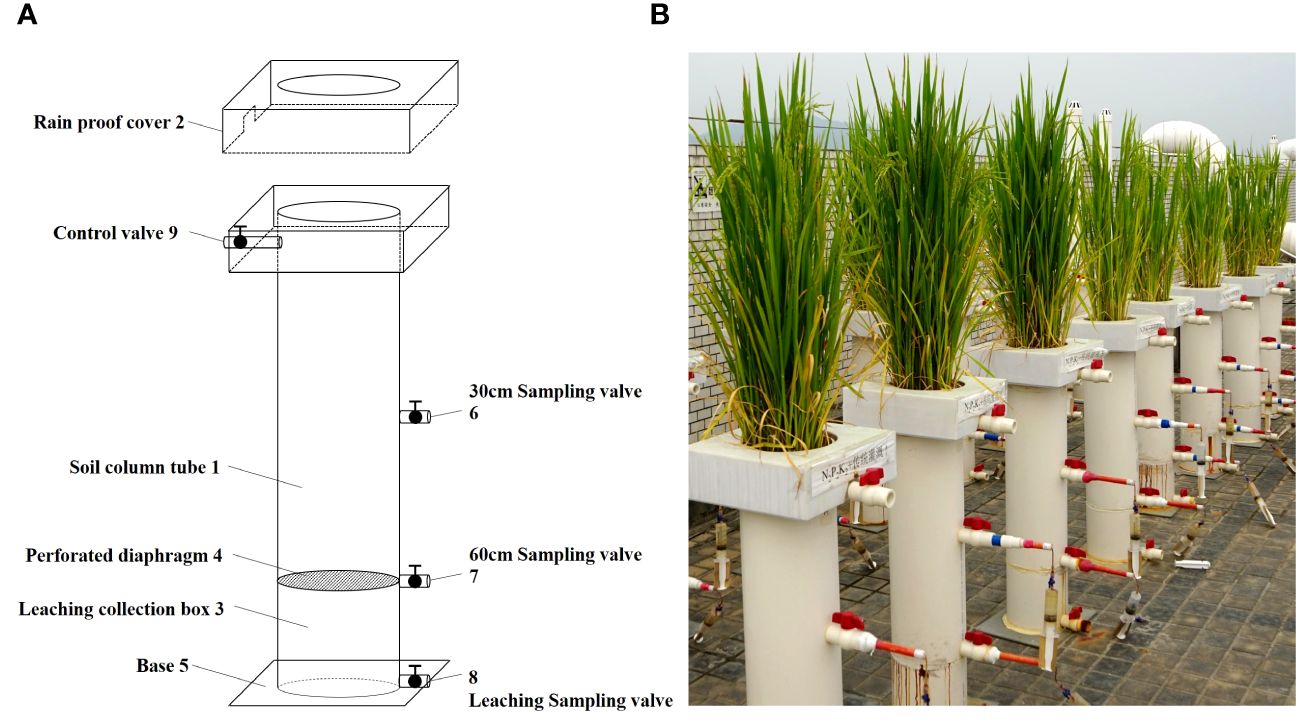
Figure 1 Schematic diagram of experimental device for collecting underground leaching water from farmland [(A) is design drawing and (B) is physical drawings].
2.3 Experiment design
The experiment was set up with eight treatment groups according to two irrigation patterns (TI and SWI) and four nitrogen fertilizer application rates (0%, 40%, 70%, and 100%) with three replicates for each treatment group. The experimental fertilizers application rate was based on the recommended fertilizers application rate of Guangdong Province testing soil for formulated fertilization. The application rates of N, P and K fertilizers were 148, 67, 114 kg·ha-1, respectively. The treatment groups were set at 0, 40, 70, and 100 in accordance with 0%, 40%, 70%, and 100% of the TN fertilizer applied to the individual units, respectively. The urea concentration used was 10 atoms% 15N labeled urea. The amount of phosphate and potassium fertilizers applied was uniform for all the treatment groups. The specific experimental settings were shown in Table 1. The base fertilizer was applied to the rice seedlings before transplanting, the surface soil (0 cm -10 cm) was mixed thoroughly with minimal disturbance of the soil after fertilizer application. The tiller fertilizer was applied at the rice tillering stage to supply the required nutrients for late tillering and nodulation. The spike fertilizer was applied at the rice spike stage to supply nutrients required for flowering, fruiting, and fruit ripening. The tiller fertilizer and spike fertilizer were dissolved with 50 mL of pure water during application, and evenly applied to the surface soil. During the planting period, flooding in the installation was observed daily and supplemented according to the appropriate flooding conditions for SWI and TI. The water level of the TI treatment was supplemented to 8 cm when it fell below 5 cm, and a water level of 1 cm -2 cm was maintained for the SWI treatment.
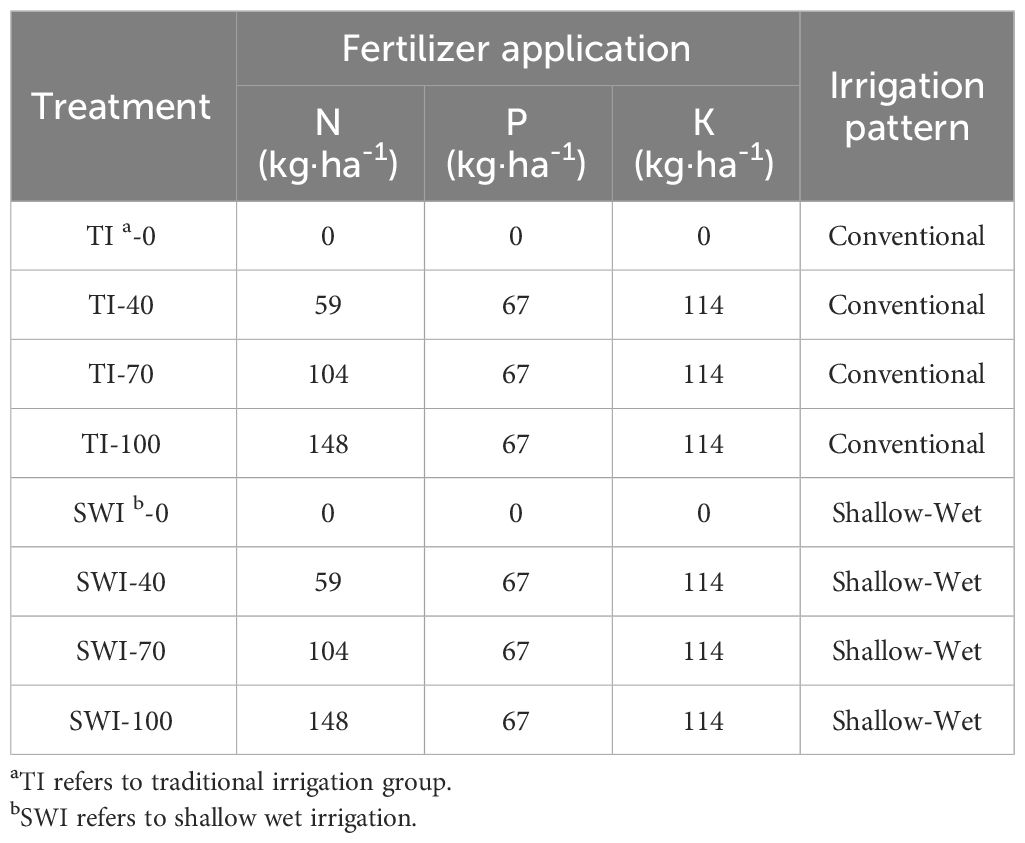
Table 1 Experimental agricultural treatment design.
2.4 Sample collection and analysis
2.4.1 Water sample collection and analysis
The method of collecting and preserving leaching water samples is shown in Supplementary Table S1. The leaching water was sampled regularly every week, kept separately, and labeled according to sampling time and depth. The measured water data were recorded according to time.
The TN concentration of the collected samples was determined using a Unico UV-2800 (Unicoi Systems, Atlanta, GA, USA) spectrophotometer after performing potassium peroxodisulfate digestion. The concentrations of NH4+-N and were analyzed using a continuous-flow analyzer (Skalar, Breda, the Netherlands).
where V denotes the leaching volume of a single device (L) and Vi denotes the leaching volume of a single device in I sampling duration (L).
where VL denotes the volume of leaching loss (t·hm−2·yr−1); Rt refers to the planting time accounts for a proportion of the year, and Rs denotes the proportion of area per hectare of a single device.
where NLVi represents the concentration of TN in leaching (g), and CNi denotes the concentration of TN in leaching of a single device in I sample duration (mg·L−1).
where NLL denotes the loss rate of TN through leaching (%); NLVi and NLV0 refer to NLV of N applied and N without applied, respectively, and WN denotes the amount of N applied.
2.4.2 Soil and plant sample collection and analysis
The whole rice growth period was divided into three soil sampling periods as follows: before the application of the tiller fertilizer, before the application of the spike fertilizer, and before harvest. Soil samples were sampled at 3-5 points using soil sampling tubes and then mixed and bagged. The samples were stored separately according to sampling depth and were categorized as wet and dry. Soil samples that needed to be air-dried were stored in a cool and ventilated place after natural air-drying, whereas fresh soil was stored at -80°C. Plant samples were collected only at harvest time. Further, plant samples from each device were cut flush, measured for wet weight, dried in a 70°C oven, cooled, weighed for dry weight, and finally crushed, ground, and stored in bags.
The TN content of soil was analyzed using the Kjeldahl method, and the nitrogen contents of both the soil and plant samples were measured using an elemental analyzer (Vario MICRO cube, Elementar, Germany). The alkali-hydrolyzed nitrogen content of soil was analyzed using the alkaline hydrolysis method. The NH4+-N and concentrations were analyzed using a continuous-flow analyzer (Skalar, Breda, the Netherlands) (Wang et al., 2021). The nitrogen content of the plant samples was measured using an elemental analyzer (Vario MICRO cube, Elementar, Germany).
2.4.3 Isotope abundance determination
The atom% 15N abundance was analyzed using a stable isotope mass spectrometer (IsoPrime 100, Elementar, Germany). The proportion of the isotopes to the fertilizer (Ndff) was calculated based on the natural abundance of isotopes, and the Plant 15N use efficiency, Soil 15N residue rate, 15N leaching loss rate are calculated with reference to the method of Wang et al. (2017) and Li et al. (2018). The background of 15N abundance in soil was 0.368 atom%. Ndff was calculated as follows:
where a is atom% 15N abundance in the plant/soil/water samples, b is atom% 15N abundance in the control plant/soil/water samples, c is atom% 15N abundance of the fertilizer, and d is natural atom% 15N abundance (0.368 atom% 15N).
Plant 15N use efficiency was calculated as follows:
where ep is the 15N concentration of the plant (%), Wp is plant dry weight (g), and f is the amount of fertilizer (g).
Soil 15N residue rate was calculated as follows:
where es is the 15N concentration of plant (%), and Ws is the soil dry weight (g).
15N leaching loss was calculated as follows:
where eL is the 15N concentration of leaching (%), and WL is the leaching weight (g).
2.4.4 High-throughput sequencing and functional gene quantification of soil microorganisms
The genomic DNA was extracted from the soil using the FastDNA® SPIN Kit for Soil (MP Biomedicals, CA, USA). The concentration of DNA was measured using a NanoDrop2000 spectrophotometer. Polymerase chain reaction (PCR) of the rRNA gene was conducted using the universal 16S rRNA primers (338F: ACTCCTACGGGAGGCAGCAG and 806R: GGACTACHVGGGTWTCTAAT). The 16s raw data were deposited in the National Center for Biotechnology Information (NCBI) Sequence Reads Archive (SRA) (accession number: PRJNA1087108). The resulting product was detected using 2% agarose gel electrophoresis. The PCR product was purified and quantified using the Quantus™ Fluorometer and AxyPrep DNA Gel Extraction Kit, respectively. The DNA library was built using the NEXTFLEX Rapid DNA-Seq Kit and sequenced using the Miseq PE300 platform (Illumina, California, USA). The original sequencing sequence was subjected to quality control using Trimmomatic software. The sequences were clustered into operational taxonomic units (OTU) using UPARSE software (version 7.1 http://drive5.com/uparse/) based on 97% similarity. Chimeras were removed from the dataset using UCHIME software. Species classification annotations were assigned to each sequence using RDP classifiers. The alignment threshold was set to 70% based on the Silva database (SSU128).
Functional gene quantitative primer information and amplification system conditions for bacteria and archaea are shown in Supplementary Tables S2 and S3. Genomic DNA was extracted using the Magnetic Bead Method Soil and Fecal Genomic DNA Extraction Kit. After the genomic DNA was photographed in a gel imaging analyzer using Beijing Liuyi DYY-6C at a concentration of 1%, a voltage of 120 V, and an electrophoresis time of 20 min, the DNA concentration and purity were detected using Thermo NANo DROP8000. The standard quality granules were provided by Wuhan Tianyi Huiyuan Biotechnology Co., Ltd. and diluted 10-fold to obtain six concentration gradients of 1E9, 1E8, 1E7, 1E6, 1E5, 1E4, and 1E3, and the reactions were prepared using qPCR96Well and SYBR® Select Master Mix (2X) kits, with each sample analyzed in triplicate.
The samples were quantified on an Applied Biosystems StepOnePlusTM Real-Time System and Bio-Rad CFX96 Real-Time System, and the same primers and conditions were applied according to the standard curve for quantitative PCR 3-well detection. A 96-well plate with standard mass pellets was used as a positive control for error correction, and no template control (NTC)was used as a negative control. The test results were analyzed usin StepOne v2.3 and BioRadCFXManager software. Refer to the research of Liu et al. (2022) and Man et al. (2022), the relative abundance of functional genes was calculated as:
2.4.5 Statistical analysis
All experiments were conducted in triplicate, and the data were presented as the arithmetic mean values. Statistical analysis was conducted using SPSS statistics version 20.0. The experimental data were plotted using Origin 2022 software. In each case, the data were statistically analyzed using a one-way analysis of variance, with the minimum level of significance set at p< 0.05.
3 Results
3.1 Physicochemical properties of soil and rice plants
The changes of soil nitrogen content at different depths of rice under different treatments were shown in Figure 2. The ammonium nitrogen content under TI treatment was significantly higher than that under SWI treatment at different growth stages and depths (p<0.05, Figures 2A, B). The changes of soil ammonium nitrogen content in 30-60 cm depth soil layers of paddy under different irrigation measures were similar to those in 0-30 cm depth. Overall, nitrate nitrogen content is higher in 0-30 cm depth soil layers than in 30-60 cm depth. During the same fertilization period, the nitrate nitrogen content of the SWI treatment was higher than that of the TI treatment (p<0.05, Figures 2C, D). The alkali-hydrolyzed nitrogen content of SWI treatment was significantly higher than that of TI treatment (p<0.05, Figures 2E, F). Under two different soil depths, with the increase of N fertilizer application in the treatment group, the contents of ammonia nitrogen, nitrate nitrogen and alkali-hydrolyzed nitrogen in soil will also increase. The soil nitrogen content after basal and tillering in the treatments of SWI-40, SWI-70, and SWI-100 were significantly higher than that of other treatments(p<0.05). The peak value of soil nitrogen content was SWI-70 treatment in 0-30 cm depth soil (0.09%) during panicle (Figures 2G, H).
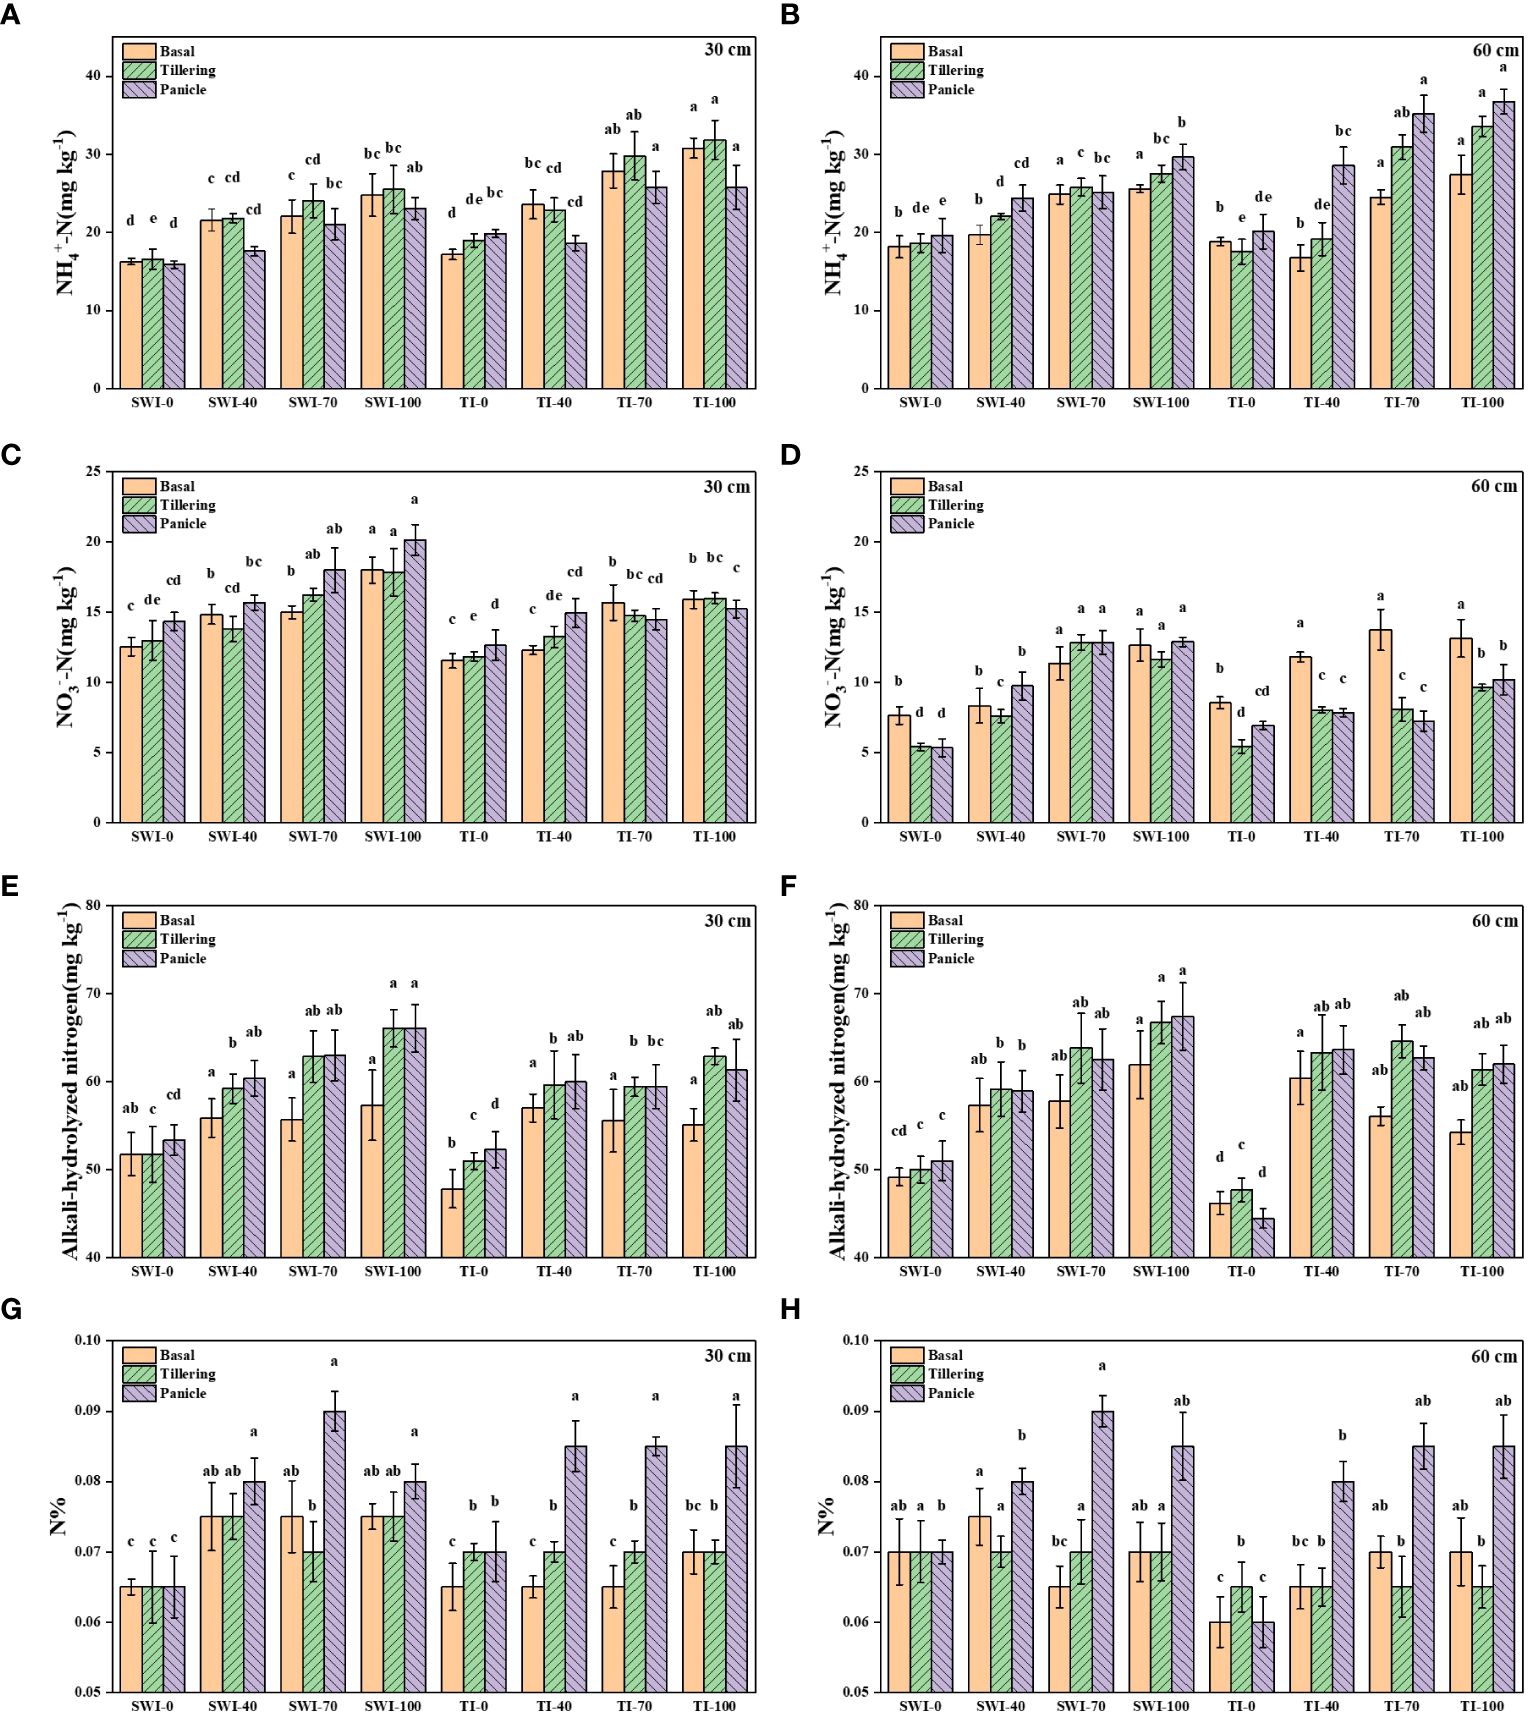
Figure 2 The contents of NH4+-N (A, B), NO3--N (C, D), alkali-hydrolyzed nitrogen (E, F) and nitrogen contents (G, H) in 0–30 cm and 30–60 cm soil layers of rice under different treatments. Means within the same item followed by different letters are significantly different (LSD, p < 0.05).
The physicochemical properties of rice plants under different treatments were shown in Table 2. The growth differences of paddy in different treatment groups were shown in Supplementary Figure S2. Compared with TI treatment, SWI treatment could increase rice yield, seed setting rate and plant nitrogen content. The nitrogen content of plants was significantly increased with high nitrogen fertilizer application of SWI-70 and SWI-100 (p<0.05).
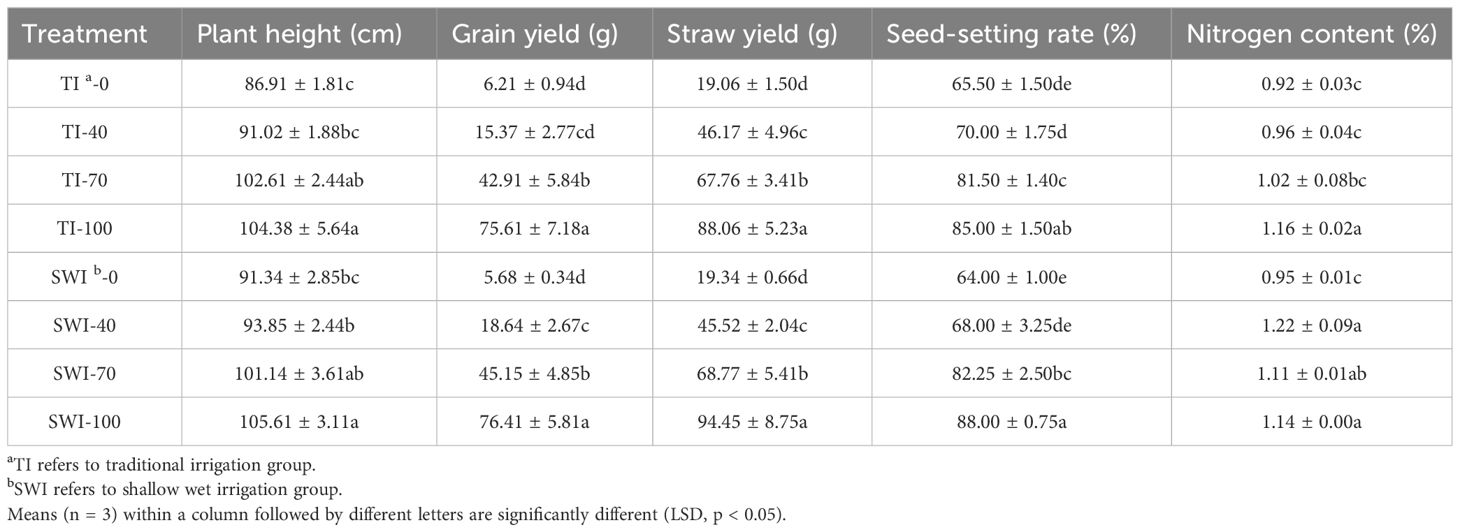
Table 2 Physicochemical properties of rice plants under different treatments.
3.2 Leaching loss concentration and loss volume
The dynamic changes of rice leaching nitrogen concentration under different irrigation measures were shown in Figure 3. The increase of fertilization rate can increase the concentration of leaching total nitrogen loss. The SW-100 and TI-100 treatment had the highest concentrations of leached total nitrogen, which were 1.30-5.41 mg·L-1 and 1.89-5.25 mg·L-1. The effect of each fertilization on the total nitrogen concentration in 30-60 cm depth soil layers was less abrupt than in 0-30 cm depth, and the concentration of total nitrogen increased first and then decreased slowly with the growth of rice (Figures 3A, B).
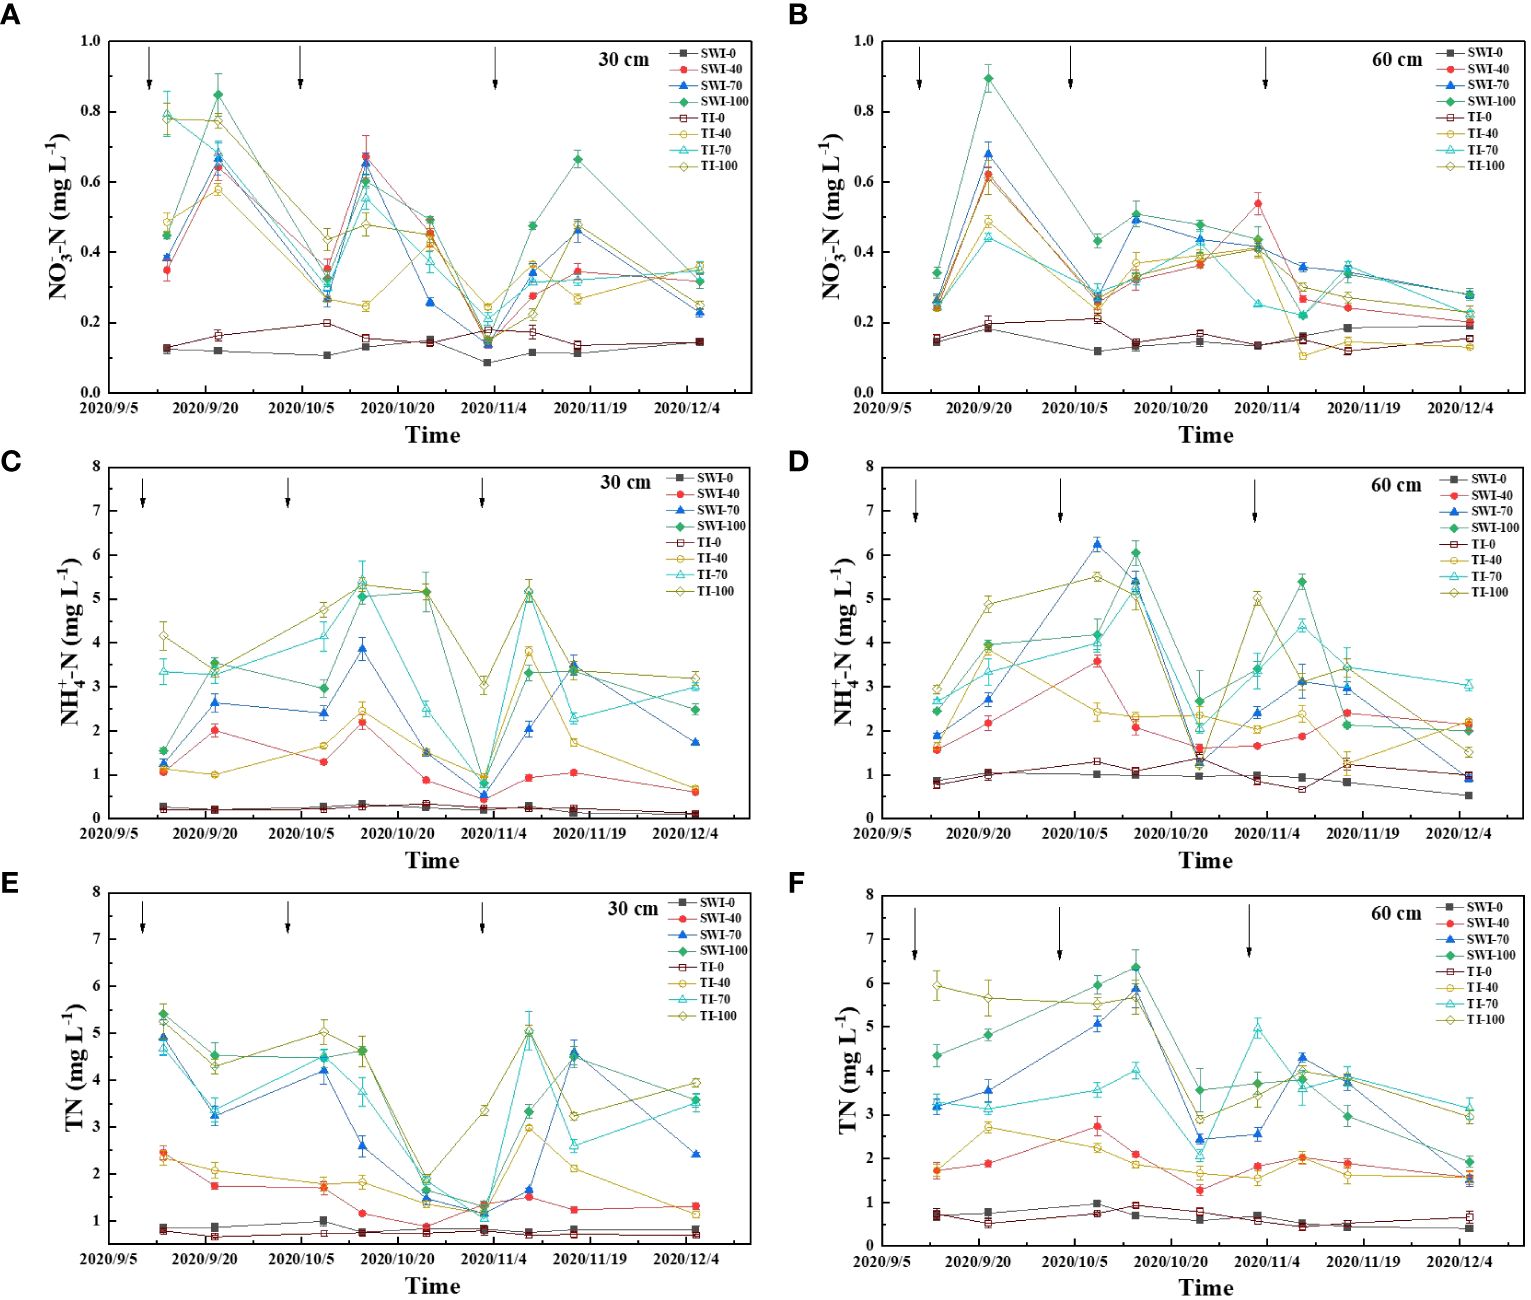
Figure 3 Dynamics of leached NO3--N (A, B), NH4+-N (C, D) and TN (E, F) concentrations in rice under different water fertilizer management practices (Arrows represent fertilization).
The concentration of leached ammonium nitrogen was similar to that of total nitrogen, and the main form of soil nitrogen leaching was ammonium nitrogen (Figures 3C, D). The leaching ammonium nitrogen concentration responded quickly to the three nitrogen fertilizer applications and had a large range. The TI-100 and TI-70 were the most obvious treatments with concentrations ranging from 3.04-5.32 mg·L-1 and 0.76-5.42 mg·L-1. The content of leaching nitrate in each treatment was significantly lower than that of ammonium nitrogen, and the content of leaching nitrate in each treatment fluctuatingly decreased with the growth period (Figures 3E, F).
The changes of total nitrogen loss in leaching (Equation 3) of rice under different treatments are shown in Figure 4. At the same time, the leaching loss volume of SWI treatment was significantly lower than that of TI treatment (Equations 1, 2; p<0.05, Supplementary Figure S3). The total nitrogen leaching loss rate (Equation 4) of each treatment was 4.60-6.32%, and the TI-100 and TI-70 were the highest treatments. Compared with the TI treatment, although the total leaching nitrogen concentration of SWI treatment was slightly higher than that of TI treatment, the total nitrogen leaching loss of SWI treatment was significantly lower. Therefore, the total nitrogen loss rate of SWI treatment was low, indicating that SWI treatment could effectively reduce nitrogen loss.
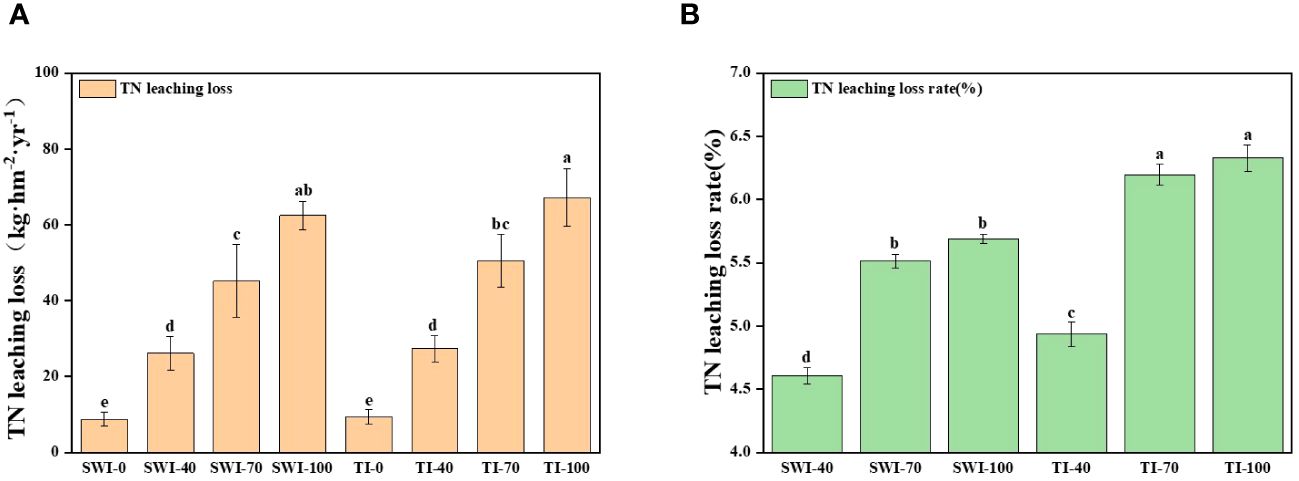
Figure 4 Changes in the amount (A) and rate (B) of total nitrogen loss from rice leaching under different treatments.
3.3 Distribution of 15N in the soil-plant-water system after fertilization
The residue and leaching loss rate of 15N labeled nitrogen fertilizer in rice soil under different treatments is shown in Figure 5. After the basal, the soil nitrogen residue rate of SWI treatment decreased with the increase of fertilizer rate, while that of TI was the opposite. After the tillering and panicle, the nitrogen residue rate of SWI treatment (Equations 5, 7) in 0-30 cm depth soil layers was increased (Figure 5A). After the panicle, the SWI-100 was the treatment with the highest residue rate, reaching 38.25%. Analyzing the soil nitrogen residue rate in two depth soil layers, it was found that nitrogen fertilizer in the SWI treatment was more likely to accumulate in 0-30 cm depth soil layers, while nitrogen fertilizer in the TI treatment was similar at two depths soil layers (Figures 5A, B).
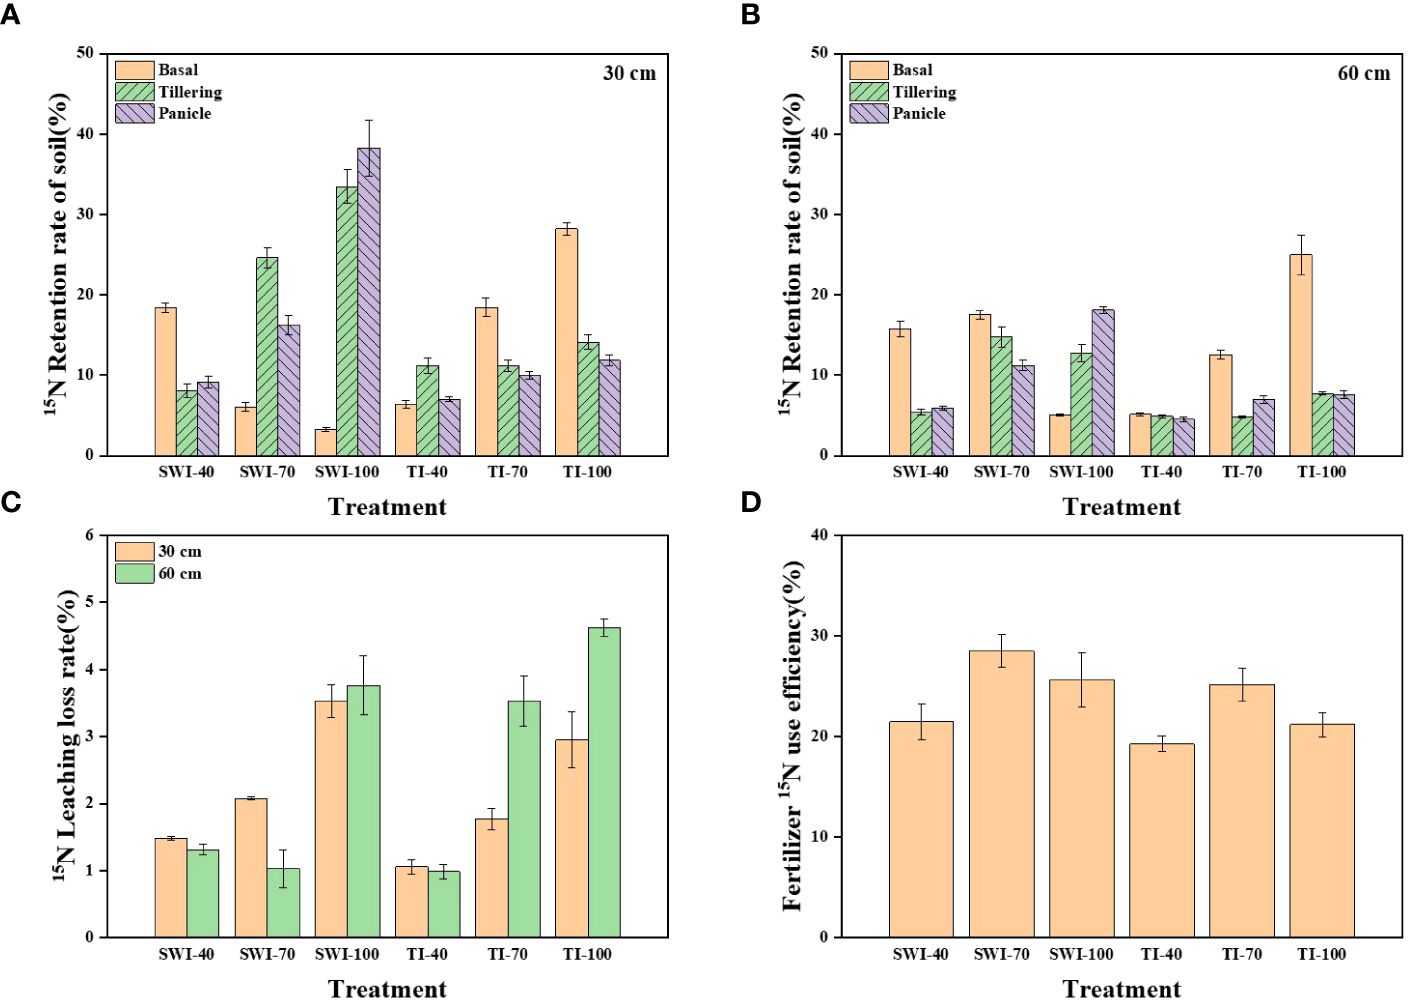
Figure 5 (A) Residual rate of 15N-labeled nitrogen fertilizer in rice 0-30 cm soil layer under different treatments; (B) Residual rate of 15N-labeled nitrogen fertilizer in 30-60 cm soil layer; (C) 15N leaching loss rate of rice nitrogen fertilizer under different treatments; (D) NUE of 15N-labeled nitrogen fertilizer under different treatments.
On the whole, the leaching loss rate of nitrogen fertilizer in 30-60 cm depth soil layers (1.06-4.63%) under TI treatment was higher than that in 0-30 cm depth (0.99-2.95%). Increasing the nitrogen fertilizer application rate has a tendency to widen the gap between the leaching loss rate (Equations 5, 8) of nitrogen fertilizer in the two depths. However, compared with TI treatment, the difference in the leaching loss rate of nitrogen fertilizer in the SWI treatment was lower between the two depths (Figure 5C). From Figure 5D, it can be seen that the fertilizer NUE (Equations 5, 6) of each treatment ranged from 19.28-28.50%, with the peak value of SWI-70 treatment. Under different irrigation measures, the fertilizer NUE with 70% nitrogen application rate was the highest. Compared with TI treatment, the SWI treatment could increase the NUE by 2.18-4.43% under the same nitrogen application rate.
3.4 Changes in soil microbial communities
The diversity index analysis of soil bacterial communities in each treatment was shown in Supplementary Table S4. The Chao1 and ACE indices of the 0-30 cm depth soil in the SWI groups were greater than those of the 30-60 cm depth soil, indicating that the microbial community richness of the 0-30 cm depth soil in the SWI groups was higher than that of the 30-60 cm depth soil. The Shannon index of the SWI groups was generally smaller than that of the TI groups, and the Shannon index of the 0-30 cm depth soil was generally smaller than that of the 30-60 cm depth soil. The Simpson index was higher in the SW-0 group compared to that in the TI-0 group, whereas the other SW groups showed lower Simpson indices than the TI groups. Therefore, the SWI measures enhanced both the homogeneity of soil microorganisms and the diversity of soil microbial communities.
High-throughput sequencing of soil microorganisms was used to analyze the microbial community at the phylum level. (Figure 6A). In the relative abundance of Proteobacteria, the vast majority of the 0-30 cm depth soil was higher than that in the 30-60 cm depth soil, with the SWI-100 groups demonstrating the highest relative abundance (25.47%). The SWI groups exhibited a higher relative abundance of Firmicutes than the TI groups. Changes in the microbial community at the genus level are shown in Figure 6B. In the SWI-0 and SWI-100 groups, the relative abundance of Bacillus, Clostridium, and Anaeromyxobacter was higher compared to those in the TI-0 and TI-100 groups.
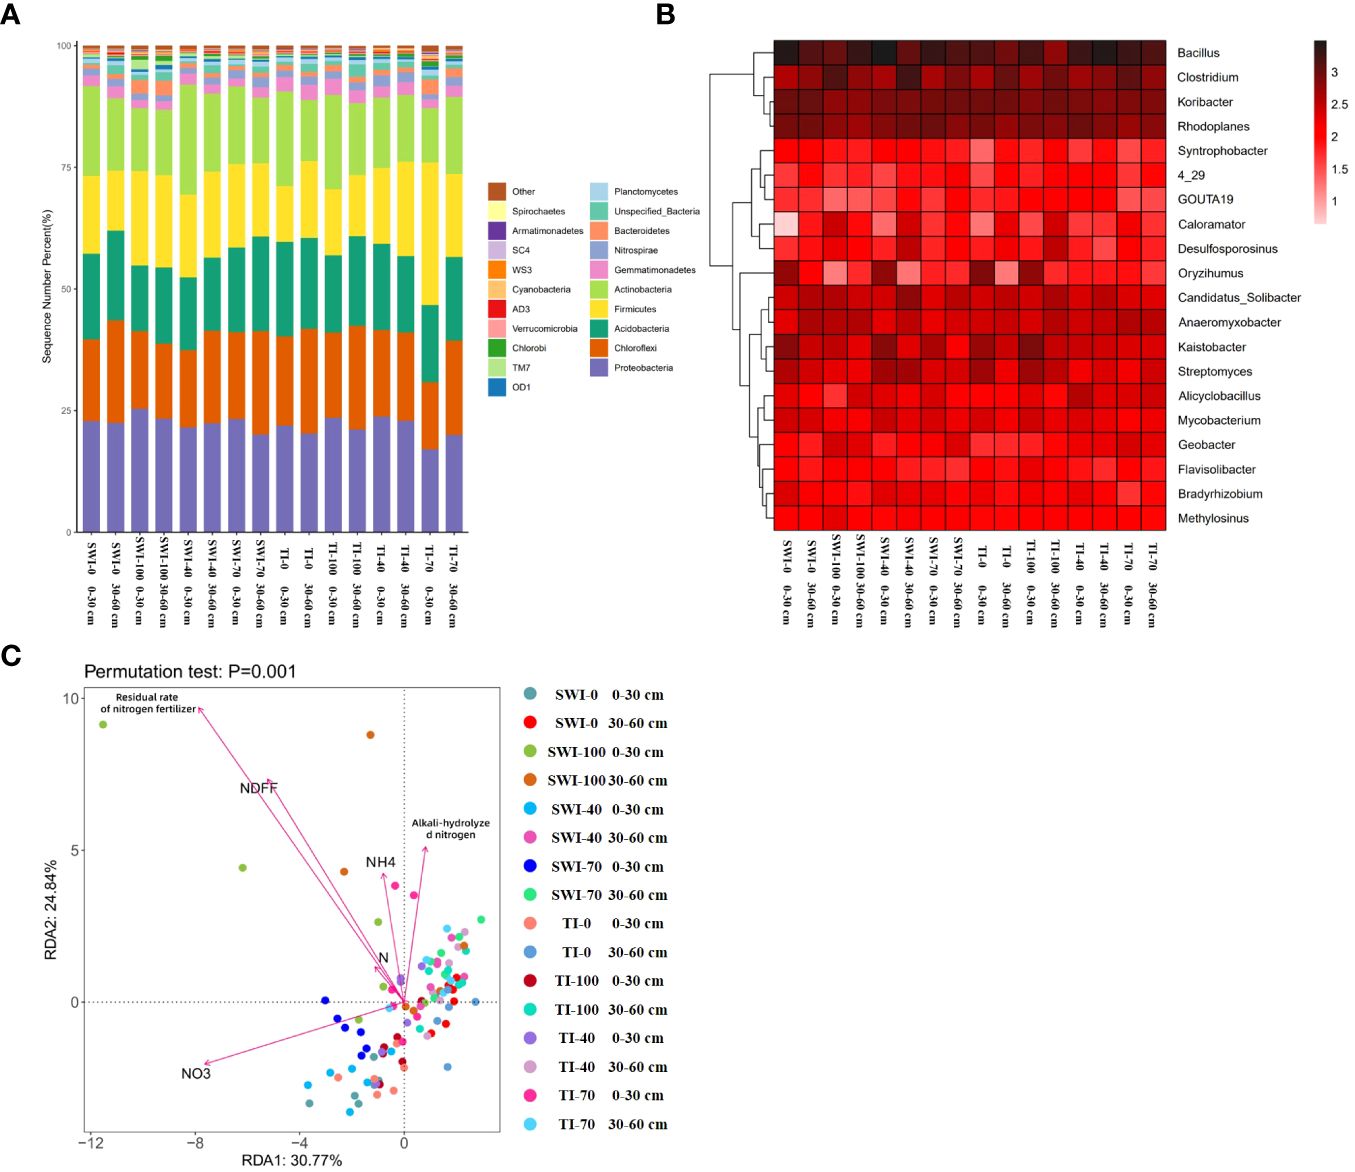
Figure 6 (A) Relative abundance composition of bacterial communities in each treatment group based on phylum levels; (B) Relative abundance composition of bacterial communities in each treatment group based on genus level; (C) Redundancy analysis (RDA) of NH4+-N, , alkali-hydrolyzed nitrogen, nitrogen content (N%), Ndff and nitrogen fertilizer residual rate under different irrigation and fertilization treatment conditions.
The redundancy analysis (RDA) revealed (Figure 6C) that the differences between the bacterial communities of soils at the two depths in the SWI groups were greater. At the 0-30 cm depth, the bacterial communities showed a positive correlation with the soil nitrate content and a negative correlation with the soil alkaline and ammonium nitrogen content, while the opposite trend was observed at the 30-60 cm depth. This indicated that the form of nitrogen in the soil at different depths were related to soil microbial communities. Differences in soil microbial communities at the 0-30 cm depth were closely related to nitrogen forms. This indicated that the fate of nitrogen in the paddy soil was closely linked to the microbial communities in the surface soil. The SWI measures could promote this phenomenon.
3.5 Changes in the soil microbial functional gene abundance
Figure 7 shows the results of soil microbial functional gene abundance determination. The 16S gene copy numbers of soil bacteria and archaea at the 0-30 cm depth were larger than those at the 30-60 cm depth. The 16S gene copy numbers of soil bacteria were 1-2 orders of magnitude larger than that of archaea. This indicated that the surface or rhizosphere soil exhibits the most concentrated distribution of soil microorganisms. The analysis of the abundance of soil ammonia-oxidizing microbial functional genes showed that the relative abundance of the bacterial amoA gene in the SWI groups was significantly higher than that in the TI groups (Equation 9). After fertilization with the tiller fertilizer, the relative abundances of the amoA gene in the 0-30 cm and 30-60 cm depth soils were 4.30 × 10⁻⁴ and 6.07 × 10⁻⁴, respectively, in the SWI-100 groups. After the fertilization of the panicle fertilizer, the relative abundance of the soil bacterial amoA gene in the SWI groups was significantly higher compared to the TI groups. The relative abundance of soil archaea genes (Equation 10) was approximately ten times higher compared to that of the bacterial amoA gene.
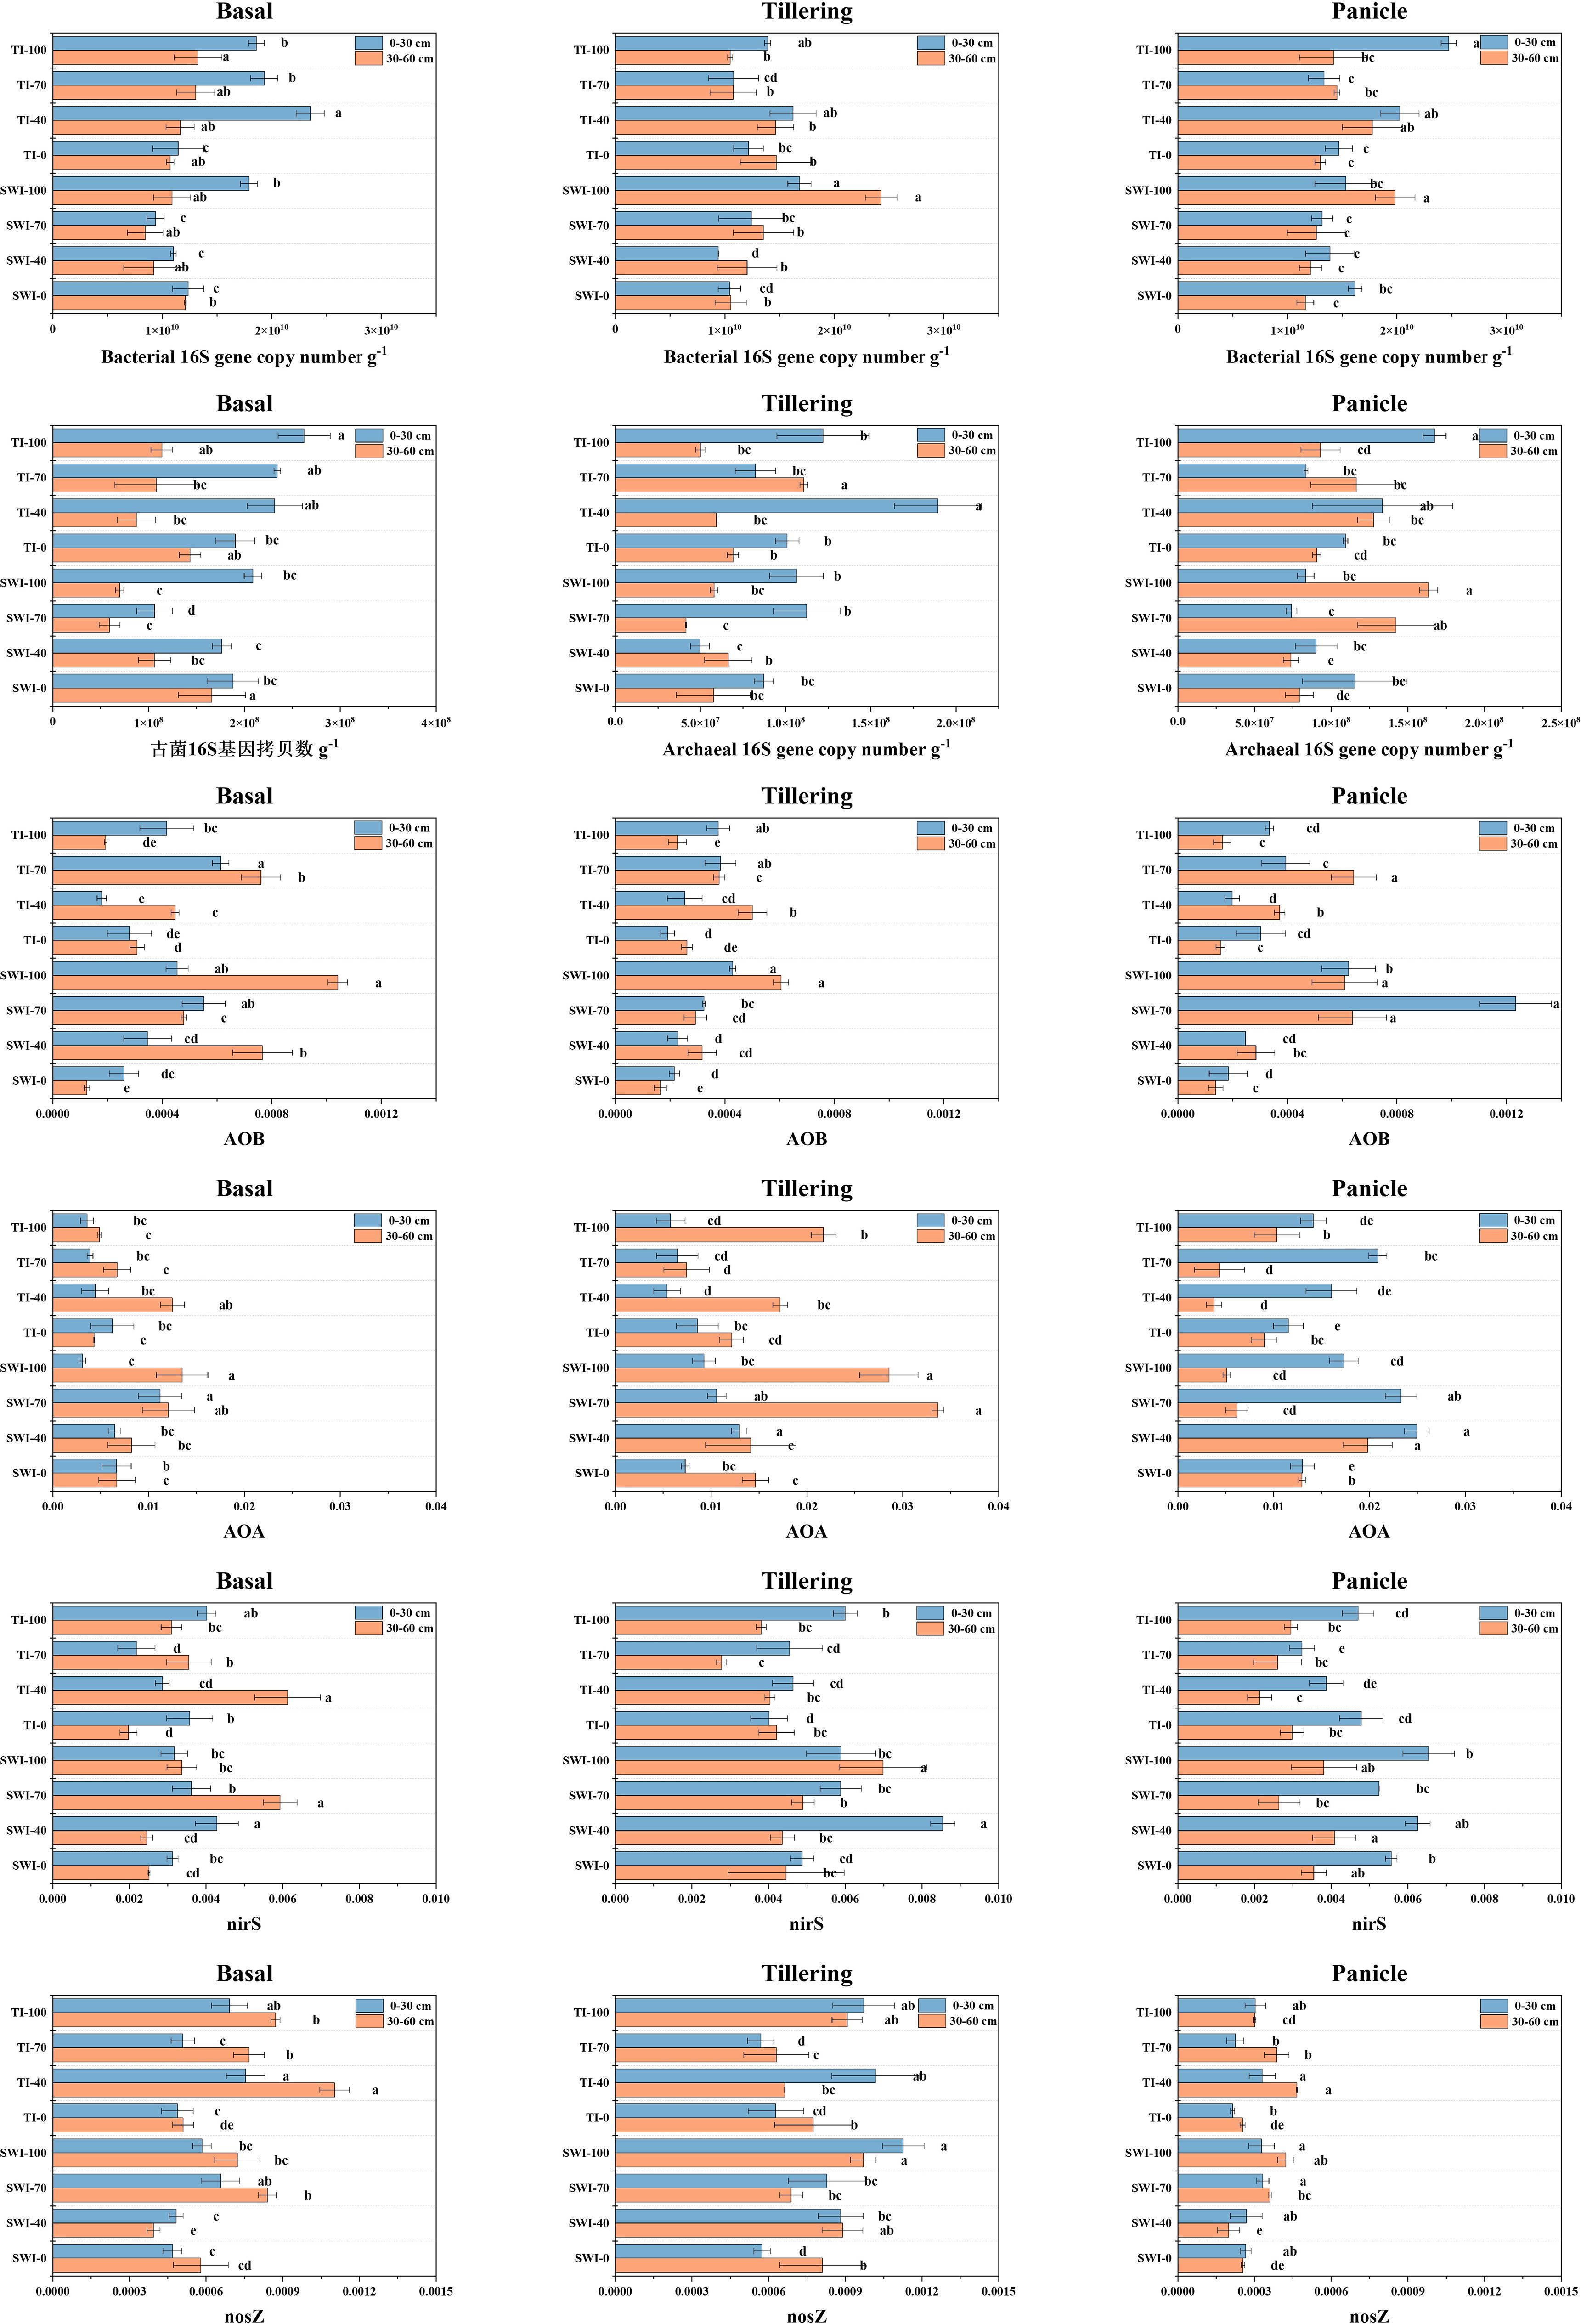
Figure 7 Changes in the copy number of soil bacteria 16S gene, copy number of soil archaea 16S gene, relative abundance of soil bacteria amoA gene, relative abundance of soil archaea amoA gene, relative abundance of soil bacteria nirS and nosZ gene at 0-30 cm and 30-60 cm soil in three reproductive periods.
The analysis of soil denitrifying bacterial functional genes showed that there was a higher relative abundance of the soil bacterial nirS gene in the SWI groups than that in the TI groups (Equation 11). After each fertilization, the relative abundance of the soil bacterial nirS gene in the SWI groups increased, whereas that in the TI groups decreased during the later stage of rice growth. The SWI measure resulted in an increase in the relative abundance of the bacterial nirS gene both in the surface soil and in the deep soil during the middle stage of rice growth in paddy fields.
4 Discussion
4.1 Changes in physical and chemical properties of soils and rice plants
In this study, the SWI treatment increased the NO3--N content and decreased the NH4+-N content of the paddy soil. These findings align with the research conducted by Wang and Huang (2021) on nitrogen content in paddy soils under water-saving irrigation practices. Soil ammonium nitrogen and nitrate nitrogen tended to migrate to deep soil; however, the migration rate of ammonium nitrogen was slower than that of nitrate nitrogen. Soil ammonium nitrogen was prone to adsorption onto soil colloidal particles, leading to its slower migration, whereas ammonium nitrogen converted into nitrate nitrogen was easier to move with water (Wang et al., 2019). After the application of nitrogen fertilizer, SWI measure can slightly increase the content of alkali-hydrolyzable nitrogen and soil nitrogen in paddy soil, indicating that reducing irrigation water will increase the content of soil organic matter and alkali-hydrolyzable nitrogen (Ma, 2018), and the increase is positively correlated with the amount of fertilizer applied.
The SWI treatment and increasing nitrogen fertilizer application rate could increase rice yield, seed setting rate and nitrogen content, but had little effect on the increase of rice plant height. This is similar to the research of Islam et al. (2016) that studying the alternate wetting and drying irrigation increased grain yield by 16%. The leaf size, tillering number and heading status of rice with 70% nitrogen application rate were significantly better than those with 40% nitrogen application rate. Postponing and reducing the application of nitrogen fertilizer can reduce the rate of nitrogen transfer in leaves, delay leaf senescence, and lead to high nitrogen accumulation in rice (Ye et al., 2013).
4.2 Dynamic changes in leaching loss concentration and loss volume
The leaching TN concentration of the SWI-100 treatment groups was found to be higher compared to that of the TI-100 treatment groups, which might be because of less water input and less dilution of nitrogen under SWI. The leaching NH4+-N concentration of the SWI-100 treatment groups was lower than that of the TI-100 treatment groups, which might be because of the reduction of the surface soil under TI. This hindered the nitrification of NH4+-N, and the applied urea was more easily converted and accumulated into NH4+-N (Valerie et al., 2023). Simultaneously, there was a posterior shift in the peak concentration of leaching NH4+-N in the SWI treatment groups. NH4+-N may be easily adsorbed by soil colloids, resulting in a slower rate of migration. Moreover, the leaching effect of the SWI treatment was weaker than that of the TI treatment, resulting in a slower downward migration of NH4+-N with gravity water. The predominant form of nitrogen leaching loss in paddy fields was NH4+-N, with a significantly higher concentration than NO3--N. This was consistent with the findings of Ji et al. (2011), which indicated that NH4+-N was the primary form of nitrogen leaching loss, constituting 39.70% of the TN loss. Root uptake is the main way for rice to absorb nitrogen (Yang et al., 2023). Zhang et al. (2016) found that rice roots had a strong preference for NH4+-N absorption. Supplying NH4+-N fertilizers to ammonium-loving crops can improve the NUE of paddy and supplying both NH4+-N and NO3--N can promote nitrogen absorption and root growth (Dong et al., 2023). Therefore, controlling moisture in paddy fields can slow down the rate of nitrogen leaching. Simultaneously, fertilizer-converted nitrogen remained in the soil of rice roots for a longer time during downward migration, promoting more forms of nitrogen to be absorbed by the plants and thus limiting nitrogen leaching losses.
The TN leaching losses in the SWI-100 and TI-100 treatment groups were 62.45 and 67.21 kg·hm-2·yr-1, respectively. Compared with the TI treatment groups, the SWI groups could reduce leaching water in the paddy field. This is similar to the study of Qi et al. (2020), which showed that dry-wet alternations significantly reduced leaching water by 21.90%. SWI reduced the amount of leaching loss by 3.0-15%, thereby reducing the TN leaching loss by 5.0-11% and the TN leaching loss rate by 0.30-0.80%. Therefore, SWI may be an effective method to reduce nitrogen leaching in paddy fields.
4.3 Distribution of 15N in the soil-plant-water system after fertilization
Figure 8 shows the nitrogen flow trend of paddy fields with 15N nitrogen fertilizer. Plant uptake (19.28-28.50%) and soil nitrogen residue were the main destinations of nitrogen fertilizer. SWI treatment could increase NUE by 2.18-4.43% under the same nitrogen application rate. Under the same irrigation measures, the NUE of 70% nitrogen application rate was the highest, which was 28.50%. Too high or too low nitrogen application rate would reduce the NUE, which was similar to the result that Zhang et al. (2012) found that the 15N-labeled NUE of rice plants was 26-30%. The accumulation of nitrogen fertilizer in soil under SWI treatment mainly occurred in the middle and late stages of rice growth (after the application of tillering or panicle), while TI treatment mainly occurred in the early stage of rice growth (after the application of basal), which is consistent with previous studies. Li et al. (2018) found that 10.30-36.40% of the basal remained in paddy soil. The leaching loss of nitrogen in various forms accounted for only 1.31-4.63% of nitrogen fertilizer. This was similar to that of many previous studies, such as the studies of Ji et al. (2011); Peng et al. (2011); Zhang et al. (2017); Han et al. (2021), and their leaching loss rates of nitrogen fertilizer were 3.50-5.40%, 3.50-5.40%, 1.40-6.40% and 0.66-2.28%, respectively. It was due to the high rainfall, low soil organic matter content and large surface runoff in South China (Zeng et al., 2021), which leads to the low rate of nitrogen fertilizer leaching. With the increase of nitrogen fertilizer application, the nitrogen leaching loss rate also showed an increasing trend, which was similar to the previous study (Shen et al., 2022; Zhang et al., 2021). This is also similar to the result of total nitrogen leaching loss in Section 3.2, indicating that appropriately reducing the nitrogen application rate in agricultural production can effectively reduce the risk of nitrogen leaching loss in paddy fields. Nitrogen fertilizer from SWI treatment is more likely to accumulate in 0-30 cm depth soil layers, which is the same as the finding of Zhang et al. (2012). Increasing the fertilization rate could significantly increase the nitrogen residue rate in 0-30 cm depth soil layers under SWI treatment and in 30-60 cm depth soil layers under TI treatment. The difference verifies that SWI treatment can effectively reduce soil nitrogen leaching loss in paddy fields.
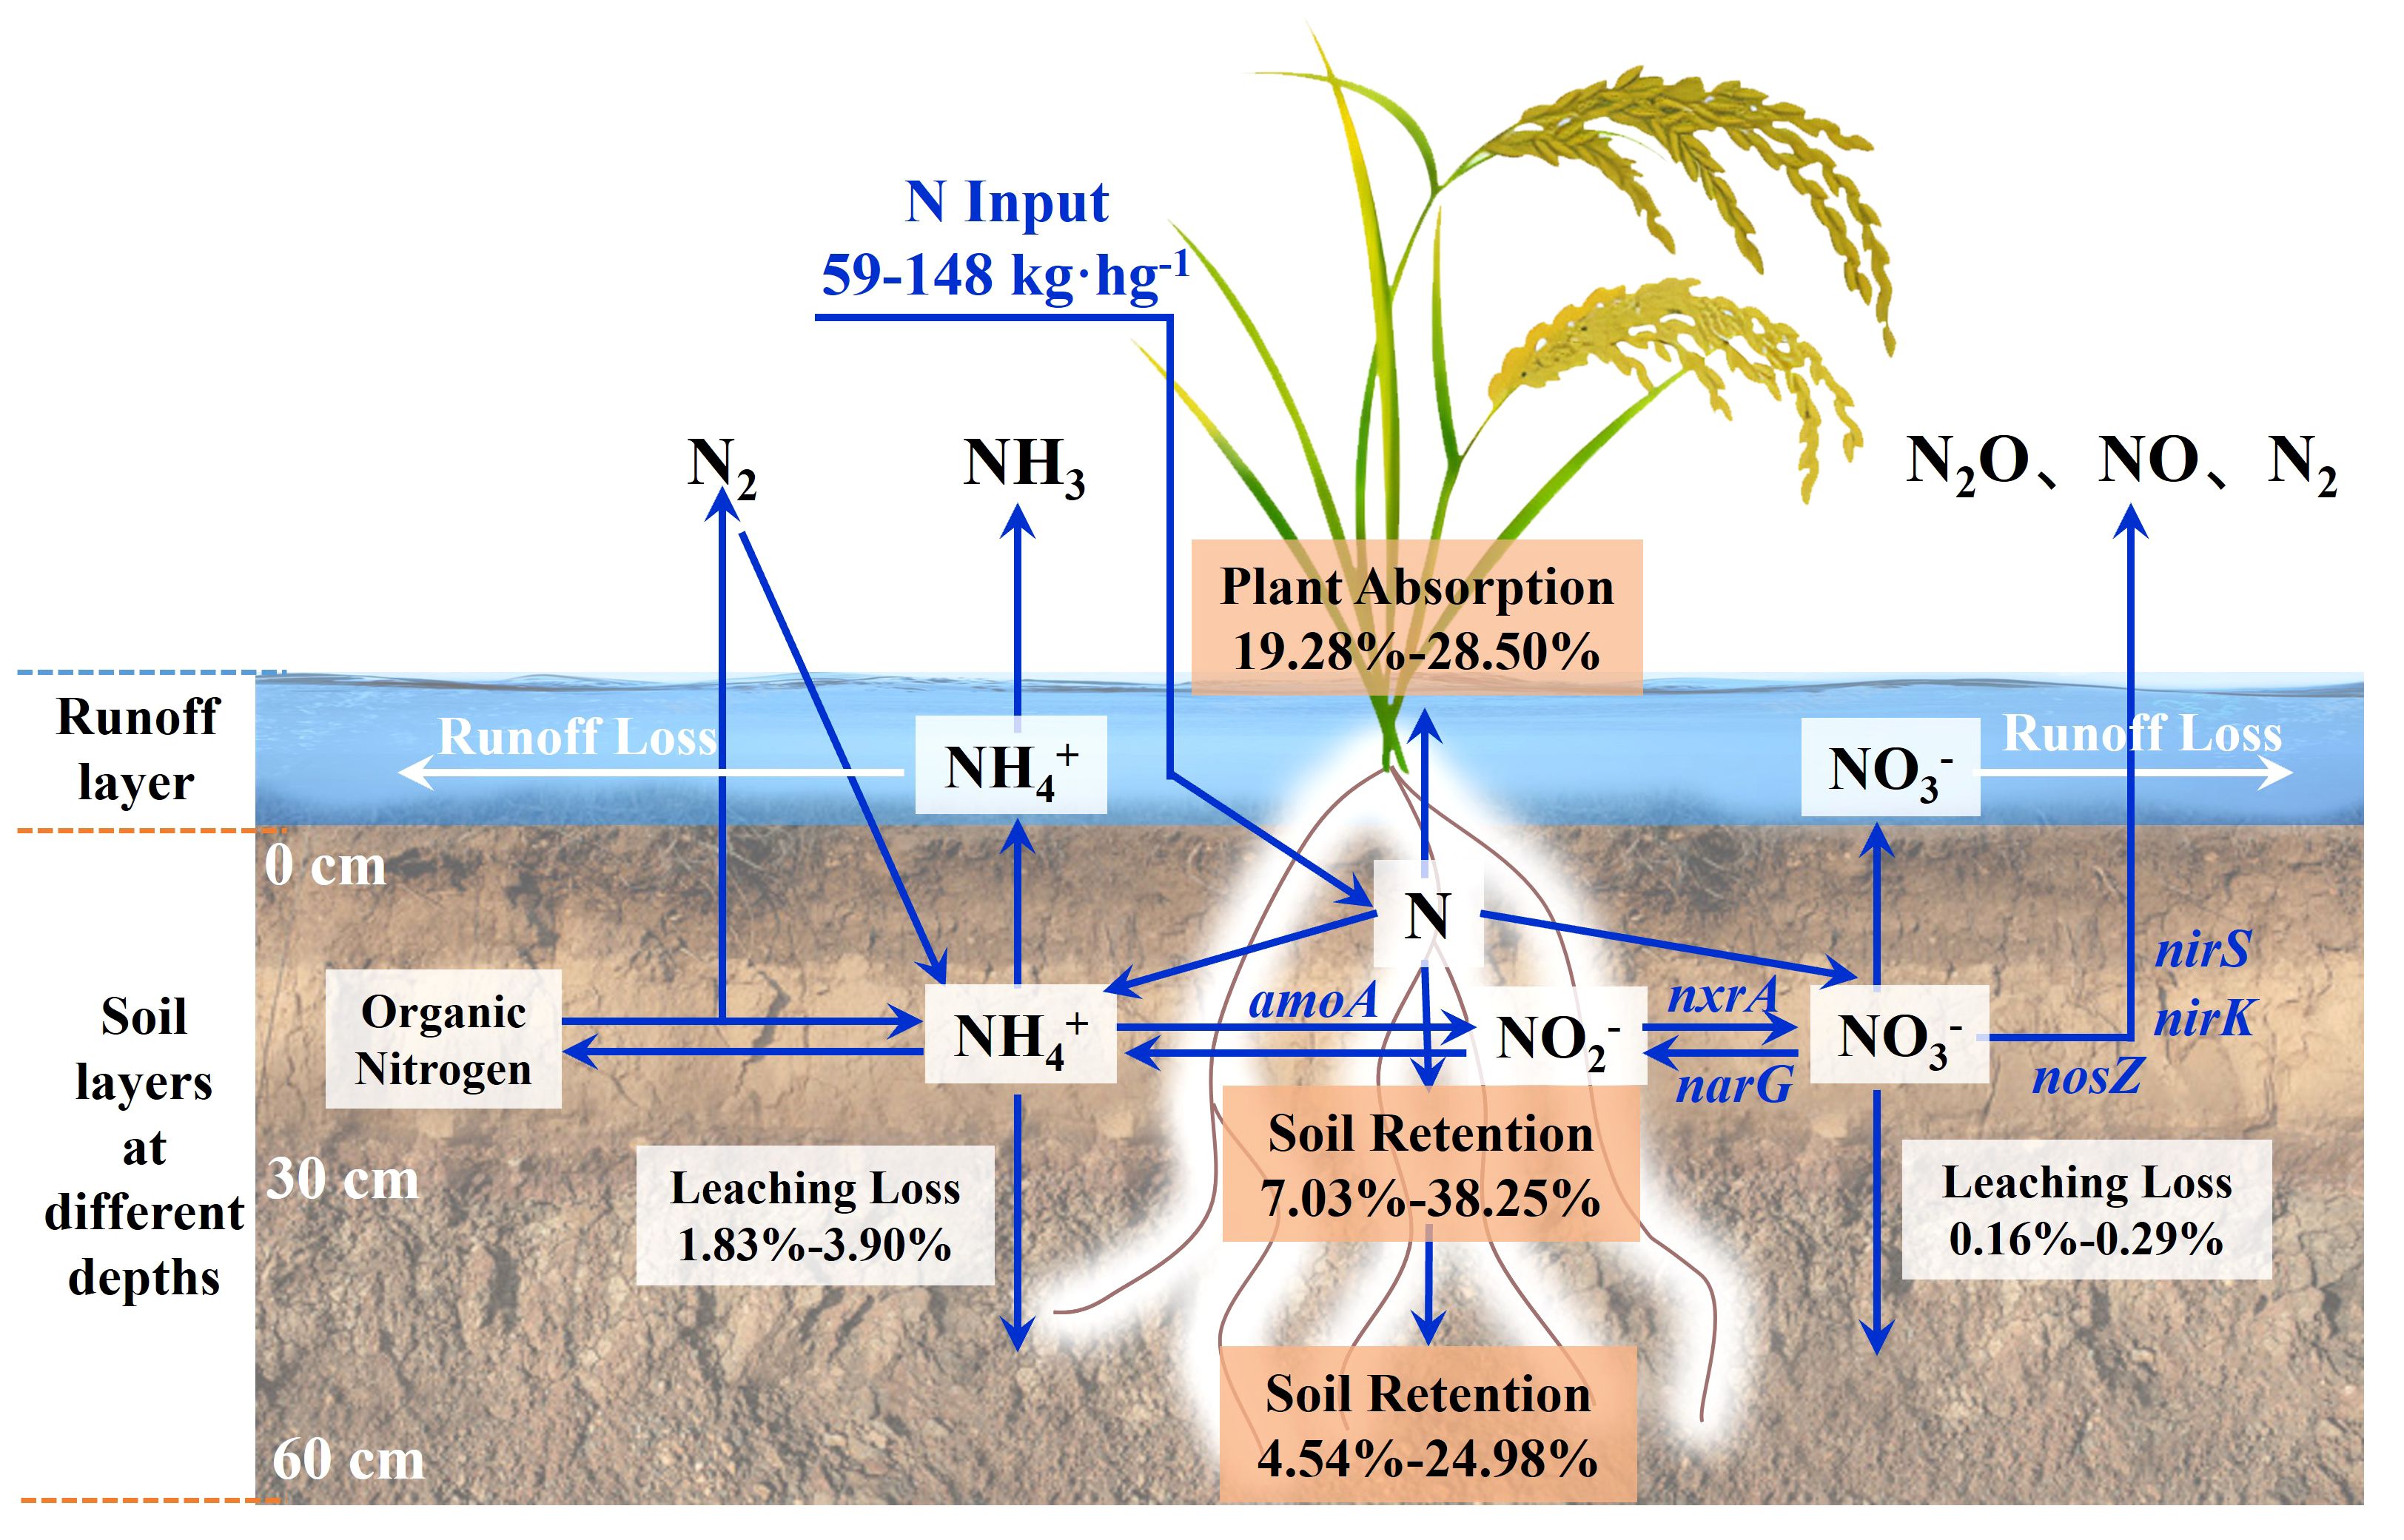
Figure 8 Nitrogen fate of 15N-labeled nitrogen fertilizer.
4.4 Effects of different fertilization measures on soil bacterial community composition
The SWI measures enhanced both the homogeneity of soil microorganisms and the diversity of soil microbial communities (Supplementary Table S4). The SWI measures could increase the relative abundance of Proteobacteria in the surface soil. Kowalchuk and Stephen (2001) found that the first step of the nitrification process, that is, the oxidation of ammonia to nitrite was the limiting step in the cycle. This stage was usually carried out by AOB of β-Proteobacteria and γ-Proteobacteria (Schleper et al., 2005). The SWI increased the relative abundance of Firmicutes in the paddy soil. Additionally, Firmicutes were found to have the ability to fix nitrogen and produce a large amount of ammonium nitrogen during rice growth (Wang et al., 2017). This may complement the relatively low NH4+-N content in the paddy soil and water under SWI measures, reducing the dependence of rice on chemical fertilizers, and thereby increasing the NUE. Among them, Mevel and Prieur (2000) found that Bacillus could improve heterotrophic nitrification activity under aerobic conditions. Simultaneously, Clostridium and Anaeromyxobacter could promote nitrogen fixation under anaerobic conditions (Masuda et al., 2020; Han et al., 2021). The relative abundance of Nitrospirae in 0-30 cm soils was smaller than that in 30-60 cm soils under SWI treatment. Previous studies have found that the Comammox Nitrospira strain can oxidize ammonium nitrogen to nitrate (Daims et al., 2015). This may be the reason for the smaller 15N leaching loss rate of 0-30 cm than 30-60 cm soil under SWI treatment. Therefore, the SWI treatment could enhance the NUE of paddy by increasing the relative abundance of microbial communities such as Bacillus, Clostridium, and Anaeromyxobacter.
4.5 Effects of different fertilization measures on microbial functional gene abundance
Ammonia-oxidizing archaea (AOA) in the paddy soil may exert a greater effect on soil ammonia oxidation than that exerted by AOB. It was found that the number of AOA in the soil could be up to 3000 times that of AOB (Leininger et al., 2006; He et al., 2007; Shen et al., 2008). This indicated that AOA was the dominant ammonia-oxidizing microorganism in the soil compared to AOB. The relative abundance of AOA and AOB in the SWI groups was higher compared to that in the TI groups during the growth and development of paddy. Additionally, SWI measures were found to increase the NO3--N content in both the soil and leaching water (Sections 3.1 and 3.2). The increase of AOA and AOB in the SWI groups promoted the soil nitrification process, thereby increasing NO3--N content. The abundances of AOA and AOB during the middle and later stages of paddy planting were higher compared to those during the early stage. This indicated that nitrification is stronger during the middle and late stages of paddy planting, and that NH4+-N converted by urea was more easily converted into NO3--N. The relative abundance of the nosZ gene (Equation 12) was lower than that of the nirS gene, which may lead to the activity of NO2− reduction to NO, which was higher than that of N2O reduction to N2.
4.6 Fate of 15N in the soil-plant-water system and environmental implication
In this study, the amount of nitrogen fertilizers applied to plants, soil, and leaching loss in the paddy field system was tracked by adding 15N-labeled urea. Figure 8 shows the fate of 15N in the soil-plant-water system after fertilization. It was found that plant absorption and soil residue were the main pathways of the nitrogen fertilizers. The same results were described in Section 3.4. The SWI measures increased the relative abundance of Firmicutes in the paddy soil, thereby increasing the ability of nitrogen fixation to produce ammonium nitrogen. Simultaneously, the relative abundances of Bacillus, Clostridium, and Anaeromyxobacter in the paddy soil were increased by SWI measures. Bacillus could improve heterotrophic nitrification activity under aerobic conditions (Mevel and Prieur, 2000). Clostridium and Anaeromyxobacter could promote nitrogen fixation under anaerobic conditions (Masuda et al., 2020; Han et al., 2021). This indicated that the SWI measures could effectively increase the NUE of paddy. Nutrients dissolved in water flow into groundwater as the paddy field is vertically leached. The SWI treatment reduced the amount of leaching water by reducing the amount of irrigation water while ensuring the yield, thereby reducing the loss of nitrogen. This improved the NUE and reduced the risk of non-point source pollution.
During the middle and late stages of rice growth, the SWI groups resulted in higher abundance of AOA and AOB. Therefore, the nitrification was more intense in the SWI group. At this time, the ammonium nitrogen converted from urea is more easily converted to nitrate nitrogen through nitrification. The nitrogen leaching loss in paddy fields is mainly caused by ammonium nitrogen (Figure 7). Thus, the SWI measures can effectively reduce the nitrogen leaching loss in paddy fields by controlling ammonium nitrogen.
5 Conclusions
The main conclusions of this paper are as follows:
● The SWI treatment promoted the absorption of nitrogen fertilizer by rice through increasing the NO3--N content in red soil and inhibiting the migration of nitrogen. Further experiments revealed that SWI treatment increased the relative abundance of Firmicutes in the paddy red soil, which were found to be capable of fixing nitrogen and producing ammonium nitrogen during rice growth. This may complement the NH4+-N content for paddy under SWI treatment.
● In South China with red soil as the main soil type, the SWI treatment could reduce the leaching loss rate of nitrogen fertilizer in the deep soil by 0.30-0.80% and improve the NUE by 2.18-4.43%. Nitrogen fertilizer from SWI treatment tend to accumulate in the surface layer (0-30 cm) of the soil. Plant absorption and nitrogen fertilizer residue were the main pathways of nitrogen fertilizer. After applying the 15N-labeled nitrogen fertilizer to the paddy soil, plant absorption accounted for 19.28-28.50% of the nitrogen fertilizer, whereas the leaching loss of each form of the nitrogen fertilizer only accounted for 1.31-4.63%.
● The SWI measure can enhance nitrification and promote nitrate nitrogen accumulation and ammonium nitrogen transformation in red soil. The SWI measure and nitrogen fertilizer application increased the relative abundance of nirS and nosZ genes and promoted denitrification in the surface red soil of paddy. The SWI measures promoted ammonia oxidation and denitrification through the promotion of Proteobacteria, Nitrospirae, and Bacteroidetes abundance and activity. Compared to AOB, AOA in the paddy soil might have a greater effect on soil ammonia oxidation.
The outcomes from this study are expected to advance the understanding the nitrogen transformation and microbial regulation mechanisms in paddy field systems under different water and fertilizer management conditions. However, limitations still exist in (i) the lack of studying gaseous nitrogen loss in paddy fields; (ii) the absence of data to deeper analysis that the soil moisture content is consistent with the same treatment. Therefore, further studies are needed to quantify the gaseous loss and fate of nitrogen fertilizers throughout the paddy system. At the same time, soil-water potential data and water depth data throughout the crop-growing season need to be analyzed to eliminate the influence of soil moisture content on different irrigational measures.
Data availability statement
The 16S raw data were deposited in the National Center for Biotechnology Information (NCBI) Sequence Reads Archive (SRA) (accession number: PRJNA1087108).
Author contributions
TYC: Data curation, Formal analysis, Writing – original draft, Writing – review & editing. XMY: Data curation, Investigation, Visualization, Writing – review & editing. ZZu: Data curation, Investigation, Visualization, Writing – review & editing. HJX: Writing – review & editing, Investigation. XJY: Investigation, Writing – review & editing. XJZ: Investigation, Writing – review & editing. SRH: Investigation, Writing – review & editing. XW: Investigation, Writing – review & editing. XML: Investigation, Writing – review & editing. YTL: Conceptualization, Funding acquisition, Methodology, Resources, Supervision, Writing – review & editing. ZZh: Conceptualization, Funding acquisition, Methodology, Resources, Supervision, Writing – review & editing.
Funding
The author(s) declare that financial support was received for the research, authorship, and/or publication of this article. This work was supported by the National Natural Science Foundation of China (grant number 42077359), National Key Research and Development Program of China (No. 2023YFD1901305), Guangdong Provincial Key R&D Program (grant number 2023B0202030001), and Science and Technology Planning Project of Guangzhou (202201010505).
Conflict of interest
The authors declare that the research was conducted in the absence of any commercial or financial relationships that could be construed as a potential conflict of interest.
Publisher’s note
All claims expressed in this article are solely those of the authors and do not necessarily represent those of their affiliated organizations, or those of the publisher, the editors and the reviewers. Any product that may be evaluated in this article, or claim that may be made by its manufacturer, is not guaranteed or endorsed by the publisher.
Supplementary material
The Supplementary Material for this article can be found online at: https://www.frontiersin.org/articles/10.3389/fpls.2024.1340336/full#supplementary-material
References
Chen, K., Yu, S. E., Ma, T., Ding, J., He, P., Dai, Y., et al. (2022). Effects of water and nitrogen management on water productivity, nitrogen use efficiency and leaching loss in rice paddies. Water 14, 1596. doi: 10.3390/w14101596
Cheng, Y., Zhang, H., Chen, Z., Wang, J., Cai, Z., Sun, N., et al. (2021). Contrasting effects of different pH-raising materials on N2O emissions in acidic upland soils. Eur. J. Soil Sci. 72, 432–445. doi: 10.1111/ejss.12964
Daims, H., Lebedeva, E. V., Pjevac, P., Han, P., Herbold, C., Albertsen, M., et al. (2015). Complete nitrification by Nitrospira bacteria. Nature 528, 504. doi: 10.1038/nature16461
Das, S., Chou, M., Jean, J., Liu, C., Yang, H. (2016). Water management impacts on arsenic behavior and rhizosphere bacterial communities and activities in a rice agro-ecosystem. Sci. Total Environ. 542, 642–652. doi: 10.1016/j.scitotenv.2015.10.122
Ding, J., Jiang, Y., Liu, Q., Hou, Z., Liao, J., Fu, L., et al. (2016). Influences of the land use pattern on water quality in low-order streams of the Dongjiang River basin, China: A multi-scale analysis. Sci. Total Environ. 551-552, 205–216. doi: 10.1016/j.scitotenv.2016.01.162
Dong, Y., Sun, C., Dong, Q. (2023). Effects of different ratios of ammonium and nitrate fertilizers on rice seedling quality and soil nutrient changes. Southwest Agric. J. 36, 2183–2190. doi: 10.16213/j.cnki.scjas.2023.10.014
Gaihre, Y. K., Singh, U., Islam, S. M. M., Huda, A., Islam, M. R., Satter, M. A., et al. (2015). Impacts of urea deep placement on nitrous oxide and nitric oxide emissions from rice fields in Bangladesh. Geoderma 259-260, 370–379. doi: 10.1016/j.geoderma.2015.06.001
Gaihre, Y. K., Singh, U., Islam, S. M. M., Huda, A., Islam, M. R., Sanabria, J., et al. (2018). Nitrous oxide and nitric oxide emissions and nitrogen use efficiency as affected by nitrogen placement in lowland rice fields. Nutr. Cyc. Agroecosys. 110, 277–291. doi: 10.1007/s10705-017-9897-z
Guo, H., Liu, J., Zhang, Y., Shen, J., Han, X., Zhang, W., et al. (2010). Significant acidification in major Chinese croplands. Science 5968), 1008–1010. doi: 10.1126/science.1182570
Han, H., Gao, R., Cui, Y., Gu, S. (2021). Transport and transformation of water and nitrogen under different irrigation modes and urea application regimes in paddy fields. Agric. Water Manage. 255, 107024. doi: 10.1016/j.agwat.2021.107024
He, J., Shen, J., Zhang, L., Zhu, Y., Zheng, Y., Xu, M., et al. (2007). Quantitative analyses of the abundance and composition of ammonia-oxidizing bacteria and ammonia-oxidizing archaea of a Chinese upland red soil under long-term fertilization practices. Environ. Microbiol. 9, 2364–2374. doi: 10.1111/j.1462-2920.2007.01358.x
Islam, S. M. M., Gaihre, Y. K., Biswas, J. C., Jahan, M. S., Singh, U., Adhikary, S., et al. (2018a). Different nitrogen rates and methods of application for dry season rice cultivation with alternate wetting and drying irrigation: Fate of nitrogen and grain yield. Agric. Water Manage. 196, 144–153. doi: 10.1016/j.agwat.2017.11.002
Islam, S. M. M., Gaihre, Y. K., Biswas, J. C., Singh, U., Ahmed, M. N., Sanabria, J., et al. (2018b). Nitrous oxide and nitric oxide emissions from lowland rice cultivation with urea deep placement and alternate wetting and drying irrigation. Sci. Rep. 8 (1), 1–10. doi: 10.1038/s41598-018-35939-7
Islam, S. M. M., Gaihre, Y. K., Shah, A. L., Singh, U., Sarkar, M. I. U., Satte, M. A., et al. (2016). Rice yields and nitrogen use efficiency with different fertilizers and water management under intensive lowland rice cropping systems in Bangladesh. Nutr. Cycl. Agroecosys. 106, 143–156. doi: 10.1007/s10705-016-9795-9
Issaka, F., Zhang, Z., Zhao, Z., Asenso, E., Li, J., Li, Y.-T., et al. (2019). Sustainable conservation tillage improves soil nutrients and reduces nitrogen and phosphorous losses in maize farmland in Southern China. Sustainability 11, 2397. doi: 10.3390/su11082397
Ji, X., Zheng, S., Shi, L., Liu, Z. (2011). Systematic studies of nitrogen loss from paddy soils through leaching in the Dongting Lake area of China. Pedosphere 06, 753–762. doi: 10.1016/S1002-0160(11)60179-3
Kowalchuk, G. A., Stephen, J. R. (2001). AMMONIA-OXIDIZING BACTERIA: A model for molecular microbial ecology. Annu. Rev. Microbiol. 55, 485–529. doi: 10.1146/annurev.micro.55.1.485
Leininger, S., Urich, T., Schloter, M., Schwark, L., Qi, J., Nicol, G., et al. (2006). Archaea predominate among ammonia-oxidizing prokaryotes in soils. Nature 442, 806–809. doi: 10.1038/nature04983
Li, G., Lin, J., Xue, L., Ding, Y., Wang, S., Linzhang, Y. (2018). Fate of basal N under split fertilization in rice with 15N isotope trace. Pedosphere 28, 135–143. doi: 10.1016/S1002-0160(17)60407-7
Li, P., Li, X., Hou, W., Ren, T., Cong, R. (2018). Studying the fate and recovery efficiency of controlled release urea in paddy soil using 15N tracer technique. Scientia Agricultura Sin. 51, 3961–3971. doi: 10.3864/j.issn.0578-1752.2018.20.014
Liu, H., Huang, X., Tan, W., Di, H., Xu, J., Li, Y., et al. (2020). High manure load reduces bacterial diversity and network complexity in a paddy soil under crop rotations. Soil Ecol. Lett. 2, 104–119. doi: 10.1007/s42832-020-0032-8
Liu, Y., Chi, Q., Cheng, H., Ding, H., Wen, T., Zhao, J., et al. (2022). Comparative microbial nitrogen functional gene abundances in the topsoil vs. Subsoil of three grassland habitats in northern China. Front. Plant Sci. 12. doi: 10.3389/fpls.2021.792002
Ma, Y. (2018). Effects of water regulation on yield, quality and soil environment of alfalfa under subsurface drip irrigation in desert irrigation area. Gansu Agric. University.
Man, Y., Li, W., Wang, J., Tam, N., Tai, Y., Tao, R., et al. (2022). Plants inhibit the relative abundance of sulfonamide resistance genes and class 1 integron by influencing bacterial community in rhizosphere of constructed wetlands. Sci. Total Environ. 824, 153977–153977. doi: 10.1016/j.scitotenv.2022.153977
Masuda, Y., Yamanaka, H., Xu, Z. X., Shiratori, Y., Aono, T., Amachi, S., et al. (2020). Diazotrophic anaeromyxobacter isolates from soils. Appl. Environ. Microbiol. 86. doi: 10.1128/AEM.00956-20
Mevel, G., Prieur, D. (2000). Heterotrophic nitrification by a thermophilic Bacillus species as influenced by different culture conditions. Can. J. Microbiol. 46, 465–473. doi: 10.1139/w00-005
Peng, S., Luo, Y., Xu, J., Khan, S., Jiao, X., Wang, W. (2012). Integrated irrigation and drainage practices to enhance water productivity and reduce pollution in a rice production system. Irrigation Drainage 61, 285–293. doi: 10.1002/ird.684
Peng, S., Yang, S., Xu, J., Luo, Y., Hou, H. (2011). Nitrogen and phosphorus leaching losses from paddy fields with different water and nitrogen managements. Paddy Water Environ. 9, 333–342. doi: 10.1007/s10333-010-0246-y
Qi, D., Wu, Q., Zhu, J. (2020). Nitrogen and phosphorus losses from paddy fields and the yield of rice with different water and nitrogen management practices. Sci. Rep. 10. doi: 10.1038/s41598-020-66757-5
Schleper, C., Jurgens, G., Jonuscheit, M. (2005). Genomic studies of uncultivated archaea. Nat. Rev. Microbiol. 3, 479–488. doi: 10.1038/nrmicro1159
Shen, J., Li, Y., Wang, Y., Li, Y., Zhu, X., Jiang, W., et al. (2022). Soil nitrogen cycling and environmental impacts in the subtropical hilly region of China. Front. Agric. Sci. Eng. 03), 407–424.
Shen, J., Zhang, L., Zhu, Y., Zhang, J., He, J. (2008). Abundance and composition of ammonia-oxidizing bacteria and ammonia-oxidizing archaea communities of an alkaline sandy loam. Environ. Microbiol. 10, 1601–1611. doi: 10.1111/j.1462-2920.2008.01578.x
Tan, X., Shao, D., Liu, H., Yang, F., Xiao, C., Yang, H., et al. (2013). Effects of alternate wetting and drying irrigation on percolation and nitrogen leaching in paddy fields. Paddy Water Environ. 11, 381–395. doi: 10.1007/s10333-012-0328-0
Valerie, S., Andre, V., Wolfgang, W., Catarina, H., Nils, P., Gerd, W., et al. (2023). Nitrogen release from different polymer-coated urea fertilizers in soil is affected by soil properties. Soil Use Manage. 4, 1477–1490.
Wang, M., Fu, Y., Wang, Y., Li, Y., Shen, J., Liu, X., et al. (2021). Pathways and mechanisms by which biochar application reduces nitrogen and phosphorus runoff losses from a rice agroecosystem. Sci. Total Environ. 797, 149193. doi: 10.1016/j.scitotenv.2021.149193
Wang, L., Huang, D. (2021). Nitrogen and phosphorus losses by surface runoff and soil microbial communities in a paddy field with different irrigation and fertilization managements. PloS One 16, e254227. doi: 10.1371/journal.pone.0254227
Wang, C., Liu, D., Bai, E. (2018). Decreasing soil microbial diversity is associated with decreasing microbial biomass under nitrogen addition. Soil Biol. Biochem. 120, 126–133. doi: 10.1016/j.soilbio.2018.02.003
Wang, R., Min, J., Kronzucker, H. J., Li, Y., Shi, W. (2019). N and P runoff losses in China's vegetable production systems: Loss characteristics, impact, and management practices. Sci. Total Environ. 663, 971–979. doi: 10.1016/j.scitotenv.2019.01.368
Wang, J., Song, Y., Ma, T., Raza, W., Li, J., Howland, J. G., et al. (2017). Impacts of inorganic and organic fertilization treatments on bacterial and fungal communities in a paddy soil. Appl. Soil Ecol. 112, 42–50. doi: 10.1016/j.apsoil.2017.01.005
Wang, D., Xu, C., Yan, J., Zhang, X., Chen, S., Chauhan, B. S., et al. (2017). 15 N tracer-based analysis of genotypic differences in the uptake and partitioning of N applied at different growth stages in transplanted rice. Field Crops Res. 211, 27–36. doi: 10.1016/j.fcr.2017.06.017
Xu, C., Chen, L., Chen, S., Chu, G., Wang, D., Zhang, X. (2020). Rhizosphere aeration improves nitrogen transformation in soil, and nitrogen absorption and accumulation in rice plants. Rice Sci. 02), 162–174.
Yang, J., Guo, W., Yang, W., Zhou, B., Xing, S. (2023). Effects of milk vetch on leaching and loss of dissolved organic carbon and nitrogen in different types of paddy soils. J. Agro-Environment Sci. 1–10.
Ye, Y., Liang, X., Chen, Y., Liu, J., Gu, J., Guo, R., et al. (2013). Alternate wetting and drying irrigation and controlled-release nitrogen fertilizer in late-season rice. Effects on dry matter accumulation, yield, water and nitrogen use. Field Crops Res. 144, 212–224. doi: 10.1016/j.fcr.2012.12.003
Zeng, F., Zuo, Z., Mo, J., Chen, C., Yang, X., Wang, J., et al. (2021). Runoff losses in nitrogen and phosphorus from paddy and maize cropping systems: A field study in Dongjiang basin, South China. Front. Plant Sci. 12. doi: 10.3389/fpls.2021.675121
Zhang, M., Tian, Y., Zhao, M., Yin, B., Zhu, Z. (2017). The assessment of nitrate leaching in a rice–wheat rotation system using an improved agronomic practice aimed to increase rice crop yields. Agriculture Ecosyst. Environ. 241, 100–109. doi: 10.1016/j.agee.2017.03.002
Zhang, J., Wang, J., Müller, C., Cai, Z. (2016). Ecological and practical significances of crop species preferential N uptake matching with soil N dynamics. Soil Biol. Biochem. 103, 63–70. doi: 10.1016/j.soilbio.2016.08.009
Zhang, X., Xiao, G., Bol, R., Wang, L., Zhuge, Y., Wu, W., et al. (2021). Influences of irrigation and fertilization on soil N cycle and losses from wheat-maize cropping system in northern China. Environ. Pollut. 278, 116852–116852. doi: 10.1016/j.envpol.2021.116852
Zhang, Q., Yang, Z., Zhang, H., Yi, J. (2012). Recovery efficiency and loss of 15N-labelled urea in a rice-soil system in the upper reaches of the Yellow River basin. Agriculture Ecosyst. Environ. 158, 118–126. doi: 10.1016/j.agee.2012.06.003
Zhao, Z., Sha, Z., Liu, Y., Wu, S., Zhang, H., Li, C., et al. (2016). Modeling the impacts of alternative fertilization methods on nitrogen loading in rice production in Shanghai. Sci. Total Environ. 566-567, 1595–1603. doi: 10.1016/j.scitotenv.2016.06.055
Zhao, Z., Zhang, H., Li, C., Zhao, Q., Cao, L. (2014). Quantifying nitrogen loading from a paddy field in Shanghai, China with modified DNDC model. Agriculture Ecosyst. Environ. 197, 212–221. doi: 10.1016/j.agee.2014.08.002
Keywords: shallow wet irrigation, soil nitrogen transformation, nitrogen leaching loss, 15N isotope tracer technique, microbial composition and function
Citation: Chen T, Yang X, Zuo Z, Xu H, Yang X, Zheng X, He S, Wu X, Lin X, Li Y and Zhang Z (2024) Shallow wet irrigation reduces nitrogen leaching loss rate in paddy fields by microbial regulation and lowers rate of downward migration of leaching water: a 15N-tracer study. Front. Plant Sci. 15:1340336. doi: 10.3389/fpls.2024.1340336
Received: 17 November 2023; Accepted: 08 March 2024;
Published: 25 March 2024.
Edited by:
Néstor Fernández Del-Saz, University of the Balearic Islands, SpainReviewed by:
Jianlin Shen, Chinese Academy of Sciences (CAS), ChinaHanxi Wang, Harbin Normal University, China
S.M. Mofijul Islam, Bangladesh Rice Research Institute, Bangladesh
Copyright © 2024 Chen, Yang, Zuo, Xu, Yang, Zheng, He, Wu, Lin, Li and Zhang. This is an open-access article distributed under the terms of the Creative Commons Attribution License (CC BY). The use, distribution or reproduction in other forums is permitted, provided the original author(s) and the copyright owner(s) are credited and that the original publication in this journal is cited, in accordance with accepted academic practice. No use, distribution or reproduction is permitted which does not comply with these terms.
*Correspondence: Zhen Zhang, enpoYW5nYWxAc2NhdS5lZHUuY24=; emhhbmd6aGVuXzIzMTAyQDE2My5jb20=; Yongtao Li, eW9uZ3Rhb0BzY2F1LmVkdS5jbg==
†These authors have contributed equally to this work and share first authorship