 Maryam Salami1*
 Bahram Heidari1*†
 Bahram Alizadeh2
 Jacqueline Batley3†
 Jin Wang4Xiao-Li Tan4
 Ali Dadkhodaie1
 Christopher Richards5
- 1Department of Plant Production and Genetics, School of Agriculture, Shiraz University, Shiraz, Iran
- 2Oil Crops Research Department, Seed and Plant Improvement Institute, Agricultural Research Education and Extension, Organization, (AREEO), Karaj, Iran
- 3School of Biological Sciences, University of Western Australia, Perth, WA, Australia
- 4School of Life Sciences, Jiangsu University, Zhenjiang, China
- 5United States Department of Agriculture (USDA), Agricultural Research Service (ARS), National Laboratory for Genetic Resources Preservation, Fort Collins, CO, United States
Introduction: An important strategy to combat yield loss challenge is the development of varieties with increased tolerance to drought to maintain production. Improvement of crop yield under drought stress is critical to global food security.
Methods: In this study, we performed multiomics analysis in a collection of 119 diverse rapeseed (Brassica napus L.) varieties to dissect the genetic control of agronomic traits in two watering regimes [well-watered (WW) and drought stress (DS)] for 3 years. In the DS treatment, irrigation continued till the 50% pod development stage, whereas in the WW condition, it was performed throughout the whole growing season.
Results: The results of the genome-wide association study (GWAS) using 52,157 single-nucleotide polymorphisms (SNPs) revealed 1,281 SNPs associated with traits. Six stable SNPs showed sequence variation for flowering time between the two irrigation conditions across years. Three novel SNPs on chromosome C04 for plant weight were located within drought tolerance-related gene ABCG16, and their pleiotropically effects on seed weight per plant and seed yield were characterized. We identified the C02 peak as a novel signal for flowering time, harboring 52.77% of the associated SNPs. The 288-kbps LD decay distance analysis revealed 2,232 candidate genes (CGs) associated with traits. The CGs BIG1-D, CAND1, DRG3, PUP10, and PUP21 were involved in phytohormone signaling and pollen development with significant effects on seed number, seed weight, and grain yield in drought conditions. By integrating GWAS and RNA-seq, 215 promising CGs were associated with developmental process, reproductive processes, cell wall organization, and response to stress. GWAS and differentially expressed genes (DEGs) of leaf and seed in the yield contrasting accessions identified BIG1-D, CAND1, and DRG3 genes for yield variation.
Discussion: The results of our study provide insights into the genetic control of drought tolerance and the improvement of marker-assisted selection (MAS) for breeding high-yield and drought-tolerant varieties.
1 Introduction
Rapeseed (Brassica napus L.) is a member of the Brassicaceae family and is ranked second in global oilseed production (Meyer and Purugganan, 2013; FAO, 2018; Raboanatahiry et al., 2018). It is utilized almost entirely for oil production, food, feedstock, and biodiesel production. Rapeseed, originated from interspecific hybridization between turnip rape (B. rapa, AA, 2n = 20) and cabbage (B. oleracea, CC, 2n = 18), is the most widespread oilseed crop in various climates due to the ability to germinate and grow at low temperatures (Ren et al., 2000; Chalhoub et al., 2014; Koh et al., 2017; Wozniak et al., 2019).
Understanding the genetic bases of yield-related trait is of great significance for breeding high-yield rapeseed (Shi et al., 2011; Khan et al., 2018; Raboanatahiry et al., 2018; Zhu et al., 2021). Although both spring and winter growth habit forms have been identified in rapeseed, the winter form has shown a higher grain yield (Fordonski et al., 2016). The grain yield of rapeseed can be directly increased through selection for fecundity and by indirect selection for phenological traits which show complicated genetic control in plants (Nowosad et al., 2016; Marjanovic-Jeromela et al., 2019). Nevertheless, the polygenic nature of the genetic control of yield and its components and the influence of environmental variables complicates mining genetic loci contributing to stress tolerance in plants including rapeseed. Water-deficit stress in the period between the flowering stage and pod formation stages causes up to around 30% loss in grain yield (Elferjani and Soolanayakanahally, 2018).
Drought stress in arid and semiarid areas restricts plant growth and production in agriculture (Haq et al., 2014; Seleiman et al., 2021). At the early vegetative growth stage, drought slows down the rapeseed growth by inhibiting cell expansion and division (Yosefi and Heidari, 2022). However, drought at the reproductive development stage could drastically reduce rapeseed yield by producing small and medium-sized grains (Hatzig et al., 2018). Several studies have been conducted to evaluate the drought tolerance of rapeseed (Yarnia et al., 2011; Liu et al., 2015; Zhou et al., 2021). However, progress in improvement for drought tolerance is slow because of the complex genetic architecture of drought stress tolerance controlled by several minor and major genes (Bernardo, 2008). Understanding the genetic control of drought tolerance mechanisms can significantly accelerate the development of drought-tolerant varieties through marker-assisted selection (MAS) and genomic selection (GS).
Genome-wide association studies (GWASs) are currently the powerful tool to detect marker–trait associations (MTAs) and can be applied to mapping and identifying linked markers and candidate genes contributing to drought tolerance (Xiao et al., 2017). In rapeseed, GWAS has been used to identify loci and candidate genes for drought stress tolerance (Zhang et al., 2015; Khanzada et al., 2020; Shahzad et al., 2021; Salami et al., 2024). In a study consisting of 157 genotyped inbred rapeseed cultivars, GWAS was used to identify 320 SNPs linked with both seed weight (SW) and silique length (SL) traits and mapped to the gene BnaA.ARF18 (Dong et al., 2018). In another study, 197 candidate genes were detected for budding, bolting, day to flowering (DTF), and the interval between DTF and bolting in rapeseed of which FRIGIDIA (FRI), FLOWERING LOCUS C (FLC), and AGAMOUS-like 16 (AGL16) showed significant contribution to flowering time (Helal et al., 2021). Raman et al. (2019) conducted an association analysis in canola accessions using 11,804 SNPs under normal irrigation and water-stressed conditions and identified 47 SNPs on chromosome A02, and an additional 13 SNPs on chromosome C03 were associated with flowering close to FLOWERING LOCUS T (FT) and FLOWERING LOCUS C (FLC) genes for the drought avoidance mechanism (Raman et al., 2020). In the Hu et al. (2022) study, 628 SNPs were identified for 56 agronomically important traits through GWAS in a panel of diverse rapeseed accessions. A whole-genome resequencing and multilocus genome-wide association study (ML-GWAS) in rapeseed accessions revealed that 908 SNPs for agronomic and phenological traits of which 79 candidate genes were associated with BnaA09g39790D (RNA helicase), BnaA09g39950D (Lipase), and BnaC09g25980D (SWEET7) genes (Zhang et al., 2023a).
Transcriptomics and RNA-seq technology exploits transcript sequences to estimate patterns of gene expression, alternative splicing, and allele-specific expression (Marguerat and Bahler, 2010; Zhang et al., 2023b). Transcript analysis can complement QTLs identified. In one study, RNA-seq was performed on eight tissues of extremely high- and low-harvest index (HI) rapeseed accessions and demonstrated that 33 functional candidate genes were located within the confidence intervals of significant SNPs associated with HI-related traits (Lu et al., 2016). In another study, Zhang et al. (2023a) performed GWAS and transcriptome analysis for seed yield and yield-related traits in Brassica napus for identification of differentially expressed genes (DEGs) in the seed of contrasting seed size/seed weight accessions.
Expanding rapeseed production areas through cultivation of drought-tolerant varieties could be an efficient strategy to alleviate the adverse effects of drought. Genomic studies focused on drought tolerance can be translated into breeding objectives for varietal development. In the present study, we aimed to identify novel SNPs and key genes for drought tolerance related traits in rapeseed. First, we investigated the effects of drought stress on agronomic, grain yield-related, and yield-related traits. Then, a GWAS approach was used to determine novel SNPs/genes for traits in the well-watered and drought stress conditions in 3 years. The RNA-Sequencing (RNA-Seq) experiment was performed in the leaf and seed of the contrasting high- and low-yielding varieties to validate the genes associated with the position of the identified linked SNPs. Differentially expressed genes (DEGs) in the leaf and seed of the accessions in the yield contrasting varieties to explore the genetic basis of drought tolerance can be facilitated by integrated functional genomic approaches.
2 Materials and methods
2.1 Plant materials, field experiment, and drought treatments
The plant materials used in this study consisted of 119 rapeseed varieties including breeding lines, hybrids, and commercial cultivars provided by the Institute of Seed and Plant Improvement (SPII), Iran (Additional File 1). The field experiment was performed at the Research Farm of Plant Production and Genetics, Shiraz, Iran in a 3-year trial in 2017, 2018, and 2020 growing seasons. Plants growth was incomplete in a 2019 trial which was due to spring frost damage. The texture of the soil was silty loam, and concentrations of micro- and macronutrients are shown in Additional File 2. Seasonal temperature, relative humidity, and mean precipitation are shown in Supplementary Figure S1. The experimental design was a lattice by patterning 11 × 11-unit cells (11 varieties and 11 units per block) with three replicates per watering regime [well-watered (WW) and drought stress (DS)]. The plot size was 1 m2 with the between-plot distances of 0.5 m. Each plot was composed of four 1-m-long rows, each with 25 plants per 4-cm spaces. The seeds were sown on four rows 1 m in length on 17 September for the three seasons.
The fertilizers were applied at the rates of 250 kg N ha−1, 100 kg P ha−1, and 100 kg K ha−1. Phosphorus and potassium fertilizers were incorporated to the soil prior to sowing, and nitrogen was used as top dressed in different growth stages of rapeseed. In the well-watered condition, irrigation was carried out from planting till seed physiological maturity (maximum seed dry weight) as previously described by Ozer (2003). In the drought stress treatment, irrigation continued till the 50% pod development stage when irrigation then stopped till end of the growing season, which made three irrigation practices less in the drought-stressed plants than in the well-watered plants throughout the growing season. The numbers of irrigations in WW and DS treatments were 9 and 6, respectively.
For weed control, 3 L ha−1 Treflan® HFP herbicide was sprayed at sowing and hand weeding was also followed during the growing season. The Pirimor 50 pesticide at a rate of 2 L ha−1 was used for the aphids on rapeseed at the flowering and early podding periods. Harvesting time was the first week of July when the siliquae in terminal raceme turned creamy white in color.
2.2 Measurement of phenotypic characteristics
Days to flowering (DTF) was measured as the interval between the time of sowing and the time when the first flowers opened on 50% of the plants followed by Matar et al. (2021) description. Days to silique development (DTSD) was recorded as a number of days from the sowing to the time that first pods appeared on 50% of the plants. Days to ripening (DTR) was measured as the interval between the dates of sowing and the time when pods were dried. Plant height (PH) (cm) was recorded from the ground to the tip of the main pod at the ripening stage. For branch number/plant (BNPP) and yield components including silique length (SL; cm), seed number/silique (SNPS), seed weight/plant (SWPP; g), and thousand seed weight (THSW; g), 10 randomly plants were harvested from the middle rows to avoid border effects in each plot. At the harvesting time, plants in two middle rows were cut for plant weight (PW; g), seed yield (SY; kg ha−1), and harvest index (HI; %) measurements. The grain weight of 10 spikes was used as grain weight per spike. The HI was calculated by dividing the grain yield by the biological yield.
2.3 Analysis of variance and estimation of genetic variation and genetic gain
Descriptive parameters including mean and standard deviation (SD) were calculated for each treatment in SAS software (version 9.4). Box and whisker plots were used for the graphical presentation of the descriptive statistics. The packages ggplot2 in R (version 4.3.2) for win (http://CRAN.R-project.org/, accessed on 23 February 2021) and RStudio (version 1.3.1093) (https://rstudio.com/, accessed on 23 February 2021) were used for analysis of boxplots (McGill et al., 1978; Wickham, 2016). The correlation matrix between variables and a constructing heat map of correlation coefficients were computed using packages plotly, heatmaply, and ggcorrplot (https://cran.rproject.org/web/packages/ggcorrplot/index.html) in the R software.
The PROC GLM procedure was used for combined analysis of variances (ANOVA) in the Statistical Analysis System (SAS) software (SAS Institute Inc., Cary, NC, USA, version 9.3) (Dodig et al., 2008). The RANDOM statement with the TEST as option procedure was used to define the year as a random effect and water treatment and genotype as fix effects in ANOVA.
Phenotypic and genotypic variances were calculated as shown in Equation 1 using the expected mean squares (EMS) of sources of variations in ANOVA as follows (Lush, 1949),
where is the genotypic variance, MSG is the mean square for genotype, MSE is the error mean square in ANOVA, and r is the number of replications.
where and are the phenotypic and environmental variances, respectively (Equation 2).
The environmental, genotypic, and phenotypic coefficients of variation were calculated as shown in Equations 3, 4, and 5 using as follows (Burton, 1952):
where ECV is the environmental coefficient of variation, GCV is the genotypic coefficient of variation, PCV is the phenotypic coefficient of variation, is the root of genotypic variance, is the root of phenotypic variance, and x̅ is the trait mean.
Variance components were used to calculate the broad-sense heritability () in Equation 6 as follows (Marwede et al., 2004):
Simple genetic advance (GA) and GA over means (GAM) were calculated as shown in Equations 7 and 8 as follows::
where k is the selection intensity which was 1.76 denoting selection of 10% of top-ranked varieties, is heritability in a broad sense, and x̅ is the trait mean.
2.4 Reference mapping and variant calling
Pseudo-genome sequences of the diploid A (283.8 Mb) and C genomes (488.6 Mb) were combined and used as the reference sequences for mapping analyses. Reads for each genotype were aligned independently to the reference genome using CLC Genomics Workbench (version 7.0.4). The mapped reads were interrogated for sequence variation using the CLC Bio probabilistic variant calling tool. A minimum depth of coverage of 3× for 454 and 8× for Illumina data was required for SNP calling. Mapping data and variant calls were exported from CLC and combined using a custom Perl script to determine reference, or variant call for every genotype at all variant positions.
2.5 DNA extraction and single SNP-based association mapping
Genomic DNA was isolated from the fresh leaves collected from a bulk of five randomly chosen plants per variety in a greenhouse (Murray and Thompson, 1980). The genomic DNA was quantified using a NanoDrop ND-1000 Spectrophotometer (NanoDrop Technologies, Inc., Wilmington, DE, United States). The DNA samples were used for genotyping Brassica 60 K Infinium array as described in the manufacturer’s protocol (Illumina Inc., San Diego, CA). Quality preprocessing of 52,157 SNPs obtained from 60K chips was done by using TASSEL software v5 (Bradbury et al., 2007). The SNPs were filtered for site coverage (90%), minimum minor allele frequency (MAF) of 0.05 with only biallelic markers, and low rates of missing data (≤10%) using the TASSEL (version 5).
2.6 Population genetics analysis, linkage disequilibrium, and LD decay
The polymorphism information content (PIC) value of each SNP locus in all varieties and the PIC values on each chromosome were calculated by PowerMarker (version 3.2.5) (Liu and Muse, 2005). We generated 29,310 SNPs involving 119 varieties derived from Iran, Germany, France, America, Australia, Hungary, Serbia, and Russia (Additional File 1). For population structure analysis, the natural logarithms of probability data (LnP(K)) and the ad hoc statistic ΔK were calculated (Su et al., 2017). The population structure underlying the collection of rapeseed varieties was analyzed using STRUCTURE (version 2.3.4) (Hubisz et al., 2009). The model-based Bayesian cluster analysis program was used to identify subpopulations. A total 10,000 burn-in periods followed by 100,000 Markov Chain Monte Carlo (MCMC) iterations from K = 3 to K = 10 were used to identify the optimal number of clusters (K). Three independent runs were generated for each K. The results were collated by the Structure Harvester tool (Earl and VonHoldt, 2011), and the best K-value was identified based on the delta K method (Evanno et al., 2005). A neighbor-joining (NJ) tree was created to validate population stratification with the software TASSEL (version 5). A PCA was done on the significant SNPs data using R software (version 4.3.2) (R Core Team, 2018) with the ggplot2 (Wickham, 2016) and ape (Paradis and Schliep, 2018) packages, respectively. To investigate chromosome-wide and the genome-specific patterns of linkage disequilibrium (LD) (r2), the software TASSEL (version 5) (www.maizegenetics.net/) with 1000 permutations was used. After quality control processing, a total of 29,310 high-quality SNPs with MAF ≥0.05 and pairwise r2 values were used to determine the extent of LD decay across genome and among chromosomes.
2.7 Genome-wide association analysis
The marker–trait associations (MTAs) were analyzed using the program TASSEL (version 5). Four models, namely, general linear model (GLM) with the Q matrix of population structure (GLM + Q), mixed linear model (MLM) with both the kinship (K) as a random effect and Q matrices (MLM + Q), GLM model with the major principal components (PC) matrix (GLM + PC) and MLM with both the PC and K matrices (MLM + K + PC), were used to identify the MTAs. In GWAS, five PCs based on their cumulative eigenvalue contribution were used in population structure analysis. The Q matrix obtained from structure analysis and the relative kinship and PC matrices were calculated by TASSEL software. The phenotypic variation explained by significant SNP marker (R2) was calculated in TASSEL (version 5) (Bradbury et al., 2007). Quantile–quantile (QQ) plots were shown with −log10(P) of each SNP and expected P-value using the R package qqman (https://cran.rproject.org/web/packages/qqman/index.html). Manhattan plots were drawn in TASSEL software.
2.8 Screening candidate genes overlapped with the SNP position
To identify candidate genes (CGs) related to the SNPs of traits under the well-watered and drought-stressed conditions, the flanking sequences of the linked SNPs obtained from the “Darmor-bzh” reference genome (http://www.genoscope.cns.fr/brassicanapus/data/) was used to search in the rapeseed genome by Ensembl Plants (https://plants.ensembl.org/). Consequently, all the genes underlying the genomic region of each SNPs were functionally annotated by Ensembl Plants (https://plants.ensembl.org/) and online resources (https://genome.ucsc.edu/ and https://www.ncbi.nlm.nih.gov/). The CGs were identified based on their putative function in rapeseed or closely related species.
2.9 Allele effect and haplotype analyses
The allele effects for the linked significant SNPs were analyzed as previously described by Alemu et al. (2021). Varieties were divided into two different groups according to their specific SNP alleles, and the means were compared using Turkey’s honest significant difference (HSD) test. Exploring and harnessing haplotype diversity helps in the detection of CGs for improvement of target traits in crops (Qian et al., 2017). A haplotype association test was performed to investigate the combined effect of the linked significant SNPs. The SNPs in the same haploblock and the LD of significant SNPs were determined using Haploview (version 4.2) (Barrett et al., 2005). A standardized disequilibrium coefficient (D′) was used to evaluate the LD between markers and generate the LD heatmap. Haploid blocks were detected based on LD using the confidence intervals (CI) method in Haploview (version 4.2) (Gabriel et al., 2002).
2.10 RNA extraction, library construction, and RNA-sequencing
To validate the GWAS-identified SNPs contributed to drought tolerance, the expression of candidate genes associated with the position of the related SNPs was analyzed in two drought-tolerant and two drought-sensitive varieties. The experiment consisted of the RNA-Seq analysis in two top high- (G19 and G41) and two top low- (G111 and G114) yielding varieties showing contrasting yield under the WW and DS conditions. The plants were grown in 20-cm-diameter pots in the greenhouse under 12-h light/12-h dark conditions with normal experimental management. There were six plants in each pot. When the flower buds became visible, plants were randomly divided into two groups, each with three plants: the control group and the drought stress treatment group and each experiment underwent three biological replicates. During irrigation, drought-treated flower pots maintain a soil moisture content of 10% (irrigated with PEG6000 at a concentration of 20%), whereas well-watered flower pots maintain a soil moisture content of 30% (irrigated with sterile water of equal volume). Thirty days after flowering, the leaf and mature seeds were harvested from plants in each replicate group and each condition (the well-watered and drought stress treatments). All harvested seeds and leaves were immediately frozen using liquid nitrogen and transferred to a deep freezer (−80°C) for storage.
A total of 24 samples (control and treatments with three biological replicates, respectively) were prepared for RNA-Seq. Total RNA was extracted from the seeds and leaves using a Plant RNA Mini Kit (Tiangen, Inc., China) according to the manufacturer’s instruction. Four cDNA libraries were constructed, and RNA-Seq was performed on a DNBSEQ-G400 platform.
Low-quality reads were filtered out using the NGS QC toolkit (version 2.2.3) (https://omictools.com/ngs-qc-toolkit-tool) (Patel and Jain, 2012). High-quality reads from the raw sequencing reads were matched to the B. napus reference genome of “Darmor-bzh” (http://www.genoscope.cns.fr/brassicanapus/). The identified genes in the previous step were quantitatively analyzed using Cluffquant and Cluffnorm of Cufflinks 2.0.0 (http://cole-trapnell-lab.github.io/cufflinks/releases/v2.0.0/).
2.11 Identification of differentially expressed genes
The DEGs were identified based on FPKM (fragments per kilo base of transcript per million mapped fragment) and Q value (<0.05) (Q value: error-corrected value after multiple testing), and a log2 (fold change) ≥1 was set as the threshold to identify the significance of gene expression differences. Furthermore, to verify the statistical significance and hierarchical clustering of DEGs, a heat map was generated using R software (version 4.3.2).
2.12 Enrichment analyses of Gene Ontology and Kyoto Encyclopedia of Genes and Genomes pathways
To further understand the function of DEGs, we performed Kyoto Encyclopedia of Genes and Genomes (KEGG) and Gene Ontology (GO) analyses on the identified DEGs. The sequence file of each gene was used as input into Eggnog software (version 2.0.1) to identify annotation of genes (Huerta-Cepas et al., 2017). GO and KEGG analyses were conducted using the ClusterProfiler (version 4.0.0) R package. Only GO terms or KEGG pathways with P-value <0.05 verified for subsequent analyses. The REVIGO program (http://revigo.irb.hr/) was used to remove redundant GO terms (Supek et al., 2011).
2.13 Integration of genome-wide association study and transcriptome data
The RNA‐seq data were used for the ratios of genome‐wide up‐ and downregulated DEGs. In addition, we calculated the ratios of up‐ and downregulated DEGs within the 288-kbp intervals corresponding to the significant SNPs of the GWAS analysis. Then, we compared the DEG ratios for all genome‐wide genes and for potential drought tolerance-related genes detected in the GWAS of the high- and low-yield contrasting varieties under drought stress.
3 Results
3.1 Phenotypic variation and heritability of traits
The results of ANOVA for the main effects of treatments and the interactions are shown in Additional File 3. The effects of year (Y), environment (E), and genotype (G) were statistically significant (P-value < 0.01), which shows variation among varieties for traits over years and irrigation treatments. The G × Y, G × E, Y × E, and Y × G × E interactions were significant for all traits. Phenotypic variation for traits under normal irrigation and drought stress conditions is shown in Table 1; Figures 1A–M. The results showed that PW, SWPP, HI, and SY had high variation among the 119 rapeseed varieties in two irrigation regimes.
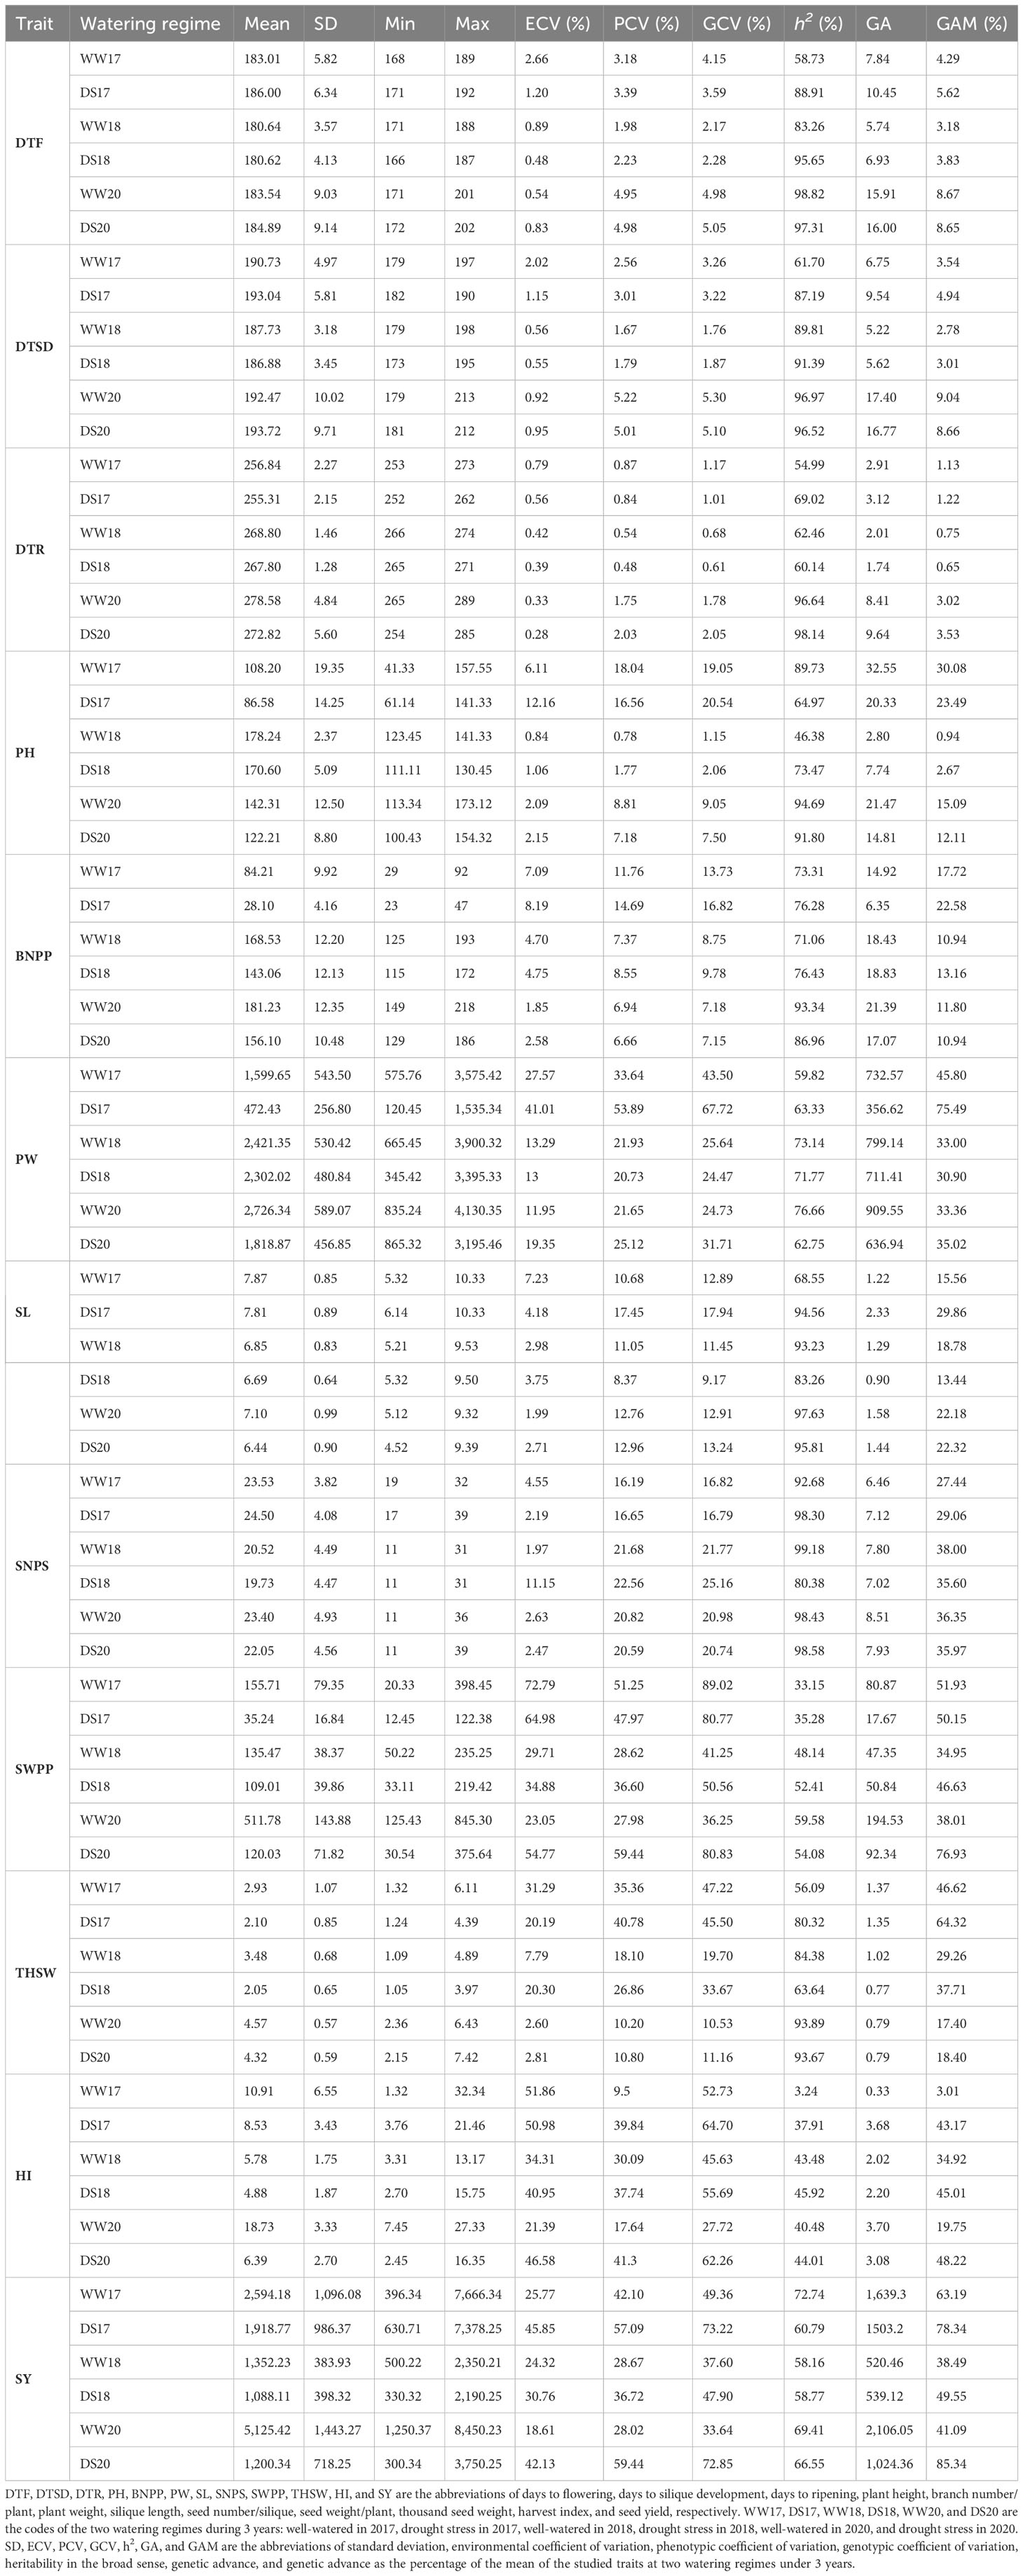
Table 1 Phenotypic variation of agronomic and yield related traits in 119 rapeseed (Brassica napus L.) varieties.
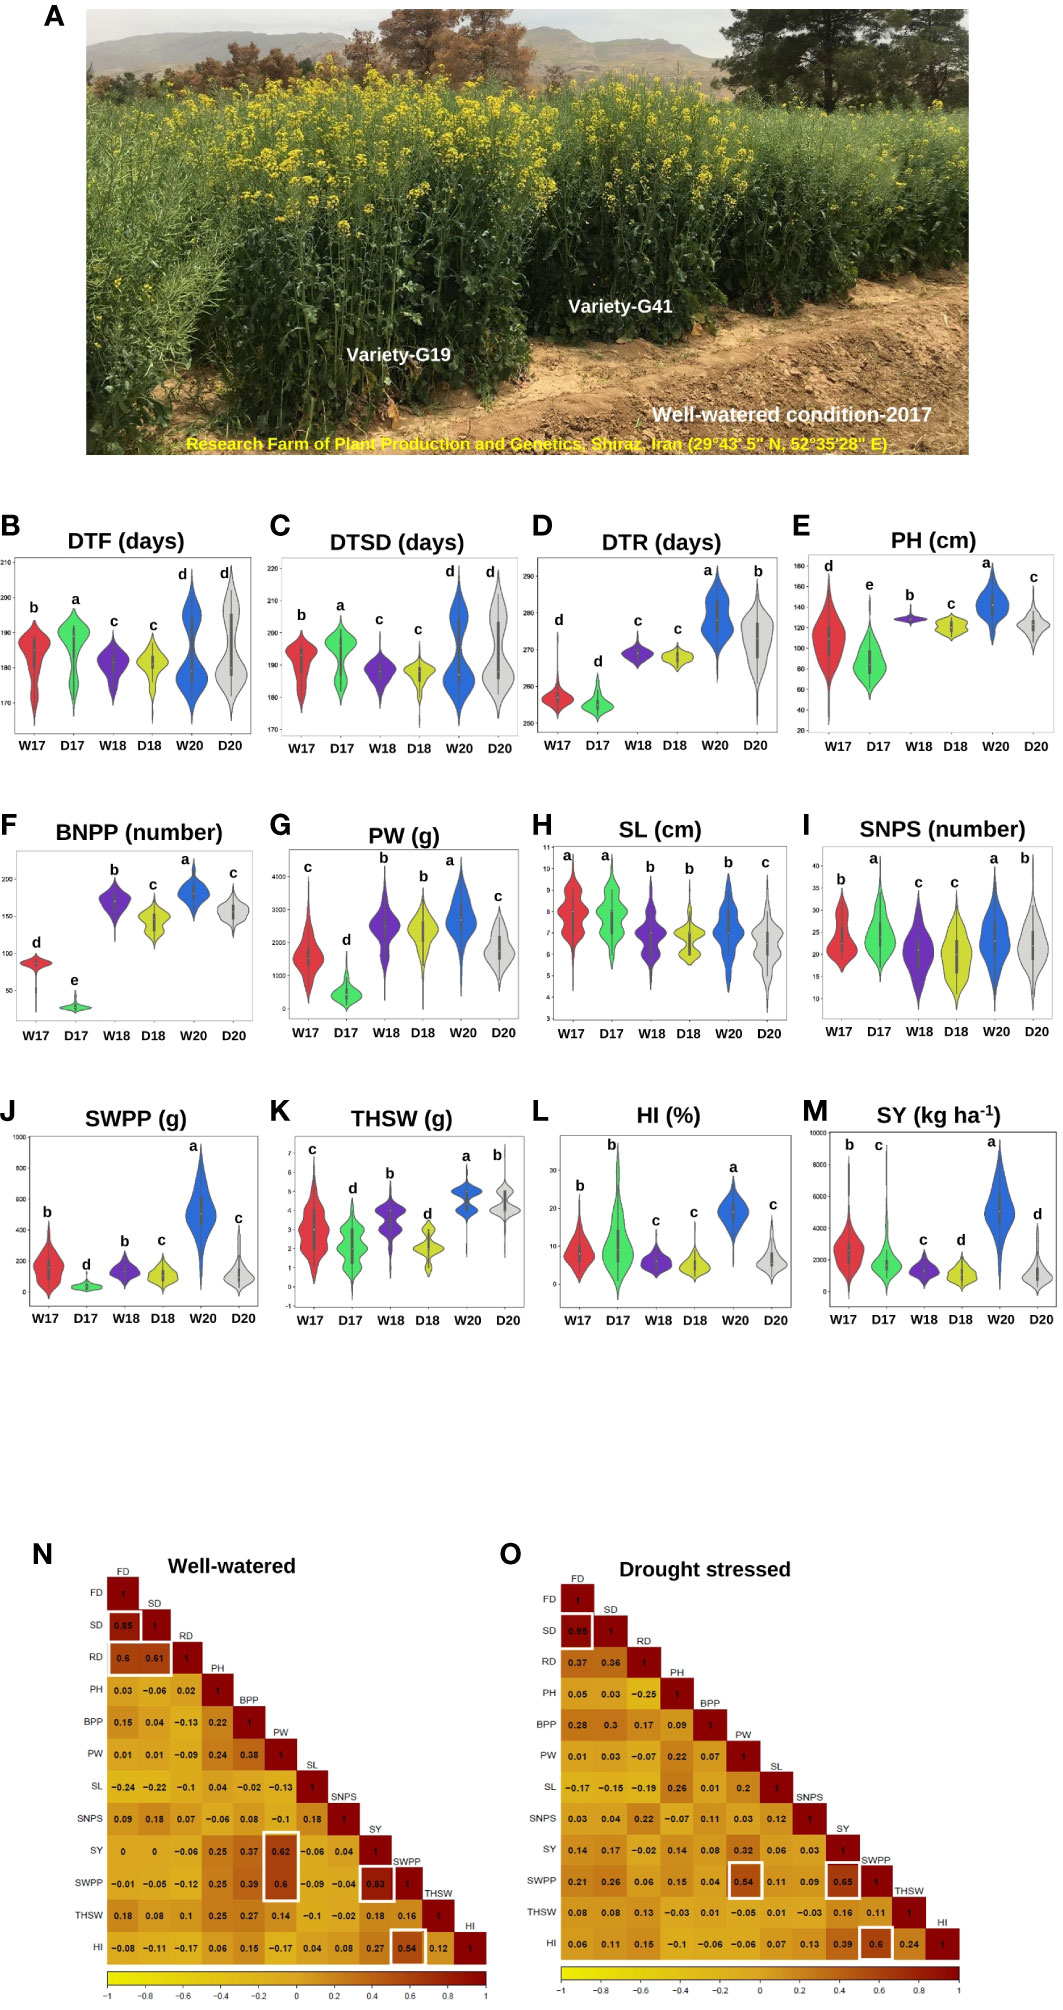
Figure 1 Agronomic and yield-related traits phenotyping in rapeseed (Brassica napus L.) varieties under two watering regimes (well-watered and drought stress conditions) across three years, 2017, 2018, and 2020. (A) A diverse collection of rapeseed varieties was assessed for agronomic and yield-related traits under well-watered conditions in 2017 in Research Farm of Plant Production and Genetics, Shiraz, Iran (29°43′ 5″ N, 52° 35′28″ E), highlighting the range of phenotypic diversity within the panel. G19 and G41 were high-yield varieties. (B-M) The violin plots illustrating the changes in agronomic and yield-related traits under well-watered and drought stress conditions from the individual data sets of 3 years (2017, 2018, and 2020) of 119 rapeseed varieties. The width of the violin plot represents the density of the distribution. The white dot in the box plot shows the median value, and the upper and lower boxes in the box represent the upper and lower quartiles of the data set. Data are means ± SD, P-value < 0.05, as determined by multiple comparison testing by one-way ANOVA. Traits represent as (B) days to flowering (DTF), (C) days to silique development (DTSD), (D) days to ripening (DTR), (E) plant height (PH), and (F) branch number/plant (BNPP), (G) plant weight (PW), (H) silique length (SL), (I) seed number/silique (SNPS), (J) seed weight/plant (SWPP), (K) thousand seed weight (THSW), (L) harvest index (HI), and (M) seed yield (SY). WW17, DS17, WW18, DS18, WW20, and DS20 were the codes of the two watering regimes during 3 years: well-watered in 2017, drought stress in 2017, well-watered in 2018, drought stress in 2018, well-watered in 2020, and drought stress in 2020, respectively. (N, O) Heat map showing the correlation between the agronomic and yield-related traits under two watering regimes in three growing seasons (2017, 2018, and 2020). (N) Well-watered condition, (O) drought stress condition. Traits represent as flowering date (FD), silique date (SD), ripening date (RD), plant height (PH), branches per plant (BPP), plant weight (PW), silique length (SL), seed number/silique (SNPS), seed yield (SY), seed weight/plant (SWPP), thousand seed weight (THSW), and harvest index (HI). A color scale showing the correlation values ranging from dark yellow, −1, to orange, 0, to 1, dark red is shown below the heat map.
The SWPP, SY, HI, and PW traits showed significant differences between normal irrigation and drought stress conditions. Compared with normal irrigation, drought stress significantly reduced SWPP, SY, HI, PW, BNPP, THSW, PH, SL, SNPS, and DTR by 67.08%, 53.62%, 44.09%, 44.09%, 31.92%, 24.58%, 22.85%, 11.51%, 4.03%, 1.73%, and 1.03%, respectively (Table 1; Supplementary Figure S2).
Analysis of genetic variation showed that the traits were divided into three groups with PCV and GCV above 20% as high, 10%–20% as moderate, and below 10% as low (Table 1). In normal irrigation conditions, SWPP, SY, and PW had high PCV and GCV in 3 years (Table 1). Moderate PCV and GCV were recorded for SL and SNPS in 3 years. The DTF, DTSD, and DTR traits in 3 years and PH and BNPP in two years showed low PCV and GCVs (Table 1). Under drought conditions, the PCV estimates of various characters varied from 0.48% for DTR to 51.08% for SY and SWPP (Table 1). The GCV estimates varied from 0.61% for DTR to 80.77% for SWPP. Both GCV and PCV were high (>20%) for PW, SY, SWPP, and HI in 3 years and for SNPS in 2018 and 2020, THSW in 2017 and 2018. DTF, DTSD, and DTR had lower variation (<6%) in drought stress condition in 3 years.
Heritability estimates for most of the traits were higher under drought compared with well-watered conditions. The heritability estimates for traits in the WW condition ranged from 3.24% for HI to 99.18% for SNPS and from 35.28% for SWPP to 99.18% for SNPS in drought stress. The estimates of heritability were moderate for PW and SY in 3 years (Table 1). Genetic advances (GA) ranged from 0.33 for HI to 2106.05 for SY in normal irrigation conditions, and it ranged from 0.77 for THSW to 1503.2 for SY in drought stress. High heritability values coupled with high GA were recorded for PW, SWPP, and SY under well-watered conditions in three growing seasons. Genetic advance normalized based on the trait mean (GAM) under well-watered conditions ranged from 63.19% for SY to 0.75% for DTR and from 0.65% for DTR to 85.34% for SY in drought stress. Among the tested traits, SNPS showed high heritability (>80%) coupled with the high GAM (>20%) under both irrigation conditions across 3 years.
3.2 Interrelationship of agronomic and yield-related traits
Analysis of correlation of traits helps in indirect selection for yield improvement. Under WW conditions, significant and relatively high correlations were identified for DTF with DTSD and DTR (0.85**, 0.60**) and DTR with DTSD (0.61**) (Figure 1N). Correlations of SY with PW (0.62**) and SWPP (0.83**) were significant. Under drought conditions, a positive and significant correlation coefficient was found for SWPP with each SY, HI, and PW traits (0.65**, 0.60**, and 0.54**) whereas DTSD had a strong positive correlation (0.95**) with DTF (Figure 1O).
3.3 Morphological variations between high- and low-yield varieties
Owing to the lower complexity of yield components and lower influence of environmental effects compared with yield, use of yield-related traits with high heritability as indirect selection for improvement of grain yield is preferred. We assessed the difference of agronomic traits and yield components in the high- and low-grain yield varieties. The results indicated that BNPP, SWPP, and PW were significantly larger in the high-yield varieties than in the low-yield varieties (P-value < 0.01**). However, PH, THSW, and HI were relatively similar between the two contrasting groups (Figures 2A–L).
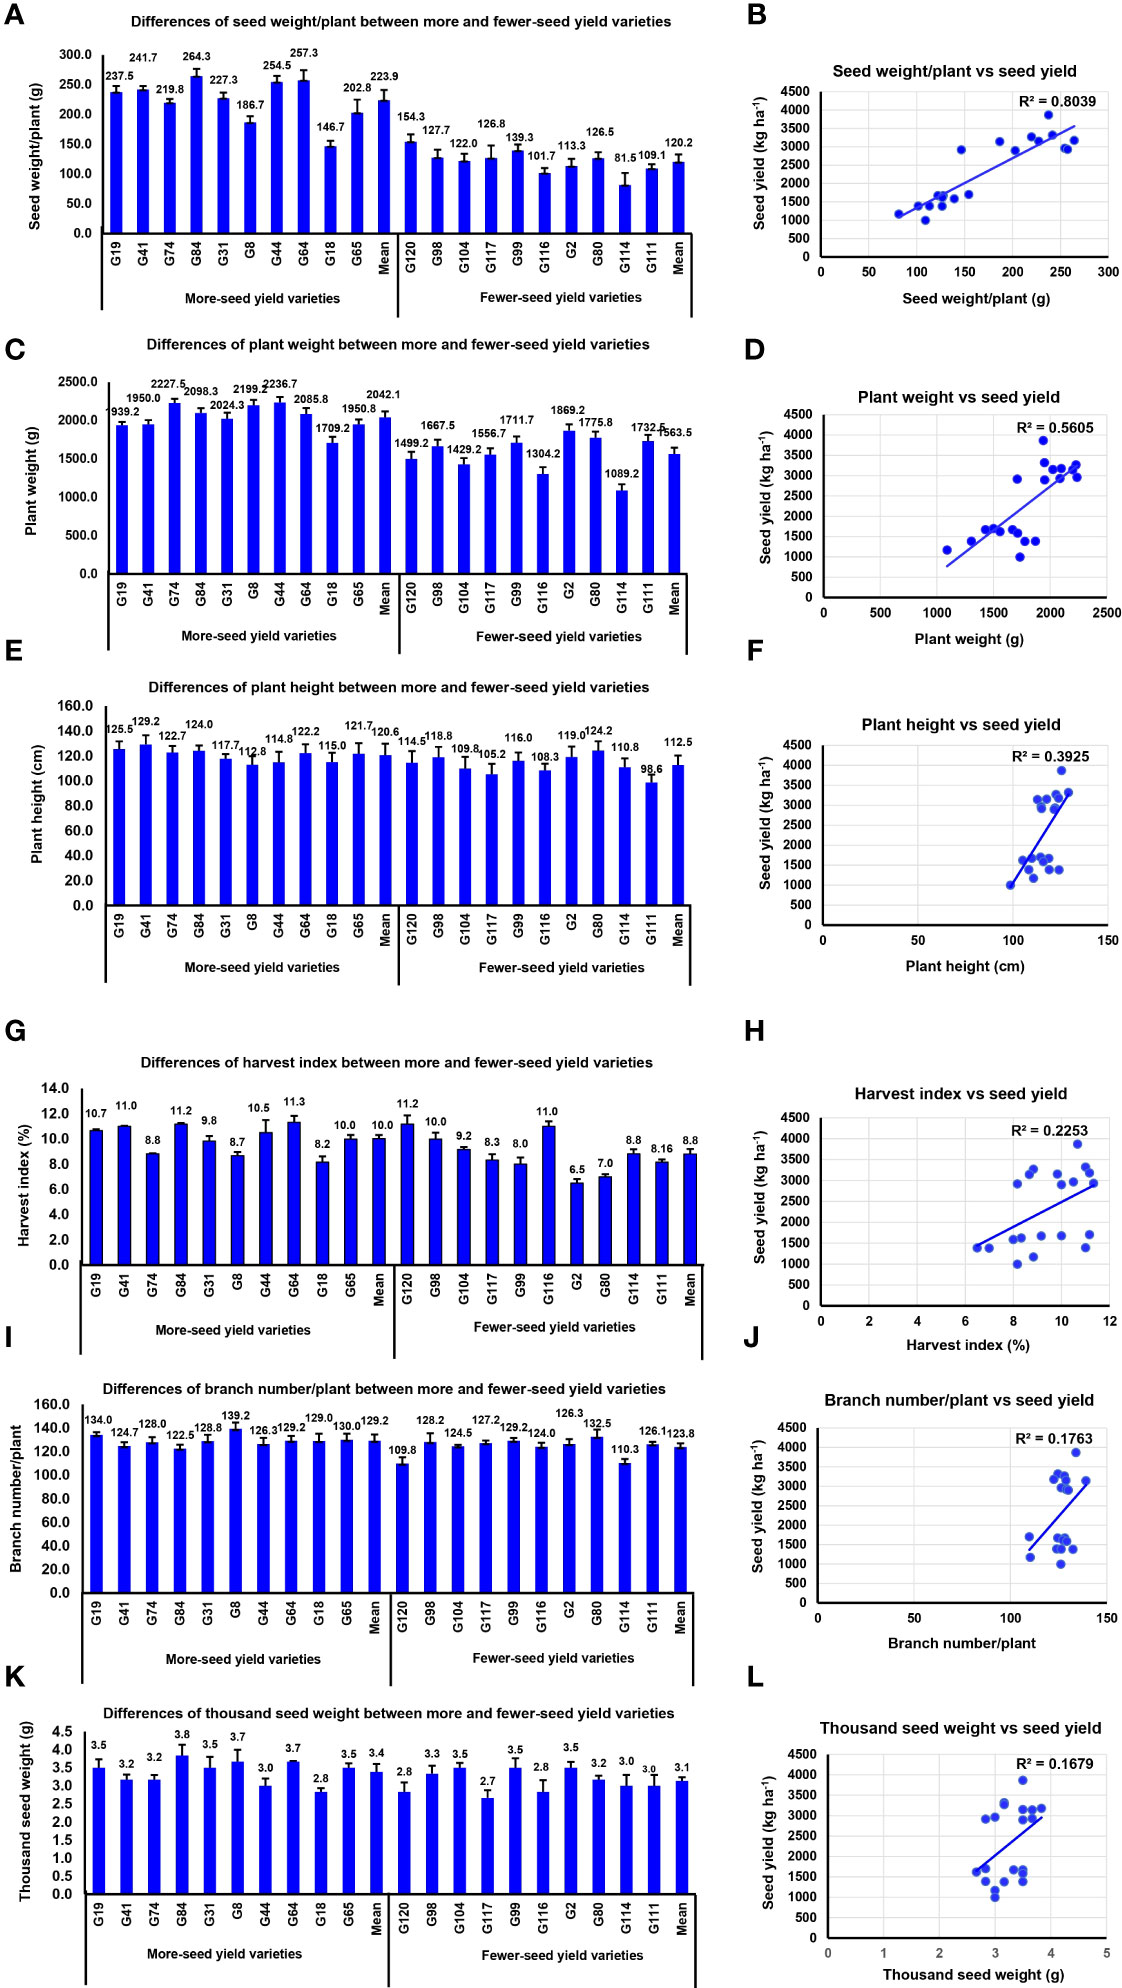
Figure 2 The seed yield variation was caused by agronomic and yield components. (A) Differences of seed weight/plant between high- and low-yield varieties. (B) Correlation analysis between seed yield and seed weight/plant. (C) Differences of plant weight between high- and low-yield varieties. (D) Correlation analysis between seed yield and plant weight. (E) Differences of plant height between high- and low-yield varieties. (F) Correlation analysis between seed yield and plant height. (G) Differences of harvest index between high- and low-yield varieties. (H) Correlation analysis between seed yield and harvest index. (I) Differences of branch number/plant between high- and low-yield varieties. (J) Correlation analysis between seed yield and branch number/plant. (K) Differences of thousand seed weight between high- and low-yield varieties. (L) Correlation analysis between seed yield and thousand seed weight.
3.4 Distribution of SNPs, LD, LD decay, and population structure
After filtering low-quality SNPs (call rate <90% and minor allele frequency <0.05) in TASSEL software, a set of 29,310 high-quality SNPs was used for genetic variation and GWAS analyses. The SNP markers were not evenly distributed across the whole genome with the A subgenome having a higher number of SNP markers (14,925; 50.92%) compared to the C subgenomes (Supplementary Figures S3A, D). However, the density of SNPs in the C subgenome (42.96 SNPs/kbps) was higher than that in the A subgenome (19.76 SNPs/kbps) (Additional File 4). Among all chromosomes, C04 (2,624 SNPs) and C05 (723 SNPs) had the highest and lowest numbers of markers (Supplementary Figure S3A). The PIC values for chromosome ranged from 0.24 to 0.38 (Additional File 4). The mean PIC values of the A and C subgenomes were 0.32 and 0.32, respectively.
Linkage disequilibrium was examined as the squared Pearson correlation coefficient (r2) between all pairs of SNP markers. The LD in the C subgenome was significantly higher LD (0.031) than in the A subgenome (0.025). The C05 chromosome showed the highest LD (0.088) among chromosomes (Additional File 4). The LD decay with an average of 288 kbps in the whole genome ranged from 101.61 in A10 to 953.78 kbps in A08. However, the LD decay distance for C03 was 942.6 kbps, which was large compared with those for other chromosomes in the C subgenome (Additional File 4).
In analysis of population structure, the peak of the broken line was observed at k = 7 suggesting that the tested population can be divided into seven distinct groups and one mixed group partly correlated with their origins (Supplementary Figure S3B). Neighbor-joining (NJ) cluster analysis was performed to explore the relatedness among the rapeseed varieties. The NJ tree showed that our varieties could be divided into four groups (Supplementary Figure S3C). The first group (group A) was composed of 30 breeding lines originated from Iran and Australia, group B was composed of 10 varieties from Iran and Germany, 55 breeding lines in group C originated from Iran, and Group D had 24 varieties composed of hybrids and cultivars originated in France and America. The PCA based on the genome-wide SNPs supported the results of population structure and phylogenetic tree (Supplementary Figure S3E).
3.5 Significant SNPs and candidate genes associated with traits
We measured 12 traits including plant architecture, phenological and agronomic traits, and yield components in 119 rapeseed varieties grown under two irrigation conditions over 3 years. Using 29,310 high-quality SNPs, our GWAS for these 12 traits revealed 1,281 unique SNPs linked with the traits at the P-value < 10−4 threshold (Supplementary Figures S3F, S4-S6; Additional Files 5-8). Higher numbers of significant SNPs associated with traits were identified in the GLM + Q and MLM + K + PC models. However, the result of the MLM model was preferred, which showed fewer false positives than the GLM model. False positives are often controlled by incorporating covariates for the kinship and PCs matrices in the MLM model (Liu et al., 2016). Accordingly, the results of the MLM + K + PC model were used for further analysis. The number of significant SNPs linked with traits was variable. Higher SNPs were found for the DTF, BNPP, and SY traits than others. Based on statistical significance and the repeatability of the linked SNPs in two irrigation treatments across years, several important SNPs are shown in Tables 2, 3. Generally, the effective candidate regions with significant GWAS signals were defined as the LD blocks surrounding the signal peak (Yano et al., 2016). Based on the 288-kbps LD decay distance and CG analysis, we identified 2,232 genes as GWAS-associated CGs (Additional Files 9, 10). The SNPS (557) trait followed by DTF (524) showed the highest number of CGs. The key genes related to four agronomically important traits were selected for further functional verifications.
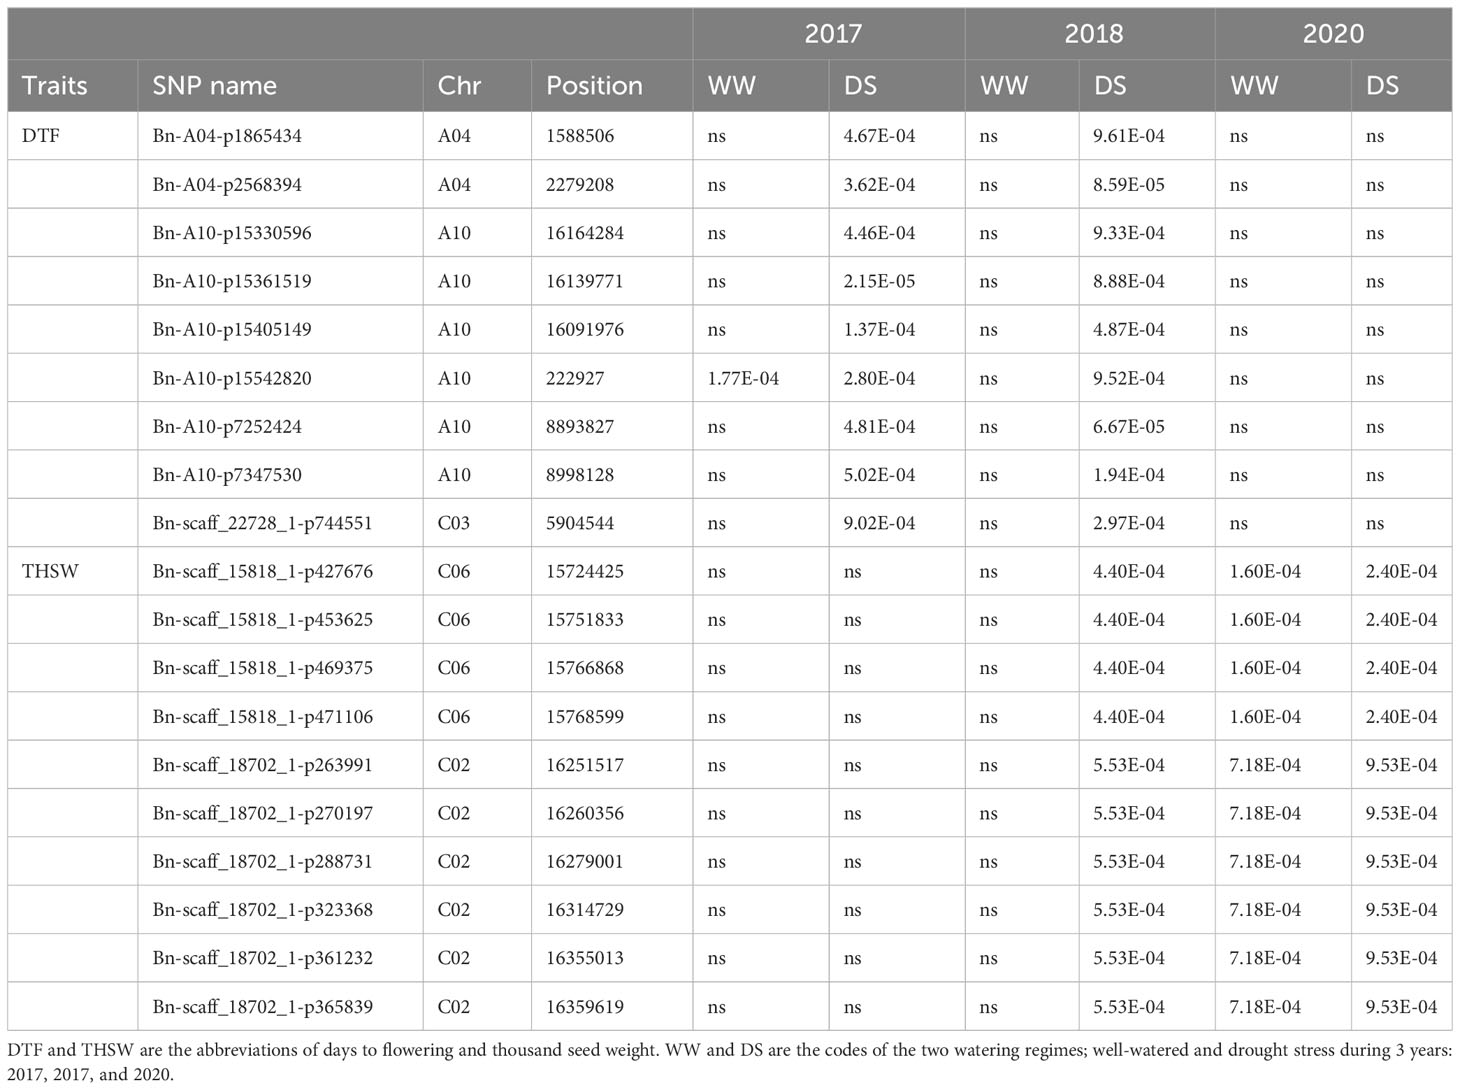
Table 2 Repetitive significant SNP in the current study.
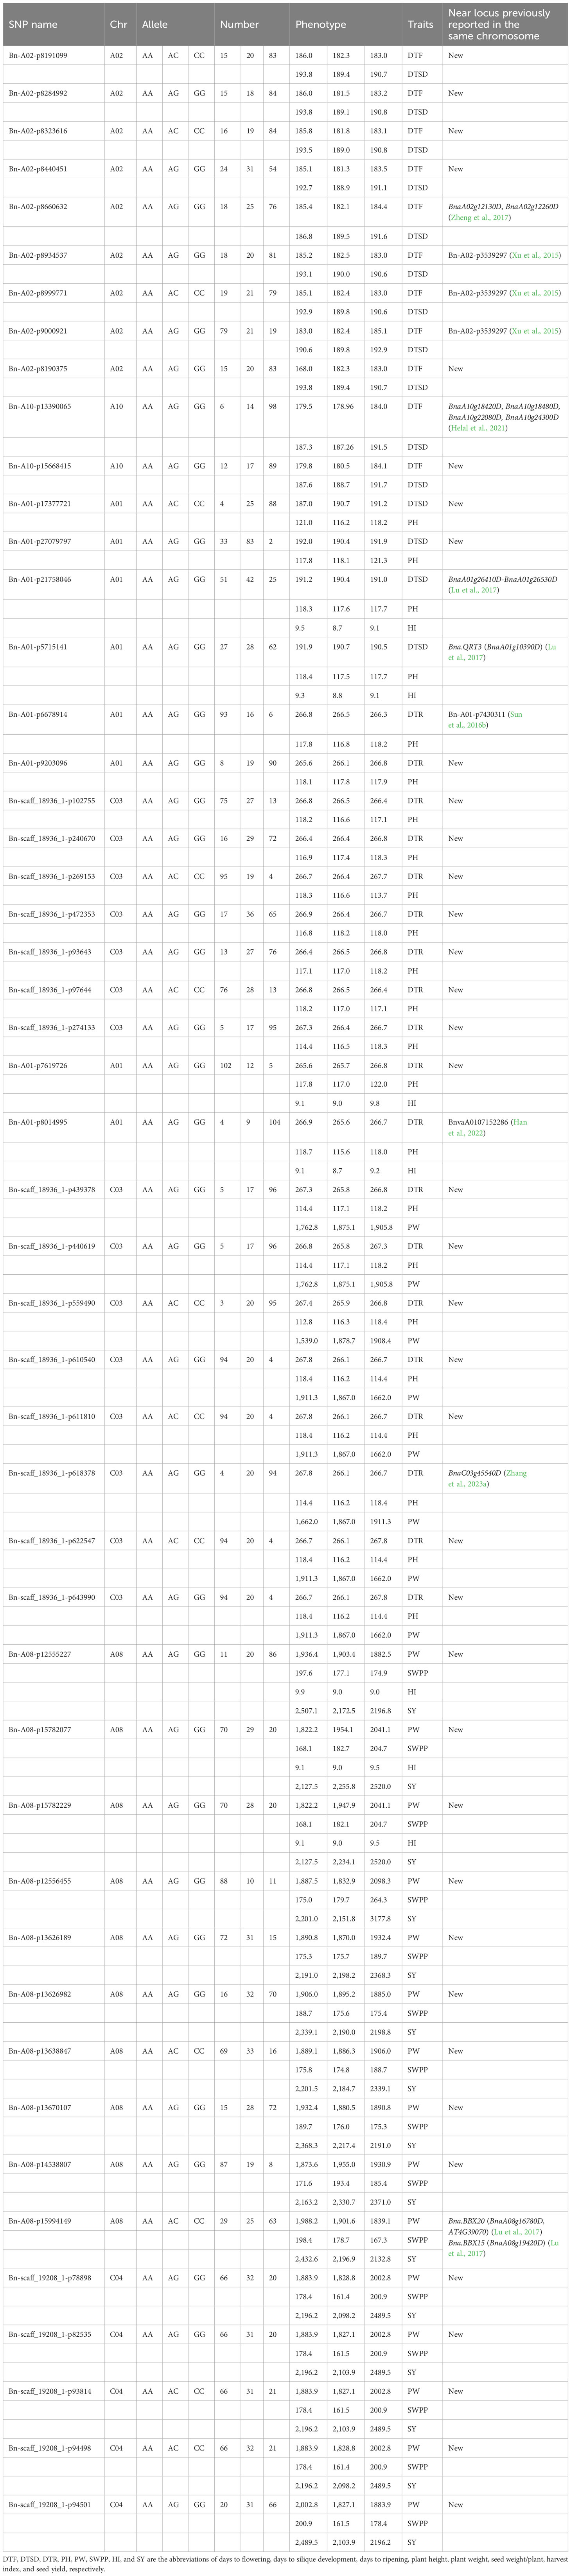
Table 3 Details of 49 pleiotropic SNPs of agronomic and yield-related traits detected from genome-wide association study (GWAS).
3.5.1 SNPs and candidate genes linked with phenological and agronomic traits under drought conditions
3.5.1.1 Days to flowering
A total of 324 significant SNPs were significantly associated with the DTF (Additional Files 5-8). The SNP Chr10:222927 linked with flowering time in both WW and DS conditions across 2 years (Table 2). Six linked SNPs, (Chr10:222927, Chr10:8893827, Chr10:8998128, Chr10:16091976, Chr10:16091976, Chr10:16139771) were significant across 2 years under drought conditions (Table 2). We found that the C02 peak was a major associated signal, harboring 52.77% of the associated SNPs (171) (Additional File 5; Figures 3A–D), which had not been reported previously. Accordingly, we focused on the 159 SNPs positioned in the Chr12:23345227–32168120 genomic region and extracted all CGs within 200 kbps of the most significant SNPs. A number of 146 genes, including transcription factors, enzymes, and transporters that represent plausible candidates for the causal gene of the flowering time, were identified (Additional File 10). Information of seven enriched gene ontology groups for DTF candidate genes is shown in Figure 3E. The SNP Bn-scaff_18507_1-p354053 (A/G) located 12.7 kbps downstream of LIPOXYGENASE 4 (LOX4) plays important roles in flower development and male fertility regulation (Klepikova et al., 2016). The Chr12:24697490 (A/G) and Chr12:24697925 (A/G) SNPs in a LD block were located within the position of candidate flowering gene GDSL ESTERASE/LIPASE (Figures 3F, G). Our results showed that the varieties with the alleles GG in SNP Chr12:24697490 showed significantly late flowering compared with those with the alleles AG (Figure 3H). The 1-kbps LD block surrounding Chr12:24986073 (A/C) contains the candidate flowering gene FAR1-RELATED SEQUENCE (FRS). The 3.2-kbps LD block surrounding Chr12:28382413 (A/G) contains the candidate flowering gene 9-CIS-EPOXTCAROTENOID DIOXYGENASE (NCED9), which is a critical gene in the regulation of abscisic acid (ABA) synthesis. The 60.8-kbps LD block surrounding the Chr12:29519291 (A/G) SNP contains CINNAMOYL-COA REDUCTASE 2 (CCR2), which plays an important role in pollen development by regulating the programmed cell death (PCD) of tapetum cells (Zhang et al., 2023c). Chr12:30219143 (A/G), which explained 11.62% of the phenotypic variance located 3.6 kbps downstream of pollen-specific gene RALFL14. Another pollen-specific gene, DEFENSIN-LIKE 7 (DEFL7), is located 36.71 kbps downstream of Chr12:30219143 (P = 6.58 × 10⁻⁴). DEFL genes are involved in pollen tube guidance and pollen tube reception and are responsible for the failure of double fertilization events (Takeuchi and Higashiyama, 2012).
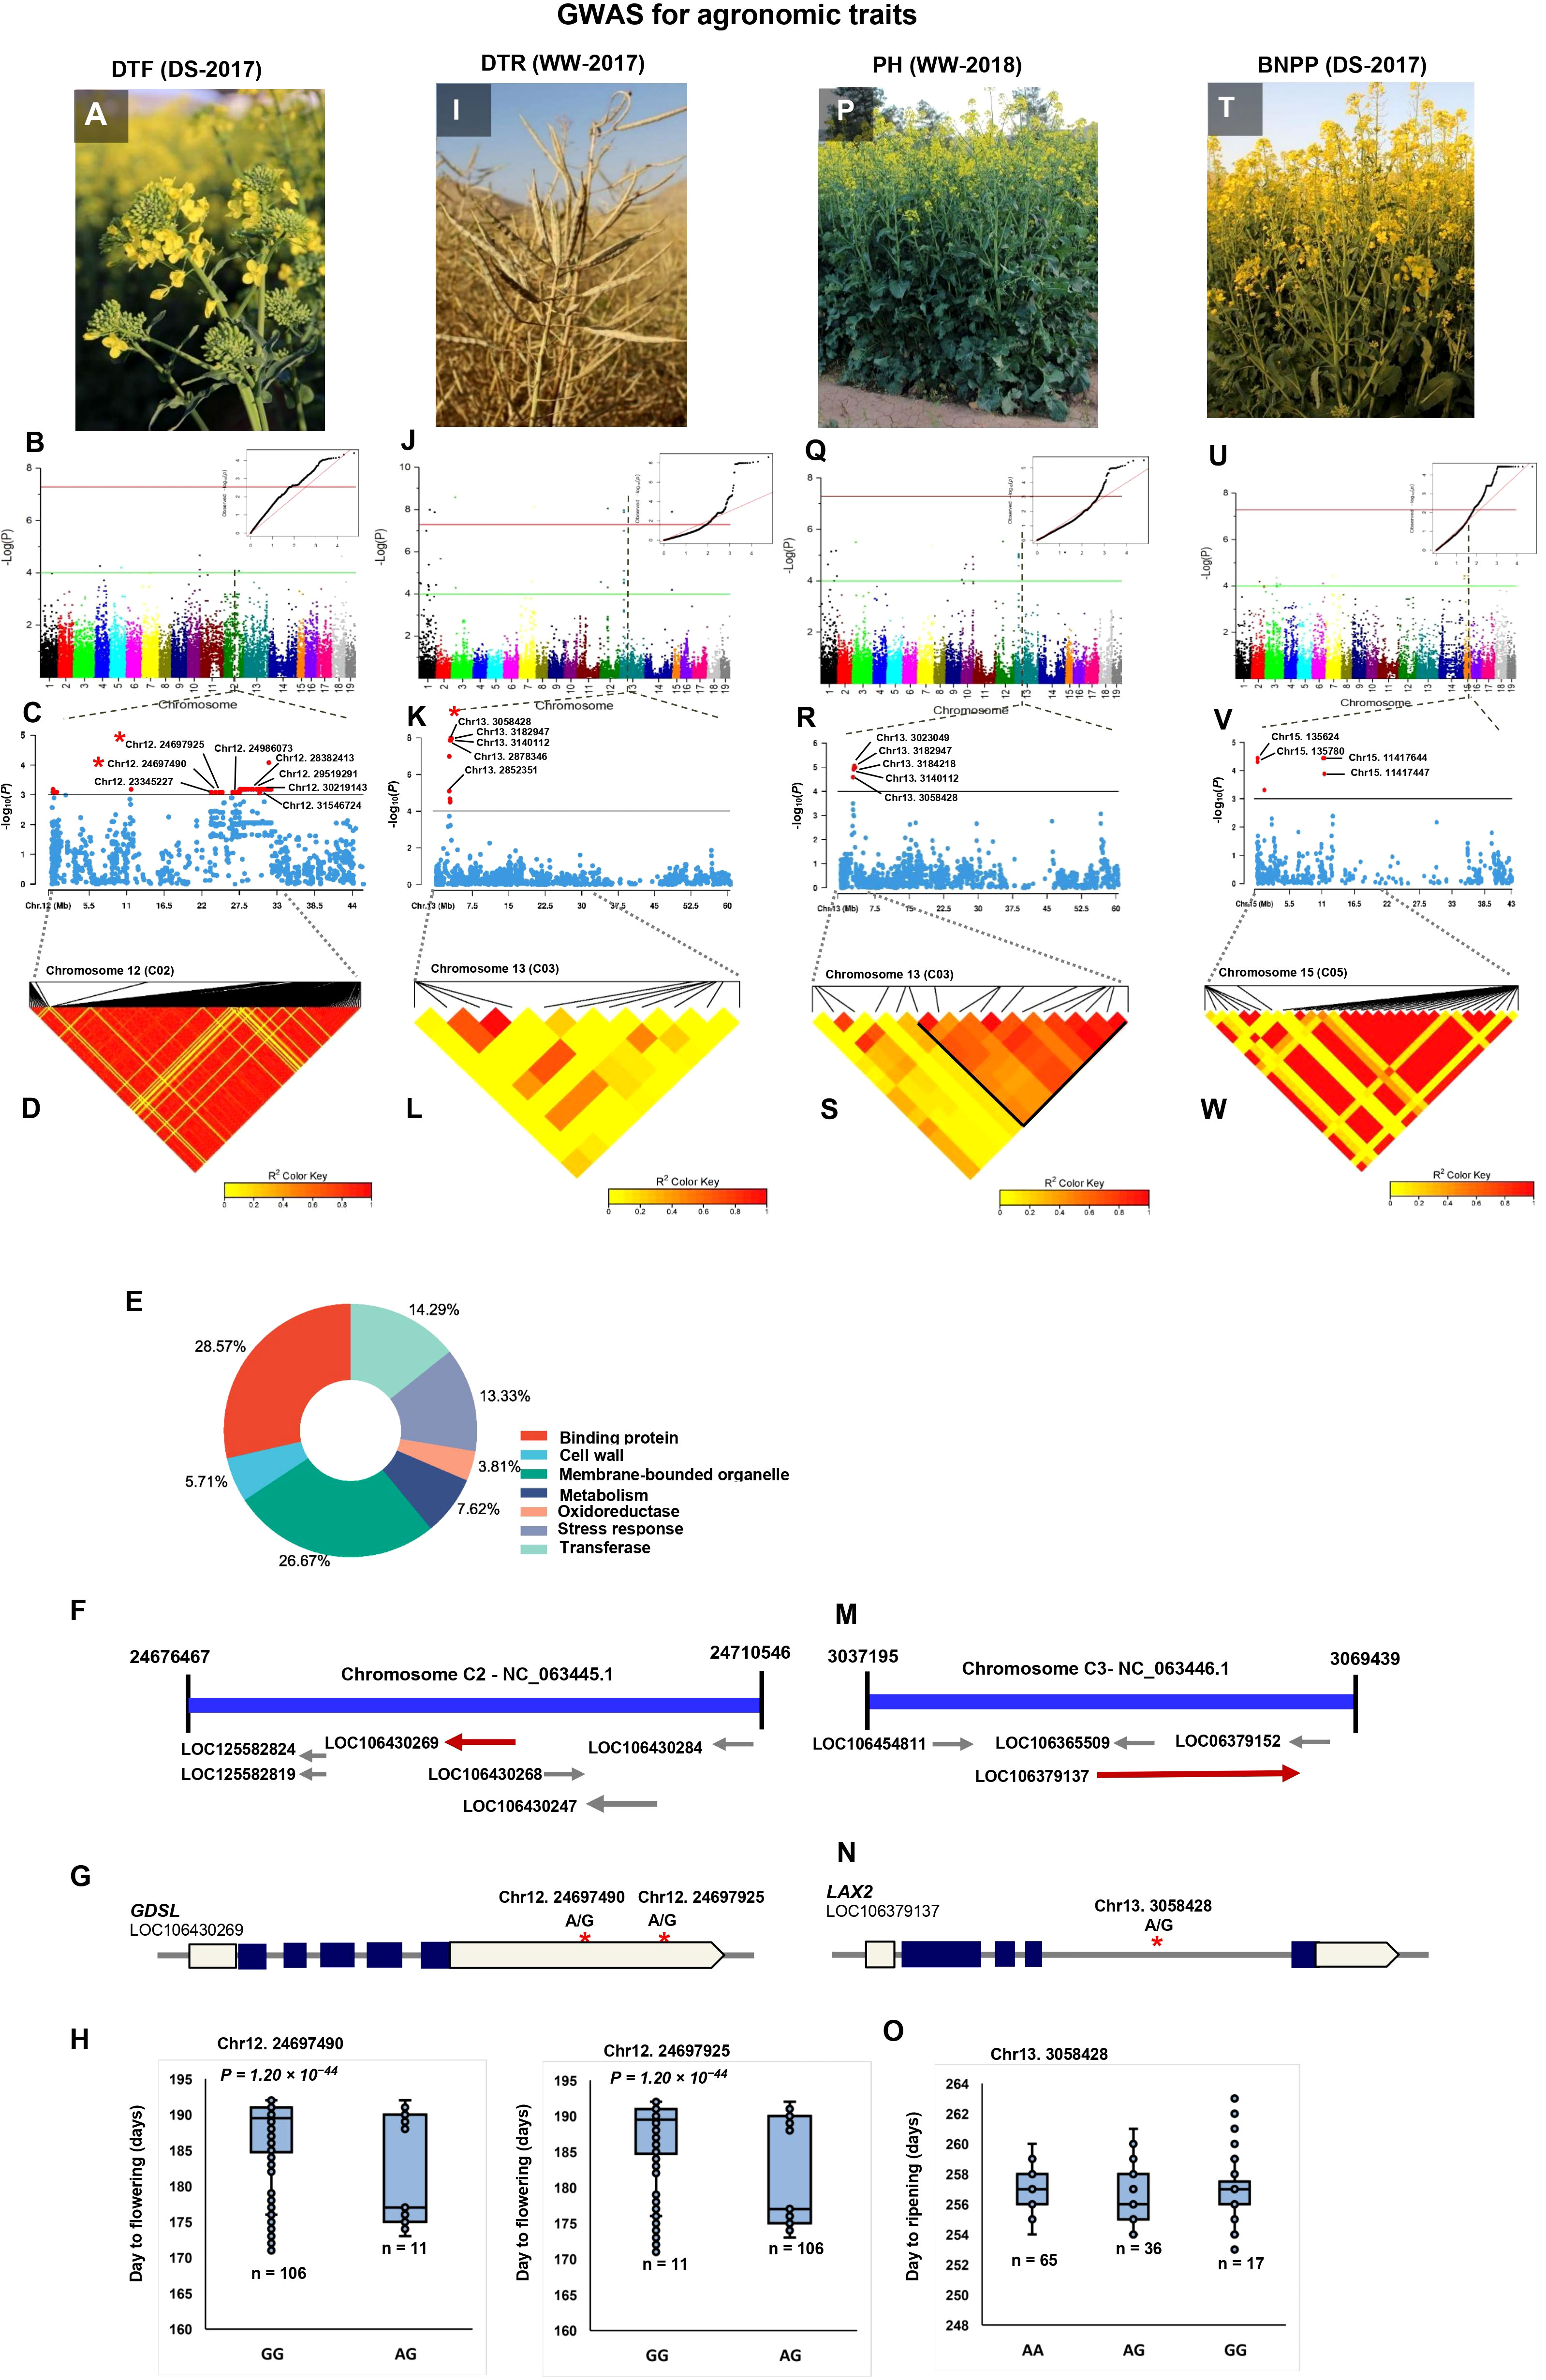
Figure 3 Genome-wide association study (GWAS) reveals the genetic basis of agronomic traits. (A) GWAS of day to flowering (DTF) using the 119 rapeseed (Brassica napus) varieties under drought stress conditions in 2017. (B) Manhattan plot and corresponding quantile–quantile (QQ) plot displaying the GWAS result of DTF in 19 chromosomes (1–10 stand for rapeseed chromosome of A01–A10, and 11–19 stand for rapeseed chromosome of C01–C09 at the horizontal axis). SNPs on different chromosomes are denoted by different colors. (C) Locus zoom plot for DTF associations in chromosome 12 (C02). (D) A representation of pairwise r2 value (displayed as percentages) among polymorphic sites of chromosome 12 (C02) for DTF. (E) CirGO visualization of GO enrichment analysis of significant genes identified by GWAS for DTF. (F) Schematic diagram of the region of chromosome 12 (C02) genotyped in this study, showing the associated gene GDSL (LOC106430269). Chromosomal position based on the National Center for Biotechnology Information (NCBI). (G) Gene model of GDSL. Solid boxes indicate exons, open boxes indicate untranslated regions (UTRs), and lines connecting the exons indicate introns. The red stars mark the position of Chr12:24697490 and Chr12:24697925. (H) The influence of Chr12:24697490 and Chr12:24697925 on day to flowering. The significance of difference between two varieties was evaluated using Student’s t-test. (I) GWAS of day to ripening (DTR) under well-watered conditions in 2017. (J) Manhattan plot and corresponding quantile–quantile (QQ) plot displaying the GWAS result of DTR in 19 chromosomes. (K) Locus zoom plot for DTR associations in the chromosome 13 (C03). (L) A representation of pairwise r2 value (displayed as percentages) among polymorphic sites of chromosome 13 (C03) for DTR. (M) Schematic diagram of the region of chromosome 13 (C03) genotyped in this study, showing the associated gene LAX2 (LOC106379137). Chromosomal position based on NCBI. (N) Gene model of LAX2. Solid boxes indicate exons, open boxes indicate untranslated regions (UTRs), and lines connecting the exons indicate introns. The red star marks the position of Chr13:3058428. (O) The influence of Chr13:3058428 on day to ripening. (P) GWAS of plant height (PH) under well-watered conditions in 2018. (Q) Manhattan plot and corresponding quantile–quantile (QQ) plot displaying the GWAS result of PH in 19 chromosomes. (R) Locus zoom plot for PH associations in the chromosome 13 (C03). (S) A representation of pairwise r2 value (displayed as percentages) among polymorphic sites of chromosome 13 (C03) for PH. (T) GWAS of branch number/plant (BNPP) under drought stress conditions in 2017. (U) Manhattan plot and corresponding quantile–quantile (QQ) plot displaying the GWAS result of BNPP in 19 chromosomes. (V) Locus zoom plot for BNPP associations in the chromosome 15 (C05). (W) A representation of pairwise r2 value (displayed as percentages) among polymorphic sites of chromosome 15 (C05) for BNPP.
3.5.1.2 Days to silique development
GWAS identified 30 TASs on chromosomes A01, A02, A03, and A10 for DTSD (Additional Files 5-8). Chr1:18351464 and Chr1:5217408 had the strongest signals for DTSD in the WW condition in 2017, which explained 43.50% and 37.75% of the phenotypic variance, respectively (Additional File 5). Three SNPs under drought conditions, Chr3:25485861 (A/G), Chr3:25524140 (A/G), and Chr3:25525060 (A/C), identified on chromosome A03 were located ~20 kbps downstream and upstream of the AGL19 gene, respectively. This gene is involved in seed formation, silique maturity, and seed desiccation (Shah et al., 2022).
3.5.1.3 Days to ripening
A total of 97 significant associations were identified for DTR (Additional Files 5-8). The 55 and 42 TASs identified in WW and DS conditions explained 63.20% and 36.79% of the phenotypic variance. There were 77 CGs associated with 21 significant SNPs in the C03:2498421–3217123 intervals (Additional Files 5, 10; Figures 3I–L). Chr13:2852351 (P = 2.11 × 10⁻⁵) and Chr13:2878346 (P =1.36 × 10⁻⁸) were located ~10 kbps downstream and upstream of aspartic proteinase oryzasin-1, respectively. In B. napus, BnaAP36s and BnaAP39s genes play a critical role in pollen tube growth (Wang et al., 2023). Chr13:3058428 (P =1.36 × 10⁻⁸) explained 42.99% of the phenotypic variance located within the position of the panicle architecture-related gene LAX PANICLE 2 (LAX2) (Figures 3M, N). The varieties with the AA and GG alleles in this SNP showed significantly late maturity compared with those with the AG alleles (Figure 3O). Another specific gene, FY, located 19.96 kbps upstream of the Chr13:3140112 (P = 1.07 × 10⁻⁸) SNP, plays a role in the regulation of flowering time in the autonomous flowering pathway through repression of the FLOWERING LOCUS C (FLC) (Kyung et al., 2022). Chr13:3182947 which explained 43.65% of the phenotypic variance was located <1 kbps upstream of two genes from MADS-box AGAMOUS (AG) genes: AGL15 and AGL16. MADS-box genes play an important role in regulating floral carpel and ovule development (Sheng et al., 2019; Shah et al., 2022).
3.5.1.4 Plant height
A total of 70 significantly associated SNPs were identified for PH, of which 59 and 11 were identified in the WW and DS conditions, respectively (Additional Files 5-8). Among the linked SNPs, 16 SNPs identified in the WW conditions were located on chromosome C03 (2736068–3217123 bp), which explained 31.69% of the phenotypic variance (Additional File 6; Figures 3P–S). The 14.28-kbps LD block surrounding Chr13:3023049 (P = 8.96 × 10⁻⁶) contains the TIFY9 gene (Figure 3R). The TIFY family is a plant-specific gene involved in accelerated cell division, leaf flatness, and lateral organ development (Zhang et al., 2020). Chr13:3058428 (A/G) which explained 27.34% of the phenotypic variance of PH was located 12.78 kbps downstream of gene GH3.12 responsible for plant stem growth. Three SNPs, Chr13:3140112 (A/G), and Chr13:3182947 (A/C), and Chr13:3184218 (A/G), were located ~20 kbps downstream and upstream of PAO1.
3.5.2 SNPs and candidate genes linked with yield and yield-related traits under drought conditions
3.5.2.1 Branch number/plant
Of 250 SNPs detected for BNPP, 28 and 222 SNPs explained 10.58% and 89.14% of the BNPP variance in the WW and DS conditions, respectively (Additional Files 5-8). There were 22 of the 222 SNPs identified under DS condition located in the C05:11200372–1417644-bp region, which had not been reported previously (Additional Files 5, 10; Figures 3T–W). Five SNPs, namely, Chr15:125848, Chr15:135624, Chr15:135780, Chr15:136834, and Chr15:136975, within an LD block were located <5 kbps downstream and upstream of the SBT1.1 gene (Figure 3V), a gene which contributed to elongation of the main shoot, increasing inflorescence branching and biomass (Martinez et al., 2015). Two SNPs, Chr15: 136834 (P = 1.31 × 10⁻⁴) and Chr15: 136975 (P = 3.63 × 10⁻⁵), in an LD block were mapped to 11 kbps upstream of a member of SKP1-Like gene family, ASK3.
3.5.2.2 Plant weight
Of the 56 significant SNPs for PW, 34 and 22 explained 58.10% and 41.89% of PW variance in the WW and DS conditions, respectively (Additional Files 5-8). There were 12 TASs of the WW condition located on the 35,474,299–35,698,370 bp interval in chromosome C04 (Additional File 7; Figures 4A–D). This genomic region contained four genes of ABC transporter G superfamily (ABCG16, ABCG17, ABCG18, and ABCG19) which contribute to cytokinin transport in the shoot and enhance the tiller number, grain number per panicle, and grain yield (Wu et al., 2022a). Four SNPs, Chr14:35642269 (A/G), Chr14:35642321 (A/C), Chr14:35642324 (A/C), and Chr14:35643023 (A/G), in an LD block, were located within the ABCG16 sequence (Figures 4C, E, F). The varieties with the alleles AA and CC in these SNPs showed significantly higher plant weight compared with varieties with other alleles (Figure 4G). We identified four haplotypes/markers associated with PW located on chromosome C04 (35,474,299–35,697,553 bp) (Figure 4H) with an average plant weight of 2984.37 g in Hap3 significantly greater than in other three Haps (Figure 4I).
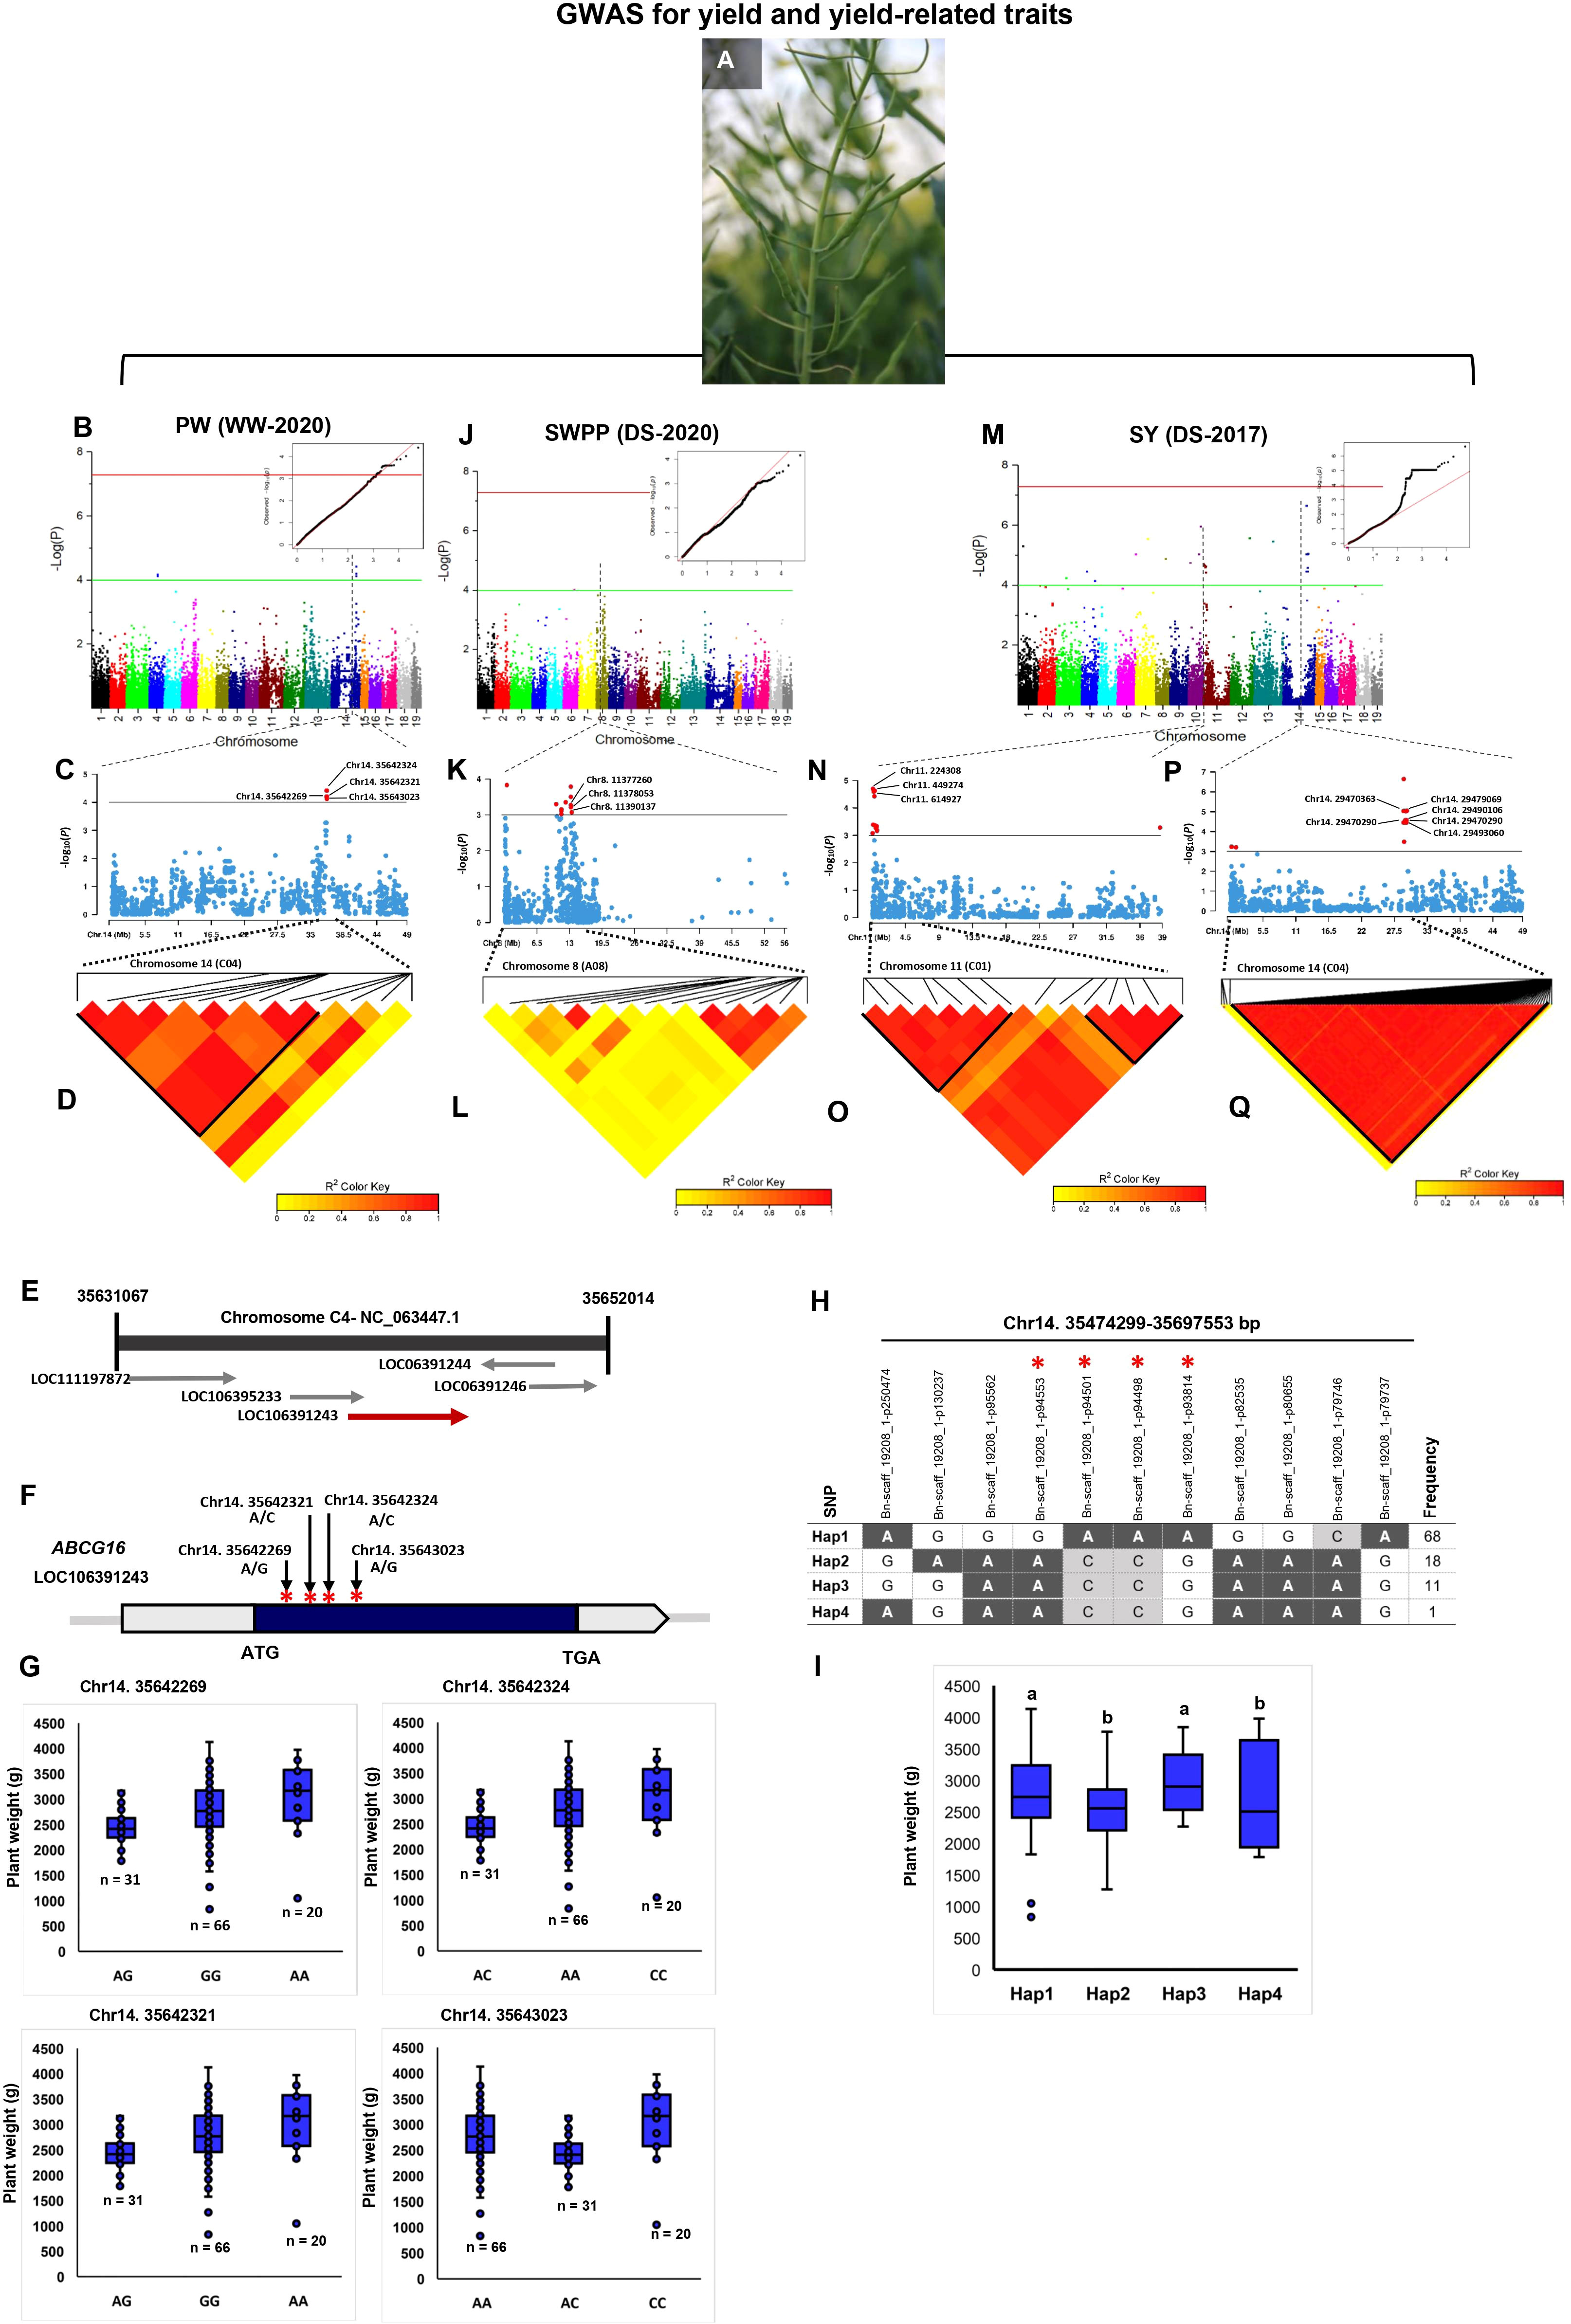
Figure 4 Genome-wide association study (GWAS) reveals the genetic basis of seed yield and yield-related traits in rapeseed (Brassica napus). (A) Phenotypes of siliques in rapeseed which are considered the major contributing factors for increasing rapeseed yield. (B–D) GWAS of plant weight (PW) using the 119 rapeseed varieties under well-watered conditions in 2020. (B) Manhattan plot and corresponding quantile–quantile (QQ) plot displaying the GWAS result of PW in 19 chromosomes (1–10 stand for rapeseed chromosomes of A01–A10, and 11–19 stand for rapeseed chromosomes of C01–C09 at the horizontal axis). SNPs on different chromosomes are denoted by different colors. (C) Locus zoom plot for PW associations in the chromosome 14 (C04). (D) A representation of pairwise r2 value (displayed as percentages) among polymorphic sites of chromosome 14 (C04) for PW. (E) Schematic diagram of the region of chromosome 14 (C04) genotyped in this study, showing the associated gene ABCG16 (LOC106391243). Chromosomal position based on the National Center for Biotechnology Information (NCBI). (F) Gene model of ABCG16. Solid boxes indicate exons, and open boxes indicate untranslated regions (UTRs). The red stars mark the positions of Chr14:35642269, Chr14:35642321, Chr14:35642324, and Chr14:35643023. (G) The influence of Chr14:35642269, Chr14:35642321, Chr14:35642324, and Chr14:35643023 on plant weight. (H) Haplotype block based on 11 significant SNPs on chromosome 14 (C04). (I) Four different haplotype variants (Hap1–Hap4) are present at different frequencies in the analyzed population. Boxplots for plant weight indicate the phenotype values corresponding to the four different haplotype groups. Significant differences among haplotypes were identified using one-way ANOVA. Different letters indicate distinct groups. (J–L) GWAS of seed weight/plant (SWPP) under drought stress conditions in 2020. (J) Manhattan plot and corresponding quantile–quantile (QQ) plot displaying the GWAS result of SWPP in 19 chromosomes. (K) Locus zoom plot for SWPP associations in chromosome 8 (A08). (L) A representation of the pairwise r2 value (displayed as percentages) among polymorphic sites of chromosome 8 (A08) for SWPP. (M-Q) GWAS of seed yield (SY) under drought stress conditions in 2017. (M) Manhattan plot and corresponding quantile–quantile (QQ) plot displaying the GWAS result of SY in 19 chromosomes. (N) Locus zoom plot for SY associations in chromosome 11 (C01). (O) A representation of pairwise r2 value (displayed as percentages) among polymorphic sites of chromosome 11 (C01) for SY. (P) Locus zoom plot for SY associations in the chromosome 14 (C04). (Q) A representation of pairwise r2 value (displayed as percentages) among polymorphic sites of chromosome 14 (C04) for SY.
3.5.2.3 Seed number/silique
There were 10 drought-related TASs identified on chromosome A02 (750,194–791,056 bp) that had not been reported in drought stress in rapeseed, previously (Additional File 7). The Chr2:751843 (A/G), Chr2:751923 (A/G), and Chr2:752016 (A/G) SNPs located within a MADS-box gene, FLOWERING LOCUS C (FLC), involved in flowering time control, inflorescence architecture, floral organ identity determination, and seed development (Soppe et al., 2021). Chr2:989812 (A/C) located 9.10 kbps downstream of seed plant-specific BIG GRAIN LIKE gene family (BG1-D) regulates grain number per plant, grain size with both bigger length and width, and finally grain yield (Liu et al., 2015; Lo et al., 2020; Gao et al., 2022). Chr7:36944365 (A/C) located within CAND1 encodes cullin-associated Nedd8-dissociated protein 1 (Additional File 7).
3.5.2.4 Seed weight/plant
Of the significant TASs identified in drought stress, 10 were located on 10,335,313 bp–13,452,346 bp of chromosome A08 (Additional Files 7, 8). Chr8:11377260 and Chr8:11378053 (P = 7 × 10⁻⁴) were located within the position of a member of the purine permease (PUP)-type transporter gene family, PUP21. In addition, Chr8:11390137 (A/G) was located within other members of the PUP-like family gene, PUP10 (Figures 4J–L).
3.5.2.5 Thousand seed weight
Among the THSW-associated SNPs, 10 were stable overs 2 years under drought stress conditions (Table 2). There were 13 TASs on chromosome C02 (16,251,517 bp–16,902,605 bp) and eight on chromosome C06 (15,724,425 bp–15,768,599 bp) that explained 26.08% and 19.7% of the THSW variance in the WW and DS treatments, respectively (Additional File 7).
3.5.2.6 Seed yield
Of the SY SNPs, 34 were positioned in the 130,644-bp–676,816-bp interval on chromosome C01 (Figures 4M–O). Chr11:224308 (P = 2.58 × 10⁻⁵; Figure 4N), which explained 24.34% of the phenotypic variance located within the position of the DRG3 gene belonging to the G-protein family. Chr11:449274 (P = 4.56 × 10⁻⁴; Figure 4N), which explained 17.69% of the SY variance located 7.78 kbps downstream of CYP79B1. Chr11:614927 (P = 4.68 × 10⁻⁴) was located within the sequence of the AGAMOUS LIKE21 (AGL21) gene, which has been shown to upregulate in siliques and dry seeds in rapeseed (Yu et al., 2017). There were 112 drought-related SY–SNPs located in the 29,030,148-bp–29,607,326-bp interval on chromosome C04 and explained 67.56% of the phenotypic variance of SY (Additional File 5; Figures 4P, Q). Six SNPs on chromosome C04 with complete LD (r2 = 1, Figure 4Q), namely, Chr14:29470290, Chr14:29470363, Chr14:29479069, Chr14:29490106, Chr14:29492969, and Chr14:29493060, located <13 kbps downstream and upstream of CYP78A9, which is another member of the cytochrome P450 superfamily.
3.5.2.7 Harvest index
The 38 SNPs significantly associated with HI contributed to 38.34% and 61.65% of HI variance in the WW and DS conditions, respectively (Additional Files 5-8). Among the HI SNPs, seven SNPs were located on chromosome C06 (24,703,167 bp–34,271,977 bp) and five on chromosome C08 (28,759,659 bp–30,043,480 bp) in the WW condition in 2017 (Additional File 5).
3.6 Identification of novel pleiotropic SNPs associated with more than one trait
In the current study, 19 novel repetitive SNPs linked to both DTF and THSW traits were identified on chromosomes A04, A10, C02, C03, and C06. Analysis of SNPs for pairwise traits revealed that 49 SNPs associated with two or more than two traits and the differences in phenotypic values between varieties with two alleles at each of these SNPs were significant. Of the 49 pleiotropic SNPs, 11 SNPs were overlapped with those reported in previous studies only and the rest were unique in this study (Table 3). There were 11 SNPs on chromosome A02 and A10 that were associated with both DTF and DTSD simultaneously. A pleiotropic SNP Bn-A02-p8660632 for the phenotype of both DTF and DTSD mapped on chromosome A02 and was 2,186 kbps downstream of the position of the BnaA02g12130D and BnaA02g12260D genes. These genes affected DTF and PH in B. napus in the Zheng et al. (2017) study. Pleiotropic SNPs were identified for DTSD and PH; DTSD, PH, and HI; DTR and PH; DTR, PH, and HI; DTR, PH, and PW; PW, SWPP, HI, and SY; and PW, SWPP, and SY (Table 3). The position of the pleiotropic SNP Bn-A08-p15994149 for PW, SWPP, and SY on chromosome A08 was 3,734 kbps downstream of the candidate gene BnaA08g16780D and was 69 kbps downstream of the region (13,520,923 bp–13,598,303 bp) that affected branch pod number and pod number per plant in the Lu et al. (2016) study.
3.7 Estimating the effect of major pleiotropic SNPs on traits
As shown in Table 3, varieties with allele AA in the Bn-A01-p21758046 and Bn-A01-p5715141 SNPs showed higher DTSD, PH, and HI. Varieties with the allele GG in Bn-A01-p7619726 had higher DTR, PH, and HI. The allele GG in Bn-scaff_18936_1-p439378 and Bn-scaff_18936_1-p440619 presented higher DTR, PH, and PW. The allele AA in Bn-scaff_18936_1-p610540 and Bn-scaff_18936_1-p611810 increased DTR, PH, and PW. Varieties with the allele AA in Bn-A08-p12555227 showed higher PW, SWPP, HI, and SY, whereas varieties with the allele GG in Bn-A08-p15782077 and Bn-A08-p15782229 had higher PW, SWPP, HI, and SY.
3.8 Comparative transcriptome analysis between seed and leaf of low and high grain yield varieties
The transcriptome analysis of mature seeds in the rapeseed varieties differing in their seed yield can provide crucial systems-level insights into molecular mechanisms underlying seed development and seed yield. We selected four rapeseed varieties, namely, G111 and G114 as low-seed yield and G19 and G41 as high-seed yield varieties, to investigate the transcriptional differences in the two contrasting groups. In total, 2,906 DEGs (1,441 up- and 1,465 downregulated) of both tissues (seed and leaf) in low-seed yield and 7,243 (3,519 up- and 3,724 downregulated) of both tissues in high-seed yield varieties with |log2FC| ≥ 1 and padj < 0.05 were identified (Figures 5A, B). Of the DEGs, 994 upregulated and 1,008 downregulated genes shared between the two contrasting groups. The Gene Ontology (GO) enrichment analyses of all the genes showed that most of the genes were related to various developmental process, reproductive processes, cell wall organization, cell cycle and cell division, metabolic processes, response to stress/hormone, and regulation of transcription (Figure 5C). These processes are well known to be involved during various aspects of seed development. At least, 321 transcription factor (TF)-encoding genes belonging to 66 families exhibited stage-specific expression in one or more than one cultivar. The members of MYB, bHLH, ERF, WRKY, bZIP, and ARF families were highly represented in these varieties (Figure 5D). The expression profiles of key gene families and individual genes involved in cell division, cell size determination, cell wall modification, carbohydrate metabolism, and grain filling were analyzed. We observed a higher expression of several members of these gene families in high-yield varieties (Figure 5E). A higher transcriptional activity of cyclin-encoding genes was identified in high-yield varieties, which is almost related to higher mitotic activity and an extended period of cell division. The genes encoding glucan synthases and xyloglucan endotransglucosylases/hydrolases exhibited higher transcriptional activity in high-yield varieties. These enzymes are involved in the synthesis and remodeling of cell wall components and production of energy (Miedes et al., 2013; Perrot et al., 2022; Zhang et al., 2022). Furthermore, the transcript abundance of genes involved in cell expansion (expansins), seed storage proteins (e.g., vicilin-like storage protein), and lipid transfer proteins was also significantly higher in the high-seed yield rapeseed varieties (Figure 5E). It has been shown that these proteins contribute to various aspects of seed development and seed maturation (Pagnussat et al., 2012; Wang et al., 2015a; Yaqoob et al., 2020; Rahman et al., 2021; Fang et al., 2023).
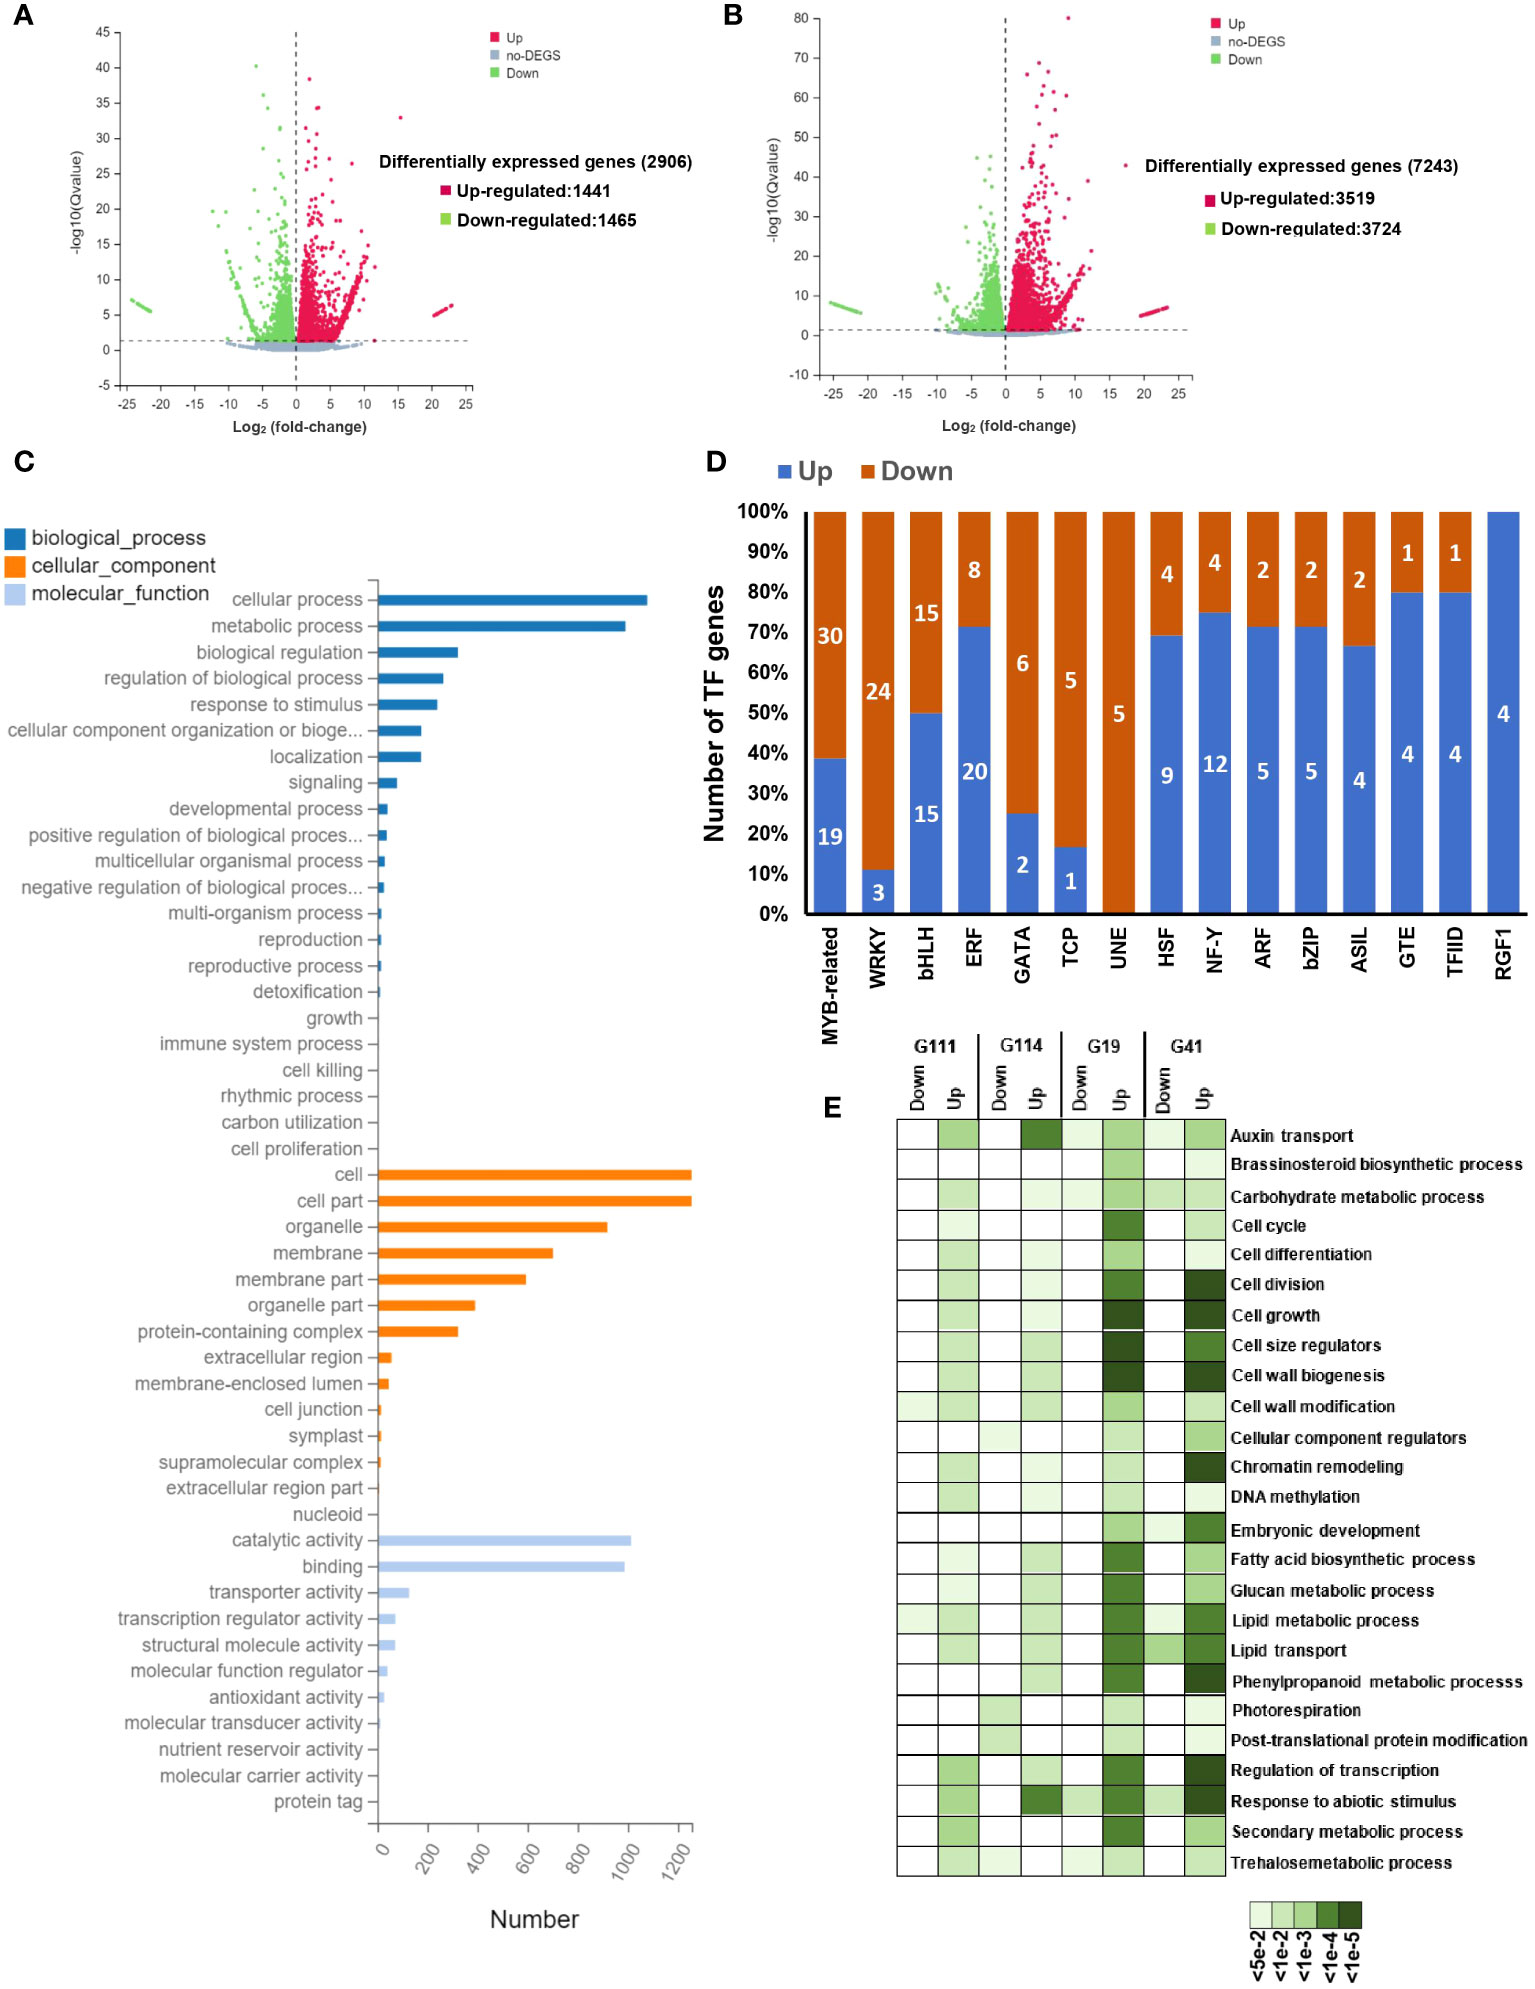
Figure 5 Drought-responsive transcriptional changes in rapeseed (Brassica napus). (A, B) Volcano plots showing the comparison of differentially expressed genes (DEGs) between the treatment and control groups in low-yield varieties (A) and high-yield varieties (B). The red scatters indicate upregulated DEGs, green scatters indicate downregulated DEGs, and black scatters indicate no DEGs between the uniconazole-treated and untreated samples. Datasets were filtered to remove genes with low expression levels (dotted line from −1 to 1 on the x-axis), and a significance cutoff (P-value < 0.01) was applied (dotted line on the y-axis). The x-axis shows log2 fold changes in expression and the y-axis –log10 of q-values of a transcript being differentially expressed. (C) The Gene Ontology (GO) enrichment analysis of differentially expression genes. The top 23 enriched GO terms (P-value < 1.0E-5) were used for diagram. Gene ontology categories included biological process, cellular component, and molecular function. (D) The number of genes from different transcription factor (TF) families showing up- or downregulation in high-yield varieties of mature seed. (E) Enriched gene ontology (GO) terms of mature seed in down- and upregulated genes in high-yield varieties and low-yield varieties. The color scale at the bottom represents significance (corrected P-value).
3.9 Validation of candidate genes associated with SNPs by transcriptome analysis
Transcriptome sequencing was performed for further analysis of the identified CGs associated with the linked SNPs. We found that 215 CGs were significantly expressed under drought stress (Additional File 11; Figure 6A). The identified GCs were mainly associated with DTF (47.90% of the CGs), DTR (41.86%), PH (4.18%), and yield components (4.65%). The results of the KEGG pathway analysis are shown in Figure 6B. For the upregulated DEGs, 16 KEGG pathways were enriched according to P-value < 0.01 and FDR < 0.01. Our gene expression analysis identified 23 DTF-associated genes surrounding the SNP peaks in chromosome C02 of which 19 genes were upregulated under the DS condition (Figure 6B). One of these genes with 14.32-fold change between the two contrasting varieties, GDSL ESTERASE/LIPASE (LOC106430269) in C02, contained two significant DTF SNPs (Figure 6C). Six genes, LOX4, FAR1, NCED9, CCR2, RALFL14, and DEFL7, were located near our SNPs; Bn-scaff_18507_1-p354053, Bn-scaff_22749_1-p574003, Bn-scaff_16328_1-p636786, Bn-scaff_16485_1-p1575966, Bn-scaff_18245_1-p84866, and Bn-scaff_18406_1-p183669 were, respectively, upregulated in the DS condition and in the high-seed yield varieties (Table 4; Figure 6C). Among these genes, the LOX4 gene showed 11.56-fold change between the two contrasting groups. In the KEGG analysis, we found that GDSL ESTERASE/LIPASE and LOX4 are involved in the lipid metabolism pathways (Additional File 12; Figure 6B). Transcriptome analysis in both leaf and seed samples showed variable responses to drought stress. Higher DEGs and larger absolute changes were observed in expression of the genes in seed extracts than in leaf (Figures 6D–J).
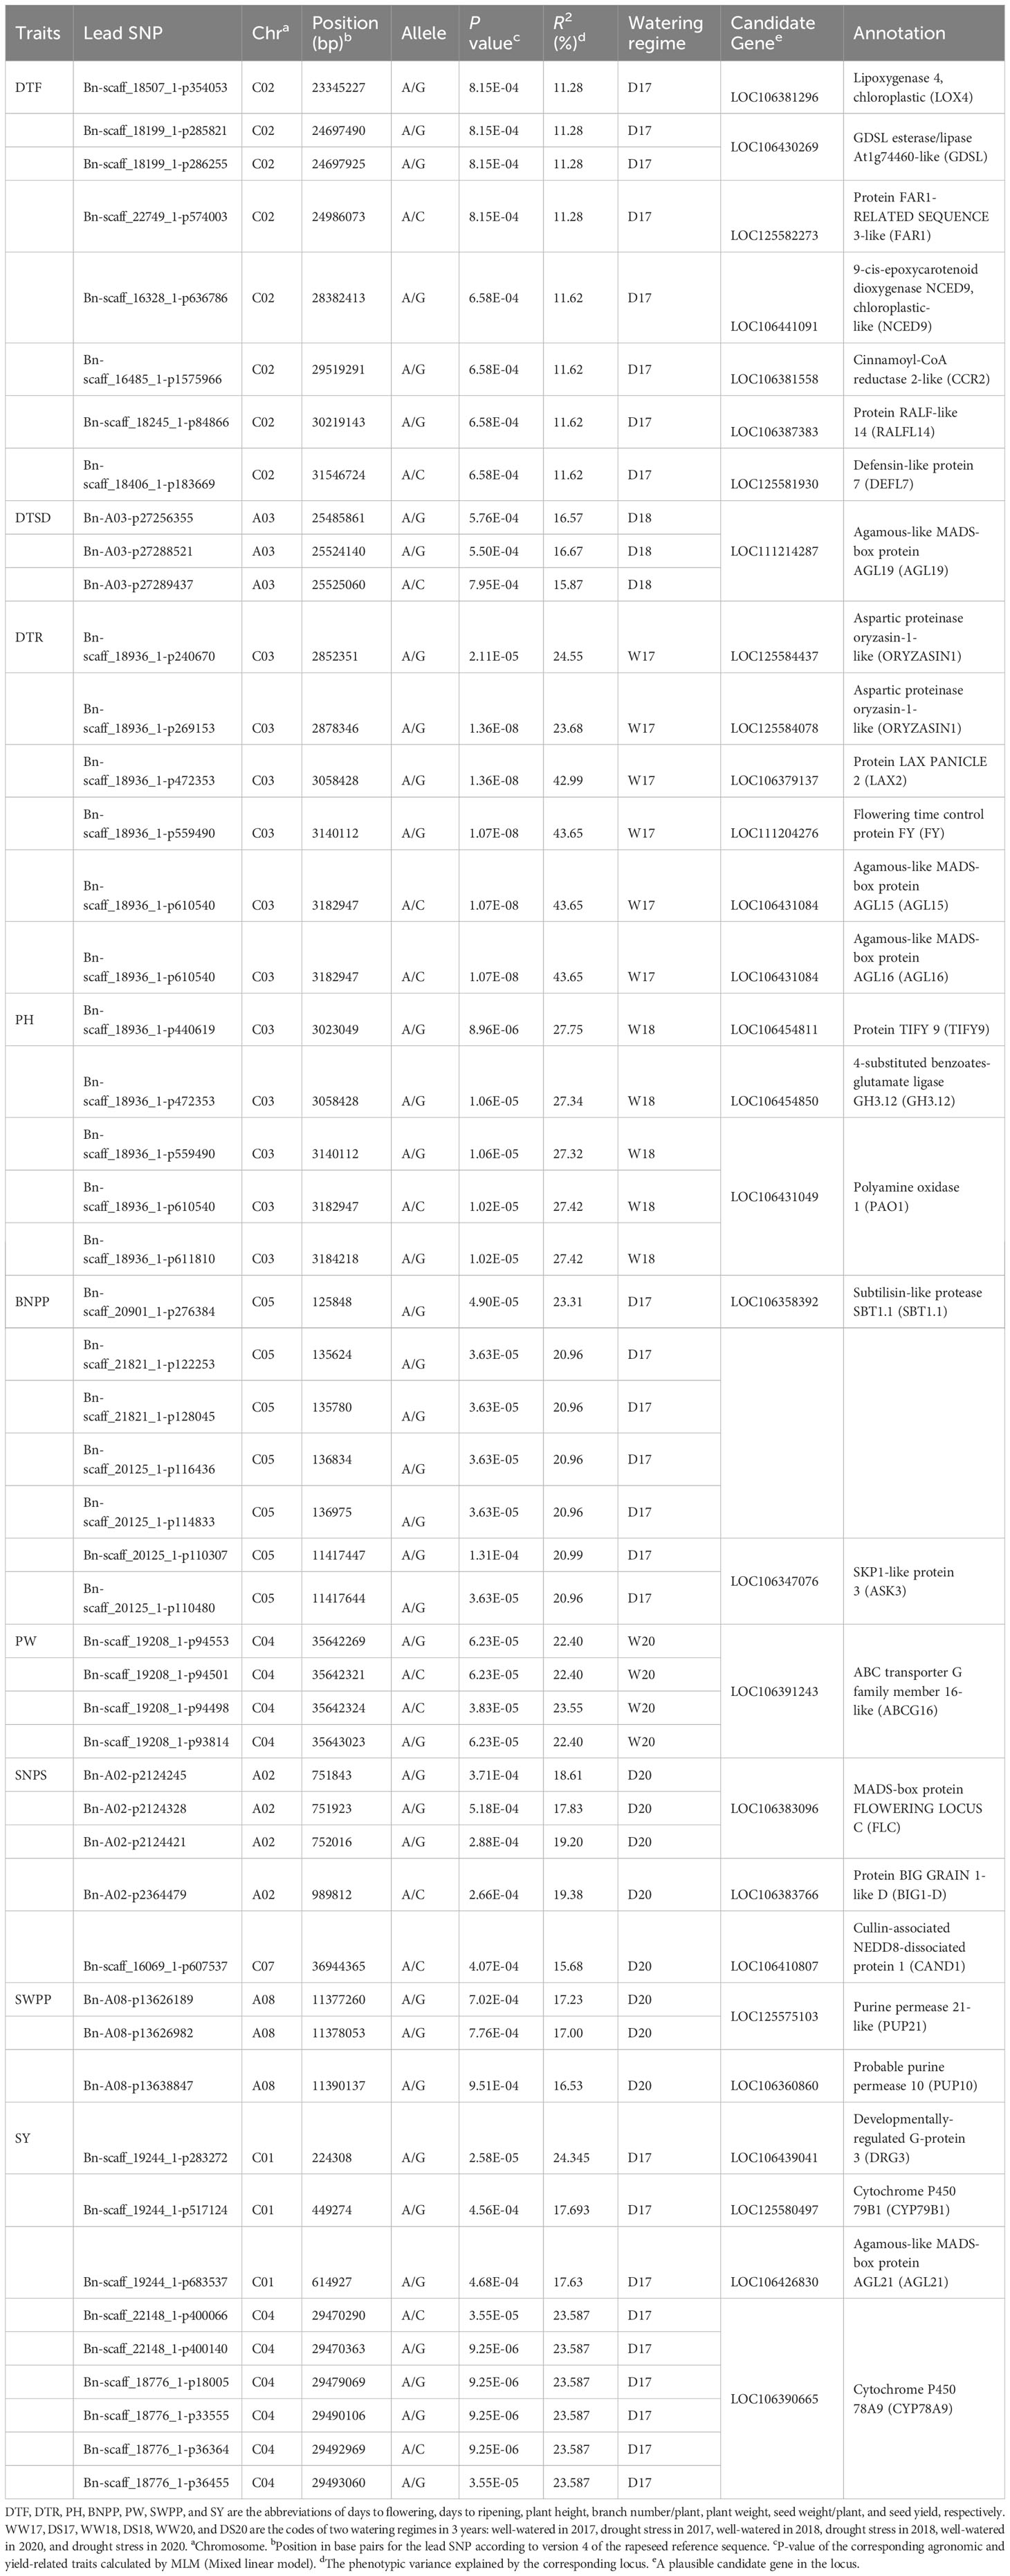
Table 4 SNPs and candidate genes significantly associated with agronomic and yield-related traits integrating genome-wide association and transcriptome studies.
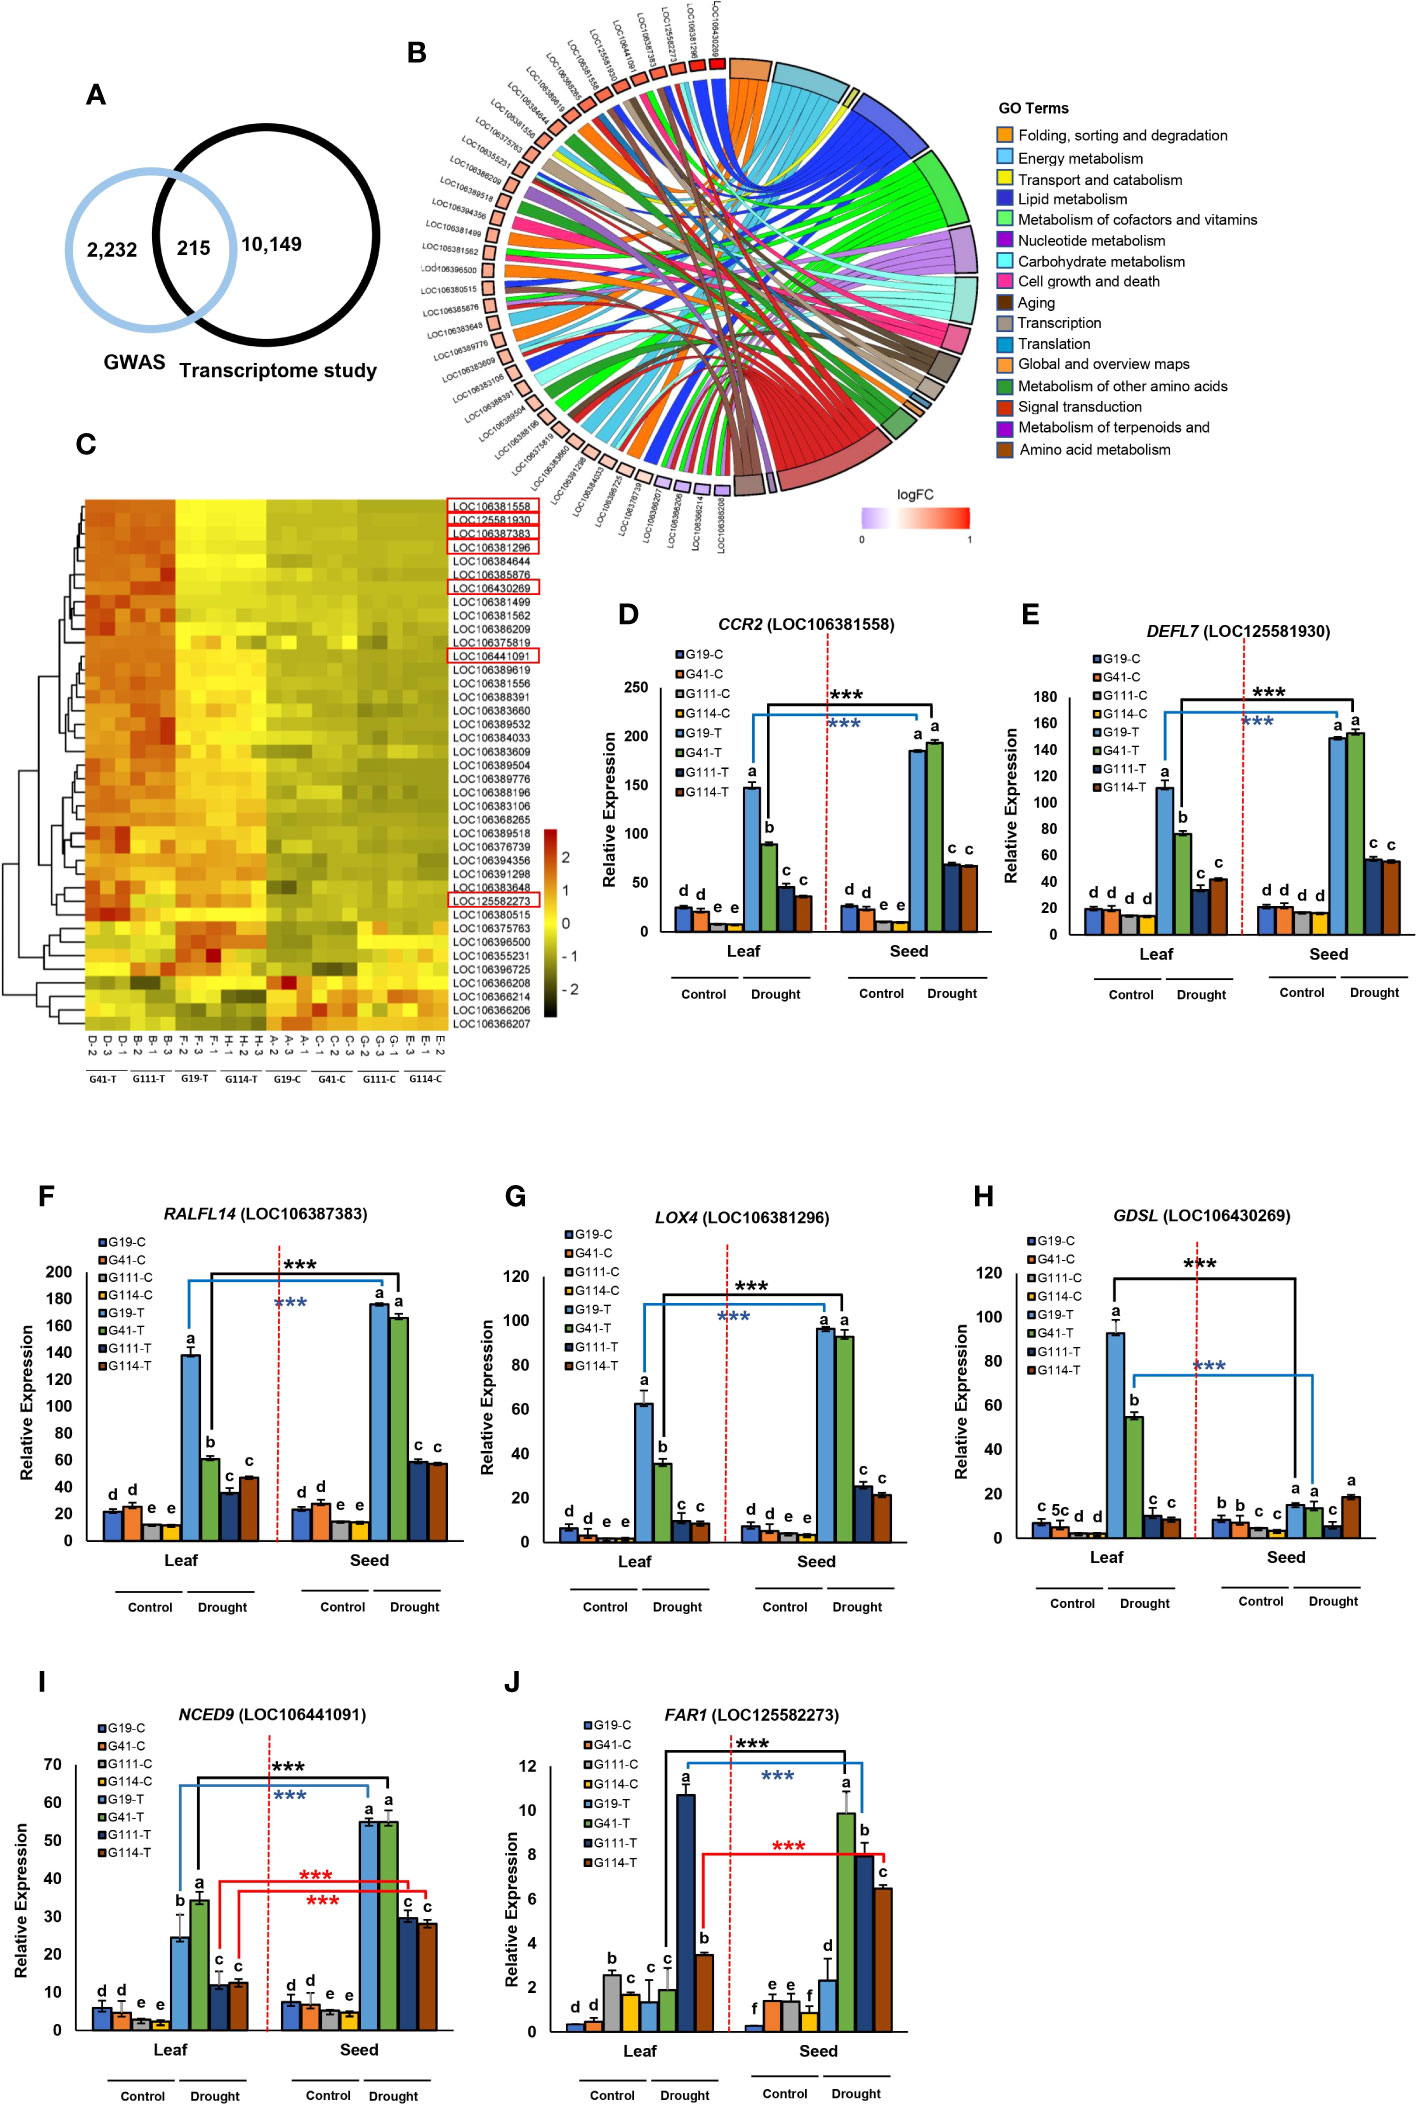
Figure 6 Analysis of transcriptomes between high- and low-yielding varieties selected in drought stress treatment in the field study. Transcriptome study for days to flowering (DTF). (A) Venn diagram of overlapped genes significant in GWAS and transcriptome analysis. (B) Detailed analysis of 16 enriched gene ontology groups selected using Circos plots for candidate genes in chromosomes A02, C01, C02, and C04 related to DTF. Symbols of DEG from each of the analyzed comparisons are displayed on the left side of the graph with their logFC values, mapped by color scale (red = higher expression; violet = lower expression). The white color corresponds to expression levels below the cutoff value for the given comparisons. Colored connecting lines determine gene involvement in the GO terms. (C) Heat map of the expression of 40 genes associated with DTF in chromosomes A02, C01, C02, and C04 among low-yield varieties (G111 and G114) and high-yield varieties (G19 and G41) under drought stress. The red box indicates the key genes in the associated region of C02 related to DTF. Heatmap color represents the expression level of each gene (rows) under drought treatments (fold change > 1, P-value < 0.05). Red bars: upregulation; green bars: downregulation; (C): control and (T): drought treatment. (D-J) Tissue-specific expression of seven candidate genes in the peak regions of C02 from four varieties of rapeseed (low-yield varieties: G111 and G114; high-yield varieties: G19 and G41) under drought stress; (C): control and (T): drought treatment. Tissue-specific expression of the gene CCR2 (D), DEFL7 (E), RALFL14 (F), LOX4 (G), GDSL (H), NCED9 (I), and FAR1 (J) between low-yield varieties and high-yield varieties under drought stress. Data are means ± SD, P-value < 0.05, as determined by multiple comparison testing by one-way ANOVA. Different letters indicate distinct groups. Red dotted line indicates division expression of genes between seed and leaf. Asterisks indicate significant difference between seed and leaf (Student’s t-test, ***P-value < 0.001).
We found that 20 genes surrounding the peak SNPs for DTR were significantly upregulated in the DS condition (Figure 7B). Expression of two genes, ORYZASIN1 and FY, near the SNPs Bn-scaff_18936_1-p269153 and Bn-scaff_18936_1-p559490 for DTR, respectively, which was significantly higher in seed and drought than in leaf and WW conditions was significant between the two contrasting low- and high-yield varieties (Figures 7B, C, E). In the KEGG analysis, we found that ORYZASIN1 and FY were from the lipid metabolism and biosynthesis of other secondary metabolites (Figure 7A; Additional File 13). The LAX2 gene which belonged to transport and catabolism pathways was upregulated in drought treatment and contained a significant SNP in C03 for DTR (Figures 7B, D; Table 4; Additional File 13). Similar results were observed for gene expression level under drought stress for two members of the MADS domain family, AGL15 and AGL16, that were near the significant SNP loci on C03 (Table 4). We observed that the expression of the LAX2, AGL15, and AGL16 genes was significantly higher in seed than in leaf samples under drought (Figure 7F).
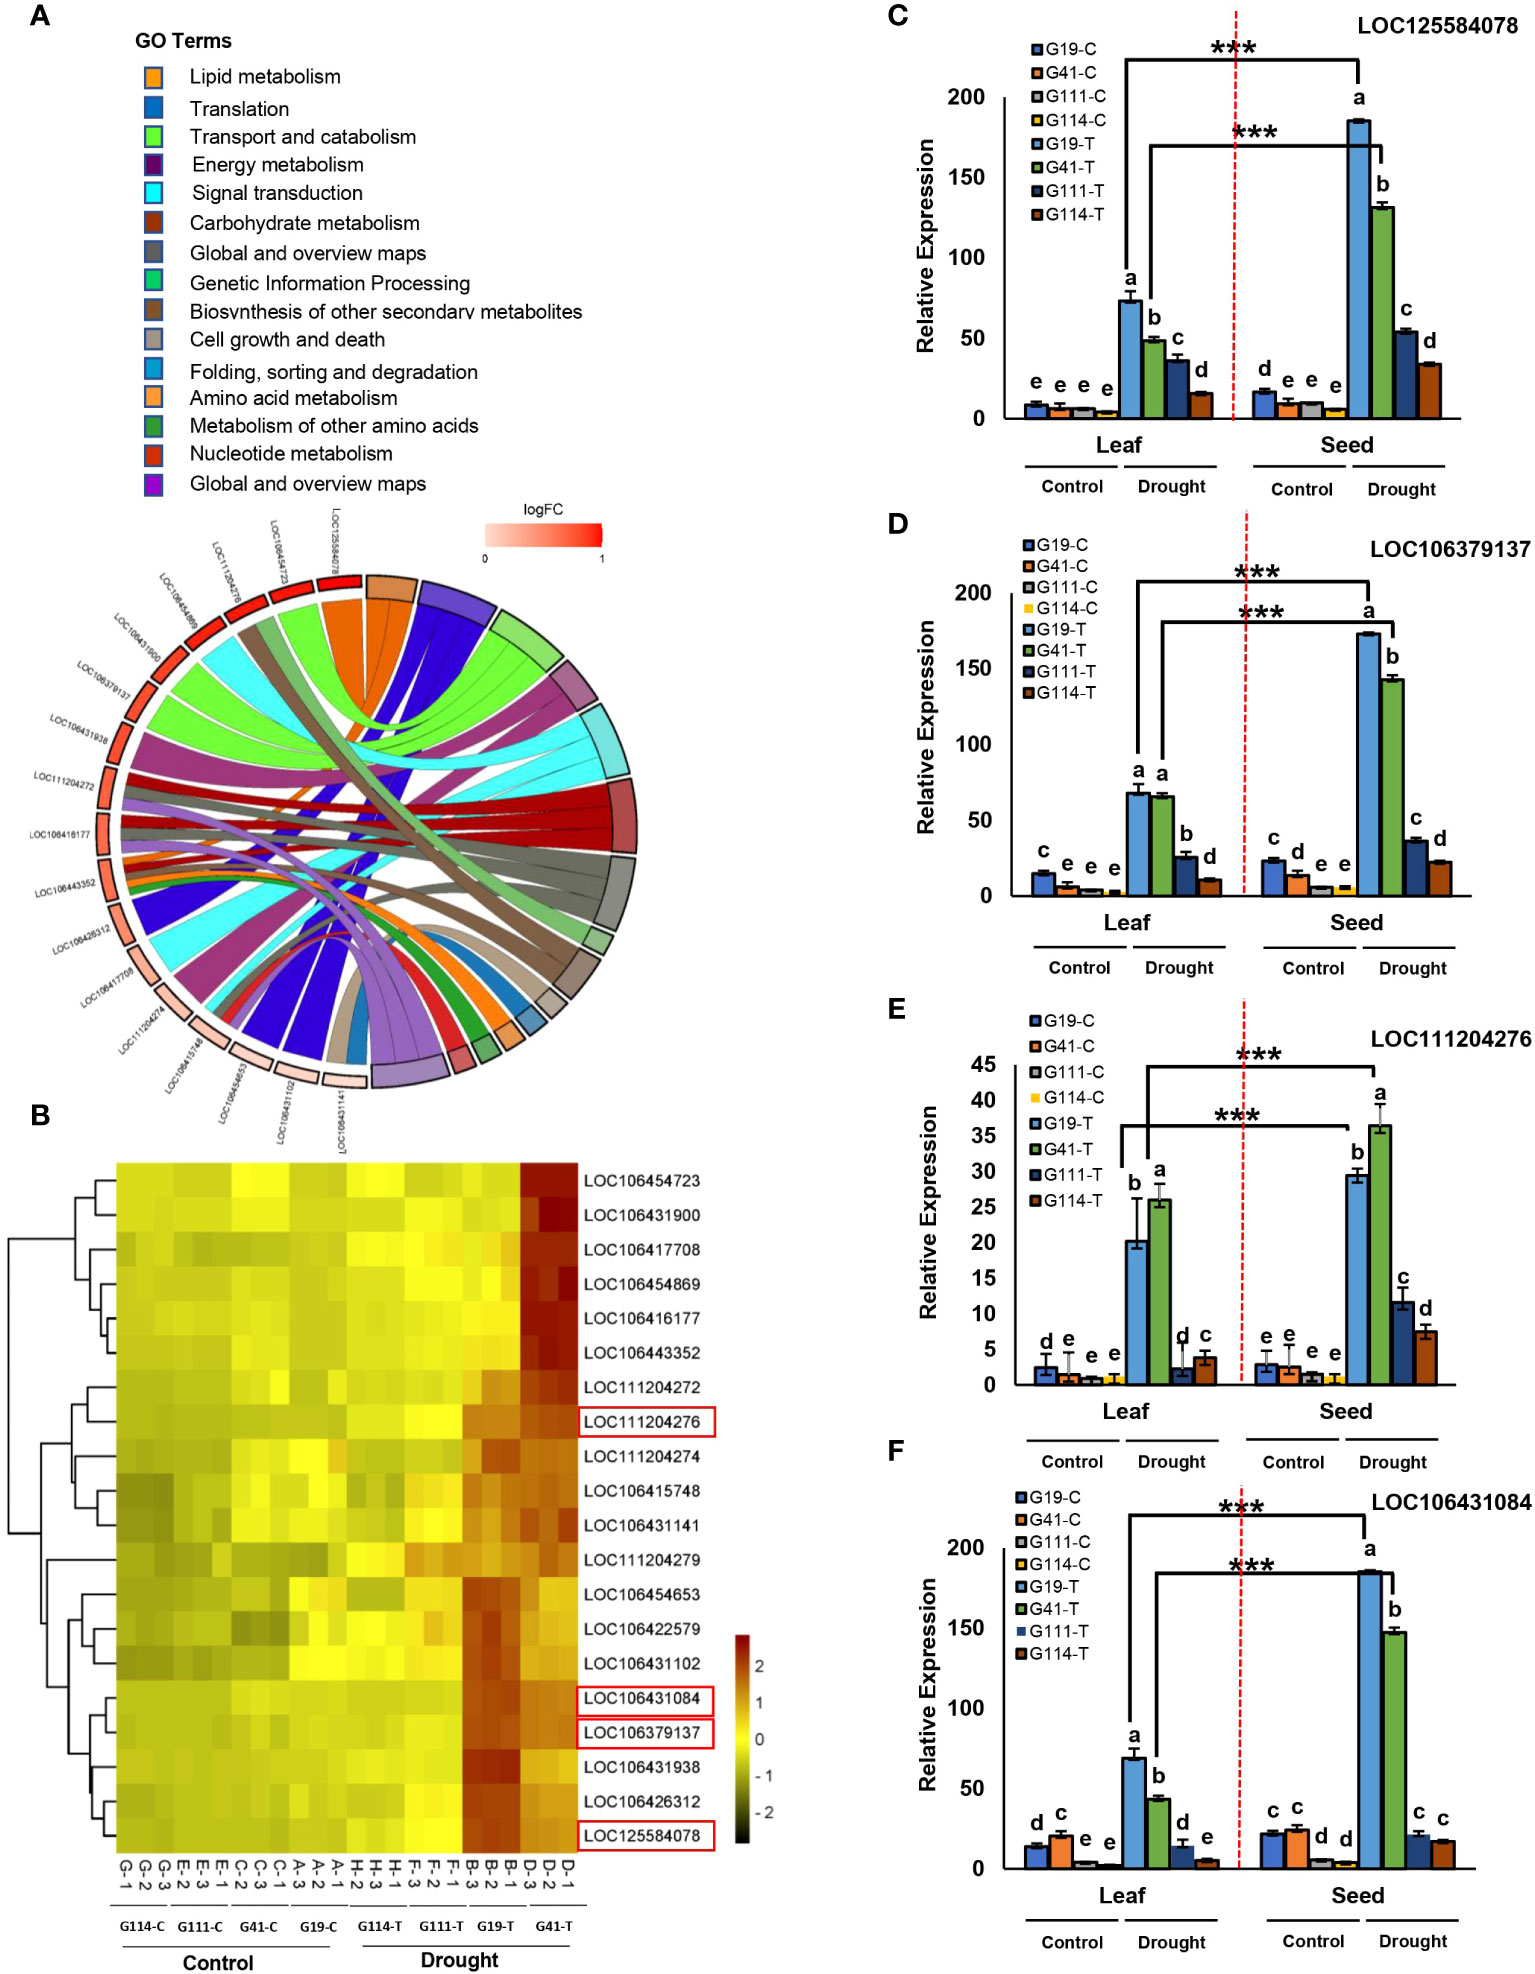
Figure 7 Analysis of transcriptomes between high- and low-yielding varieties selected in drought stress treatment in the field study. Transcriptome study for days to ripening (DTR). (A) Detailed analysis of 15 enriched gene ontology groups selected using Circos plots for candidate genes in chromosomes A01, C03, and C06 related to DTR. Symbols of DEG from each of the analyzed comparisons are displayed on the left side of the graph with their logFC values, mapped by color scale (dark red = higher expression; light red = lower expression). Colored connecting lines determine gene involvement in the GO terms. (B) Heat map of the expression of 20 genes associated with DTR in chromosomes A01, C03, and C06 among low-yield varieties (G111 and G114) and high-yield varieties (G19 and G41) under drought stress. The red box indicates the key genes in the associated region of C03 related to DTR. Heatmap color represents the expression level of each gene (rows) under drought treatments (fold change >1, P-value <0.05). Red bars: upregulation; green bars: downregulation; (C): control and (T): drought treatment. (C-F) Tissue-specific expression of seven candidate genes in the peak regions of C03 from four varieties of rapeseed (low-yield varieties: G111 and G114; high-yield varieties: G19 and G41) under drought stress; (C): control and (T): drought treatment. Tissue-specific expression of the gene LOC125584078 (C), LOC106379137 (D), LOC111204276 (E), and LOC106431084 (F) between low-yield varieties and high-yield varieties under drought stress. Data are means ± SD, P-value < 0.05, as determined by multiple comparison testing by one-way ANOVA. Different letters indicate distinct groups. Red dotted line indicates division expression of genes between seed and leaf. Asterisks indicate significant difference between seed and leaf (Student’s t-test, *** P-value < 0.001).
The TIFY9, GH3.12, and PAO1 genes associated with PH SNPs on C03 showed significant differential expression between high- and low-yield varieties in the DS condition (Figures 8A, B, E–H). GH3.12 had a higher expression in leaf than in seed (Figure 8D), whereas the expression of TIFY9 was higher in seed (Figure 8C).
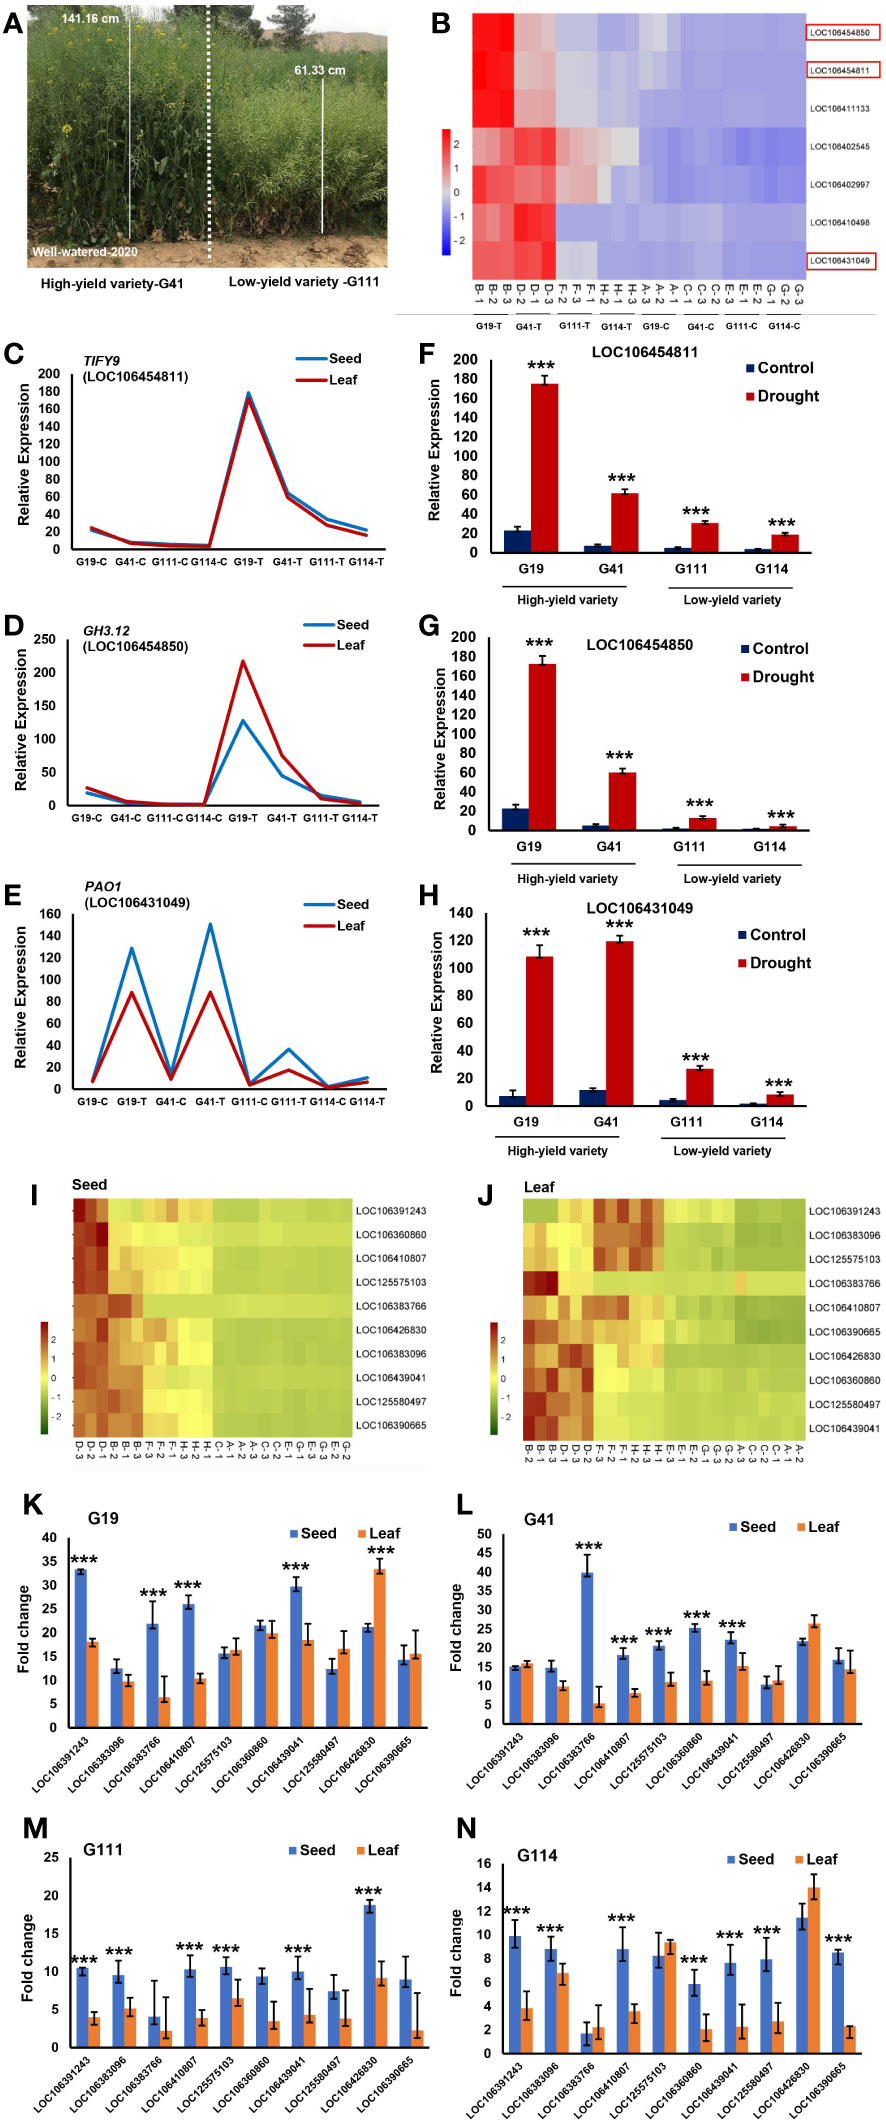
Figure 8 Transcriptome study for plant height (PH) and seed yield (SY). (A) Plant height phenotypes of two rapeseed varieties; G41 as a high-yield varieties and G111 as a low-yield varieties were grown in field under well-watered conditions in 2020. (B) Heat map of the expression of seven genes associated with PH in chromosomes A07, C03, C06, and C07 among low-yield varieties (G111 and G114) and high-yield varieties (G19 and G41) under drought stress. The red box indicates the key genes in the associated region of C03 related to PH. Heatmap color represents the expression level of each gene (rows) under drought treatments (fold change > 1, P-value < 0.05). Red bars: upregulation; blue bars: downregulation; (C): control and (T): drought treatment. (C-E) Tissue-specific expression of three candidate genes in the peak regions of C03 from four varieties of rapeseed (low-yield varieties: G111 and G114; high-yield varieties: G19 and G41) between seed and leaf under drought stress; (C): control and (T): drought treatment. Tissue-specific expression of the gene TIFY9 (C), GH3.12 (D), and PAO1 (E) between seed and leaf from four varieties. (F) Expression pattern of the gene TIFY9 between low-yield varieties and high-yield varieties under drought stress. (G) Expression pattern of the gene GH3.12 between low-yield varieties and high-yield varieties under drought stress. (H) Expression pattern of the gene PAO1 between low-yield varieties and high-yield varieties under drought stress. (I, J) Heat map of the expression of 10 key genes associated with SY in chromosomes A02, A08, C01, C04, and C07 among low-yield varieties (G111 and G114) and high-yield varieties (G19 and G41) from seed (I) and leaf (J) under drought stress. Heatmap color represents the expression level of each gene (rows) under drought treatments (fold change >1, P-value < 0.05). Red bars: upregulation; green bars: downregulation; (C): control and (T): drought treatment. (K-N) Tissue-specific expression of 10 genes associated with SY in four varieties: G19 (K), G41 (L), G111 (M), and G114 (N) under drought stress. Asterisks indicate significant difference between seed and leaf (Student’s t-test, ***P-value < 0.001).
There were 10 DEGs (BG1, FLC, DRG3, CAND1, PUP10, PUP21, ABCG16, AGL21, CYP79B1, and CYP78A9) associated with the SY SNPs which showed significant differential expression between high- and low-yield varieties (Table 4; Figures 8I–K). These DEGs are known to regulate seed yield by affecting anther and pollen development, seed ripening, seed size, and seed weight regulation (Ma et al., 2015; Castelan-Munoz et al., 2019; Xu et al., 2019; Li et al., 2022). The ABCG16 gene with 33.03-fold change in the seed sample showed a higher expression in the high-yield variety G19 under drought than in the WW condition (Figures 8I–K). The AGL21 gene with 33.42-fold change showed higher expression in leaf under drought than in the WW condition in G19 (Figure 8K). The CAND1 and DRG3 genes had higher expression in seed than in leaf samples in both low- and high-yield varieties under drought conditions (Figures 8I, K–N).
3.10 Validation of major drought-related genes by combining GWAS and RNA-seq results
We identified the DEGs in the selected yield contrasting varieties in the drought compared with the well-watered treatment. A gene ontology enrichment analysis was also performed to identify the functional roles of DEGs and variety-specific responses under drought stress conditions. Transcriptomic analysis showed that 10 DEGs (BG1, FLC, DRG3, CAND1, PUP10, PUP21, ABCG16, AGL21, CYP79B1, and CYP78A9) had significantly higher expression in the high- than in low-yield varieties. These CGs were upregulated in the low-yield varieties under the drought stress compared with the well-watered conditions. Consistent with the higher number of DEGs observed in the leaf or seed of the high-yield varieties in response to drought, higher enriched GO terms unique to the high-yield varieties, particularly in seed, were detected. Most of the enriched GO terms exclusive to the high-yield varieties in seeds were those processes that were associated with abiotic stress, including the responses to ABA, osmotic adjustment, and regulation of stomatal movements. A number of 25 upregulated DEGs were identified in the seeds of the high-yield compared with 20 DEGs in the low-yield varieties (Supplementary Figure S7). In the high-yield varieties, xyloglucan endotransglucosylase/hydrolases (XTH13), triacylglycerol lipase (SDP1), serine/threonine-protein kinase (SRK2F), ABC transporter F family (ABCF1), ethylene-responsive transcription factor (ERF113), zinc-finger proteins (ZC3H49), F-box protein (FBD), NAC domain-containing proteins (NAC072), and acetyl-CoA acetyltransferase (FadA) showed above fivefold change (Supplementary Figures S7C, E). Upregulation of the XTH13, NAC072 and FadA genes was observed in the two contrasting varieties (Supplementary Figures S7C–F). The XTH gene family is involved in various physiological processes in plants, especially in abiotic stress responses and cell elongation (Ma et al., 2022). The XTH genes have been regulated by TF NAC by directly binding to the promoter region of the XTH genes improving stress tolerance (Tao et al., 2022).
4 Discussion
4.1 Traits variations in rapeseed under drought stress
Breeding rapeseed which is an important source of oil and protein for food and industrial applications is challenging due to environmental stresses worldwide (Elferjani and Soolanayakanahally, 2018; Secchi et al., 2023). Results of evaluation of a rapeseed population over three growing seasons showed large genetic diversity for morphological, phenological, and yield traits in both drought and well-watered treatments. Our data showed a significant treatment by trait value interaction. Phenotyping under two irrigation regimes revealed differences for the traits among varieties over treatments and years that were higher than those in earlier studies (Korber et al., 2016; Luo et al., 2017; Raman et al., 2020; Menendez et al., 2021; Qin et al., 2022; Yang et al., 2023). Higher heritability and genetic gain from selection for several traits in this study under two contrasting irrigation regimes indicated selection potential for the improvement of drought tolerance in the tested rapeseed population. Our study showed that the 119 varieties could be clustered into seven supported genetic lineages that roughly reflected their geographical origin consistent with previous studies (Gazave et al., 2016; Bird et al., 2017).
4.2 Novel and stable loci identified for agronomic and yield-related traits under drought conditions
Due to the sensitivity of complex traits to the environmental effects, the integration of GWAS and RNA-seq across different tissues might assist identification of candidate genes responsible for stress tolerance. Our study uncovered numerous loci correlated with variation in agronomic and yield-related traits. This study identified a set of candidate genes that could be exploited to alter agronomic traits and yield components to improve grain yield in rapeseed varieties. Life cycle timing is critical for yield and productivity of Brassica napus cultivars grown in different environments. Timing of flowering is crucial for optimal pollination, survival in specific environments, high seed quality, and seed yield and maintaining seed propagation in crop rotation systems (Kirkegaard et al., 2018). In the present study, we identified six stable SNPs for flowering time that were common between the two irrigation treatments across years. In addition, 171 novel signals significantly associated with flowering time were identified under drought conditions. Numerous loci of flowering time in B. napus have been identified on chromosomes A02, C02, and C03 by QTL mapping and GWAS in other studies (Akhatar et al., 2021; Vollrath et al., 2021; Han et al., 2022). We identified 21 novel MTAs on chromosome C03 for ripening time in rapeseed that were not previously reported. In temperate regions such as Iran, early flowering and maturity are important breeding targets in B. napus because drought restricts the growth season (Helal et al., 2021). Identification of candidate loci involved in drought tolerance can be used for marker-assisted selection and helps develop drought-tolerant rapeseed for dry regions. In a meta-QTL analysis, co-localized QTLs for flowering and maturity times were identified on chromosomes A01, A02, A03, A05, and C09 (Zhou et al., 2014).
Plant architecture (PA), which refers to the spatial distribution pattern of aboveground parts including plant height (PH) and number of aerial branches, is influenced by both genetic and environmental factors (Cai et al., 2016; Wang et al., 2019; Dong et al., 2022). In the present study, we identified 70 unique SNPs on chromosomes A01, A02, A04, A07, A09, A10, C03, and C05 associated with PH under two irrigation regimes of which several SNPs were close to those identified in previous studies (Sun et al., 2016a; Zhang et al., 2023a). In line with results of the Liu et al. (2021) and Zheng et al. (2017) studies, the highest number of significant SNPs for PH was identified on chromosome C03. In the current study, we identified 22 unique SNPs associated with branch number under drought stress condition that were not discovered in previous studies in rapeseed. These SNPs provide new information for understanding the establishment of ideal PA and developing breeding strategies for yield improvement in rapeseed. The molecular genetic mechanisms underlying branch number have been analyzed using GWAS in other rapeseed studies (Sun et al., 2016b; Dong et al., 2022; Hu et al., 2022). In the Sun et al. (2016b) study, 56 unique loci significantly associated with branch number explained up to 51.1% of the phenotypic variation. Hu et al. (2022) identified two significant SNP signals on chromosome C07 associated with branch trait in three environments.
Increasing the yield potential is a major goal for rapeseed breeding. We identified SNPs linked with yield and yield components of which several were stable over years and unique to this study. We identified 10 significant association signals for each THSW and SNPS traits that were stable across 2 of 3 years under drought stress conditions. Among the linked SNPs, 37 associated with two or more traits. Our pleiotropic SNP Bn-A02-p3539297 affecting both DTF and DTSD traits in our study has also been detected in a GWAS in the Xu et al. (2016) study. The position of the pleiotropic SNP Bn-A10-p13390065 affected DTF and DTSD in our study was close to the position of four flowering time-related genes (BnaA10g18420D, BnaA10g18480D, BnaA10g22080D, and BnaA10g24300D) identified in the Helal et al. (2021) study. Markers stable over environments and those with pleiotropic effects are preferred for use in marker-assisted selection (MAS) programs. According to the SNP-trait associations, we identified 188 SNPs for SY of which the SNPs in the 34,329-kbps–34,381-kbps interval on chromosome C06 were adjacent to the position of previously reported SNPs associated with yield components (Pal et al., 2021). In addition, the SNP Bn-A08-p14538807 on chromosome A08 was close to the SNP Chr18:12100271 detected for siliqua length in Pal et al. (2021). The SNPs in the 131-kbps–677-kbps interval on chromosome C01 overlapped with the position of the linked SNPs detected by Zhang et al. (2011) and Dong et al. (2018). In this study, 38 SNPs for HI were identified under two irrigation regimes across 3 years of which the SNPs Bn-scaff_16361_1-p2541607 and Bn-scaff_16361_1-p2545776 on chromosome C08 were close to the SNP Chr18:33618188 detected for HI in Qin et al. (2022).
4.3 Candidate genes involved in rapeseed growth under drought stress
Information about genetic control of architecture- and phenology-related characters helps in breeding for drought tolerance and avoidance. Integration of GWAS and RNA-seq revealed 59 DEGs associated with flowering and maturity times of which the LOX4, GDSL, FAR1, NCED9, CCR2, RALFL14, DEFL7, ORYZASIN1, LAX2, FY, AGL15, AGL16, and AGL19 genes were key flowering and maturity genes in our study. In the hormone pathway, the LOX4, NCED9, ORYZASIN1, and LAX2 genes play important roles in flower development and pollen tube growth (Caldelari et al., 2011; Chauvin et al., 2013; Huang and Han, 2014; Gomez et al., 2015; Li et al., 2018; Zuniga-Mayo et al., 2018; Park et al., 2019; Tran et al., 2023; Zhang et al., 2023d). From the auxin carrier AUX/LAX family, LAX2 regulates the floral organ development by modulating auxin polar transport (Cardarelli and Cecchetti, 2014). Auxin, which is required for floral meristem initiation, regulates floral organ initiation, growth, and patterning that ensure reproductive success of the mature flower (Iqbal et al., 2017). In the present study, we also identified three members of MADS-box genes, AGL15, AGL16, and AGL19, that were involved in flowering and maturity in rapeseed. FAR1, CCR2, AGL15, AGL16, and AGL19 regulate several events during pollen development such as tapetal degradation, the formation of anther cuticle and pollen exine, central vacuole development, and flowering transition (Fang and Fernandez, 2002; Lee and Lee, 2010; Whittaker and Dean, 2017; Ma et al., 2020; Zhao et al., 2020; Li et al., 2021; Chen et al., 2022). It has been shown that FAR1 involved in floral bud differentiation interacts with proteins of flowering promoting SQUAMOSA-PROMOTER BINDING PROTEIN-LIKE (SPL) transcription factors (Xie et al., 2020). FAR1 is even involved in branching regulation and floral bud sex differentiation (Hiraoka et al., 2013). Plant GDSL lipases form a large gene family, and members have been identified in Arabidopsis (105), Oryza sativa (114), and Brassica rapa L. (121) (Lai et al., 2017; Shen et al., 2022), which regulate seed development (Ma et al., 2018; Ding et al., 2019; Zhang et al., 2020; Liu et al., 2023).
Seven DEGs including TIFY9, GH3.12, and PAO1 were identified as the candidate genes of plant height in the present study. TIFY genes play an important role in leaf and stem growth and responses to environmental stresses (Vanholme et al., 2007; Cai et al., 2014; Baekelandt et al., 2018; Liu et al., 2020a; Singh and Mukhopadhyay, 2021). The overexpression of TIFY1 in Arabidopsis resulted in elongated petioles and hypocotyls due to increased cell elongation (Shikata et al., 2004). Previous studies have shown that the BrGH3.12, one of the CGs identified in our study, was highly expressed in the leaf apical region, which regulate flowering in B. rapa (Gu et al., 2017). It has been shown that upregulation of BnaC03.GH3-12 may improve stress tolerance ability in B. napus (Wang et al., 2019). Polyamine oxidase (PAO) has been detected in many actively growing tissues (roots, stems, leaves, and floral organs) and plays a key role in maintaining normal growth and resisting the adverse environmental stresses in plants (Murray Stewart et al., 2018; Yu et al., 2019; Wu et al., 2022b; Samanta et al., 2023).
4.4 Genes responsible for yield variation between the high- and low-yield varieties under drought conditions
The number of seeds per silique and seed size/seed weight traits are the important goals of B. napus breeding and development of new high-density seeding varieties (Zhu et al., 2023). In the present study, 10 DEGs were identified as the yield component-related CGs of which BIG GRAIN 1 (BG1) governs seed size in legume species (Ge et al., 2016) and rice (Lo et al., 2020). The expression level of BG1 and PUP10 in the high-yield varieties was higher than in low-yield varieties, which suggests that BG1 and PUP10 might positively regulate the grain yield. The BG3 gene encoding a purine permease regulates grain size via modulating cytokinin (CK) transport in rice (Xiao et al., 2019). Among the CGs detected in our study, long- and short-distance transporters including ABCG16, PUP10, and PUP21 are from the ABC transporter and PUP families that are involved in CK traffic (Gillissen et al., 2000; Tsai et al., 2012; Xiao et al., 2019; Zhao et al., 2019; Liu et al., 2020b).
We identified CYP78A9 and CYP79B1 as two members of the CYP family genes that play highly conserved roles in facilitating organ growth including floral organ, seeds, embryos, and endosperm in Arabidopsis, maize, soybean, and rice (Sotelo-Silveira et al., 2013; Wang et al., 2015b; Xu et al., 2015; Sun et al., 2017; Yeon et al., 2021). Shi et al. (2019) reported that the expression level of BnaA9.CYP78A9 in silique valves of the long-silique variety was much higher than that in the regular-silique variety and that the long-silique plants showed higher concentrations of auxin in the developing silique, suggesting that BnaA9.CYP78A9 contributes to the silique elongation phase in rapeseed.
The expression level of cullin-associated NEDD8-dissociated protein 1 (CAND1) and developmentally regulated G-protein 3 (DRG3) genes associated with yield components in our study was much higher in seed than in leaf of high-yield varieties. One of the critical elements of plant reproduction is the production of functional pollen grains. The expression of CAND1 which is one of the key regulators of the SKP1-CUL1/RBX1-F-BOX (SCF) complex is imperative for fertility (Feng et al., 2004; Li et al., 2022; Rani et al., 2023). CAND1 regulates the dynamic and functionality of the SCF complex, which is required for pollen and grain development) Hong et al., 2014(. Analysis of the cand1-3 mutants in the Li et al. (2022) study has shown that CUL1 from the SCF complex was expressed in pollen at a level significantly higher than any other tissue in Arabidopsis that could be due to the high concentration of the SCF substrates in pollen. DRG3, one of the CGs in our study, is a member of the family of GTP binding protein (G-proteins). G-proteins regulate plant growth and development pathways especially phytohormone signaling and cross-talk and defense responses (Kumar et al., 2014; Pandey, 2020). G-proteins are also known to regulate key agronomical traits such as seed size and yield (Cui et al., 2020). Roy Choudhury et al. (2014) identified the correlation between plant-specific G protein expression in seed tissue with higher seed size, seed mass, and seed number per plant, effectively resulting in significantly higher seed yield in Camelina sativa.
4.5 Candidate genes associated with enhanced drought tolerance in rapeseed
Breeding drought-tolerant rapeseed has always been a tough challenge for plant breeders. The use of grain yield as a selection criterion has proved to be a boon in this area of research. In addition, understanding response to drought stress in high-yielding crops at the molecular level is useful for developing drought tolerance. In this study, we found the XTH13, SDP1, SRK2F, ABCF1, ERF113 genes that were upregulated in the high-yield varieties under drought conditions. Xyloglucan endotransglucosylase/hydrolase (XTH) is one of the critical enzymes which contribute to the development and strengthening of cell walls (Shi et al., 2015). The constitutive expression of XTH that increased stomatal closures was conferred by the increased cell-wall remodeling activity of XTH in guard cells, which may reduce transpirational water loss in response to dehydration stress (Choi et al., 2011; Han et al., 2017). In plants, the SnRK family comprises 38 members, which can be subdivided into three subfamilies: SnRK1, SnRK2, and SnRK3. Compelling evidence suggests that SnRK2s are involved in ABA and/or stress signaling pathways. The SnRK2 protein kinase is a central regulator of abscisic acid (ABA)-dependent stomatal closure (Kamiyama et al., 2021; Hasan et al., 2022). Some SnRK2 are also activated by hyperosmotic stress (Julkowska et al., 2015; Hasan et al., 2022). ERF113 is a member of the ethylene response factor (ERF) family that is induced by salt stress and drought stresses (Debbarma et al., 2019). Additionally, ERF113 transcription is responsive to jasmonic acid, salicylic acid, ABA, and ethylene hormones for stress tolerance (Krishnaswamy et al., 2011). In the Fang et al. (2022) study, transgenic soybean plants overexpressing ERF113 showed significantly slower water loss in the leaves than wild type and plants with RNAi silencing of the gene under drought stress. These results reveal that the XTH13, SDP1, SRK2F, ABCF1, and ERF113 genes identified in our study might improve drought tolerance in rapeseed, providing a theoretical basis for the molecular breeding of drought-tolerant varieties.
5 Conclusion
In the present study, multiomics analysis with the use of phenotypic, genomic, and transcriptomic data was performed to identify the major QTNs/genes associated with the plant responses to the effects of drought stress in rapeseed. We found high variation and linked SNPs for agronomic and seed yield-related traits that can be used in marker-assisted breeding (MAB) and development of improved rapeseed varieties with high yield under drought stress conditions. Two SNPs (Bn-scaff_18936_1-p610540 and Bn-scaff_18936_1-p472353) on chromosome C03 explained 43.65% and 42.99% of the phenotypic variance of ripening time, which is an important drought-adaptive trait. There were 10 drought tolerance-related genomic regions located on chromosome A02 (750,194 bp–791,056 bp) that had not been reported in previous studies in rapeseed. Four novel SNPs on chromosome C04 for plant weight were located within the sequence of the drought tolerance-related gene ABCG16, and their pleiotropic effects on seed weight per plant and seed yield were characterized. The GWAS analysis showed that 49 pleiotropic SNPs on chromosomes A01, A02, A08, A10, C03, and C04 were associated with at least two traits and 10 SNPs had a stable association with thousand seed weight overs 2 years under drought stress conditions. Overall, our study provides supporting information for three research areas. One is an irrigation treatment by trait value interaction and the interrelationship of novel candidate genes and drought-adaptive traits that help to unravel the drought tolerance mechanisms in rapeseed. The other is comparative transcriptomics that proved that seed weight/plant and plant weight at the phenotypic level and stress signaling pathway genes at the molecular level had higher contributions in response to the high-yield varieties to drought stress. The third is a large SNP data set correlated with drought tolerance, which will accelerate future efforts aiming at the development of drought-tolerant varieties through a MAS program.
Data availability statement
The datasets presented in this study can be found in online repositories. The names of the repository/repositories and accession number(s) can be found in the article/Supplementary Material.
Author contributions
MS: Investigation, Writing – original draft, Data curation, Formal analysis, Methodology, Software. BH: Investigation, Writing – original draft, Conceptualization, Project administration, Supervision, Visualization, Writing – review & editing. BA: Investigation, Methodology, Writing – review & editing. JB: Data curation, Investigation, Methodology, Writing – review & editing. JW: Data curation, Investigation, Visualization, Writing – review & editing. XT: Data curation, Investigation, Visualization, Writing – review & editing. AD: Writing – review & editing. CR: Visualization, Writing – review & editing.
Funding
The author(s) declare that no financial support was received for the research, authorship, and/or publication of this article.
Conflict of interest
The authors declare that the research was conducted in the absence of any commercial or financial relationships that could be construed as a potential conflict of interest.
The author(s) declared that they were an editorial board member of Frontiers, at the time of submission. This had no impact on the peer review process and the final decision.
Publisher’s note
All claims expressed in this article are solely those of the authors and do not necessarily represent those of their affiliated organizations, or those of the publisher, the editors and the reviewers. Any product that may be evaluated in this article, or claim that may be made by its manufacturer, is not guaranteed or endorsed by the publisher.
Supplementary material
The Supplementary Material for this article can be found online at: https://www.frontiersin.org/articles/10.3389/fpls.2024.1342359/full#supplementary-material
References
Akhatar, J., Goyal, A., Kaur, N., Atri, C., Mittal, M., Singh, M. P., et al. (2021). Genome wide association analyses to understand genetic basis of flowering and plant height under three levels of nitrogen application in Brassica juncea (L.) Czern and Coss. Sci. Rep. 11, 4278. doi: 10.1038/s41598-021-83689-w
Alemu, A., Brazauskas, G., Gaikpa, D. S., Henriksson, T., Islamov, B., Jorgensen, L. N., et al. (2021). Genome-wide association analysis and genomic prediction for adult-plant resistance to Septoria tritici blotch and powdery mildew in winter wheat. Front. Genet. 12. doi: 10.3389/fgene.2021.661742
Baekelandt, A., Pauwels, L., Wang, Z., Li, N., De Milde, L., Natran, A., et al. (2018). Arabidopsis leaf flatness is regulated by PPD2 and NINJA through repression of CYCLIN D3 genes. Plant Physiol. 178, 217–232. doi: 10.1104/pp.18.00327
Barrett, J. C., Fry, B., Maller, J. D. M. J., Daly, M. J. (2005). Haploview: analysis and visualization of LD and haplotype maps. Bioinformatics 21, 263–265. doi: 10.1093/bioinformatics/bth457
Bernardo, R. (2008). Molecular markers and selection for complex traits in plants: Learning from the last 20 years. Crop Sci. 48, 164916–164964. doi: 10.2135/cropsci2008.03.0131
Bird, K. A., An, H., Gazave, E., Gore, M. A., Pires, J. C., Robertson, L. D., et al. (2017). Population structure and phylogenetic relationships in a diverse panel of Brassica rapa L. Front. Plant Sci. 8. doi: 10.3389/fpls.2017.00321
Bradbury, P. J., Zhang, Z., Kroon, D. E., Casstevens, T. M., Ramdoss, Y., Buckler, E. S. (2007). TASSEL: software for association mapping of complex traits in diverse samples. Bioinformatics 23, 2633–2635. doi: 10.1093/bioinformatics/btm308
Burton, G. W. (1952). “Quantitative inheritance in grasses,” in Proceedings of the 454 International Grassland Congress, Vol. 1 (State College, PA: Pennsylvania State College), 277–283.
Cai, G., Yang, Q., Chen, H., Yang, Q., Zhang, C., Fan, C., et al. (2016). Genetic dissection of plant architecture and yield-related traits in Brassica napus. Sci. Rep. 6, 21625. doi: 10.1038/srep21625
Cai, Q., Yuan, Z., Chen, M., Yin, C., Luo, Z., Zhao, X., et al. (2014). Jasmonic acid regulates spikelet development in rice. Nat. Commun. 5, 3476. doi: 10.1038/ncomms4476
Caldelari, D., Wang, G., Farmer, E. E., Dong, X. (2011). Arabidopsis lox3 lox4 double mutants are male sterile and defective in global proliferative arrest. Plant Mol. Biol. 75, 25–33. doi: 10.1007/s11103-010-9701-9
Cardarelli, M., Cecchetti, V. (2014). Auxin polar transport in stamen formation and development: how many actors? Front. Plant Sci. 5. doi: 10.3389/fpls.2014.00333
Castelan-Munoz, N., Herrera, J., Cajero-Sanchez, W., Arrizubieta, M., Trejo, C., Garcia-Ponce, B., et al. (2019). MADS-box genes are key components of genetic regulatory networks involved in abiotic stress and plastic developmental responses in plants. Front. Plant Sci. 10. doi: 10.3389/fpls.2019.00853
Chalhoub, B., Denoeud, F., Liu, S., Parkin, I. A., Tang, H., Wang, X., et al. (2014). Early allopolyploid evolution in the post-Neolithic Brassica napus oilseed genome. Science 345, 950–953. doi: 10.1126/science.1253435
Chauvin, A., Caldelari, D., Wolfender, J. L., Farmer, E. E. (2013). Four 13-lipoxygenases contribute to rapid jasmonate synthesis in wounded Arabidopsis thaliana leaves: a role for lipoxygenase 6 in responses to long-distance wound signals. New Phytol. 197, 566–575. doi: 10.1111/nph.12029
Chen, W. H., Lin, P. T., Hsu, W. H., Hsu, H. F., Li, Y. C., Tsao, C. W., et al. (2022). Regulatory network for FOREVER YOUNG FLOWER-like genes in regulating Arabidopsis flower senescence and abscission. Commun. Biol. 5, 662. doi: 10.1038/s42003-022-03629-w
Choi, J. Y., Seo, Y. S., Kim, S. J., Kim, W. T., Shin, J. S. (2011). Constitutive expression of CaXTH3, a hot pepper xyloglucan endotransglucosylase/hydrolase, enhanced tolerance to salt and drought stresses without phenotypic defects in tomato plants (Solanum lycopersicum cv. Dotaerang). Plant Cell Rep. 30, 867–877. doi: 10.1007/s00299-010-0989-3
Cui, Y., Jiang, N., Xu, Z., Xu, Q. (2020). Heterotrimeric G protein are involved in the regulation of multiple agronomic traits and stress tolerance in rice. BMC Plant Biol. 20, 1–13. doi: 10.1186/s12870-020-2289-6
Debbarma, J., Sarki, Y. N., Saikia, B., Boruah, H. P. D., Singha, D. L., Chikkaputtaiah, C. (2019). Ethylene response factor (ERF) family proteins in abiotic stresses and CRISPR–Cas9 genome editing of ERFs for multiple abiotic stress tolerance in crop plants: a review. Mol. Biotechnol. 61, 153–172. doi: 10.1007/s12033-018-0144-x
Ding, L. N., Guo, X. J., Li, M., Fu, Z. L., Yan, S. Z., Zhu, K. M., et al. (2019). Improving seed germination and oil contents by regulating the GDSL transcriptional level in Brassica napus. Plant Cell Rep. 38, 243–253. doi: 10.1007/s00299-018-2365-7
Dodig, D., Zoric, M., Knezevic, D., King, S. R., Surlan-Momirovic, G. (2008). Genotype × environment interaction for wheat yield in different drought stress conditions and agronomic traits suitable for selection. Aust. J. Agric. Res. 59, 536–545. doi: 10.1071/AR07281
Dong, H., Tan, C., Li, Y., He, Y., Wei, S., Cui, Y., et al. (2018). Genome-wide association study reveals both overlapping and independent genetic loci to control seed weight and silique length in Brassica napus. Front. Plant Sci. 9. doi: 10.3389/fpls.2018.00921
Dong, Z., Tang, M., Cui, X., Zhao, C., Tong, C., Liu, Y., et al. (2022). Integrating GWAS, linkage mapping and gene expression analyses reveal the genetic control of first branch height in Brassica napus L. Front. Plant Sci. 13. doi: 10.3389/fpls.2022.1080999
Earl, D. A., VonHoldt, B. M. (2011). STRUCTURE HARVESTER: a website and a program for vizualizing STRUCTURE output and implementing the Evanno method. Conserv. Genet. Resour. 4, 359–361. doi: 10.1007/s12686-011-9548-7
Elferjani, R., Soolanayakanahally, R. (2018). Canola responses to drought, heat, and combined stress: shared and specific effects on carbon assimilation, seed yield, and oil composition. Front. Plant Sci. 9. doi: 10.3389/fpls.2018.01224
Evanno, G., Regnaut, S., Goudet, J. (2005). Detecting the number of clusters of individuals using the software STRUCTURE: a simulation study. Mol. Ecol. 14, 2611–2620. doi: 10.1111/j.1365-294X.2005.02553.x
Fang, S. C., Fernandez, D. E. (2002). Effect of regulated overexpression of the MADS domain factor AGL15 on flower senescence and fruit maturation. Plant Physiol. 130, 78–89. doi: 10.1104/pp.004721
Fang, X., Ma, J., Guo, F., Qi, D., Zhao, M., Zhang, C., et al. (2022). The AP2/ERF GmERF113 positively regulates the drought response by activating GmPR10-1 in soybean. Int. J. Mol. Sci. 23, 8159. doi: 10.3390/ijms23158159
Fang, C., Wu, S., Li, Z., Pan, S., Wu, Y., An, X., et al. (2023). A systematic investigation of lipid transfer proteins involved in male fertility and other biological processes in maize. Int. J. Mol. Sci. 24, 1660. doi: 10.3390/ijms24021660
Food and Agriculture Organization of the United Nations (2018). Oilcrops, oils and meals market assessment. Available at: http://faostat.fao.org.
Feng, S., Shen, Y., Sullivan, J. A., Rubio, V., Xiong, Y., Sun, T. P., et al. (2004). Arabidopsis CAND1, an unmodified CUL1-interacting protein, is involved in multiple developmental pathways controlled by ubiquitin/proteasome-mediated protein degradation. Plant Cell 16, 1870–1882. doi: 10.1105/tpc.021949
Fordonski, G., Pszczokowska, A., Okorski, A., Olszewski, J., Zaluski, D., Gorzkowska, A. (2016). The yield and chemical composition of winter oilseed rape seeds depending on different nitrogen fertilization doses and the preceding crop. J. Elem. 21, 1225–1234. doi: 10.5601/jelem.2016.21.2.1122
Gabriel, S. B., Schaffner, S. F., Nguyen, H., Moore, J. M., Roy, J., Blumenstiel, B., et al. (2002). The structure of haplotype blocks in the human genome. Science 296, 2225–2229. doi: 10.1126/science.1069424
Gao, X., Zhang, J., Li, J., Wang, Y., Zhang, R., Du, H., et al. (2022). The phosphoproteomic and interactomic landscape of qGL3/OsPPKL1-mediated brassinosteroid signaling in rice. Plant J. 109, 1048–1063. doi: 10.1111/tpj.15613
Gazave, E., Tassone, E. E., Ilut, D. C., Wingerson, M., Datema, E., Witsenboer, H. M., et al. (2016). Population genomic analysis reveals differential evolutionary histories and patterns of diversity across subgenomes and subpopulations of Brassica napus L. Front. Plant Sci. 7. doi: 10.3389/fpls.2016.00525
Ge, L., Yu, J., Wang, H., Luth, D., Bai, G., Wang, K., et al. (2016). Increasing seed size and quality by manipulating BIG SEEDS1 in legume species. Proc. Natl. Acad. Sci. 113, 12414–12419. doi: 10.1073/pnas.1611763113
Gillissen, B., Burkle, L., Andre, B., Kuhn, C., Rentsch, D., Brandl, B., et al. (2000). A new family of high-affinity transporters for adenine, cytosine, and purine derivatives in Arabidopsis. Plant Cell 12, 291–300. doi: 10.1105/tpc.12.2.291
Gomez, J. F., Talle, B., Wilson, Z. A. (2015). Anther and pollen development: a conserved developmental pathway. J. Integr. Plant Biol. 57, 876–891. doi: 10.1111/jipb.12425
Gu, A., Meng, C., Chen, Y., Wei, L., Dong, H., Lu, Y., et al. (2017). Coupling Seq-BSA and RNA-Seq analyses reveal the molecular pathway and genes associated with heading type in Chinese cabbage. Front. Genet. 8. doi: 10.3389/fgene.2017.00176
Han, Y., Han, S., Ban, Q., He, Y., Jin, M., Rao, J. (2017). Overexpression of persimmon DkXTH1 enhanced tolerance to abiotic stress and delayed fruit softening in transgenic plants. Plant Cell Rep. 36, 583–596. doi: 10.1007/s00299-017-2105-4
Han, X., Tang, Q., Xu, L., Guan, Z., Tu, J., Yi, B., et al. (2022). Genome-wide detection of genotype environment interactions for flowering time in Brassica napus. Front. Plant Sci. 13. doi: 10.3389/fpls.2022.1065766
Haq, T., Ali, A., Nadeem, S. M., Maqbool, M. M., Ibrahim, M. (2014). Performance of canola cultivars under drought stress induced by withholding irrigation at different growth stages. Soil Environ. 33, 43–50.
Hasan, M. M., Liu, X. D., Waseem, M., Guang-Qian, Y., Alabdallah, N. M., Jahan, M. S., et al. (2022). ABA activated SnRK2 kinases: An emerging role in plant growth and physiology. Plant Signal. Behav. 17, 2071024. doi: 10.1080/15592324.2022.2071024
Hatzig, S. V., Nuppenau, J. N., Snowdon, R. J., Schießl, S. V. (2018). Drought stress has transgenerational effects on seeds and seedlings in winter oilseed rape (Brassica napus L.). BMC Plant Biol. 18, 1–13. doi: 10.1186/s12870-018-1531-y
Helal, M. M. U., Gill, R. A., Tang, M., Yang, L., Hu, M., Yang, L., et al. (2021). SNP-and haplotype-based GWAS of flowering-related traits in Brassica napus. Plants 10, 2475. doi: 10.3390/plants10112475
Hiraoka, K., Yamaguchi, A., Abe, M., Araki, T. (2013). The florigen genes FT and TSF modulate lateral shoot outgrowth in Arabidopsis thaliana. Plant Cell Physiol. 54, 352–368. doi: 10.1093/pcp/pcs168
Hong, M. J., Kim, D. Y., Seo, Y. W. (2014). Cullin, a component of the SCF complex, interacts with TaRMD5 during wheat spike development. Biol. Plant 58, 218–230. doi: 10.1007/s10535-013-0383-4
Hu, J., Chen, B., Zhao, J., Zhang, F., Xie, T., Xu, K., et al. (2022). Genomic selection and genetic architecture of agronomic traits during modern rapeseed breeding. Nat. Genet. 54, 694–704. doi: 10.1038/s41588-022-01055-6
Huang, X., Han, B. (2014). Natural variations and genome-wide association studies in crop plants. Annu. Rev. Plant Boil. 65, 531–551. doi: 10.1146/annurev-arplant-050213-035715
Hubisz, M. J., Falush, D., Stephens, M., Pritchard, J. K. (2009). Inferring weak population structure with the assistance of sample group information. Mol. Ecol. Resour. 9, 1322–1332. doi: 10.1111/j.1755-0998.2009.02591.x
Huerta-Cepas, J., Forslund, K., Coelho, L. P., Szklarczyk, D., Jensen, L. J., Von Mering, C., et al. (2017). Fast genome-wide functional annotation through orthology assignment by eggNOG-mapper. Mol. Biol. Evol. 34, 2115–2122. doi: 10.1093/molbev/msx148
Iqbal, N., Khan, N. A., Ferrante, A., Trivellini, A., Francini, A., Khan, M. I. R. (2017). Ethylene role in plant growth, development and senescence: interaction with other phytohormones. Front. Plant Sci. 8. doi: 10.3389/fpls.2017.00475
Julkowska, M. M., McLoughlin, F., Galvan-Ampudia, C. S., Rankenberg, J. M., Kawa, D., Klimecka, M., et al. (2015). Identification and functional characterization of the Arabidopsis Snf 1-related protein kinase SnRK 2.4 phosphatidic acid-binding domain. Plant Cell Environ. 38, 614–624. doi: 10.1111/pce.12421
Kamiyama, Y., Hirotani, M., Ishikawa, S., Minegishi, F., Katagiri, S., Rogan, C. J., et al. (2021). Arabidopsis group C Raf-like protein kinases negatively regulate abscisic acid signaling and are direct substrates of SnRK2. Proc. Natl. Acad. Sci. 118, e2100073118. doi: 10.1073/pnas.2100073118
Khan, S., Anwar, S., Kuai, J., Noman, A., Shahid, M., Din, M., et al. (2018). Alteration in yield and oil quality traits of winter rapeseed by lodging at different planting density and nitrogen rates. Sci. Rep. 8, 1–12. doi: 10.1038/s41598-017-18734-8
Khanzada, H., Wassan, G. M., He, H., Mason, A. S., Keerio, A. A., Khanzada, S., et al. (2020). Differentially evolved drought stress indices determine the genetic variation of Brassica napus at seedling traits by genome-wide association mapping. J. Adv. Res. 24, 447–461. doi: 10.1016/j.jare.2020.05.019
Kirkegaard, J. A., Lilley, J. M., Brill, R. D., Ware, A. H., Walela, C. K. (2018). The critical period for yield and quality determination in canola (Brassica napus L.). Field Crops Res. 222, 180–188. doi: 10.1016/j.fcr.2018.03.018
Klepikova, A. V., Kasianov, A. S., Gerasimov, E. S., Logacheva, M. D., Penin, A. A. (2016). A high resolution map of the Arabidopsis thaliana developmental transcriptome based on RNA-seq profiling. Plant J. 88, 1058–1070. doi: 10.1111/tpj.13312
Koh, J. C., Barbulescu, D. M., Norton, S., Redden, B., Salisbury, P. A., Kaur, S., et al. (2017). A multiplex PCR for rapid identification of Brassica species in the triangle of U. Plant Methods 13, 1–8. doi: 10.1186/s13007-017-0200-8
Korber, N., Bus, A., Li, J., Parkin, I. A., Wittkop, B., Snowdon, R. J., et al. (2016). Agronomic and seed quality traits dissected by genome-wide association mapping in Brassica napus. Front. Plant Sci. 7. doi: 10.3389/fpls.2016.00386
Krishnaswamy, S., Verma, S., Rahman, M. H., Kav, N. N. (2011). Functional characterization of four APETALA2-family genes (RAP2.6, RAP2.6L, DREB19 and DREB26) in Arabidopsis. Plant Mol. Biol. 75, 107–127. doi: 10.1007/s11103-010-9711-7
Kumar, R., Arya, G. C., Bisht, N. C. (2014). Differential expression and interaction specificity of the heterotrimeric G-protein family in Brassica nigra reveal their developmental-and condition-specific roles. Plant Cell Physiol. 55, 1954–1968. doi: 10.1093/pcp/pcu126
Kyung, J., Jeon, M., Lee, I. (2022). Recent advances in the chromatin-based mechanism of FLOWERING LOCUS C repression through autonomous pathway genes. Front. Plant Sci. 13. doi: 10.3389/fpls.2022.964931
Lai, C. P., Huang, L. M., Chen, L. F. O., Chan, M. T., Shaw, J. F. (2017). Genome-wide analysis of GDSL-type esterases/lipases in Arabidopsis. Plant Mol. Biol. 95, 181–197. doi: 10.1007/s11103-017-0648-y
Lee, J., Lee, I. (2010). Regulation and function of SOC1, a flowering pathway integrator. J. Exp. Bot. 61, 2247–2254. doi: 10.1093/jxb/erq098
Li, L., Garsamo, M., Yuan, J., Wang, X., Lam, S. H., Varala, K., et al. (2022). CAND1 is required for pollen viability in Arabidopsis thaliana—a test of the adaptive exchange hypothesis. Front. Plant Sci. 13. doi: 10.3389/fpls.2022.866086
Li, Y., Tao, H., Zhang, B., Huang, S., Wang, P. (2018). Timing of water deficit limits maize kernel setting in association with changes in the source-flow-sink relationship. Front. Plant Sci. 9. doi: 10.3389/fpls.2018.01326
Li, Y., Zhang, L., Hu, S., Zhang, J., Wang, L., Ping, X., et al. (2021). Transcriptome and proteome analyses of the molecular mechanisms underlying changes in oil storage under drought stress in. Brassica napus L. Gcb Bioenergy 13, 1071–1086. doi: 10.1111/gcbb.12833
Liu, X., Huang, M., Fan, B., Buckler, E. S., Zhang, Z. (2016). Iterative usage of fixed and random effect models for powerful and efficient genome-wide association studies. PloS Genet. 12, e1005767. doi: 10.1371/journal.pgen.1005767
Liu, J., Liu, J., Wang, H., Khan, A., Xu, Y., Hou, Y., et al. (2023). Genome wide identification of GDSL gene family explores a novel GhirGDSL26 gene enhancing drought stress tolerance in cotton. BMC Plant Biol. 23, 1–18. doi: 10.1186/s12870-022-04001-0
Liu, K., Muse, S. V. (2005). PowerMarker: an integrated analysis environment for genetic marker analysis. Bioinformatics 21, 2128–2129. doi: 10.1093/bioinformatics/bti282
Liu, L., Tong, H., Xiao, Y., Che, R., Xu, F., Hu, B., et al. (2015). Activation of Big Grain1 significantly improves grain size by regulating auxin transport in rice. Proc. Natl. Acad. Sci. 112, 11102–11107. doi: 10.1073/pnas.1512748112
Liu, H., Wang, J., Zhang, B., Yang, X., Hammond, J. P., Ding, G., et al. (2021). Genome-wide association study dissects the genetic control of plant height and branch number in response to low-phosphorus stress in Brassica napus. Ann. Bot. 128, 919–930. doi: 10.1093/aob/mcab115
Liu, L., Zhao, L., Chen, P., Cai, H., Hou, Z., Jin, X., et al. (2020b). ATP binding cassette transporters ABCG1 and ABCG16 affect reproductive development via auxin signaling in Arabidopsis. Plant J. 102, 1172–1186. doi: 10.1111/tpj.14690
Liu, X., Zhao, C., Yang, L., Zhang, Y., Wang, Y., Fang, Z., et al. (2020a). Genome-wide identification, expression profile of the TIFY gene family in Brassica oleracea var. capitata, and their divergent response to various pathogen infections and phytohormone treatments. Genes 11, 127. doi: 10.3390/genes11020127
Lo, S. F., Cheng, M. L., Hsing, Y. I. C., Chen, Y. S., Lee, K. W., Hong, Y. F., et al. (2020). Rice Big Grain 1 promotes cell division to enhance organ development, stress tolerance and grain yield. J. Plant Biotechnol. 18, 1969–1983. doi: 10.1111/pbi.13357
Lu, K., Peng, L., Zhang, C., Lu, J., Yang, B., Xiao, Z., et al. (2017). Genome-wide association and transcriptome analyses reveal candidate genes underlying yield-determining traits in Brassica napus. Front. Plant Sci. 8. doi: 10.3389/fpls.2017.00206
Lu, K., Xiao, Z., Jian, H., Peng, L., Qu, C., Fu, M., et al. (2016). A combination of genome-wide association and transcriptome analysis reveals candidate genes controlling harvest index-related traits in Brassica napus. Sci. Rep. 6, 36452. doi: 10.1038/srep36452
Luo, X., Ding, Y., Zhang, L., Yue, Y., Snyder, J. H., Ma, C., et al. (2017). Genomic prediction of genotypic effects with epistasis and environment interactions for yield-related traits of rapeseed (Brassica napus L.). Front. Genet. 8. doi: 10.3389/fgene.2017.00015
Lush, J. L. (1949). “Heritability of quantitative characters in farm animals,” in Heritability of Quantitative Characters in Farm Animals (CABI, Wallingford, UK), 356–375. doi: 10.1111/j.1601-5223.1949.tb03347.x
Ma, X., Chen, Y., Liu, M., Xue, X., Zhang, X., Xu, L., et al. (2022). Genome-wide analysis of the XTH gene family and functional analysis of DlXTH23.5/25 during early longan somatic embryogenesis. Front. Plant Sci. 13. doi: 10.3389/fpls.2022.1043464
Ma, M., Wang, Q., Li, Z., Cheng, H., Li, Z., Liu, X., et al. (2015). Expression of TaCYP78A3, a gene encoding cytochrome P450 CYP78A3 protein in wheat (Triticum aestivum L.), affects seed size. Plant J. 83, 312–325. doi: 10.1111/tpj.12896
Ma, J. Q., Xu, W., Xu, F., Lin, A., Sun, W., Jiang, H. H., et al. (2020). Differential alternative splicing genes and isoform regulation networks of rapeseed (Brassica napus L.) infected with Sclerotinia sclerotiorum. Genes 11, 784. doi: 10.3390/genes11070784
Ma, R., Yuan, H., An, J., Hao, X., Li, H. (2018). A Gossypium hirsutum GDSL lipase/hydrolase gene (GhGLIP) appears to be involved in promoting seed growth in Arabidopsis. PloS One 13, e0195556. doi: 10.1371/journal.pone.0195556
Marguerat, S., Bahler, J. (2010). RNA-seq: from technology to biology. Cell. Mol. Life Sci. 67, 569–579. doi: 10.1007/s00018-009-0180-6
Marjanovic-Jeromela, A., Terzic, S., Jankulovska, M., Zoric, M., Kondic-Spika, A., Jockovic, M., et al. (2019). Dissection of year related climatic variables and their effect on winter rapeseed (Brassica napus L.) development and yield. Agronomy 9, 517. doi: 10.3390/agronomy9090517
Martinez, D. E., Borniego, M. L., Battchikova, N., Aro, E. M., Tyystjärvi, E., Guiamet, J. J. (2015). SASP, a Senescence-Associated Subtilisin Protease, is involved in reproductive development and determination of silique number in Arabidopsis. J. Exp. Bot. 66, 161–174. doi: 10.1093/jxb/eru409
Marwede, V., Schierholt, A., Mollers, C., Becker, H. C. (2004). Genotype × environment interactions and heritability of tocopherol contents in canola. Crop Sci. 44, 728–731. doi: 10.2135/cropsci2004.7280
Matar, S., Kumar, A., Holtgrawe, D., Weisshaar, B., Melzer, S. (2021). The transition to flowering in winter rapeseed during vernalization. Plant Cell Environ. 44, 506–518. doi: 10.1111/pce.13946
McGill, R., Tukey, J. W., Larsen, W. A. (1978). Variations of box plots. Am. Stat. 32, 12–16. doi: 10.1080/00031305.1978.10479236
Menendez, Y. C., Sanchez, D. H., Snowdon, R. J., Rondanini, D. P., Botto, J. F. (2021). Unraveling the impact on agronomic traits of the genetic architecture underlying plant-density responses in canola. J. Exp. Bot. 72, 5426–5441. doi: 10.1093/jxb/erab191
Meyer, R. S., Purugganan, M. D. (2013). Evolution of crop species: genetics of domestication and diversification. Nat. Rev. Genet. 14, 840–852. doi: 10.1038/nrg3605
Miedes, E., Suslov, D., Vandenbussche, F., Kenobi, K., Ivakov, A., Straeten., V. D. D., et al. (2013). Xyloglucan endotransglucosylase/hydrolase (XTH) overexpression affects growth and cell wall mechanics in etiolated Arabidopsis hypocotyls. J. Exp. Bot. 64, 2481–2497. doi: 10.1093/jxb/ert107
Murray, M. G., Thompson, W. (1980). Rapid isolation of high molecular weight plant DNA. Nucleic Acids Res. 8, 4321–4326. doi: 10.1093/nar/8.19.4321
Nowosad, K., Liersch, A., Popławska, W., Bocianowski, J. (2016). Genotype by environment interaction for seed yield in rapeseed (Brassica napus L.) using additive main effects and multiplicative interaction model. Euphytica 208, 187–194. doi: 10.1007/s10681-015-1620-z
Ozer, H. (2003). Sowing date and nitrogen rate effects on growth, yield and yield components of two summer rapeseed cultivars. Eur. J. Agron. 19, 453–463. doi: 10.1016/S1161-0301(02)00136-3
Pagnussat, L., Burbach, C., Baluska, F., Canal, L. D. L. (2012). An extracellular lipid transfer protein is relocalized intracellularly during seed germination. J. Exp. Bot. 63, 6555–6563. doi: 10.1093/jxb/ers311
Pal, L., Sandhu, S. K., Bhatia, D., Sethi, S. (2021). Genome-wide association study for candidate genes controlling seed yield and its components in rapeseed (Brassica napus subsp. napus). Physiol. Mol. Biol. 27, 1933–1951. doi: 10.1007/s12298-021-01060-9
Pandey, S. (2020). Plant receptor-like kinase signaling through heterotrimeric G-proteins. J. Exp. Bot. 71, 1742–1751. doi: 10.1093/jxb/eraa016
Paradis, E., Schliep, K. (2018). Ape 5.0: An environment for modern phylogenetics and evolutionary analyses in R. Bioinformatics 35, 526–528. doi: 10.1093/bioinformatics/bty633
Park, H. Y., Lee, H. T., Lee, J. H., Kim, J. K. (2019). Arabidopsis U2AF65 regulates flowering time and the growth of pollen tubes. Front. Plant Sci. 10. doi: 10.3389/fpls.2019.00569
Patel, R. K., Jain, M. (2012). NGS QC Toolkit: a toolkit for quality control of next generation sequencing data. PloS One 7, e30619. doi: 10.1371/journal.pone.0030619
Perrot, T., Pauly, M., Ramirez, V. (2022). Emerging roles of β-glucanases in plant development and adaptative responses. Plants 11, 1119. doi: 10.3390/plants11091119
Qian, L., Hickey, L. T., Stahl, A., Werner, C. R., Hayes, B., Snowdon, R. J., et al. (2017). Exploring and harnessing haplotype diversity to improve yield stability in crops. Front. Plant Sci. 8. doi: 10.3389/fpls.2017.01534
Qin, M., Song, J., Guo, N., Zhang, M., Zhu, Y., Huang, Z., et al. (2022). Genome-wide association analyses reveal candidate genes controlling harvest index and related agronomic traits in Brassica napus L. Agronomy 12, 814. doi: 10.3390/agronomy12040814
Raboanatahiry, N., Chao, H., Dalin, H., Pu, S., Yan, W., Yu, L., et al. (2018). QTL alignment for seed yield and yield related traits in Brassica napus. Front. Plant Sci. 9, 1127. doi: 10.3389/fpls.2018.01127
Rahman, M., Guo, Q., Baten, A., Mauleon, R., Khatun, A., Liu, L., et al. (2021). Shotgun proteomics of Brassica rapa seed proteins identifies vicilin as a major seed storage protein in the mature seed. PloS One 16, e0253384. doi: 10.1371/journal.pone.0253384
Raman, H., Raman, R., Mathews, K., Diffey, S., Salisbury, P. (2020). QTL mapping reveals genomic regions for yield based on an incremental tolerance index to drought stress and related agronomic traits in canola. Crop Pasture Sci. 71, 562–577. doi: 10.1071/CP20046
Raman, H., Raman, R., Qiu, Y., Yadav, A. S., Sureshkumar, S., Borg, L., et al. (2019). GWAS hints at pleiotropic roles for FLOWERING LOCUS T in flowering time and yield-related traits in canola. BMC Genom. 20, 1–18. doi: 10.1186/s12864-019-5964-y
Rani, V., Sengar, R. S., Garg, S. K., Mishra, P., Shukla, P. K. (2023). Physiological and molecular role of strigolactones as plant growth regulators: A review. Mol. Biotechnol. 1–27. doi: 10.1007/s12033-023-00694-2
R Core Team (2018). R: A language and environment for statistical computing (Vienna, Austria: R Foundation for Statistical Computing).
Ren, J. P., Dickson, M. H., Earle, E. D. (2000). Improved resistance to bacterial soft rot by protoplast fusion between Brassica rapa and B. oleracea. Theor. Appl. Genet. 100, 810–819. doi: 10.1007/s001220051356
Roy Choudhury, S., Riesselman, A. J., Pandey, S. (2014). Constitutive or seed-specific overexpression of Arabidopsis G-protein γ subunit 3 (AGG3) results in increased seed and oil production and improved stress tolerance in Camelina sativa. Plant Biotechnol. J. 12, 49–59. doi: 10.1111/pbi.12115
Salami, M., Heidari, B., Batley, J., Wang, J., Tan, X. L., Richards, C., et al. (2024). Integration of genome-wide association studies, metabolomics, and transcriptomics reveals phenolic acid-and flavonoid-associated genes and their regulatory elements under drought stress in rapeseed flowers. Front. Plant Sci. 14. doi: 10.3389/fpls.2023.1249142
Samanta, I., Roy, P. C., Das, E., Mishra, S., Chowdhary, G. (2023). Plant peroxisomal polyamine oxidase: A ubiquitous enzyme involved in abiotic stress tolerance. Plants 12, 652. doi: 10.3390/plants12030652
Secchi, M. A., Fernandez, J. A., Stamm, M. J., Durrett, T., Prasad, P. V., Messina, C. D., et al. (2023). Effects of heat and drought on canola (Brassica napus L.) yield, oil, and protein: A meta-analysis. Field Crops Res. 293, 108848. doi: 10.1016/j.fcr.2023.108848
Seleiman, M. F., Al-Suhaibani, N., Ali, N., Akmal, M., Alotaibi, M., Refay, Y., et al. (2021). Drought stress impacts on plants and different approaches to alleviate its adverse effects. Plants 10, 259. doi: 10.3390/plants10020259
Shah, L., Sohail, A., Ahmad, R., Cheng, S., Cao, L., Wu, W. (2022). The roles of MADS-Box genes from root growth to maturity in Arabidopsis and rice. Agronomy 12, 582. doi: 10.3390/agronomy12030582
Shahzad, A., Qian, M., Sun, B., Mahmood, U., Li, S., Fan, Y., et al. (2021). Genome-wide association study identifies novel loci and candidate genes for drought stress tolerance in rapeseed. Oil Crop Sci. 6, 12–22. doi: 10.1016/j.ocsci.2021.01.002
Shen, G., Sun, W., Chen, Z., Shi, L., Hong, J., Shi, J. (2022). Plant GDSL esterases/lipases: Evolutionary, physiological and molecular functions in plant development. Plants 11, 468. doi: 10.3390/plants11040468
Sheng, X. G., Zhao, Z. Q., Wang, J. S., Yu, H. F., Shen, Y. S., Zeng, X. Y., et al. (2019). Genome wide analysis of MADS-box gene family in Brassica oleracea reveals conservation and variation in flower development. BMC Plant Biol. 19, 1–15. doi: 10.1186/s12870-019-1717-y
Shi, J., Li, R., Zou, J., Long, Y., Meng, J. (2011). A dynamic and complex network regulates the heterosis of yield-correlated traits in rapeseed (Brassica napus L.). PloS One 6, e21645. doi: 10.1371/journal.pone.0021645
Shi, L., Song, J., Guo, C., Wang, B., Guan, Z., Yang, P., et al. (2019). A CACTA-like transposable element in the upstream region of BnaA9.CYP78A9 acts as an enhancer to increase silique length and seed weight in rapeseed. Plant J. 98, 524–539. doi: 10.1111/tpj.14236
Shi, Y. Z., Zhu, X. F., Miller, J. G., Gregson, T., Zheng, S. J., Fry, S. C. (2015). Distinct catalytic capacities of two aluminium-repressed Arabidopsis thaliana xyloglucan endotransglucosylase/hydrolases, XTH15 and XTH31, heterologously produced in Pichia. Phytochem. 112, 160–169. doi: 10.1016/j.phytochem.2014.09.020
Shikata, M., Matsuda, Y., Ando, K., Nishii, A., Takemura, M., Yokota, A., et al. (2004). Characterization of Arabidopsis ZIM, a member of a novel plant-specific GATA factor gene family. J. Exp. Bot. 55, 631–639. doi: 10.1093/jxb/erh078
Singh, P., Mukhopadhyay, K. (2021). Comprehensive molecular dissection of TIFY Transcription factors reveal their dynamic responses to biotic and abiotic stress in wheat (Triticum aestivum L.). Sci. Rep. 11, 9739. doi: 10.1038/s41598-021-87722-w
Soppe, W. J., Vinegra, D. L. T. N., Albani, M. C. (2021). The diverse roles of FLOWERING LOCUS C in annual and perennial Brassicaceae species. Front. Plant Sci. 12. doi: 10.3389/fpls.2021.627258
Sotelo-Silveira, M., Cucinotta, M., Chauvin, A. L., Chavez Montes, R. A., Colombo, L., Marsch-Martinez, N., et al. (2013). Cytochrome P450 CYP78A9 is involved in Arabidopsis reproductive development. Plant Physiol. 162, 779–799. doi: 10.1104/pp.113.218214
Stewart, T. M., Dunston, T. T., Woster, P. M., Casero, R. A. (2018). Polyamine catabolism and oxidative damage. J. Biol. Chem. 293, 18736–18745. doi: 10.1074/jbc.TM118.003337
Su, W., Wang, L., Lei, J., Chai, S., Liu, Y., Yang, Y., et al. (2017). Genome-wide assessment of population structure and genetic diversity and development of a core germplasm set for sweet potato based on specific length amplified fragment (SLAF) sequencing. PloS One 12, e0172066. doi: 10.1371/journal.pone.0172066
Sun, X., Cahill, J., Van Hautegem, T., Feys, K., Whipple, C., Novak, O., et al. (2017). Altered expression of maize PLASTOCHRON1 enhances biomass and seed yield by extending cell division duration. Nat. Commun. 8, 14752. doi: 10.1038/ncomms14752
Sun, C., Wang, B., Wang, X., Hu, K., Li, K., Li, Z., et al. (2016a). Genome-wide association study dissecting the genetic architecture underlying the branch angle trait in rapeseed (Brassica napus L.). Sci. Rep. 6, 33673. doi: 10.1038/srep33673
Sun, C., Wang, B., Yan, L., Hu, K., Liu, S., Zhou, Y., et al. (2016b). Genome-wide association study provides insight into the genetic control of plant height in rapeseed (Brassica napus L.). Front. Plant Sci. 7. doi: 10.3389/fpls.2016.01102
Supek, F., Bosnjak, M., Skunca, N., Smuc, T. (2011). REVIGO summarizes and visualizes long lists of gene ontology terms. PloS One 6, e21800. doi: 10.1371/journal.pone.0021800
Takeuchi, H., Higashiyama, T. (2012). A species-specific cluster of defensin-like genes encodes diffusible pollen tube attractants in Arabidopsis. PloS Biol. 10, e1001449. doi: 10.1371/journal.pbio.1001449
Tao, Y., Wan, J. X., Liu, Y. S., Yang, X. Z., Shen, R. F., Zhu, X. F. (2022). The NAC transcription factor ANAC017 regulates aluminum tolerance by regulating the cell wall-modifying genes. Plant Physiol. 189, 2517–2534. doi: 10.1093/plphys/kiac197
Tran, L. T., Sugimoto, K., Kasozi, M., Mitalo, O. W., Ezura, H. (2023). Pollination, pollen tube growth, and fertilization independently contribute to fruit set and development in tomato. Front. Plant Sci. 14. doi: 10.3389/fpls.2023.1205816
Tsai, Y. C., Weir, N. R., Hill, K., Zhang, W. J., Kim, H. J., Shiu, S. H., et al. (2012). Characterization of genes involved in cytokinin signaling and metabolism from rice. Plant Physiol. 158, 1666–1684. doi: 10.1104/pp.111.192765
Vanholme, B., Grunewald, W., Bateman, A., Kohchi, T., Gheysen, G. (2007). The tify family previously known as ZIM. Trends Plant Sci. 12, 239–244. doi: 10.1016/j.tplants.2007.04.004
Vollrath, P., Chawla, H. S., Schiessl, S. V., Gabur, I., Lee, H., Snowdon, R. J., et al. (2021). A novel deletion in FLOWERING LOCUS T modulates flowering time in winter oilseed rape. Theor. Appl. Genet. 134, 1217–1231. doi: 10.1007/s00122-021-03768-4
Wang, R., Li, M., Wu, X., Wang, J. (2019). The gene structure and expression level changes of the GH3 gene family in Brassica napus relative to its diploid ancestors. Genes 10, 58. doi: 10.3390/genes10010058
Wang, X. B., Li, Y. H., Zhang, H. W., Sun, G. H., Zhang, W. M., Qiu, L. J. (2015b). Evolution and association analysis of GmCYP78A10 gene with seed size/weight and pod number in soybean. Mol. Biol. Rep. 42, 489–496. doi: 10.1007/s11033-014-3792-3
Wang, L., Liang, X., Dou, S., Yi, B., Fu, T., Ma, C., et al. (2023). Two aspartic proteases, BnaAP36s and BnaAP39s, regulate pollen tube guidance in Brassica napus. Mol. Breed. 43, 27. doi: 10.1007/s11032-023-01377-1
Wang, X., Zhou, W., Lu, Z., Ouyang, Y., Yao, J. (2015a). A lipid transfer protein, OsLTPL36, is essential for seed development and seed quality in rice. Plant Sci. 239, 200–208. doi: 10.1016/j.plantsci.2015.07.016
Whittaker, C., Dean, C. (2017). The FLC locus: a platform for discoveries in epigenetics and adaptation. Annu. Rev. Cell Dev. Biol. 33, 555–575. doi: 10.1146/annurev-cellbio-100616-060546
Wickham, H. (2016). ggplot2: Elegant Graphics for Data Analysis (New York, NY, USA: Springer). doi: 10.1007/978-3-319-24277-4
Wozniak, E., Waszkowska, E., Zimny, T., Sowa, S., Twardowski, T. (2019). The rapeseed potential in Poland and Germany in the context of production, legislation, and intellectual property rights. Front. Plant Sci. 10. doi: 10.3389/fpls.2019.01423
Wu, S., Fang, C., Li, Z., Wang, Y., Pan, S., Wu, Y., et al. (2022a). ATP-Binding Cassette G Transporters and their multiple roles especially for male fertility in Arabidopsis, Rice and Maize. Int. J. Mol. Sci. 23, 9304. doi: 10.3390/ijms23169304
Wu, J., Liu, W., Jahan, M. S., Shu, S., Sun, J., Guo, S. (2022b). Characterization of polyamine oxidase genes in cucumber and roles of CsPAO3 in response to salt stress. Environ. Exp. Bot. 194, 104696. doi: 10.1016/j.envexpbot.2021.104696
Xiao, Y., Liu, H., Wu, L., Warburton, M., Yan, J. (2017). Genome-wide association studies in maize: Praise and stargaze. Mol. Plant 10, 359–374. doi: 10.1016/j.molp.2016.12.008
Xiao, Y., Liu, D., Zhang, G., Gao, S., Liu, L., Xu, F., et al. (2019). Big Grain3, encoding a purine permease, regulates grain size via modulating cytokinin transport in rice. J. Integr. Plant Biol. 61, 581–597. doi: 10.1111/jipb.12727
Xie, Y., Liu, Y., Ma, M., Zhou, Q., Zhao, Y., Zhao, B., et al. (2020). Arabidopsis FHY3 and FAR1 integrate light and strigolactone signaling to regulate branching. Nat. Commun. 11, 1955. doi: 10.1038/s41467-020-15893-7
Xu, F., Fang, J., Ou, S., Gao, S., Zhang, F., Du, L., et al. (2015). Variations in CYP78A13 coding region influence grain size and yield in rice. Plant. Cell Environ. 38, 800–811. doi: 10.1111/pce.12452
Xu, L., Hu, K., Zhang, Z., Guan, C., Chen, S., Hua, W., et al. (2016). Genome-wide association study reveals the genetic architecture of flowering time in rapeseed (Brassica napus L.). DNA Res. 23, 43–52. doi: 10.1093/dnares/dsv035
Xu, R., Li, N., Li, Y. (2019). Control of grain size by G protein signaling in rice. J. Integr. Plant Biol. 61, 533–540. doi: 10.1111/jipb.12769
Yano, K., Yamamoto, E., Aya, K., Takeuchi, H., Lo, P. C., Hu, L., et al. (2016). Genome-wide association study using whole-genome sequencing rapidly identifies new genes influencing agronomic traits in rice. Nat. Genet. 48, 927–934. doi: 10.1038/ng.3596
Yaqoob, A., Shahid, A. A., Imran, A., Sadaqat, S., Liaqat, A., Rao, A. Q. (2020). Dual functions of Expansin in cell wall extension and compression during cotton fiber development. Biol. 75, 2093–2101. doi: 10.2478/s11756-020-00514-x
Yarnia, M., Arabifard, N., Khoei, F. R., Zandi, P. (2011). Evaluation of drought tolerance indices among some winter rapeseed cultivars. Afr. J. Biotechnol. 10, 10914–10922. doi: 10.5897/AJB
Yeon, M. H., Park, C. H., Lee, Y. E., Roh, J., Kim, S. K. (2021). Seed-specifically overexpressed Arabidopsis cytochrome P450 85A2 promotes vegetative and reproductive growth and development of Arabidopsis thaliana. J. Plant Biol. 65. doi: 10.3389/fpls.2021.639508
Yosefi, M., Heidari, H. (2022). Evaluation of wheat tolerance during germination and early growth stages to detergent-contaminated water. Tenside Surfactants Deterg 1), 95–103. doi: 10.1515/tsd-2021-2380
Yu, Z., Jia, D., Liu, T. (2019). Polyamine oxidases play various roles in plant development and abiotic stress tolerance. Plants 8, 184. doi: 10.3390/plants8060184
Yu, L. H., Wu, J., Zhang, Z. S., Miao, Z. Q., Zhao, P. X., Wang, Z., et al. (2017). Arabidopsis MADS-box transcription factor AGL21 acts as environmental surveillance of seed germination by regulating ABI5 expression. Mol. Plant 10, 834–845. doi: 10.1016/j.molp.2017.04.004
Zhang, C., Gong, R., Zhong, H., Dai, C., Zhang, R., Dong, J., et al. (2023a). Integrated multi-locus genome-wide association studies and transcriptome analysis for seed yield and yield-related traits in Brassica napus. Front. Plant Sci. 14. doi: 10.3389/fpls.2023.1153000
Zhang, J., Mason, A. S., Wu, J., Liu, S., Zhang, X., Luo, T., et al. (2015). Identification of putative candidate genes for water stress tolerance in canola (Brassica napus). Front. Plant Sci. 6. doi: 10.3389/fpls.2015.01058
Zhang, X., Ran, W., Zhang, J., Ye, M., Lin, S., Li, X., et al. (2020). Genome-wide identification of the Tify gene family and their expression profiles in response to biotic and abiotic stresses in tea plants (Camellia sinensis). Int. J. Mol. Sci. 21, 8316. doi: 10.3390/ijms21218316
Zhang, X., Song, J., Wang, L., Yang, Z. M., Sun, D. (2022). Identification of a DEAD-box RNA helicase BnRH6 reveals its involvement in salt stress response in rapeseed (Brassica napus). Int. J. Mol. Sci. 24, 2. doi: 10.3390/ijms24010002
Zhang, Y., Wang, K., Wang, Z., Li, X., Li, M., Zhu, F., et al. (2023c). The lipoxygenase gene AfLOX4 of Amorpha fruticosa L. is a potential regulator of drought stress tolerance pathways under saline and alkaline conditions. Acta Physiol. Plant 45, 72. doi: 10.1007/s11738-023-03542-7
Zhang, Y., Xu, J., Li, R., Ge, Y., Li, Y., Li, R. (2023d). Plants’ Response to abiotic stress: mechanisms and strategies. Int. J. Mol. Sci. 24, 10915. doi: 10.3390/ijms241310915
Zhang, L., Yang, G., Liu, P., Hong, D., Li, S., He, Q. (2011). Genetic and correlation analysis of silique-traits in Brassica napus L. by quantitative trait locus mapping. Theor. Appl. Genet. 122, 21–31. doi: 10.1007/s00122-010-1419-1
Zhang, L., Zheng, L., Wu, J., Liu, Y., Liu, W., He, G., et al. (2023b). OsCCRL1 is essential for phenylpropanoid metabolism in rice anthers. Rice 16, 1–20. doi: 10.1186/s12284-023-00628-1
Zhao, J., Long, T., Wang, Y., Tong, X., Tang, J., Li, J., et al. (2020). RMS2 encoding a GDSL lipase mediates lipid homeostasis in anthers to determine rice male fertility. Plant Physiol. 182, 2047–2064. doi: 10.1104/pp.19.01487
Zhao, J., Yu, N., Ju, M., Fan, B., Zhang, Y., Zhu, E., et al. (2019). ABC transporter OsABCG18 controls the shootward transport of cytokinins and grain yield in rice. J. Exp. Bot. 70, 6277–6291. doi: 10.1093/jxb/erz382
Zheng, M., Peng, C., Liu, H., Tang, M., Yang, H., Li, X., et al. (2017). Genome-wide association study reveals candidate genes for control of plant height, branch initiation height and branch number in rapeseed (Brassica napus L.). Front. Plant Sci. 8. doi: 10.3389/fpls.2017.01246
Zhou, X., Dai, L., Wang, P., Liu, Y., Xie, Z., Zhang, H., et al. (2021). Mining favorable alleles for five agronomic traits from the elite rapeseed cultivar Zhongshuang 11 by QTL mapping and integration. Crop J. 9, 1449–1459. doi: 10.1016/j.cj.2020.12.008
Zhou, Q., Fu, D., Mason, A. S., Zeng, Y., Zhao, C., Huang, Y. (2014). In silico integration of quantitative trait loci for seed yield and yield-related traits in Brassica napus. Mol. Breed. 33, 881–894. doi: 10.1007/s11032-013-0002-2
Zhu, J., Cai, D., Wang, J., Cao, J., Wen, Y., He, J., et al. (2021). Physiological and anatomical changes in two rapeseed (Brassica napus L.) genotypes under drought stress conditions. Oil Crop Sci. 6, 97–104. doi: 10.1016/j.ocsci.2021.04.003
Zhu, J., Lei, L., Wang, W., Jiang, J., Zhou, X. (2023). QTL mapping for seed density per silique in Brassica napus. Sci. Rep. 13, 772. doi: 10.1038/s41598-023-28066-5
Keywords: drought, gene ontology, linkage disequilibrium, QTN, RNA-sequencing, single-nucleotide polymorphism, yield
Citation: Salami M, Heidari B, Alizadeh B, Batley J, Wang J, Tan X-L, Dadkhodaie A and Richards C (2024) Dissection of quantitative trait nucleotides and candidate genes associated with agronomic and yield-related traits under drought stress in rapeseed varieties: integration of genome-wide association study and transcriptomic analysis. Front. Plant Sci. 15:1342359. doi: 10.3389/fpls.2024.1342359
Received: 21 November 2023; Accepted: 26 February 2024;
Published: 19 March 2024.
Edited by:
Manohar Chakrabarti, The University of Texas Rio Grande Valley, United StatesReviewed by:
Sujan Mamidi, HudsonAlpha Institute for Biotechnology, United StatesMehboob-ur- Rahman, National Institute for Biotechnology and Genetic Engineering, Pakistan
Copyright © 2024 Salami, Heidari, Alizadeh, Batley, Wang, Tan, Dadkhodaie and Richards. This is an open-access article distributed under the terms of the Creative Commons Attribution License (CC BY). The use, distribution or reproduction in other forums is permitted, provided the original author(s) and the copyright owner(s) are credited and that the original publication in this journal is cited, in accordance with accepted academic practice. No use, distribution or reproduction is permitted which does not comply with these terms.
*Correspondence: Bahram Heidari, YmhlaWRhcmlAc2hpcmF6dS5hYy5pcg==; Maryam Salami, bWFyeXNhbGFtaTY2NkBnbWFpbC5jb20=
†ORCID: Bahram Heidari, orcid.org/0000-0002-5856-4592
Jacqueline Batley, orcid.org/0000-0002-5391-5824