- 1State Key Laboratory for the Biology of Plant Diseases and Insect Pests, Institute of Plant Protection, Chinese Academy of Agricultural Science, Beijing, China
- 2National Agricultural Experimental Station for Plant Protection, Ministry of Agriculture and Rural Affairs, Gangu, Gansu, China
- 3Control of Biological Hazard Factors (Plant Origin) for Agri-product Quality and Safety, Ministry of Agriculture and Rural Affairs, Beijing, China
Wheat leaf rust caused by Puccinia triticina (Pt) is one of the most serious diseases affecting wheat worldwide. Given that China is the world’s largest wheat-producing country, there is a lack of comprehensive understanding regarding the temporal and spatial dynamics of wheat leaf rust epidemics. This study investigated the population structure of Pt across different wheat leaf rust epidemic seasons in Gansu and Shaanxi provinces. Samples were collected in the 2020 winter from Gansu and Shaanxi, and during the 2021 spring and summer from eight additional provinces: Shandong, Henan, Gansu, Shaanxi, Hubei, Yunnan, Guizhou, and Xinjiang. Population genetics analysis was conducted using 12 pairs of Simple sequence repeat (SSR) markers. The results indicated that the genetic diversity of the samples was highest in Shandong (SD) and Shaanxi in the 2020 winter (SN_20w), and Shaanxi in the 2021 summer (SN_21s), while Xinjiang (XJ) exhibited the lowest genetic diversity. Population structure analysis revealed six distinct genetic backgrounds across the 10 populations, with SN_20w and XJ showing greater genetic distances compared to other populations. There was less genetic differentiation and strong gene flow between pairwise populations of Henan (HA) and SN_21s, SD and Gansu in the winter of 2020 (GS_20w), Gansu in the summer of 2021 (GS_21s) and Hubei (HB), and GS_20w and HB, with six shared multi-locus genotypes detected among four pairwise populations. Integrating population genetic analysis, horizontal wind field analysis, topographic analysis, and the sampling timeline, this study concluded that the winter populations of Pt in the Guanzhong region experienced dominance shifts, with limited impact on the wheat leaf rust epidemic of 2021. In the 2021 epidemic season, two pathways of pathogen dispersal were proposed: (1) from the Guanzhong basin to Henan province; (2) through the Hanshui River Valley to Hubei province. These findings provide valuable insights into the spatial dynamics of wheat leaf rust and inform targeted prevention and control strategies.
Introduction
Wheat leaf rust caused by Puccinia triticina (Pt) is one of the most significant diseases affecting global wheat production, resulting in the highest wheat yield losses worldwide (Prasad et al., 2020; Savary et al., 2019). According to an estimate proposed by an ecoclimatic suitability model, 94.4% of global wheat production is vulnerable to wheat leaf rust, with an estimated annual average loss of 8.6 to 18.3 million tons worldwide between 2000 and 2050 (Chai et al., 2020). China is the world’s largest wheat-producing country, experiencing substantial annual wheat production losses of approximately 3 million tons due to wheat leaf rust (FAOSTAT, 2022; Huerta-Espino et al., 2011). Identifying resistance genes, breeding resistant varieties, and deploying these varieties across wheat-growing regions with diverse climatic conditions represent cost-effective and efficient measures to combat wheat leaf rust.
To address the disease, it is crucial to monitor disease structure and identify key factors affecting disease transmission and prevalence before implementing resistance breeding strategies. Annual race identification of the wheat leaf rust pathogen based on single leaf-rust-resistance genes has provided insights into the pathogen’s virulence structure (Li et al., 2024; Liu and Chen, 2012; Zhang et al., 2020). Additionally, molecular marker-based population structure analysis has revealed genetic relationships among populations across different wheat production areas.
Studies have been conducted to uncover genetic relationships and pathogen dispersal between different Pt populations during a single epidemic season. Xu et al. (2022) collected 622 isolates of Pt from 15 provinces, municipalities, and autonomous regions in China in 2018. Their research clarified genetic relationships among pathogen populations in the main wheat-producing areas and suggested that the spread of Pt follows an east-to-west and south-to-north direction during the disease epidemic season in China. Focusing on Pt populations in the eastern wheat-producing regions of China, Li et al. (2023) identified differences between northern and southern populations, which were bounded by the Qinling Mountains-Huaihe River line.
Under natural conditions, Pt completes its life cycle through repeated infections via the asexual reproduction of urediniospores, with the overwintering and oversummering of pathogens playing a crucial role in disease epidemics. Fundamental studies have confirmed that Pt can overwinter on winter wheat and volunteer wheat in areas south of Shijiazhuang city, Hebei province (Bu et al., 1953; Bu and Zhou, 1952; Zeng et al., 1957). A zonation study based on the termination temperature threshold for urediniospores of Pt revealed an oversummering zone spanning from the southwest to the northeast, encompassing Yunnan, western Guizhou, central Sichuan, southeast Gansu, central and northern Shaanxi, southern Ningxia, most of Shanxi, central Inner Mongolia, and western and northern Hebei (Xia, 2021).
In practical studies of wheat stripe rust, regions such as Longnan and Tianshui in Gansu and Baoji in Shaanxi are recognized as important autumn sources of inoculum. The wheat stripe rust pathogen can overwinter in the form of hyphae in these regions and infect autumn-sown wheat, serving as the initial inoculum in the following spring, subsequently spreading to susceptible wheat in the eastern wheat-producing areas (Chen et al., 2013; Zhao and Kang, 2023). Geographically, Longnan, Tianshui, and Baoji act as bridges connecting the east and west and the north and south. However, between different wheat leaf rust epidemic seasons, it remains unclear whether pathogen populations in these regions are important sources for the disease prevalence in the following year or how winter sources contribute to the population structure in various wheat-growing regions.
To clarify the genetic relationship between winter populations of Pt in Gansu and Shaanxi provinces and the epidemic populations in the main wheat areas of China in the following year, samples were collected from Longnan and Tianshui in Gansu province and Baoji in Shaanxi province in the winter of 2020, and samples from Shandong, Henan, Hubei, Gansu, Shaanxi, Guizhou, Yunnan and Xinjiang in China were collected in the epidemic season of the following year (2021) to conduct population genetic structure analysis. This study aims to enhance our understanding of the annual dynamics of wheat leaf rust disease within the existing knowledge of population genetic structure and is vital for gaining a comprehensive insight into wheat leaf rust epidemic patterns.
Materials and methods
Puccinia triticina sampling
In this study, a total of 199 Pt samples were collected across 49 sampling sites (Figure 1; Table 1). In November and December 2020, 40 Pt samples were collected from Gansu and Shaanxi provinces. Subsequently, from March to June 2021, 159 Pt samples were collected from Shandong, Henan, Gansu, Shaanxi, Hubei, Yunnan, Guizhou, and Xinjiang. Wheat leaf samples were wrapped in craft paper and stored at 4°C. Sampling sites were visualized using sf v 1.0-18, tidyverse v 2.0.0, maptools v 1.1-5, and rmapshaper v 0.5.0 in R (Bivand and Lewin-Koh, 2022; Pebesma, 2018; Teucher and Russell, 2023; Wickham H et al., 2019).
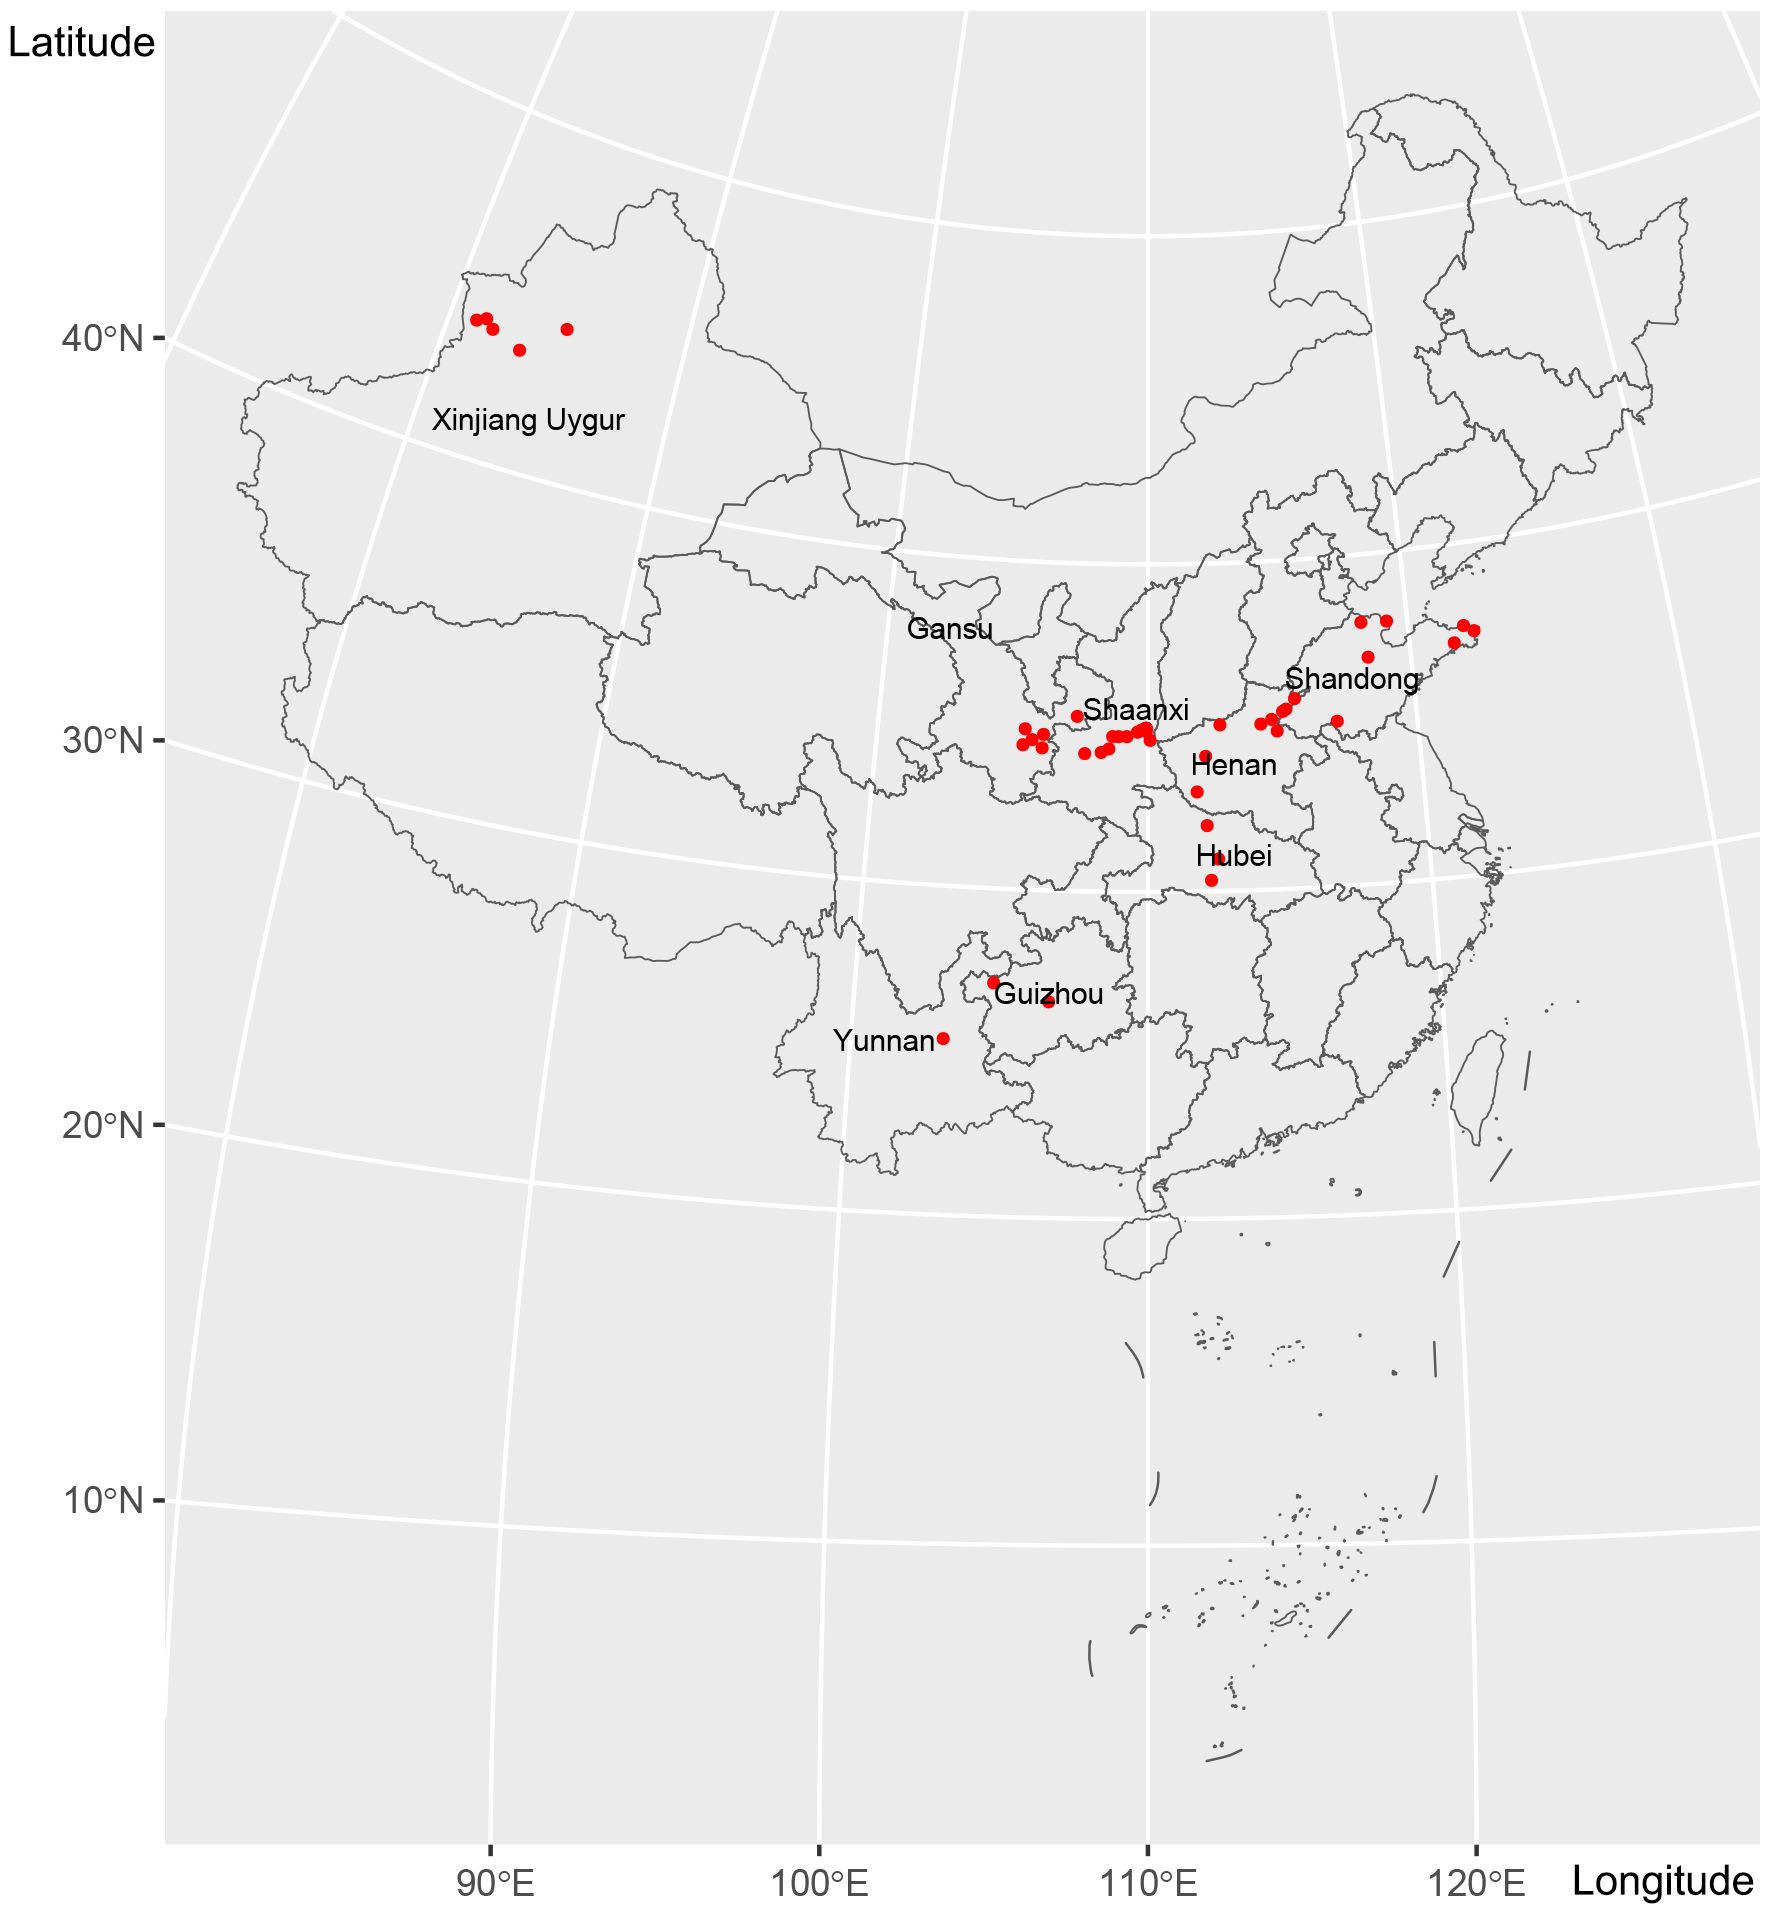
Figure 1. A total of 199 Pt samples were collected from 49 sampling sites in eight provinces and autonomous regions of China from winter 2020 to summer 2021.
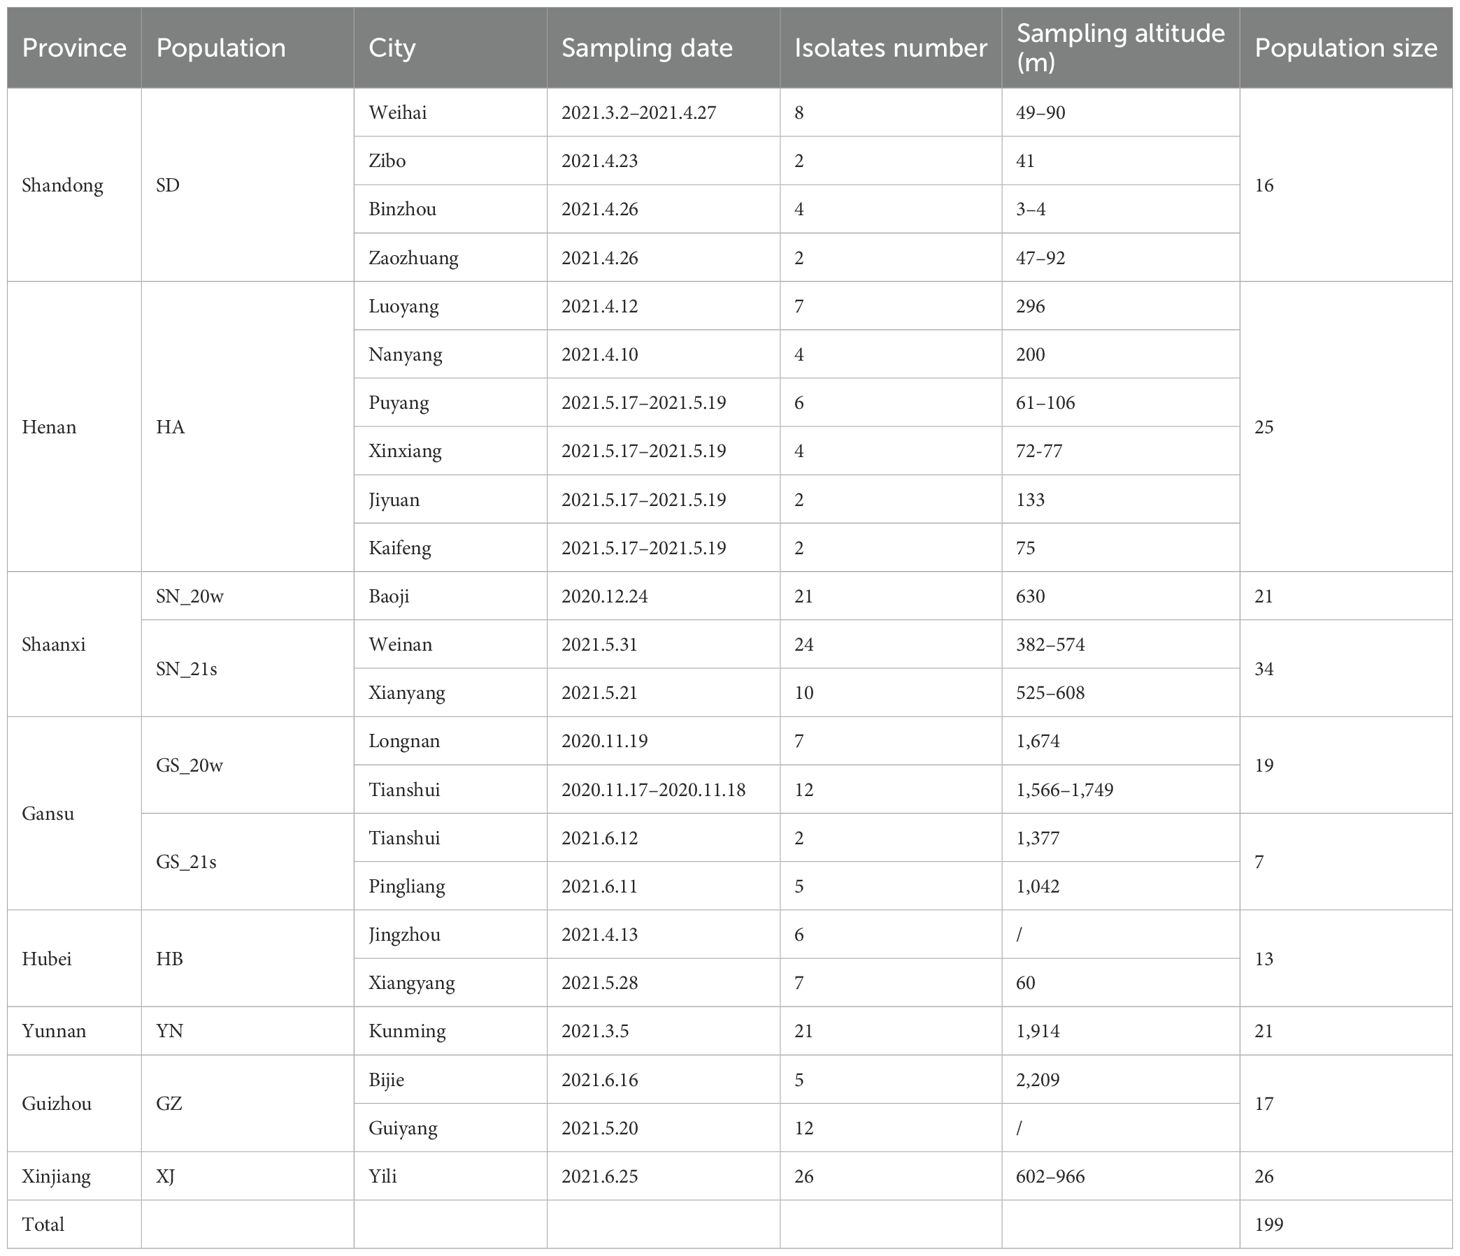
Table 1. Sampling information of Pt from 10 populations in eight provinces and autonomous regions of China from 2020 to 2021.
SSR amplification
For SSR amplification, a 1 cm2 leaf segment with a single uredinium of Pt was placed in a 2 mL grinding tube, along with one grain of steel beads (YA3032–500 g, Beijing Solarbio Technology Co., Ltd., China) and 0.3 g of 1.0 mm glass grinding beads (BE6061-500, Beijing Easybio Technology Co., Ltd., China). These were frozen in liquid nitrogen and then ground at 1,800 cycles/min for 30 s using a Fastprep tissue homogenizer (MpBio, China). DNA was extracted using a plant genomic DNA kit (TIANGEN Biotech Co. Ltd., Beijing, China). The DNA concentration and purity were assessed using a DS-11FX ultra-micro/fluorescence full-function spectrophotometer (DeNovx), with samples with a DNA concentration >20 ng/μL selected for SSR amplification.
In this study, 12 pairs of fluorescent SSR primers, including RB8, RB1, RB35, RB11, and RB16 (Duan et al., 2003), and PtSSR151A, PtSSR161, PtSSR91, PtSSR152, PtSSR92, PtSSR173, and PtSSR13 (Szabo and Kolmer, 2007) (Supplementary Table S1) (Beijing Tsingke Biotech Co., Ltd., China), were utilized for SSR amplification. Each PCR reaction was set up with a 12.5 μL mixture containing 6.25 μL of Taq DNA mix (2X M5 Hiper plus Taq HiFi PCR mix, Beijing Mei5 Biotechnology Co., Ltd., China), 0.5 μL of each primer, 0.5 μL of DNA template, and 4.75 μL of deionized water. The PCR procedure involved an initial denaturation at 95°C for 3 min, followed by 35 cycles of 94°C for 25 s, annealing at 58°C–61°C for 15 s, and elongation at 72°C for 5 min, with a final extension at 72°C for 10 min.
PCR products were diluted at 1:50 with deionized water and loaded into a 96-well plate. Each well received 1 μL of the diluted PCR product and 9 μL of Hi-Di Formamide (Applied Biosystems, Thermo Fisher Scientific, USA) and GeneScan 500 Lizi (Applied Biosystems, Thermo Fisher Scientific, USA) mixture (at a ratio of 1000:15). The mixture was heated for 5 min at 95°C, followed by an ice bath for 3 min. The length detection of SSR amplification was performed using a 3500 Genetic Analyzer (Applied Biosystems, Thermo Fisher Scientific, USA), with fragment sizes identified using GeneMarker software v 2.7.0 (SoftGenetics, LLC., USA).
Population genetic structure
Preliminary data analyses were conducted using the R package poppr v 2.9.3 (Kamvar et al., 2015, 2014; Team, 2024). Missing values for each SSR locus were less than 10%, and missing values for each sample were less than 25%. Genetic polymorphisms of SSR loci and gene accumulation curves were calculated using poppr v 2.9.3. Clone correction was performed to eliminate potential bias caused by cloned genotypes.
Genetic background analysis was conducted using STRUCTURE without prior assignment of samples into distinct populations (Evanno et al., 2005). Parameters were set with a burn-in period of 10,000, followed by 100,000 MCMC repetitions, and K values ranging from 2 to 10 with 10 independent runs. The results were processed using StructureSelector to identify the most appropriate K value (Li and Liu, 2018), and a graphical representation for the specific K was generated using StructureSelector, classifying samples into different populations.
Discriminant analysis of principal components (DAPC) and clustering analyses were performed on data post-clone correction. DAPC was conducted using adegenet v 2.1.10 in R (Jombart, 2008), with visualizations performed using ade4 v 1.7-22 (Dray and Dufour, 2007). Clustering analysis was performed using ape v 5.8 in R with Nei’s genetic distance (Paradis and Schliep, 2019), and visualizations were generated using ggplot2 v 3.5.1 (Wickham, 2016).
Arlequin v.3.5.2.2 was used to calculate the F-statistics (FST) with the number of permutations = 10000 (Excoffier et al., 2005). GENALEX 6.5 software was employed to calculate gene flow (Nm) between different populations (Peakall and Smouse, 2012; Slatkin, 1985; Wright, 1951). Shared multi-locus genotypes (MLGs) between populations were analyzed using poppr v 2.9.3 in R.
Wind driving force on pathogen dispersal
Horizontal wind field analysis was performed using xarray v 2022.3.0 (Hoyer and Hamman, 2017), pandas v 2.0.0 (https://pandas.pydata.org/), numpy v 1.22.0 (Harris et al., 2020), cartopy v 0.23.0 (https://scitools.org.uk/cartopy/docs/latest/), and matplotlib v 3.8.0 (Hunter, 2007) in Python v 3.9.7. ERA5 (ECMWF Reanalysis v5) hourly data on pressure levels from 1940 to present were utilized to extract the u-component and v-component of wind in January and February 2021 (Hersbach et al., 2023). Considering the altitude range of the sampling sites in Shaanxi (382–630m) and Gansu (1,042–1,749m), and the time period between winter and summer sampling, ERA5 hourly data on pressure levels of 950hPa and 850hPa were extracted for horizontal wind field analysis in January and February 2021.
MeteoInfoMap v 3.9.6 (Wang, 2014) was used to analyze the airflow trajectories at several sampling sites to supplement the horizontal wind field analysis. The meteorological data were downloaded from the NOAA (https://www.noaa.gov/). Specifically, the forward airflow trajectories of Longnan (2020.11.25–2020.11.27) in Gansu province, backward airflow trajectories of Jingzhou (2021.3.22–2021.3.24) in Hubei province, backward airflow trajectories of Xiangyang (2021.5.6–2021.5.9) in Hubei province, backward airflow trajectories of Luoyang (2021.3.27–2021.3.28) in Henan province, and backward airflow trajectories of Jiyuan (2021.5.6–2021.5.8) in Henan province were examined. The airflow trajectories were generated hourly and analyzed over 48 h. Cluster calculations were applied to group the trajectories, and the airflows in different directions were visually distinguished by assigning different colors based on the proportion of each airflow trajectory.
Topographic analysis
Topographic analysis was conducted on the sampling sites of six populations in Gansu, Shaanxi, Henan, and Hubei provinces to explore topographic barriers and potential pathways of pathogen dispersal. MeteoInfoMap v 3.9.6 software was used to label sampling sites by latitude and longitude on satellite maps, with BingSatelliteMap serving as the base map (Wang, 2014).
Results
Sampling sites and populations
The 199 isolates collected from 2020 to 2021 were divided into 10 populations based on seasonal differences and sampling locations (Figure 1; Table 1). SN_20w (winter 2020, Baoji, Shaanxi) and GS_20w (winter 2020, Longnan and Tianshui, Gansu) represented winter samples. The remaining eight populations, all sampled in 2021, were classified according to their geographic locations: SD (Shandong), HA (Henan), SN_21s (Shaanxi, summer 2021), GS_21s (Gansu, summer 2021), HB (Hubei), YN (Yunnan), GZ (Guizhou), and XJ (Xinjiang).
Genetic polymorphism
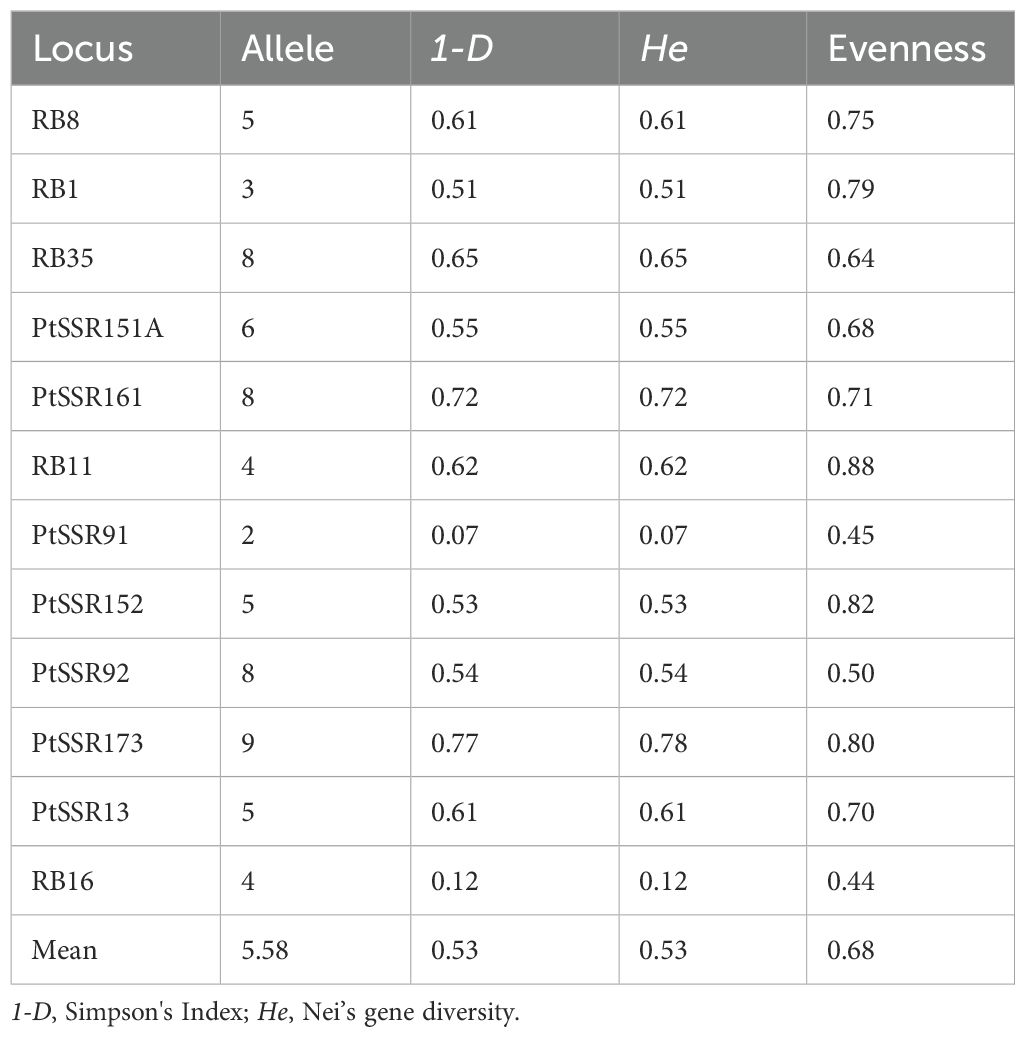
The genetic polymorphism of the 12 pairs of SSR markers used in this study revealed a range of allele numbers from 2 to 9, with an average of 5.58 (Table 2). The Simpson's index (1-D) and Nei’s gene diversity (He) both averaged 0.53, indicating that the selected markers provided appropriate polymorphism for this sample set. The evenness values ranged from 0.44 to 0.88, suggesting a reasonably balanced distribution of allele frequencies within the sample set.
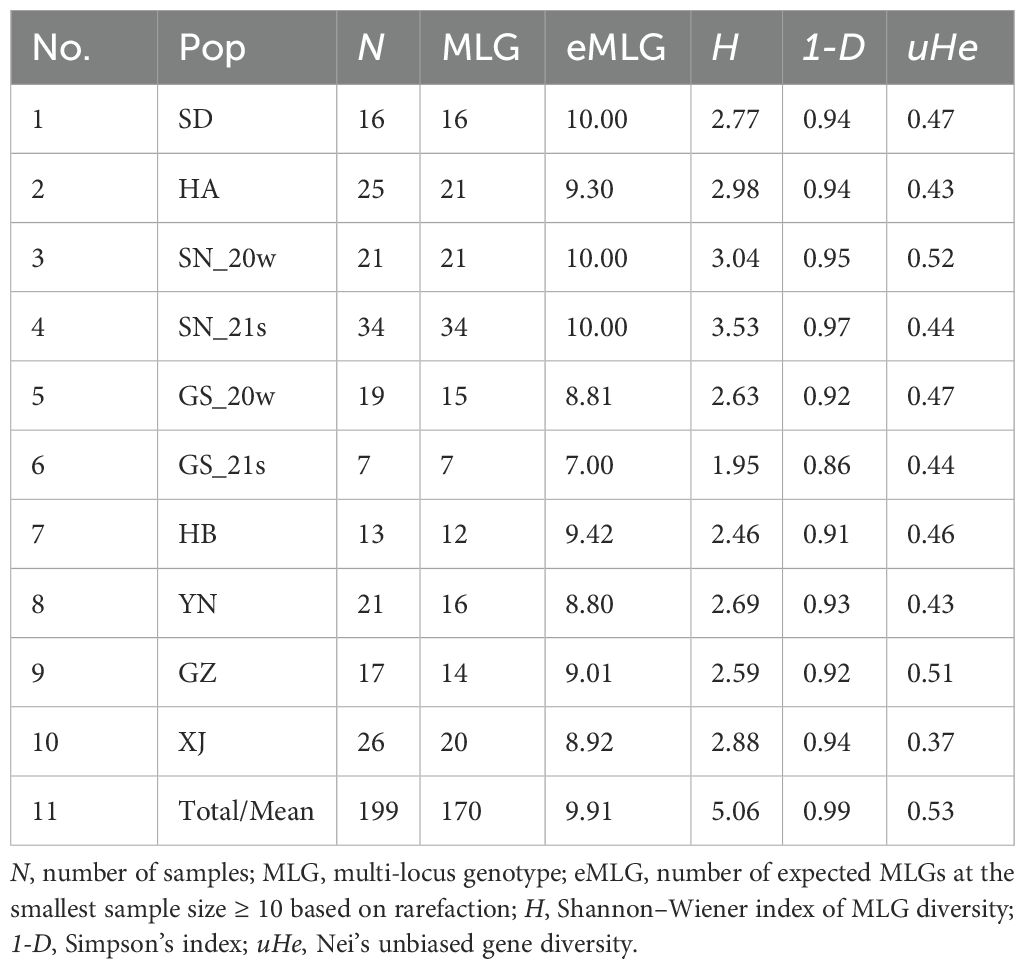
The 199 isolates generated a total of 170 MLGs using the 12 pairs of SSR primers, and the gene accumulation curve indicated that this set of primers provided adequate discrimination for the sample set (Supplementary Figure S1). Among the 10 populations divided by sampling seasons and sampling sites, only GS_21s exhibited a population size of less than 10. The populations SD, SN_20w, and SN_21s exhibited the highest level of eMLG (10.00), suggesting a greater diversity of genotypes within these populations. In contrast, the XJ population had the lowest uHe value (0.37), indicating the lowest genetic diversity among the populations studied (Table 3).
Population genetic structure
A total of 199 samples without pre-defined populations using STRUCTURE analysis yielded an optimal K value of 6 (Figure 2; Supplementary Table S1). The genetic backgrounds of the SN_20w and XJ populations were distinct from other populations. The HA population showed a similar genetic background to SN_21s, and the two populations were geographically adjacent at sampling sites. The genetic lineages of HB were primarily composed of the main genetic lineages of GS_20w and GS_21s, suggesting a frequent dispersal of strains between the Hubei and Gansu populations in different seasons. The YN and GZ populations exhibited genetic lineages distinct from other regions (represented by the orange bar block), while the wheat leaf rust pathogens in these two regions had close genetic relationships. The SD population exhibited a mixed genetic background, with its main genetic lineage (represented by the green bar block) found in the GS_20w and HB populations, and other genetic lineages (represented by the blue and orange bar blocks) also present, indicating that the SD population may have been an introduced population with multiple sources of pathogen origins.

Figure 2. The genetic structure analysis of 10 Pt populations based on the optimal K value (K=6) revealed the relationships between genetic backgrounds among the populations.
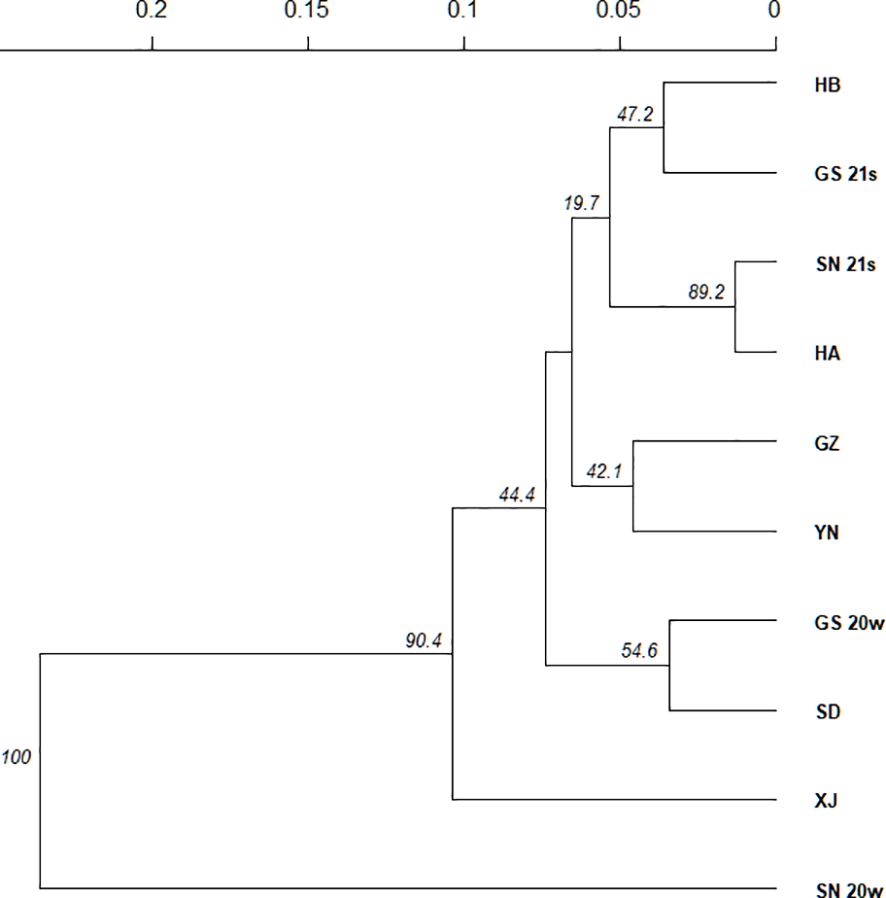
The phylogenetic analysis based on Nei’s genetic distance for the 10 populations supported the results of the STRUCTURE analysis (Figure 3). SN_20w was completely separated from the other populations, indicating genetic distinctiveness and possibly a different origin. The XJ population was also genetically independent. Among the remaining eight populations, the pairwise populations of SD and GS_20w, GZ and YN, SN_21s and HA, and HB and GS_21s each showed closer genetic relationships with each other than the others.
In the DAPC of the 10 populations, the first eigenvalue obtained from the DA analysis was much higher than the rest, indicating that this eigenvalue explained a large part of the variation between populations, demonstrating significant genetic differentiation of SN_20w and XJ populations from the other populations (Figure 4A). In the DAPC for the remaining eight populations, since the SD population was geographically distant from the YN and GZ populations, the close genetic relationship might be related to the long-distance spread of Pt (Figure 4B). The HB population was genetically distinct from the other populations but closely related to GS_20w and GS_21s, indicating potential genetic exchange between the Hubei and Gansu populations despite their geographic separation.
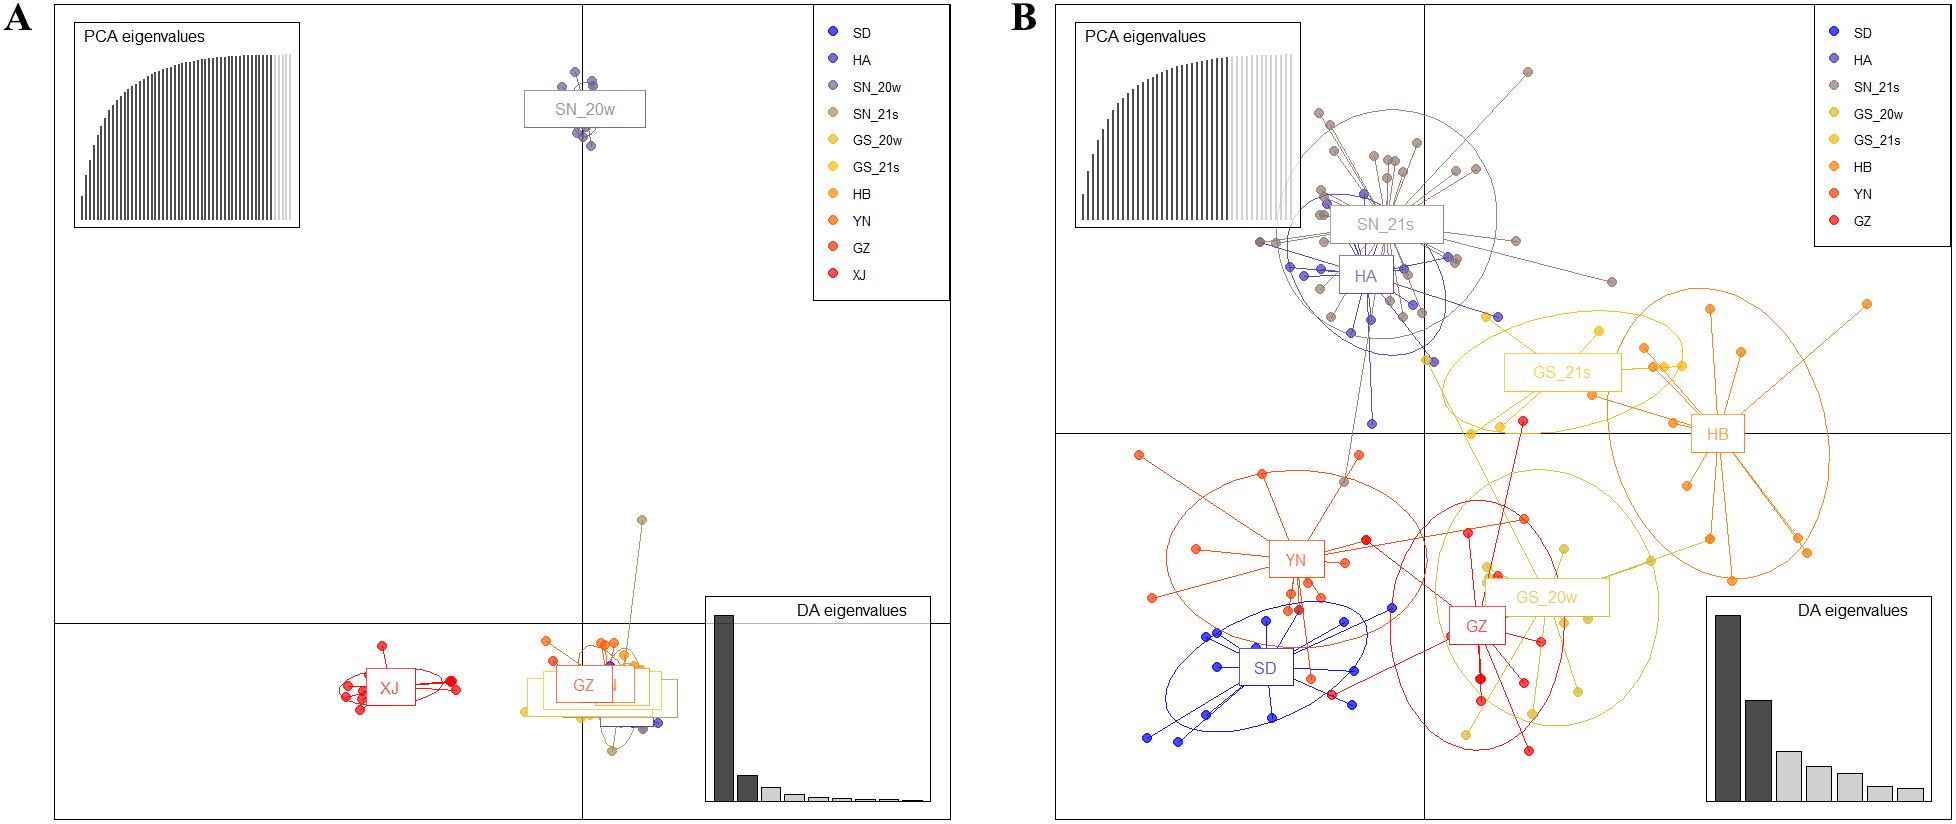
Figure 4. Discriminant analysis of principal components of the 10 Pt populations (A) and eight populations excluding XJ and SN_20w (B).
Genetic differentiation and gene flow
The fixation index (FST) and gene flow (Nm, Nei’s migration) parameters between pairwise populations were calculated, with results sorted from the highest to the lowest Nm values (Table 4). The FST values reflect varying levels of genetic differentiation: 0 < FST < 0.05 indicates low differentiation, 0.05 ≤ FST < 0.15 indicates moderate differentiation, FST ≥ 0.15 indicates high differentiation, and FST ≥ 0.25 indicates higher differentiation among populations. Notably, pairwise populations with FST values less than 0.05 (HA and SN_21s, SD and GS_20w, GS_21s and HB, GS_20w and HB) exhibited strong gene flow (Nm > 4), suggesting reduced genetic differentiation due to increased genetic exchange between these populations. Focusing on the winter and summer epidemic populations in the Gansu and Shaanxi regions, the summer populations (SN_21s and GS_21s) showed moderate genetic differentiation (FST = 0.051), while the winter populations (SN_20w and GS_20w) exhibited high genetic differentiation (FST = 0.208). For populations within the same region but different seasons, GS_20w and GS_21s showed moderate genetic differentiation (FST = 0.057), and SN_20w and SN_21s showed high differentiation (FST = 0.211). These patterns suggested that the summer epidemic populations in the two regions might not have been directly caused by continuous infection from the winter populations.
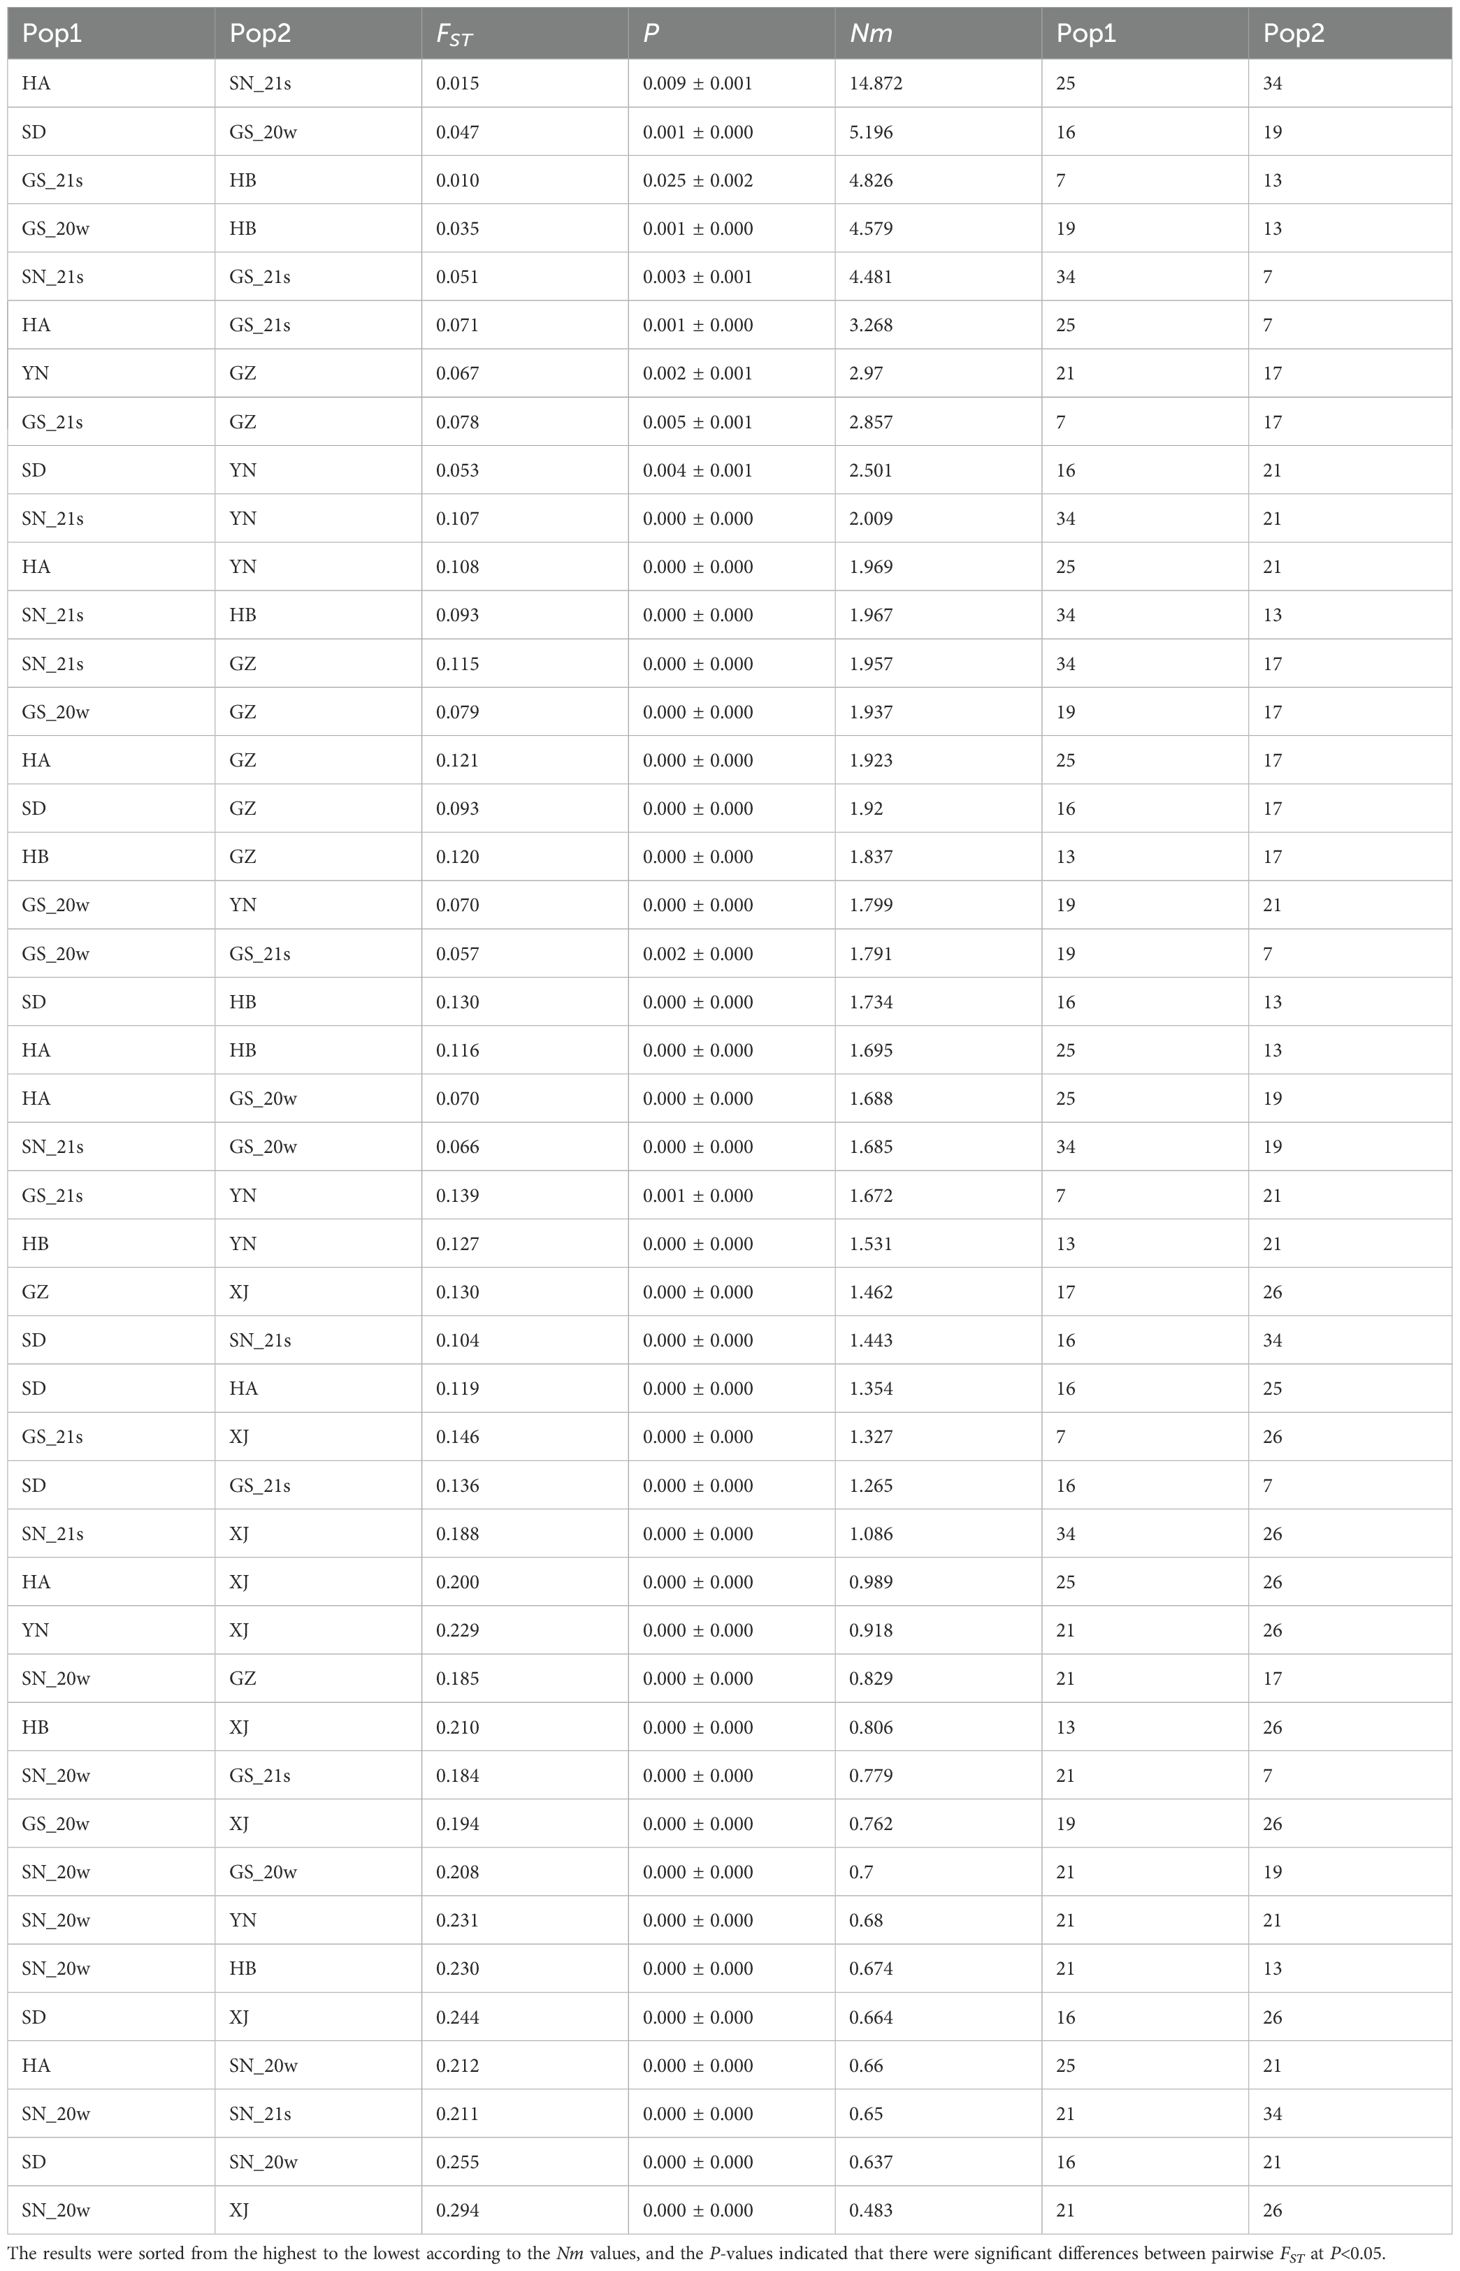
Table 4. The FST (fixation index) and gene flow (Nm, Nei’s migration) parameters between pairwise Pt populations.
Shared MLGs
Shared MLGs provided evidence for pathogen dispersal. Among the 170 MLGs analyzed, six were detected in different populations (Table 5). Three shared MLGs were detected between SN_21s and HA populations, while one shared MLG was detected between GS_20w and HB, YN and GZ, and SD and YN populations, respectively. The detection of shared MLGs between the SD and YN populations, which are geographically distant, supported the possibility of long-distance pathogen dispersal events between these two regions. In this study, shared MLGs were only found between pairwise populations, and no MLG was detected in multiple populations. This suggested that inter-regional transmission of Pt might also be constrained by factors such as topographic barriers, host adaptability of strains, or different climatic conditions.

Table 5. Six shared multi-locus genotypes (MLGs) in pairwise Pt populations were detected from 170 MLGs.
Wind driving force on pathogen dispersal
Wind plays a critical role in the regional migration of urediniospores of Pt. In the southern regions of Gansu province, wind streamlines were disrupted by mountain barriers, leading to localized chaotic disturbances that facilitated the mixing of urediniospores (Figures 5A, B). On the north and south sides of the Qinling Mountains and the Daba Mountains, wind streamlines were redirected, with wind along the Qinling Mountains flowing towards Henan, and wind between the Qinling Mountains and Daba Mountains tending to flow towards Hubei (Figures 5C, D). At both 950 hPa and 850 hPa, the wind streamline between Gansu and Shaanxi was obstructed by the Liupan Mountains and Qingling Mountains.
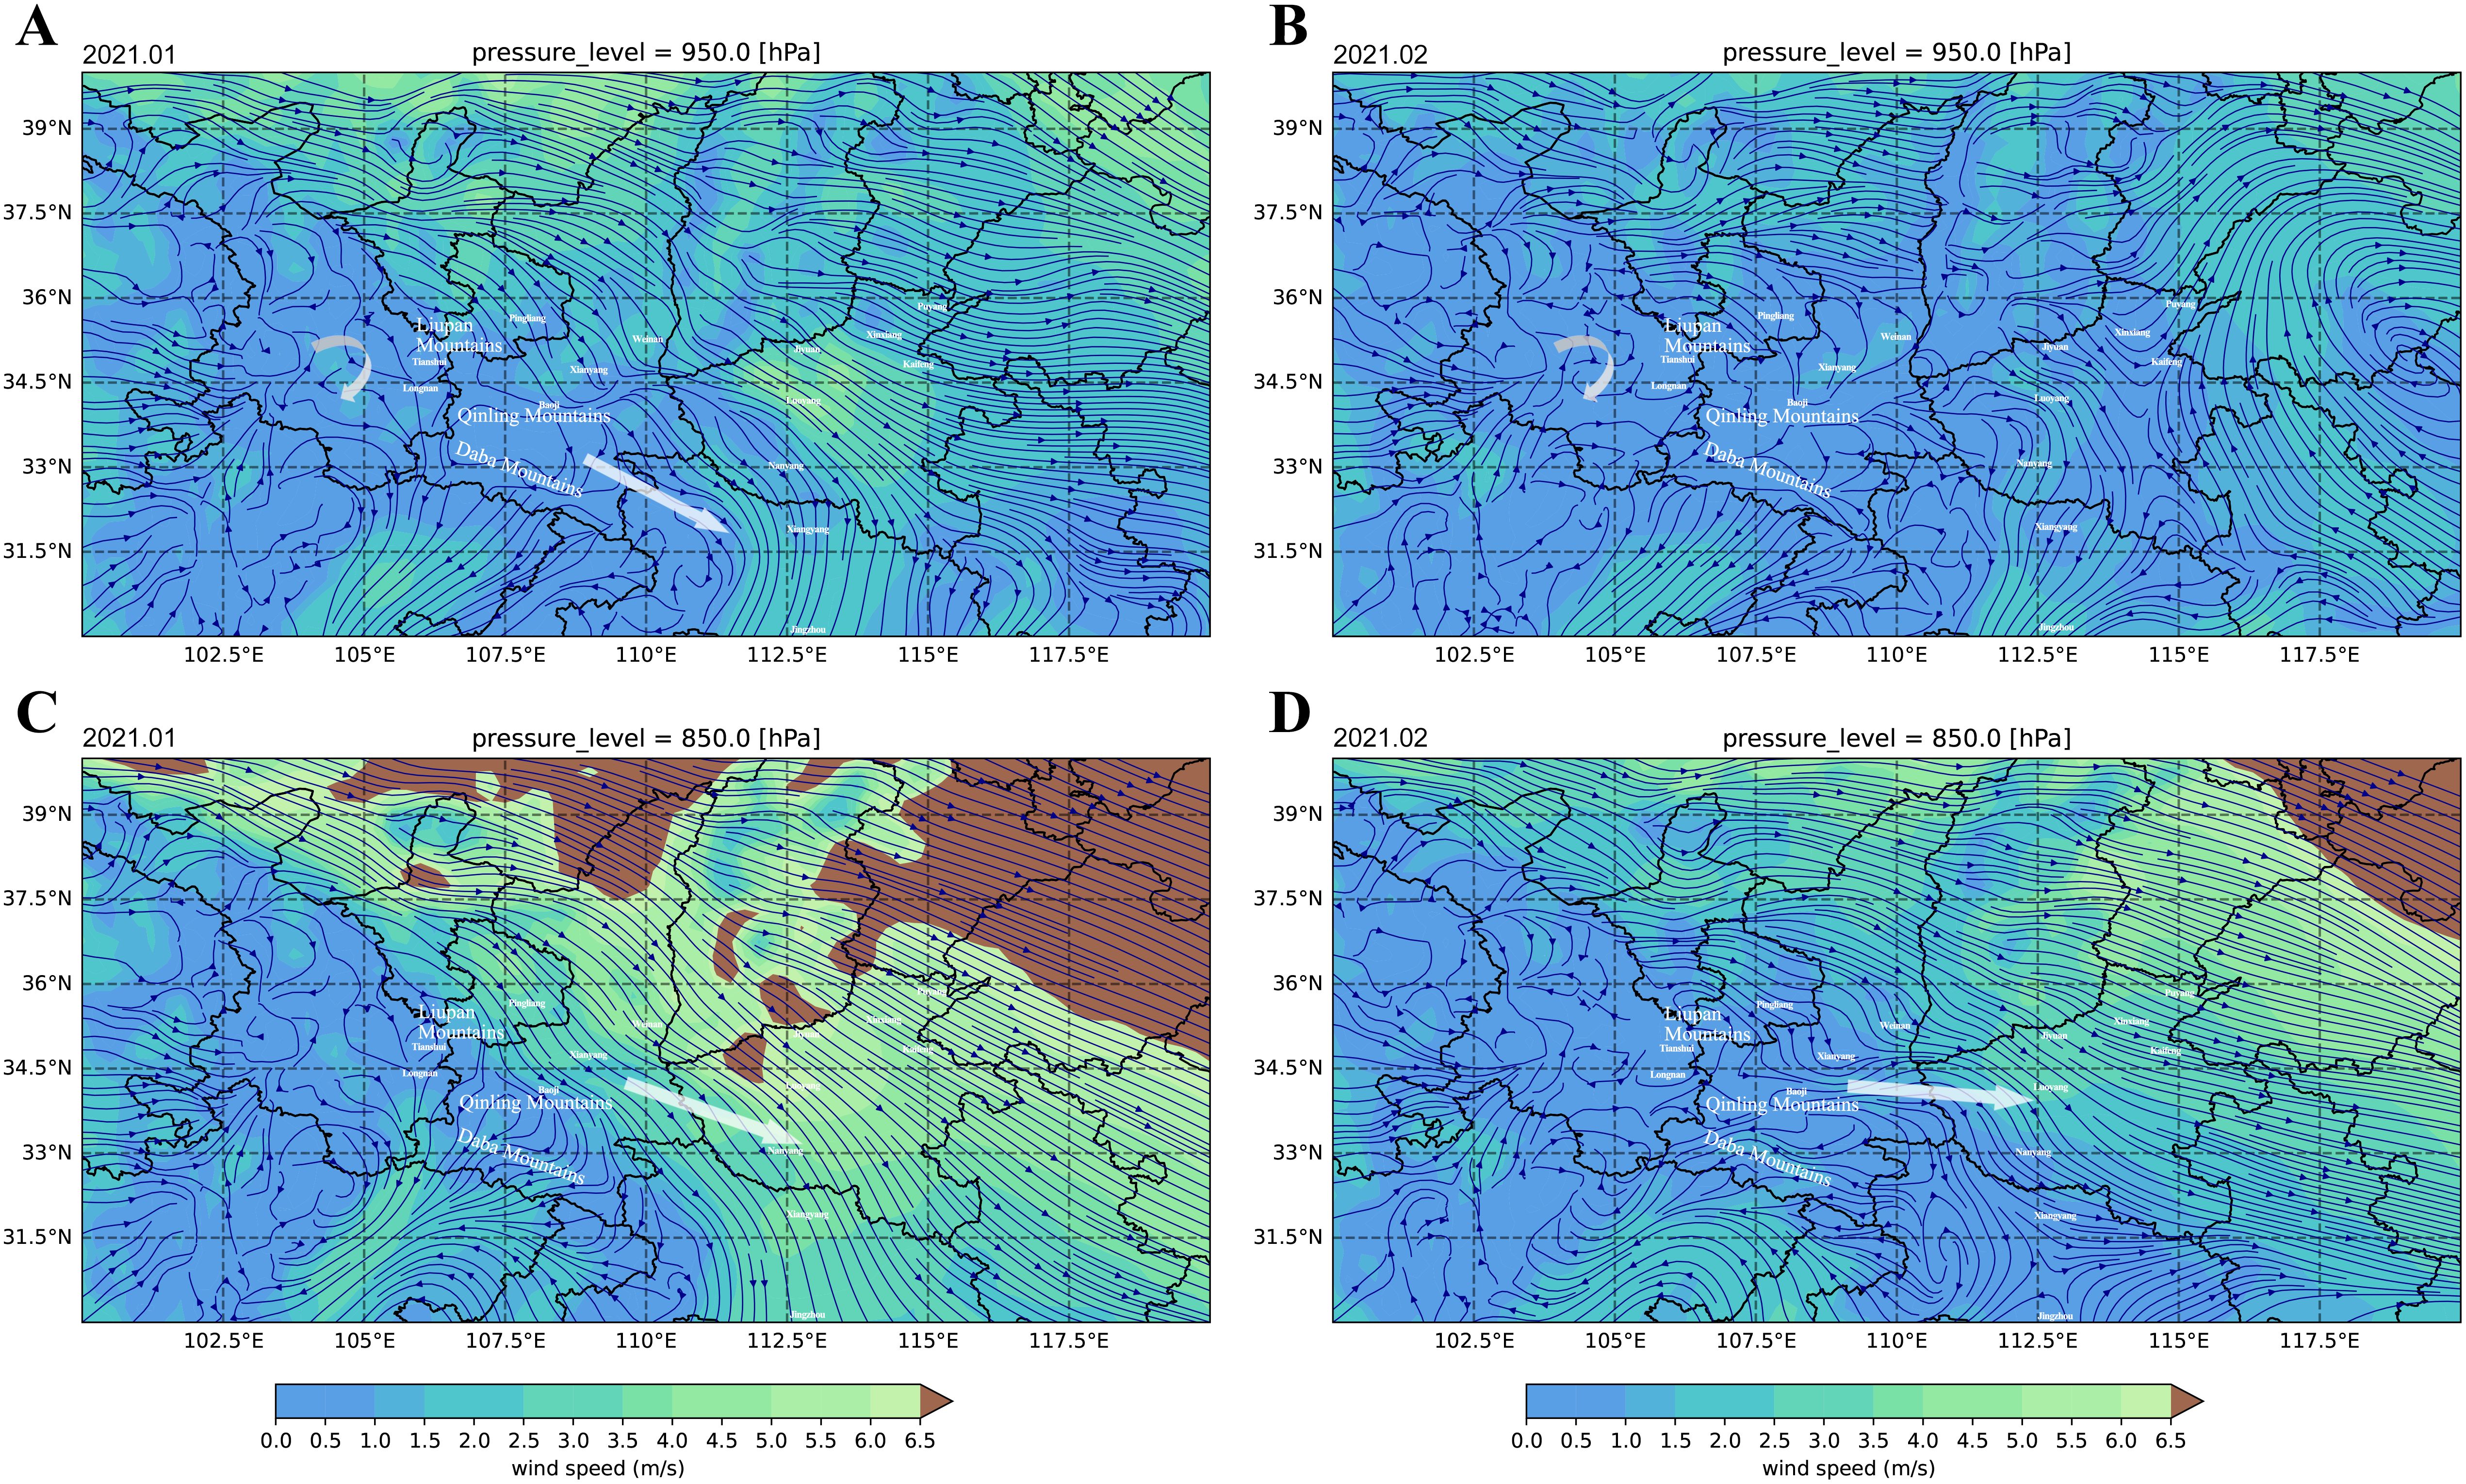
Figure 5. The horizontal wind field analysis showed the potential driving force of wind on urediniospore dispersal. The average wind field of 950 hPa on January 2021 (A) and February 2021 (B) revealed that the wind streamline disturbance blocked by mountains in southern Gansu provided favorable conditions for the mixing of different genetic populations of urediniospores. The average wind field of 850 hPa on January 2021 (C) and February 2021 (D) showed that the wind streamline flowing out of Shaanxi via the Qinling Mountains reached Henan.
The forward airflow trajectories revealed airflow from Longnan, Gansu province, to Hubei province in the winter (Supplementary Figure S2A). The backward airflow trajectories revealed that Jingzhou (Supplementary Figure S2B) and Xiangyang (Supplementary Figure S2C) in Hubei province received airflow from Gansu province, and Luoyang (Supplementary Figure S2D) and Jiyuan (Supplementary Figure S2E) in Henan province received airflow from Shaanxi province in the summer.
Discussion
During the spring to summer of 2021 wheat leaf rust epidemic season, genetic relationships among populations could potentially reflect pathogen dispersal events. The YN population was sampled earlier (2021.3.5) compared to the SD population (2021.3.20–2021.4.27). Coupled with evidence from population structure and shared MLGs, this suggested pathogen dispersal from Yunnan to Shandong. Genetic diversity of populations in the efferent population is generally higher than that of the afferent population (Brussard, 1984). However, the YN population displayed lower genetic diversity than the SD population, which can be explained in three ways. (1) A previous study in the eastern wheat-producing area positioned Shandong north of the boundary line for Pt’s northward transmission (Li et al., 2023). In this study, genetic structure analysis suggested that the SD population might be an afferent population with multiple sources. Under K=6, SD samples encompassed three distinct genetic backgrounds, explaining the higher genetic diversity in the afferent SD population compared to the efferent YN population. (2) Urediniospores of Pt can be dispersed over long distances by airflows, allowing different geographical populations to both receive and transmit pathogens, rather than spreading via a single-point diffusion model like soil-borne diseases. “Genetic diversity” is a common result of host selection, pathogen immigration and emigration, inheritance, variation accumulation, and pathogen population evolution, rather than a determinant of pathogen dispersal. More critical factors may include the host adaptability, disease onset timing, urediniospore quantity, and wind strength and direction. (3) The low genetic diversity in the YN population could be related to the reduced wheat cultivation area in the southwestern region. The reduction affected the effective size of the pathogen population and the accumulation of variations within the population. Additionally, the earlier wheat maturation time and rust occurrence times in the southwestern region, combined with fewer external pathogen introductions due to reduced host availability, contribute to the YN population’s lower genetic diversity.
The Xinjiang Uyghur Autonomous Region is geographically remote from other wheat-producing areas, and the XJ population is also genetically distinct, which is supported by similar studies (Zhang et al., 2024). There was significant genetic differentiation between the XJ and other populations (FST= 0.146-0.341), with moderate gene flow (Nm > 1). The potential eastward dispersal of pathogens from Xinjiang is likely limited and slow. Thus, the influence of the XJ population on the occurrence and prevalence of wheat leaf rust in the main wheat-growing areas and on the genetic structure is insignificant, and vice versa.
Genetic relationships between the populations across different epidemic seasons may reflect both pathogen dispersal events and the dominant shifts in response to environmental changes. The HB population exhibited a mixed genetic background, sharing backgrounds with both GS_20w and GS_21s. Low genetic differentiation and high gene flow were observed between GS_20w and HB, as well as between GS_21s and HB, while GS_20w and GS_21s did not show a close genetic relationship. This suggested that both winter populations and summer populations from Gansu contributed to the occurrence of wheat leaf rust in Hubei during spring to summer in 2021. However, under conditions of chaotic wind streamlines facilitating urediniospore mixing, the high genetic difference between GS_20w and GS_21s populations suggested that genetic population dominance shifts might occur from winter to summer in Gansu, along with multiple strain introductions from the Gansu population to Hubei. Although Hubei and Gansu are not directly adjacent, the SN population in Shaanxi, directly adjacent to Hubei, showed a higher level of genetic differentiation with the HB population. Integrating wind field analysis, we speculate that areas in Gansu such as Longnan and Tianshui, located west of the Liupan Mountains and between the Daba Mountains and the Qinling Mountains, provide a Hanshui River Valley pathway for pathogen dispersal from Gansu to Hubei.
The HA population was more closely related genetically to the SN_21s population. Geographically, the sampling sites for the SN_21s population, Weinan and Xianyang, located north of the Qinling Mountains, which block pathogen dispersal southward. To the west, the Liupan Mountains also form a topographical barrier. Weinan and Xianyang are situated in the Guanzhong Plain, bordered by the Northern Shaanxi Plateau to the north, with the only eastward route being the Guanzhong Basin leading to Henan. Horizontal wind field analysis indeed revealed wind flowing from Shaanxi via the Qinling Mountains to Henan. Genetic analyses indicated that the SN_20w had minimal impact on disease prevalence in the main wheat-growing areas. In contrast, the SN_21s population could pass through the Guanzhong Plain pathway and enter Henan province, the most extensive wheat cultivation area in China. The abundance of hosts in this region further facilitated pathogen infection and widespread dispersal. It also revealed dominance shifts of populations in Shaanxi, where SN_20w might be replaced by predominant populations in changing environmental conditions caused by seasonal changes, infecting wheat in limited areas without further spread.
The difference between SN_20w and SN_21s may be exaggerated due to the limited sample collection of SN_20w, which failed to fully cover the entire genetic composition of the winter wheat leaf rust population in this region. Nevertheless, the difference between GS_20w and GS_21s showed that even within the same area, pathogen population composition was dynamic, involving the process of disease infection and re-infection, with strain population composition determined by strains occupying dominant ecological niches first. Moreover, the genetic differentiation between the Gansu and Shaanxi populations can be explained by the Liupan Mountains and the Qinling Mountains blocking wind streamlines between the two regions.
In studies on the regional spread of wheat stripe rust, strains spreading from the southwestern region to the lower reaches of the Yangtze River played an important role in the population structure (Huang et al., 2025). However, in the population structure study of wheat leaf rust, the strains in southwest China do not seem to play such a crucial role. Previous studies indicated that during the same epidemic season, gene flow between the Yunnan, Sichuan, and Hubei populations was relatively low (Nm, Hubei-Yunnan = 5.029, Hubei-Sichuan = 4.715). In contrast, gene flow between Shaanxi, Gansu, and Hubei showed higher levels (Nm, Hubei-Shaanxi = 10.638, Hubei-Gansu = 7.308) (Xu et al., 2022). We believe the main reason is that the wheat leaf rust pathogen adapts to a more moderate temperature (10°C–25°C) than the wheat stripe rust pathogen (Ren et al., 2023). The stripe rust pathogen continually increased in Yunnan during the winter but rarely overwinters in most of the Huang-Huai-Hai Plain, the Guanzhong Plain, and the middle and lower reaches of the Yangtze River (Chen et al., 2013). After the temperature rose, the initial inoculum generated by the early occurrence of stripe rust in Yunnan was able to largely colonize after spreading to Hubei. However, the leaf rust pathogen has a broader range of temperature adaptation. The occurrence of leaf rust in Hubei may be affected by local overwinter sources, and imported sources from Gansu and Shaanxi. Therefore, strains introduced from Yunnan to Hubei do not have such a significant ground-breaking effect, and thus do not play a decisive role in the epidemic of leaf rust in Hubei and the middle and lower reaches of the Yangtze River.
In summary, the winter populations of Pt in the Guanzhong region experienced dominance shifts and had a limited impact on the wheat leaf rust epidemic of 2021. Specifically, GS_20w contributed to the population structure of SD and HB, while SN_20w was not detected during 2021, and the summer populations in Gansu and Shaanxi showed no direct correlation with the winter populations. From winter 2020 to spring 2021, Pt from Gansu dispersed to Hubei along the Hanshui River Valley pathway, while the exchange of pathogen sources between Shaanxi and Gansu may have been hindered by the Liupan Mountains and the Qinling Mountains. The winter strains in Shaanxi failed to spread in 2020 and were replaced during dominance shifts. From spring to summer in 2021, strains from Shaanxi were transmitted through the Guanzhong basin pathway to Henan, impacting wheat leaf rust occurrence there. Pathogens from Gansu also followed the Hanshui River Valley pathway into Hubei and potentially spread further to Shandong (Figure 6). Shandong province, located north of the boundary line of the northern and southern pathogen populations in the eastern wheat-producing area, received pathogen sources from the western regions of Gansu, Hubei, and Yunnan, and from the southern regions of Jiangsu, Anhui, and Zhejiang. After the pathogens complete multiplication, strains could continue to spread northward, infecting unripe wheat in the North China Plain.
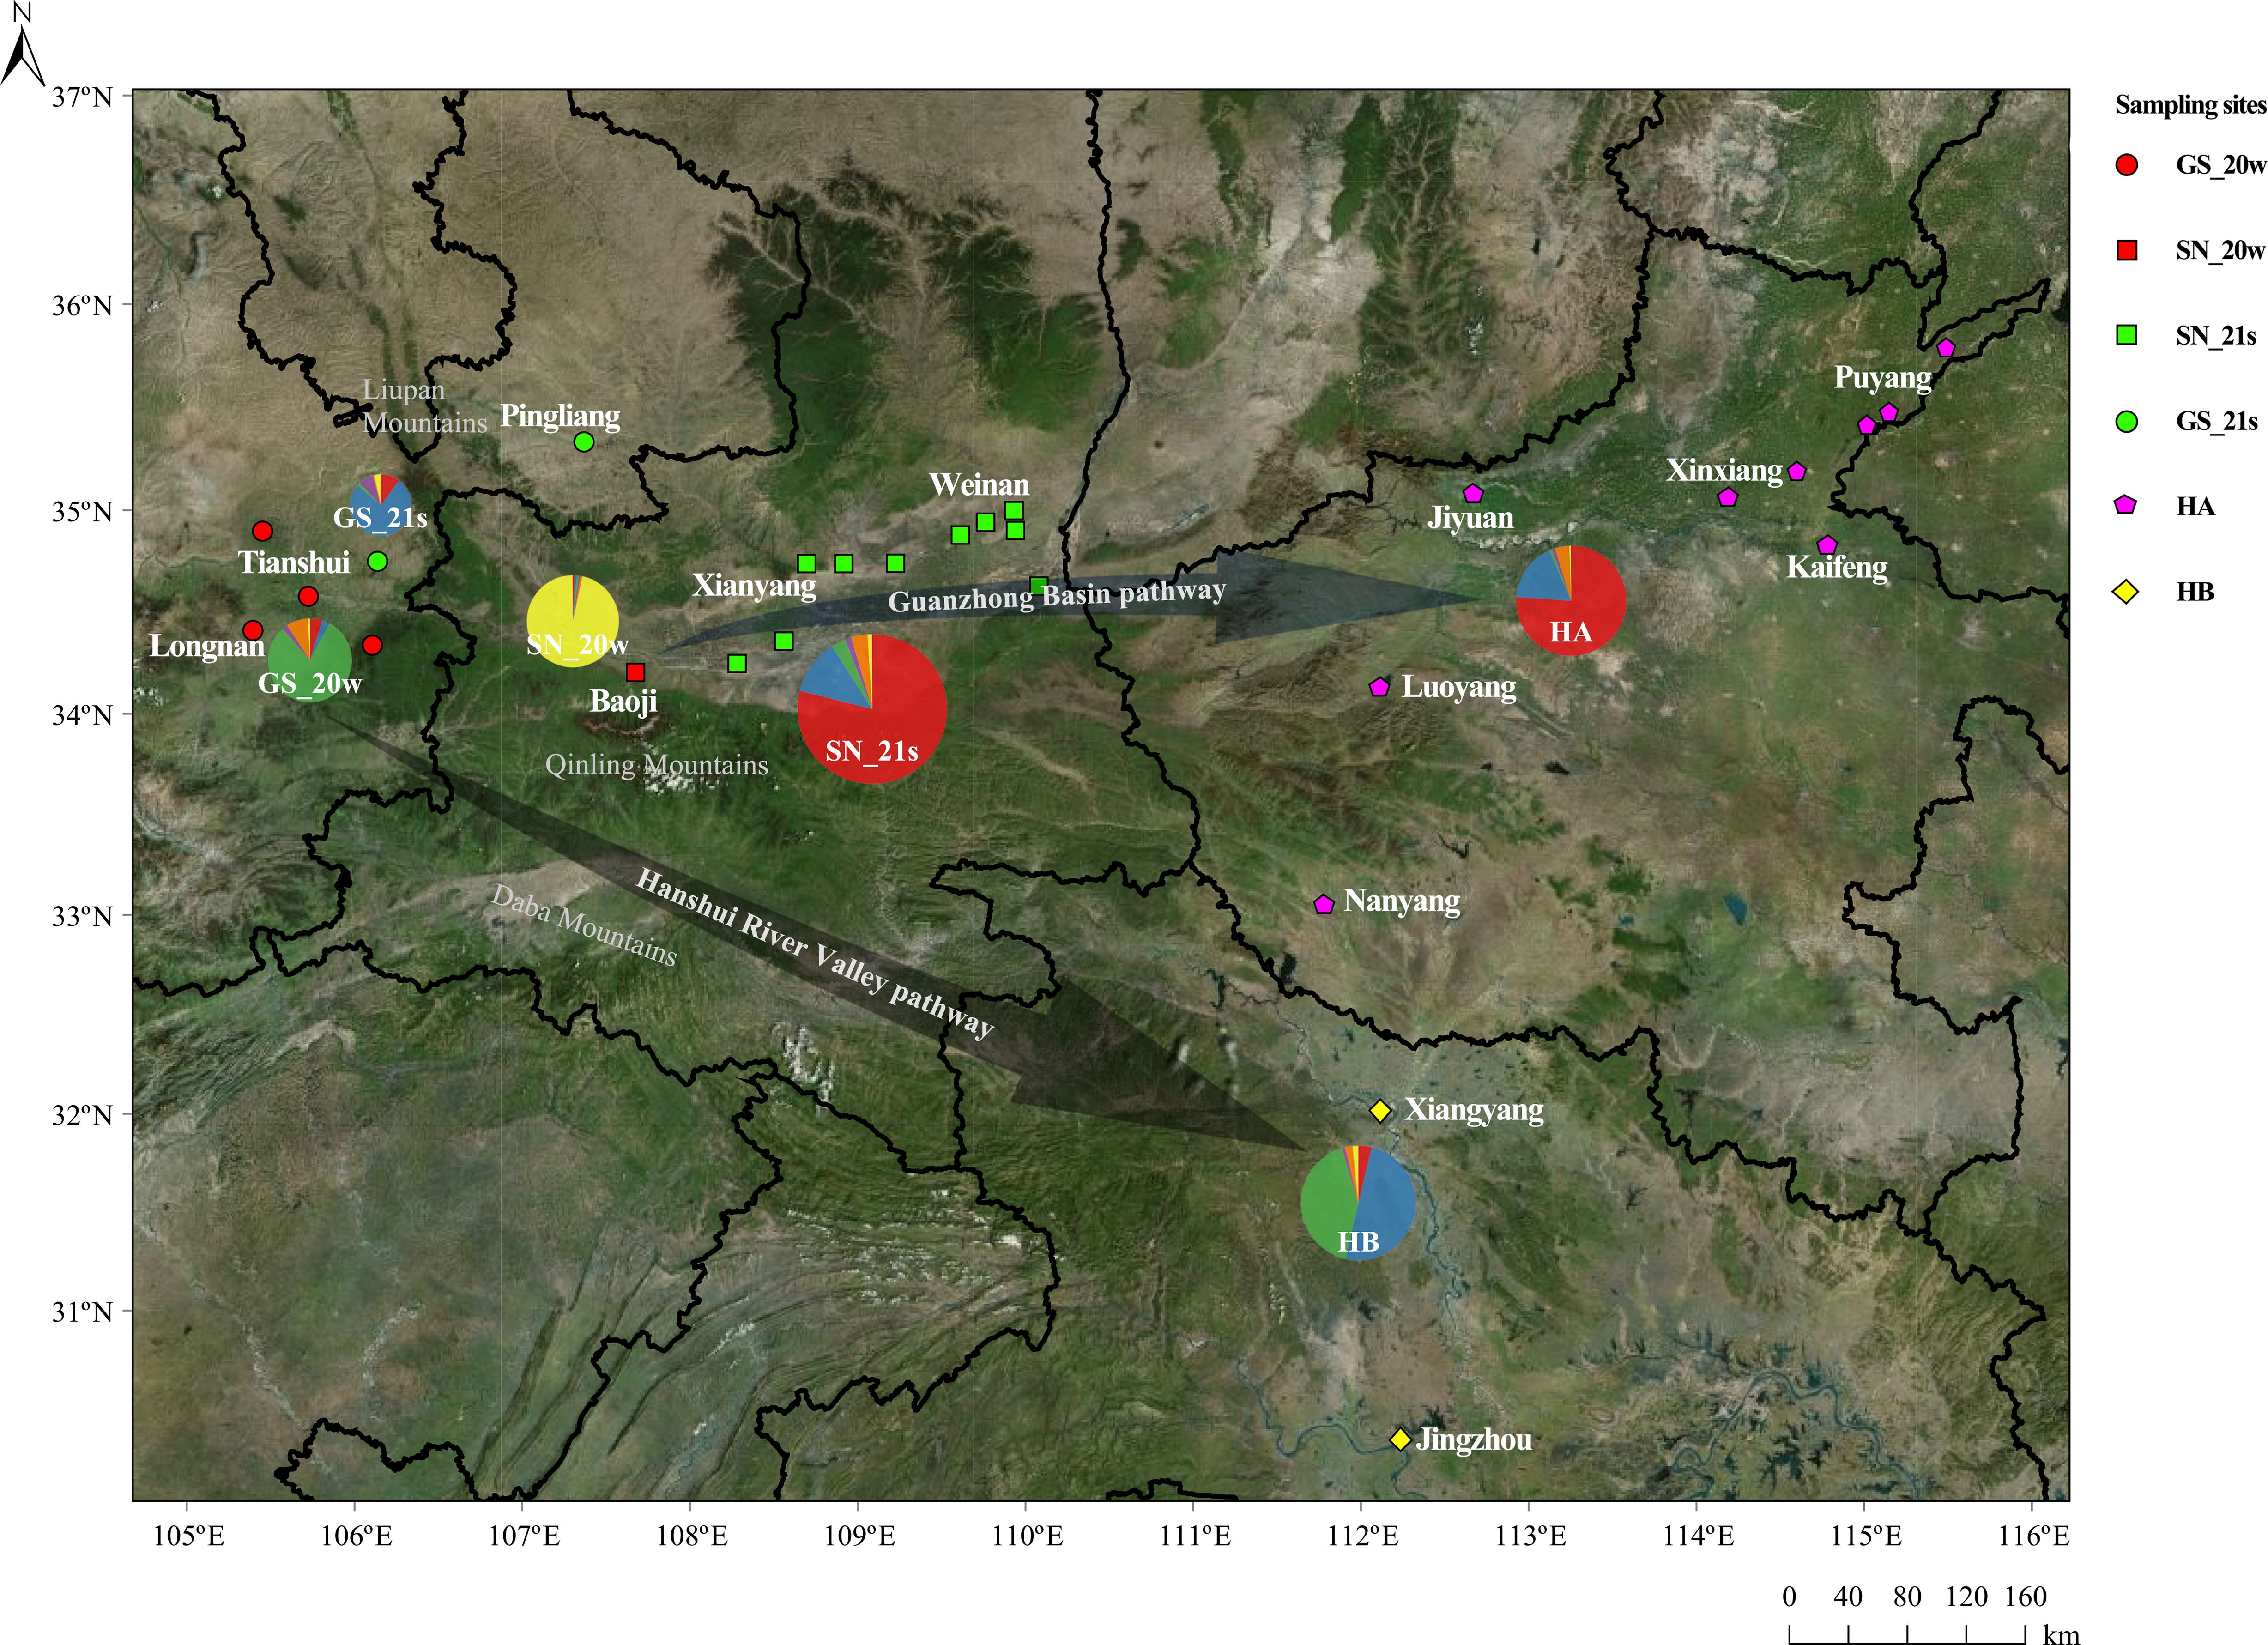
Figure 6. Sampling sites in four provinces of Gansu, Shaanxi, Henan, and Hubei were marked on topographic maps according to different Pt populations (different sampling seasons). Arrows indicated two possible pathogen pathways. The pie charts show the population structure of each population, with the same colors as the STRUCTURE analysis.
Data availability statement
The original contributions presented in the study are included in the article/Supplementary Material, further inquiries can be directed to the corresponding author/s.
Author contributions
HL: Data curation, Software, Visualization, Writing – original draft, Writing – review & editing. NZ: Formal analysis, Software, Visualization, Writing – original draft. QZ: Methodology, Visualization, Writing – original draft. LH: Methodology, Resources, Supervision, Writing – review & editing. HZ: Resources, Writing – review & editing. LG: Resources, Writing – review & editing. WC: Resources, Writing – review & editing. TL: Funding acquisition, Project administration, Resources, Supervision, Writing – review & editing.
Funding
The author(s) declare that financial support was received for the research and/or publication of this article. This study was funded by grants from the National Key Research and Development Program (2024YFD1400400), the National Natural Science Foundation of China (31671967), the China Agriculture Research System (CARS-3), the Agricultural Science and Technology Innovation Program (CAAS-ASTIP, CAAS-ZDRW202403), and the Epidemic Detection and Control of Crop Diseases and Insect Pests (2130108).
Conflict of interest
The authors declare that the research was conducted in the absence of any commercial or financial relationships that could be construed as a potential conflict of interest.
Generative AI statement
The author(s) declare that no Generative AI was used in the creation of this manuscript.
Publisher’s note
All claims expressed in this article are solely those of the authors and do not necessarily represent those of their affiliated organizations, or those of the publisher, the editors and the reviewers. Any product that may be evaluated in this article, or claim that may be made by its manufacturer, is not guaranteed or endorsed by the publisher.
Supplementary material
The Supplementary Material for this article can be found online at: https://www.frontiersin.org/articles/10.3389/fpls.2025.1558898/full#supplementary-material
Supplementary Figure 1 | Genotype accumulation curve based on population genetic analysis of 12 SSR markers.
Supplementary Figure 2 | Airflow trajectories in several sampling sites, and the ratio of each airflow trajectory showed the proportion of airflow blowing in/from that direction during the time. (A) The forward airflow trajectories of Longnan (2020.11.25–2020.11.27) in Gansu province at 1,674m; (B) The backward airflow trajectories of Jingzhou (2021.3.22–2021.3.24) in Hubei province at 1,500m; (C) The backward airflow trajectories of Xiangyang (2021.5.6–2021.5.9) in Hubei province at 1,500m; (D) The backward airflow trajectories of Luoyang (2021.3.27–2021.3.28) in Henan province at 296m; (E) The backward airflow trajectories of Jiyuan (2021.5.6–2021.5.8) in Henan province at 133m.
Supplementary Table 1 | The K-value parameters of 199 samples obtained using STRUCTURE software.
Supplementary Table 2 | The band size of the sample at each SSR locus in the study.
References
Bivand, R., Lewin-Koh, N. (2022). maptools: tools for handling spatial objects. Available online at: https://CRAN.R-project.org/package=maptools.
Brussard, P. F. (1984). Geographic patterns and environmental gradients: the central-marginal model in drosophila revisited. Annu. Rev. Ecol. Syst. 15, 25–64. doi: 10.1146/annurev.es.15.110184.000325
Bu, M., Ouyang, X., Zhou, J. (1953). How to predict the prevalence of winter wheat stripe rust in North China Plain. Agric. Commun. 12, 498–499. Available online at: https://kns.cnki.net/kcms2/article/abstract?v=ZIcs-hjNidGT9gzz44Ig7Vc37U61I-Fx_2MwLyOtr6C8X-J6YNFPZfhsDr0tHW7ypB8q_5FQvNBQdrH01rLFhnLKuqq_JvrFWgG-iCJcU1Zi-a3UYf-7fwlil8-tMzW9n2LqZQGTCVu4sH8Ci_krWdw8daokaTnx93DQxGlP_X-nwZpDVjNdyrvz235ztlEP&uniplatform=NZKPT&language=CHS.
Bu, M., Zhou, J. (1952). Occurrence and future prediction of wheat rust disease in 1952. Agric. Sci. China 4, 23. Available online at: https://kns.cnki.net/kcms2/article/abstract?v=ZIcs-hjNidHEvLwBlGtEtFG4Oip0-rVcobluuvIMzIVp61VMtvSRe6gI9faDnYa-8sIsjl3M-ri-DbhnHEcdfPmGQPE2CG-ITpeIbj-z1k6cFwNrctJgAAwLWM53Kef7AUj9H1dvTh_GLSn44cxtc44tMuO9OvI2xDf9onaDbVWsqGk3nG3rheFzGw-mCAIN&uniplatform=NZKPT&language=CHS.
Chai, Y., Pardey, P. G., Hurley, T. M., Senay, S. D., Beddow, J. M. (2020). A probabilistic bio-economic assessment of the global consequences of wheat leaf rust. Phytopathology 110, 1886–1896. doi: 10.1094/phyto-02-20-0032-r
Chen, W., Kang, Z., Ma, Z., Xu, S., Jin, S., Jiang, Y. (2013). Integrated management of wheat stripe rust caused by Puccinia striiformis f. sp. tritici in China. Sci. Agricult. Sin. 46 (20), 4254–4262. doi: 10.3864/j.issn.0578-1752.2013.20.008
Dray, S., Dufour, A.-B. (2007). The ade4 package: Implementing the duality diagram for ecologists. J. Stat. Software 22, 1–20. doi: 10.18637/jss.v022.i04
Duan, X., Enjalbert, J., Vautrin, D., Solignac, M., Giraud, T. (2003). Isolation of 12 microsatellite loci, using an enrichment protocol, in the phytopathogenic fungus Puccinia triticina. Mol. Ecol. Notes. 3, 65–67. doi: 10.1046/j.1471-8286.2003.00350.x
Evanno, G., Regnaut, S., Goudet, J. (2005). Detecting the number of clusters of individuals using the software STRUCTURE: a simulation study. Mol. Ecol. 14, 2611–2620. doi: 10.1111/j.1365-294X.2005.02553.x
Excoffier, L., Laval, G., Schneider, S. (2005). Arlequin (version 3.0): An integrated software package for population genetics data analysis. Evol. Bioinf. 1, 47–50. doi: 10.1177/117693430500100003
FAOSTAT (2022). Crops and livestock products. Available online at: https://www.fao.org/faostat/en/#data/QCL (Accessed December 5, 2024).
Harris, C. R., Millman, K. J., van der Walt, S. J., Gommers, R., Virtanen, P., Cournapeau, D., et al. (2020). Array programming with numPy. Nature 585, 357–362. doi: 10.1038/s41586-020-2649-2
Hersbach, H., Bell, B., Berrisford, P., Biavati, G., Horányi, A., Muñoz Sabater, J., et al. (2023). ERA5 hourly data on pressure levels from 1940 to present., Copernicus Climate Change Service (C3S) Climate Data Store (CDS). doi: 10.24381/cds.bd0915c6
Hoyer, S., Hamman, J. (2017). xarray: N-D labeled arrays and datasets in python. J. Open Res. Software 5, 10. doi: 10.5334/jors.148
Huang, L., Zhao, W., Xia, C., Zhao, N., Li, H., Sun, Z., et al. (2025). Wheat stripe rust inoculum from the southwest dispersed to the east Huang-Huai-Hai region through southern Anhui in China. Plant Dis. 109, 138–148. doi: 10.1094/pdis-06-24-1246-re
Huerta-Espino, J., Singh, R. P., Germán, S., McCallum, B. D., Park, R. F., Chen, W. Q., et al. (2011). Global status of wheat leaf rust caused by Puccinia triticina. Euphytica 179, 143–160. doi: 10.1007/s10681-011-0361-x
Hunter, J. D. (2007). Matplotlib: A 2D graphics environment. Comput. Sci. Eng. 9, 90–95. doi: 10.1109/mcse.2007.55
Jombart, T. (2008). adegenet: a R package for the multivariate analysis of genetic markers. Bioinformatics 24, 1403–1405. doi: 10.1093/bioinformatics/btn129
Kamvar, Z. N., Brooks, J. C., Grünwald, N. J. (2015). Novel R tools for analysis of genome-wide population genetic data with emphasis on clonality. Front. Genet. 6. doi: 10.3389/fgene.2015.00208
Kamvar, Z. N., Tabima, J. F., Grünwald, N. J. (2014). Poppr: an R package for genetic analysis of populations with clonal, partially clonal, and/or sexual reproduction. PeerJ 2, e281. doi: 10.7717/peerj.281
Li, H., Huang, L., Zhang, H., Liu, B., Gao, L., Chen, W., et al. (2024). Race and virulence dynamics of Puccinia triticina in China during 2007 to 2021. Plant Dis. 108, 256–263. doi: 10.1094/pdis-04-23-0727-sr
Li, Y., Liu, J. (2018). STRUCTURESELECTOR: A web-based software to select and visualize the optimal number of clusters using multiple methods. Mol. Ecol. Resour. 18, 176–177. doi: 10.1111/1755-0998.12719
Li, H., Zhang, Q., Wang, G., Wang, J., Chen, Z., Zhao, W., et al. (2023). Molecular evidences for population differentiation and the migration from south to north of Puccinia triticina in eastern China. Phytopathol. Res. 5, 9. doi: 10.1186/s42483-023-00163-3
Liu, T. G., Chen, W. Q. (2012). Race and virulence dynamics of Puccinia triticina in China during 2000-2006. Plant Dis. 96, 1601–1607. doi: 10.1094/pdis-06-10-0460-re
Paradis, E., Schliep, K. (2019). ape 5.0: an environment for modern phylogenetics and evolutionary analyses in R. Bioinformatics 35, 526–528. doi: 10.1093/bioinformatics/bty633
Peakall, R., Smouse, P. E. (2012). GenAlEx 6.5: genetic analysis in Excel. Population genetic software for teaching and research-an update. Bioinformatics 28, 2537–2539. doi: 10.1093/bioinformatics/bts460
Pebesma, E. (2018). Simple features for R: standardized support for spatial cector data. R. J. 10, 439–446. doi: 10.32614/RJ-2018-009
Prasad, P., Savadi, S., Bhardwaj, S. C., Gupta, P. K. (2020). The progress of leaf rust research in wheat. Fungal Biol. 124, 537–550. doi: 10.1016/j.funbio.2020.02.013
Ren, X., Wang, C., Ren, Z., Wang, J., Zhang, P., Zhao, S., et al. (2023). Genetics of resistance to leaf rust in wheat: an overview in a genome-wide level. Sustainability 15, 3247. doi: 10.3390/su15043247
Savary, S., Willocquet, L., Pethybridge, S. J., Esker, P., McRoberts, N., Nelson, A. (2019). The global burden of pathogens and pests on major food crops. Nat. Ecol. Evol. 3, 430–439. doi: 10.1038/s41559-018-0793-y
Slatkin, M. (1985). Gene flow in natural populations. Annu. Rev. Ecol. Syst. 16, 393–430. doi: 10.1146/annurev.es.16.110185.002141
Szabo, L. J., Kolmer, J. A. (2007). Development of simple sequence repeat markers for the plant pathogenic rust fungus Puccinia triticina. Mol. Ecol. Notes. 7, 708–710. doi: 10.1111/j.1471-8286.2007.01686.x
Team, R. C. (2024). R: a Language and environment for statistical computing (Vienna, Austria: R Foundation for Statistical Computing).
Teucher, A., Russell, K. (2023). rmapshaper: client for ‘mapshaper’ for ‘geospatial’ operations. Available online at: https://CRAN.R-project.org/package=rmapshaper.
Wang, Y. Q. (2014). MeteoInfo: GIS software for meteorological data visualization and analysis. Meteorol. Appl. 21, 360–368. doi: 10.1002/met.1345
Wickham, H. (2016). ggplot2: Elegant Graphics for Data Analysis (Vienna, Austria., Springer-Verlag New York: R Foundation for Statistical Computing).
Wickham H, A. M., Bryan, J., Chang, W., McGowan, L. D., François, R., Grolemund, G., et al. (2019). Welcome to the tidyverse. J. Open Source Software 4, 1686. doi: 10.21105/joss.01686
Wright, S. (1951). The genetical structure of populations. Ann. Eugen. 15, 323–354. doi: 10.1111/j.1469-1809.1949.tb02451.x
Xia, X. (2021). Over-summering regionalization and population genetic structure of Puccinia triticina in China. Chin. Acad. Agric. Sci. doi: 10.27630/d.cnki.gznky.2021.000558
Xu, Z., Li, H., Xia, X., Liu, B., Gao, L., Chen, W., et al. (2022). SSR genotypes of the Puccinia triticina in 15 provinces of China indicate regional migration in one season from east to west and south to north. Agronomy-Basel 12, 3068. doi: 10.3390/agronomy12123068
Zeng, G., He, J., Zhang, G., Zhou, S., Xue, L. (1957). On the over-wintering of the uredo-stage of wheat stem rust and leaf rust in the Dairen-Lushun district. Acta Phytopathol. Sin. 3, 87–97. doi: 10.13926/j.cnki.apps.1957.01.007
Zhang, L., Xiao, Y., Gao, Y., Zhao, N., An, Y., Yang, W., et al. (2020). Race and virulence analysis of puccinia triticina in China during 2011 to 2013. Plant Dis. 104, 2095–2101. doi: 10.1094/pdis-01-20-0047-re
Zhang, L., Zhao, P., Meng, Q., Yan, H., Liu, D. (2024). The migration, diversity, and evolution of puccinia triticina in China. Plants-Basel 13, 2438. doi: 10.3390/plants13172438
Keywords: wheat leaf rust, Puccinia triticina, population genetic structure, pathogen dispersal, genetic relationship
Citation: Li H, Zhao N, Zhang Q, Huang L, Zhang H, Gao L, Chen W and Liu T (2025) Genetic and wind field analysis of wheat leaf rust (Puccinia triticina) dispersal: from winter sources in Gansu and Shaanxi to summer epidemics in China. Front. Plant Sci. 16:1558898. doi: 10.3389/fpls.2025.1558898
Received: 11 January 2025; Accepted: 10 April 2025;
Published: 14 May 2025.
Edited by:
Muthu Venkateshwaran, University of Wisconsin–Platteville, United StatesReviewed by:
Naser Safaie, Tarbiat Modares University, IranHongli Ji, Sichuan Academy of Agricultural Sciences, China
Wen Chen, Northwest A&F University, China
Copyright © 2025 Li, Zhao, Zhang, Huang, Zhang, Gao, Chen and Liu. This is an open-access article distributed under the terms of the Creative Commons Attribution License (CC BY). The use, distribution or reproduction in other forums is permitted, provided the original author(s) and the copyright owner(s) are credited and that the original publication in this journal is cited, in accordance with accepted academic practice. No use, distribution or reproduction is permitted which does not comply with these terms.
*Correspondence: Taiguo Liu, bGl1dGFpZ3VvQGNhYXMuY24=
†These authors have contributed equally to this work
 Hongfu Li
 Na Zhao
 Qinqin Zhang1,2
 Hao Zhang
 Li Gao
 Wanquan Chen
 Taiguo Liu