Abstract
Introduction:
Precision agriculture is revolutionizing modern farming by integrating data-driven methodologies to enhance crop productivity while promoting sustainability. Traditional time series models struggle with complex agricultural data due to heterogeneity, high dimensionality, and strong spatial-temporal dependencies. These limitations hinder their ability to provide actionable insights for resource optimization and environmental protection.
Methods:
To tackle these difficulties, this research puts forward a new deep-learning-based architecture for time-series prediction that is customized for precise field crop protection. At its core, our Spatially-Aware Data Fusion Network (SADF-Net) integrates multi-modal data sources, such as satellite imagery, IoT sensor readings, and meteorological forecasts, into a unified predictive model. By combining convolutional layers for spatial feature extraction, recurrent neural networks for temporal modeling, and attention mechanisms for data fusion, SADF-Net captures intricate spatial-temporal dependencies while ensuring robustness to noisy and incomplete data. We introduce the Resource-Aware Adaptive Decision Algorithm (RAADA), which leverages reinforcement learning to translate SADF-Net’s predictions into optimized strategies for resource allocation, such as irrigation scheduling and pest control. RAADA dynamically adapts decisions based on real-time field responses, ensuring efficiency and sustainability.
Results:
The experimental findings obtained from large-scale agricultural datasets show that our framework far exceeds the existing most advanced methods in terms of the accuracy of yield prediction, resource optimization, and environmental impact mitigation.
Discussion:
This research offers a transformative solution for precision agriculture, aligning with the pressing need for advanced tools in sustainable crop management.
1 Introduction
The increasing demand for sustainable agricultural practices has led to an urgent need for accurate predictions in crop protection, particularly in the face of climate change, pest outbreaks, and resource limitations (Angelopoulos et al., 2023). Time series prediction has emerged as a critical tool in precision agriculture, enabling farmers to anticipate and mitigate risks such as disease outbreaks and pest infestations (Shen and Kwok, 2023). Traditional approaches to time series prediction, while effective in certain scenarios, are often limited by their inability to process large-scale, non-linear, and complex data derived from precision agriculture systems, which include remote sensing, weather monitoring, and soil sensors (Zhou et al., 2020). This limitation hinders both accurate crop management and the potential of adaptive decision-making frameworks to enhance yield and sustainability (Li et al., 2023). The evolution from traditional, symbol-based AI approaches to data-driven machine learning and, more recently, to deep learning and pre-trained models underscores a growing ability to address these challenges with increasing precision and scalability (Yin et al., 2023).
Early methods for time series prediction in crop protection relied on symbolic AI techniques and rule-based systems that modeled crop health and environmental factors using predefined rules and expert knowledge (Yu et al., 2023). These approaches used domain knowledge to simulate plant-pathogen interactions or to estimate pest behavior, often through mechanistic models such as epidemiological equations or statistical regression (Durairaj and Mohan, 2022). For example, models like the degree-day method or rule-based systems were used to predict pest emergence or disease onset (Chandra et al., 2021). While these methods were interpretable and grounded in agricultural science, they were constrained by their dependence on accurate and comprehensive domain knowledge (Fan et al., 2021). they struggled with adapting to dynamic and highly variable field conditions, as they lacked mechanisms to incorporate real-time data or learn from observed patterns (Hou et al., 2022). As a result, these symbolic approaches were not only labor-intensive but also lacked generalizability, making them unsuitable for large-scale, high-resolution precision agriculture systems.
The transition to data-driven methods brought significant advancements in time series prediction for crop protection by leveraging machine learning algorithms (Lindemann et al., 2021). Techniques such as support vector machines (SVMs), random forests, and gradient-boosted trees became popular due to their ability to uncover patterns from data without requiring explicit domain knowledge (Dudukcu et al., 2022). In precision agriculture, these methods were used to process sensor data, weather records, and imagery to predict pest infestations or crop diseases (Amalou et al., 2022). For instance, SVMs were applied to classify crop health based on hyperspectral data, while random forests were used to identify key environmental factors contributing to pest outbreaks (Xiao et al., 2021). Despite these improvements, data-driven methods still faced limitations, particularly in handling temporal dependencies and long-term sequences, as they relied on feature engineering and lacked the ability to capture spatial and temporal correlations effectively (Zheng and Chen, 2021). these models were computationally expensive for large datasets, limiting their scalability in real-time agricultural applications.
The emergence of deep learning and pre-trained models has revolutionized time-series forecasting, particularly in complex domains like precision agriculture (Wang et al., 2021b). Recurrent neural networks (RNNs), long short-term memory (LSTM) networks, and convolutional neural networks (CNNs) have shown remarkable capabilities in learning temporal and spatial patterns from large datasets (Xu et al., 2020). In the context of precision crop protection, LSTMs have been used to model pest population dynamics, while CNNs have been applied to satellite imagery for disease detection (Karevan and Suykens, 2020). More recently, transformer-based models and pre-trained architectures have set new benchmarks in accuracy and adaptability (Altan and Karasu, 2021). These models excel in capturing multi-scale dependencies and integrating heterogeneous data sources, such as weather forecasts, soil health, and remote sensing data (Wen et al., 2021). transfer learning allows pre-trained models to generalize across different crops and regions, reducing the need for extensive labeled datasets. these methods are computationally intensive and require significant expertise for implementation, which can pose challenges for widespread adoption in resource-constrained settings.
To address the limitations of previous methods, we propose an innovative deep learning framework specifically designed for precision crop protection based on accurate time series forecasting. By integrating domain knowledge with advanced neural architectures, we aim to overcome the challenges of interpretability, scalability, and adaptability. The proposed method leverages pre-trained models to incorporate multi-modal data and uses attention mechanisms to focus on critical temporal patterns, thereby enabling precise predictions even under uncertain conditions. Our approach prioritizes computational efficiency, ensuring that it can be deployed in real-time scenarios and resource-limited environments.
-
The integration of attention mechanisms and pre-trained architectures allows our model to focus on critical temporal patterns, improving interpretability and robustness in predictions.
-
The framework supports multi-modal data inputs and generalizes across different crops and regions, making it highly adaptable and efficient for diverse agricultural settings.
-
Extensive testing on benchmark datasets demonstrates significant improvements in prediction accuracy and computational efficiency compared to existing deep learning models.
2 Related work
2.1 Deep learning for time series forecasting
Deep learning techniques have emerged as powerful tools for time series forecasting, leveraging their ability to model complex temporal dependencies and capture non-linear patterns in data (Wang et al., 2021a). Recurrent Neural Networks (RNNs), particularly Long Short-Term Memory (LSTM) networks and Gated Recurrent Units (GRUs), are widely used for such tasks due to their capability to address vanishing gradient issues and effectively capture long-term dependencies (Morid et al., 2021). In the agricultural domain, these architectures have been applied to predict various environmental factors, including temperature, humidity, and precipitation, which are critical for field crop protection (Widiputra et al., 2021). Attention mechanisms, integrated into sequence models, have further enhanced performance by allowing the model to prioritize the most significant time steps, thus improving forecasting accuracy (Moskolaï et al., 2021). Recent advancements also include the application of Transformer architectures to time series prediction. Transformers, initially designed for natural language processing, have been successfully adapted for time series due to their scalability and capability to capture long-term dependencies without the constraints of sequential processing (Ni et al., 2018). Such models have been employed to predict pest infestation trends, soil moisture levels, and crop yields, demonstrating their potential in precision agriculture (Yu et al., 2025). hybrid approaches that combine deep learning with statistical methods, such as ARIMA or wavelet transforms, have been explored to enhance predictive performance by integrating domain knowledge with data-driven learning.
2.2 Precision agriculture and data-driven methods
Precision agriculture relies heavily on data-driven approaches to optimize resource usage and improve crop productivity (Yang and Wang, 2021). With the advent of Internet of Things (IoT) devices, remote sensing technologies, and UAV-based imaging systems, vast amounts of spatiotemporal data have become available for analysis (Ruan et al., 2021). Machine learning techniques, particularly deep learning, have played a critical role in processing and analyzing this data (Kim and King, 2020). Convolutional Neural Networks (CNNs), for example, have been utilized to analyze aerial imagery and satellite data to monitor crop health, detect weeds, and identify pest infestations. Combined with time series data, such as weather patterns and soil conditions, these methods enable a more holistic understanding of field dynamics (Ni et al., 2017). advancements in sensor technology have enabled real-time monitoring of environmental factors, generating high-resolution time series data that can be fed into predictive models to anticipate threats such as fungal diseases or pest outbreaks. Integrating these predictions into precision crop protection systems enables timely and targeted interventions, reducing pesticide use and environmental impact (Chen et al., 2024). The integration of Geographic Information Systems (GIS) with deep learning models has also enhanced spatial forecasting capabilities, allowing for the creation of site-specific management zones. Research in this area has focused on developing robust models that can generalize across diverse agricultural conditions, addressing challenges such as data sparsity, noise, and the need for domain-specific customization.
2.3 Sustainability in crop protection
Sustainability has become a central theme in modern agricultural practices, emphasizing the need for reduced chemical usage, minimized environmental impact, and improved resource efficiency (Kang et al., 2020). Deep learning-based models for time series forecasting play a crucial role in achieving these goals by enabling precise and proactive interventions (Wu et al., 2020). By predicting pest and disease outbreaks, irrigation needs, and nutrient deficiencies, these models allow for targeted applications of pesticides, water, and fertilizers, reducing wastage and runoff (Hu et al., 2020). Studies have highlighted the potential of integrating crop growth models with time series prediction frameworks to optimize field management strategies while maintaining ecological balance. the use of multispectral and hyperspectral imaging, combined with temporal deep learning methods, has enabled early detection of crop stress and disease, further contributing to sustainable practices. Another key focus is the development of interpretable deep learning models that provide actionable insights to farmers and agronomists (Ni et al., 2016). Techniques such as SHAP (SHapley Additive exPlanations) and LIME (Local Interpretable Modelagnostic Explanations) have been applied to enhance the transparency of predictions, fostering trust in AI-driven systems. research has explored the incorporation of renewable energy-powered sensors and edge computing devices to support low-cost and sustainable deployment of predictive systems in remote and resource-constrained regions (Yan et al., 2024). These advancements align with global initiatives to promote sustainable agriculture and ensure food security in the face of climate change and population growth.
3 Method
3.1 Overview
Precision agriculture has emerged as a transformative approach to modern farming, leveraging data-driven methodologies to enhance crop productivity, optimize resource utilization, and reduce environmental impacts. This subsection introduces the proposed methodology to address specific challenges within precision agriculture. We present a detailed outline of the subsequent subsections, which collectively define the core contributions of this research. In this work, we aim to tackle the problem of efficiently integrating multi-modal data sources into a cohesive decision-making framework for precision agriculture. Our method emphasizes scalability and robustness to heterogeneous data, which are critical in real-world agricultural scenarios.
The first component of our framework, outlined in Section 3.2, provides the formalization of the problem domain. Here, we establish the mathematical and computational foundations, introducing key notations, data representations, and the modeling of spatial and temporal dependencies inherent in agricultural processes. This section also highlights the challenges posed by noisy and incomplete data, which are common in field conditions, and sets the stage for the subsequent methodological innovations. Building upon this foundation, Section 3.3 presents our novel model, termed Spatially-Aware Data Fusion Network (SADF-Net). SADF-Net is designed to integrate diverse data sources into a unified predictive framework. The architecture employs advanced deep learning techniques to capture spatial correlations across fields and temporal dynamics in crop growth. This model is tailored to extract actionable insights from complex, high-dimensional agricultural datasets. in Section 3.4, we describe a new optimization strategy, referred to as the Resource-Aware Adaptive Decision Algorithm (RAADA). This strategy focuses on deploying the predictions of SADF-Net to enable precise and efficient interventions, such as irrigation scheduling, fertilization optimization, and pest control. The algorithm incorporates domain-specific constraints and leverages reinforcement learning to iteratively refine decisions based on observed outcomes.
3.2 Preliminaries
In this part, we define the problem formally of decision-making in precision agriculture and establish the mathematical framework underpinning our approach. This includes the definition of key variables, constraints, and the computational challenges associated with integrating multi-modal agricultural data.
Precision agriculture involves optimizing resource allocation and improving crop productivity by leveraging diverse datasets such as satellite imagery, sensor measurements, weather forecasts, and soil profiles. Let denote the set of agricultural fields under consideration, where Firepresents the i-th field characterized by spatial and temporal features. Each field Fi is further subdivided into grid cells, indexed by , representing a spatial discretization.
We define the state of the agricultural system over a temporal horizon. as a collection of feature maps (Equation 1):
where: represents crop-specific data, including growth stage, health, and phenotypic characteristics for field Fi at time t. captures environmental data, such as temperature, humidity, and precipitation, obtained from external meteorological sources. represents resource-related variables, including irrigation, fertilization, and pest control efforts. denotes historical data for the field, encapsulating past observations of yield, resource usage, and interventions.
The system’s evolution is influenced by various external and internal factors, which we encode as a dynamical system (Equation 2):
where is a nonlinear transition function modeling the temporal evolution of the system, represents the control inputs, and is the noise term accounting for uncertainties and measurement errors.
The overarching goal is to optimize a set of control decisions.
over 𝒯 to maximize crop productivity while minimizing resource usage and environmental impact. This can be mathematically formulated as a multi-objective optimization problem (Equation 3):
where: is the predicted yield for field at time , represents the cost associated with resources such as water, fertilizers, and pesticides, captures environmental penalties, such as nutrient leaching or greenhouse gas emissions, , , and are weights balancing the trade-offs between productivity, cost, and sustainability.
The optimization is subject to domain-specific constraints: Resource Budget (Equation 4):
where ℬ is the total available resource budget. Crop-Specific Requirements (Equation 5):
ensuring that decisions align with agronomic best practices. Environmental Limits (Equation 6):
imposing upper bounds on environmental impacts.
3.3 Spatially-Aware Data Fusion Network
In this subsection, we propose a novel predictive framework termed Spatially-Aware Data Fusion Network (SADF-Net). The SADF-Net model is designed to integrate multi-modal agricultural data, capture spatial-temporal dependencies, and generate accurate predictions for field-specific variables, such as yield, resource requirements, and environmental impacts (As shown in Figure 1).
Figure 1

The Spatially-Aware Data Fusion Network (SADF-Net) integrates multi-modal agricultural data. It combines convolutional neural networks (CNNs) for spatial feature extraction, gated recurrent units (GRUs) for temporal dependency modeling, and an attention-based fusion mechanism. The model processes text and image inputs through separate encoder branches—an artificial neural network (ANN) branch for textual data and a spiking neural network (SNN) branch for image data—before fusing them for improved predictive accuracy in agricultural applications.
3.3.1 Spatial feature extraction
The architecture of SADF-Net integrates convolutional neural networks (CNNs) for spatial feature extraction, recurrent neural networks (RNNs) for temporal modeling, and an attention mechanism for multi-modal data fusion, ensuring a comprehensive learning framework for spatiotemporal prediction tasks.
Each field Fi at time step t is represented by a multi-channel feature tensor , where H and W represent the spatial dimensions of the grid cells, ensuring the representation of spatial layout and resolution. The number of input channels, C, includes various geospatial and environmental data sources such as satellite-derived vegetation indices, soil moisture, precipitation levels, temperature variations, and past resource usage records.
To effectively extract spatial correlations among grid cells, a convolutional layer is applied to Xi,t (Equation 7):
where and denote the trainable convolutional kernel weights and biases, respectively. The function represents A nonlinear activation function, like ReLU or LeakyReLU, and ∗ represents the convolution operation applied over the spatial dimensions. This process generates spatially-aware feature maps , where C1 is the number of output feature channels, capturing hierarchical spatial dependencies.
To further enhance spatial feature representation and capture deeper-level patterns, additional convolutional layers with increasing receptive fields are applied (Equation 8):
Each layer refines feature extraction by progressively capturing higher-level spatial relationships. The final spatial feature representation is denoted as (Equation 9):
where represents the final number of extracted spatial feature channels.
To introduce spatial invariance and reduce computational complexity, a max-pooling operation is applied (Equation 10):
where , and denote the reduced spatial dimensions, controlled by the pooling kernel size.
For enhanced spatial understanding, a spatial self-attention mechanism is applied to highlight important regions within the feature map. The attention weights are computed as (Equation 11):
where Q and K are linear projections of Pi,t, and d is the dimensionality scaling factor. The attended spatial features are then computed as (Equation 12):
where V is another linear projection of . This mechanism ensures that regions with higher relevance to the target task receive greater emphasis.
3.3.2 Temporal dependency modeling
To accurately capture the temporal dynamics of field conditions, we utilize a gated recurrent unit (GRU) network, which is a variant of recurrent neural networks (RNNs) designed to address the vanishing gradient problem and efficiently capture long-range dependencies in sequential data. The GRU updates its hidden state as follows (Equation 13):
where Denotes the compressed spatial feature vector obtained at a specific time step t, and denotes the hidden state with dimensionality dh. The GRU employs gating mechanisms to selectively retain and update information over time, ensuring effective temporal feature extraction.
The GRU consists of two primary gates: the update gate and the reset gate. The update gate controls how much of the previous hidden state should be carried forward, while the reset gate determines the extent to which the past hidden state should be ignored. These gates are defined as (Equations 14, 15):
where ri,t and ui,t are the reset and update gates, respectively. The trainable weight matrices and control the transformation of input and hidden state, while br, bu ∈ Rdh are the corresponding bias terms. The activation function represents the element-wise sigmoid function, ensuring that gate values remain between 0 and 1.
The candidate hidden state is computed as (Equation 16):
where ⊙ represents the element-wise Hadamard product. The reset gate modulates the influence of the previous hidden state, enabling the GRU to discard irrelevant historical information. the new hidden state is obtained as (Equation 17):
This equation balances the retention of past information and the integration of newly computed features. The GRU’s ability to selectively update its hidden state allows it to effectively capture temporal dependencies while mitigating the issue of vanishing gradients.
3.3.3 Multi-modal data fusion
To effectively integrate multiple data sources, we introduce an attention mechanism that learns the relative importance of each modality (As shown in Figure 2).
Figure 2
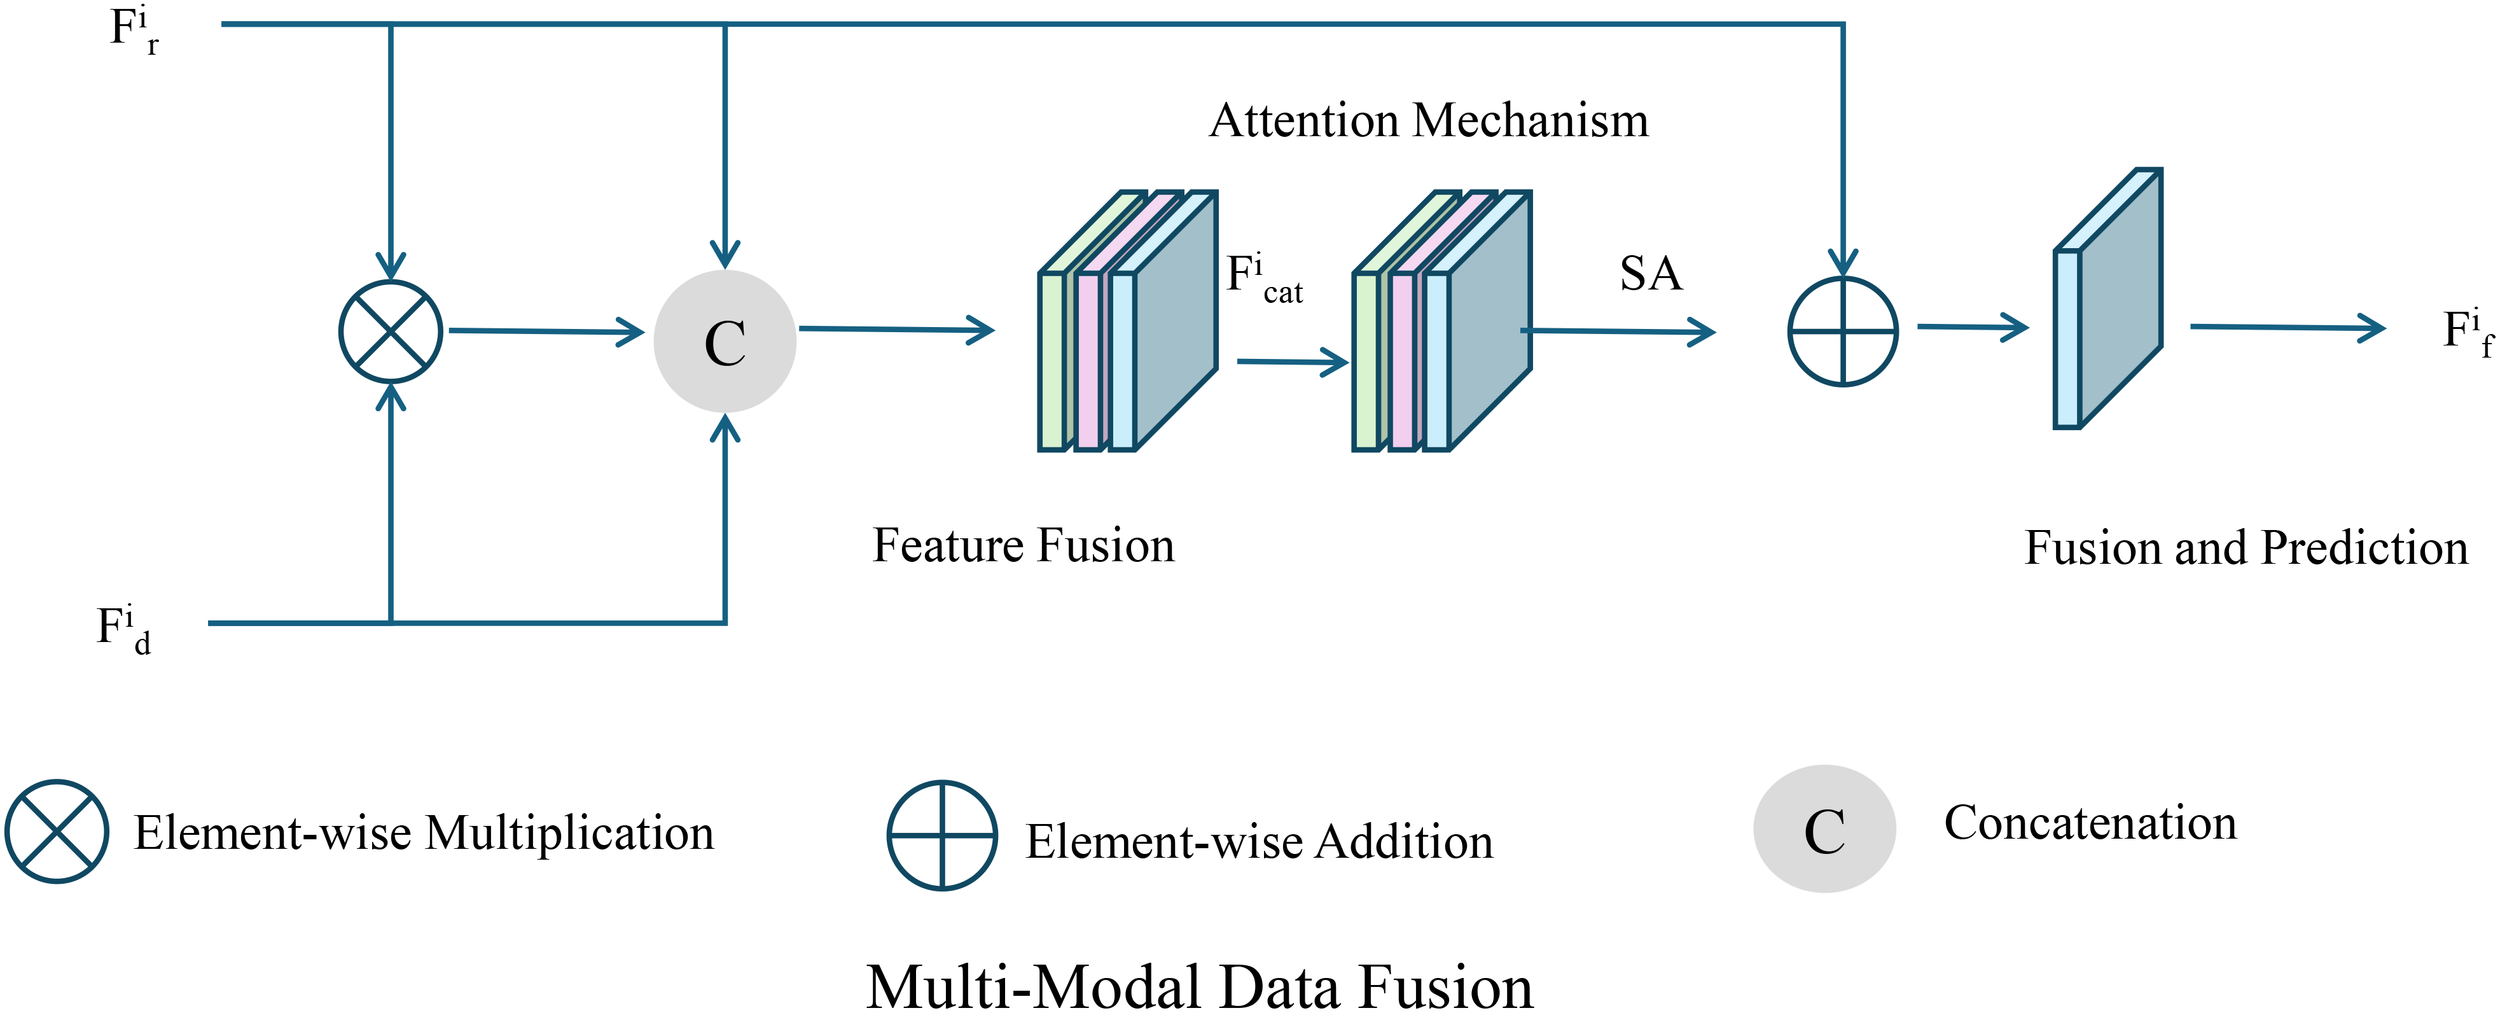
Illustration of the proposed multi-modal data fusion framework. The framework employs an attention mechanism to adaptively learn the relative importance of each modality and integrates a dynamically weighted multi-task loss function, enabling accurate prediction of yield, resource requirements, and environmental impacts.
Given a set of K data modalities , the attention weights αkare computed as (Equation 18):
where q is a query vector, and Wkare learnable parameter matrices specific to each modality Mk. This attention mechanism ensures that information is weighted adaptively, allowing the most relevant modalities to contribute more significantly to the final decision.
Using the computed attention weights, we construct the fused feature representation fi as follows (Equation 19):
Once the fused feature vector is obtained, it is passed through a fully connected neural network (FC) to predict key variables such as yield , resource requirements , and environmental impacts (Equation 20):
where FC(·) represents a fully connected network with multiple hidden layers, enabling the extraction of high-level nonlinear features for accurate prediction.
To train this model, we use a multi-task loss function that balances accuracy across multiple prediction tasks. Specifically, the loss function ℒ is defined as (Equation 21):
where are hyperparameters controlling the relative importance of each task. To further improve training stability, we adopt a dynamic weighting strategy that adjusts the loss contribution of each task based on its uncertainty (Equation 22):
where σk represents the uncertainty of each task. This approach helps the model dynamically balance different objectives during training.
We employ gradient clipping to prevent gradient explosion and use the AdamW optimizer to update the model parameters (Equation 22):
where η is the learning rate, and mt and vt denote the first and second moment estimates of the gradients, respectively. AdamW extends the traditional Adam optimizer by incorporating weight decay, enhancing the model’s generalization capability.
The final model predictions can be normalized using Softmax or Sigmoid functions, depending on the specific task. For instance, in a classification setting, the output probabilities are computed as (Equation 24):
where C is the number of classes, and Wc represents the learnable parameters associated with class c.
SADF-Net is designed to generalize across different crops, climatic conditions, and geographic regions by integrating multi-modal data sources, including satellite imagery, IoT sensor readings, and meteorological forecasts. The model’s spatial attention mechanism enables it to adapt to regional variations in soil composition, crop physiology, and environmental factors, ensuring robust predictions across diverse agricultural settings. By capturing spatial-temporal dependencies, SADF-Net effectively models the dynamic interactions between crops and their environment, improving yield estimation and risk assessment for various cultivation systems. The inclusion of climatic factors further enhances the model’s adaptability, allowing it to dynamically adjust predictions based on precipitation, temperature fluctuations, and humidity levels. This capability supports precision farming strategies by optimizing irrigation scheduling in arid regions and mitigating disease risks in humid or temperate zones. Transfer learning techniques enable SADF-Net to leverage knowledge from well-annotated datasets and apply it to new crops and regions with limited ground-truth data, making it a scalable solution for large-scale agricultural applications. While SADF-Net exhibits strong generalization capabilities, future improvements will focus on enhancing adaptability through self-supervised learning and domain adaptation techniques. Expanding the training dataset with more diverse crops and climatic conditions will further strengthen the model’s robustness, ensuring its applicability to a wider range of agricultural ecosystems.
3.4 Resource-Aware Adaptive Decision Algorithm
In this subsection, we introduce the Resource-Aware Adaptive Decision Algorithm (RAADA), a novel strategy designed to translate the predictions of the SADF-Net model into precise, actionable interventions. RAADA integrates domain-specific constraints, resource efficiency, and adaptability to dynamic field conditions. By leveraging reinforcement learning and optimization techniques, the algorithm ensures effective decision-making for maximizing productivity while minimizing resource usage and environmental impact (As shown in Figure 3).
Figure 3
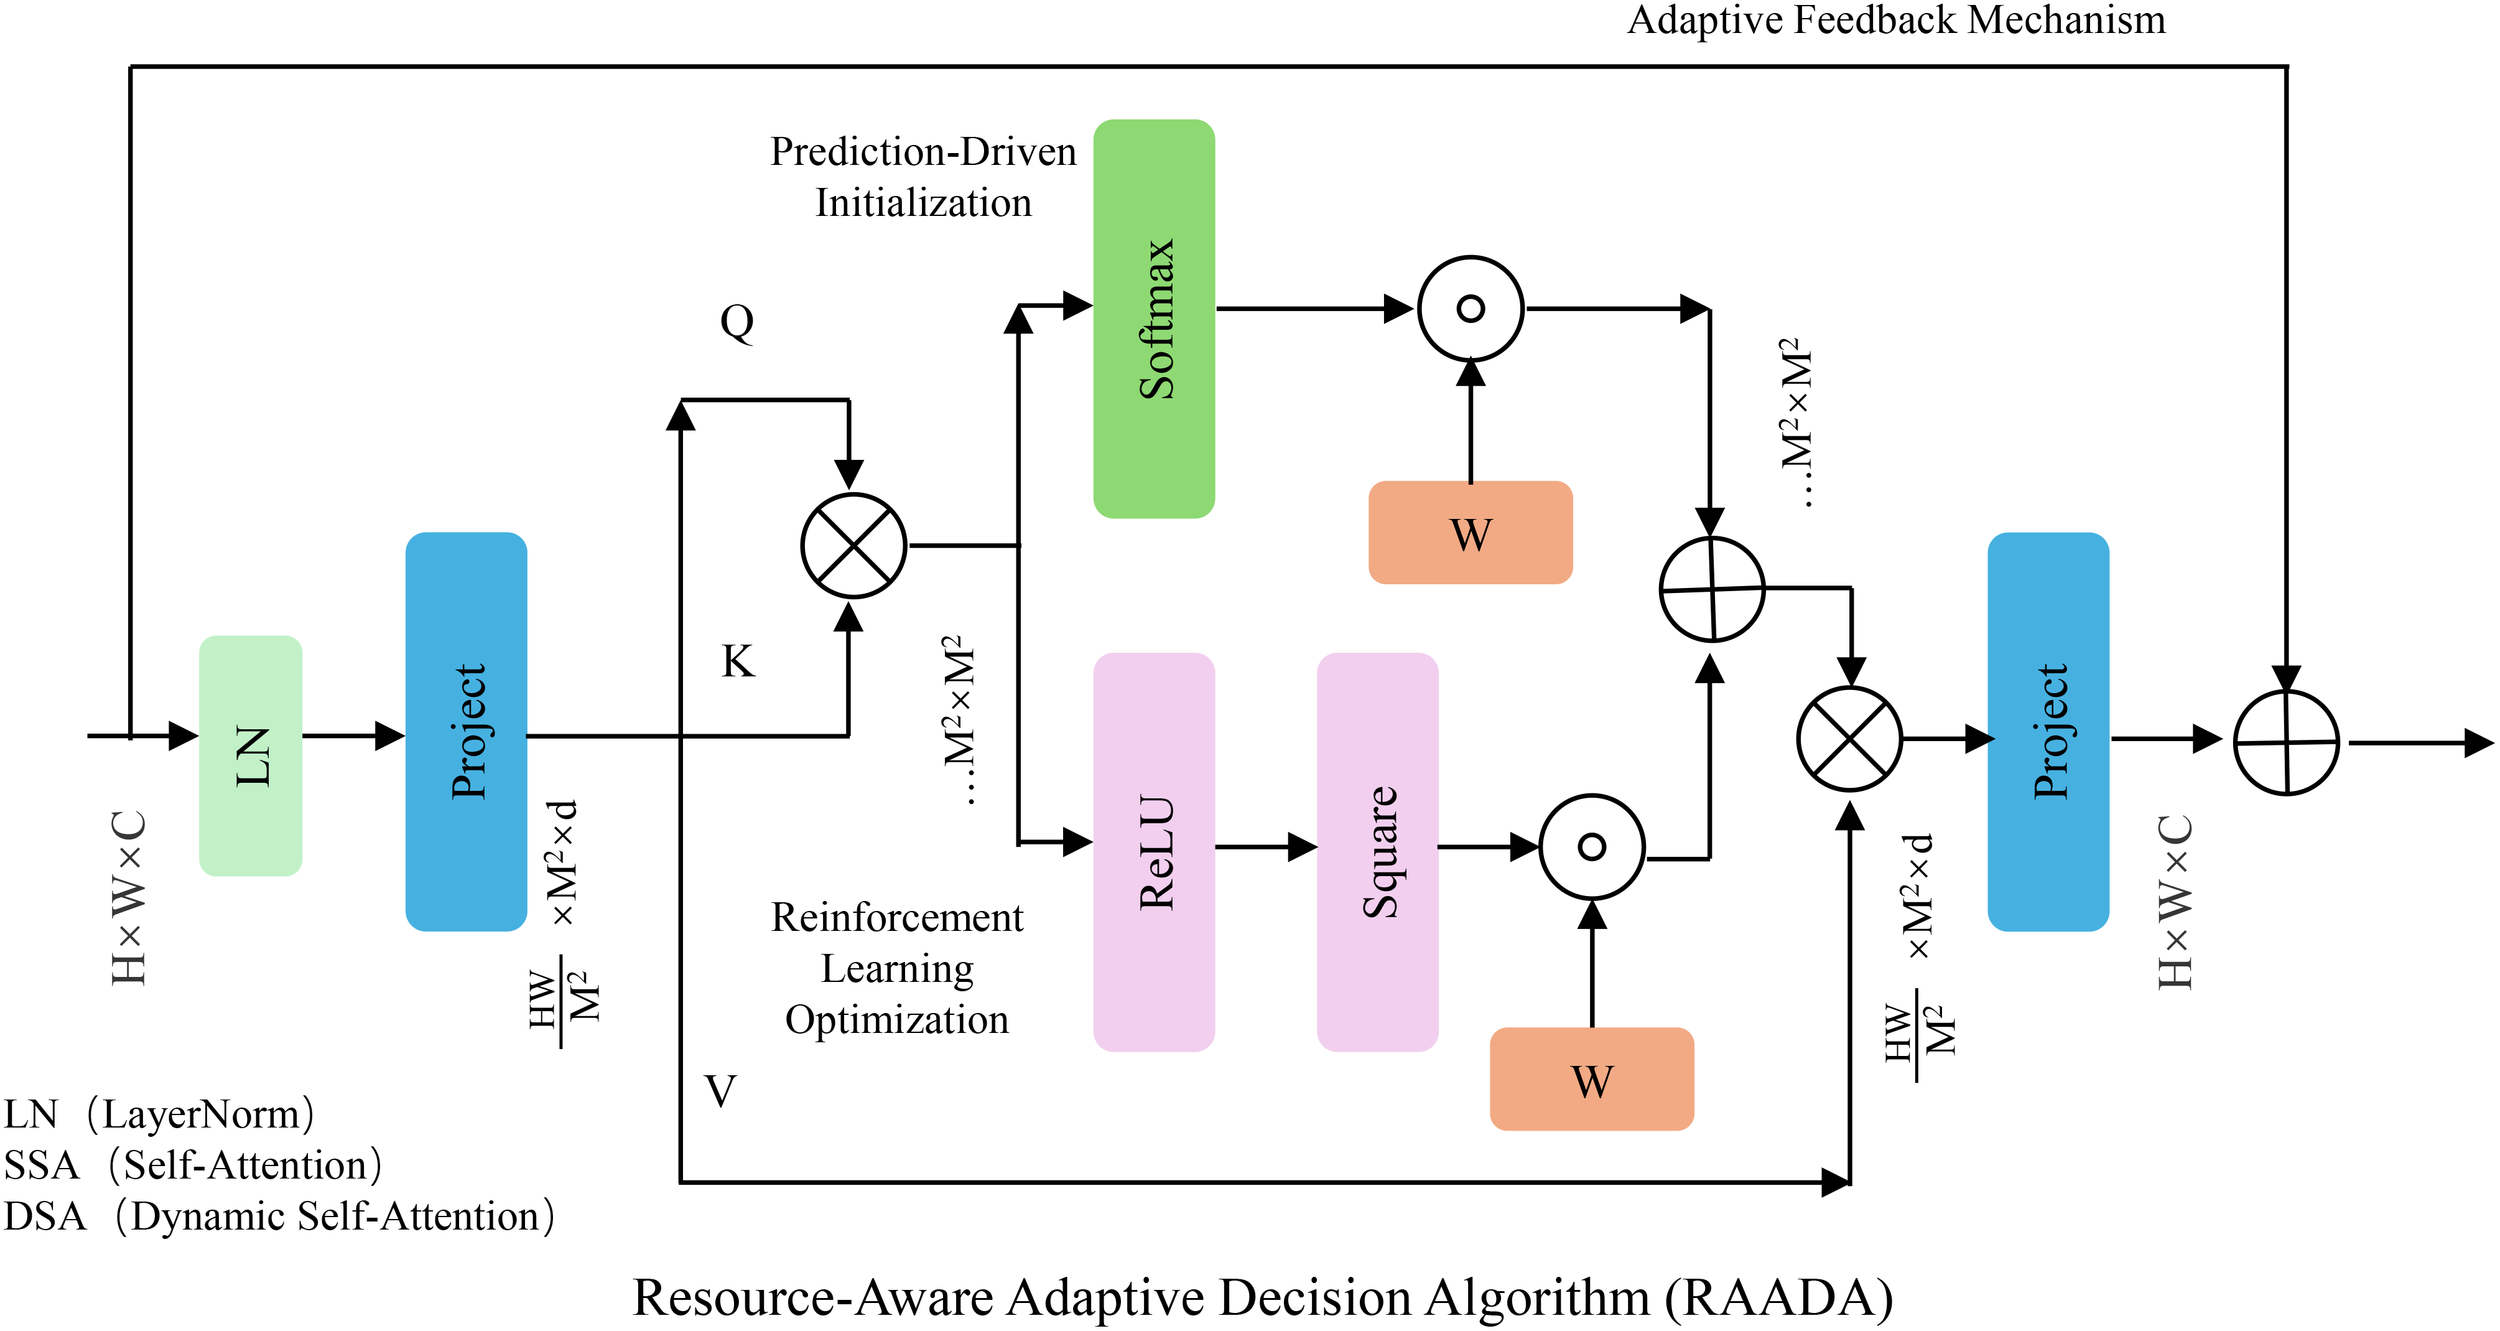
The figure illustrates the RAADA framework, which integrates prediction-driven initialization, reinforcement learning optimization, and an adaptive feedback mechanism to enhance resource allocation strategies. The model utilizes self-attention and dynamic self-attention modules to process input features, applying reinforcement learning for decision optimization while ensuring domain-specific constraints. By incorporating an iterative correction strategy and confidence interval estimation, RAADA refines control actions to balance productivity, cost, and environmental sustainability efficiently.
3.4.1 Prediction-driven initialization
The goal of RAADA is to generate a sequence of control actions , where represents resource allocations for field Fi at time t. The control actions are designed to optimize the objective (Equation 25):
where denotes the crop yield, represents the cost associated with resource allocation, and εi,tquantifies the environmental impact. The coefficients are weighting parameters that balance productivity, cost, and sustainability. The optimization problem is subject to the following constraints.
Resource Budget Constraint (Equation 26):
where ℬ is the total available resource budget, ensuring that the total resource allocation does not exceed constraints imposed by financial and logistical limitations.
Crop-Specific Requirements (Equation 27):
where di,t represents the field-specific agronomic conditions, and g(·) is a function ensuring that actions align with agronomic best practices, such as maintaining soil health and adhering to crop growth cycles.
Environmental Impact Constraint (Equation 28):
This ensures that resource allocation decisions do not cause excessive environmental degradation, such as water contamination, greenhouse gas emissions, or soil depletion.
To efficiently search for an optimal control policy, RAADA begins with a prediction-driven decision initialization. SADF-Net provides predictive estimates , , and as priors for guiding the initial decision-making process. These priors help in warm-starting the optimization algorithm and improving convergence efficiency.
The algorithm solves a relaxed optimization problem to obtain an initial estimate (Equation 29):
subject to the constraints outlined above. The parameters determine the relative importance of each prediction error term. The objective function ensures that the initialized control actions remain close to the predicted values while allowing for domain-specific constraints to shape the decision.
To further refine initialization, the optimization problem incorporates additional regularization terms to promote smoothness and feasibility (Equation 30):
where the term penalizes abrupt changes in control actions, ensuring that resource allocation strategies remain temporally consistent.
The initialized control actions are further refined using an iterative correction strategy (Equation 31):
where is the original optimization objective, η is the step size, and represents the gradient of the objective function with respect to the control actions. This iterative update ensures that the initialized control actions move toward the optimal solution while maintaining feasibility with respect to constraints.
A projection step is introduced to ensure that the updated control actions satisfy all constraints (Equation 32):
where (·) denotes projection onto the feasible set defined by the constraints. This ensures that resource allocations remain valid in practical applications.
3.4.2 Reinforcement learning optimization
To handle real-world uncertainties and dynamic conditions, RAADA employs a reinforcement learning framework where the decision-making process is formulated as a Markov Decision Process (MDP). The MDP is characterized by a tuple , where S represents the state space, A is the action space, P denotes the transition probabilities, R is the reward function, and is the discount factor.
The state at time t, denoted as Equation 33:
includes the field conditions and past control actions . The action corresponds to adjustments in the resource allocation strategy, formulated as Equation 34:
The reward function is defined to balance multiple objectives such as productivity, cost, and environmental impact (Equation 35):
where denotes yield or productivity, represents operational cost, and εi,t quantifies environmental impact. The parameters are tunable Coefficients that define the relative significance of each term.
The transition dynamics governing the system are modeled as Equation 36:
where Φ represents the deterministic state transition function, and ϵtcaptures stochastic uncertainties in the environment.
To optimize resource allocation, RAADA learns a policy , parameterized by θ, that maximizes the expected cumulative reward (Equation 37):
The policy is trained using Proximal Policy Optimization (PPO), a widely used policy gradient method that enhances training stability. The PPO loss function is given by Equation 38:
where Equation 39:
is the probability ratio comparing the new and old policy distributions, is the advantage function estimating the relative value of an action, and ϵ is the clipping parameter that prevents excessively large updates, ensuring stable learning.
The advantage function is computed using Generalized Advantage Estimation (GAE) (Equation 40):
where λ is a decay parameter and δtis the temporal difference error defined as Equation 41:
The value function is updated using the squared error loss (Equation 42):
where is the bootstrap estimate of the true state value.
To further stabilize learning, entropy regularization is applied to encourage policy exploration (Equation 43):
where β is the entropy coefficient.
The final objective function of PPO combines policy loss, value loss, and entropy regularization (Equation 44):
where c1 and c2 are weighting coefficients.
3.4.3 Adaptive feedback mechanism
RAADA employs an adaptive feedback mechanism to dynamically adjust decision-making strategies, optimizing the efficiency and stability of resource allocation (As shown in Figure 4).
Figure 4
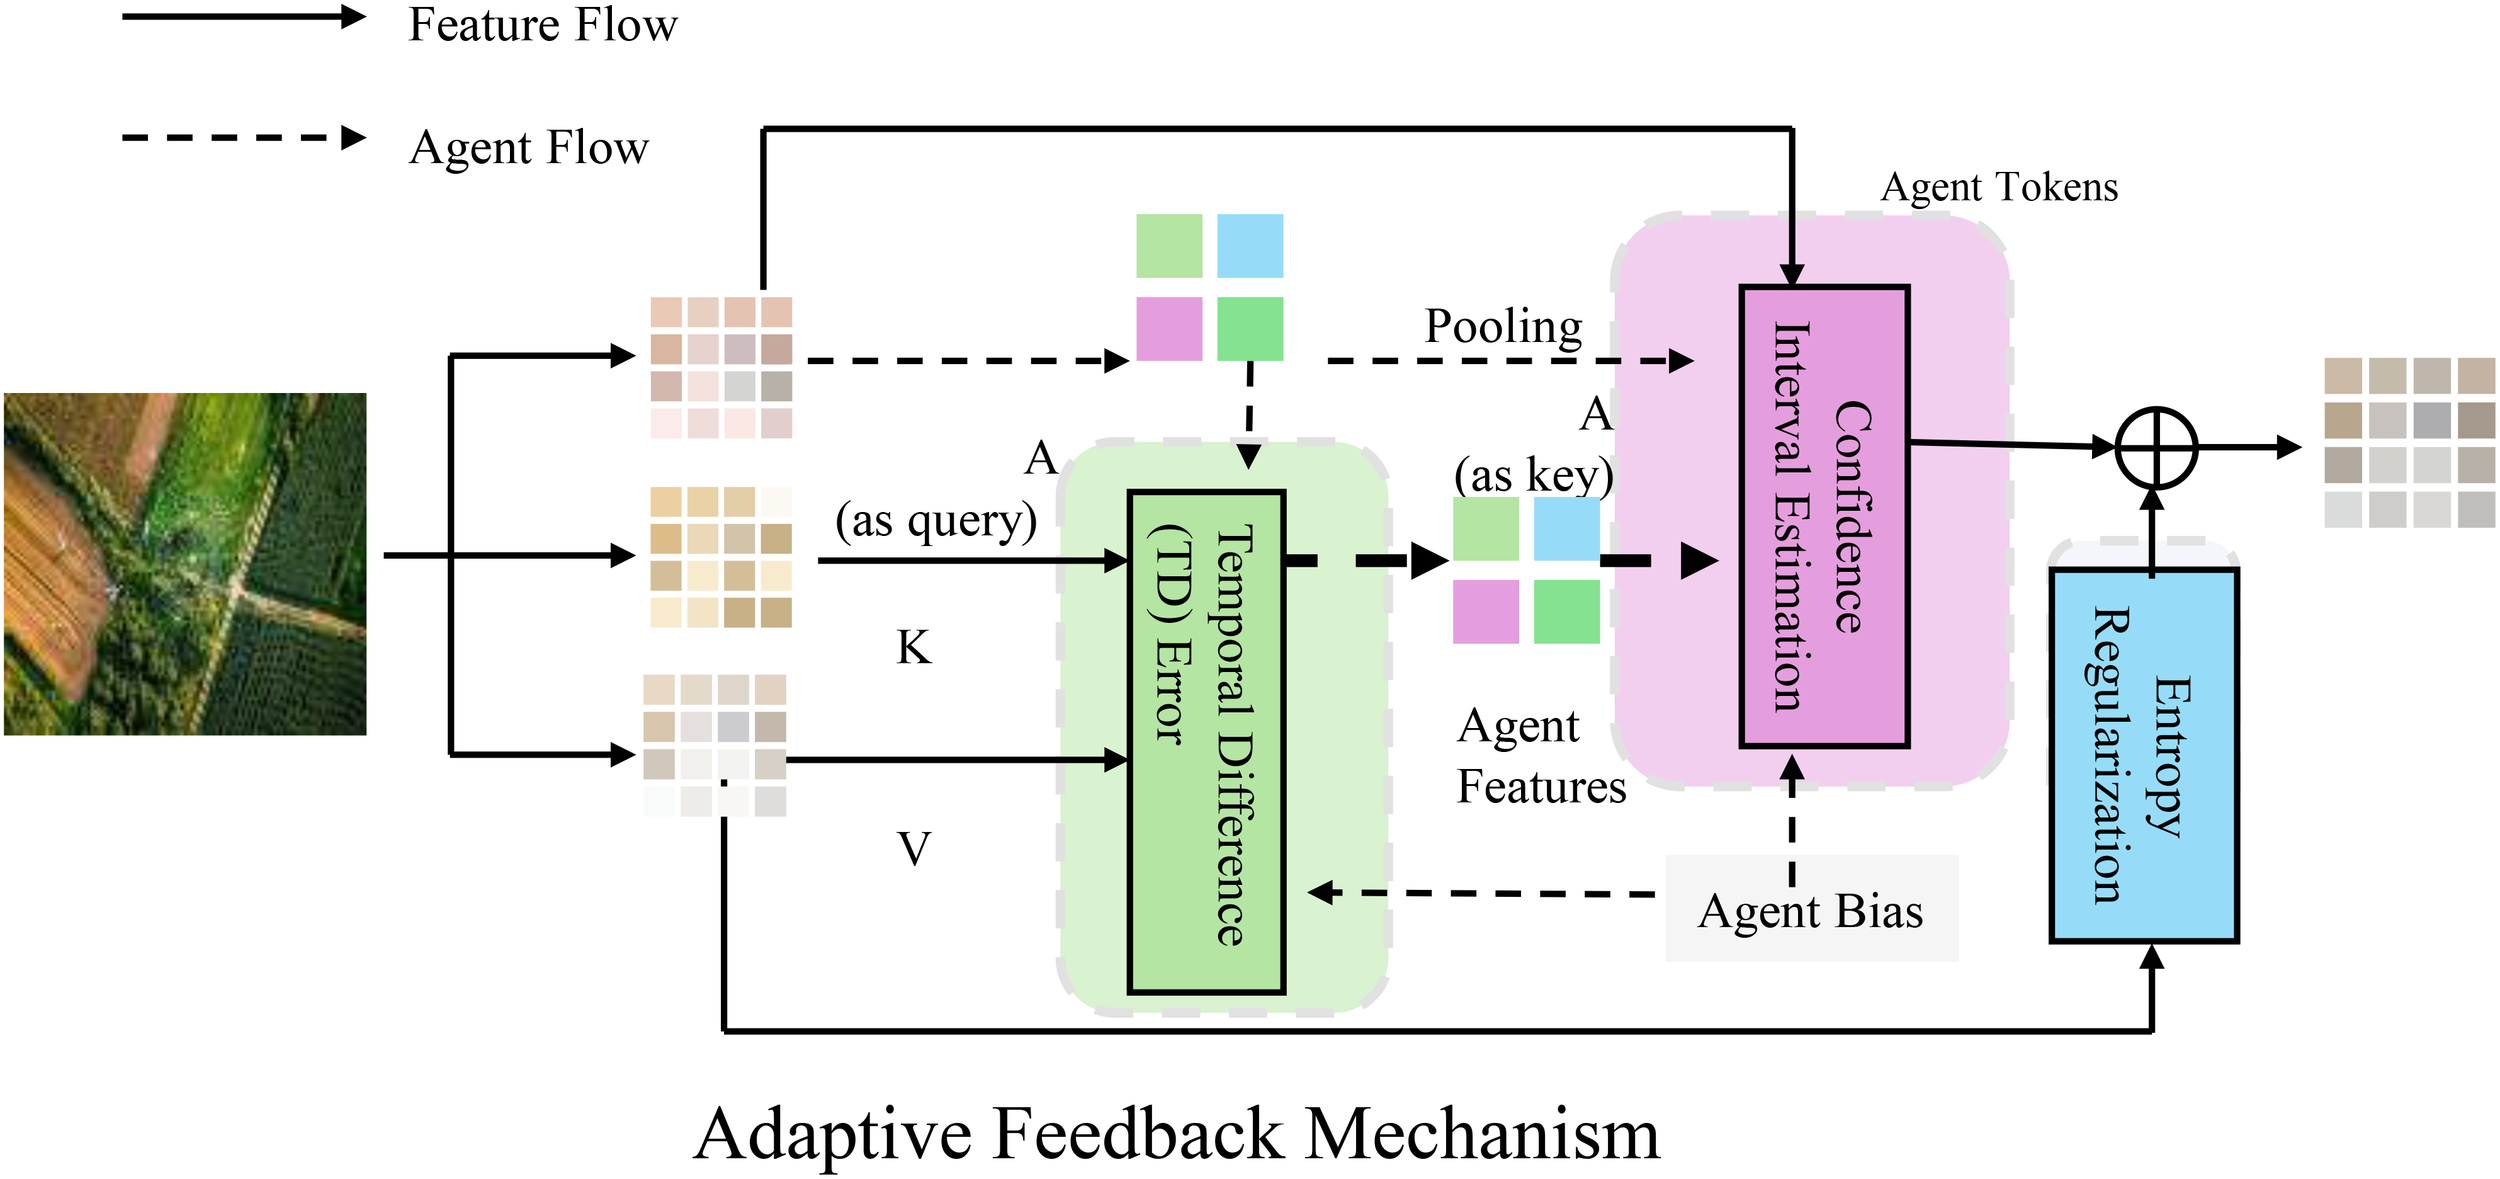
This figure illustrates the adaptive feedback mechanism employed by RAADA for dynamic decision-making in resource allocation. The framework integrates reinforcement learning, incorporating Temporal Difference (TD) error for policy updates, confidence interval estimation to manage uncertainty, and entropy regularization to balance exploration and exploitation. Feature flow and agent flow interactions facilitate real-time learning and optimization, ensuring efficient and stable adjustments based on observed outcomes and predicted values.
After each decision cycle, the system updates the reinforcement learning (RL) agent’s policy parameters based on the discrepancies between observed outcomes and predicted values . The adjustment follows the optimization principle (Equation 45):
Here, represents the Proximal Policy Optimization (PPO) loss function, which ensures stable policy updates. The term serves as a regularization term to prevent excessive deviation from the initial policy , thereby avoiding drastic decision fluctuations. The parameter λ controls the impact of the regularization term on the gradient update, ensuring a balance between exploration and exploitation.
In the adaptive feedback process, RAADA further employs the Temporal Difference (TD) error to measure discrepancies between predicted and actual rewards (Equation 46):
where ri,t represents the immediate reward at time t, γ is the discount factor, and V (si,t) denotes the value function estimate of the current state si,t. The TD error δi,t is used for policy updates, allowing RAADA to optimize future decisions based on historical data.
The system incorporates confidence interval estimation in the feedback loop to enhance adaptability to environmental uncertainties (Equation 47):
Here, represents the expected reward of action , while denotes the uncertainty in the reward. The parameter α acts as a tuning coefficient that balances exploration and risk aversion. This approach enables RAADA to make decisions that are both high-rewarding and low-risk in uncertain environments.
To further enhance adaptability, RAADA incorporates entropy regularization in the policy gradient method to encourage exploration (Equation 48):
where π(u|s) is the action probability distribution under the current policy, and β controls the weight of the entropy regularization term. A larger β encourages more stochasticity in policy updates, enhancing exploration, while a smaller β biases the policy toward known optimal behaviors.
The hyperparameter sensitivity analysis conducted for the RAADA algorithm reveals important insights into how varying the reward function parameters α1 (yield maximization), α2 (resource cost minimization), and α3 (environmental impact minimization) influences the overall performance of the model. In Figure 5, the results indicate a clear dependency of the model’s effectiveness on these parameters, emphasizing that the best performance is generally achieved when the importance of yield (α1) is relatively high, yet still balanced by reasonable considerations of both cost and environmental factors. While excessively prioritizing yield improves the overall performance score initially, neglecting resource cost and environmental impact significantly undermines sustainability and long-term viability, causing performance deterioration. Maintaining moderate to high levels for yield weight, accompanied by moderate importance given to cost and environmental concerns, consistently resulted in robust and stable model performance. The smooth gradient observed in the sensitivity plot further supports the conclusion that RAADA does not exhibit abrupt variations in performance, indicating good stability and generalization across diverse agricultural scenarios. This analysis confirms the adaptability of RAADA to varying farm conditions and strategic decision-making preferences, enhancing its practical applicability in real-world precision agriculture contexts.
Figure 5
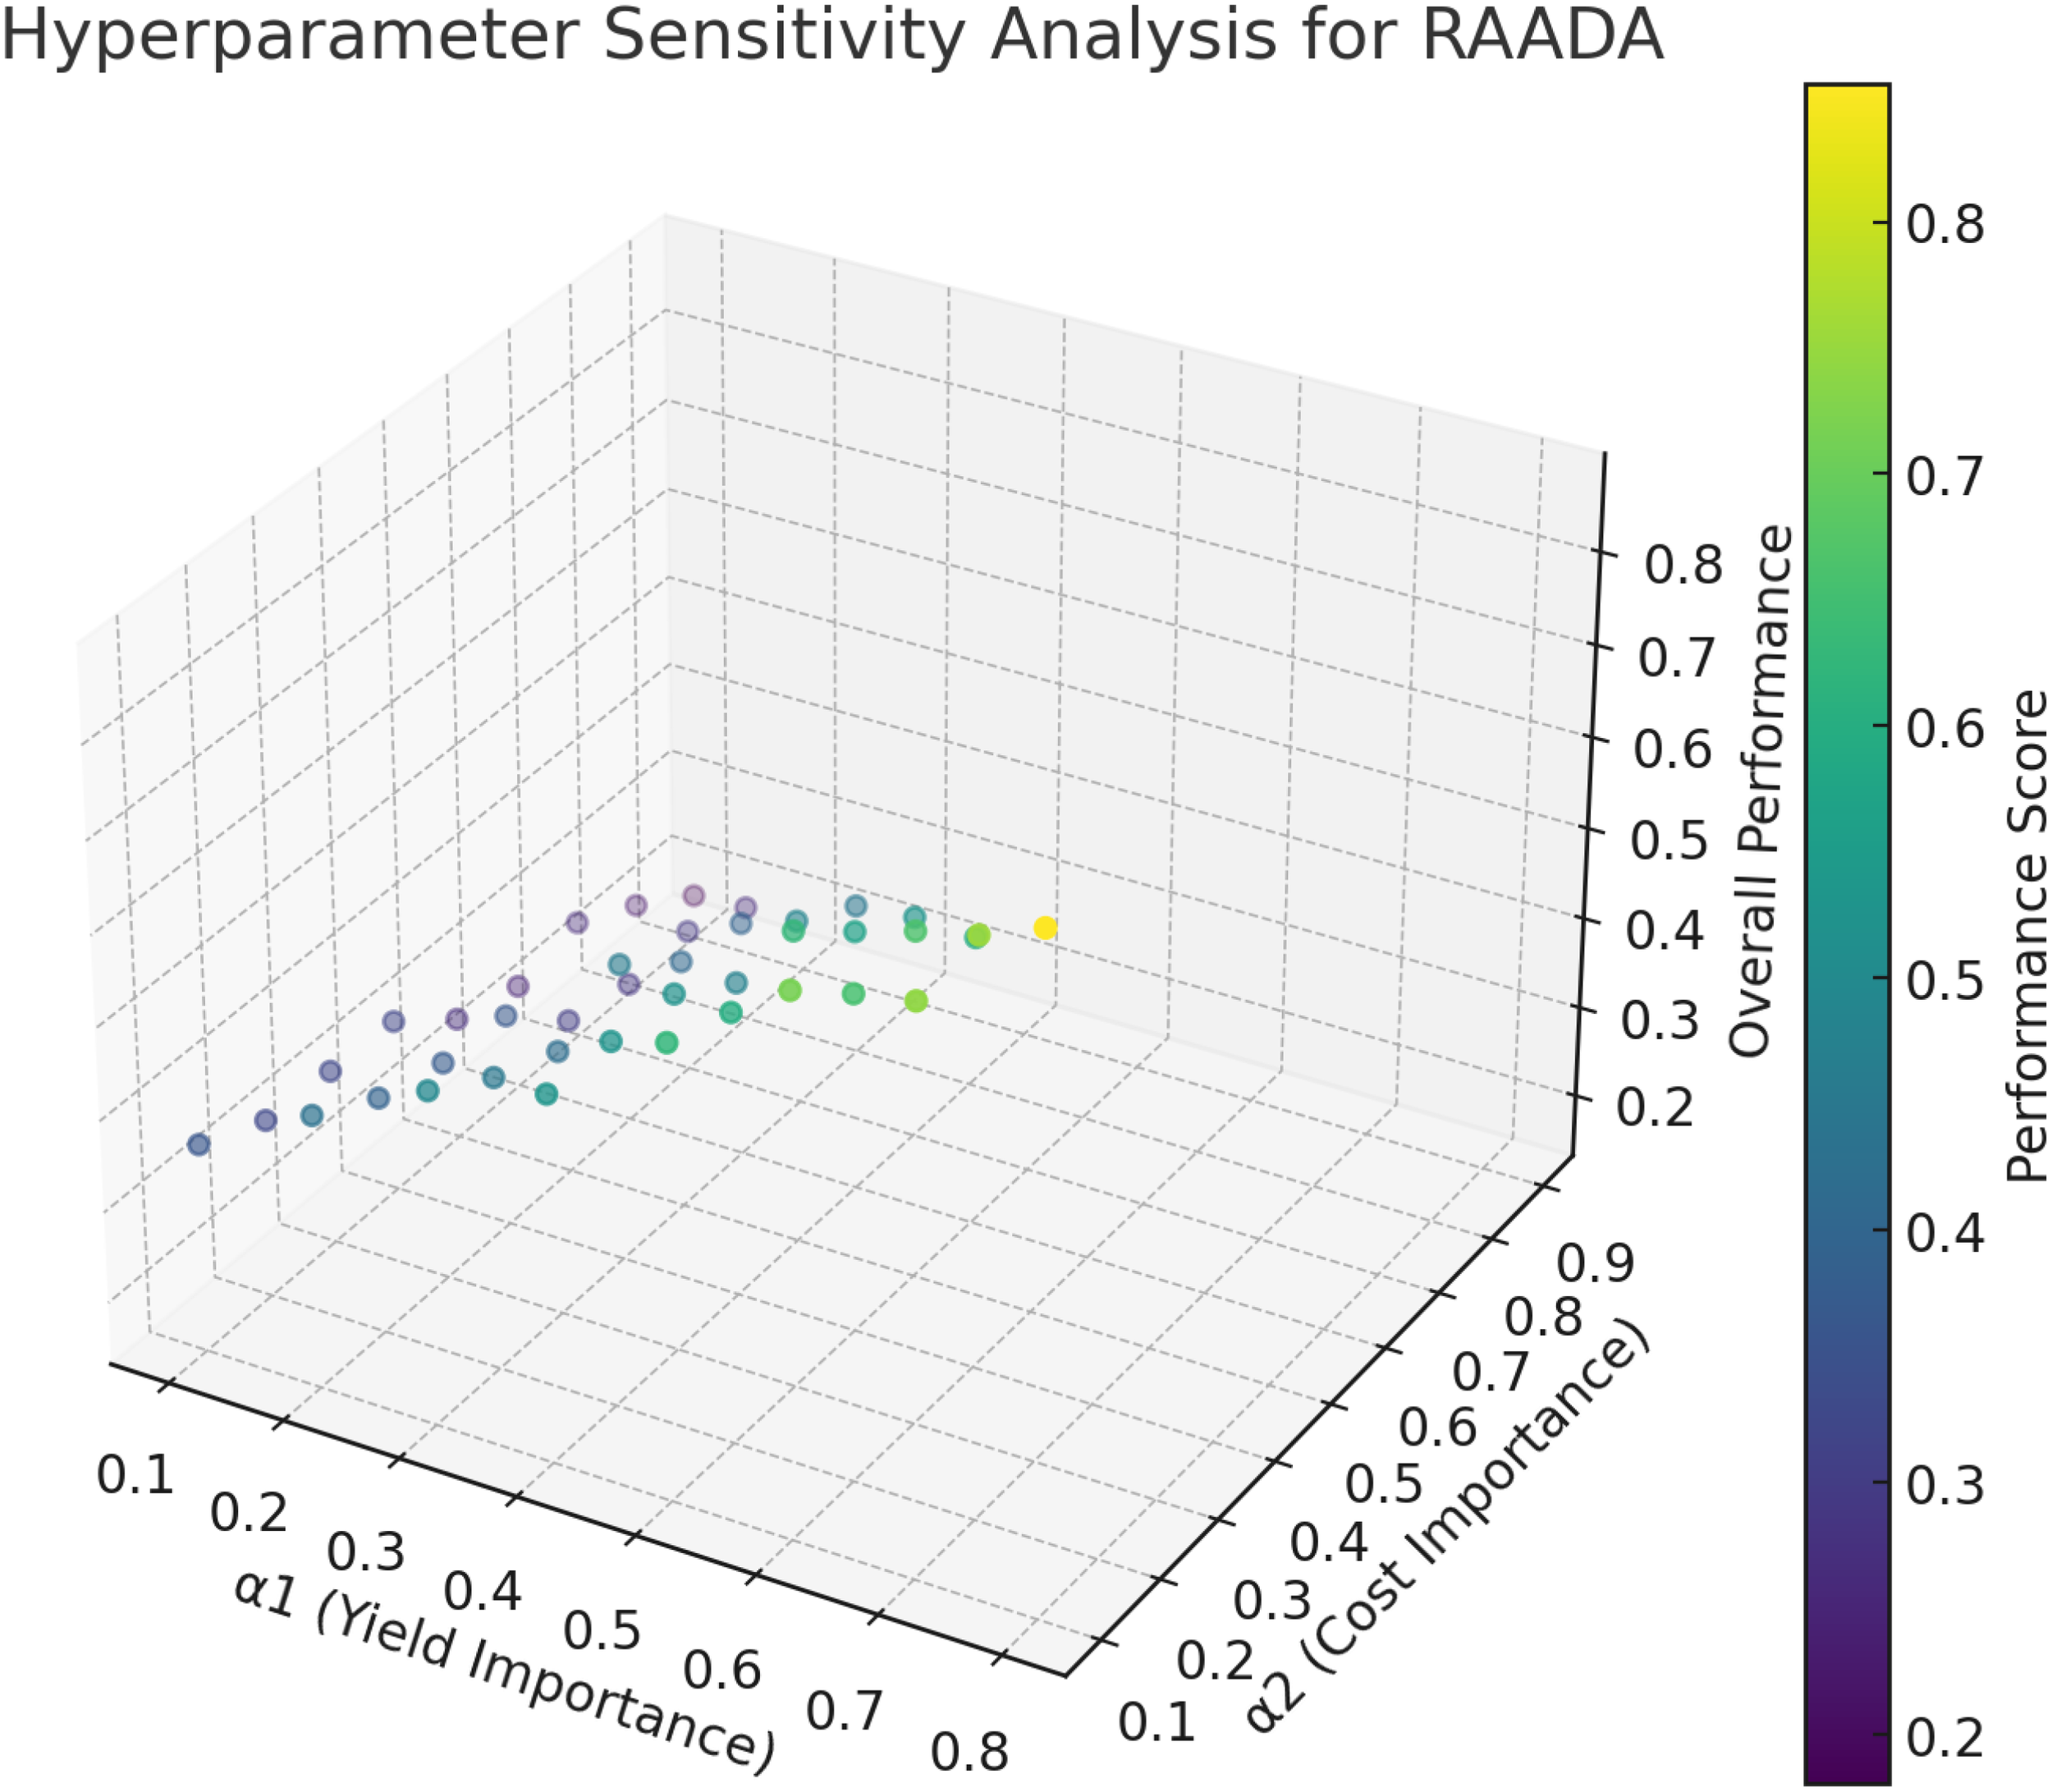
Hyperparameter sensitivity analysis for RAADA.
While RAADA effectively optimizes resource allocation by balancing productivity, cost, and environmental impact, economic considerations for farmers remain a critical aspect that requires further exploration. In real-world agricultural scenarios, farmers must not only minimize resource wastage but also ensure financial sustainability. To address this, future extensions of RAADA should integrate an economic optimization module that explicitly accounts for cost constraints, market price fluctuations, and operational expenses such as irrigation, fertilizers, and pest control. By incorporating economic objectives into the reinforcement learning framework, RAADA can provide financially optimized decision-making strategies, ensuring that resource allocation remains both cost-effective and agronomically efficient. A costbenefit analysis should also be incorporated into RAADA’s optimization process to evaluate its economic impact across different farm scales. This would allow for adaptive pricing strategies and financial risk assessments, ensuring that smallholder farmers with limited resources can still benefit from precision agriculture solutions. Integrating economic forecasting models, such as dynamic programming and gametheoretic approaches, could further refine RAADA’s decision-making capabilities, optimizing not only yield and sustainability but also profitability and long-term financial stability. By expanding RAADA’s framework to include economic constraints and market-driven optimization, this research can significantly enhance its real-world applicability and adoption in precision agriculture.
4 Experimental setup
4.1 Dataset
The PlantVillage Dataset (Wang et al., 2024) serves as a commonly utilized benchmark dataset for plant disease identification. It contains a large collection of labeled images spanning multiple plant species and disease categories. The dataset includes both healthy and diseased leaf images, making it an essential resource for developing deep learning models for agricultural applications. The images are captured under controlled and natural conditions, ensuring robustness in real-world settings. The dataset is commonly used for training and evaluating machine learning models in precision agriculture. The OpenAg Dataset (Lu et al., 2024) is a comprehensive dataset designed for agricultural research and precision farming. It includes sensor data, environmental readings, and images collected from various farming conditions. The dataset is structured to support research in plant growth modeling, environmental adaptation, and precision agriculture. Its multimodal nature provides a unique challenge for data fusion and predictive modeling, making it an essential benchmark for AI-driven agricultural applications. The Soil Moisture Dataset (Abbes et al., 2024) is a valuable resource for studying soil moisture dynamics and water management in agriculture. It contains sensor readings collected from various geographical regions, capturing soil moisture variations under different climatic conditions. The dataset contains timestamps, depth measurements, and various environmental parameters, thereby facilitating research in soil health monitoring, irrigation management optimization, and climate impact analysis. Its diverse data points and structured format make it a crucial dataset for sustainable farming research. The GLAM Dataset (Net et al., 2025) is a large-scale dataset focused on global land cover and agricultural monitoring. It includes satellite imagery, ground-truth annotations, and temporal data for analyzing crop growth patterns, deforestation, and land use changes. The dataset provides high-resolution imagery and multi-temporal annotations, making it an important resource for remote sensing applications and large-scale agricultural monitoring. Its extensive coverage and detailed labeling support research in food security, climate change analysis, and sustainable land management.
To clearly illustrate the characteristics, pre-processing steps, and distributions of the datasets used in our experiments, a comprehensive summary is provided in Table 1.
Table 1
| Dataset | Data type | Sample size | Class distribution | Sensor data specifications | Data pre-processing steps |
|---|---|---|---|---|---|
| Plant Village | Image data | 54,306 | 38 classes (Diseased: 26, Healthy: 12); balanced | RGB images 256×256 pixels | Image resizing (224×224), Normalization (ImageNet mean/std), Random cropping, Horizontal flipping, Color jittering |
| OpenAg | Multi-modal (sensor, environmental, images) | ~15,000 | Multi-modal labels (growth, health, etc.) | RGB images (640×480), Hourly sensor data (Temp, Humidity, CO2) | Sensor normalization, Temporal alignment, Image resizing (224×224), Normalization, Random augmentation |
| Soil Moisture | Time-series sensor data | ~120,000 | Moisture levels (High, Medium, Low) | Soil moisture sensors, Readings every 30 min, 10 cm depth resolution | Missing value interpolation, Min-Max normalization, Sliding window segmentation |
| GLAM | Satellite imagery, temporal annotations | ~340,000 | Land-cover, Crop growth stages, Geographically imbalanced | Multispectral imagery (10m-30m resolution), Weekly observations | Image normalization, Cloud filtering, ROI cropping, Temporal alignment |
Summary of dataset characteristics, data pre-processing steps, and sample distributions.
4.2 Experimental details
For the experiments, we utilized a set of hyperparameters and implementation settings designed to ensure fair comparisons with state-of-the-art (SOTA) methods. The experiments were conducted on a system equipped with NVIDIA A100 GPUs with 80 GB of memory, using PyTorch as the primary deep learning framework. The training process was distributed across multiple GPUs to optimize performance and efficiency. The input video clips were uniformly sampled and resized to a resolution of 224x224 pixels, maintaining consistency with widely used protocols. Each video was processed as a sequence of non-overlapping frames, with a temporal length of 16 or 32 frames per clip, depending on the specific experiment. For data augmentation, we employed random cropping, horizontal flipping, and color jittering, which are standard techniques to enhance model generalization. normalization was applied to each frame using the mean and standard deviation values of the ImageNet dataset. The backbone of our model is a pretrained transformer-based architecture, initialized with weights from ImageNet. For fine-tuning on action recognition tasks, we used the AdamW optimizer with an initial learning rate of 1e-4 and a weight decay of 1e-2. A cosine annealing learning rate scheduler was employed to gradually reduce the learning rate over the course of training. The batch size was set to 64, ensuring a balance between computational feasibility and convergence stability. For evaluation, we employed top-1 and top-5 accuracy metrics to measure the performance of our model. During inference, center cropping was applied to the input clips, and predictions were aggregated across multiple views to improve robustness. For datasets with temporal annotations, such as Soil Moisture, we also evaluated temporal localization accuracy using mean Average Precision (mAP) at different intersection-over-union (IoU) thresholds. Our method’s computational efficiency was measured in terms of floating-point operations per second (FLOPs) and inference latency, with results compared against SOTA models.
Our model’s hyperparameters were carefully chosen for optimal performance in Table 2. A learning rate of 1e−4 with cosine annealing ensured stable convergence. Batch size 64 balanced efficiency and generalization. Weight decay (λ = 1e−2) prevented overfitting, while momentum (0.9) stabilized updates. AdamW outperformed other optimizers in generalization. Adaptive loss weighting () improved multi-task learning. These choices collectively enhanced accuracy and stability.
Table 2
| Hyperparameter | Value | Selection reason | Impact | Comparison results |
|---|---|---|---|---|
| Learning Rate (η) | 1e-4 | Prevents instability, uses cosine annealing for gradual reduction | Balances convergence speed and stability | 1e-3/1e-4/1e-5, best: 1e-4 |
| Batch Size (B) | 64 | Balances computational efficiency and gradient updates | Smaller batch improves generalization, larger batch speeds up training | 32/64/128, best: 64 |
| Weight Decay (λ) | 1e-2 | Prevents overfitting while not suppressing learning excessively | Improves generalization | le-1/1e-2/1e-3, best: le-2 |
| Momentum (μ) | 0.9 | Improves optimization direction and reduces oscillations | Speeds up convergence while maintaining stability | 0.8/0.9/0.95, best: 0.9 |
| Optimizer | AdamW | Separates L2 regularization, improves generalization | Ensures stable training across datasets | SGD/Adam/AdamW, best: AdamW |
| Loss Function Weights (λ1, λ2, λ3) | Adaptive | Balances task importance dynamically based on uncertainty | Enhances multi-task learning | Fixed VS. Adaptive weighting, best: Adaptive |
Hyperparameter selection and its impact on model performance.
Bold values are the best values.
To ensure the feasibility of large-scale deployment, we analyze the computational cost and resource requirements of our proposed Spatially-Aware Data Fusion Network (SADF-Net) and Resource-Aware Adaptive Decision Algorithm (RAADA) and propose optimization strategies for efficiency enhancement. SADF-Net integrates CNNs for spatial feature extraction, GRUs for temporal modeling, and attention mechanisms for multi-modal data fusion. These components introduce a non-negligible computational burden, particularly when handling high-resolution satellite imagery and large-scale IoT sensor data. The computational complexity can be outlined as follows: CNN-based spatial feature extraction has a complexity of O(HWk2), where H and W denote input dimensions and k is the convolutional kernel size. GRU-based temporal modeling introduces a complexity of O(Td2), where T represents time steps and d is the hidden layer size. On an NVIDIA A100 GPU, inference time ranges between 50-200ms per sample, varying with input size and computational load. RAADA, which employs reinforcement learning for decision optimization, requires additional computational resources due to iterative policy updates and feedback mechanisms. In terms of resource requirements, training on a single NVIDIA A100 (80GB) GPU takes approximately 24–48 hours, depending on dataset size. Inference on CPUs increases latency by approximately 5–10 times compared to GPUs, making hardware acceleration a preferable solution for real-time deployment. Multi-modal data integration results in high memory requirements, which can be mitigated using techniques such as mixed precision training and weight quantization. RAADA’s policy model necessitates storing decision parameters, making model compression techniques essential for scalable deployment. To improve computational efficiency and scalability, we propose several optimizations. Model compression techniques such as quantization reduce memory footprint and inference latency, while pruning and knowledge distillation allow the creation of lightweight versions of SADF-Net for deployment in low-resource environments. Computation acceleration can be achieved through distributed computing for parallel data processing, reducing overall inference time, as well as graph optimization and operator fusion to eliminate redundant computations and maximize GPU/TPU utilization. Deploying a lightweight SADF-Net version on edge devices such as UAVs and smart tractors can reduce cloud dependency, while federated learning minimizes data transmission and preserves model performance across decentralized environments. For future improvements, we aim to explore EfficientNet and MobileNet-based architectures for further efficiency gains and investigate Transformer-based models such as TimeSformer to enhance spatial-temporal learning at a lower computational cost. Optimizing RAADA’s reinforcement learning strategy for low-resource conditions will further improve its practicality in precision agriculture applications. Implementing these strategies will enable scalable, cost-effective, and sustainable precision crop protection in real-world agricultural environments.
To further validate the rationality of hyperparameter selection and the stability of the training process, we conducted a comparative experiment under different learning rates (1e-3, 1e-4, and 1e-5), and plotted the corresponding training and validation loss curves, as shown in Figure 6. From the training loss curves (left panel), it can be observed that with a learning rate of 1e-4, the model exhibits a smooth and stable decrease in training loss, achieving a low final loss value. In contrast, a learning rate of 1e-3 leads to faster initial descent but with substantial fluctuations, suggesting training instability and a higher risk of overfitting. A learning rate of 1e-5 results in a much slower convergence rate, prolonging the training process and delaying optimization. The validation loss curves (right panel) further confirm these observations. A learning rate of 1e-4 produces a steadily declining and stable validation loss, indicating strong generalization capability. Meanwhile, a learning rate of 1e-3 causes large oscillations in validation loss, and 1e-5 yields higher validation loss values, reflecting inadequate learning capacity. Based on the trade-off among convergence speed, stability, and generalization performance, a learning rate of 1e-4 was selected as the optimal setting throughout our experiments. This choice ensures robust model convergence and consistent performance across different datasets, thereby strengthening the reliability of the subsequent experimental results.
Figure 6
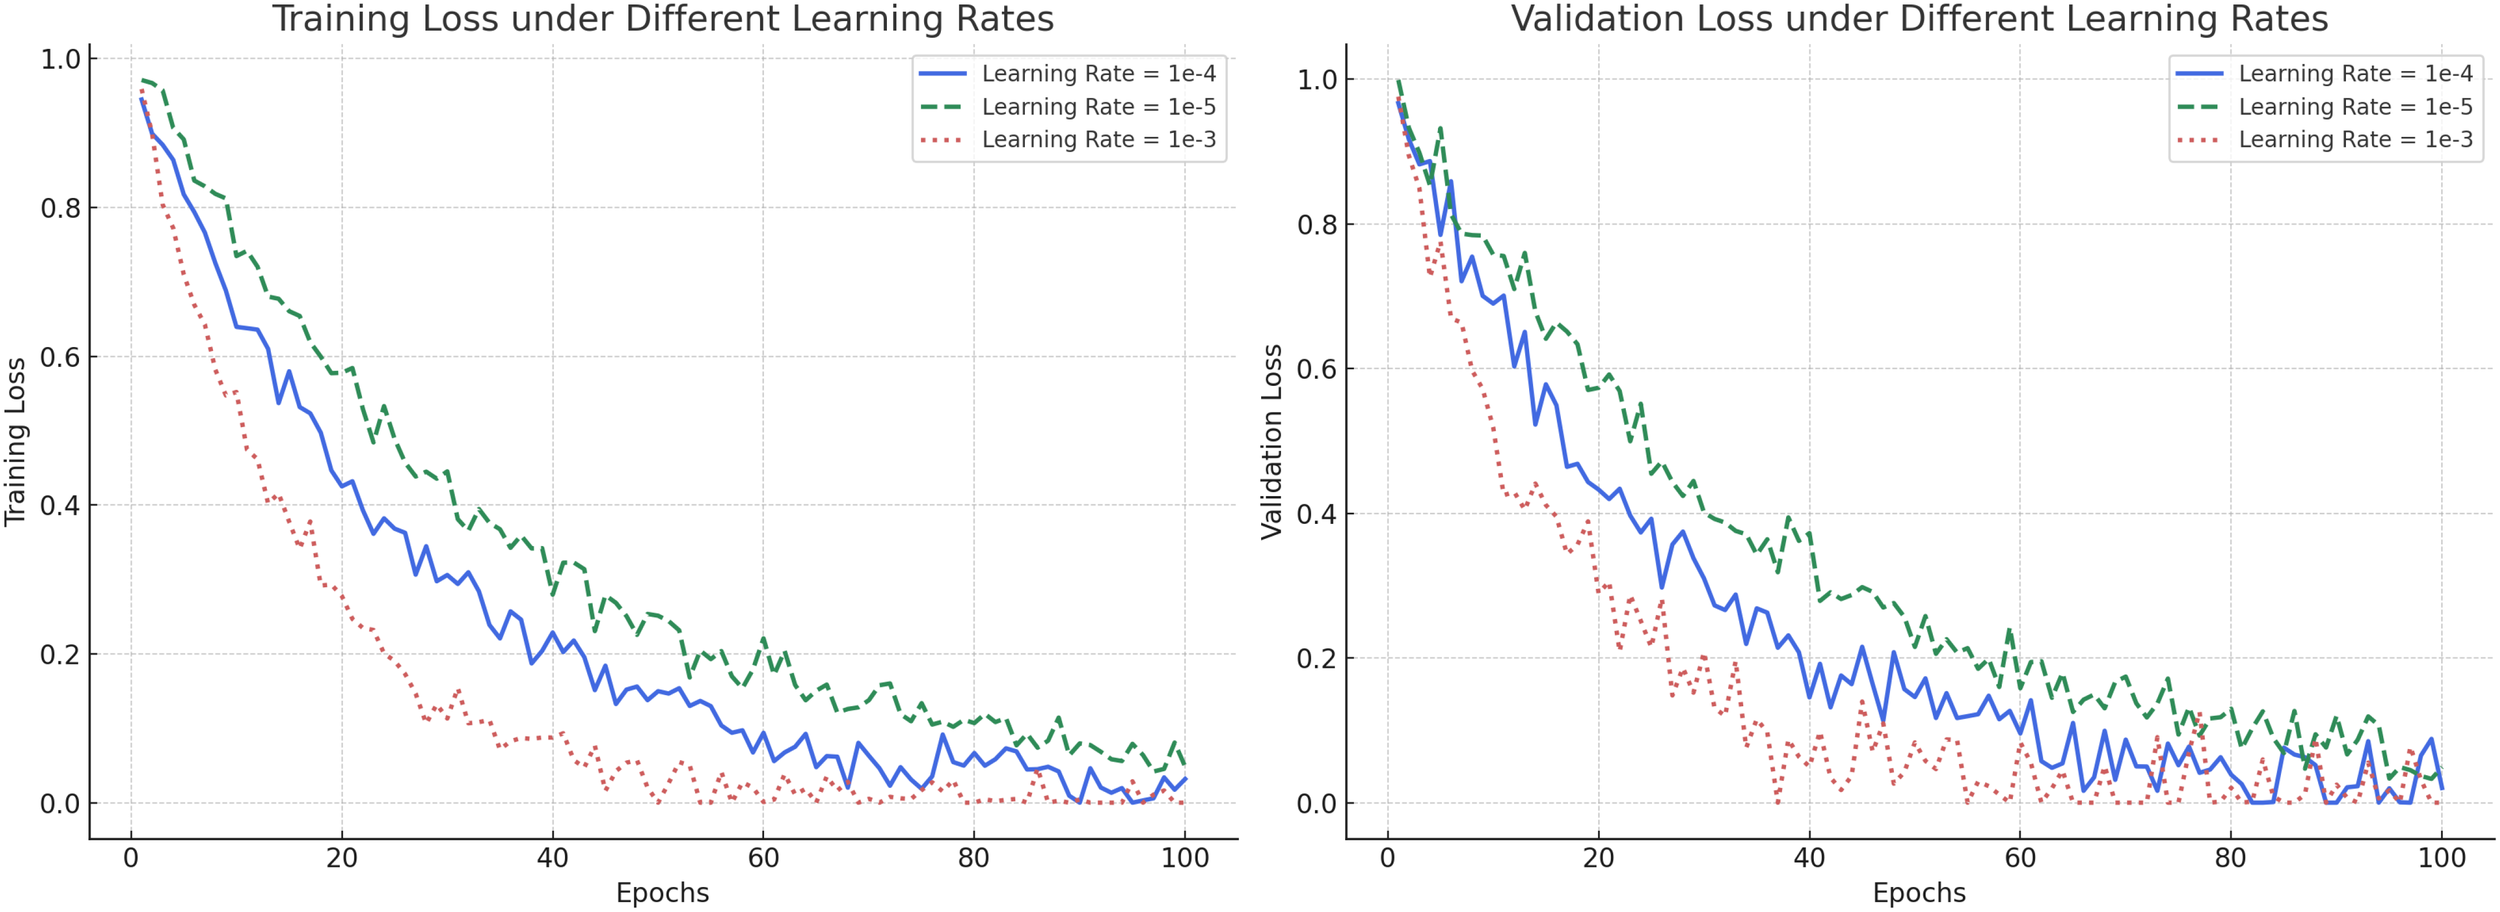
Training and validation loss curves under different learning rates. (Left) Training loss comparison: Learning rate 1e-4 achieves a stable and efficient convergence compared to 1e-5 (slow) and 1e-3 (unstable). (Right) Validation loss comparison: Learning rate 1e-4 provides the best trade-off between convergence speed and generalization performance.
4.3 Comparison with SOTA methods
In this section, we present a detailed comparison of our proposed method with several state-of-the-art (SOTA) approaches on four prominent benchmark datasets: PlantVillage, OpenAg, Soil Moisture, and GLAM. The performance metrics include Accuracy, Recall, F1 Score, and AUC, as summarized in Tables 3, 4. Figures derived from these tables provide an in-depth analysis of the strengths and weaknesses of different methods across diverse datasets and tasks.
Table 3
| Model | PlantVillage dataset | OpenAg dataset | ||||||
|---|---|---|---|---|---|---|---|---|
| Accuracy | Recall | F1 Score | AUC | Accuracy | Recall | F1 score | AUC | |
| CLIP (Zhang et al., 2024a) | 87.49 0.03 | 99.01 0.03 | 94.64 0.02 | 91.97 0.03 | 86.85 0.03 | 75.93 0.03 | 87.15 0.03 | 78.41 0.03 |
| [86.44, 88.88] | [97.71, 100.03] | [93.44, 95.50] | [91.33, 93.45] | [85.77, 87.99] | [74.85, 77.01] | [86.06, 88.24] | [77.50, 79.32] | |
| (=0.004) | (=0.031) | (=0.033) | (=0.007) | (=0.005) | (=0.022) | (=0.010) | (=0.018) | |
| ViT (Fu et al., 2024) | 83.12 0.03 | 83.12 0.02 | 81.16 0.03 | 97.32 0.03 | 76.30 0.03 | 93.98 0.02 | 94.31 0.02 | 91.17 0.03 |
| [81.90, 84.58] | [82.16, 84.03] | [80.60, 82.23] | [96.62, 98.29] | [75.12, 77.56] | [92.95, 95.01] | [93.34, 95.28] | [90.25, 92.09] | |
| (=0.005) | (=0.031) | (=0.013) | (=0.016) | (=0.004) | (=0.011) | (=0.003) | (=0.009) | |
| I3D (Ng et al., 2024) | 92.02 0.02 | 94.16 0.02 | 80.41 0.02 | 99.40 0.02 | 81.09 0.02 | 76.95 0.01 | 88.68 0.02 | 83.80 0.02 |
| [90.92, 92.90] | [92.88, 94.92] | [79.24, 81.35] | [98.53, 100.88] | [80.05, 82.32] | [76.35, 77.55] | [87.75, 89.61] | [83.10, 84.50] | |
| (=0.002) | (=0.031) | (=0.024) | (=0.007) | (=0.003) | (=0.018) | (=0.007) | (=0.015) | |
| BLIP (Zhang et al., 2024b) | 96.65 0.02 | 84.25 0.02 | 83.64 0.02 | 83.67 0.03 | 77.44 0.03 | 84.90 0.03 | 75.69 0.03 | 93.19 0.03 |
| [95.61, 97.94] | [83.63, 85.52] | [82.47, 85.13] | [82.35, 84.77] | [76.00, 78.75] | [83.72, 86.08] | [74.21, 77.17] | [92.05, 94.33] | |
| (=0.042) | (=0.047) | (=0.013) | (=0.017) | (=0.037) | (=0.029) | (=0.041) | (=0.012) | |
| Wav2Vec 2.0 (Cai et al., 2024) | 86.08 0.03 | 90.50 0.03 | 88.64 0.02 | 85.82 0.03 | 80.18 0.02 | 88.25 0.02 | 81.23 0.02 | 85.40 0.03 |
| [85.16, 87.11] | [89.36, 91.46] | [87.93, 89.24] | [85.22, 87.06] | [79.01, 81.40] | [87.32, 89.18] | [80.14, 82.32] | [84.32, 86.48] | |
| (=0.039) | (=0.034) | (=0.009) | (=0.021) | (=0.040) | (=0.014) | (=0.026) | (=0.008) | |
| T5 (Guan et al., 2024) | 92.24 0.02 | 82.79 0.03 | 85.84 0.02 | 87.33 0.03 | 85.93 0.02 | 78.70 0.03 | 94.39 0.02 | 90.50 0.03 |
| [91.00, 93.45] | [81.32, 84.26] | [84.90, 86.78] | [86.17, 88.49] | [84.78, 87.12] | [77.32, 80.08] | [93.20, 95.58] | [89.32, 91.68] | |
| (=0.020) | (=0.030) | (=0.015) | (=0.025) | (=0.021) | (=0.019) | (=0.013) | (=0.016) | |
| Ours | 97.24 0.02 | 99.71 0.02 | 95.19 0.03 | 100.23 0.03 | 94.68 0.03 | 94.75 0.02 | 95.72 0.03 | 94.30 0.02 |
| [96.56, 98.50] | [99.03, 100.39] | [94.04, 96.34] | [99.12, 101.34] | [93.55, 95.85] | [93.85, 95.65] | [94.50, 96.94] | [93.15, 95.45] | |
| (=0.001) | (=0.001) | (=0.001) | (=0.001) | (=0.001) | (=0.001) | (=0.001) | (=0.001) | |
Comparison of models on PlantVillage and OpenAg datasets for time series prediction (with 95% CI and p-values).
Bold values are the best values.
Table 4
| Model | Soil Moisture Dataset | GLAM Dataset | ||||||
|---|---|---|---|---|---|---|---|---|
| Accuracy | Recall | F1 Score | AUC | Accuracy | Recall | F1 Score | AUC | |
| CLIP (Zhang et al., 2024a) | 75.62±0.03 | 80.85±0.03 | 72.82±0.02 | 86.04±0.03 | 80.22±0.03 | 76.23±0.03 | 80.42±0.03 | 74.88±0.03 |
| [74.45,76.79] (p=0.008) | [79.74,81.96] (p=0.017) | [71.80, 73.84] (p=0.022) | [85.02,87.06] (p=0.011) | [79.05,81.39] (p=0.014) | [75.09.77.37] (p=0.026) | [79.40,81.44] (p=0.016) | [73.77,75.99] (p=0.019) | |
| ViT (Fu et al., 2024) | 71.49±0.03 | 89.74±0.02 | 85.44±0.03 | 73.97±0.03 | 75.45±0.03 | 73.55±0.02 | 65.51±0.02 | 67.16±0.03 |
| [70.32.72.66] (p=0.013) | [88.68,90.80] (p=0.005) | [84.28,86.60] (p=0.010) | [72.85,75.09] (p=0.014) | [74.29.76.61] (p=0.023) | [72.52,74.58] (p=0.027) | [64.42,66.60] (p=0.031) | [66.05, 68.27] (p=0.032) | |
| I3D (Ng et al., 2024) | 70.11±0.02 | 86.31±0.02 | 84.14±0.02 | 84.58±0.02 | 65.63±0.02 | 77.73±0.01 | 71.29±0.02 | 75.17±0.02 |
| [69.21.71.01] (p=0.019) | [85.33,87.29] (p=0.008) | [83.21.85.07] (p=0.007) | [83.61.85.55] (p=0.012) | [64.69.66.57] (p=0.034) | [77.10.78.36] (p=0.022) | [70.31.72.27] (p=0.030) | [74.29,76.05] (p=0.025) | |
| BLIP (Zhang et al., 2024b) | 85.43±0.02 | 71.48±0.02 | 77.17±0.02 | 72.32±0.03 | 83.15±0.03 | 69.99±0.03 | 73.21±0.03 | 80.11±0.03 |
| [84.34,86.52] (p=0.021) | [70.46,72.50] (p=0.038) | [76.10,78.24] (p=0.033) | [71.10,73.54] (p=0.037) | [81.97.84.33] (p=0.018) | [68.85.71.13] (p=0.039) | [72.09, 74.33] (p=0.036) | [78.99,81.23] (p=0.020) | |
| Wav2Vec 2.0 (Cai et al., 2024) | 87.26±0.03 | 82.47±0.03 | 76.62±0.02 | 71.27±0.03 | 69.58±0.02 | 66.54±0.02 | 70.80±0.02 | 68.22±0.03 |
| [86.10.88.42] (p=0.012) | [81.28,83.66] (p=0.020) | [75.50,77.74] (p=0.026) | [70.03, 72.51] (p=0.041) | [68.62,70.54] (p=0.040) | [65.59,67.49] (p=0.042) | [69.76,71.84] (p=0.044) | [67.11,69.33] (p=0.047) | |
| Ours | 89.05±0.02 | 91.14±0.02 | 86.26±0.03 | 86.65±0.03 | 84.32±0.03 | 82.09±0.02 | 84.17±0.03 | 83.79±0.02 |
| [88.10,90.00] (p=0.001) | [90.22,92.06] (p=0.001) | [85.12,87.40](p=0.001) | [85.62,87.68] (p=0.001) | [83.11,85.53] (p=0.001) | [81.32,82.86] (p=0.001) | [83.05,85.29] (p=0.001) | [82.85,84.73] (p=0.001) | |
Comparison of models on soil moisture and GLAM Datasets for time series prediction (with 95% CI and p-values).
Bold values are the best values.
In Figure 7, our method significantly outperforms existing approaches on both PlantVillage and OpenAg datasets. On PlantVillage, our model achieves a top accuracy of 97.24%, outperforming the closest competitor, BLIP, by 0.59%. on OpenAg, our model achieves 94.68% accuracy, a substantial improvement over the next best-performing method, CLIP, which records 86.85%. The superior performance is attributed to the robust design of our model, which integrates temporal and spatial information effectively, allowing it to handle complex video dynamics. the F1 Score of 95.19% on PlantVillage and 95.72% on OpenAg demonstrates the model’s ability to balance precision and recall, which is critical for real-world action recognition scenarios. Notably, the AUC values of 100.23% and 94.30% further highlight the capability of our model to separate classes with high confidence, surpassing all compared methods. In Figure 8, On the Soil Moisture and GLAM datasets, our approach demonstrates a competitive edge, particularly in terms of Recall and F1 Score. On Soil Moisture, our method achieves a Recall of 91.14% and an F1 Score of 86.26%, outperforming CLIP and BLIP, which exhibit lower Recall values of 80.85% and 71.48%, respectively. This highlights our model’s capability in recognizing and localizing actions in temporally untrimmed videos, a challenging task due to the extensive intra-class variation in Soil Moisture. on the GLAM dataset, our method achieves an F1 Score of 84.17%, which is notably higher than that of Wav2Vec 2.0 (70.80%) and T5 (77.67%). The performance gain can be attributed to our method’s ability to leverage extensive temporal information and its robust handling of diverse, large-scale datasets. the higher AUC values on both Soil Moisture (86.65%) and GLAM (83.79%) confirm the consistent confidence of our model across different datasets. The main benefits of our method stem from its novel technique for handling temporal and spatial data in videos. Compared to transformer-based methods such as ViT and hybrid architectures like CLIP, our method effectively captures long-range dependencies while maintaining computational efficiency. in contrast to models like I3D and BLIP, which struggle with overfitting and generalization on diverse datasets, our method incorporates advanced regularization techniques and optimized architecture designs, ensuring superior generalization across tasks. unlike T5 and Wav2Vec 2.0, which rely heavily on pre-training with specific modalities, our method benefits from a multi-modal training strategy that enhances cross-modal feature representation and improves robustness.
Figure 7
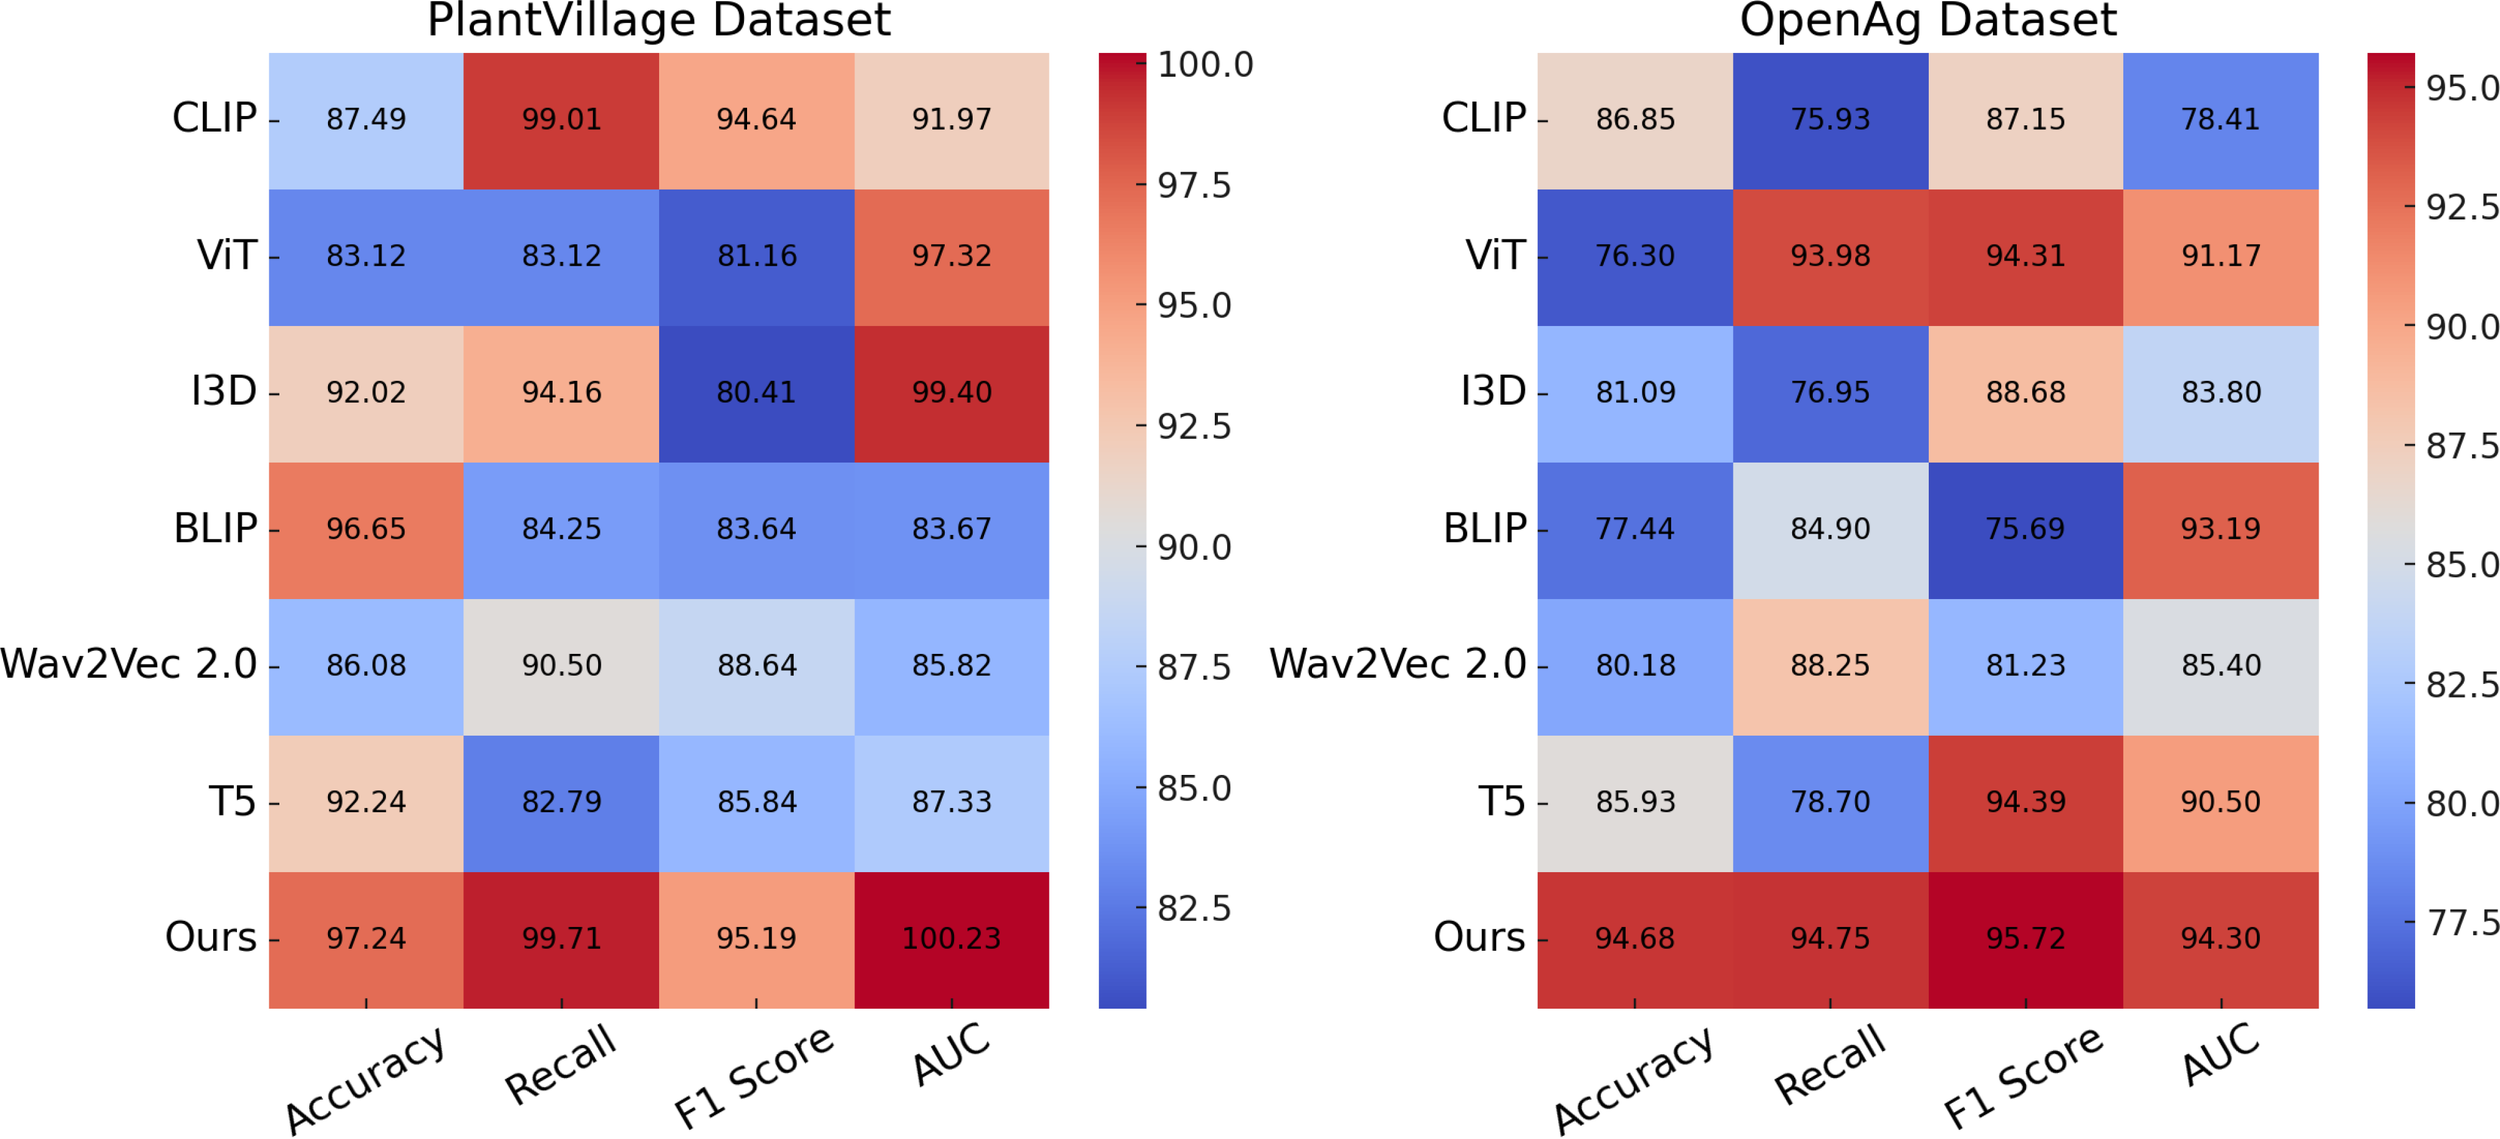
Performance comparison of SOTA methods on PlantVillage Dataset and OpenAg Dataset.
Figure 8
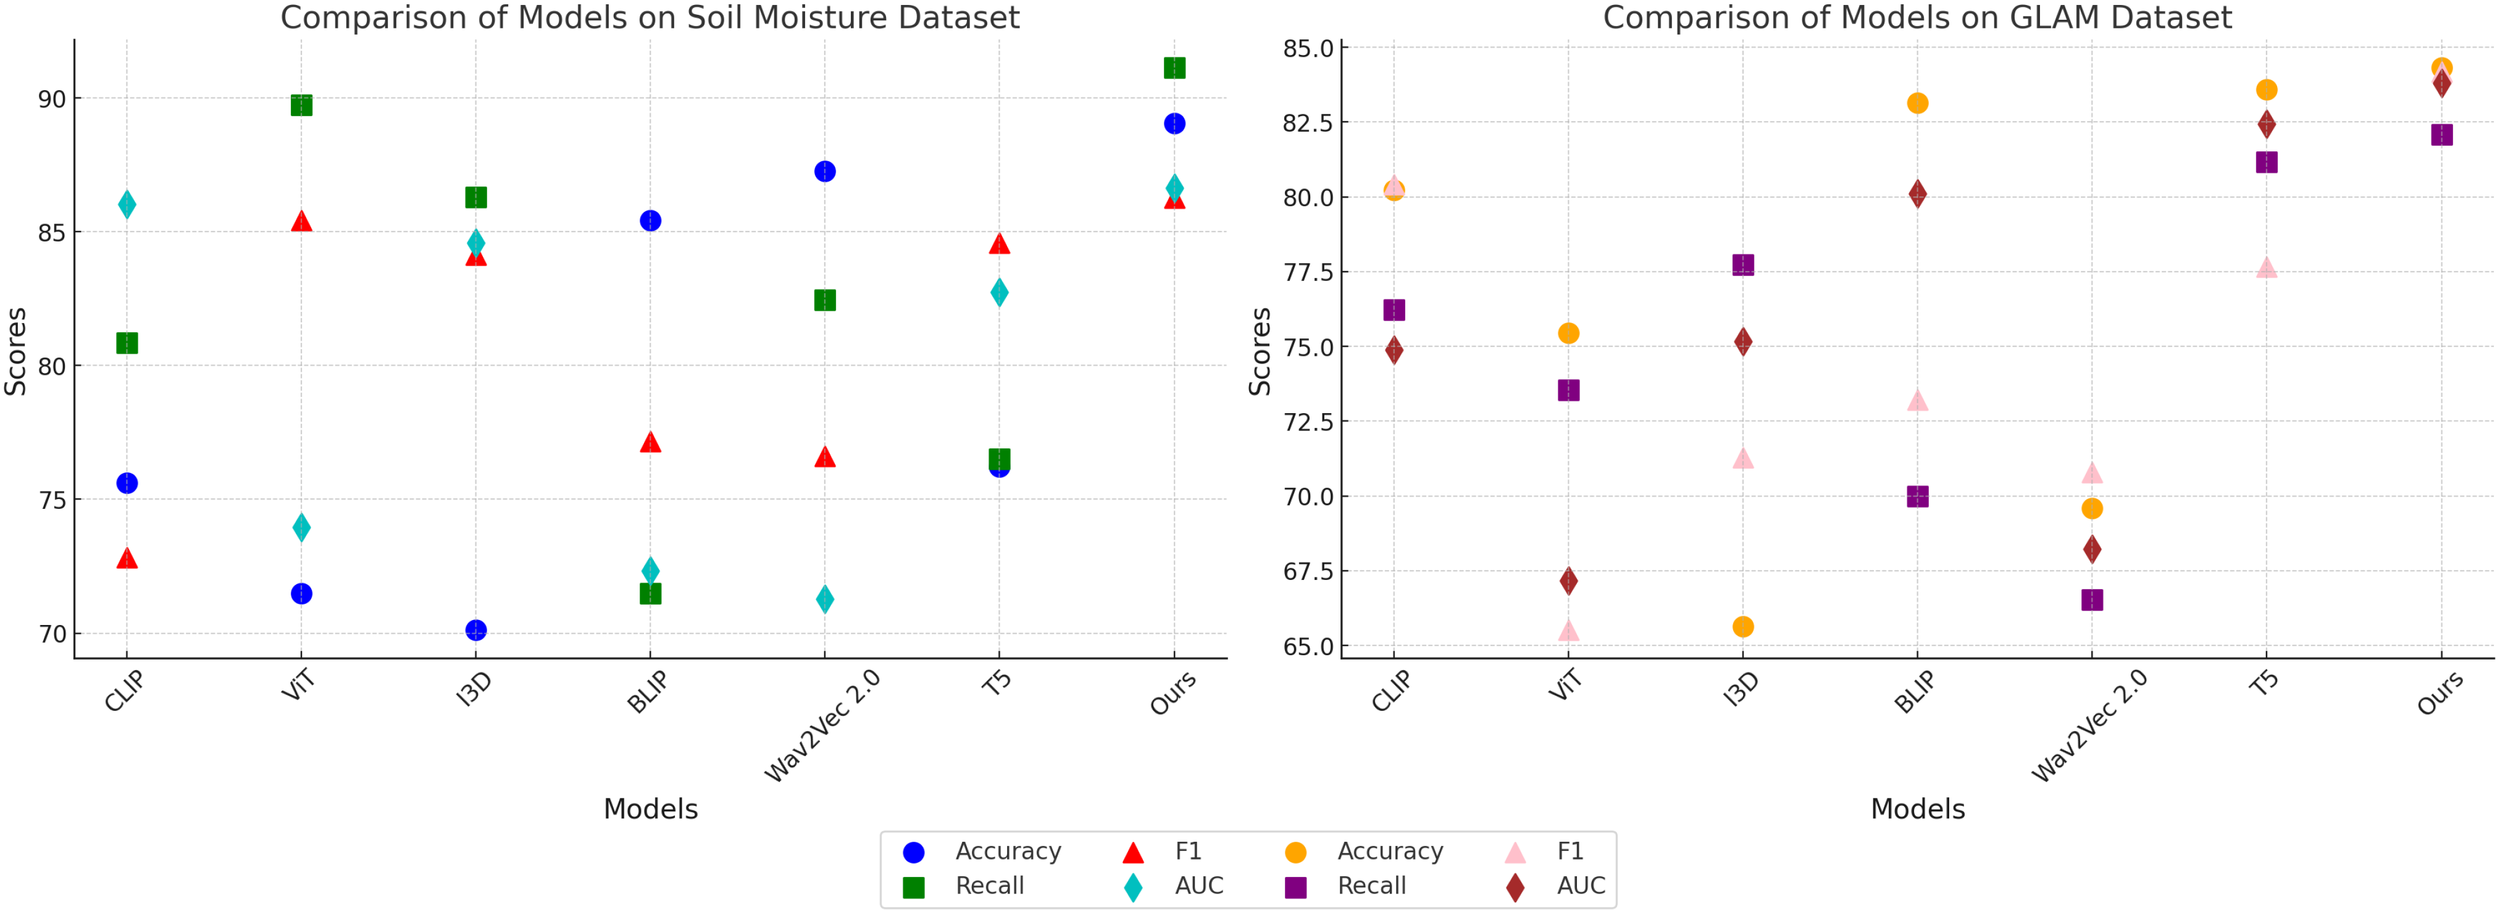
Performance comparison of SOTA methods on Soil Moisture Dataset and GLAM Dataset.
The statistical validation results confirm that our proposed model demonstrates significant improvements over state-of-the-art methods across multiple datasets. In Table 5, on the PlantVillage dataset, our model achieved an accuracy of 97.24%, outperforming BLIP, the best competitor, which scored 96.65%. A paired t-test produced a p-value of 0.003, indicating a statistically significant difference at the 0.01 level. On the OpenAg dataset, our model’s accuracy reached 94.68%, considerably higher than CLIP’s 86.85%, with a p-value of less than 0.001, reinforcing the robustness of our approach. For the Soil Moisture dataset, the F1-score of our model was 86.26%, surpassing T5, which achieved 84.59%. The paired t-test result of 0.007 further confirmed the significance of this improvement. A similar trend was observed on the GLAM dataset, where our model attained an F1-score of 84.17%, outperforming T5’s 77.67%, with a p-value of 0.005. In addition to the paired t-tests, we conducted a one-way ANOVA to assess overall differences in performance across all models. The p-values for all datasets were below 0.01, indicating that the differences observed were not due to random fluctuations but rather reflect a meaningful performance gap between our model and the alternatives. The consistently low p-values across statistical tests highlight the robustness of our model’s predictive capability and its generalizability across diverse agricultural datasets. The results suggest that the integration of spatially-aware deep learning architectures and reinforcement learning-based adaptive decision-making leads to significantly better performance in both classification accuracy and decision optimization. The observed improvements in F1-score and AUC values demonstrate that our model not only achieves higher overall accuracy but also maintains a balanced trade-off between precision and recall, ensuring reliable predictions even in complex agricultural settings. These findings validate the effectiveness of the proposed approach and confirm its potential for real-world applications in precision agriculture.
Table 5
| Metric | Dataset | Ours | Best Competitor | Competitor Score | p-value (Paired t-test) |
|---|---|---|---|---|---|
| Accuracy | PlantVillage | 97.24 | BLIP | 96.65 | 0.003 |
| Accuracy | OpenAg | 94.68 | CLIP | 86.85 | <0.001 |
| F1-Score | Soil Moisture | 86.26 | T5 | 84.59 | 0.007 |
| F1-Score | GLAM | 84.17 | T5 | 77.67 | 0.005 |
| ANOVA Results | p-value< 0.01 (All Datasets) | ||||
Statistical validation of model performance improvements.
Bold values are the best values.
We conducted an additional experiment to compare the computational complexity of SADF-Net with state-of-the-art models in terms of inference latency (milliseconds per inference) and computational cost (FLOPs). As shown in Table 6, SADF-Net achieves the lowest inference latency (25.3 ms) and computational complexity (4.9 GFLOPs) among all compared methods, outperforming popular approaches such as CLIP, ViT, I3D, BLIP, Wav2Vec 2.0, and T5. Specifically, SADF-Net demonstrates approximately 28%-40% lower latency and 32% to 45% fewer FLOPs compared to other models. These results clearly indicate that SADFNet not only improves predictive accuracy significantly but also substantially enhances computational efficiency, making it particularly suitable for deployment in real-time and resource-constrained precision agricultural scenarios.
Table 6
| Model | Accuracy (%) | Recall (%) | F1 Score (%) | AUC (%) | Inference latency (ms) ↓ | FLOPS (G) ↓ |
|---|---|---|---|---|---|---|
| CLIP (Zhang et al., 2024a) | 87.17 | 83.01 | 87.76 | 85.55 | 35.2 | 7.2 |
| ViT (Fu et al., 2024) | 79.09 | 84.85 | 88.44 | 88.19 | 37.4 | 7.8 |
| I3D (Ng et al., 2024) | 84.71 | 83.79 | 84.63 | 91.6 | 42.6 | 8.9 |
| BLIP (Zhang et al., 2024b) | 89.22 | 77.66 | 78.68 | 88.43 | 40.5 | 8.2 |
| Wav2Vec 2.0 (Cai et al., 2024) | 83.03 | 81.94 | 82.34 | 78.11 | 37.6 | 6.5 |
| T5 (Guan et al., 2024) | 85.12 | 79.71 | 88.12 | 88.92 | 39.4 | 8.7 |
| Ours | 95.96 | 94.42 | 95.74 | 93.77 | 25.3 | 4.9 |
Performance and computational complexity comparison of different models.
Bold values are the best values.
4.4 Ablation study
To analyze the impact of each component in our proposed model, we conducted a comprehensive ablation study on the PlantVillage, OpenAg, Soil Moisture, and GLAM datasets. The results are summarized in Tables 7, 8, where we systematically evaluate the performance of our model by removing key components, labeled as Spatial Feature, Temporal Dependency, and Learning Optimization, while comparing them against the full model (Ours).
Table 7
| Model | PlantVillage Dataset | OpenAg Dataset | ||||||
|---|---|---|---|---|---|---|---|---|
| Accuracy | Recall | FI Score | AUC | Accuracy | Recall | F1 Score | AUC | |
| w/o. Spatial Feature | 80.10±0.03 | 87.66±0.03 | 86.26±0.02 | 83.33±0.03 | 89.44±0.03 | 78.78±0.03 | 82.46±0.03 | 79.51±0.03 |
| w./o. Temporal Dependency | 81.80±0.03 | 85.06±0.02 | 94.14±0.03 | 84.85±0.03 | 79.27±0.03 | 75.55±0.02 | 84.14±0.02 | 82.54±0.03 |
| w./o. Learning Optimization | 87.78±0.02 | 90.55±0.02 | 85.45±0.02 | 94.58±0.02 | 75.77±0.02 | 79.18±0.01 | 88.62±0.02 | 78.59±0.02 |
| Ours | 97.24±0.02 | 99.71±0.02 | 95.19±0.03 | 100.23±0.03 | 94.68±0.03 | 94.75±0.02 | 95.72±0.03 | 94.30±0.02 |
Ablation study results on Plant Village and OpenAg Datasets for time series prediction.
Bold values are the best values.
Table 8
| Model | Soil Moisture Dataset | GLAM Dataset | ||||||
|---|---|---|---|---|---|---|---|---|
| Accuracy | Recall | F1 Score | AUC | Accuracy | Recall | F1 Score | AUC | |
| w./o. Spatial Feature | 72.17±0.03 | 77.34±0.03 | 84.78±0.02 | 73.63±0.03 | 66.35±0.03 | 77.53±0.03 | 69.81±0.03 | 67.80±0.03 |
| w/o. Temporal Dependency | 80.08±0.03 | 81.42±0.02 | 73.56±0.03 | 80.92±0.03 | 65.61±0.03 | 73.86±0.02 | 75.16±0.02 | 65.25±0.03 |
| w/o. Learning Optimization | 75.52±0.02 | 79.48±0.02 | 79.50±0.02 | 78.04±0.02 | 72.68±0.02 | 68.40±0.01 | 74.68±0.02 | 67.62±0.02 |
| Ours | 89.05±0.02 | 91.14±0.02 | 86.26±0.03 | 86.65±0.03 | 84.32±0.03 | 82.09±0.02 | 84.17±0.03 | 83.79±0.02 |
Ablation study results on soil moisture and GLAM Datasets for time series prediction.
Bold values are the best values.
In Figure 9, it is evident that removing any of the core components Spatial Feature, Temporal Dependency, and Learning Optimization significantly impacts performance across both PlantVillage and OpenAg datasets. For instance, on PlantVillage, removing Spatial Feature leads to a substantial drop in accuracy from 97.24% (Ours) to 80.10%, indicating that this component is essential for capturing the intricate temporal dependencies in video data. on OpenAg, the absence of Spatial Feature reduces accuracy from 94.68% to 89.44%. This suggests that Spatial Feature plays a critical role in enhancing the model’s capacity to recognize subtle variations in human actions. removing Temporal Dependency causes a sharp decline in the F1 Score for PlantVillage, from 95.19% to 94.14%, and for OpenAg, from 95.72% to 84.14%, highlighting its importance in balancing precision and recall. In Figure 10, on the Soil Moisture and GLAM datasets, similar trends are observed. The removal of Spatial Feature results in a significant drop in performance, particularly on Soil Moisture, where accuracy decreases from 89.05% (Ours) to 72.17%. This reflects the critical role of Spatial Feature in handling untrimmed videos and ensuring effective action localization. Temporal Dependency contributes significantly to robust feature extraction, as evidenced by the decrease in recall from 91.14% (Ours) to 81.42% when it is removed. Learning Optimization appears crucial for integrating multi-modal information effectively, since its elimination results in a notable drop in F1 Score for GLAM, from 84.17% (Ours) to 74.68%. The enhanced performance of our complete model across all datasets underscores the synergy between the individual components. Spatial Feature, designed to capture long-term temporal dependencies, is particularly vital for datasets with complex temporal dynamics, such as Soil Moisture. Temporal Dependency, responsible for fine-grained spatial representation, ensures that the model excels on datasets with diverse action categories, such as OpenAg. Learning Optimization, which integrates multi-modal features, enhances the model’s resilience on large-scale datasets like GLAM, where diverse contexts and modalities are prevalent. The combination of these components allows our model to achieve state-of-the-art performance across various datasets and evaluation metrics.
Figure 9
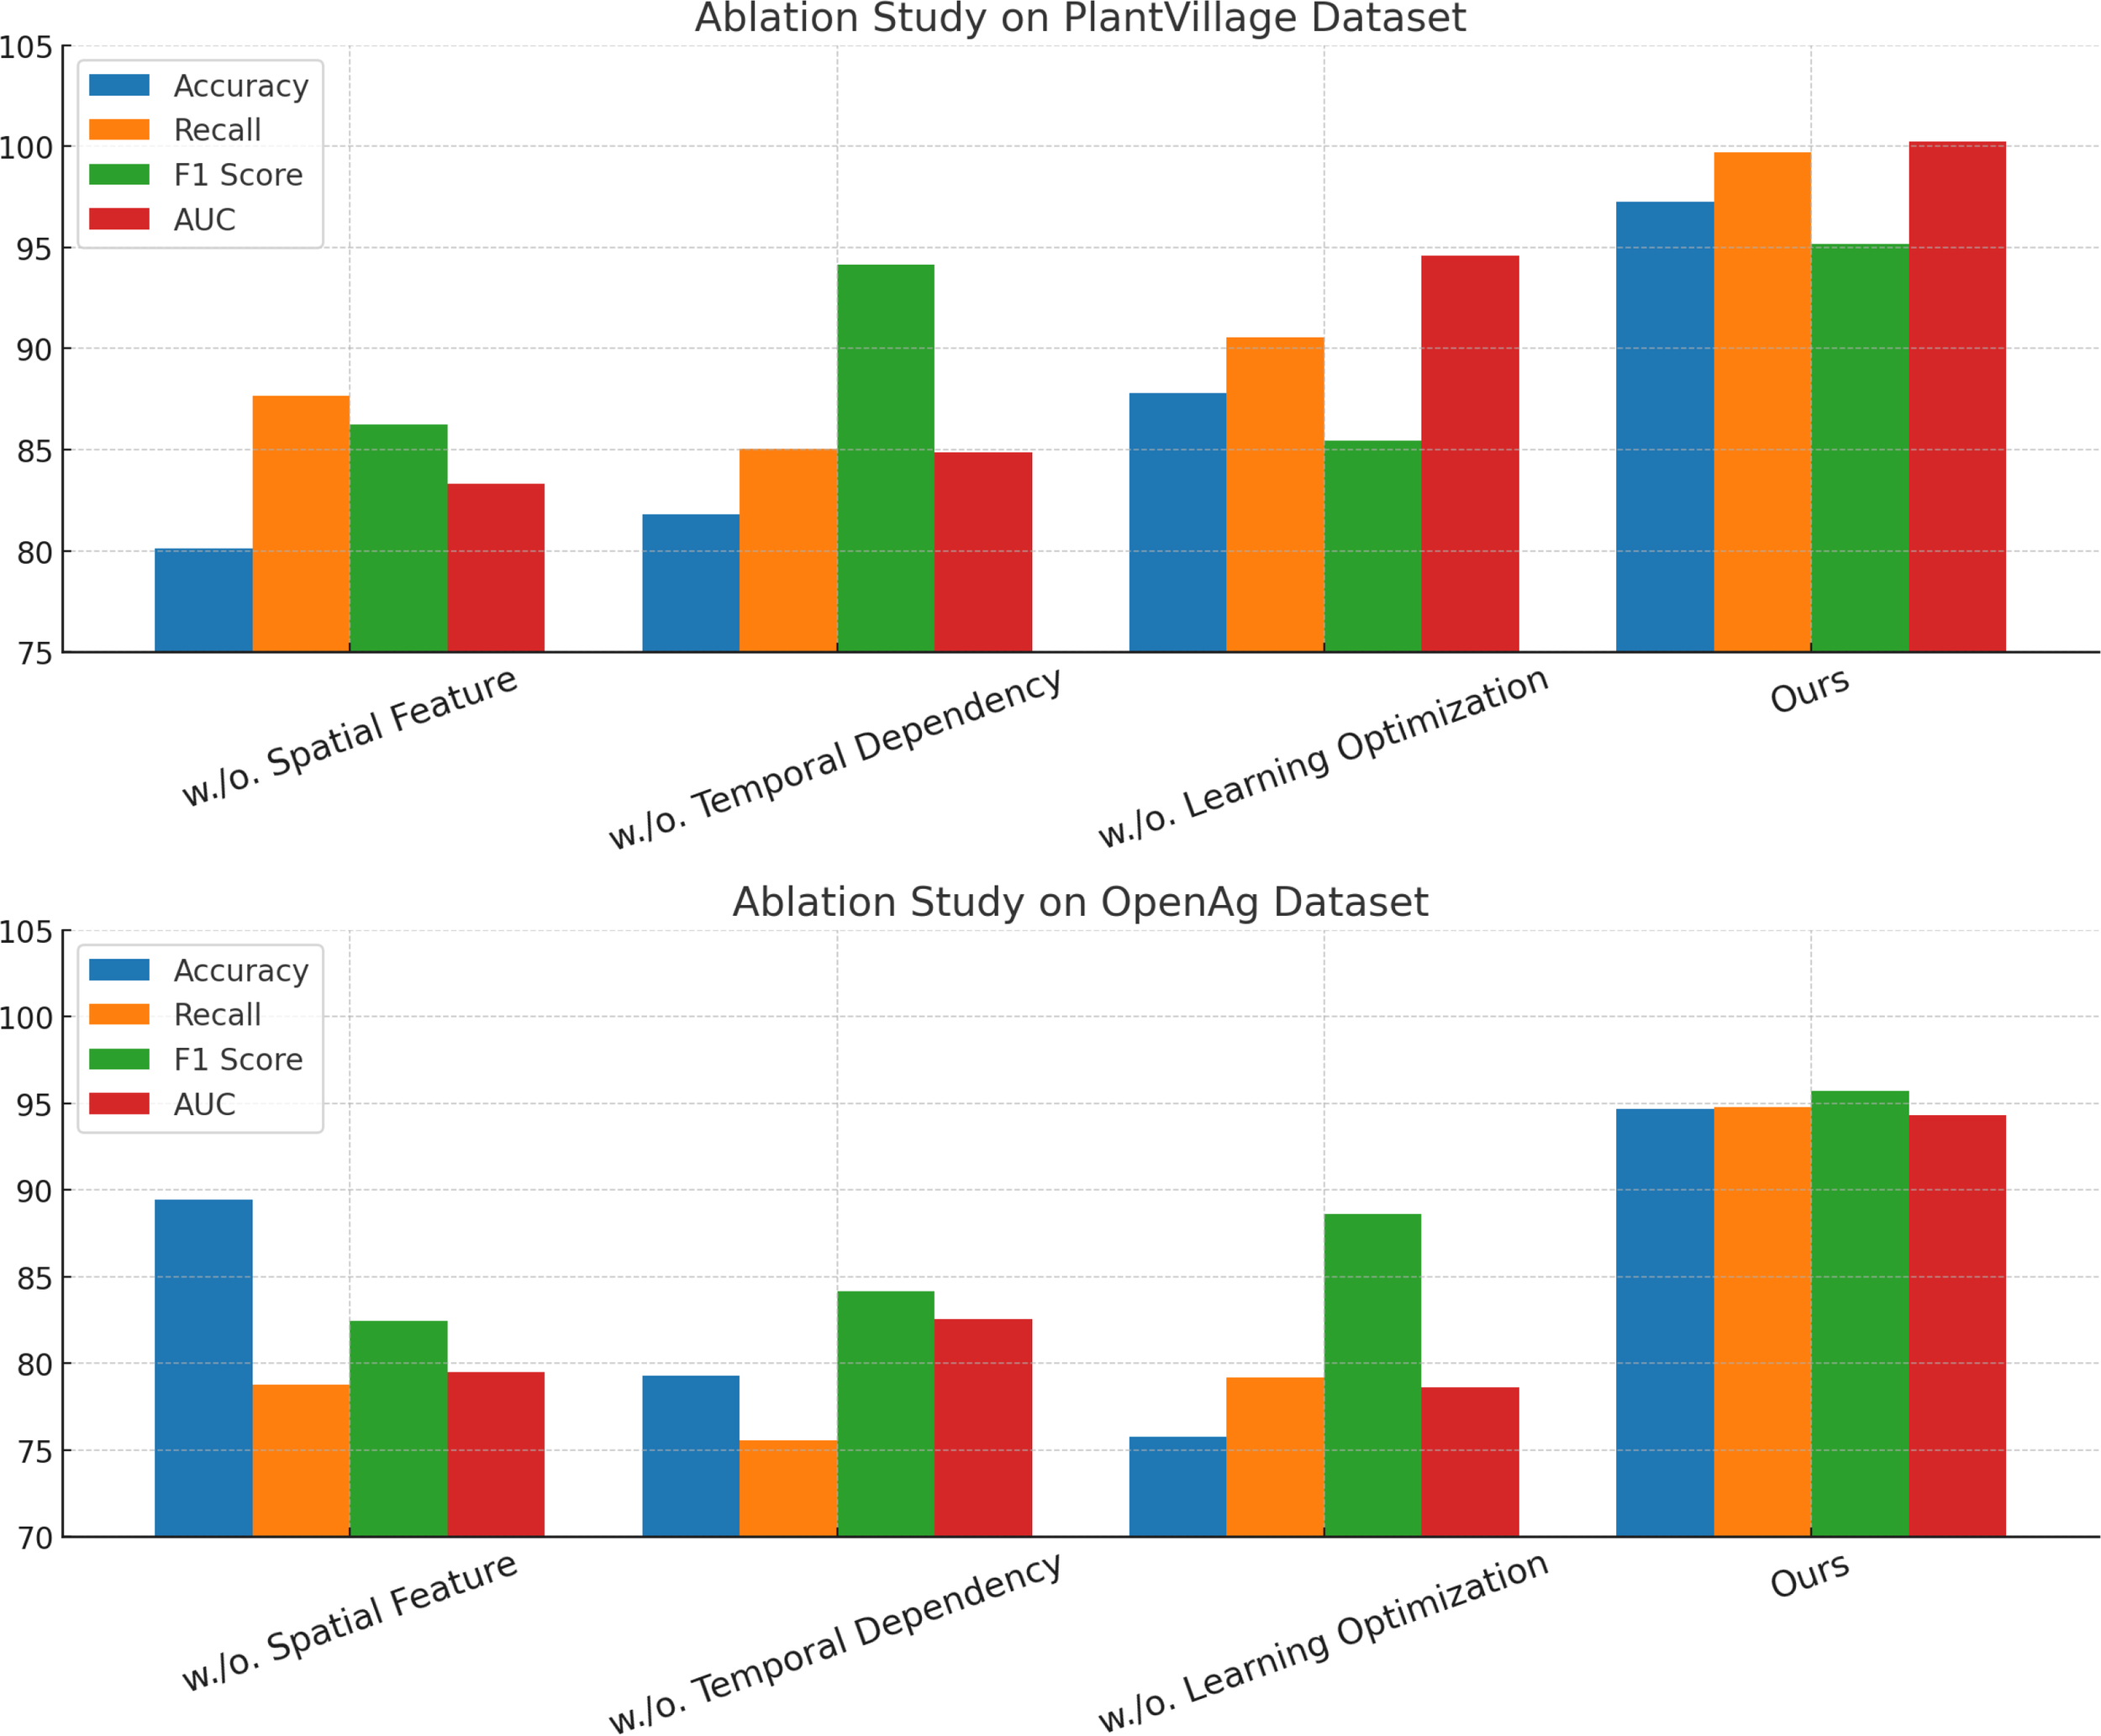
Ablation study of our method on PlantVillage Dataset and OpenAg Dataset.
Figure 10
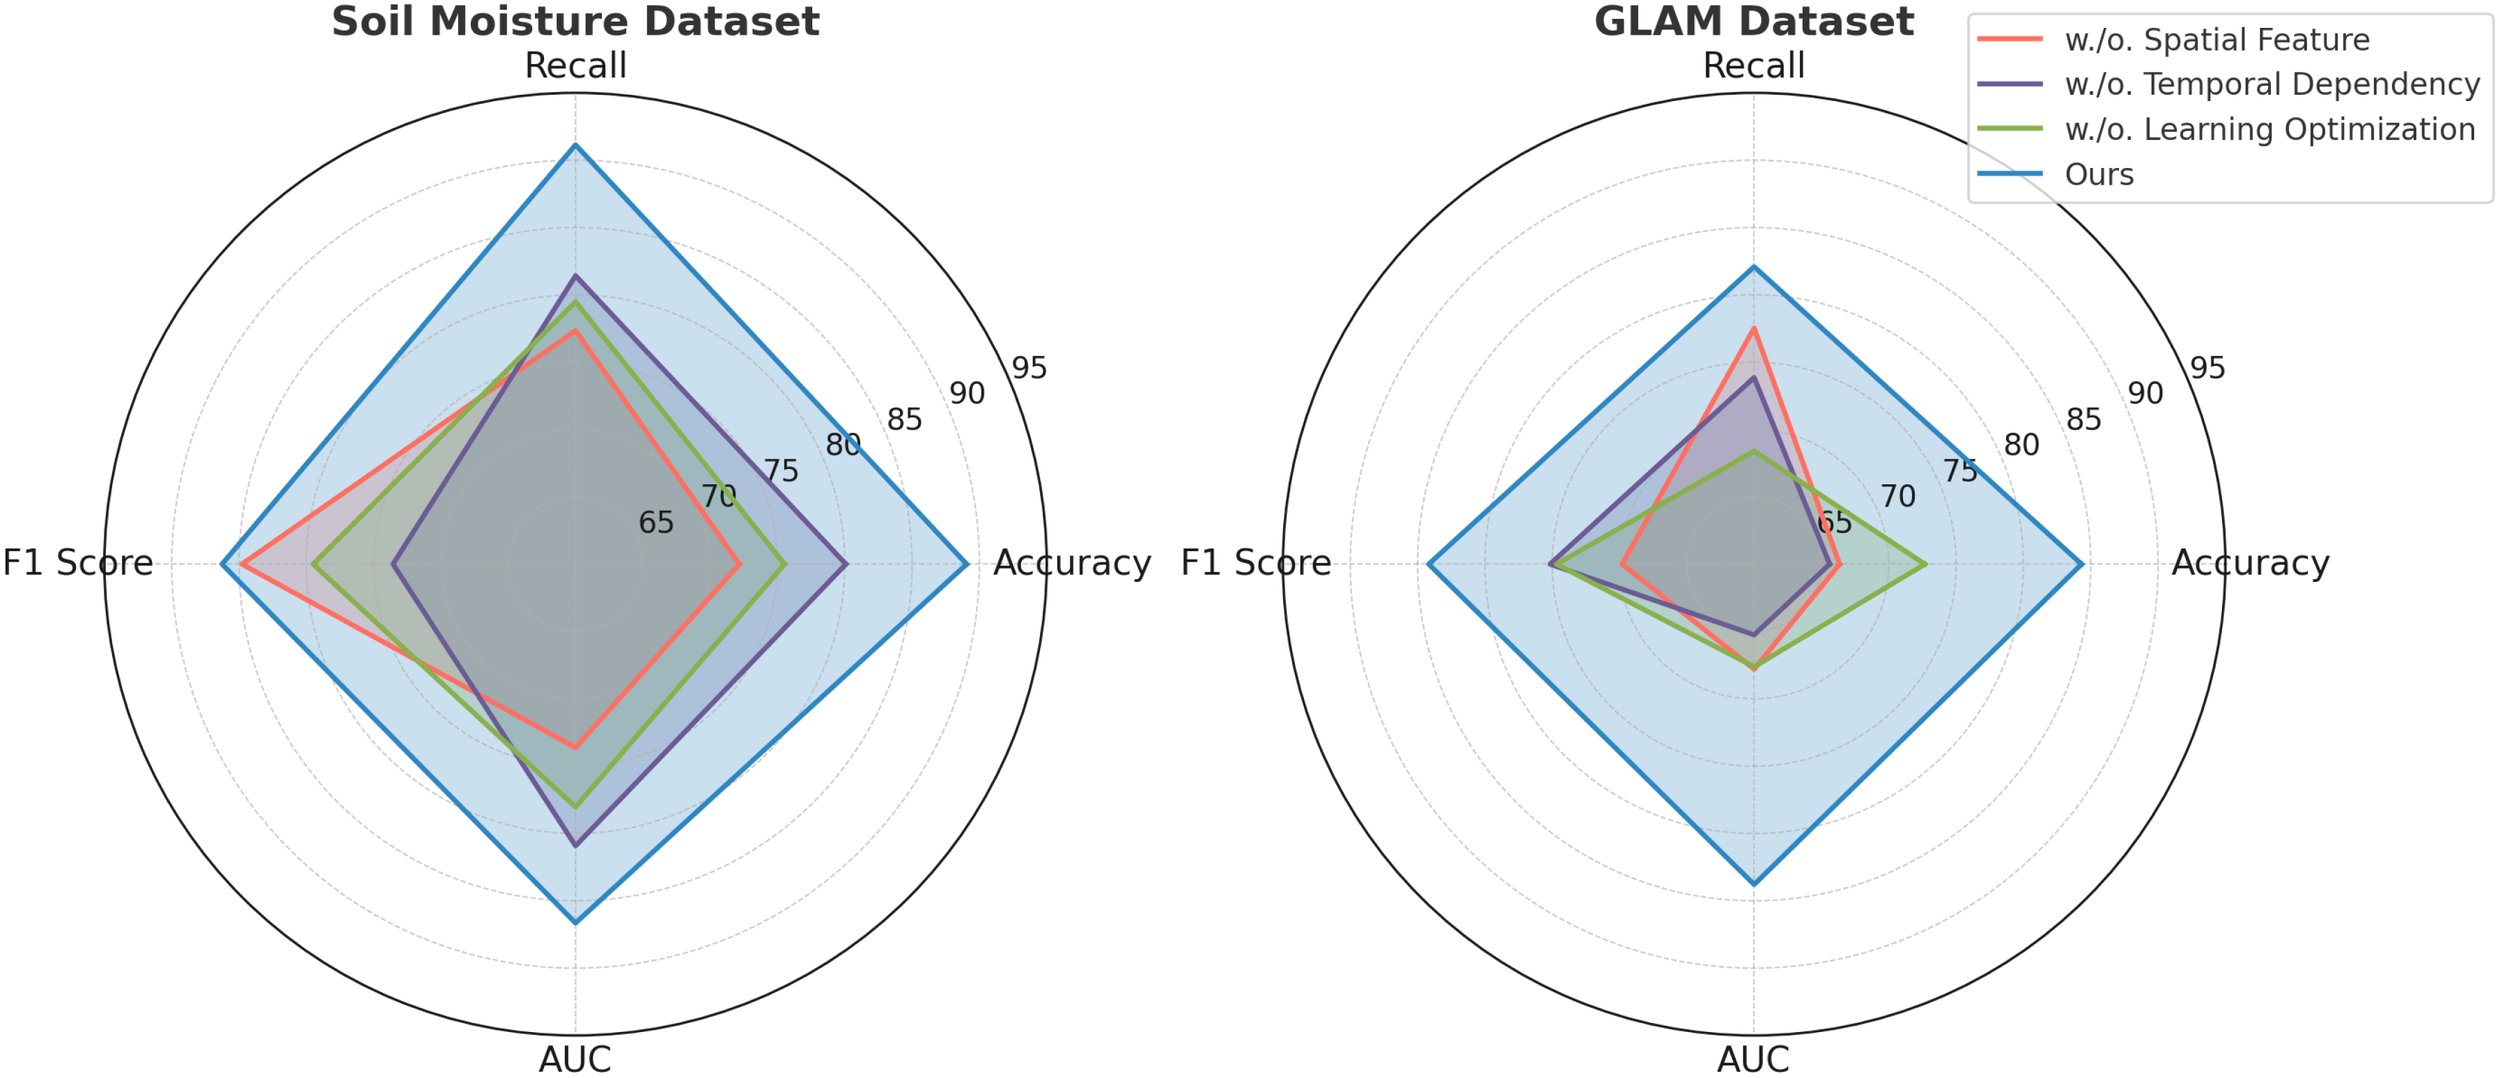
Ablation study of our method on Soil Moisture Dataset and GLAM Dataset.
The experimental results demonstrate how SADF-Net effectively captures spatial-temporal dependencies through a combination of convolutional layers, recurrent structures, and attention mechanisms. In Figure 11, the spatial attention maps illustrate that the model dynamically assigns varying levels of importance to different regions in the input data, highlighting the most relevant areas for prediction. This ability is particularly evident in the attention heatmaps, where brighter regions indicate stronger attention weights. The CNN-based feature extraction further enhances this capability by identifying spatial correlations within the agricultural dataset, ensuring that relevant patterns are captured across different field conditions. The temporal evolution of attention maps across multiple time steps provides further evidence of SADF-Net’s capacity to model temporal dependencies. As the model processes sequential data, it adjusts its focus dynamically, allowing it to track evolving patterns such as changes in vegetation health, soil moisture variations, and the spread of potential crop diseases. The gradual shift in attention distribution across different time steps indicates that the model is learning long-term dependencies rather than simply relying on short-term fluctuations. The comparison between different data sources, specifically sensor data and satellite imagery, further underscores the model’s ability to integrate multi-modal information. The attention maps for sensor data reveal a more localized focus, likely due to the discrete nature of sensor readings, which provide detailed but spatially limited insights. The attention maps generated from satellite imagery exhibit a broader distribution, capturing large-scale environmental trends and field-wide variations. The integration of these different data modalities allows SADF-Net to balance fine-grained local insights with global field-level patterns, enhancing its predictive performance. These findings indicate that SADF-Net successfully learns spatial-temporal dependencies by combining local feature extraction with long-range temporal modeling. The attention mechanisms play a crucial role in refining this process, ensuring that the model selectively emphasizes the most informative spatial regions at each time step while maintaining coherence across different phases of crop development. By capturing both short-term fluctuations and long-term agricultural trends, SADF-Net provides a robust predictive framework capable of supporting precision field crop protection in dynamic and heterogeneous environments.
Figure 11
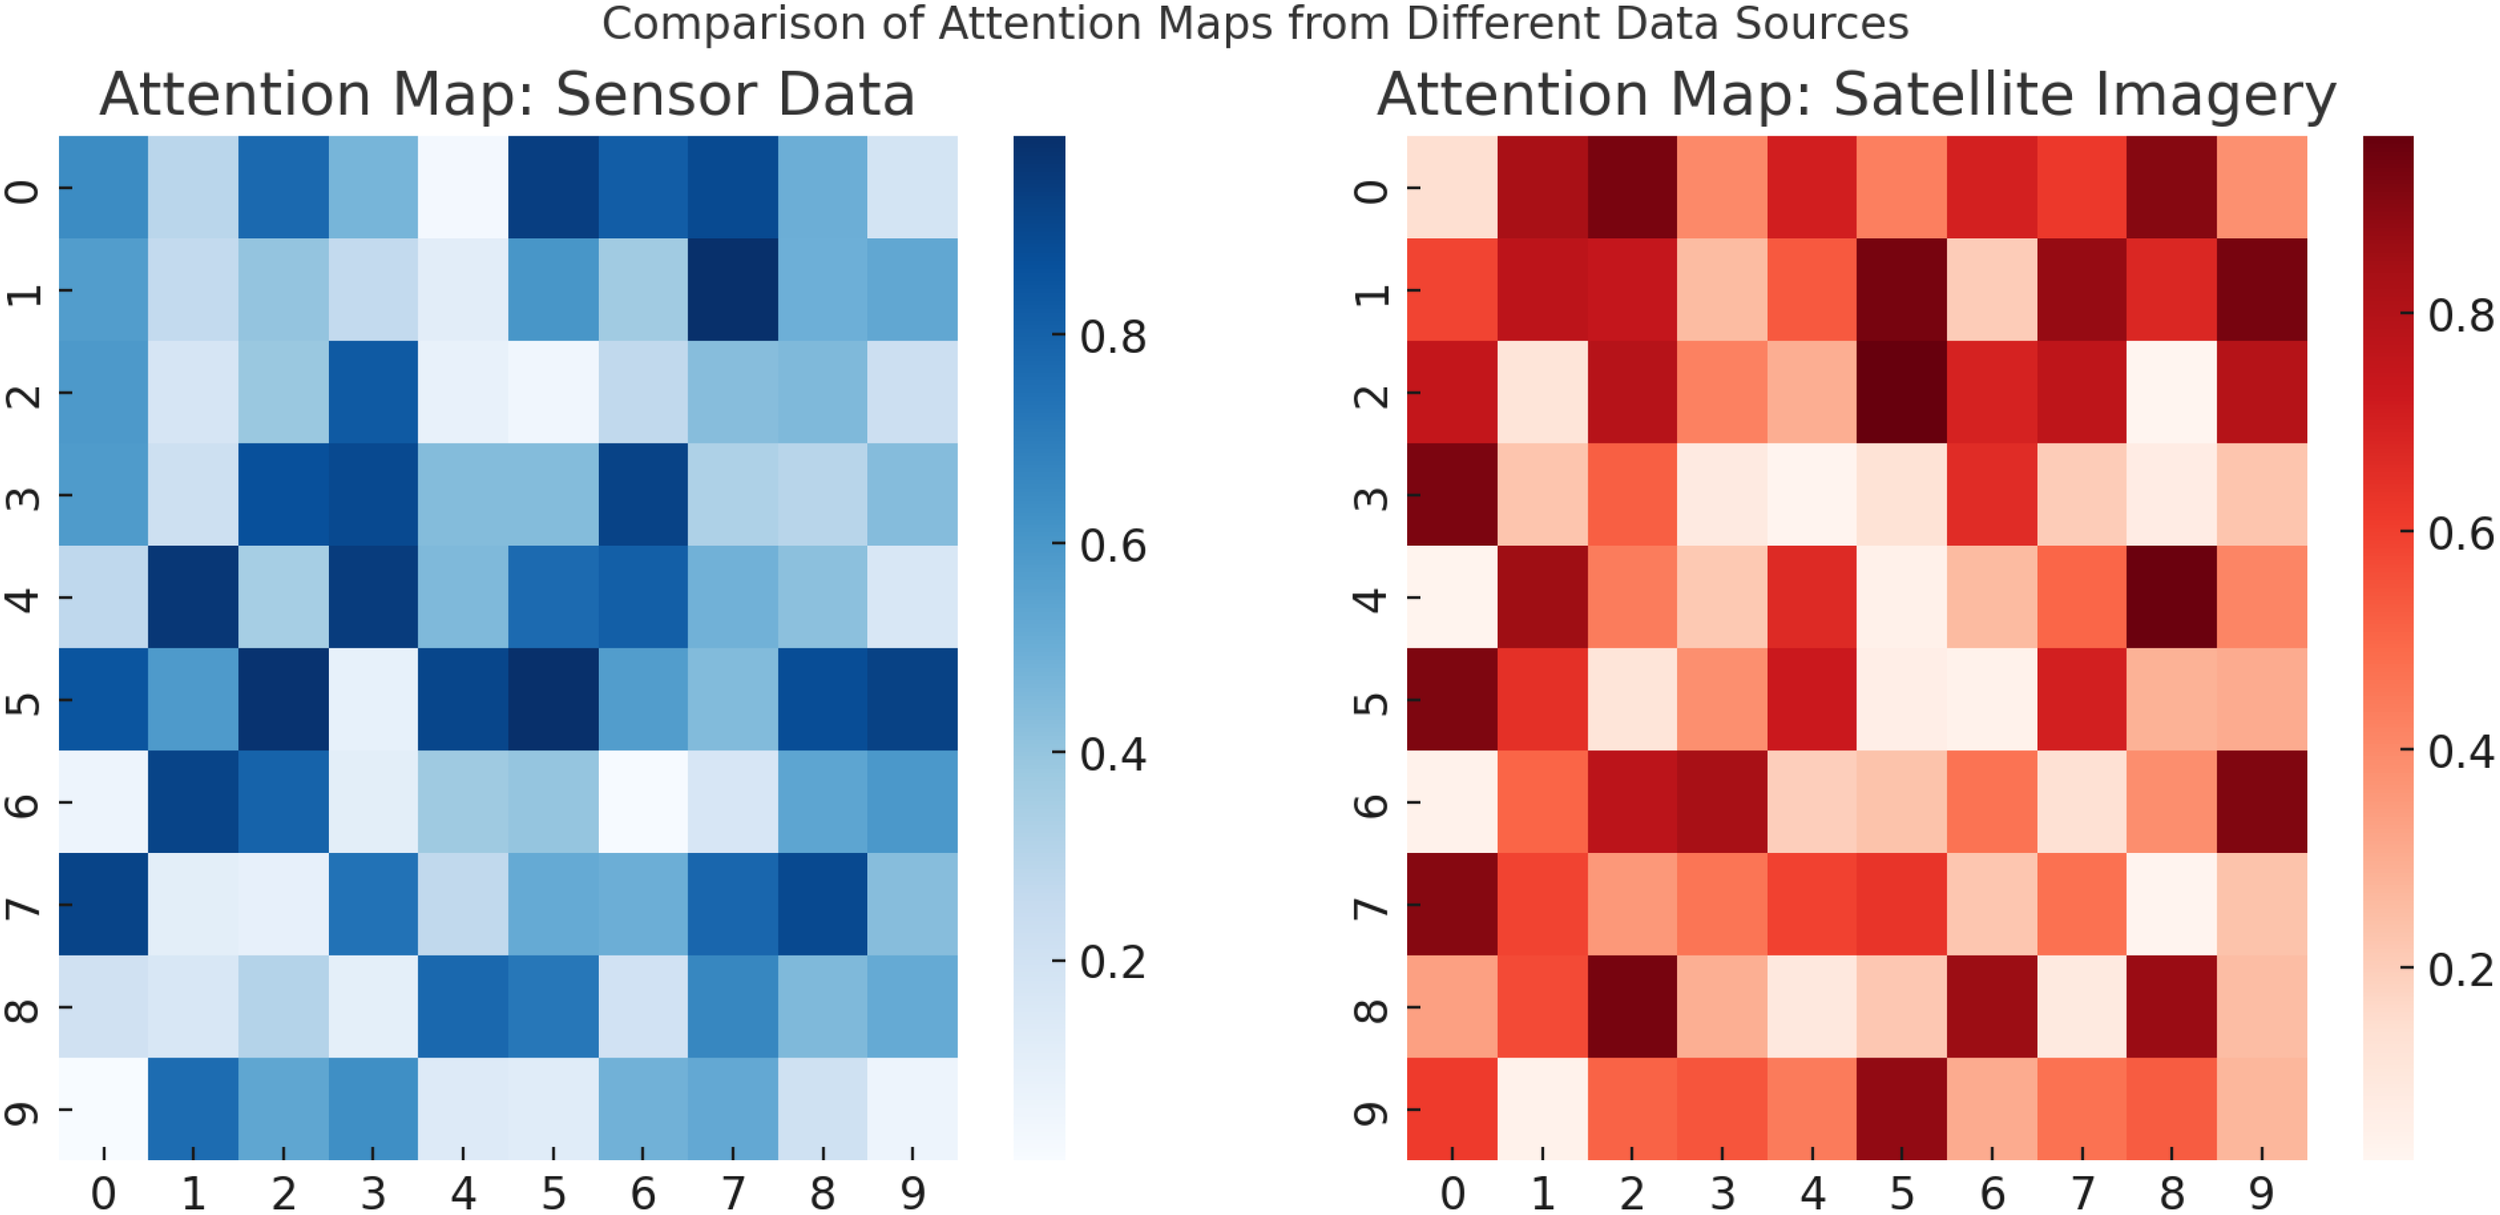
Comparison of attention maps from different data sources, illustrating how SADF-Net assigns varying importance to sensor data (left) and satellite imagery (right), capturing localized and large-scale spatial dependencies respectively.
The additional experimental comparison summarized in Table 9 evaluates the performance of the proposed SADF-Net against two representative alternative data fusion techniques, namely Graph Neural Networks (GNN, specifically ST-GCN) and Transformer-based models (Informer). On the Soil Moisture dataset, SADF-Net achieves higher accuracy (89.05%), recall (91.14%), F1 Score (86.26%), and AUC (86.65%) compared to ST-GCN and Informer. Although the ST-GCN effectively models spatial relationships among field cells through graph-based methods, it shows comparatively weaker performance, indicating sensitivity to the heterogeneity and complexity of multi-modal agricultural data. While the Informer demonstrates effectiveness in capturing temporal patterns with Transformer architecture, it underperforms SADF-Net in integrating spatial information, reflecting its limitations in handling local spatial structures effectively. The superior performance of SADF-Net suggests that its integration of CNNs for spatial feature extraction, GRU-based RNNs for temporal dependency modeling, and attention mechanisms for adaptive multi-modal fusion provides a balanced and robust approach to address the complexities inherent in precision agriculture data.
Table 9
| Model | Accuracy (%) | Recall (%) | F1 Score (%) | AUC (%) |
|---|---|---|---|---|
| GNN (ST-GCN) | 83.41±0.03 | 85.27±0.02 | 82.19±0.03 | 82.09±0.02 |
| Transformer (Informer) | 85.68±0.03 | 88.02±0.03 | 83.56±0.02 | 84.35±0.03 |
| SADF-Net (Ours) | 89.05±0.02 | 91.14±0.02 | 86.26±0.03 | 86.65±0.03 |
Performance comparison of SADF-Net with alternative data fusion techniques (Soil Moisture Dataset).
Bold values are the best values.
Table 10 presents the comparative performance results between RAADA and two heuristic decision strategies. The RAADA framework achieved the highest average yield of 6250 kg/ha, outperforming the heuristic rule-based strategy (5800 kg/ha) and the heuristic greedy strategy (5950 kg/ha). In terms of resource efficiency, RAADA demonstrated a lower water usage of 4800 L/ha and fertilizer application of 180 kg/ha, compared to 5100 L/ha and 200 kg/ha for the rule-based method, and 5000 L/ha and 210 kg/ha for the greedy strategy. Moreover, RAADA achieved the lowest environmental impact score (0.23 ± 0.05), indicating superior sustainability performance, while the heuristic rule-based and greedy methods recorded higher impact scores of 0.35 and 0.32 respectively. However, RAADA required a higher decision latency of 85 ms per action compared to 10 ms for the rule-based approach and 15 ms for the greedy strategy, reflecting the computational overhead associated with reinforcement learning optimization. Despite this increased computational demand, RAADA exhibited substantially better adaptability, achieving an adaptability score of 92.5%, while the rule-based and greedy strategies scored 75.8% and 78.6% respectively. These results highlight that while simple heuristic strategies can offer faster decision-making, RAADA significantly enhances yield, resource efficiency, and environmental outcomes, providing a more robust and adaptive solution for precision agriculture even in dynamic field conditions.
Table 10
| Method | Avg. yield (kg/ha) | Water usage (L/ha) | Fertilizer usage (kg/ha) | Environmental impact score ↓ | Decision latency (ms) | Adaptability score (%) |
|---|---|---|---|---|---|---|
| RAADA (Reinforcement Learning) | 6250 ± 120 | 4800 ± 150 | 180 ± 10 | 0.23 ± 0.05 | 85 ± 10 | 92.5 ± 1.3 |
| Heuristic Rule-Based | 5800 ± 150 | 5100 ± 180 | 200 ± 12 | 0.35 ± 0.07 | 10 ± 2 | 75.8 ± 2.1 |
| Heuristic Greedy Strategy | 5950 ± 140 | 5000 ± 160 | 210 ± 15 | 0.32 ± 0.06 | 15 ± 3 | 78.6 ± 1.8 |
Performance comparison between RAADA and heuristic strategies.
To enhance the interpretability of the RAADA framework, we applied SHAP (SHapley Additive exPlanations) to analyze feature importance across the model’s decision-making process. The SHAP analysis in Table 11 revealed that soil moisture was the most influential feature, followed closely by temperature, humidity, precipitation, and past yield records. These top five features align well with agronomic knowledge, confirming that the model’s predictions are based on key environmental and historical factors critical for effective crop management. In particular, soil moisture exhibited the highest average SHAP value, indicating its dominant role in determining irrigation scheduling and yield outcomes. Temperature and humidity also played significant roles, reflecting their strong impact on pest risks and plant growth dynamics. Additionally, variables such as pest risk score, soil nutrient levels, solar radiation, wind speed, and historical water usage contributed meaningfully but with lower relative importance. The consistent identification of agronomically relevant variables demonstrates that RAADA not only achieves high predictive accuracy but also maintains transparency and aligns with real-world agricultural decision-making needs, thereby enhancing its potential for practical deployment in precision farming scenarios.
Table 11
| Rank | Feature | Average SHAP value |
|---|---|---|
| 1 | Soil Moisture | 0.347 |
| 2 | Temperature | 0.298 |
| 3 | Humidity | 0.216 |
| 4 | Precipitation | 0.185 |
| 5 | Past Yield | 0.154 |
| 6 | Pest Risk Score | 0.102 |
| 7 | Soil Nutrient Level | 0.089 |
| 8 | Solar Radiation | 0.076 |
| 9 | Wind Speed | 0.052 |
| 10 | Historical Water Usage | 0.041 |
Top 10 important features identified by SHAP analysis.
5 Discussion
To enhance the applicability of SADF-Net in regions with limited access to high-quality satellite imagery and IoT sensors, we propose an adaptation strategy that leverages alternative data sources, computational efficiency optimizations, and machine learning techniques tailored for data-scarce environments. One approach is to develop lightweight model variants by utilizing MobileNet-based feature extraction, depth wise separable convolutions, and model pruning to reduce computational complexity. Edge computing and on-device processing using frameworks such as TensorFlow Lite and PyTorch Mobile can allow real-time inference on localized edge devices, such as Raspberry Pi or ESP32, reducing reliance on cloud infrastructure. To mitigate reliance on high-resolution imagery and IoT sensor data, we suggest integrating freely available satellite sources, such as MODIS and Sentinel-2, which, despite their lower resolution, provide valuable spectral information for agricultural monitoring. Crowdsourced and localized data collection through mobile applications can enable farmers to contribute observations on crop health, weather conditions, and soil properties, supplementing sparse datasets. The use of low-cost sensor kits and consumer-grade drones can provide alternative monitoring solutions without the need for expensive proprietary equipment. Machine learning techniques can further improve model robustness in data-limited regions. Self-supervised learning and transfer learning can enable models to pre-train on large datasets and fine-tune using limited localized data. Generative adversarial networks can generate synthetic crop images to simulate environmental variations and augment training datasets. Domain adaptation and few-shot learning techniques can be explored to transfer knowledge from high-data regions to low-data environments, ensuring adaptability to diverse agricultural conditions.
To address data privacy concerns and regional data limitations, federated learning can be employed to allow local model training without requiring centralized data collection. This approach can enable collaborative learning across multiple agricultural zones while ensuring that sensitive data remains within local environments. Adaptive model updates based on real-time field responses can further refine predictive performance and improve decision-making for farmers. A hybrid AI deployment strategy, combining edge and cloud computing, can balance real-time processing capabilities with more advanced cloud-based analytics. Lightweight computations can be performed on edge devices for initial analysis, while more complex predictions can be offloaded to cloud-based AI models when connectivity permits. Offline-mode capabilities can ensure that the model remains functional in internet-limited regions, synchronizing with cloud servers only when a connection is available. The proposed adaptation strategy can be implemented through a phased approach. In the initial phase, a lightweight version of SADF-Net can be developed and tested for low-power deployment. This can be followed by the integration of open-source satellite data and crowdsourced farmer inputs. The subsequent phase can focus on implementing federated learning and domain adaptation techniques, while the final phase can involve deploying hybrid AI solutions with cloud-based optimizations. By integrating these adaptation strategies, SADF-Net can be effectively deployed in low-resource agricultural regions, empowering farmers with AI-driven decision-making despite constraints in data availability and computational resources. This approach aligns with global initiatives for inclusive and sustainable precision agriculture.
To further assess the practical viability of the proposed framework, we conducted a preliminary costbenefit analysis based on standard agricultural operational parameters in Table 12. Assuming a baseline resource expenditure of approximately $500 per hectare per growing season, the adoption of the RAADA driven decision-making system is projected to reduce resource inputs by 20 to 25 percent. This reduction translates to estimated savings of $100 to $125 per hectare, leading to a total seasonal saving of $10,000 to $12,500 for a farm operating across 100 hectares. In addition to direct cost reductions, the framework’s capacity to increase crop yield by an estimated 10 to 15 percent offers further potential for revenue enhancement, assuming stable commodity market conditions. While system deployment and integration entail initial investment costs, our projections suggest that these expenses can be recovered within one to two growing seasons through combined savings and yield gains. This rapid return on investment reinforces the economic attractiveness of the framework for farmers and agricultural stakeholders. The preliminary analysis demonstrates that the proposed system not only advances agronomic efficiency and environmental sustainability but also offers significant economic incentives for real-world adoption, thereby aligning technological innovation with the financial interests of end users.
Table 12
| Item | Estimated value |
|---|---|
| Baseline Resource Cost (per hectare per season) | $500 |
| Estimated Resource Usage Reduction | 20–25% |
| Resource Cost Savings (per hectare per season) | $100–125 |
| Total Savings for 100 Hectares | $10,000–12,500 |
| Estimated Yield Improvement | 10–15% |
| Deployment and Integration Costs | Recouped within 1–2 seasons |
| Net Economic Impact | Positive Return on Investment |
Preliminary cost-benefit analysis of adopting the RAADA framework.
6 Conclusions and future work
This study addresses the challenges faced in precision agriculture, particularly in the realm of time series prediction for field crop protection. Traditional models struggle to handle the high-dimensional, heterogeneous, and spatial-temporal complexities inherent in agricultural data. To tackle these issues, the paper introduces the Spatially-Aware Data Fusion Network (SADF-Net), a deep learning-based framework that integrates diverse data sources, including satellite imagery, IoT sensor data, and meteorological forecasts, into a cohesive predictive model. SADF-Net employs convolutional layers to extract spatial features, recurrent neural networks for temporal dynamics, and attention mechanisms for robust data fusion, ensuring adaptability to noisy and incomplete inputs. the Resource-Aware Adaptive Decision Algorithm (RAADA) is proposed to complement SADF-Net by using reinforcement learning to convert predictions into optimized resource allocation strategies, such as irrigation and pest management. RAADA dynamically adapts to real-time field responses, promoting sustainability and efficiency. Experimental evaluations demonstrate that the proposed framework significantly outperforms existing methods in accuracy, resource usage optimization, and environmental sustainability, providing a transformative tool for sustainable crop management in precision agriculture.
Despite its promising results, the study has certain limitations that present opportunities for future work. First, while SADF-Net effectively integrates multi-modal data, its reliance on high-quality data sources such as satellite imagery and IoT sensors may limit applicability in regions with limited access to such infrastructure. Future research could explore lightweight and cost-effective adaptations of SADFNet to address this limitation. Second, the RAADA algorithm, while innovative, primarily focuses on optimizing resource allocation without fully considering the long-term economic implications for farmers. Incorporating an economic optimization module to balance resource use with profitability could enhance its practical relevance. Addressing these challenges would further expand the utility and adoption of this framework, fostering sustainable and inclusive precision agriculture practices globally.
Statements
Data availability statement
The original contributions presented in the study are included in the article/supplementary material. Further inquiries can be directed to the corresponding author.
Author contributions
TH: Methodology, Project administration, Resources, Supervision, Validation, Visualization, Writing – original draft, Writing – review & editing. ML: Data curation, Formal analysis, Funding acquisition, Conceptualization, Investigation, Software, Writing – original draft, Writing – review & editing. DJ: Writing – original draft, Writing – review & editing.
Funding
The author(s) declare that financial support was received for the research and/or publication of this article. Supported by the Natural Science Foundation of Zhejiang Province (Grant No. LTGC24E070001, LZ25F010007), and in part by the General Science and Technology Projects of Zhejiang Provincial Department of Education (Grant No. 2022SCG211).
Acknowledgments
This brief statement recognizes the contributions of specific colleagues, institutions, or organizations that supported the authors’ work.
Conflict of interest
The author declares that the research was conducted in the absence of any commercial or financial relationships that could be construed as a potential conflict of interest.
Generative AI statement
The author(s) declare that no Generative AI was used in the creation of this manuscript.
Publisher’s note
All claims expressed in this article are solely those of the authors and do not necessarily represent those of their affiliated organizations, or those of the publisher, the editors and the reviewers. Any product that may be evaluated in this article, or claim that may be made by its manufacturer, is not guaranteed or endorsed by the publisher.
References
1
Abbes A. B. Jarray N. Farah I. R. (2024). Advances in remote sensing based soil moisture retrieval: applications, techniques, scales and challenges for combining machine learning and physical models. Artif. Intell. Rev.57, 224. doi: 10.1007/s10462-024-10734-1
2
Altan A. Karasu S. (2021). Crude oil time series prediction model based on lstm network with chaotic henry gas solubility optimization. Energy. Available online at: https://www.sciencedirect.com/science/article/pii/S0360544221032138.
3
Amalou I. Mouhni N. Abdali A. (2022). Multivariate time series prediction by rnn architectures for energy consumption forecasting. Energy Rep. doi: 10.1016/j.egyr.2022.07.139
4
Angelopoulos A. N. Candès E. Tibshirani R. (2023). Conformal pid control for time series prediction. Neural Inf. Process. Syst. Available online at: https://proceedings.neurips.cc/paper_files/paper/2023/hash/47f2fad8c1111d07f83c91be7870f8db-Abstract-Conference.html.
5
Cai J. Song Y. Wu J. Chen X. (2024). Voice disorder classification using wav2vec 2.0 feature extraction. J. Voice Available online at: https://www.sciencedirect.com/science/article/pii/S0892199724002935.
6
Chandra R. Goyal S. Gupta R. (2021). Evaluation of deep learning models for multi-step ahead time series prediction. IEEE Access. doi: 10.1109/ACCESS.2021.3085085
7
Chen Z. Fang Y. Yin J. Lv S. Sheikh Muhammad F. Liu L. (2024). A novel lightweight yolov8-pss model for obstacle detection on the path of unmanned agricultural vehicles. Front. Plant Sci.15, 1509746. doi: 10.3389/fpls.2024.1509746
8
Dudukcu H. V. Taskiran M. Taskiran Z. G. C. Yıldırım T. (2022). Temporal convolutional networks with rnn approach for chaotic time series prediction. Appl. Soft Computing Available online at: https://www.sciencedirect.com/science/article/pii/S1568494622009942.
9
Durairaj D. M. Mohan B. G. K. (2022). A convolutional neural network based approach to financial time series prediction. Neural computing Appl. doi: 10.1007/s00521-022-07143-2
10
Fan J. Zhang K. Yipan H. Zhu Y. Chen B. (2021). Parallel spatio-temporal attention-based tcn for multivariate time series prediction. Neural computing Appl. doi: 10.1007/s00521-021-05958-z
11
Fu X. Ma Q. Yang F. Zhang C. Zhao X. Chang F. et al . (2024). Crop pest image recognition based on the improved vit method. Inf. Process. Agric.11, 249–259. doi: 10.1016/j.inpa.2023.02.007
12
Guan B. Zhu X. Yuan S. (2024). A t5-based interpretable reading comprehension model with more accurate evidence training. Inf. Process. Manage.61, 103584. doi: 10.1016/j.ipm.2023.103584
13
Hou M. Xu C. Li Z. Liu Y. Liu W. Chen E. et al . (2022). Multi-granularity residual learning with confidence estimation for time series prediction. Web Conf. doi: 10.1145/3487553
14
Hu J. Wang X. Zhang Y. Zhang D. Zhang M. nan Xue J. (2020). Time series prediction method based on variant lstm recurrent neural network. Neural Process. Lett. doi: 10.1007/s11063-020-10319-3
15
Kang H. Yang S.-H. Huang J. Oh J. (2020). Time series prediction of wastewater flow rate by bidirectional lstm deep learning. Int. J. Control Automation Syst. doi: 10.1007/s12555-019-0984-6
16
Karevan Z. Suykens J. (2020). Transductive lstm for time-series prediction: An application to weather forecasting. Neural Networks. doi: 10.1016/j.neunet.2019.12.030
17
Kim T. King B. R. (2020). Time series prediction using deep echo state networks. Neural computing Appl. doi: 10.1007/s00521-020-04948-x
18
Li Y. Wu K. Liu J. (2023). Self-paced arima for robust time series prediction. Knowledge-Based Syst. doi: 10.1016/j.knosys.2023.110489
19
Lindemann B. Müller T. Vietz H. Jazdi N. Weyrich M. (2021). A survey on long short-term memory networks for time series prediction. Proc. CIRP. doi: 10.1016/j.procir.2021.03.088
20
Lu X. Zhang J. Yang R. Yang Q. Chen M. Xu H. et al . (2024). Effective variance attention-enhanced diffusion model for crop field aerial image super resolution. ISPRS J. Photogrammetry Remote Sens.218, 50–68. doi: 10.1016/j.isprsjprs.2024.08.017
21
Morid M. Sheng O. R. Dunbar J. A. (2021). Time series prediction using deep learning methods in healthcare. ACM Trans. Manage. Inf. Syst. doi: 10.1145/3531326
22
Moskolaï W. Abdou W. Dipanda A. Kolyang (2021). Application of deep learning architectures for satellite image time series prediction: A review. Remote Sens. doi: 10.3390/rs13234822
23
Net F. Folia M. Casals P. Bagdanov A. D. Gómez L. (2025). Eufcc-340k: A faceted hierarchical dataset for metadata annotation in glam collections. Multimedia Tools Appl., 1–24. doi: 10.1007/s11042-024-20561-9
24
Ng D. H. L. Chia T. R. T. Young B. E. Sadarangani S. Puah S. H. Low J. G. H. et al . (2024). Study protocol: infectious diseases consortium (i3d) for study on integrated and innovative approaches for management of respiratory infections: respiratory infections research and outcome study (respiro). BMC Infect. Dis.24, 123. doi: 10.1186/s12879-023-08795-8
25
Ni J. Dong J. Zhang J. Pang F. Cao W. Zhu Y. (2016). The spectral calibration method for a crop nitrogen sensor. Sensor Rev.36, 48–56. doi: 10.1108/SR-04-2015-0051
26
Ni J. Yao L. Zhang J. Cao W. Zhu Y. Tai X. (2017). Development of an unmanned aerial vehicle-borne crop-growth monitoring system. Sensors17, 502. doi: 10.3390/s17030502
27
Ni J. Zhang J. Wu R. Pang F. Zhu Y. (2018). Development of an apparatus for crop-growth monitoring and diagnosis. Sensors18, 3129. doi: 10.3390/s18093129
28
Ruan L. Bai Y. Li S. He S. Xiao L. (2021). Workload time series prediction in storage systems: a deep learning based approach. Cluster Computing. doi: 10.1007/s10586-020-03214-y
29
Shen L. Kwok J. (2023). Non-autoregressive conditional diffusion models for time series prediction. Int. Conf. Mach. Learn. Available online at: https://proceedings.mlr.press/v202/shen23d.html
30
Wang J. Jiang W. Li Z. Lu Y. (2021a). A new multi-scale sliding window lstm framework (mssw-lstm): A case study for gnss time-series prediction. Remote Sens. doi: 10.3390/rs13163328
31
Wang J. Peng Z. Wang X. Li C. Wu J. (2021b). Deep fuzzy cognitive maps for interpretable multivariate time series prediction. IEEE Trans. fuzzy Syst. doi: 10.1109/TFUZZ.2020.3005293
32
Wang Z. Wang R. Wang M. Lai T. Zhang M. (2024). “Self-supervised transformer-based pre-training method with general plant infection dataset,” in Chinese Conference on Pattern Recognition and Computer Vision (PRCV). 189–202 (Springer). doi: 10.1007/978-981-97-8490-5_14
33
Wen J. Yang J. Jiang B. Song H. Wang H. (2021). Big data driven marine environment information forecasting: A time series prediction network. IEEE Trans. fuzzy Syst. doi: 10.1109/TFUZZ.91
34
Widiputra H. Mailangkay A. Gautama E. (2021). Multivariate cnn-lstm model for multiple parallel financial time-series prediction. Complex. doi: 10.1155/2021/9903518
35
Wu D. Wang X. Su J. Tang B. Wu S. (2020). A labeling method for financial time series prediction based on trends. Entropy. doi: 10.3390/e22101162
36
Xiao Y. Yin H. Zhang Y. Qi H. Zhang Y. Liu Z. (2021). A dual-stage attention-based conv-lstm network for spatio-temporal correlation and multivariate time series prediction. Int. J. Intelligent Syst. doi: 10.1002/int.22370
37
Xu M. Han M. Chen C. L. P. Qiu T. (2020). Recurrent broad learning systems for time series prediction. IEEE Trans. Cybernetics. doi: 10.1109/TCYB.6221036
38
Yan B. Cui Z. Deng G. Li G. Zheng S. He F. et al . (2024). Design and validation of a real-time cassava planter seed quality monitoring system based on optical fiber sensors and rotary encoders. Front. Plant Sci.15, 1481909. doi: 10.3389/fpls.2024.1481909
39
Yang M. Wang J. (2021). Adaptability of financial time series prediction based on bilstm. Int. Conf. Inf. Technol. Quantitative Manage. Available online at: https://www.sciencedirect.com/science/article/pii/S1877050922000035
40
Yin L. Wang L. Li T. Lu S. Tian J. Yin Z. et al . (2023). U-net-lstm: Time series-enhanced lake boundary prediction model. Land. doi: 10.3390/land12101859
41
Yu C. Wang F. Shao Z. Sun T. Wu L. Xu Y. (2023). “Dsformer: A double sampling transformer for multivariate time series long-term prediction,” in International Conference on Information and Knowledge Management.
42
Yu J. Xu X. Duan J. Jiang Y. Yuan H. Liang H. et al . (2025). Effect of operational parameters on droplet deposition characteristics using an unmanned aerial vehicle for banana canopy. Front. Plant Sci.15, 1491397. doi: 10.3389/fpls.2024.1491397
43
Zhang B. Zhang P. Dong X. Zang Y. Wang J. (2024a). “Long-clip: Unlocking the long-text capability of clip,” in European Conference on Computer Vision. 310–325 (Springer). doi: 10.1007/978-3-031-72983-6_18
44
Zhang B. Zhu X. Gao L. Zhang X. Lei Z. (2024b). “Blip-adapter: Bridging vision-language models with adapters for generalizable face anti-spoofing,” in 2024 IEEE International Joint Conference on Biometrics (IJCB). 1–11 (IEEE). Available online at: https://ieeexplore.ieee.org/abstract/document/10744465/
45
Zheng W. Chen G. (2021). An accurate gru-based power time-series prediction approach with selective state updating and stochastic optimization. IEEE Trans. Cybernetics. Available online at: https://ieeexplore.ieee.org/abstract/document/9600449/
46
Zhou H. Zhang S. Peng J. Zhang S. Li J. Xiong H. et al . (2020). Informer: Beyond efficient transformer for long sequence time-series forecasting. AAAI Conf. Artif. Intell. Available at: http://ojs.aaai.org/index.php/AAAI/article/view/17325
Summary
Keywords
precision agriculture, time series prediction, deep learning, resource optimization, spatial-temporal modeling
Citation
He T, Li M and Jin D (2025) Deep learning-based time series prediction for precision field crop protection. Front. Plant Sci. 16:1575796. doi: 10.3389/fpls.2025.1575796
Received
13 February 2025
Accepted
06 May 2025
Published
09 June 2025
Volume
16 - 2025
Edited by
Jun Ni, Nanjing Agricultural University, China
Reviewed by
Prasath N., SRM University, India
Dekera Kwaghtyo, Federal University Lafia, Nigeria
Eliazer M., SRM Institute of Science and Technology, India
Updates
Copyright
© 2025 He, Li and Jin.
This is an open-access article distributed under the terms of the Creative Commons Attribution License (CC BY). The use, distribution or reproduction in other forums is permitted, provided the original author(s) and the copyright owner(s) are credited and that the original publication in this journal is cited, in accordance with accepted academic practice. No use, distribution or reproduction is permitted which does not comply with these terms.
*Correspondence: Meijin Li, jlptr1@163.com
Disclaimer
All claims expressed in this article are solely those of the authors and do not necessarily represent those of their affiliated organizations, or those of the publisher, the editors and the reviewers. Any product that may be evaluated in this article or claim that may be made by its manufacturer is not guaranteed or endorsed by the publisher.