 Haoran Liu1,2,3Weiwei Liu1,2,3Jinzhi Wang1,2,3
 Wei Li1,2,3Jingwen Zhang1,2,3Jian Gong1,2,3
 Lijuan Cui1,2,3*
- 1Key Laboratory of Wetland Conservation and Restoration, Chinese Academy of Forestry, Beijing, China
- 2Institute of Wetland Research, Chinese Academy of Forestry, Beijing, China
- 3Institute of Ecological Protection and Restoration Research, Chinese Academy of Forestry, Beijing, China
Introduction: The Liaohe Estuary, a representative estuarine ecosystem in eastern China, has experienced significant shifts in plant community characteristics due to climate change and anthropogenic influences in recent decades.
Methods: This study employed sediment 210Pb dating, pollen analysis, and environmental factor indicators to comprehensively assess the composition, trends, and drivers of plant communities in the Liaohe Estuary from 1944 to 2022.
Results: The findings revealed that herbaceous plants dominated the estuary's vegetation under a cool and humid climate, though humidity exhibited a declining trend over time. Between 2001 and 2022, pollen concentration and herbaceous plant prevalence increased significantly. Key environmental drivers—mean annual temperature (MAT), salinity, grain size, pH, and agricultural production—were strongly correlated (p < 0.001) with plant community dynamics. Natural factors (grain size, salinity) enhanced the dominance of key species but reduced overall pollen concentration. Conversely, agricultural activities diminished dominant species proportions while increasing pollen concentration.
Discussion: These results highlight the dual influence of climatic and anthropogenic factors on estuarine vegetation. The study provides a theoretical basis for restoring degraded estuarine ecosystems.
1 Introduction
The Liaohe Estuary, a vital coastal ecosystem in northern China, is one of the most representative estuary in high-latitude regions (Jiang et al., 2015). Its unique geographical environment and complex ecological processes play a crucial role in preserving regional biodiversity and maintaining ecological balance. Furthermore, it serves as a valuable indicator of the impacts of climate change and land-use changes driven by human activities (Xiong et al., 2023). However, estuarine ecosystems are among the most fragile ecosystems globally, highly sensitive to external disturbances and vulnerable to the combined effects of from physical, chemical, and biological processes. In recent years, global climate change and human activities have led to a 14.8% reduction in the Liaohe Estuary area, accelerating the succession of plant communities. These changes have significantly altered the structure and function of plant communities in the area, posing serious threats to biodiversity conservation and the preservation of wildlife habitats (Xie et al., 2018; Peng et al., 2021; Cui et al., 2022). Therefore, it is necessary to study the succession characteristics of plant communities in the Liaohe Estuary to support its sustainable development.
Estuarine plant communities play a vital role in supporting biodiversity. Exploring their characteristics is of significant value for understanding estuarine ecosystem functions, maintaining biodiversity, and responding to environmental changes (Zuo et al., 2012). Research on estuarine plant communities primarily utilizes modern vegetation diversity indicators, such as species richness, evenness, and coverage, to analyze the response factors of plant communities and study plant community succession based on long-term trends in plant diversity. Radiometric dating can provide precise chronological sequences, offering a high-resolution temporal framework for studying long-term trends in plant community changes (Appleby and Oldfield, 1978). However, there is a notable lack of comprehensive studies examining the characteristics, changes, and driving factors of plant communities over long-term scales using radiometric dating (Sun et al., 2020; Lane et al., 2024). Estuarine plant communities are constrained by various environmental factors, with climate change—particularly fluctuations in temperature and precipitation—significantly influencing their structure and distribution. Changes in precipitation, for example, alter freshwater flow, indirectly impacting soil salinity in estuary (Lorenz et al., 2021; Feng and Chen, 2023; Byrne et al., 2023). This, in turn, affects species composition, as well as the speed and direction of plant community succession (Byrne et al., 2001; Duarte et al., 2013). Human activities, such as agricultural production, directly damage estuarine plants and soils, leading to changes in plant species composition (Zheng et al., 2004; Deng et al., 2006; Abrahim et al., 2013). Furthermore, abiotic factors such as salinity, pH, and grain size are widely recognized as key determinants of the distribution patterns of dominant plants in estuaries (Fenu et al., 2012; Meixler et al., 2018; Pratolongo et al., 2019; Borde et al., 2020). Therefore, changes in both the natural environment and human activities have impacts on plant communities. In exploring the succession of plant communities, it is essential to thoroughly analyze the combined effects of environmental factors and human activities on the structure and function of plant communities. This will help to comprehensively understand the driving mechanisms of plant community succession.
Pollen analysis, as a valuable tool for investigating historical ecological characteristics, offers critical insights into past vegetation composition, coverage, and environmental changes. It plays a key role in understanding historical dynamics of plant communities (Xiao et al., 2008; Wang, 2009; Li and Zhao, 2018). However, the application of paleoenvironmental methods, such as pollen analysis and 210Pb dating, to modern ecological research on estuarine systems, particularly in the unique context of the Liaohe Estuary, has not been previously explored. In this study, a sediment core was collected from the tidal flats of the Liaohe Estuary, pollen analysis and 210Pb dating were systematically integrated to establish a chronological framework for plant communities in this region. Based on pollen assemblages and concentrations, the composition and trends of plant communities in the Liaohe Estuary were comprehensively analyzed. By incorporating multiple environmental indicators, including mean annual temperature (MAT), mean annual precipitation (MAP), soil salinity, grain size and agricultural production, this study not only elucidated the combined impacts of climate change and human activities on plant community changes but also provided a scientific basis for vegetation restoration and ecological reconstruction of degraded estuarine ecosystems. This research fills a critical gap in the study of plant community dynamics in the Liaohe Estuary, offering significant insights into the evolution and driving mechanisms of its ecosystem over recent decades, as well as practical guidance for sustainable development strategies in the region.
2 Materials and methods
2.1 Sampling location and core collection
The Liaohe Estuary (40°45′—41°05′ N, 121°28′—121°58′ E) is located at the mouth of the Liaohe River in Panjin, Liaoning Province, China. It is the largest reed coastal wetland reserve in China, as well as the second-largest reed-producing area in the world, covering approximately 2.23×10⁵ hm² (Ma et al., 2017). The region has a temperate semi-humid monsoon climate with distinct seasons and concurrent heat and rain. The average annual temperature is 8.3 °C–8.4 °C, with the lowest temperature in January reaching –29.2 °C and the highest temperature in July reaching 35.2 °C. The frost-free period lasts an average of 171 days, and the average annual precipitation is 631 mm, mainly in the period from July to September. The dominant species in the study area are Spartina alterniflora, Scirpus triqueter, and Suaeda salsa.
Core Liaohekou (LHK, 40°57′26″ N, 121°48′00″ E) was collected from the Liaohe estuary National Nature Reserve in Panjin, Liaoning Province, in May 2023. The core has a total length of 154 cm (Figure 1). The LHK site was located within the intertidal mudflat dominated by S. alterniflora and S. triqueter. Samples were collected using an electroacoustic sediment sampler (diameter: 90 mm). Immediately after collection, the samples were sectioned into 2 cm intervals, preserved in an incubator, and stored at 4 °C in the refrigerator upon transport to the laboratory. A total of 77 samples were collected.
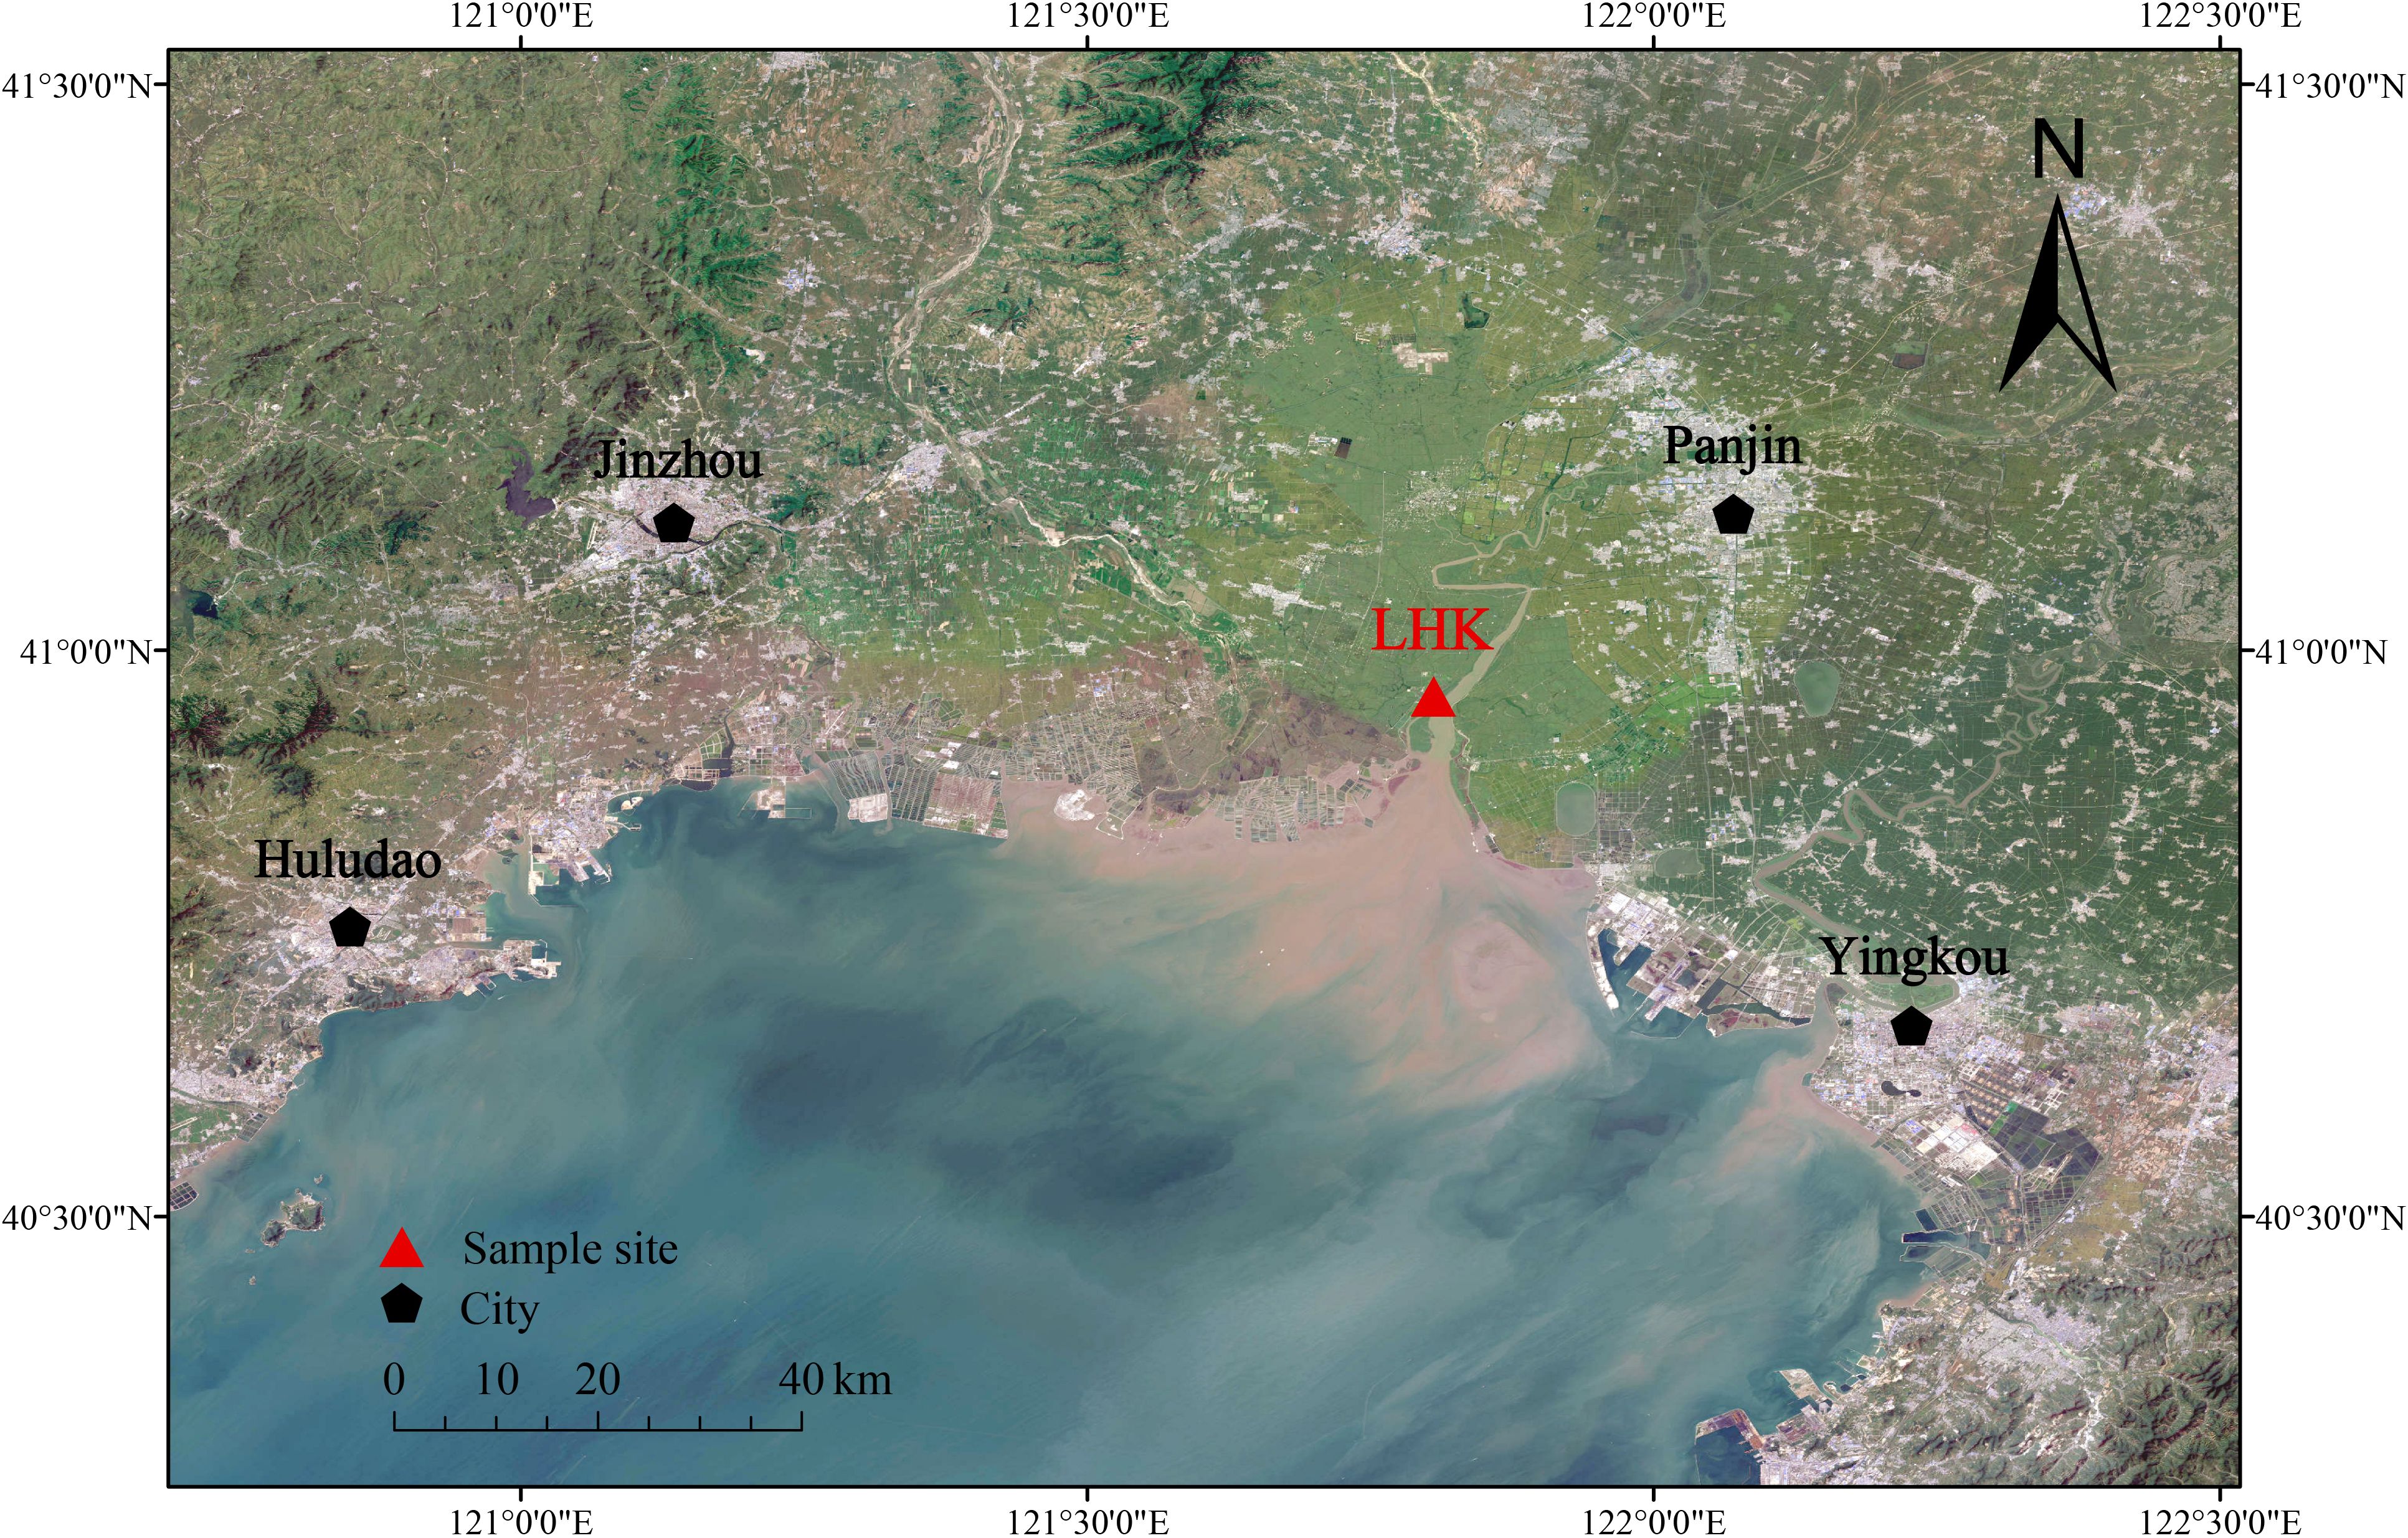
Figure 1. Location map of core LHK in Liaohe Estuary.
2.2 Chronometry
The 210Pb dating method is a technique used to determine the age of recent sediments based on the radioactive decay properties of 210Pb (Goldberg, 1963). The chronological framework of the sediment core soil profile was established through 210Pb dating analysis. For the 77 sediment samples obtained, 7–8 g of each soil sample was freeze-dried. Subsequently, 210Pb specific activity was measured using a gamma spectrometry system comprising a high-purity germanium well detector (Ortec HPGe GWL-120-15) manufactured by EG & G Ortec, an Ortec-919 quadruple spectrometer controller, and an IBM computer with a 16 K multichannel analyzer, 210Pb activity was measured at 46.5 keV. Once radioactive equilibrium was achieved, the isotope 214Pb of 210Pb after reaching radiation equilibrium was measured at 352 keV using gamma rays. Standard 210Pb samples provided by the University of Liverpool were used for calibration, with a measurement error of less than 10%.
2.3 Pollen analysis
Pollen analysis is a technique first proposed by von Post in 1916, which reconstructs paleovegetation, paleoclimate, and paleoenvironments by studying pollen and spores in sediments (von Post, 1916). The 77 sediment samples were consolidated by combining every two consecutive layers, resulting in a total of 39 sediment samples (with the final layer, 152–154 cm, treated as a single sample). Approximately 5 g of fresh soil was collected from each sample for pollen concentration measurement and identification. For each sample, at least 300 pollen grains were analyzed, with an average of 366 grains per sample. The identification process relies on key reference materials, including the pollen images and morphological descriptions in books such as Pollen Morphology of Chinese Plants (Wang et al., 1995). Modern pollen databases from Sun Yat-sen University and international cooperative laboratories were also utilized, supplemented by slide-based microscopic morphological comparison analyses. Pollen analysis of the sediment profile was performed using CONISS cluster analysis, dividing the profile into four distinct pollen zones. This classification was based on the sum of squared differences and similarity indices calculated between samples.
Pollen concentration represents the number of pollen per unit volume or sample weight (Nalepka and Walanus, 2003). It is calculated by counting the total number of pollen in the sample and measuring the sample weight. The formula is as follows:
where: X represents the pollen concentration (grains/g); N represents the number of marker pollen added to the sample; N’ represents the number of marker pollen counted under the microscope; n represents the total number of pollen counted under the microscope; G represents the weight of the sample used for analysis.
2.4 Determination of soil physicochemical properties
Similar to the pollen analysis, 39 sediment samples were collected for measurements of soil grain size, salinity, and pH. Soil grain size was determined using laser diffraction technology. Organic matter was removed using H2O2, carbonates were eliminated with 10% hydrochloric acid, and dispersion was achieved with sodium hexametaphosphate (NaPO3)6. Soil grain size was then determined using a Mastersize 2000 laser particle size analyzer (Malvern Instruments, UK). Soil salinity was measured using the conductivity method, with a DJS-1C conductivity meter, and conductivity of the DDSJ-30–8 sediment extract was calculated (Ryan et al., 1996). Soil pH was determined using the pH electrode method, where a pH meter was used to measure the pH of the extract from a soil-water mixture (ratio of 5:1) obtained from the sediment samples.
2.5 Climate and agricultural production data
Based on the 1 km resolution monthly temperature and precipitation dataset from the National Tibetan Plateau Scientific Data Center, the mean annual temperature (MAT) and mean annual precipitation (MAP) for Panjin City, Liaoning Province, from 1944 to 2022 were calculated, yielding the MAT and MAP data (Peng, 2019, 2020). The agricultural production data for Panjin City, Liaoning Province, are numerical data. The data from 1990 to 2018 were obtained from the National Bureau of Statistics, while data from 2019 to 2022 were retrieved from the Panjin Statistical Yearbook. Missing agricultural production data for the period of 1944 to 1989 were estimated using the agricultural production growth rate provided in the Panjin Statistical Yearbook.
2.6 Data analysis
Prior to statistical analysis, all raw data were organized and preprocessed using Microsoft Excel 2019 (Held et al., 2019). Tilia software was used to explore the changes in pollen percentages at different soil depths, while Origin 2021 was employed to investigate the variations in the percentages of pollen taxa and pollen concentration with soil depth (Grimm, 1990; Moberly et al., 2018). Principal component analysis (PCA) of the most dominant seven pollen taxa was conducted using Origin 2021 to explore the distribution characteristics of the most dominant seven pollen taxa. Redundancy analysis (RDA) of the most dominant seven pollen taxa, pollen concentration, and environmental factors was performed using R 4.3.3 to examine the influence of environmental factors on the most dominant seven pollen taxa and pollen concentration (R Core Team, 2024). The rdacca.hp package was utilized to extract the explanatory power of each environmental factor, aiming to assess the contribution of each environmental factor to the most dominant seven pollen taxa and pollen concentration (Cheng et al., 2023). Additionally, based on the random forest model, R 4.3.3 was used to analyze the contribution of principal components of the most dominant seven pollen taxa, pollen concentration, and environmental factors, which was cross-validated with the RDA results to confirm the contributions of environmental factors to the most dominant seven pollen taxa and pollen concentration. Mapping was accomplished using Tilia, Origin 2021, R 4.3.3, and ArcMap 10.7 (Johnston et al., 2001).
3 Results
3.1 Pollen composition characteristics
Since it is challenging to identify some pollen from the family to the genus level (e.g., Poaceae), certain pollen grains were identified to the genus level (e.g., Pinus), while others were identified to the family level. A total of 14289 pollen grains were identified from core LHK, belonging to 68 categories at the family and genus levels. The sediment profile contained the following pollen taxa: 25 taxa of herbaceous pollen, 33 taxa of woody pollen, 7 taxa of fern spores, and 3 taxa of algal spores. Among these, three aquatic pollen taxa of were identified: Cyperaceae, Typha, and Myriophyllum, while the remaining 65 types were terrestrial. Herbaceous pollen was predominantly represented by Artemisia, Asteraceae-Aster, Asteraceae, and Poaceae, followed by Cyperaceae and Typha, with occasional occurrences of Elaeagnaceae, Ephedra, Nitraria, Polygalaceae, Polygonum, Ranunculaceae, and Umbelliferae. Woody pollen mainly included Pinus, Betula, deciduous Quercus, Salix, Ulmus, and evergreen Quercus. Fern spores were primarily represented by Pteris, as well as monolete and trilete spores. Algal spores were relatively sparse, including Concentricystis, Pediastrum, and Dinoflagellate. Based on the average percentage of each pollen taxan in the entire sediment profile, herbaceous pollen dominated with 87.6% of the total pollen, followed by woody pollen (9.6%), fern spores (2.1%), and algae spores (0.7%), with the latter representing a relatively small proportion (Figures 2, 3).
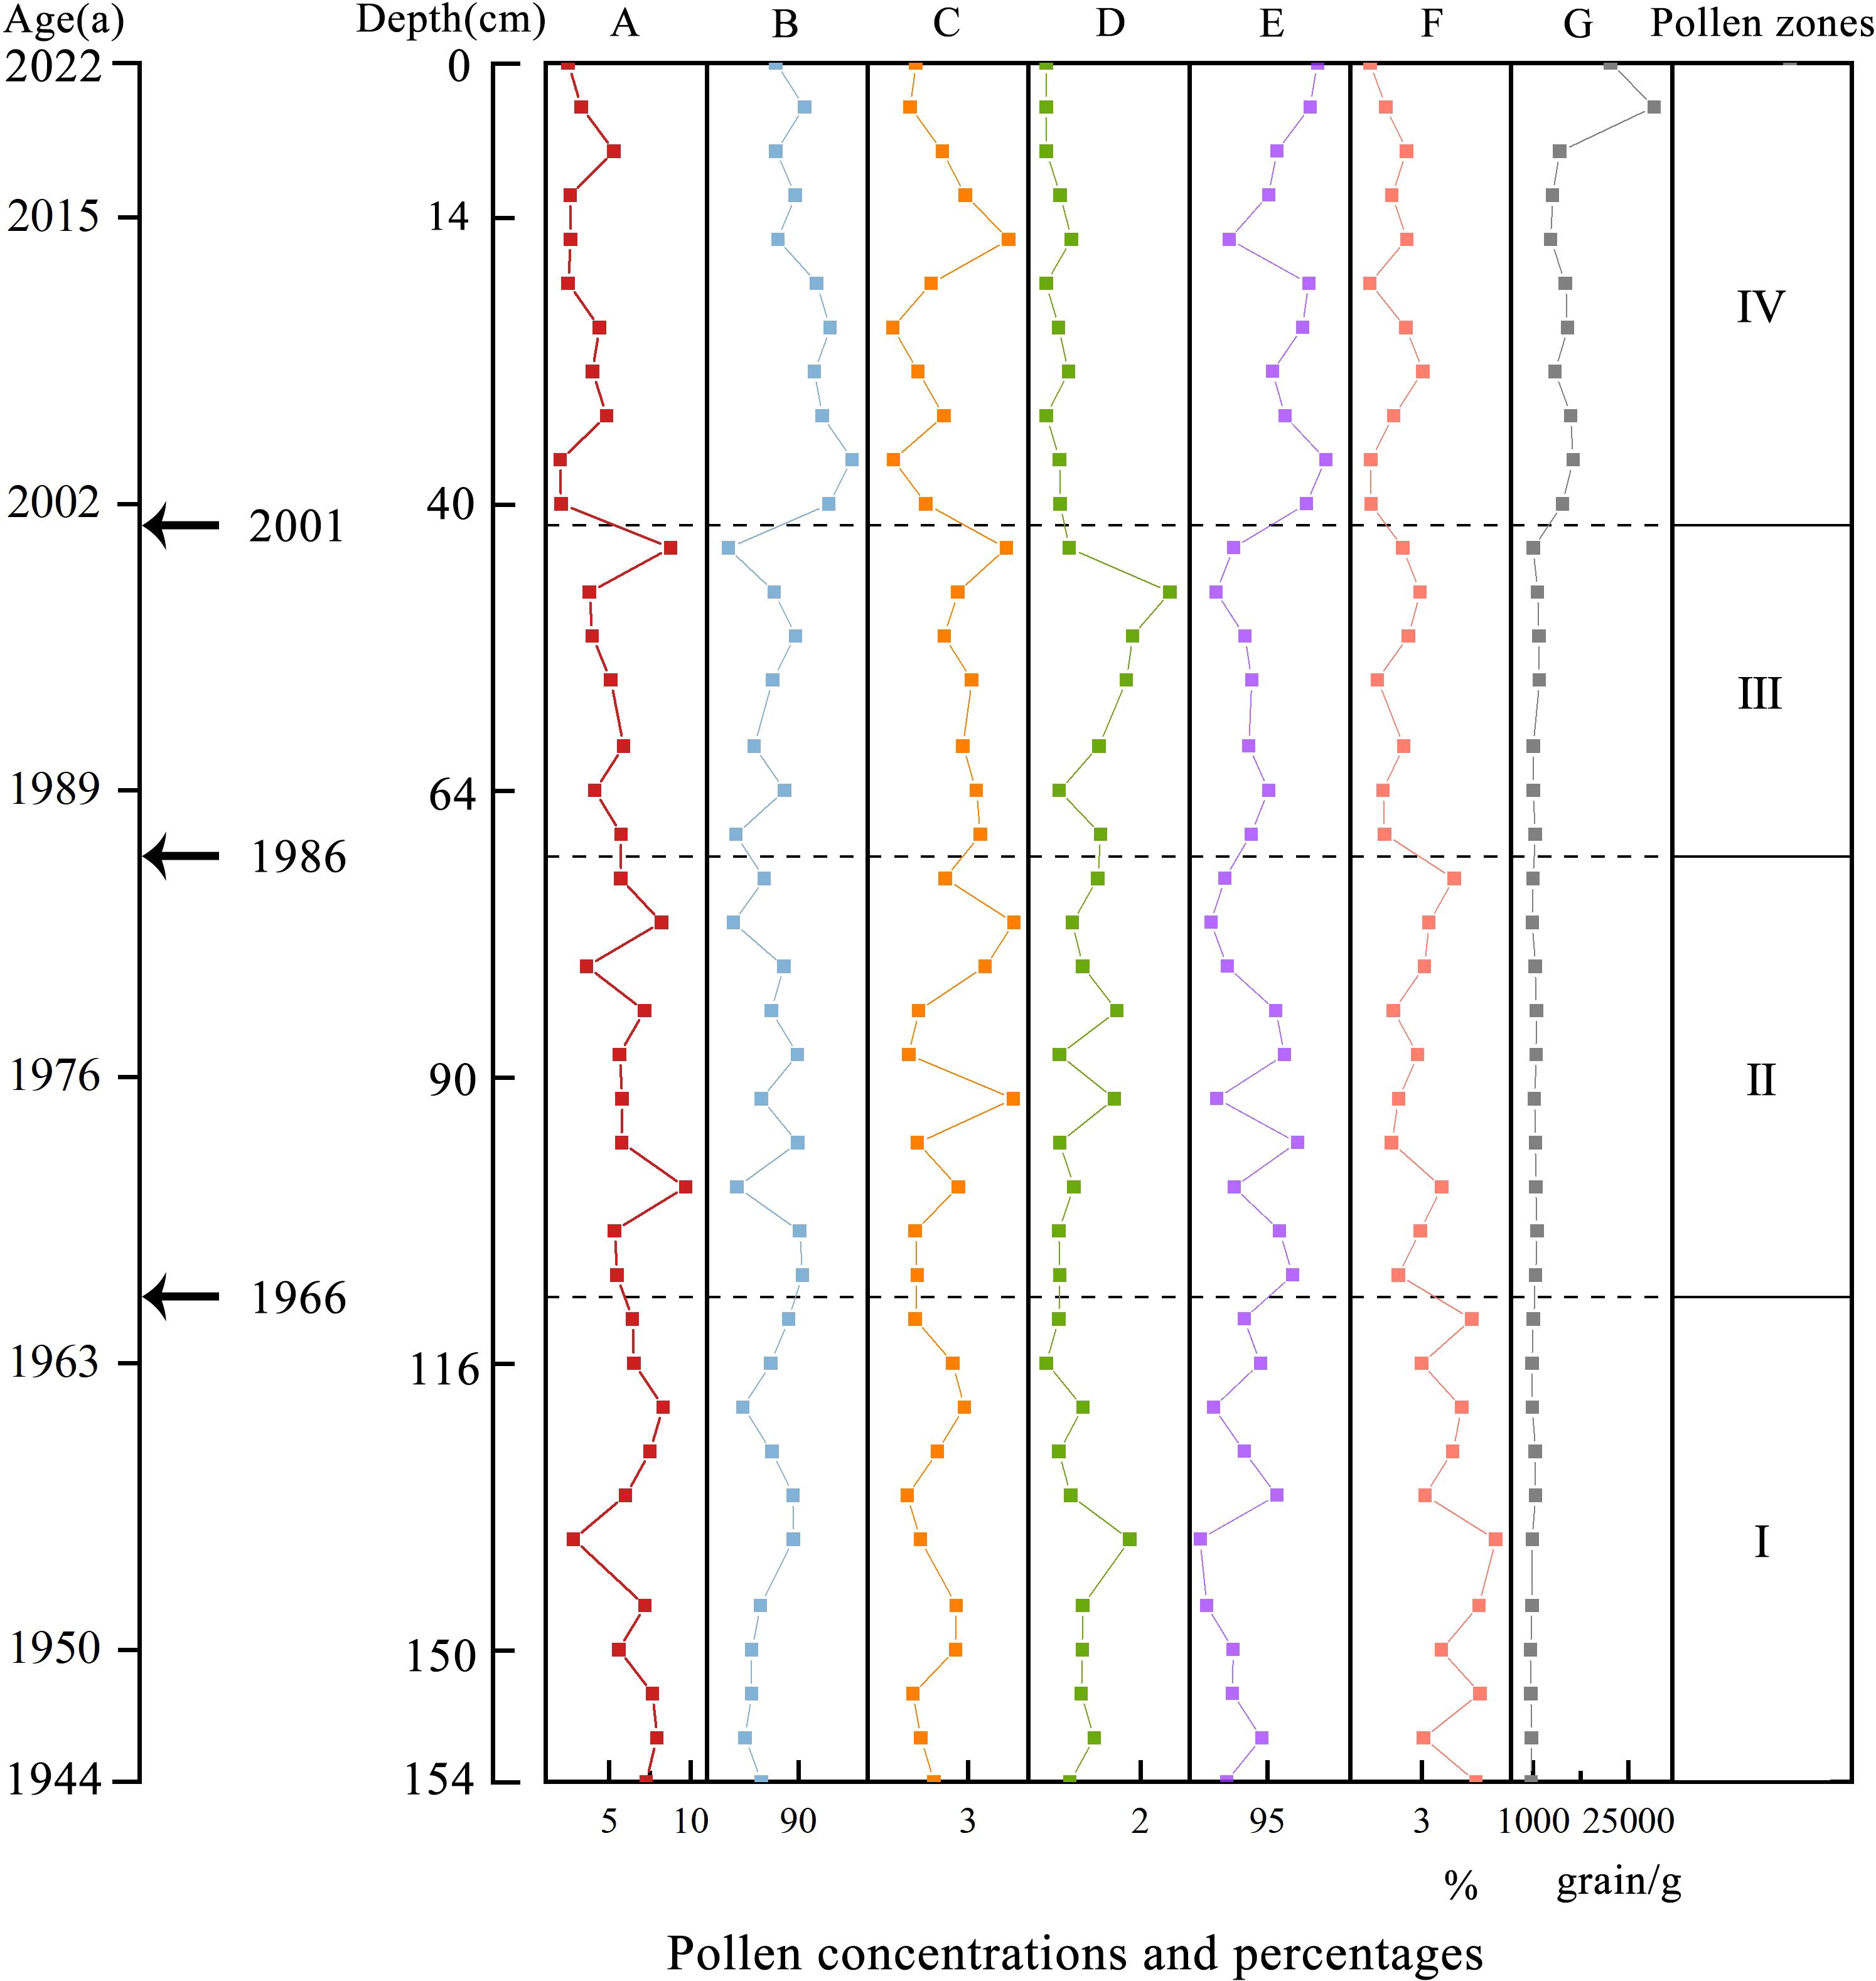
Figure 2. Integrated column of pollen concentrations and percentages from core LHK in Liaohe Estuary Wetland. (A) Woody pollen; (B) Herbaceous pollen; (C) Fern spores; (D) Algae spores; (E) Terestrial pollen; (F) Aquatic pollen; (G) Pollen concentration.
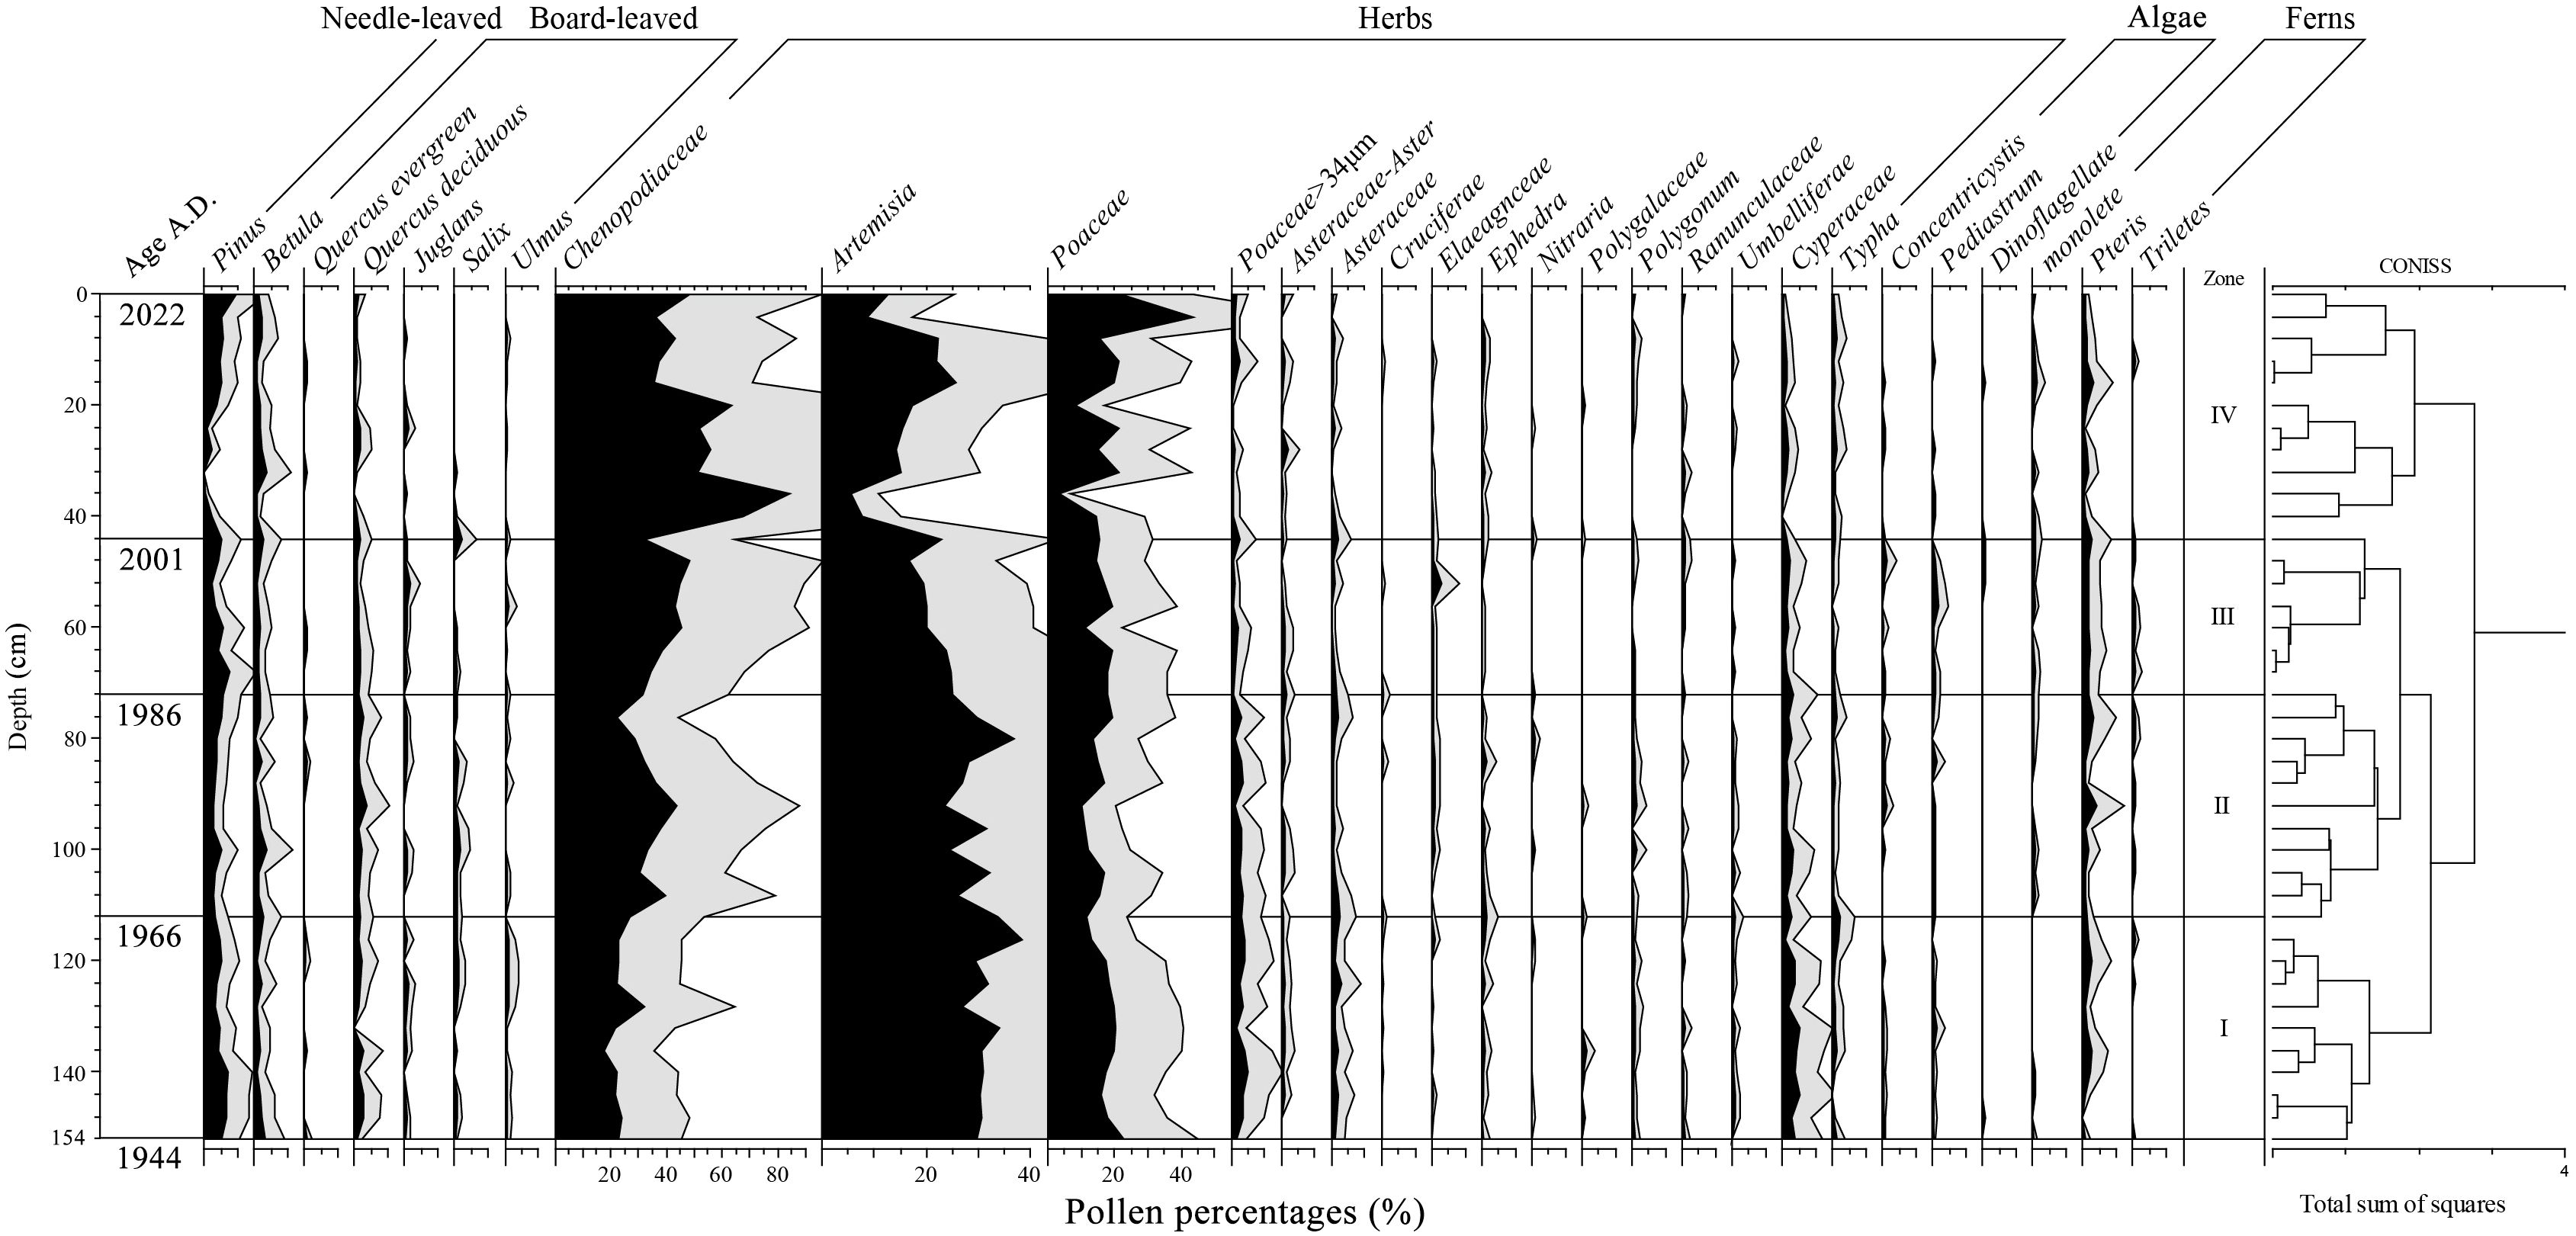
Figure 3. Variations of the pollen assemblages (%) along the core LHK.
3.2 Pollen zone characteristics and differences among pollen zones
The differences in pollen composition between adjacent samples were compared for all identified herbaceous and woody pollen, fern and algal spores, and the results were divided into four pollen zones, each characterized by unique pollen assemblage characteristics. In addition, an analysis was conducted based on the percentage of pollen taxa in each pollen zone (Figure 3).
Zone I: Artemisia-Betula-Poaceae-Pinus (112–156 cm)
The total pollen concentration was low, with an average of 883 grains g-1 (Figure 2). The pollen was mainly herbaceous pollen (82.9%–89.3%, average 85.9%), followed by woody pollen (7.6%–14.6%, average 11.7%). Fern spores (1.07%–2.86%, average 1.74%) and algae spores (0%–1.8%, average 0.7%) had lower pollen shares (Figure 2). Herbaceous pollen was dominated by Artemisia (32.2%), Chenopodiaceae (23.9%), and Poaceae (21.6%), with other terrestrial pollen such as cold-wet-loving Asteraceae (1.7%) and aquatic pollen such as Cyperaceae (3.6%) and Typha (1.0%). The most common woody pollen was Pinus (5.2%), followed by Betula (1.8%), deciduous Quercus (1.7%), Ulmus (0.7%), Salix (0.5%), and Juglans. Fern spores mainly included the moisture-loving Pteris (1.4%), as well as trilete and monolete spores, while algae spores included Pediastrum and Concentricystis.
Zone II: Chenopodiaceae-Artemisia-Poaceae (72–112 cm)
The total pollen concentration was clearly higher than that of the Zone I, with an average concentration of 1567 grains g-1 (Figure 2). It was still dominated by herbaceous pollen (81.6%–90.5%, average 87.0%), followed by woody pollen (7.5%–13.2%, average 10.0%), with sporadic occurrences of fern spores (0.9%–4.7%, average 2.3%) and algae spores (0.3%–1.5%, average 0.7%) in this zone (Figure 2). Among the herbaceous pollen, compared to Zone I, Chenopodiaceae (34.6%) showed a significant increase in proportion, whereas the proportions of Artemisia (29.2%) and Poaceae (18.0%) slightly decreased, and Cyperaceae (2.2%), Asteraceae (1.2%), and Typha (0.7%) were present. The proportions of aquatic pollen, such as Cyperaceae and Typha, decreased comparing to Zone I. The woody pollen was still dominated by Pinus (3.9%), followed by deciduous Quercus (2.0%), Betula (1.7%), Salix (0.7%), and Juglans (0.4%). Fern spores were still mainly Pteris (1.7%), followed by monolete and trilete spores. Algae spores included small concentrations of Pediastrum and Concentricystis.
Zone III: Chenopodiaceae-Artemisia-Poaceae-Pinus (44–72 cm)
The pollen concentration was similar to that of the Zone II, at 1738 grains g-1 (Figure 2). This zone was again dominated by herbaceous pollen (81.0%–89.6%, average 85.5%), followed by woody pollen (6.4%–14.1%, average 10.1%). Fern spores (2.1%–4.4%, average 3.1%) and algae spores (0.3%–2.6%, average 1.3%) were still scarce (Figure 2). Among the herbaceous pollen, compared to Zone II, Chenopodiaceae (42.8%) increased and became the most dominant, followed by Artemisia (22.1%) and Poaceae (18.6%), with lower abundances of Cyperaceae (1.6%), Asteraceae (0.9%), and Asteraceae-Aster (0.6%), etc. While the proportion of aquatic pollen decreased further compared with Zone II. The woody pollen was dominated by Pinus (4.9%), followed by Betula (1.6%), deciduous Quercus (1.4%), Sporadic Juglans (0.6%), and Salix (0.5%). Fern spores mainly included Pteris (2.1%) and monoletes (0.6%), and algae spores mainly included Pediastrum (0.8%), with an increased pollen percentage compared to Zone II.
Zone IV: Chenopodiaceae-Poaceae-Artemisia (0–44 cm)
The pollen concentration clearly increased compared to that in the Zone III, being the highest in the entire profile at 11504 grains g-1 (Figure 2). The zone was dominated by herbaceous pollen (87.1%–94.0%, average 91.3%), relative to Zone III, with a significant increase in percentage, accounting for the highest proportion in the entire profile (Figure 2). We also observed a significant decrease in woody pollen (2.6%–11.8%, average 6.9%), which increased with Zone III. Fern spores (0.3%–4.5%, average 1.7%) and algae spores (0%–0.5%, average 0.2%) were clearly decreased compared to Zone III. Among the herbaceous pollen, Chenopodiaceae (53.1%) continued to increase compared to Pollen Zone III, dominating the assemblage, followed by Poaceae (20.2%), while Artemisia (15.4%) clearly decreased. Cyperaceae (0.9%) and Typha (0.8%) were also present. Woody pollen was dominated by Pinus (3.7%), followed by Betula (1.7%), while deciduous Quercus (0.7%) was the main deciduous pollen with decreased percentage compared to Zone III. Fern spores mainly included Pteris (1.6%), with a significant decrease in proportion compared with Zone III, whereas algae spores were almost absent.
The percentage of Chenopodiaceae in the Liaohe Estuary varied clearly across different pollen zones, increasing by 29.2% from pollen zone I to pollen zone IV, while the percentage of Artemisia decreased by 16.8%. Specifically, Artemisia was most prevalent in pollen zone I, whereas Chenopodiaceae became dominant in pollen zones II to IV. According to the 210Pb dating analysis, core LHK showed sedimentation spanning from 1944 to 2022. Between 2001 and 2022, pollen concentration increased clearly (by a factor of 6.7 compared to the previous pollen zone), with the percentage of herbaceous pollen increasing by 6.8%, while the percentages of woody pollen, fern spores, and algae spores decreased. Additionally, over time, the percentage of terrestrial pollen increased by 3.4%, while that of aquatic pollen decreased (Figure 2).
3.3 PCA of main the most dominant seven pollen taxa
Among the pollen taxa shown in Figure 3, the most dominant seven pollen taxa, namely Pinus, Betula, Chenopodiaceae, Artemisia, Poaceae, Cyperaceae, and Pteris, each account for more than 1.5% of the total pollen in each pollen zone. PCA was conducted on the most dominant seven pollen taxa. The results showed that the first two axes could explain 58.0% of the variations in main pollen percentage, with the first principal component accounting for 41.2%, which was noticeably higher than the second principal component of 16.8% (Figure 4). On the first principal component axis, Betula, Pinus, Poaceae, Cyperaceae, Artemisia, and Pteris showed a positive correlation, whereas Chenopodiaceae showed a negative correlation. This indicates that except for Chenopodiaceae, the other main pollen taxa have similar characteristics.
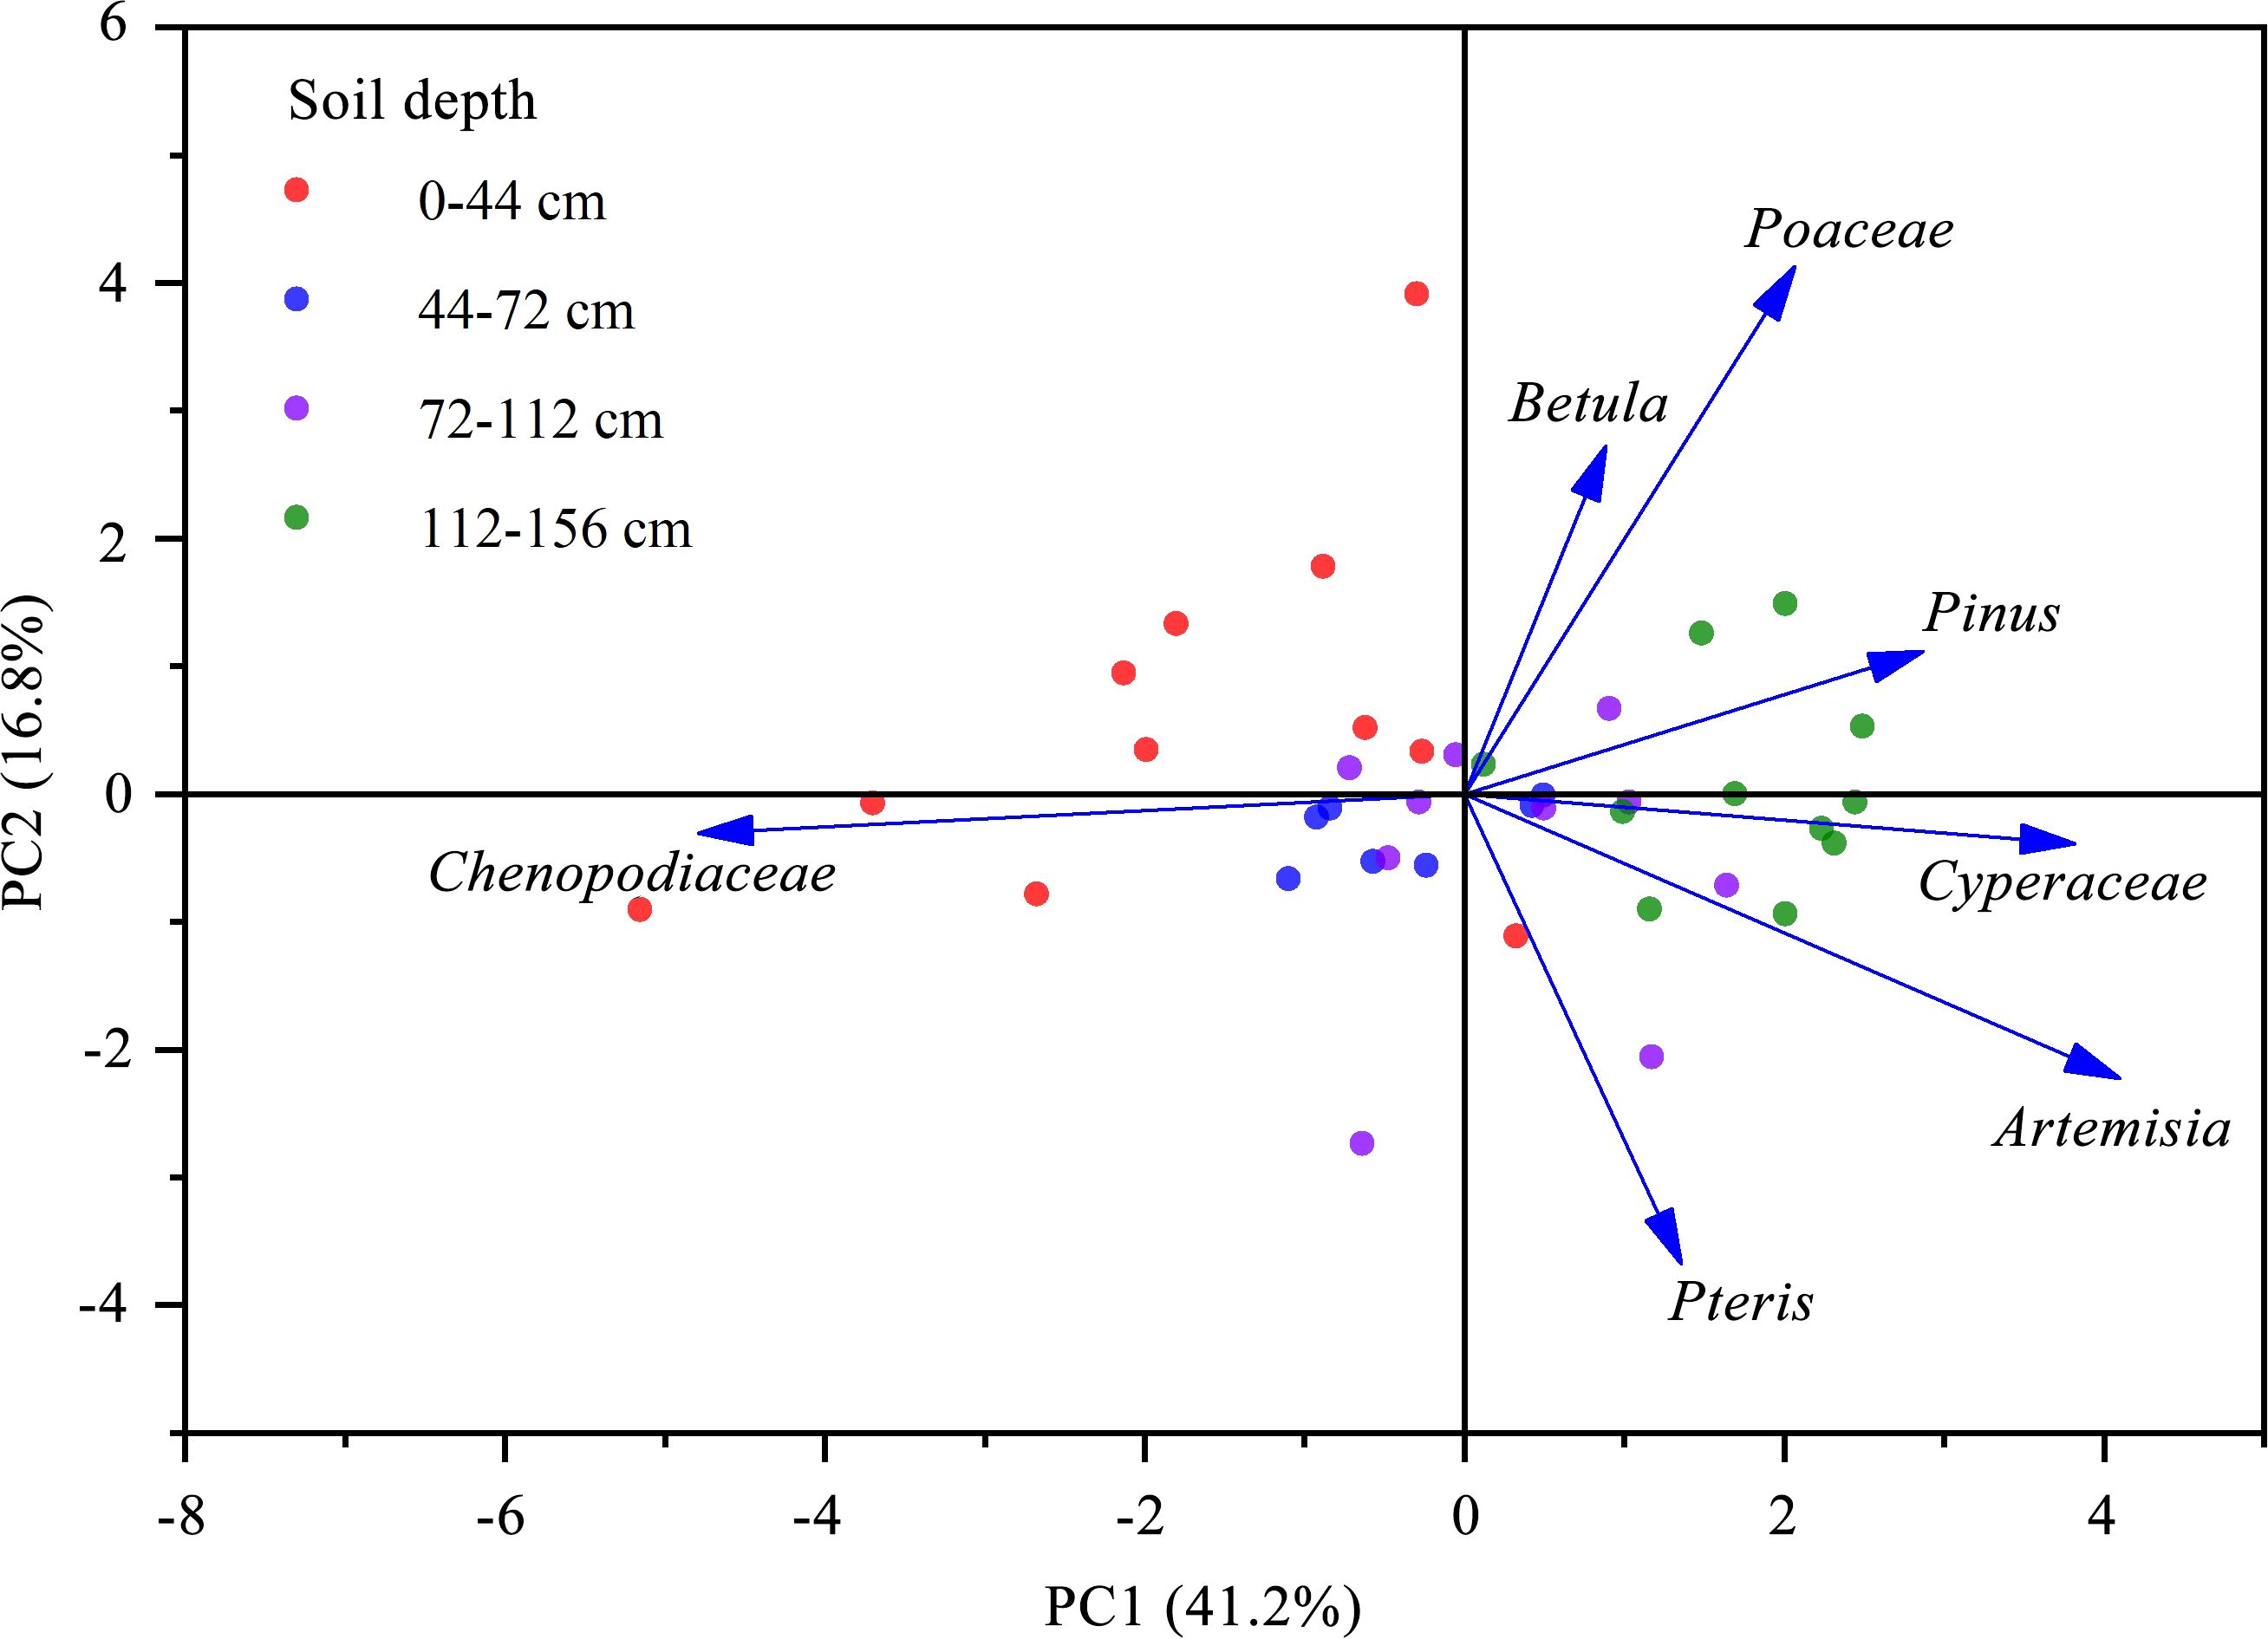
Figure 4. Principal component analysis of the most dominant seven pollen taxa.
3.4 Correlation analysis of pollen and environmental factors
Between 2001 and 2022, with the increase in MAT (Mean Annual Temperature), the percentages and concentrations of herbaceous pollen significantly increased, while those of woody plants, ferns, and algae showed a notable decrease (Supplementary Figure S1). To further analyze the relationship between environmental factors and the most dominant seven pollen taxa as well as pollen concentration, climate factors (MAT and MAP), soil factors (salinity, grain size, and pH), and human activity factors (agricultural production) were selected for correlation analysis with the percentages of the most dominant seven pollen taxa and pollen concentration (Figure 5). Through Detrended Correspondence Analysis (DCA), the sum of the first four axis eigenvalues was 0.19 (< 3), indicating that a linear model RDA was appropriate to explain the impact of environmental factors on the most dominant seven pollen taxa and pollen concentration. The results showed that the environmental factors explained 67.4% of the variation in the community of the most dominant seven pollen taxa, with the first axis explaining 73.6% and the second axis explaining 2.0%. Grain size (30.8%, p< 0.001), agricultural production (29.7%, p< 0.001), MAT (11.4%, p< 0.001), salinity (21.2%, p< 0.001) and pH (6.9%, p< 0.001) significantly explained these differences (Table 1). In the different sediment layers, MAT and agricultural production had a notable impact on the 0–44 cm sediment layer.
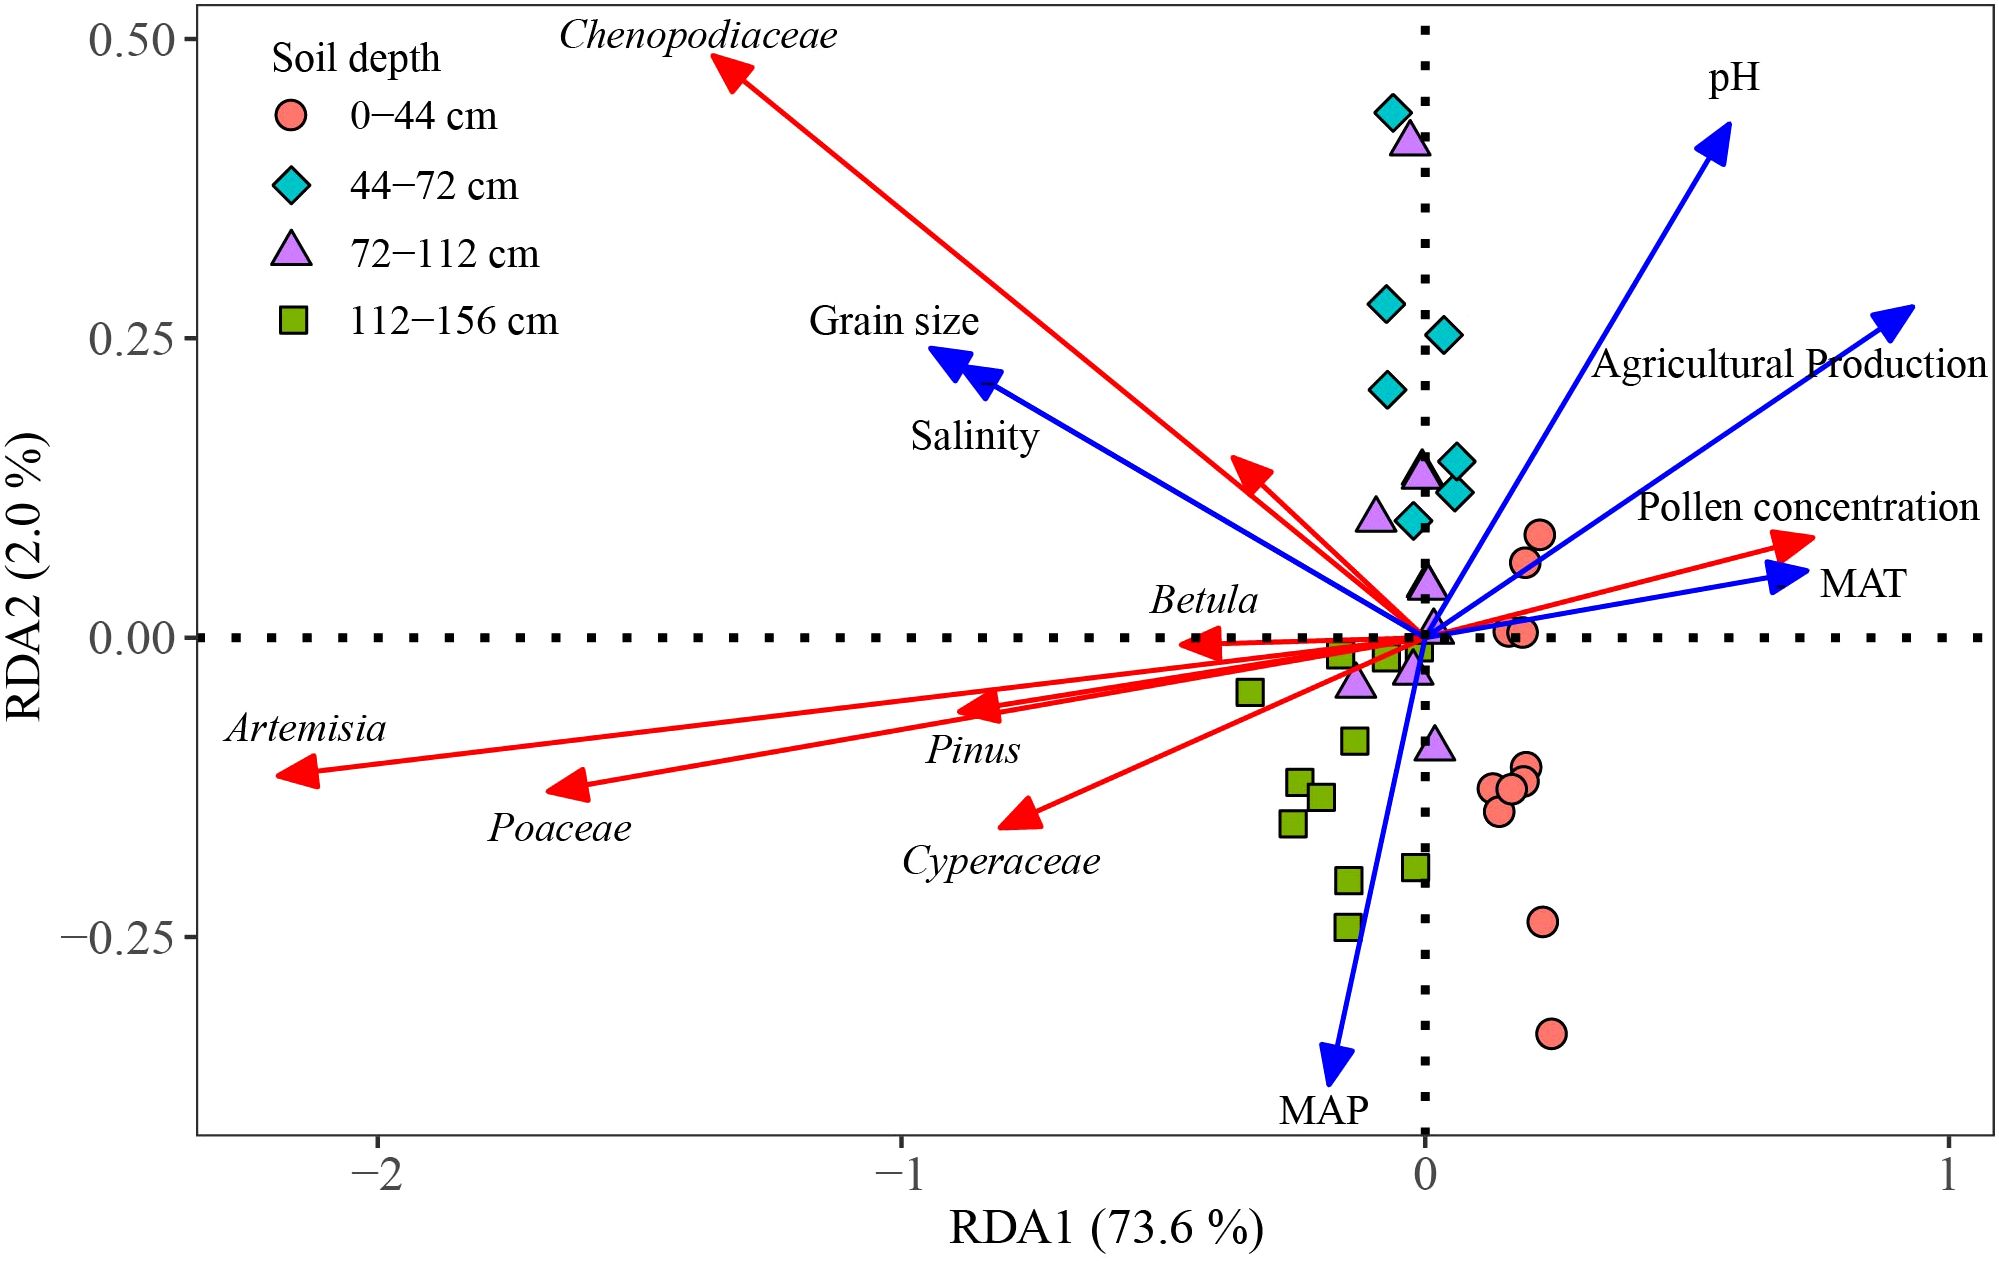
Figure 5. Redundancy analysis of the most dominant seven pollen taxa and environmental variables. MAT, Mean Annual Temperature; MAP, Mean Annual Precipitation.
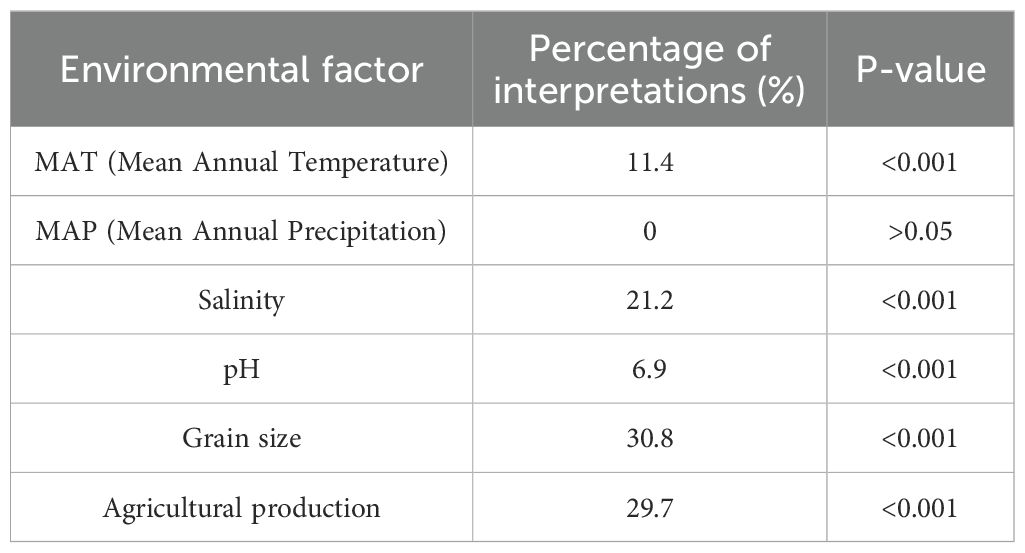
Table 1. Results of redundancy analysis interpreting the percentage of the most dominant seven pollen taxa by environmental factors.
Based on the aforementioned PCA results, the first two principal components (PC1 and PC2) of the most dominant seven pollen taxa were extracted. Combined with pollen concentration, the random forest model was used to explore the contribution of environmental factors to the principal components of the most dominant seven pollen taxa and pollen concentration. The results showed that pH, salinity, Grain size, Agricultural production, and MAT ranked at the top in terms of their contributions to PC1, PC2, and pollen concentration, while MAP had a lower contribution (Figure 6). pH, Grain size, and Agricultural production had extremely significant contributions to PC1 (p< 0.01), and salinity had a significant contribution to PC1 (p< 0.05). The contribution ranking was pH > Grain size > Agricultural production > Salinity > MAT > MAP. Grain size had a significant contribution to PC2 (p< 0.05). The contribution ranking was Grain size > Agricultural production > MAT > pH > Salinity > MAP. Salinity had an extremely significant contribution to pollen concentration (p< 0.01), and Grain size had a significant contribution to pollen concentration (p< 0.05). The contribution ranking was Salinity > Grain size > Agricultural production > pH > MAT > MAP.
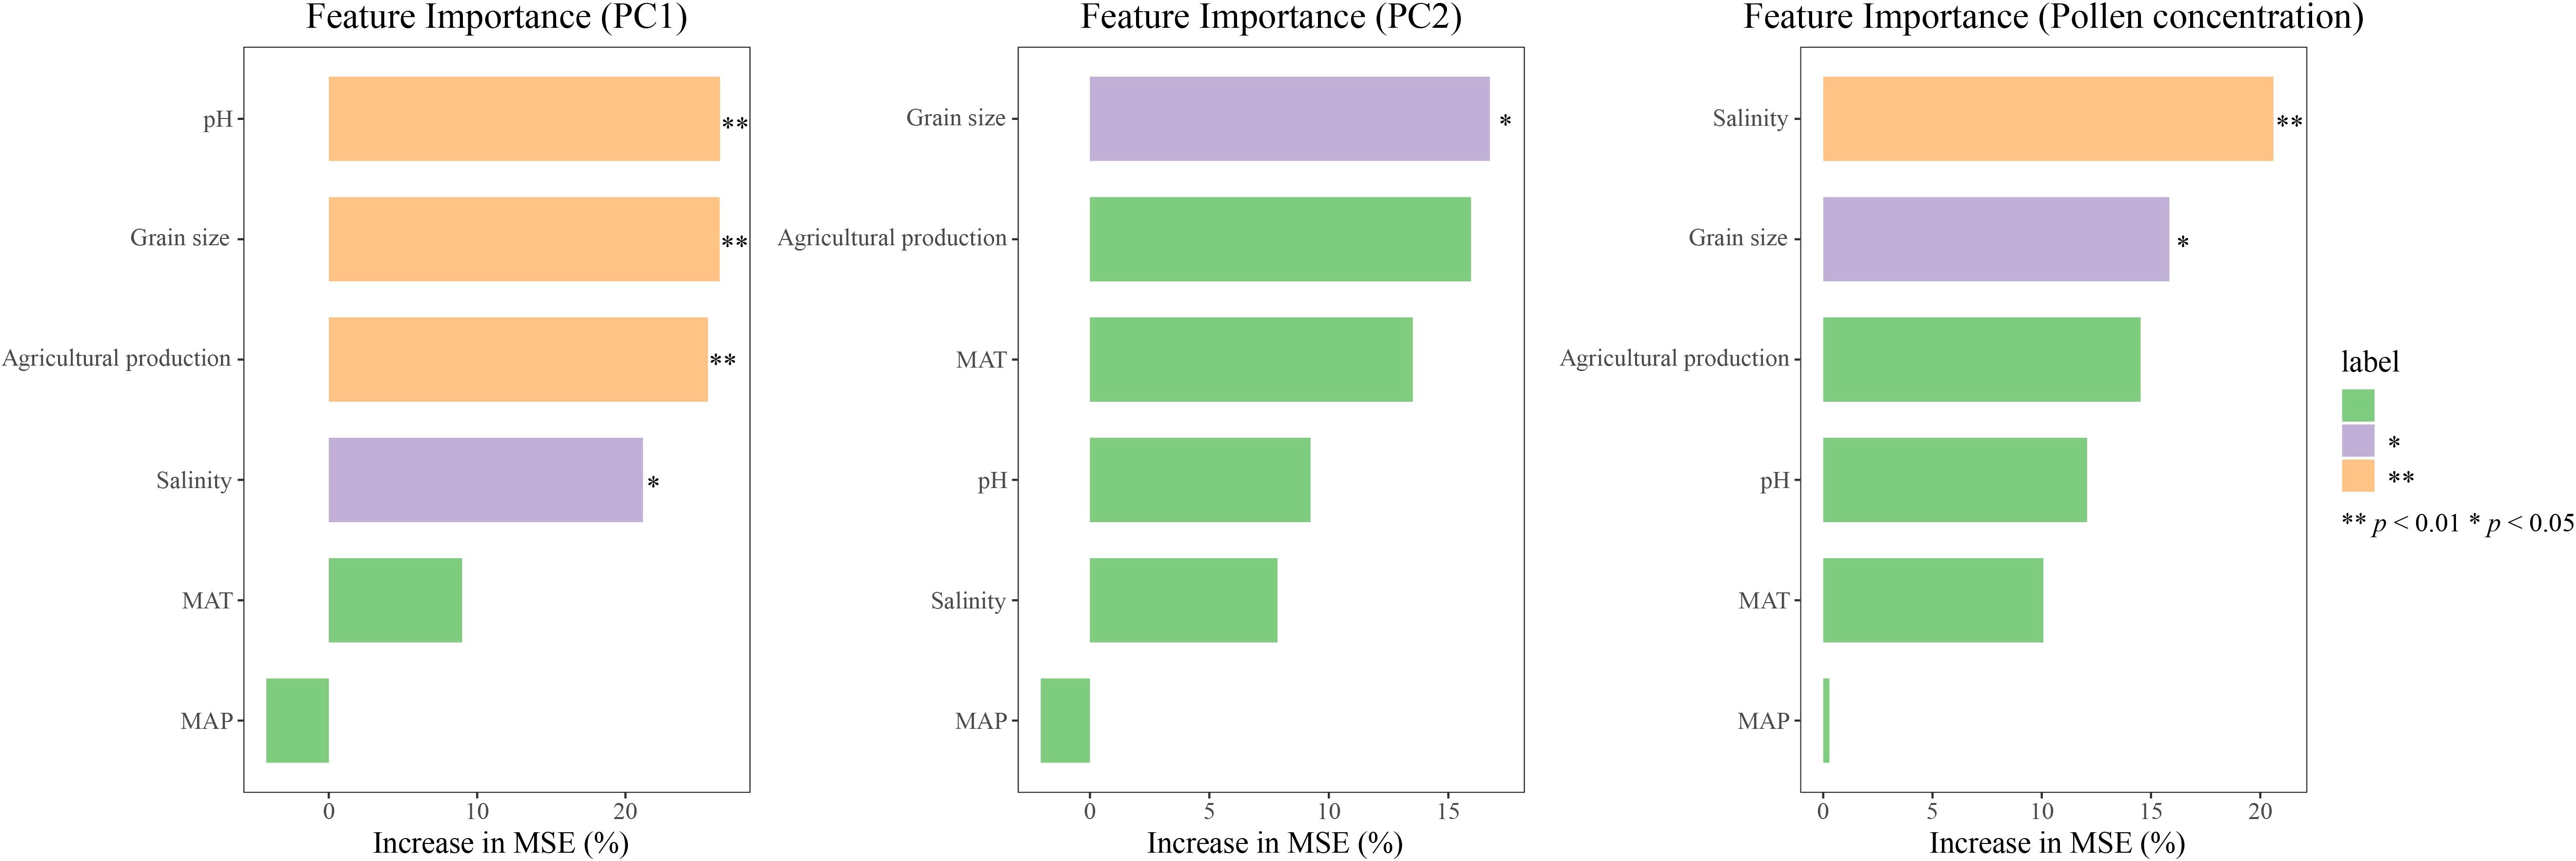
Figure 6. Contribution analysis of environmental factors to the principal components of the seven most dominant pollen taxa and pollen concentration based on random forest. MAT, Mean Annual Temperature; MAP, Mean Annual Precipitation. Significance levels: *p < 0.05, **p < 0.01.
4 Discussion
4.1 Characteristics of pollen of plant communities and climate change in the Liaohe Estuary
The entire sediment core profile showed that pollen concentration increased with decreasing soil depth, which was particularly evident in pollen zones III and IV (Figure 2). Pollen concentration can effectively reflect changes in pollen productivity, and studies also have shown a significant positive correlation between pollen concentration and vegetation coverage (Miao et al., 2016). It can be inferred that the vegetation coverage or pollen productivity near the core LHK has clearly increased over time, with a notable increase observed between 2001 and 2022. The pollen assemblage was dominated by herbaceous pollen, followed by woody pollen, with few fern and algae spores. In pollen zones III and IV, the percentage of herbaceous pollen clearly increased, while the percentage of woody pollen, fern, and algae spores clearly decreased, indicating that the plant communities in the Liaohe Estuary were dominated by herbaceous plants from 1944 to 2022, and the percentage of herbaceous plant increased clearly between 2001 and 2022. The findings of this study, that plant communities during this period were dominated by herbaceous species and the percentage of herbaceous pollen increased over time, are consistent with conclusions from other studies conducted in the Liaohe Estuary (Ma et al., 2016; Guo, 2019). The herbaceous pollen mainly included Chenopodiaceae, Artemisia, Poaceae, Cyperaceae, and Typha, while the woody pollen was dominated by Pinus, deciduous Quercus, and Betula. These results are consistent with pollen records from other studies in the Liaohe Estuary and its surrounding areas (Yang et al., 2021, 2022). Furthermore, the ratio of Chenopodiaceae to Artemisia can be used to determine the dry and wet conditions of the period. A ratio greater than four indicates that the climate of the region is relatively dry, while a ratio lower than four indicates that the climate is relatively humid. The larger the numerical gap, the more significant the dry and wet conditions (Wang et al., 2010). The entire sediment profile in the core showed that the percentage of Chenopodiaceae gradually increased with decreasing soil depth and was the dominant group starting from pollen zone II, whereas the percentage of Artemisia decreased with decreasing soil depth (Figure 3). The Chenopodiaceae/Artemisia ratio gradually increased from 0.74 to 3.45, accompanied by a decrease in the percentage of aquatic species’ pollen, indicating that the climate of the region was initially relatively humid but exhibited a drying trend over time (Figure 2). Woody pollen was mainly Pinus (37.91%–46.19%), followed by Betula and deciduous Quercus, all of which are cold-resistant plants (Wang et al., 1986; Zhang et al., 2020).
Furthermore, we analyzed the pollen community characteristics and climate change in the four pollen zones according to changes in the percentage of different families and genera. First period (1944—1966 a): Pollen concentration in the entire soil profile was the lowest during this period, with herbaceous pollen dominant, indicating that the pollen community mainly comprised herbaceous plants. Woody pollen included Pinus, Betula, deciduous Quercus, Ulmus, and Salix, with Pinus being the only conifer, but accounting for a large proportion. The Chenopodiaceae/Artemisia ratio was 0.74. Pollen of several aquatic species such as Cyperaceae and Typha, as well as moisture-loving fern spores such as Pteris, was recorded. Herbaceous pollen included cold-loving Asteraceae, and woody pollen included cold-resistant species such as Betula, indicating that the climate during this period was humid and cool (Wang et al., 1986; Singh and Pusalkar, 2020). Second period (1966—1986 a): Pollen concentration increased clearly during this period, and the pollen zone distribution was similar to that in the first period, indicating that the pollen community was still dominated by herbaceous plants. The percentage of pollen from aquatic species, such as Typha and Cyperaceae, decreased, while the percentage of Chenopodiaceae clearly increased, with a Chenopodiaceae/Artemisia ratio of 1.18, indicating that compared to the period of 1944–1966, the climate was slightly drier during this period, but overall still humid. The proportion of coniferous species decreased slightly, indicating that the temperature during this period was slightly higher than that that during the first period, and the distribution of tree families and genera indicated a cool and humid climate similar to that of the first period. Third period (1986—2001 a): In this period, the pollen community was still dominated by herbaceous plants. Among woody pollen, we observed pollen of cold-resistant tree species, such as Betula and Juglans, as well as deciduous broad-leaved tree species, such as deciduous Quercus and Juglans, indicating a cool climate (Wang et al., 1986; Zykin et al., 2017). Among herbaceous pollen, Chenopodiaceae continued to increase clearly compared to their abundance compared with second period, with a Chenopodiaceae/Artemisia ratio of 1.94, indicating that humidity during this period continued to decrease compared to the second period, and the climate was cool and humid. Fourth period (2001—2022 a): Pollen concentration clearly increased and the percentage of herbaceous pollen exceeded 90%, being the highest in the entire profile. Compared with the third period, the percentage of woody pollen clearly decreased, with coniferous species such as Pinus, broad-leaved species like Betula and deciduous Quercus present in small quantities. Fern and algal spores were also scarcely represented. The pollen community was dominated by herbaceous pollen, among which the percentage of Chenopodiaceae continued to rise compared to the third period, reaching the highest level in the entire profile, with a Chenopodiaceae/Artemisia ratio of 3.45. The overall climate was characterized as cool and humid, but drier than that between 1986 and 2001. Other study on the Liaohe Estuary also indicate that, influenced by climate change and human activities, the area of the typical Chenopodiaceae plant S. salsa significantly increased from 2009 to 2015 (Chen et al., 2018).
4.2 Driving factors of plant community changes in the Liaohe Estuary
Changes in the structure and composition of plant communities are consequences of changes in the number of the main plant communities (Song et al., 2024). To better understand the characteristics of plant communities in the Liaohe Estuary during different periods, PCA was used to analyze the most dominant seven pollen taxa. The first principal component accounted for 41.2% of the total explanatory power, among which Chenopodiaceae showed a negative loading pattern and other pollen taxa showed the opposite trend (Figure 4). Studies have shown that in estuaries, Chenopodiaceae pollen is a reliable indicator of salt marsh environments, and the trend of pollen percentage change is well correlated with soil salinity and pH (Liu et al., 2023). The opposite loading pattern of Chenopodiaceae pollen and other pollen in the PCA in this study may be related to changes in environmental factors, such as soil salinity and pH. In studies of plant communities using pollen analysis, pollen composition and concentration have been widely used as important indicators of sedimentary environments (Miao et al., 2016; Yang et al., 2021). Pollen concentrations indicate that changes in vegetation cover or pollen productivity are related to agricultural production; therefore, climate, soil, and human activity factors were chosen, combined with the percentages of main pollen taxa and pollen concentration, to determine the factors affecting the composition, vegetation cover and pollen productivity of plant communities in the Liaohe Estuary (Jin et al., 2020).
Changes in temperature, precipitation, and other climatic factors are the main forces driving the changes in plant community characteristics. Studies on pollen and plant communities usually use climatic factors, such as temperature and precipitation, to investigate the patterns of plant community changes (Li et al., 2014; Yang et al., 2019). Redundancy analysis (RDA) revealed that MAT (p< 0.001) influenced the percentages of the most dominant seven pollen taxa and pollen concentration, while the correlation between MAP and the most dominant seven pollen taxa as well as pollen concentration was relatively weaker (Table 1).Studies have shown that rising temperatures have driven an increase in annual total pollen emission, leading to changes in pollen productivity (Zhang and Steiner, 2022). Additionally, vegetation coverage across the country exhibits a significant positive correlation with temperature (Qi et al., 2020). The results revealed a positive correlation between MAT and pollen concentration, particularly during the period from 2001 to 2022, where the increasing trends in MAT and pollen concentration were consistent. This indicates that the rise in temperature over the past 80 years has promoted vegetation coverage or pollen productivity in the Liaohe Estuary.
Due to the unique geographical characteristics of estuaries, changes in MAP primarily affect the species composition of plant communities by affecting soil salinity, rather than directly driving plant community changes (Song et al., 2024; Huang et al., 2024). Additionally, estuarine plant communities exhibit strong adaptability to typical environmental pressures, such as salinity and tidal changes. Alongside MAP, other water sources, such as groundwater and tidal influx, may help maintain plant growth, making these communities less sensitive to changes in MAP (Guan et al., 2011; Gao et al., 2010; An et al., 2017). The results of this study further showed that MAP had no significant impact on the most dominant seven pollen taxa and pollen concentration, suggesting that MAP was not a primary driver of plant community changes in the Liaohe Estuary over the past 80 years.
According to the RDA and random forest results, soil salinity, pH, and grain size were significantly correlated with the most dominant seven pollen taxa (p< 0.001, Figure 5), and made significant contributions to PC1 of the most dominant seven pollen taxa (Figure 6), which is consistent with findings from the Yellow River Delta (He et al., 2009; Ma et al., 2012). Studies in the San Francisco Estuary have shown that during periods of high soil salinity in estuary, the percentages of Chenopodiaceae and Poaceae pollen are higher, whereas the percentage of Cyperaceae pollen is lower (Byrne et al., 2001). In this study, soil salinity and grain size were clearly positively correlated with the most dominant seven pollen taxa, with a stronger correlation observed for Chenopodiaceae pollen. Between 2001 and 2022, the percentage of Chenopodiaceae pollen increased clearly, while the percentage of aquatic pollen, such as Cyperaceae and Typha, decreased. This suggests that the main plant taxa in the Liaohe Estuary exhibit strong adaptability to changes in salinity and grain size. These findings align with previous research on plant communities in the Liaohe Estuary (Dong et al., 1995). Research in the Mu Us Sandy Land has shown that vegetation cover is significantly negatively correlated with soil grain size and significantly positively correlated with soil pH (Chen et al., 2022). The RDA results in this study also revealed that soil salinity and grain size were negatively correlated with pollen concentration, while pH was positively correlated with pollen concentration (Figure 5). Additionally, the random forest results showed that soil salinity and grain size had substantial contributions to pollen concentration (Figure 6). It indicates soil salinity and grain size in the Liaohe Estuary contributed to an increase in vegetation cover, whereas soil pH had a negative impact on vegetation cover.
Agricultural production leads to changes in land-use patterns that affect the species composition and community richness of plant communities, thereby influencing plant community characteristics. Previous studies have shown that a decrease in the percentage of native pollen and an increase in agricultural pollen in estuarine sediments during certain periods are linked to human activities such as land reclamation, agricultural planting, and vegetation burning (Deng et al., 2006; Yang et al., 2013; Abrahim et al., 2013). Additionally, chemical agents used in agriculture, such as herbicides, can reduce the distribution of native plants and lower the species composition and diversity of plant communities (Qi et al., 2020). The present study showed that agricultural production was significantly correlated with the percentages of the most dominant seven pollen taxa and pollen concentration (p< 0.001, Table 1) and has substantial contributions (Figure 6). Specifically, it showed a negative correlation with the most dominant seven pollen taxa, particularly Artemisia and Poaceae, indicating that agricultural activities over the past 80 years have negatively impacted the main plant taxa of the Liaohe Estuary plant community, with a stronger inhibitory effect on Artemisia and Poaceae. However, agricultural production was positively correlated with pollen concentration (Figure 5), suggesting that while it negatively impacted the main plant taxa, it contributed to an increase in local vegetation cover or pollen productivity. These findings align with research on the Yellow River Estuary (Jin et al., 2020).
The results indicate that rising temperatures have promoted increased vegetation cover or pollen productivity. Increases in soil salinity and grain size enhance the dominance of main plant taxa (e.g., Artemisia and Poaceae) but reduce local vegetation cover or pollen productivity. Although agricultural production inhibits the dominance of key plant taxa (e.g., Artemisia and Poaceae), it enhances local vegetation cover or pollen productivity. Therefore, it is recommended to optimize plant community structure by regulating soil salinity and grain size in estuarine management, while rationally planning agricultural activities to reduce negative impacts on native plants and maintain species diversity and ecological functions. Additionally, monitoring and adaptation strategies for climate change should be strengthened to promote the sustainable development of estuarine ecosystems.
5 Conclusion
This study employed 210Pb dating, pollen analysis, combined with soil physicochemical properties such as pH, salinity, and grain size, as well as environmental factors including MAT, MAP, and agricultural production, to investigate the characteristics of plant communities in the Liaohe Estuary from 1944 to 2022 along with the key environmental factors driving these changes. The findings of this study provide a scientific basis for the vegetation restoration and management of the degraded ecosystem in the Liaohe Estuary. The results revealed that herbaceous plants dominated the plant communities in the Liaohe Estuary during this period, with a cool and humid climate that gradually became drier over time. Over the time span from 2001 to 2022, accompanied by the increase in MAT, the percentage of herbaceous plants in plant communities and the pollen concentration both exhibited the characteristic of increasing as the soil depth decreased; correspondingly, the percentages of trees, ferns, and algae showed a decreasing trend as the soil depth decreased. Soil salinity, grain size, and agricultural production were identified as the primary factors affecting plant communities and pollen concentration in the Liaohe Estuary. Natural factors such as salinity and grain size supported the dominance of the main plant taxa but reduced overall pollen concentration, whereas human-driven agricultural activities inhibited the dominance of the main plant taxa while increasing the pollen concentration.
Data availability statement
The original contributions presented in the study are included in the article/Supplementary Material, further inquiries can be directed to the corresponding author/s.
Author contributions
HL: Conceptualization, Data curation, Formal analysis, Investigation, Methodology, Writing – original draft, Writing – review & editing. WWL: Conceptualization, Funding acquisition, Investigation, Methodology, Project administration, Writing – review & editing. JW: Methodology, Writing – review & editing. WL: Investigation, Visualization, Writing – review & editing. JZ: Methodology, Writing – review & editing. JG: Methodology, Writing – review & editing. LC: Funding acquisition, Project administration, Supervision, Validation, Writing – review & editing.
Funding
The author(s) declare that financial support was received for the research and/or publication of this article. This work is supported from the National Key R & D Program of China (grant: 2022YFF1301000), the National Natural Science Foundation of China (grant: 72474215 and 72104236), the Fundamental Research Funds of Chinese Academy of Forestry (grant: CAFYBB2023MB018).
Conflict of interest
The authors declare that the research was conducted in the absence of any commercial or financial relationships that could be construed as a potential conflict of interest.
The author(s) declared that they were an editorial board member of Frontiers, at the time of submission. This had no impact on the peer review process and the final decision.
Generative AI statement
The author(s) declare that no Generative AI was used in the creation of this manuscript.
Publisher’s note
All claims expressed in this article are solely those of the authors and do not necessarily represent those of their affiliated organizations, or those of the publisher, the editors and the reviewers. Any product that may be evaluated in this article, or claim that may be made by its manufacturer, is not guaranteed or endorsed by the publisher.
Supplementary material
The Supplementary Material for this article can be found online at: https://www.frontiersin.org/articles/10.3389/fpls.2025.1578390/full#supplementary-material
References
Abrahim, G. M. S., Parker, R. J., Horrocks, M. (2013). Pollen core assemblages as indicator of Polynesian and European impact on the vegetation cover of Auckland Isthmus catchment, New Zealand. Estuar. Coast. Shelf Sci. 131, 162–170. doi: 10.1016/j.ecss.2013.06.028
An, L. S., Zhou, B. H., Zhao, Q. S., Wang, L. (2017). Spatial distribution of vegetation and environmental interpretation in the Yellow River Delta. Acta Ecol. Sin. 37, 6809–6817. doi: 10.5846/stxb201607261518
Appleby, P. G., Oldfield, F. (1978). The calculation of lead-210 dates assuming a constant rate of supply of unsupported 210Pb to the sediment. Catena 5, 1–8. doi: 10.1016/S0341-8162(78)80002-2
Borde, A. B., Diefenderfer, H. L., Cullinan, V. I., Zimmerman, S. A., Thom, R. M. (2020). Ecohydrology of wetland plant communities along an estuarine to tidal river gradient. Ecosphere. 11, e03185. doi: 10.1002/ecs2.3185
Byrne, R., Ingram, B. L., Starratt, S., Malamud-Roam, F., Collins, J. N., Conrad, M. E. (2001). Carbon-isotope, diatom, and pollen evidence for late Holocene salinity change in a brackish marsh in the San Francisco Estuary. Quat. Res. 55, 66–76. doi: 10.1006/qres.2000.2199
Byrne, S. M., Merrifield, M. A., Carter, M. L., Cayan, D. R., Flick, R. E., Gershunov, A., et al. (2023). Southern California winter precipitation variability reflected in 100-year ocean salinity record. Commun. Earth Environ. 4, 143. doi: 10.1038/s43247-023-00803-8
Chen, G. B., Liu, W. N., Jia, Y. P., Song, X., Liu, H. Y., Xiao, L., et al. (2018). Analysis on the spatial and temporal changes of Suaeda salsa’ biomass in Liaohe Estuary during 2013 to 2016. Mod. Salt Chem. Ind. 45, 64–65. doi: 10.19465/j.cnki.2095-9710.2018.01.027
Chen, X., Liu, S. L., Peng, F., Wang, T. (2022). Interactions among biological soil crust, vegetation, and soil on medium resolution pixel scale of remote sensing. Acta Ecol. Sin. 42, 7336–7348. doi: 10.5846/stxb202107242000
Cheng, X., Song, J. P., Yan, J. Z. (2023). Influences of landscape pattern on water quality at multiple scales in an agricultural basin of western China. Environ. pollut. 319, 120986. doi: 10.1016/j.envpol.2022.120986
PubMed Abstract | PubMed Abstract | Crossref Full Text | Google Scholar
Cui, L. J., Li, W., Dou, Z. G., Zhang, M. Y., Wu, G. F., Hu, Z. W., et al. (2022). Changes and driving forces of the tidal flat wetlands in coastal China during the past 30 years. Acta Ecol. Sin. 42, 7297–7307. doi: 10.5846/stxb202203080551
Deng, Y. B., Horrocks, M., Ogden, J., Anderson, S. (2006). Modern pollen–vegetation relationships along transects on the Whangapoua Estuary, Great Barrier Island, northern New Zealand. J. Biogeogr. 33, 592–608. doi: 10.1111/j.1365-2699.2005.01417.x
Dong, H. D., Quan, K. G., Shao, C., Chen, Z. L. (1995). Ecology of plant communities in Liaohe estuary wetland tonservation area. Chin. J. Appl. Ecol. 6, 190–195.
Duarte, C. M., Losada, I. J., Hendriks, I. E., Mazarrasa, I., Marbà, N. (2013). The role of coastal plant communities for climate change mitigation and adaptation. Nat. Clim. Change. 3, 961–968. doi: 10.1038/nclimate1970
Feng, X., Chen, J. (2023). Impacts of environmental factors and freshwater discharges from multiple river outlets on estuarine salinity variation in rainy season: A case study of the Pearl River Estuary in China. J. Hydrol. 623, 129784. doi: 10.1016/j.jhydrol.2023.129784
Fenu, G., Carboni, M., Acosta, A. T. R., Bacchetta, G. (2012). Environmental factors influencing coastal vegetation pattern: new insights from the mediterranean basin. Folia Geobot. 48, 493–508. doi: 10.1007/s12224-012-9141-1
Gao, M. S., Ye, S., Shi, G. J., Yuan, H. M., Zhao, G. M., Xue, Z. N. (2010). Oceanic tide-induced shallow groundwater regime fluctuations in coastal wetland. Hydrogeol. Eng. Geol. 37, 24–27. doi: 10.16030/j.cnki.issn.1000-3665.2010.04.005
Goldberg, E. D. (1963). Geochronology with 210Pb. In radioactive dating. International Atomic Energy Agency, Vienna, 121–131.
Grimm, E. C. (1990). TILIA and TILIA. GRAPH. PC spreadsheet and graphics software for pollen data, INQUA, Working Group on Data-Handling Methods. Newsletter 4, 5–7.
Guan, B., Yu, J. B., Lu, Z. H., Wang, X. H. (2011). Effects of water-salt stresses on seedling growth and activities of antioxidative enzyme of Suaeda salsa in coastal wetlands of the Yellow River Delta. Environ. Sci. 32, 2422–2429. doi: 10.13227/j.hjkx.2011.08.003
PubMed Abstract | PubMed Abstract | Crossref Full Text | Google Scholar
Guo, R. L. (2019). Chemical weathering and its implications to provenance and climate changes of core ZK2 in the Liaohe Delta since the holocene. Shandong University of Science and Technology, Qingdao (Shandong Province.
He, Q., Cui, B. S., Zhao, X. S., Fu, H. L. (2009). Relationships between salt marsh vegetation distribution/diversity and soil chemical factors in the Yellow River Estuary, China. Acta Ecol. Sin. 29, 676–687. doi: 10.1007/978-3-642-02298-2_32
Held, B., Moriarty, B., Richardson, T. (2019). Microsoft excel functions and formulas with excel 2019/office 365. Herndon: Mercury Learn. Inf, pp.139 -170. doi: 10.1515/9781683923756
Huang, W. X., Han, G. X., Wei, S. Y., Zhao, M. L., Chu, X. J., Sun, R. F., et al. (2024). Seasonal precipitation distribution determines ecosystem CO2 and H2O exchange by regulating spring soil water–salt dynamics in a brackish wetland. Funct. Ecol. 38, 1959–1970. doi: 10.1111/1365-2435.14617
Jiang, T. T., Pan, J. F., Pu, X. M., Wang, B., Pan, J. J. (2015). Current status of coastal wetlands in China: degradation, restoration, and future management. Estuar. Coast. Shelf Sci. 164, 265–275. doi: 10.1016/j.ecss.2015.07.046
Jin, K. K., Fan, J. S., Zhao, X., Zhang, P. (2020). Analysis on dynamic change of vegetation coverage in coastal wetland of Yellow River delta. Earth Environ. Sci. 450, 12108. doi: 10.1088/1755-1315/450/1/012108
Johnston, K., Ver Hoef, J. M., Krivoruchko, K., Lucas, N. (2001). Using ArcGIS geostatistical analyst (Vol. 380) (Redlands: Esri).
Lane, S. L., Shackelford, N., Bradfield, G. E., Denoth, M., Martin, T. G. (2024). Plant community stability over 40 years in a fraser river estuary tidal freshwater marsh. Wetlands 44, 25. doi: 10.1007/s13157-024-01776-w
Li, Y. M., Yang, Z. J., Zhang, Y., Yang, Q. H., Liu, L. J., Bi, Z. W., et al. (2014). Surface pollen assemblages and vegetation relationships in the bortala river basin of xinjiang, China. Sci. Geogr. Sin. 34, 1518–1525. doi: 10.13249/j.cnki.sgs.2014.012.1518
Li, Q., Zhao, Y. (2018). Quantitative methods and progress of paleo-floristic diversity reconstruction based on pollen assemblages. Quat. Sci. 38, 821–829. doi: 10.11928/j.issn.1001-7410.2018.04.02
Liu, C. H., Ge, Y. W., She, Z. J., Li, B., Fan, B. S., Zuo, Y. T., et al. (2023). Distribution and sources of surface soil pollen in different coastal wetlands and their relationship with land cover: A case study of northwest Bohai Bay, north China. Ecol. Indic. 156, 111184. doi: 10.1016/j.ecolind.2023.111184
Lorenz, M., Klingbeil, K., Burchard, H. (2021). Impact of evaporation and precipitation on estuarine mixing. J. Phys. Oceanogr. 51, 1319–1333. doi: 10.1175/JPO-D-20-0158.1
Lu, Q., Jiang, T., Liu, D. L., Liu, Z. Y. (2020). The response characteristics of NDVI with different vegetation cover types to temperature and precipitation in China. Ecol. Environ. 29, 23. doi: 10.16258/j.cnki.1674-5906.2020.01.003
Ma, H. W., Che, J. Y., Ma, S. M., Cui, J., Wang, C. Q., Dai, Y. J. (2016). Holocene environmental changes revealed by Core LZK03 in the Liaohe River Delta. Geol. Bull. China 35, 1571–1577. doi: 10.12097/gbc.dztb-35-10-1571
Ma, C. L., Lin, T., Ye, S. Y., Ding, X. G., Li, Y. Y., Guo, Z. G. (2017). Sediment record of polycyclic aromatic hydrocarbons in the Liaohe River Delta wetland, Northeast China: Implications for regional population migration and economic development. Environ. pollut. 222, 146–152. doi: 10.1016/j.envpol.2016.12.065
PubMed Abstract | PubMed Abstract | Crossref Full Text | Google Scholar
Ma, Z. W., Xie, Z. L., Duan, X. F., Zhou, X., Timothy, R. R., Xu, X. G. (2012). Plant-soil relationship and plant niche in the Yellow River delta national natural reserve, China. Acta Sci. Nat. Univ. Pekin. 48, 801–811. doi: 10.13209/j.0479-8023.2012.104
Meixler, M. S., Kennish, M. J., Crowley, K. F. (2018). Assessment of plant community characteristics in natural and human-altered coastal marsh ecosystems. Estuaries coasts. 41, 52–64. doi: 10.1007/s12237-017-0296-0
Miao, Y. F., Fang, X. M., Liu, Y. S., Yan, X. L., Li, S. Y., Xia, W. M. (2016). Late Cenozoic pollen concentration in the western Qaidam Basin, northern Tibetan Plateau, and its significance for paleoclimate and tectonics. Rev. Palaeobot. Palynol. 231, 14–22. doi: 10.1016/j.revpalbo.2016.04.008
Moberly, J. G., Bernards, M. T., Waynant, K. V. (2018). Key features and updates for origin 2018. J. cheminformatics 10, 1–2. doi: 10.1186/s13321-018-0259-x
PubMed Abstract | PubMed Abstract | Crossref Full Text | Google Scholar
Peng, S. Z. (2019). Data from: 1-km monthly mean temperature dataset for China, (1901-2023) (Beijing, China: National Tibetan Plateau Data Center). doi: 10.11888/Meteoro.tpdc.270961
Peng, S. Z. (2020). Data from: 1-km monthly precipitation dataset for China, (1901-2023) (Beijing, China: National Tibetan Plateau/Third Pole Environment Data). doi: 10.5281/zenodo.3114194
Peng, J. W., Liu, S. G., Lu, W. Z., Liu, M. C., Feng, S. L., Cong, P. F. (2021). Continuous change mapping to understand wetland quantity and quality evolution and driving forces: a case study in the Liao River estuary from 1986 to 2018. Remote Sens. 13, 4900. doi: 10.3390/rs13234900
Pratolongo, P., Leonardi, N., Kirby, J. R., Plater, A. (2019). “Temperate coastal wetlands: morphology, sediment processes, and plant communities,” in Coastal wetlands, 2nd ed. Eds. Perillo, G. M. E., Wolanski, E., Cahoon, D. R., Hopkinson, C. S. (Elsevier Press, Amsterdam Netherlands, FL), 105–152. doi: 10.1016/B978-0-444-63893-9.00003-4
Qi, Y., Li, J. S., Guan, X., Yan, B., Fu, G., He, J., et al. (2020). Effects of herbicides on non-target plant species diversity and the community composition of fallow fields in northern China. Sci. Rep. 10, 9967. doi: 10.1038/s41598-020-67025-2
PubMed Abstract | PubMed Abstract | Crossref Full Text | Google Scholar
R Core Team (2024). R: A language and environment for statistical computing (4.3. 3) (Vienna, Austria: R, R Foundation for Statistical Computing).
Ryan, M. G., Hubbard, R. M., Pongracic, S., Raison, R. J., McMurtrie, R. E. (1996). Foliage, fine-root, woody-tissue and stand respiration in Pinus radiata in relation to nitrogen status. Tree Physiol. 16, 333–343. doi: 10.1093/treephys/16.3.333
PubMed Abstract | PubMed Abstract | Crossref Full Text | Google Scholar
Singh, D. K., Pusalkar, P. K. (2020). “Floristic diversity of the Indian himalaya,” in Biodiversity of the himalaya: jammu and kashmir state. Topics in biodiversity and conservation, vol 18. Eds. Dar, G., Khuroo, A. (Springer Press, Singapore, FL). doi: 10.1007/978-981-32-9174-4_5
Song, J., Liang, Z. H., Li, X. G., Wang, X. J., Chu, X. J., Zhao, M. L., et al. (2024). Precipitation changes alter plant dominant species and functional groups by changing soil salinity in a coastal salt marsh. J. Environ. Manage. 368, 122235. doi: 10.1016/j.jenvman.2024.122235
PubMed Abstract | PubMed Abstract | Crossref Full Text | Google Scholar
Sun, J. K., Chi, Y., Fu, Z. Y., Li, T., Dong, K. K. (2020). Spatiotemporal variation of plant diversity under a unique estuarine wetland gradient system in the Yellow River Delta, China. Chin. Geogr. Sci. 30, 217–232. doi: 10.1007/s11769-020-1109-0
von Post, L. (1916). Forest tree pollen in south Swedish peat bog deposits. Pollen Et Spores 9, 375–401.
Wang, W. M. (2009). Progress and prospect of studies on palynology in China. Acta Palaeontol. Sin. 48, 338–346. doi: 10.3724/SP.J.1226.2021.20049
Wang, X. L., Jie, D. M., Li, Y. (2010). The holocene sporopollen assemblages and paleoclimate evolution in the lower liaohe plain. Henan Sci. 28, 794–798. doi: 10.13537/j.issn.1004-3918.2010.07.009
Wang, F. X., Qian, N. F., Zhang, Y. L., Yang, H. Q. (1995). Pollen morphology of Chinese plants. Beijing: Sci. Presspp. 11–42.
Wang, K., Zhang, Y. L., Jiang, H., Han, X. B. (1986). Palynological assemblages from the Holocene sediments of the Changjiang (Yangtze) river delta and its implications. Chin. J. oceanology limnology 4, 196–210. doi: 10.1007/BF02850435
Xiao, X. Y., Shen, J., Wang, S. M., Xiao, H. F., Tong, G. B. (2008). The plant diversity and its relationship with paleoenvironment since 2.78 Ma revealed by pollen records in the Heqing deep drilling core. Chin. Sci. Bull. 53, 3686–3698. doi: 10.1007/s11434-008-0439-6
Xie, C. J., Liu, Z. Z., Xie, T., Cai, Y. Z., Li, J., Cui, B. S. (2018). Characteristics and driving forces of vegetation succession in the salt marshes at the mouth bar of Liao he estuary. J. Beijing Norm. Univ. (Nat. Sci.). 54, 137–143. doi: 10.16360/j.cnki.jbnuns.2018.01.019
Xiong, Y., Mo, S. H., Wu, H. P., Qu, X. Y., Liu, Y. Y., Zhou, L. (2023). Influence of human activities and climate change on wetland landscape pattern—A review. Sci. Total Environ. 879, 163112. doi: 10.1016/j.scitotenv.2023.163112
PubMed Abstract | PubMed Abstract | Crossref Full Text | Google Scholar
Yang, S. X., Gu, F., Song, B., Ye, S. Y., Yuan, Y. M., He, L., et al. (2022). Holocene vegetation history and responses to climate and sea-level change in the Liaohe Delta, northeast China. Catena 217, 106438. doi: 10.1016/j.catena.2022.106438
Yang, Z. B., Li, T. G., Nan, Q. Y. (2013). Features of the Sporopollen Assemblages at Southwestern Pearl River Estuary Over the Past 8–000 Years and its Paleoclimate Implications. Mar. Geol. Quat. Geol. 32, 33–40. doi: 10.3724/SP.J.1140.2012.04033
Yang, S. X., Li, J., Ye, S. Y., Mackenzie, L., Yuan, H. M., He, L., et al. (2021). Pollen distribution and transportation patterns in surface sediments of Liaodong Bay, China. Sci. Total Environ. 771, 144883. doi: 10.1016/j.scitotenv.2020.144883
PubMed Abstract | PubMed Abstract | Crossref Full Text | Google Scholar
Yang, Q. H., Yang, Z. J., Zang, Y., Bi, Z. W., Liu, L. J., Song, S. Y., et al. (2019). Relationship between surface sporepollen and modern vegetation in Xarxili Nature Reserve of Xinjiang. Arid Land Geogr. 42, 986–997. doi: 10.12118/j.issn.1000-6060.2019.05.03
Zhang, Y., Steiner, A. L. (2022). Projected climate-driven changes in pollen emission season length and magnitude over the continental United States. Nat. Commun. 13, 1234. doi: 10.1038/s41467-022-28764-0
PubMed Abstract | PubMed Abstract | Crossref Full Text | Google Scholar
Zhang, Y. X., Ye, W., Ma, C. M., Li, Y. L., Li, C. H., Zhu, L. D. (2020). Middle to late Holocene changes in climate, hydrology, vegetation and culture on the Hangjiahu Plain, southeast China. J. Paleolimnol. 64, 211–223. doi: 10.1007/s10933-020-00132-2
Zheng, Z., Deng, Y., Zhang, H., Yu, R. C., Chen, Z. X. (2004). Holocene environmental changes in the tropical and subtropical areas of the South China and the relation to human activities. Quat. Sci. 24, 387–393.
Zuo, X. A., Zhao, X. Y., Zhao, H. L., Zhang, T. H., Li, Y. L., Wang, S. K., et al. (2012). Scale dependent effects of environmental factors on vegetation pattern and composition in Horqin Sandy Land, Northern China. Geoderma 173-174, 1–9. doi: 10.1016/j.geoderma.2011.10.003
Keywords: plant community characteristics, estuary, pollen analysis, environmental factors, human activities
Citation: Liu H, Liu W, Wang J, Li W, Zhang J, Gong J and Cui L (2025) Long-term dynamics and driving mechanisms of plant communities in a temperate estuary in eastern China based on pollen analysis: a case study of the Liaohe Estuary. Front. Plant Sci. 16:1578390. doi: 10.3389/fpls.2025.1578390
Received: 17 February 2025; Accepted: 02 April 2025;
Published: 28 April 2025.
Edited by:
Xin-Sheng Chen, Anhui University, ChinaCopyright © 2025 Liu, Liu, Wang, Li, Zhang, Gong and Cui. This is an open-access article distributed under the terms of the Creative Commons Attribution License (CC BY). The use, distribution or reproduction in other forums is permitted, provided the original author(s) and the copyright owner(s) are credited and that the original publication in this journal is cited, in accordance with accepted academic practice. No use, distribution or reproduction is permitted which does not comply with these terms.
*Correspondence: Lijuan Cui, d2V0bGFuZHMxMDhAMTI2LmNvbQ==