 Song Fangyuan
 Li Yong
 Jin Huang
- Cash Crops Research Institute, Hubei Academy of Agricultural Sciences, Wuhan, China
Salt stress severely restricts plant growth and productivity. TCP genes, which are plant-specific transcription factors, play a crucial role in the stress response. However, their functions in pea (Pisum sativum) remain poorly understood. Here, we identified 21 PsTCP genes in pea, classified into Class I (PCF) and Class II (CYC/TB1 and CIN) through phylogenetic analysis. While physicochemical properties varied significantly within the PsTCP family, gene structures and conserved motifs were highly conserved among subfamilies. Comparative homology analysis revealed closer relationships between pea TCP genes and dicots (Arabidopsis) than monocots (rice). Cis-regulatory element analysis suggested roles in growth, hormone response, and stress adaptation. Under salt stress, PsTCP genes exhibited divergent expression patterns, with PsTCP17 showing significant upregulation under extreme stress. Weighted gene co-expression network (WGCNA) and gene ontology (GO) enrichment analyses identified PsTCP20 as a hub gene regulating photosynthesis and metabolic processes. Tissue-specific expression across 11 pea tissues further highlighted their functional diversity. This study provides insights into the molecular mechanisms of salt stress responses in pea and offers genetic resources for breeding salt-tolerant varieties.
1 Introduction
Soil salinity is a significant constraint on plant growth, adversely affecting physiological and biochemical processes. It impairs water and nutrient uptake, leading to reduced crop yields (Ali et al., 2023; Zhang et al., 2023). It induces ion imbalances, osmotic stress, and reactive oxygen species (ROS) accumulation, impairing germination, seedling development, photosynthesis, and water use efficiency (Hamouda et al., 2023; Rashid et al., 2023). Salinity affects 20% of global agricultural land, with projections reaching 50% by 2050, further exacerbated by rising sea levels and reduced precipitation (Otlewska et al., 2020; Ilyas et al., 2024). To mitigate these adverse effects, it is crucial to understand the molecular mechanisms that enable plants to cope with salinity stress. Transcription factors (TFs), as key regulators of gene expression, play a central role in coordinating plant responses to abiotic stresses, including salinity, by modulating the expression of stress-related genes and signaling pathways (Li et al., 2019).
Among the diverse families of transcription factors, the TCP family has become a critical player in regulating plant growth and stress adaptation. TCP transcription factors are plant-specific proteins that originated early in plant evolution and are named after their founding members: TB1 (TEOSINTE BRANCHED 1) in maize, CYC (CYCLOIDEA) in snapdragon, and PCF (PROLIFERATING CELL FACTOR) in rice (Cubas et al., 1999). Based on structural differences, TCP proteins are classified into Class I and Class II. Class I TCPs promote growth by regulating cell division, organ development, and seed germination, while Class II TCPs, characterized by an arginine-rich domain, regulate hormones, defense responses, and branching, often acting as growth inhibitors (Kosugi and Ohashi, 2002; Savadel et al., 2021; Zhang et al., 2021; Yu et al., 2022; Wu et al., 2023). TCP transcription factors play pivotal roles in plant responses to abiotic stresses, particularly salinity. Studies have shown that TCP genes are involved in stress signal transduction, enabling plants to adapt to saline environments. For example, in rice, OsTCP19 serves as a key regulator that integrates stress responses with developmental pathways, thereby enhancing salt tolerance (Mukhopadhyay and Tyagi, 2015). Similarly, overexpression of PheTCP9 or PeTCP10 from Phyllostachys edulis in Arabidopsis thaliana significantly enhances the salt tolerance in transgenic plants, highlighting their potential positive regulatory functions (Xu et al., 2022). These studies underscore the significant involvement of TCP transcription factors in stress response mechanisms, particularly under saline conditions, and point to their potential application in enhancing crop tolerance to salinity and other abiotic stresses.
Pea (Pisum sativum) is a self-pollinating, cool-season legume and a globally important crop, valued for its high nutritional content, digestibility, and cost-effective cultivation in temperate regions (Amarakoon et al., 2012; Guindon et al., 2021). Pea seeds are rich in protein, fiber, antioxidants, and essential minerals, with low cholesterol, making them beneficial for reducing cancer and cardiovascular risks, regulating blood glucose, and supporting diabetes management (Mudryj et al., 2014; Poblaciones and Rengel, 2018). Additionally, peas improve soil fertility through nitrogen fixation and are versatile as vegetables, dry peas, or green manure crops (Grela et al., 2017; Singh et al., 2022). Despite its agronomic and nutritional importance, pea production faces significant challenges from abiotic stresses, particularly salinity, which can severely impact yield and quality (Hamouda et al., 2023). To counteract such stresses, plants activate molecular mechanisms, in which transcription factors play a central role.
Although the TCP gene family has been extensively studied in various plants (Ling et al., 2020; Li et al., 2022; Pan et al., 2024), its systematic characterization in pea remains unexplored. In this study, we conducted a comprehensive genomic analysis of the PsTCP gene family, focusing on their physicochemical properties, gene structures, chromosomal distribution, conserved motifs, cis-regulatory elements, and phylogenetic relationships. We also examined their expression patterns under salt stress, revealing dynamic responses across different salt concentrations and time points. Tissue-specific profiling in 11 pea tissues further highlighted their roles in growth, development, and stress adaptation. To explore their functional mechanisms, we constructed protein-protein interaction networks and performed weighted gene co-expression network analysis (WGCNA), which identified key co-expression modules associated with salt tolerance. Additionally, structural predictions of PsTCP proteins using AlphaFold3 provided insights into their functional relationships. These findings underscore the critical roles of PsTCP genes in pea development and salt stress responses, laying the groundwork for breeding salt-tolerant pea varieties and advancing sustainable agriculture.
2 Results
2.1 Identification of TCP genes in pea and analysis of protein characteristics
By using the Pfam database (ID: PF03634) and performing BLAST alignment with A. thaliana, 21 TCP gene members were identified in pea. Based on their chromosomal locations, these genes were named PsTCP1 to PsTCP21. In addition, the physicochemical properties of these proteins were analyzed (Supplementary Table 1).
The molecular weights of PsTCP proteins range from 54.5 kDa (PsTCP4) to 21.87 kDa (PsTCP17). This significant variation in molecular weight suggests that the PsTCP protein family may be involved in diverse biological functions, reflecting structural and functional heterogeneity. The isoelectric points (pI) of the proteins range from 5.88 (PsTCP19) to 9.51 (PsTCP20). Among them, 9 proteins exhibit weak acidity (pI < 7), while the remaining 12 are alkaline (pI > 7), indicating that the TCP family may participate in regulatory processes adapted to various pH environments.
All members of this family are predicted to be unstable (instability index > 40), ranging from 44.14 (PsTCP2) to 71.17 (PsTCP17), suggesting that these proteins may rely on interactions with other molecules or complexes to maintain functional stability in vivo. The aliphatic index (AI) of PsTCP proteins ranges from 51.73 (PsTCP21) to 85.26 (PsTCP2), with an average of 61.01. Twelve family members exhibit low thermal stability (AI < 60), while the remaining 9 display moderate thermal stability (60 ≤ AI ≤ 90), indicating that the family proteins may have diverse adaptability to varying environmental temperature conditions.
Additionally, all PsTCP proteins exhibit high hydrophilicity (GRAVY < 0), indicating strong solubility in aqueous solutions and a propensity to interact with water molecules. This feature may enhance their functional accessibility within cellular environments. Subcellular localization analysis indicates that PsTCP9 is localized to the peroxisome, while the remaining 20 are localized to the nucleus. This distribution suggests that TCP proteins may perform distinct functions in specific subcellular environments, particularly emphasizing their roles in transcriptional regulation within the nucleus.
Chromosomal localization analysis revealed that the 21 PsTCP genes are unevenly distributed across the 7 chromosomes of pea (Supplementary Figure 1, Supplementary Table 1). Chromosome 4 the largest number of family members, with 5 genes (PsTCP9 to PsTCP13), while chromosomes 2 (PsTCP5) and 7 (PsTCP21) each contain only one member. Chromosomes 1 (PsTCP1 to PsTCP4) and 6 (PsTCP17 to PsTCP20) each include 4 members, whereas chromosomes 3 (PsTCP6 to PsTCP8) and 5 (PsTCP14 to PsTCP16) each carry 3 members.
2.2 Phylogenetic analysis and conserved motif characterization of the PsTCP gene family
To investigate the evolutionary relationship of the PsTCP family, a phylogenetic tree was constructed using the protein sequences of pea and A. thaliana (Figure 1A). Based on a multiple sequence alignment of 21 PsTCP and 24 AtTCP proteins, the TCP proteins from both species were classified into two classes and three subfamilies. Class I (PCF subfamily) includes 9 PsTCP (38%) and 13 AtTCP (54%) proteins. Class II is divided into two subgroups: the CYC/TB1 subfamily, which contains 3 PsTCP (19%) and 3 AtTCP (13%) proteins, and the CIN subfamily, which includes 9 PsTCP (43%) and 8 AtTCP (33%) proteins (Figures 1B, C).
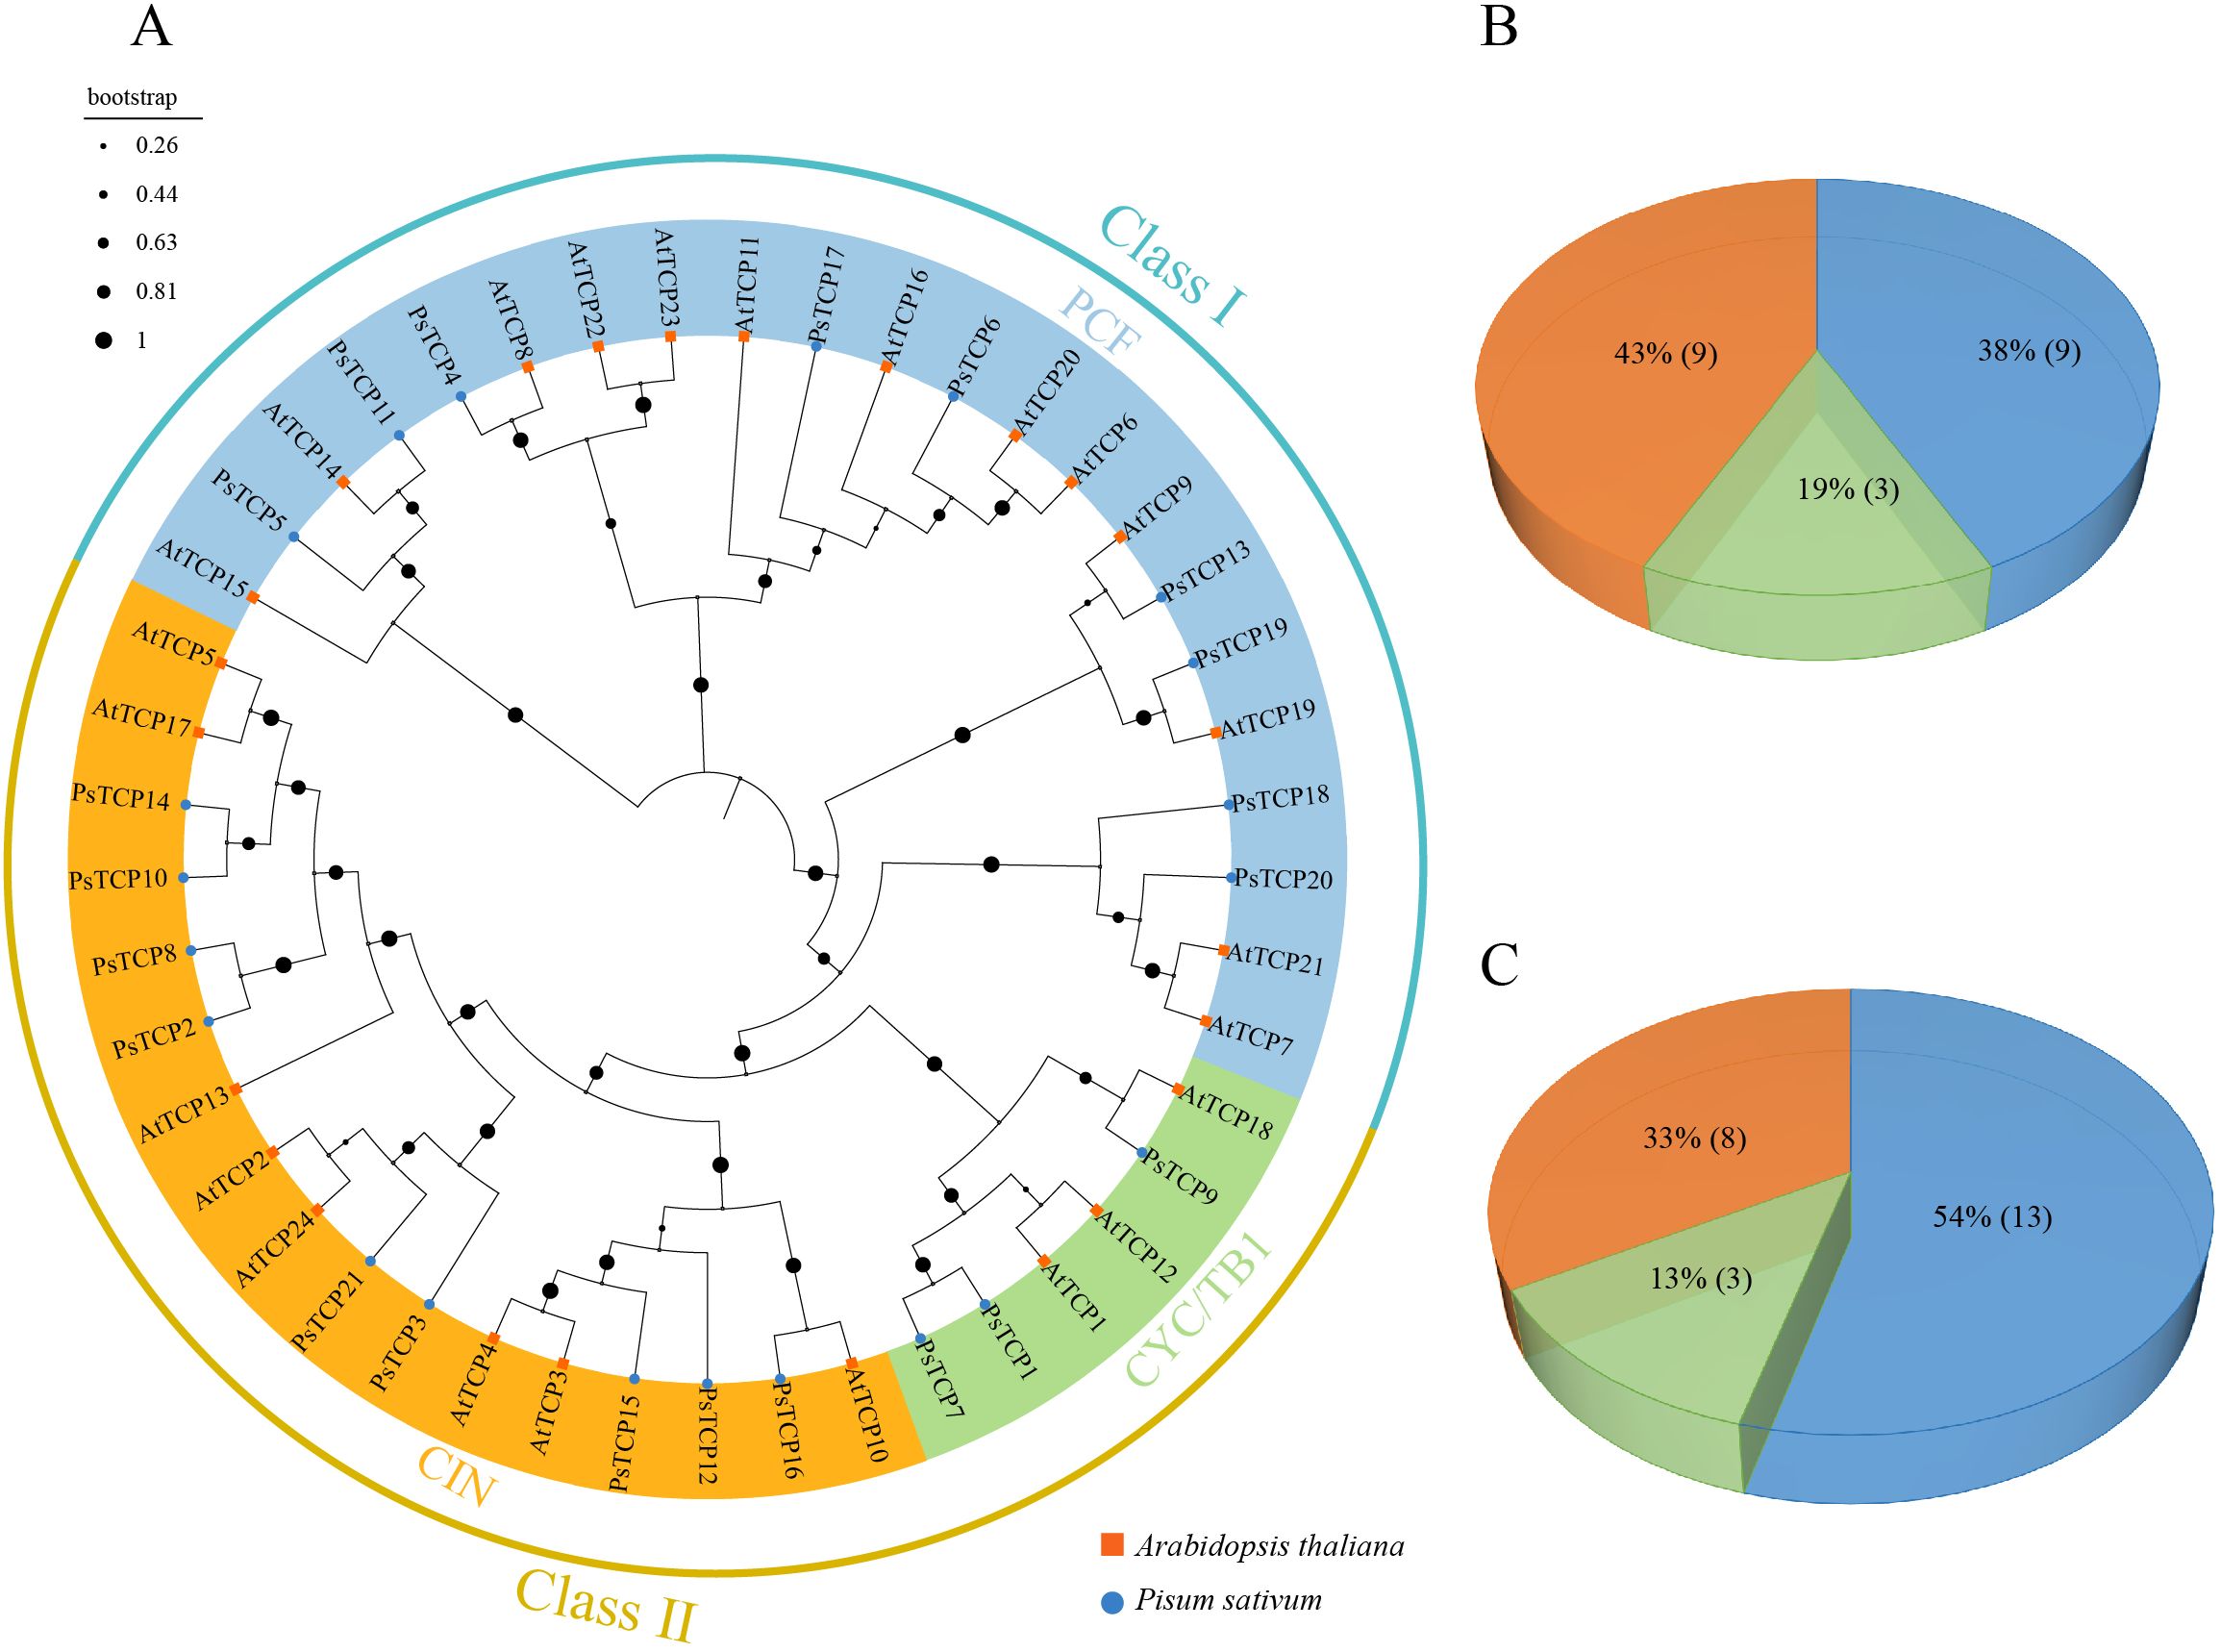
Figure 1. Phylogenetic analysis of TCP proteins. (A) The phylogenetic tree of PsTCP and AtTCP proteins, where blue circles represent pea TCP genes, and orange squares represent A. thaliana TCP genes. (B) The distribution of the three subfamilies in the PsTCP gene family. (C) The distribution of the three subfamilies in the AtTCP gene family. The colors in the figure represent the following: blue for the PCF subfamily, green for the CYC/TB1 subfamily, and orange for the CIN subfamily.
Analysis of the 21 PsTCP proteins revealed four conserved motifs across TCP proteins from different species: the base region, helix I, loop, and helix II, with high conservation was observed within the same subfamily (Figure 2). Class I TCP proteins lack four amino acids in the base region compared to Class II TCP proteins, leading to distinct DNA-binding specificities (Class I: GGNCCAC; Class II: GTGGNCCC). Despite these differences, structural conservation remains high, enabling clear differentiation between subfamilies. The base region exhibits the highest conservation, with key amino acids like lysine (K), aspartic acid (D), arginine (R), and histidine (H) being completely conserved. These residues are likely crucial for protein function, while the helix region shows moderate conservation and the loop region the least, suggesting a functional hierarchy among the motifs.
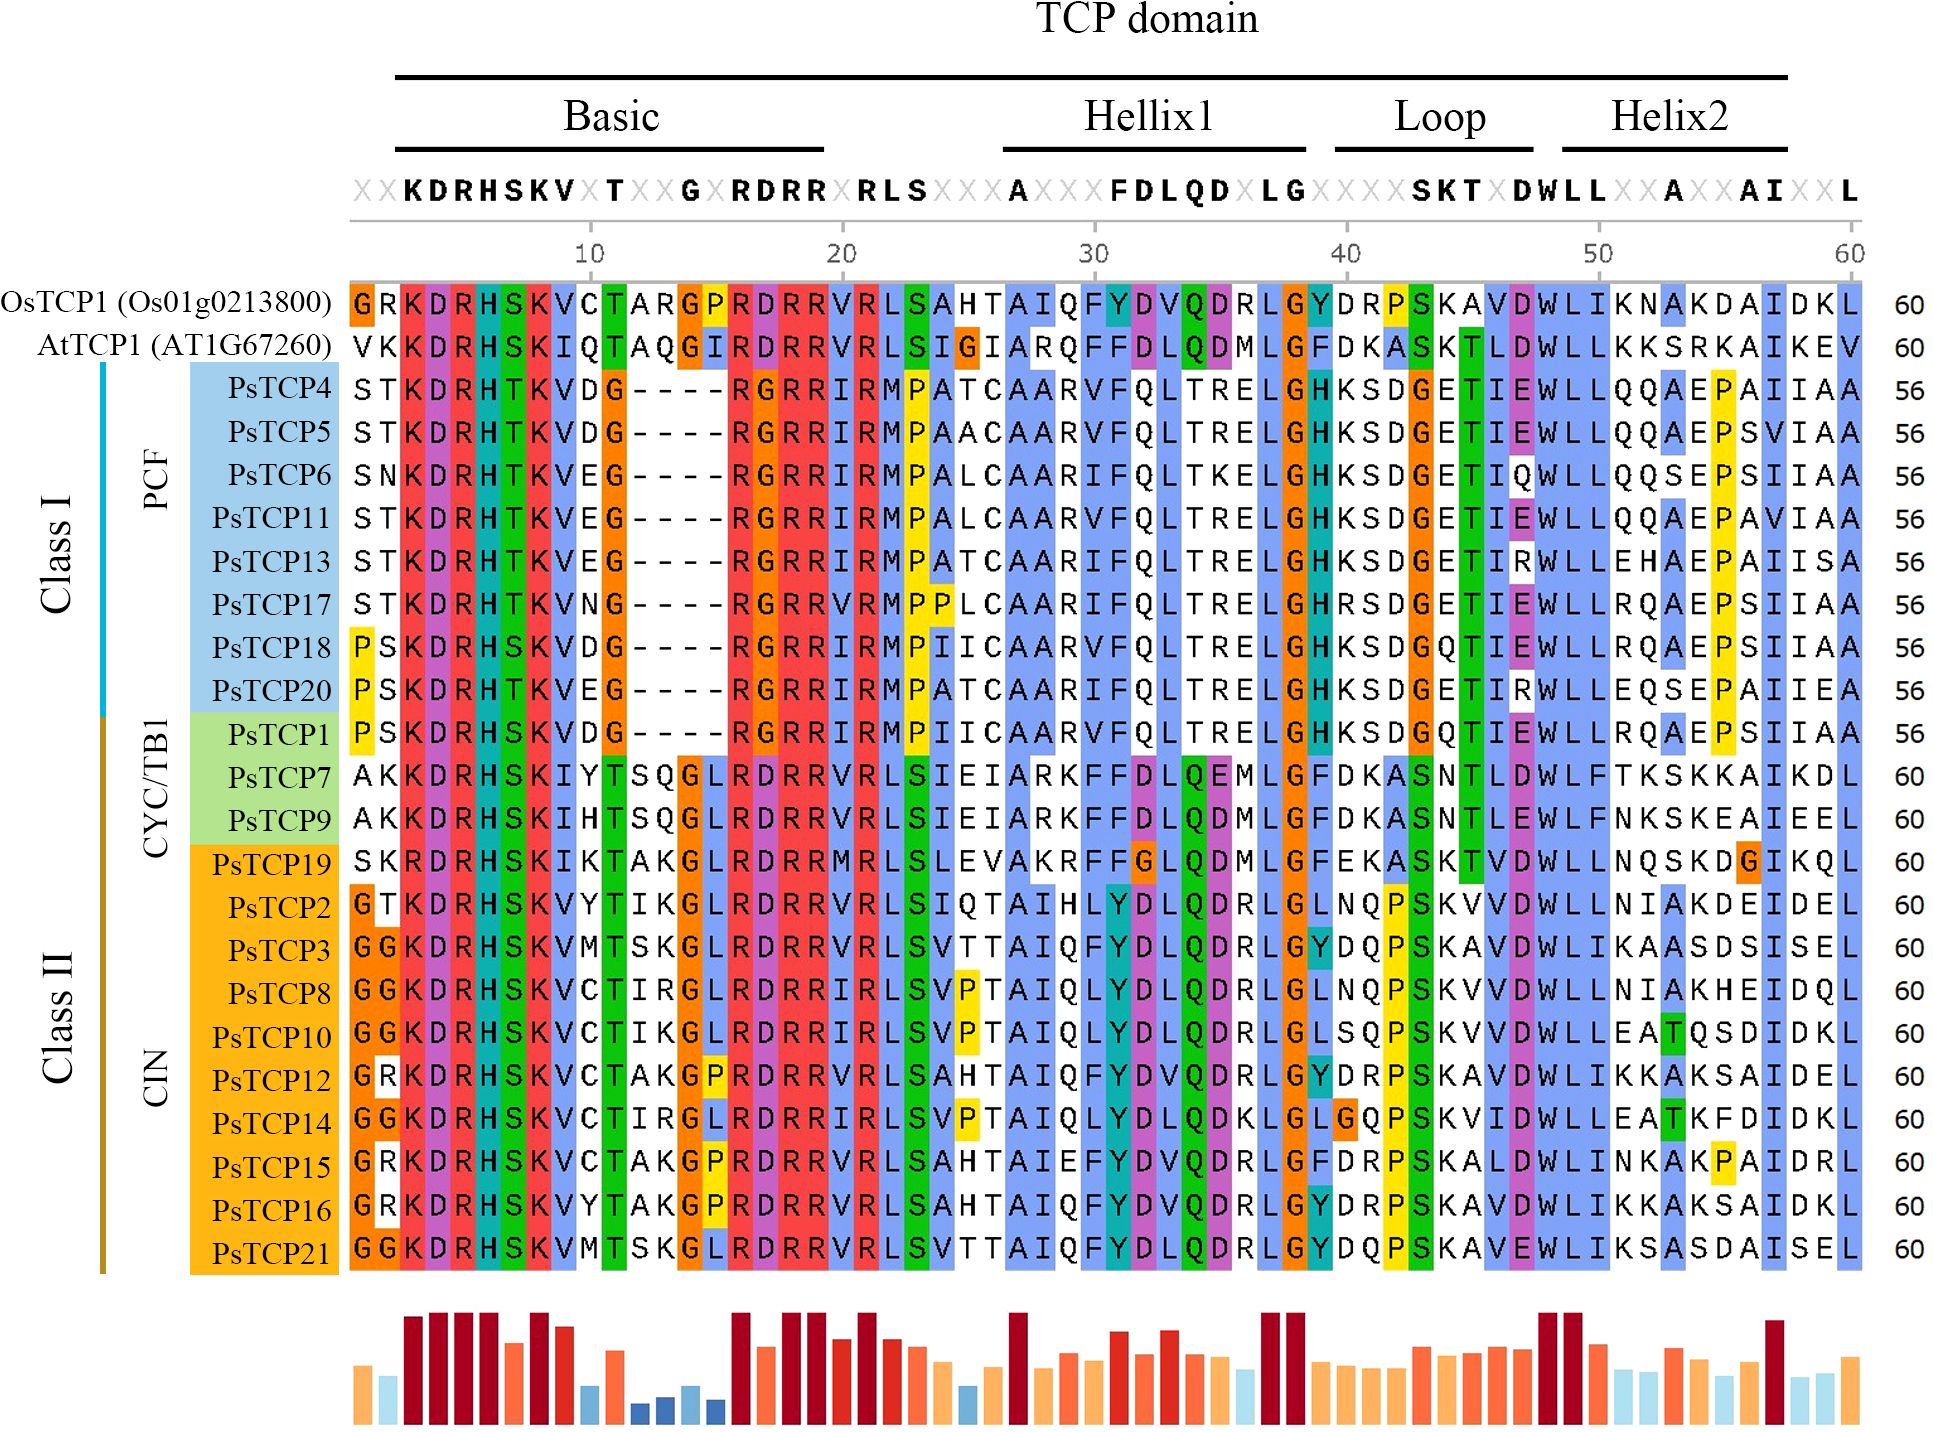
Figure 2. Domain multiple sequence alignment of PsTCP proteins. OsTCP1 represents the TCP protein from rice, and AtTCP1 represents the TCP protein from A. thaliana. The bar chart at the bottom indicates the level of sequence conservation, with longer red bars representing higher conservation and shorter blue bars indicating lower conservation.
2.3 Structural analysis of the PsTCP transcription factor family proteins
The three-dimensional structures of all PsTCP family proteins were predicted using AlphaFold3, and the results were visualized with color-coded confidence levels to indicate the reliability of the structural models (Supplementary Figure 2). The α-helix regions consistently demonstrated the highest prediction confidence across all analyzed proteins, reflecting their structural stability and evolutionary conservation within functional domains.
We further analyzed the conserved motif sequences and identified 10 conserved motifs, named motifs 1 to 10 (Figure 3A). The results indicate that these motifs exhibit a certain degree of conservation across different subfamilies. All PsTCP family members contain motif 1, suggesting that this motif is highly conserved in PsTCP proteins and may be closely related to the fundamental functions of the family. Motif 2 is present in all CIN subfamily members and is located at the N-terminal of the protein, which could be a distinguishing feature of the CIN subfamily compared to other subfamilies. This motif may be related to its role in specific biological processes, such as flower development and embryo development (Rath et al., 2022). Motif 5 is found only in a subset of members of the PCF subfamily, while motif 7 is present only in certain members of the CYC/TB1 subfamily. The presence of these specific motifs suggests structural differences among members of the different PsTCP subfamilies, reflecting potential functional diversity. These structural specificities provide important clues for further research into the function, evolution, and potential roles of PsTCP family members in plant growth, development, and stress responses.
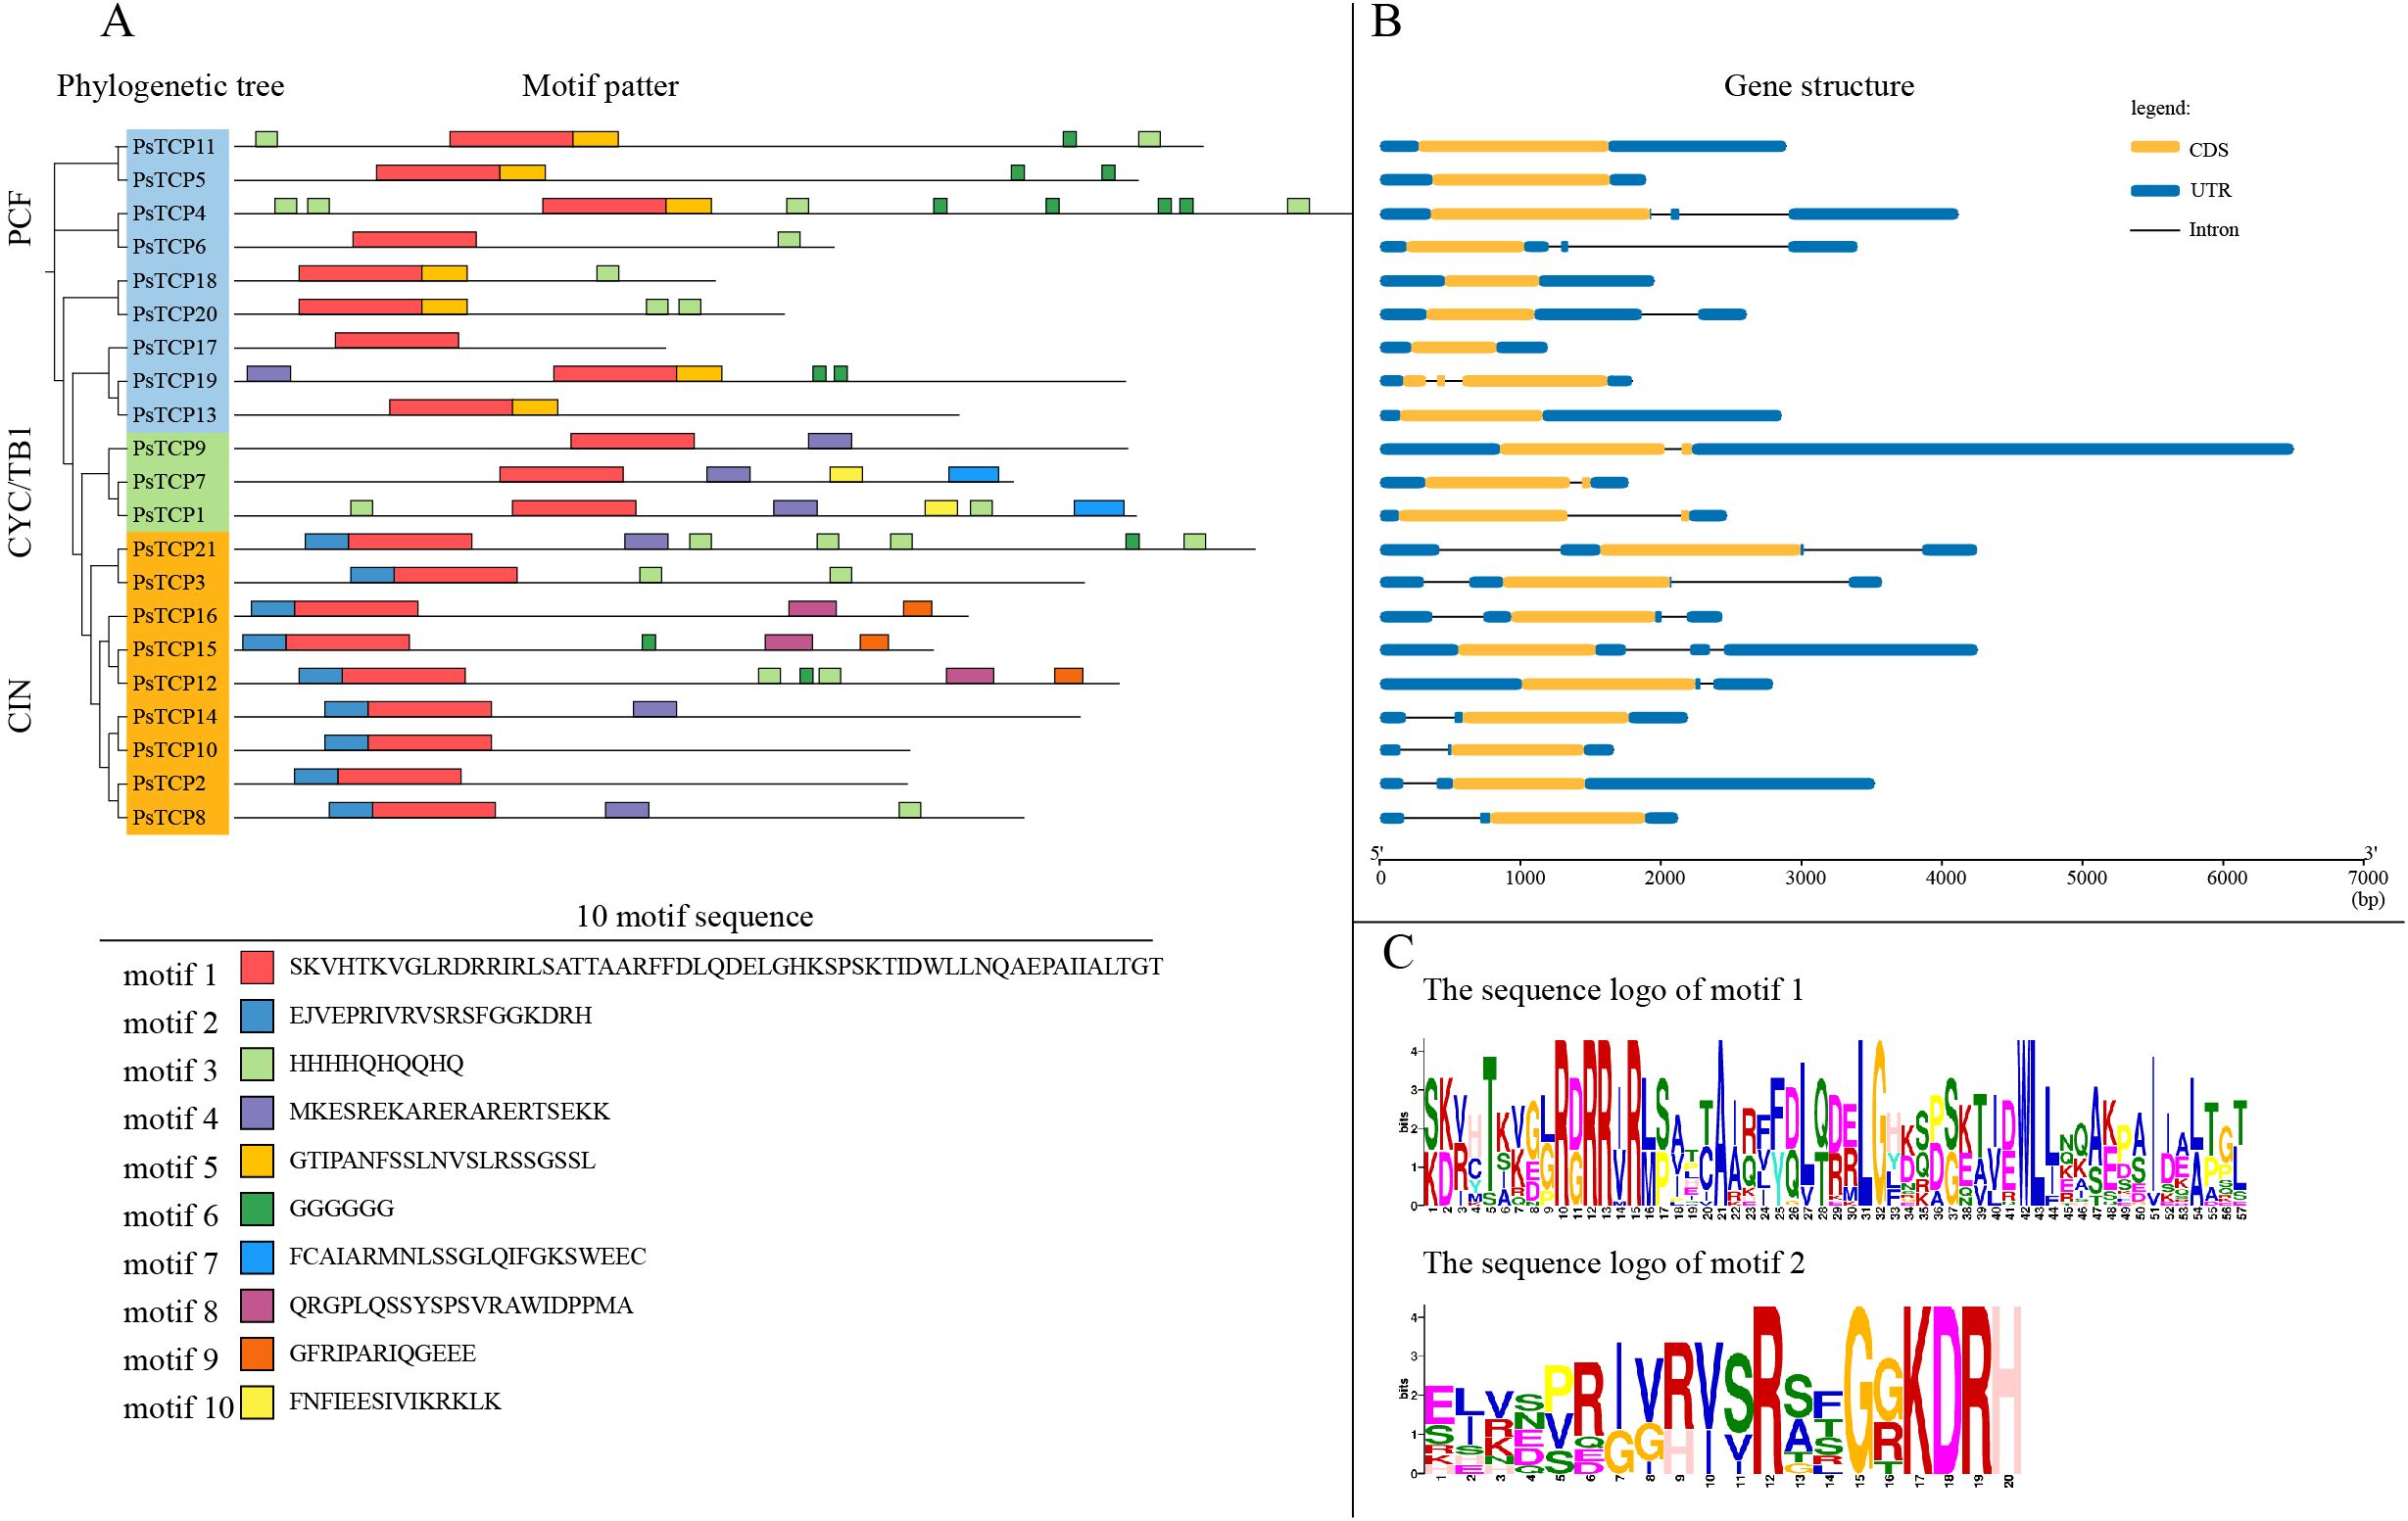
Figure 3. Conserved domains, motif analysis, and gene structure analysis of PsTCP genes. (A) The phylogenetic tree of PsTCP and the distribution of 10 motifs, with motifs 1 to 10 represented by rectangles in different colors. (B) The gene structure of PsTCP, where orange boxes represent coding sequences (CDS) black lines represent introns, and blue boxes represent the 5’ and 3’ untranslated regions. (C) The sequence identification of motifs 1 and 2, with colored letters representing the specific amino acid sequences of the motifs.
Additionally, we analyzed the gene structure of the PsTCP family (Figure 3C). The results revealed that PsTCP11, PsTCP5, PsTCP18, PsTCP17 and PsTCP13 lack intronic regions, which may be related to certain mechanisms in genome evolution, such as the activity of transposons (Venner et al., 2009). Transposons are mobile genetic elements that can insert themselves at different locations in the genome.
2.4 Synteny analysis and selective pressure evaluation of the PsTCP gene family
Synteny analysis revealed that the 21 PsTCP genes are unevenly distributed across 7 chromosomes in the pea genome (Figure 4; Supplementary Figure 1). Among the 2,711 syntenic events identified (Supplementary Table 2; Figure 4), four PsTCP gene pairs-PsTCP10-PsTCP14, PsTCP13-PsTCP19, PsTCP1-PsTCP7, and PsTCP5-PsTCP11-underwent segmental duplication (Table 1; Figure 4). Notably, no duplication events were observed for other PsTCP family members, indicating that segmental duplications are limited to a small subset of genes.
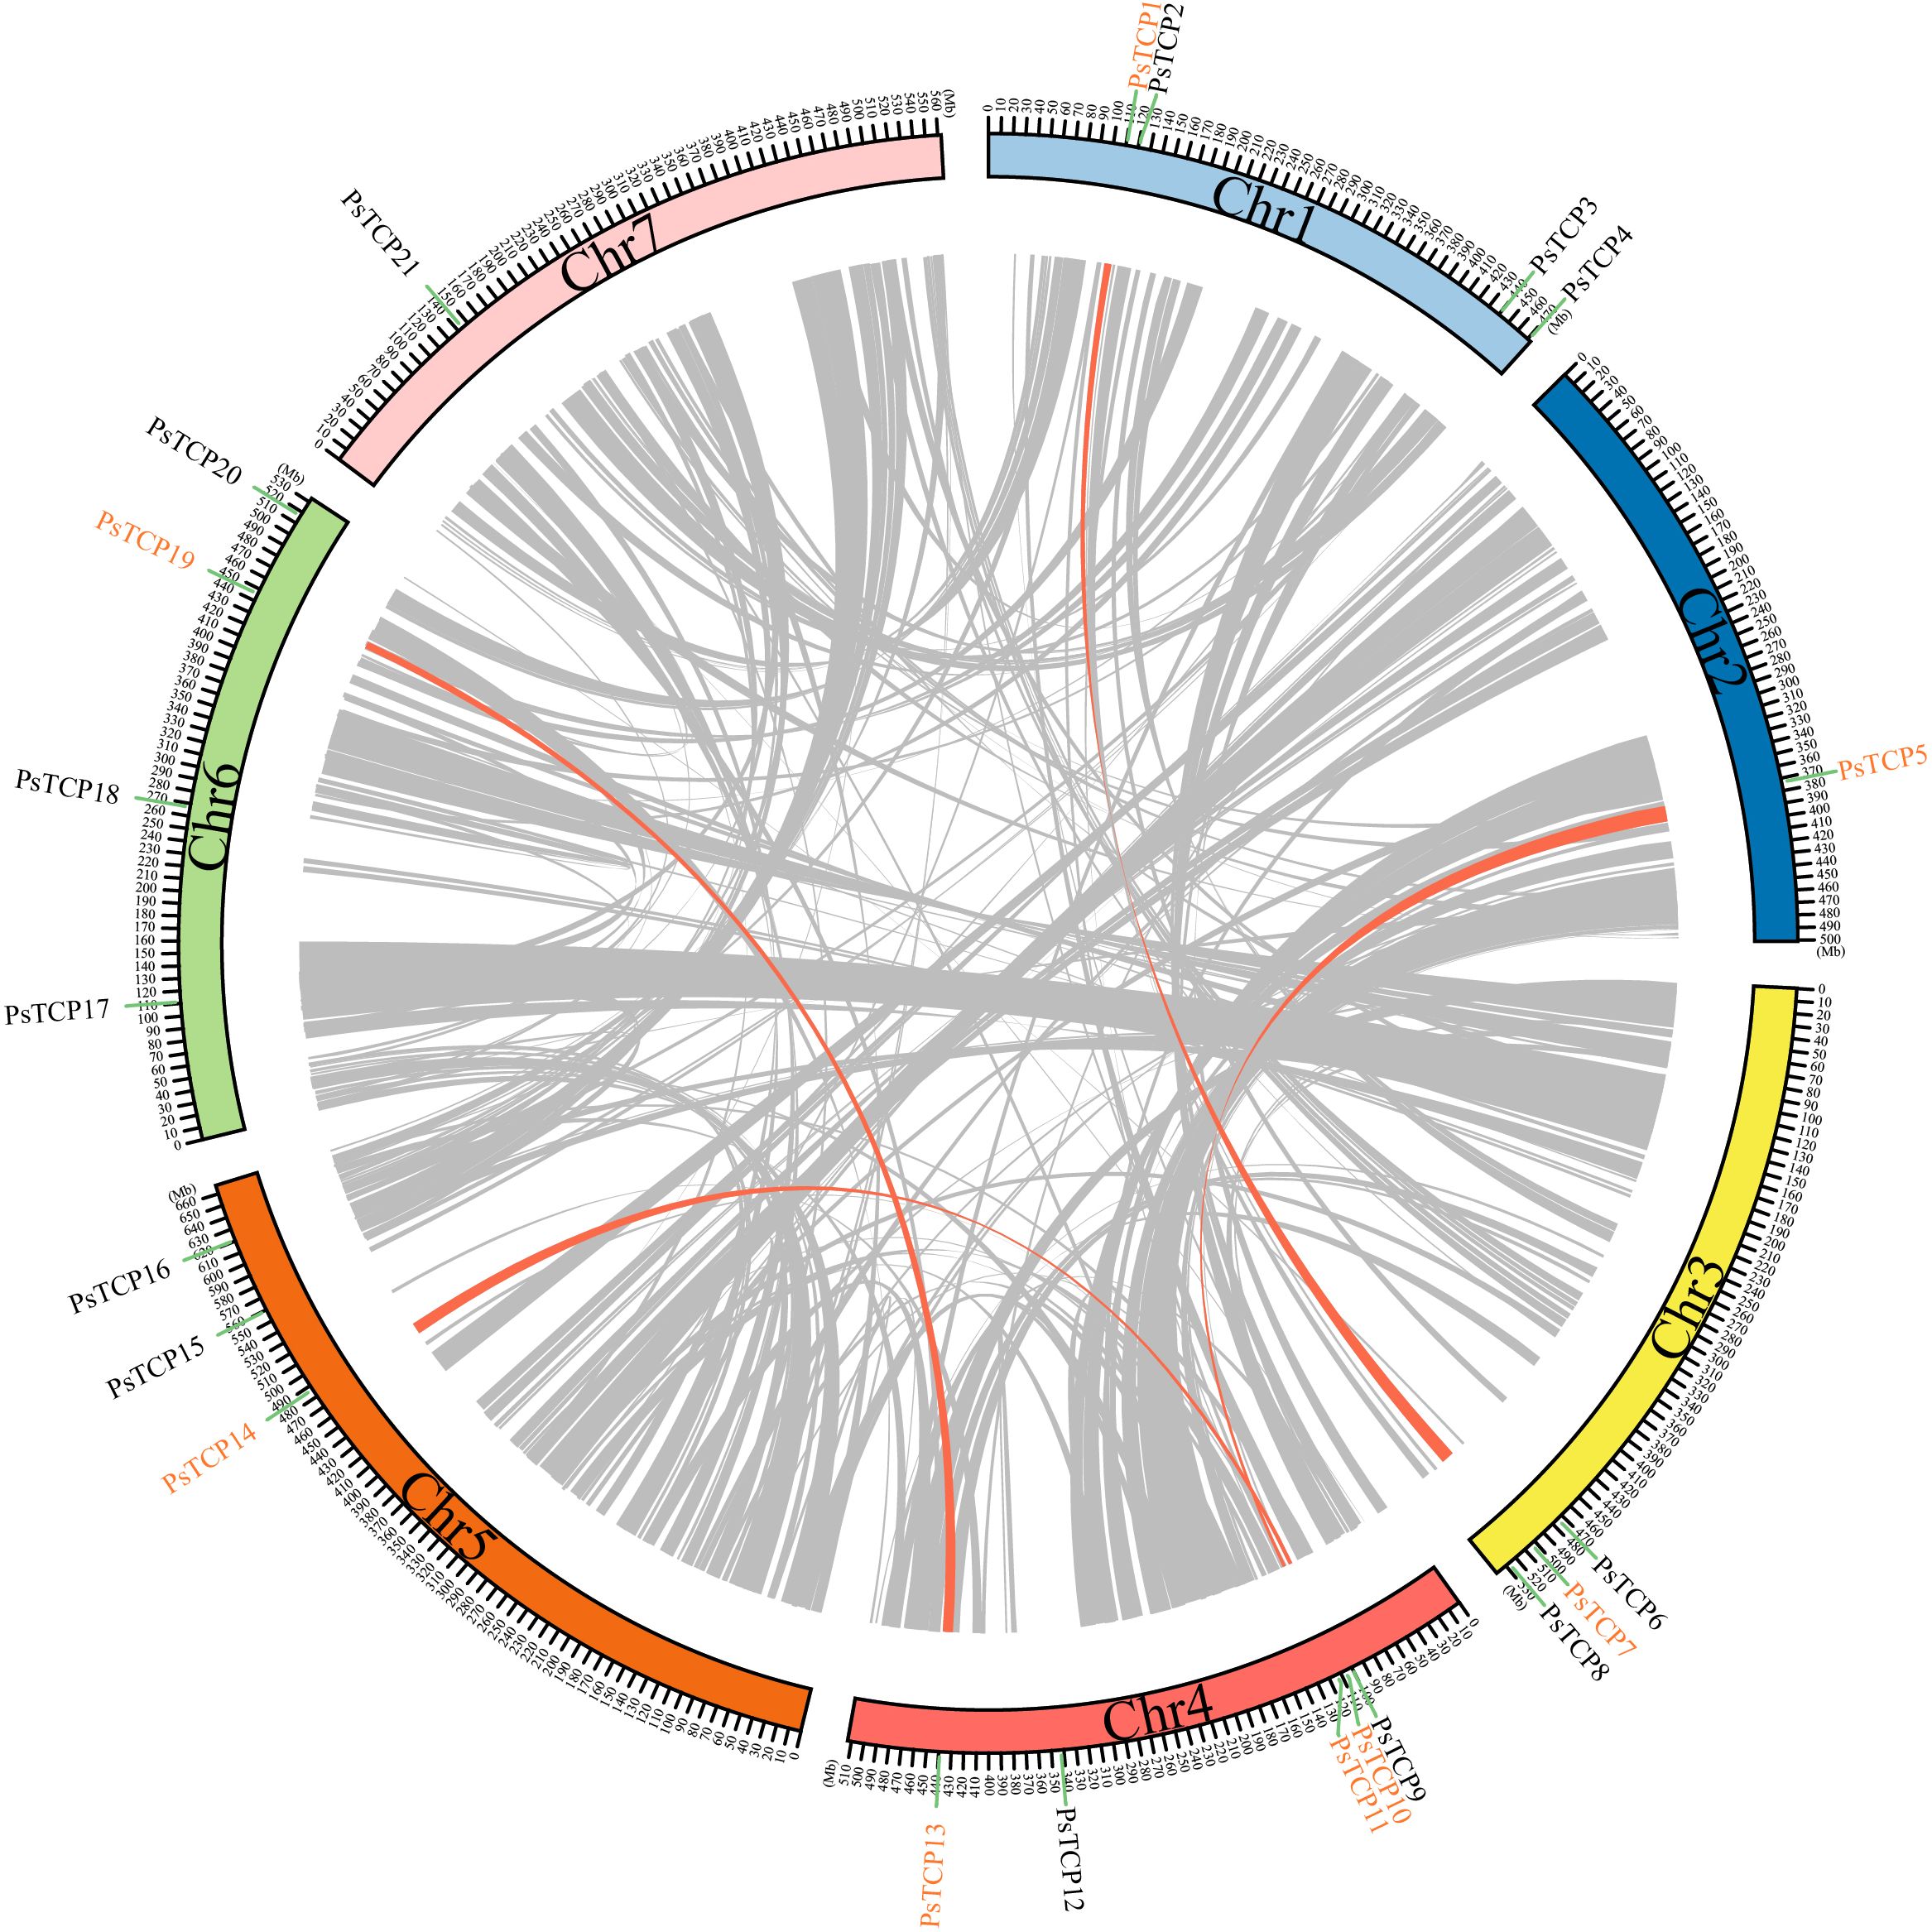
Figure 4. Genomic distribution, duplication events, and synteny analysis of PsTCP genes. The figure displays the synteny analysis of the PsTCP gene family in pea, where gray lines represent syntenic regions in the pea genome, and orange lines indicate duplicated PsTCP gene pairs. Genes marked in orange represent PsTCP genes with duplication events. Chromosome numbers are labeled within the boxes for each chromosome.
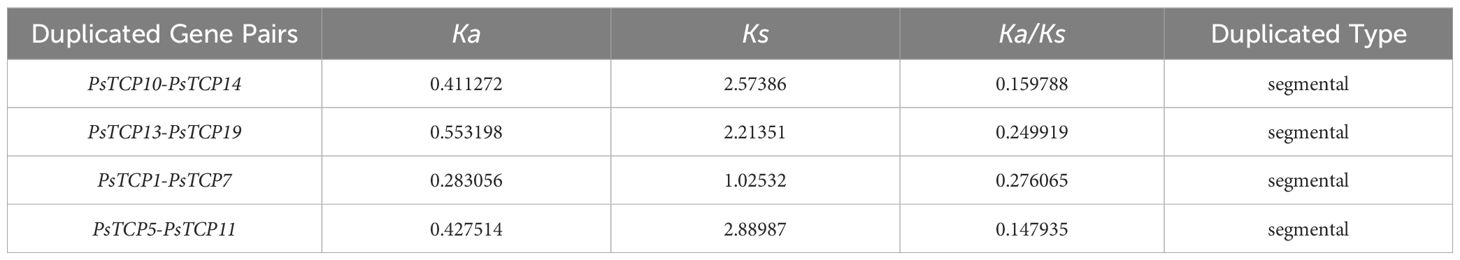
Table 1. Ka, Ks, and Ka/Ks of duplicated gene pairs of PsTCP family genes.
The Ka/Ks (Non-Synonymous/Synonymous) ratio is a critical indicator for assessing selective pressure on protein-coding genes. Our analysis revealed that the Ka/Ks ratios of all duplicated PsTCP gene pairs are below 0.3 (Table 1), indicating that these gene pairs have undergone purifying selection during evolution. Among the analyzed pairs, PsTCP1-PsTCP7 exhibited the highest Ka/Ks ratio (0.276065), while PsTCP5-PsTCP11 showed the lowest ratio (0.147935). This variation in Ka/Ks ratios suggests differences in the intensity of purifying selection across gene pairs, potentially reflecting subtle variations in evolutionary constraints or functional divergence within the PsTCP gene family.
To explore the evolutionary relationships of the PsTCP gene family across different species, we conducted a synteny analysis between pea, the monocot rice, and the dicot A. thaliana (Supplementary Figure 3A). The results showed that pea and A. thaliana (dicot) shared a stronger gene synteny, with 338 pairs of syntenic genes, including 10 pairs of PsTCP genes. In contrast, the synteny between pea and rice (monocot) was weaker, with only 193 pairs of syntenic genes, and of which only four pairs were related to the PsTCP gene family. The synteny between A. thaliana and rice was the weakest, with only 150 pairs of syntenic genes, and 3 pairs related to the PsTCP gene family. This pattern reflects the genetic conservation between dicots, suggesting that dicots may have retained more shared genetic features during evolution, resulting in higher similarity in gene structure and function between these species. On the other hand, the significant differences in genome structure and evolutionary paths between monocots (rice) and dicots (such as pea and A. thaliana) reflect the early divergence of these species, leading to weaker synteny of the PsTCP gene family between them. These synteny results not only provide important insights into the evolutionary history of the PsTCP gene family across species but also help reveal the dynamics of gene amplification and independent evolution.
The Ka/Ks analysis further supports these findings (Supplementary Figure 3B). The lower Ka/Ks ratios between pea and A. thaliana compared to those between pea and rice indicate stronger purifying selection among dicots, which may contribute to the preservation of essential genetic functions. The higher Ka/Ks values observed between monocots and dicots underscore their more distinct evolutionary trajectories, shaped by genome divergence and lineage-specific adaptations.
2.5 Analysis of cis-regulatory elements in the promoter regions of PsTCP genes
To gain deeper insight into the transcriptional regulatory mechanisms of the PsTCP gene family, we analyzed the cis-regulatory elements in the upstream 2000 bp sequence of its promoter regions. Using the PlantCARE database, we analyzed the promoter sequences of 21 PsTCP genes and identified 37 cis-regulatory elements, which were classified into three main functional categories: plant growth and development (45.9%, 17 elements), phytohormone responsive (27%, 10 elements), and abiotic and biotic stress responses (27%, 10 elements) (Figure 5A). This distribution reveals that the PsTCP gene family may respond to a variety of physiological needs during different biological processes through different cis-regulatory elements.
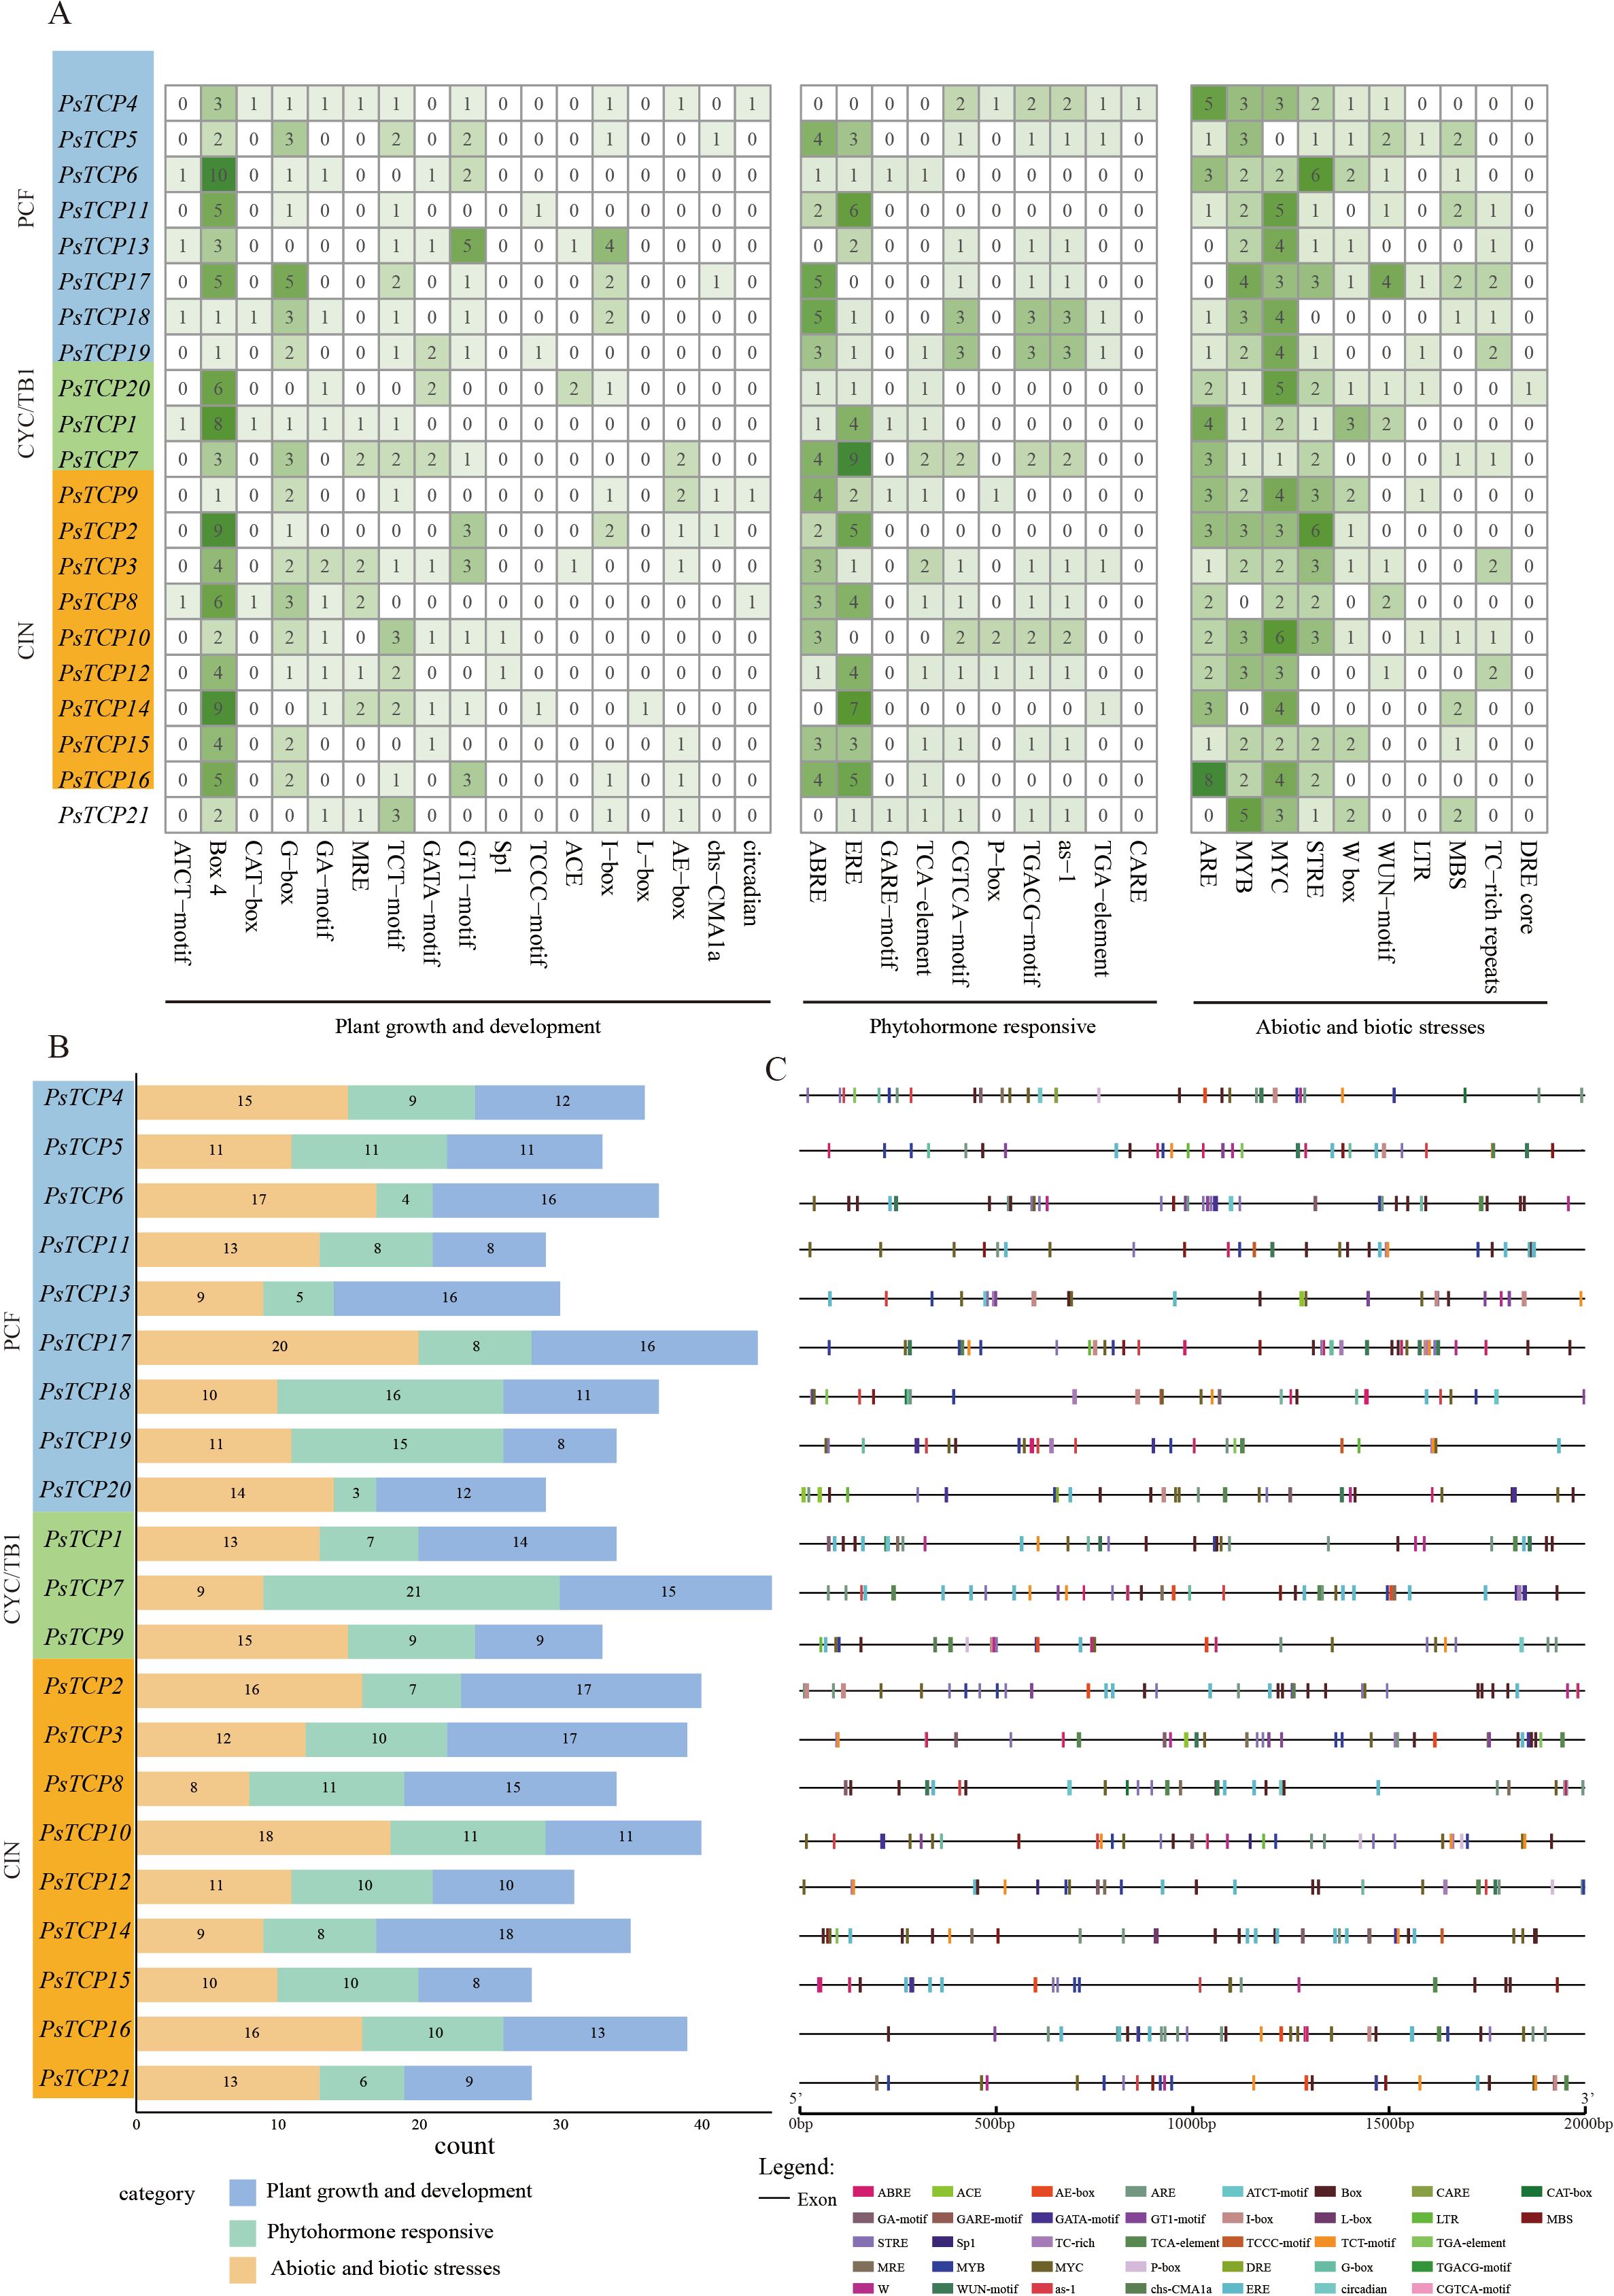
Figure 5. Cis-regulatory element analysis of the PsTCP gene promoter regions. The 2000 bp upstream sequences of each PsTCP family gene were extracted as promoter regions, and cis-regulatory elements were predicted using the PlantCARE database. Based on their functions related to plant growth and development, phytohormone responsive, and abiotic and biotic stress responses, the cis-regulatory elements were classified into three major categories. (A) A heatmap showing the number of functional cis-regulatory elements in each PsTCP gene across the three subfamilies. The darker the color, the higher the number of elements; (B) Statistical analysis of the number of cis-regulatory elements in each PsTCP gene, categorized by function: plant growth and development, phytohormone responsive, and abiotic and biotic stress response; (C) Specific distribution of cis-regulatory elements in the promoter regions.
The number of functional cis-regulatory elements varies among different genes. For example, PsTCP7 contains the highest number of functional cis-regulatory elements (45 elements), while PsTCP15 contains the fewest (28 elements). This suggests that differences in the number of cis-regulatory elements may reflect the different functional needs of the genes under various physiological conditions. For instance, PsTCP2 and PsTCP3 contain the highest number of plant growth and development-related cis-regulatory elements (17 elements each), while PsTCP15, PsTCP11, and PsTCP19 contains the fewest (8 elements). Similarly, PsTCP7 contains the most phytohormone responsive cis-regulatory elements (21 elements), while PsTCP20 contains the fewest (only 3 elements). For abiotic and biotic stress responses, PsTCP17 contains the most cis-regulatory elements (20 elements), while PsTCP8 contains the fewest (8 elements) (Figure 5B).
2.6 Protein-protein interaction network of the PsTCP gene family
To further investigate the potential functions of the PsTCP gene family in pea, we predicted their protein-protein interaction (PPI) networks (Supplementary Figure 4). Among the 21 PsTCP family members, 16 genes were grouped into two distinct interaction modules, while PsTCP2, PsTCP3, PsTCP10, PsTCP11, and PsTCP12 did not form interactions with other PsTCP genes. These non-interacting genes may engage in regulatory relationships with genes outside the PsTCP family.
The first module consisted of 13 PsTCP genes, with PsTCP5, PsTCP14, and PsTCP13 exhibiting the highest connectivity, suggesting their central roles in the network. The second module included only three genes, connected through PsTCP15 as the core node. These two modules highlight the existence of subfamily-specific functional units within the PsTCP gene family, which may reflect distinct roles in pea growth and stress response pathways. High-connectivity genes, such as PsTCP5, PsTCP14, and PsTCP13, likely act as regulatory hubs that mediate intra-family interactions and may also participate in broader signaling pathways. Previous studies have shown that hub genes often play critical roles in maintaining network stability and facilitating adaptive responses to environmental stresses (Deng et al., 2018). These findings provide new insights into the structural and functional organization of the PsTCP gene family, suggesting diverse roles in pea development and stress adaptation.
2.7 The expression pattern of the PsTCP gene family in different tissues of pea
To investigate the tissue-specific expression patterns of PsTCP genes, RNA-seq analysis was performed on 11 tissues from two pea varieties: Zhongwan 6 and Yunwan127. Zhongwan 6 tissues included white flower (WF), normal stipule (NS), root (R), green pod (GP), stem (S), fresh seed (FS), tendril (T), and imparipinnate leaf (IL), while Yunwan127 tissues included light purple vexilla (LPV), dark purple wing (DPW), and purple pod (PP). The Yunwan127 variety was selected due to its distinctive purple pigmentation in flowers and pods. After stringent quality control, all samples met the established criteria, yielding a total of 149.11 Gb of high-quality sequencing data (Supplementary Table 3). The RNA-seq reads were aligned to the reference genome, and expression profiles of PsTCP genes were obtained (Supplementary Table 6). The expression patterns of the PsTCP family across tissues were visualized (Supplementary Figure 6).
In the analysis, PsTCP15 was not detected in any tissue, which may indicate its activation under specific stress conditions, tissue-specific regulation, or potential issues such as gene annotation errors or insufficient sequencing depth. In contrast, PsTCP1 exhibited expression in both WF and LPV tissues, while PsTCP9 showed broad expression across multiple tissues, including R, S, T, LPV, WF, and DPW (Supplementary Figure 6).
These findings highlight the tissue-specific expression heterogeneity of the PsTCP gene family, suggesting their diverse roles in plant growth, development, and stress responses. For example, certain PsTCP genes may regulate developmental processes in specific tissues, while others may modulate responses to environmental stimuli or hormonal signals. The tissue-specific expression patterns provide valuable insights into the functional diversification of PsTCP genes and offer potential targets for improving stress tolerance, such as salt resistance, in pea varieties.
2.8 Expression pattern of the PsTCP gene family under salt stress
To investigate the function of the PsTCP gene family under salt stress, we designed two experimental sets. The first set involved treating plants with different concentrations of NaCl (T0: 0 mM NaCl, T30: 30 mM NaCl, T60: 60 mM NaCl, T90: 90 mM NaCl, T120: 120 mM NaCl) for 3 days. The second set used 100 mM NaCl treatment at different time points (0 hours: H0, 1 hour: H1, 3 hours: H3, 6 hours: H6, 12 hours: H12, 24 hours: H24, 48 hours: H48). Each experiment included three biological replicates.After quality control of the sequencing data, all samples met the established criteria, yielding a total of 159.42G of high-quality data (Supplementary Table 3). These data were aligned to the reference genome to obtain expression data for the PsTCP genes (Figure 6; Supplementary Figure 5; Supplementary Tables 4, 5). Among the 21 PsTCP genes, 18 showed expression in pea leaves, with a TMM value greater than 1 (Figure 6B; Supplementary Figure 5B), with PsTCP13 and PsTCP21 exhibiting higher expression levels, while PsTCP7 and PsTCP10 showed lower expression levels (Figure 6). In the experiments with different NaCl concentrations, the expression levels of PsTCP19 and PsTCP8 increased with rising NaCl concentrations, suggesting that these two genes have a positive response to salt stress and may play a promotive role in the early stages of salt stress. In contrast, the expression of PsTCP4, PsTCP18, PsTCP20, and PsTCP12 decreased with increasing NaCl concentrations, indicating that these genes might be suppressed under high salt stress, potentially due to their negative regulatory role in salt stress (Figure 6).
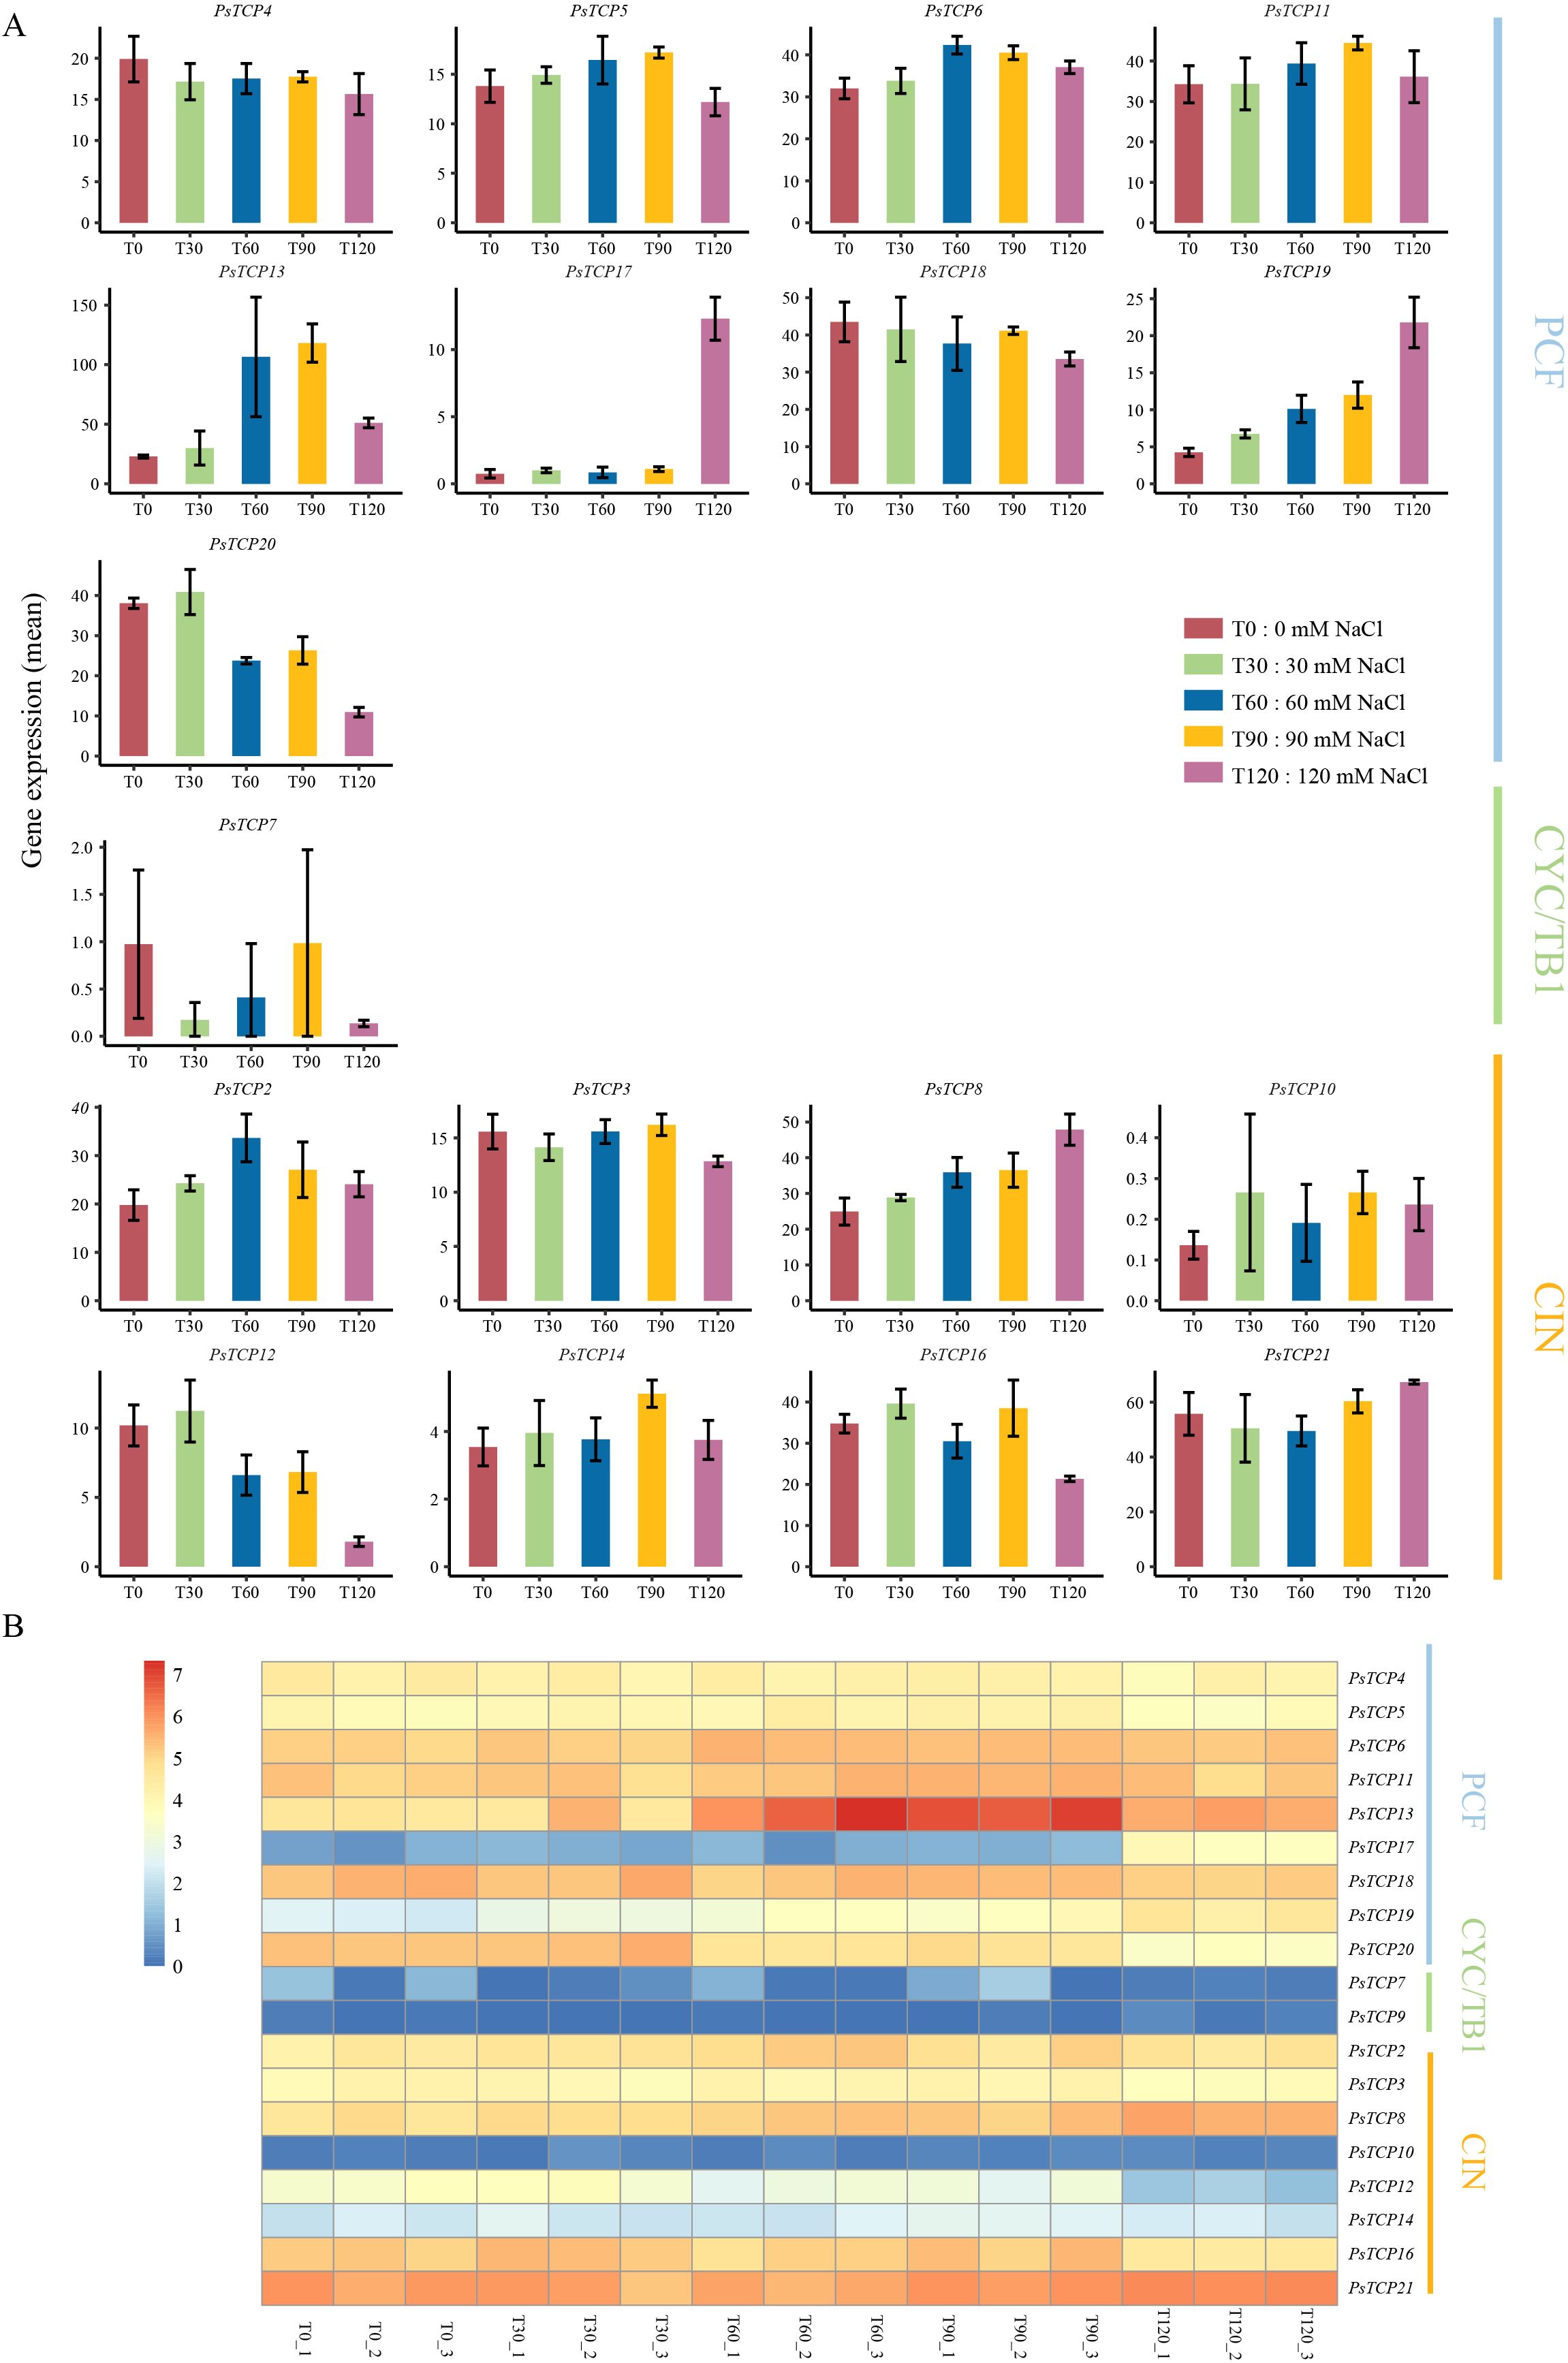
Figure 6. Expression profiles of PsTCP genes under different NaCl concentrations. (A) Bar chart showing the expression levels. Gene names are labeled above each subplot. The x-axis represents the expression levels, and the y-axis represents different treatment groups. The bar chart displays the average expression levels of the samples in each treatment group, with error bars representing the standard deviation (SD). (B) Heatmap of expression levels. Red indicates high expression, while blue indicates low expression. Gene names are shown on the right side of the heatmap, and treatment samples are displayed below. The classification of the three subfamilies is labeled on the right. Genes with expression levels below 1 in all treatments have been filtered out.
Further analysis demonstrated that under salt stress conditions, multiple TCP genes in pea exhibited diverse expression trends. Specifically, the expression levels of PsTCP5, PsTCP6, PsTCP11, PsTCP13, PsTCP2 and PsTCP14 initially showed an upward trend as the NaCl concentration gradually increased. After reaching a certain peak value, they turned to a downward trend, presenting an overall dynamic change pattern of first rising and then falling. In contrast, the expression level change trend of PsTCP21 was exactly the opposite. As the NaCl concentration increased, the expression level of this gene first decreased. When the concentration continued to increase to a certain stage, its expression level then increased instead, showing a unique change pattern of first falling and then rising (Figure 6). Notably, PsTCP17 showed a significant increase in expression under high salt concentration (120 mM NaCl), suggesting that it may play a special regulatory role under extreme salt stress conditions, possibly involved in a stronger stress response mechanism that helps the plant adapt to severe salt stress environments (Figure 6). After the 100 mM NaCl treatment, the expression levels of PsTCP5, PsTCP11, PsTCP13, PsTCP3, PsTCP10, and PsTCP16 showed a pattern of initial increase followed by a decrease over the time course (0–48 hours). In contrast, the expression levels of PsTCP18 and PsTCP7 exhibited a decrease followed by an increase (Supplementary Figure 5). Notably, PsTCP17 showed a significant increase in expression after prolonged salt stress, and its expression pattern was similar to the trend observed under different NaCl concentrations (Supplementary Figure 5). These findings highlight the significant role of the PsTCP gene family in the adaptive responses of pea to salt stress. The distinct expression patterns observed among PsTCP genes suggest their involvement in key regulatory mechanisms that enable the plant to cope with varying salt conditions. This study provides important insights into the molecular functions of PsTCP genes under salt stress and identifies potential genetic targets for breeding salt-tolerant pea varieties.
2.9 The regulatory network and functional analysis of the PsTCP gene family in response to salt stress in pea
To further investigate the critical role of PsTCP genes in pea salt tolerance, we constructed a WGCNA network based on transcriptome data from pea plants treated with different concentrations of NaCl. PsTCP genes were distributed across nine co-expression modules (Supplementary Table S7), with the blue module containing the highest number of PsTCP genes (six genes) (Figure 7B; Supplementary Table 7). This module showed a strong correlation (r = 0.92, p = 2e−06) with different salt treatments, making it the focus of our analysis. The blue module consisted of 5,960 co-expressed genes (Supplementary Table S8). By comprehensively analyzing the expression patterns of these genes (Figure 7A), the co-expression network (Figure 7B), and functional enrichment results (Figure 7C), we identified the central role of PsTCP genes within the network and their potential regulatory functions under salt stress.
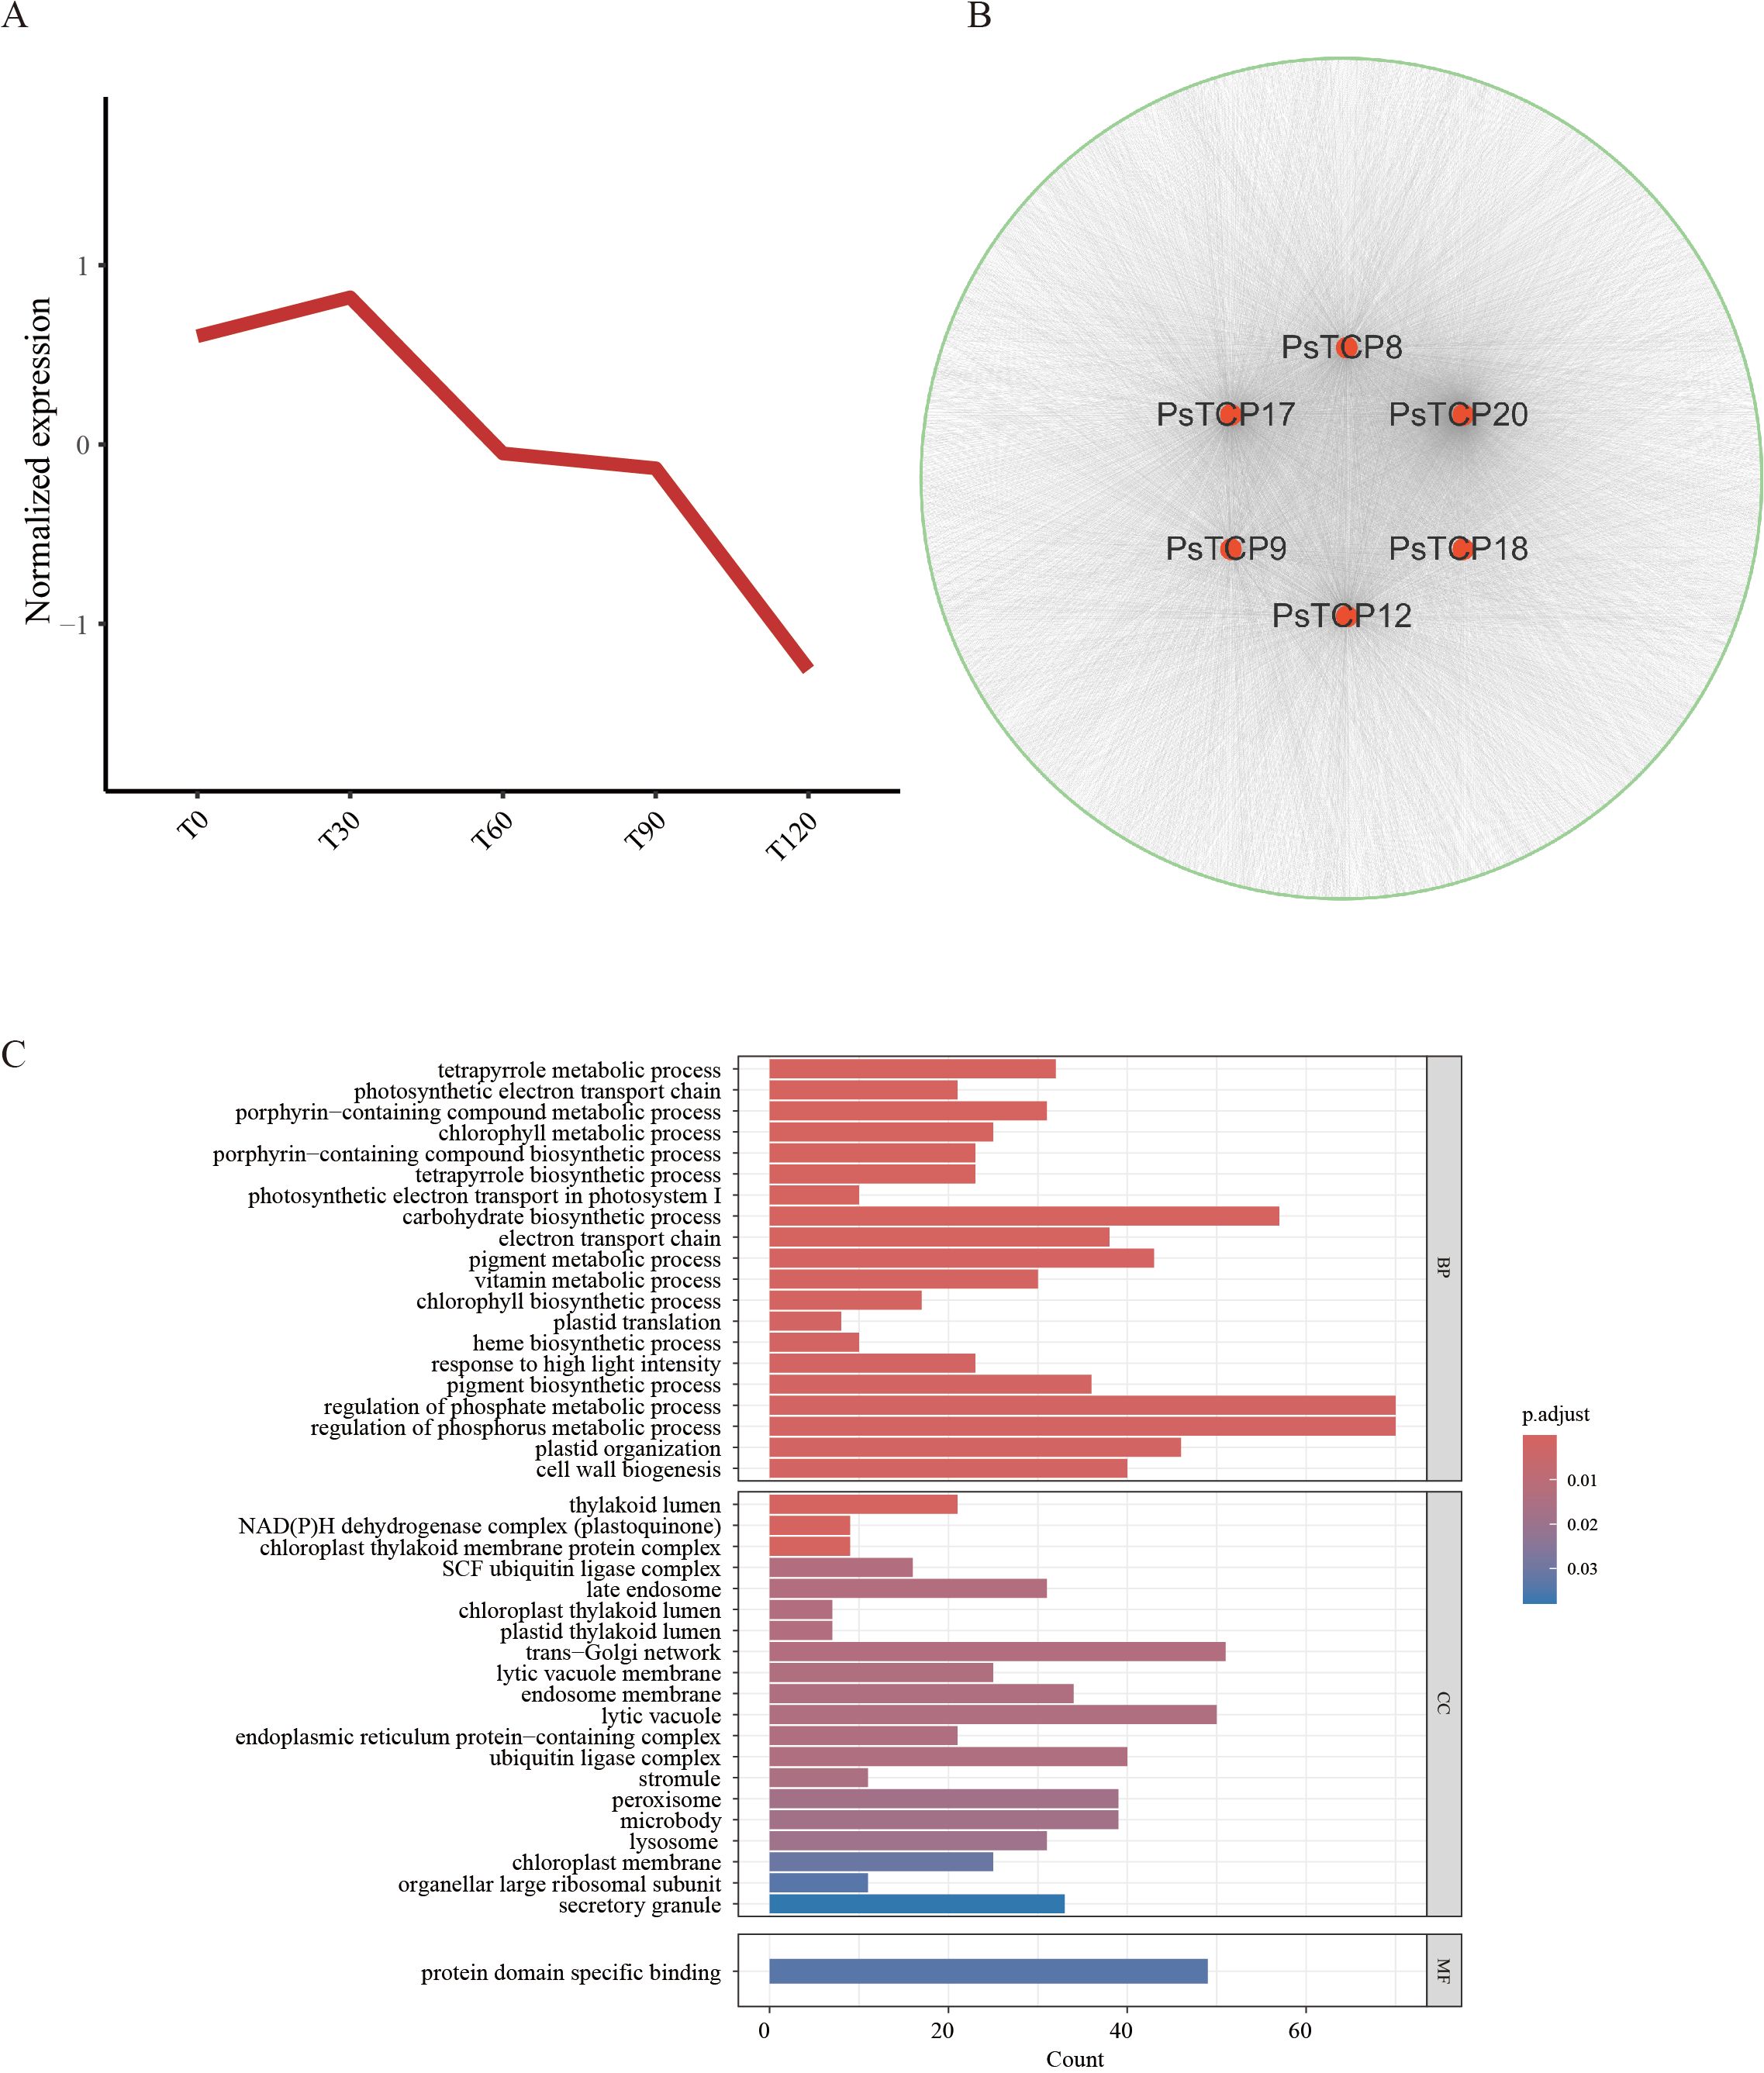
Figure 7. WGCNA and GO enrichment analysis (A) Expression patterns of genes in the blue module. (B) Co-expression network of PsTCP family genes in the blue module, where red nodes represent PsTCP family genes, green nodes represent other module genes co-expressed with PsTCP genes, and gray lines indicate co-expression relationships between genes. (C) GO functional enrichment analysis of genes co-expressed with PsTCP family genes in the blue module.
GO enrichment analysis revealed that genes co-expressed with PsTCP were significantly enriched in biological processes related to photosynthesis and metabolism, including “photosynthetic electron transport in photosystem I”, “chlorophyll metabolic process”, “tetrapyrrole biosynthetic process”, “plastid translation”, and “electron transport chain” (Figure 7C). These results suggest that the PsTCP-co-expressed network is closely associated with key physiological functions critical for energy metabolism and material conversion in pea.
Expression trend analysis further showed that genes in this network were significantly upregulated under low salt stress (T30), but their expression levels gradually decreased as NaCl concentrations increased (Figure 7A). This trend implies that these genes may actively participate in early salt stress responses by enhancing photosynthetic and metabolic activities. However, their downregulation under higher NaCl concentrations likely reflects the inhibitory effects of severe salt stress on photosynthesis and metabolism, suggesting an adaptive shift in metabolic priorities under stress conditions.
In the co-expression network (Figure 7B), PsTCP family genes exhibited varying degrees of connectivity, with PsTCP20 showing the highest degree (2742), followed by PsTCP17 (1415), PsTCP12 (1027), PsTCP8 (851), PsTCP9 (440), and PsTCP18 (63). This highlights PsTCP20 as a core hub gene within the regulatory network, potentially playing a pivotal role in coordinating pea responses to salt stress. PsTCP17 and PsTCP12, with relatively high connectivity, might also function synergistically with other genes to regulate physiological and biochemical pathways involved in salt tolerance.
Taken together, these findings indicate that PsTCP genes, particularly PsTCP20, are integral to salt tolerance in pea by regulating photosynthesis and metabolic pathways through their co-expression network. This study provides insights into the regulatory mechanisms of PsTCP genes under salt stress and offers a theoretical basis for further exploring salt tolerance networks in pea.
3 Materials and methods
3.1 Identification and physicochemical properties of the PsTCP gene family in pea
The reference genome sequence of pea was retrieved from NCBI (PRJNA1042956) (Liu et al., 2024), while the genome data of A. thaliana and rice were obtained from the Phytozome database (https://phytozome-next.jgi.doe.gov/). To identify the PsTCP gene family, the Hidden Markov Model (HMM) profile of the TCP domain (Pfam ID: PF03634) was downloaded from the Pfam database (El-Gebali et al., 2018). Potential PsTCP genes were identified using HMMER software (https://github.com/EddyRivasLab/hmmer) with default parameters. For further validation, the TCP protein sequences of A. thaliana were aligned with the pea protein sequences using BLASTP, with an E-value cutoff of 1e-5 and other parameters set to default. Candidate sequences with ≥30% identity to known TCP proteins were retained, and cross-referencing with Pfam search results confirmed the identification of 21 PsTCP genes, designated PsTCP1 to PsTCP21 based on their genomic locations.
To assess the structural conservation of PsTCP proteins, conserved domain analysis was performed using the Batch CD-Search tool with default parameters (Wang et al., 2022a). The physicochemical properties of the PsTCP proteins, including molecular weight, theoretical isoelectric point (pI), instability index, aliphatic index, and grand average of hydropathicity (GRAVY), were predicted using TBtools-II (Chen et al., 2023). Subcellular localization predictions were conducted using WoLF PSORT (https://wolfpsort.hgc.jp/).
3.2 Phylogenetic analysis
Using the Muscle5 (v5.1) software with default parameters (Edgar, 2022), we aligned the amino acid sequences of PsTCP and AtTCP proteins. Based on the alignment results, we constructed a rooted maximum likelihood (ML) phylogenetic tree using FastTree (v2.1.11) (Price et al., 2010), applying the JTT (Jones-Taylor-Thornton) model with default settings for branch length optimization and calculating SH-like local support values. For analysis and visualization, the tree was rendered using the interactive Tree of Life (iTOL) tool (Letunic and Bork, 2021), where the colors and styles of the branches were adjusted to distinguish TCP proteins from different groups.
3.3 Protein 3D structure, motif, and gene structure analysis
The three-dimensional (3D) structures of PsTCP proteins were predicted using the SWISS-MODEL server (https://swissmodel.expasy.org/), complemented by structural models retrieved from the AlphaFold database for comprehensive visualization. For motif identification, the Multiple Em for Motif Elicitation (MEME) suite (Bailey et al., 2009) was employed with the “any number of repetitions” (anr) option, configured to identify 10 motifs with a length range of 6–200 amino acids. The input data consisted of the full-length amino acid sequences of PsTCP proteins. Gene structures were visualized using the Gene Structure Display Server (GSDS) 2.0 (Hu et al., 2014), generating diagrams to highlight structural differences among PsTCP family members.
3.4 Chromosomal localization, gene duplication, synteny relationships, and Ka/Ks calculation of homologous genes
The chromosomal locations of PsTCP genes were mapped using the pea genome annotation file and visualized with MapChart software (Voorrips, 2002). Synteny analysis was performed at both intra- and inter-species levels. For intra-species synteny, MCScanX (Wang et al., 2012) was employed with default parameters to generate synteny files, and the results were visualized using Circos (Krzywinski et al., 2009). For inter-species synteny analysis, the JCVI toolkit (v1.0.11) (Tang et al., 2008) was utilized to preprocess data, including file format optimization, removal of duplicate entries, and matching of CDS and protein sequences. The jcvi.compara.catalog module facilitated pairwise genome comparisons among A.thaliana, pea, and rice to identify syntenic blocks and extract homologous gene pairs. Chromosomal homology relationships were visualized using the jcvi.graphics.karyotype module. Gene and sequence extraction, as well as filtering, were performed using SeqKit (v2.4.0) (Shen et al., 2016).
For the identified homologous gene pairs, Ka, Ks, and Ka/Ks ratio were calculated using ParaAT (v2.0) (Zhang et al., 2012). Protein sequences were aligned with Muscle (Edgar, 2022), and the alignments were combined with corresponding nucleotide sequences for downstream analysis. Ka and Ks values were computed using KaKs_Calculator 2.00 (Wang et al., 2010) under the default model, with abnormal values (Ka/Ks > 2) filtered out. Homologous gene pairs were categorized into three species combinations: A. thaliana vs. pea, pea vs. rice, and A. thaliana vs. rice.
3.5 Cis-acting element prediction
The promoter regions of PsTCP genes were defined as the 2000 bp upstream sequences, which were extracted using the -up-stream parameter in SeqKit (Shen et al., 2016). These sequences were subsequently analyzed with PlantCARE (Lescot et al., 2002) to identify and annotate cis-acting elements, including their positions and counts. Functional filtering and statistical analysis of the cis-acting elements were performed using the heatmap and ggplot2 packages in R. Finally, the distribution of cis-acting elements was visualized using the Gene Structure Display Server (GSDS) 2.0 (Hu et al., 2014).
Using the -up-stream parameter of SeqKit software (Shen et al., 2016), 2000bp upstream sequences of the PsTCP genes were extracted as promoter regions to identify and predict cis-acting elements. The sequences were then analyzed using PlantCARE (Lescot et al., 2002) to determine the positions and numbers of cis-acting elements. Functional filtering, statistical analysis, and visualization of the cis-acting elements were carried out using the heatmap3 (https://github.com/slzhao/heatmap3) and ggplot2 (https://ggplot2.tidyverse.org/) packages. Finally, the distribution of cis-acting elements was visualized using the GSDS (v2.0) platform (https://gsds.gao-lab.org/).
3.6 Protein-protein interaction network prediction
The STRING database (https://string-db.org/) was used to predict the protein-protein interactions of PsTCP proteins. The PsTCP protein sequences were input, with the confidence threshold set to 0.4 and other parameters kept at their default settings. The predicted results were then visualized using Cytoscape (v3.10.3) (Shannon et al., 2003), and the node colors and sizes were adjusted based on the degree of interaction.
3.7 The study of transcriptional expression patterns of PsTCP genes under salt stress and in different pea tissues
To study the response mechanism of PsTCP genes in pea under salt stress, two experimental sets were designed. First, pea seeds were transferred to hydroponic boxes filled with deionized water three days after germination, with no additional nutrients. All seedlings were grown under controlled conditions: a constant temperature of 26°C, relative humidity of 50%, a 16-hour light cycle (200 µmol photons m-2 s-2), and an 8-hour dark period. After one week of growth, salt stress treatments were applied, and fully expanded primary leaves were collected for sampling. Each treatment group included three biological replicates.
In the first experiment, different NaCl concentrations were applied: T0 (0 mM NaCl), T30 (30 mM NaCl), T60 (60 mM NaCl), T90 (90 mM NaCl), and T120 (120 mM NaCl). Samples were collected after 72 hours of treatment. In the second experiment, a fixed NaCl concentration of 100 mM was used, and sampling was performed at different time points: 0 hours (H0), 1 hour (H1), 3 hours (H3), 6 hours (H6), 12 hours (H12), 24 hours (H24), and 48 hours (H48).
To study the expression patterns of PsTCP genes in different tissues, samples from Light purple vexilla (LPV), Dark purple wing (DPW), and purple pod (PP) of the Yunwan 127 variety were collected. The remaining tissue samples were from the Zhongwan 6 variety. All plants were not subjected to significant artificial or natural stress before sampling, with irrigation managed by natural precipitation and supplemented by artificial irrigation when necessary. The samples were collected two days after flowering, on April 16, 2024, at 10:00 AM, with clear weather and a temperature of 21°C. The sampling location was at 36°42’12.45” N, 117°04’49.39” E. A total of 11 different tissue samples were collected with three biological replicates per tissue, each replicate representing one plant. The tissues collected were: white flower (WF), dark purple wing (DPW), light purple vexilla (LPV), normal stipule (NS), root ®, stem (S), fresh seed (FS), tendril leaf (T), imparipinnate leaf (IL), green pod (GP), and purple pod (PP). All collected samples were immediately frozen in liquid nitrogen and stored at −80°C for RNA extraction.
Total RNA was isolated from leaf tissues using TRIzol reagent, and the RNA quality and quantity were assessed using an Agilent 2100 Bioanalyzer. cDNA libraries were then constructed and high-throughput sequencing was performed on the DNBSEQ platform. To ensure data quality, all RNA sequencing data were filtered using Fastp (Chen et al., 2018) (default parameters). Clean reads were then aligned to the pea reference genome using HISAT2 (Kim et al., 2019) (v2.1.0, default parameters). Gene expression levels were quantified using the FeatureCounts tool (Liao et al., 2013), and Trimmed Mean of M-values (TMM) normalization was applied, with genes having expression levels lower than 1 TMM being filtered out.
3.8 WGCNA network construction and GO enrichment analysis
To construct a co-expression network under salt stress conditions in pea, we first imported transcriptome data (TMM values) from different NaCl treatments into R (v4.4.2) and used the WGCNA R package (Langfelder and Horvath, 2008) for network construction. No data filtering was applied, and a power value of 4 was chosen. Through WGCNA analysis, genes were grouped into different modules. Next, we extracted genes that co-expressed with the PsTCP gene family and used the ClusterGVis package (https://github.com/junjunlab/ClusterGVis) to plot the expression trend of these genes, with k-means clustering performed for analysis.
For GO enrichment analysis, we first annotated the pea protein sequences using ggnog-mapper v2 (Cantalapiedra et al., 2021) to obtain functional information. Then, we performed GO enrichment analysis on the genes co-expressed with the PsTCP family using the clusterProfiler R package (Wu et al., 2021). A significance level of P and Q values set at 0.05 was chosen for the analysis, which was categorized into biological process (BP), cellular component (CC), and molecular function (MF). The top 20 significantly enriched GO terms were selected for visualization to better elucidate the potential roles of these genes in the salt stress response of pea.
4 Discussion
4.1 Diversity and evolutionary conservation of PsTCP genes
The identification of 21 PsTCP genes in pea highlights the functional diversity within this gene family. These genes are unevenly distributed across seven chromosomes, with chromosome 4 harboring the highest number of family members (PsTCP9 to PsTCP13) (Supplementary Figure 1, Figure 4). This uneven distribution suggests that gene duplication events may have driven functional diversification, enabling pea to adapt to various environmental stresses (Yang et al., 2020). The physicochemical properties of PsTCP proteins, including molecular weight (21.87–54.5 kDa) and isoelectric points (pI 5.88–9.51), indicate that these proteins may operate in diverse cellular environments, adapting to varying pH conditions (Sabri Dashti et al., 2012). Subcellular localization predictions reveal that most PsTCP proteins are localized to the nucleus, consistent with their roles as transcription factors, while PsTCP9 is localized to the peroxisome, suggesting a potential role in ROS metabolism (Murakami et al., 2013).
Phylogenetic analysis classified PsTCP genes into Class I (PCF) and Class II (CYC/TB1 and CIN) subfamilies, mirroring their roles in growth and stress responses (Figure 1). The distribution of PsTCP proteins across subfamilies mirrors that in A. thaliana, highlighting shared evolutionary trajectories. This conservation suggests that TCP proteins play similar roles in regulating plant growth and development across species. The number of TCP genes in pea is fewer than in A. thaliana, likely due to differences in genome structure, gene duplication events, and selective pressures (Danisman, 2016). In contrast, the simpler genome of A. thaliana may have facilitated more extensive gene duplication (Ling et al., 2020).
4.2 Functional diversification and regulatory mechanisms
The conserved motifs identified in PsTCP proteins, such as motif 1 present across all family members, highlight their structural and functional stability (Figure 3A). Subfamily-specific motifs, such as motif 2 in the CIN subfamily, suggest distinct roles in specialized processes, such as flower development (Rath et al., 2022). The lack of introns in certain PsTCP genes, like PsTCP17, may be attributed to transposon activity, which could facilitate functional diversification (Venner et al., 2009). These structural features provide valuable insights into the potential functions, evolutionary history, and roles of PsTCP family members in plant growth, development, and stress responses.
Cis-regulatory element analysis further indicated that PsTCP genes harbor elements associated with growth, hormone signaling, and stress response (Figure 5). For example, PsTCP7 contains the greatest number of functional elements (45), including 21 phytohormone-responsive elements, suggesting a high sensitivity to hormonal regulation (Ijaz et al., 2020). In contrast, PsTCP20 harbors fewer hormone-responsive elements, which may imply reliance on alternative regulatory pathways. Notably, PsTCP17 is characterized by the highest number of abiotic and biotic stresses elements (20), potentially enhancing its expression under stress conditions, thus supporting its role in stress adaptation.
4.3 Evolutionary relationships and functional diversification of PsTCP genes
Phylogenetic analysis reveals that PsTCP genes are classified into Class I (PCF) and Class II (CYC/TB1 and CIN) subfamilies, reflecting their roles in growth and stress responses (Figure 1A–C). The distribution of PsTCP proteins across subfamilies mirrors that in A. thaliana, highlighting shared evolutionary trajectories. This conservation suggests that TCP proteins play similar roles in regulating plant growth and development across species. The number of TCP genes in pea is fewer than in A. thaliana, likely due to differences in genome structure, gene duplication events, and selective pressures (Danisman, 2016). In contrast, the simpler genome of A. thaliana may have facilitated more extensive gene duplication (Ling et al., 2020).
Class I TCP genes, prevalent in A. thaliana, likely regulate fundamental transcriptional processes, while the CIN subfamily, more prominent in pea, suggests expanded roles. In A. thaliana, CIN genes regulate cell proliferation and differentiation during leaf development (Rath et al., 2022).Conserved motifs, such as motif 1 in all PsTCP proteins, underscore their structural and functional integrity, while subfamily-specific motifs (e.g., motif 2 in CIN) suggest specialized roles in processes like flower development (Figure 3A) (Rath et al., 2022). The absence of introns in some PsTCP genes (e.g., PsTCP and PsTCP17) may result from transposon activity, contributing to functional diversification (Venner et al., 2009).
4.4 Expression patterns and regulatory networks under salt stress
The expression patterns of PsTCP genes under salt stress reveal their dynamic roles in stress adaptation (Figure 6). In the experiments with different NaCl concentrations (0–120 mM), PsTCP19 and PsTCP8 were upregulated with increasing salt levels, suggesting their involvement in early stress responses, potentially through the regulation of ion homeostasis (Wang et al., 2022b). In contrast, PsTCP4, PsTCP18, PsTCP20, and PsTCP12 were downregulated under high salt concentrations, indicating suppression of non-essential processes to conserve resources (Amirbakhtiar et al., 2021). Notably, PsTCP17 showed significant upregulation under extreme salt stress (120 mM NaCl), highlighting its potential role in severe stress adaptation.
Time-course experiments with 100 mM NaCl treatment further elucidated the temporal dynamics of PsTCP gene expression (Supplementary Figure 5). PsTCP5, PsTCP11, and PsTCP13 exhibited an initial increase followed by a decline, suggesting their involvement in early stress responses. Conversely, PsTCP18 and PsTCP7 showed a decrease followed by an increase, indicating potential roles in prolonged stress adaptation. The expression pattern of PsTCP17 under prolonged salt stress mirrored its response to high salt concentrations, further supporting its critical role in extreme stress conditions.
WGCNA analysis identified PsTCP8, PsTCP9, PsTCP12, PsTCP17, and PsTCP20 as hub genes within a co-expression network that regulates photosynthesis and metabolism under salt stress (Figure 7B). Genes within the blue module, including six PsTCP genes, were significantly enriched in pathways associated with photosynthesis and metabolism, such as “photosynthetic electron transport in photosystem I” and “chlorophyll metabolic process” (Figure 7C). The upregulation of these genes under low salt conditions (T30) suggests an enhancement of photosynthetic and metabolic processes to mitigate mild stress. Conversely, their downregulation under high salt conditions (T60 to T120) reflects the suppression of these essential processes under severe stress, likely due to the adverse effects of salinity on cellular functions (Parida et al., 2003; Sui et al., 2015; Ben Amor et al., 2020). The high connectivity of PsTCP20 (degree = 2742) highlights its central role in coordinating the pea plant’s response to salt stress, while PsTCP17 and PsTCP12 may function synergistically to regulate stress adaptation pathways.
5 Conclusion
This study comprehensively identified and analyzed the TCP gene family in pea, revealing its crucial role in plant growth, development, and response to salt stress. A total of 21 PsTCP genes were identified, and these genes are unevenly distributed across seven chromosomes of the pea genome. Through a comprehensive analysis of their protein characteristics, phylogenetic relationships, three-dimensional structures, conserved motifs, gene structures, synteny, selective pressure, cis-regulatory elements in promoter regions, protein-protein interaction networks, and expression patterns under different tissues and salt stress conditions, we found significant diversity and functional differentiation within the PsTCP gene family. Under salt stress, PsTCP genes exhibited complex dynamic expression patterns, with PsTCP17 significantly upregulated at high salt concentrations, potentially playing an important regulatory role under extreme salt stress conditions. PsTCP20, as a core hub gene in the co-expression network, showed high co-expression with genes related to photosynthesis and metabolism, indicating its key regulatory function in pea adaptation to salt stress. Furthermore, the differential expression of PsTCP genes across various tissues highlighted their diversified roles in plant growth and development. These findings not only enrich our understanding of the functions of the TCP gene family but also provide potential genetic targets and theoretical basis for the molecular improvement of salt-tolerant pea varieties and other crops. However, our current understanding of PsTCP gene functions is primarily based on bioinformatics predictions and expression analysis, and future studies should employ experimental approaches, such as gene knockout or overexpression, to directly validate their specific roles in pea.
6 Limitations of the study
Although this study provides important insights into the PsTCP gene family in pea, our current understanding of the functions of PsTCP genes primarily relies on bioinformatic predictions and expression analyses. The lack of direct functional validation methods, such as gene knockout or overexpression experiments, limits our deeper understanding of the specific functions and regulatory mechanisms of PsTCP genes.
Data availability statement
The datasets presented in this study can be found in online repositories. The names of the repository/repositories and accession number(s) can be found in the article/Supplementary Material.
Ethics statement
Written informed consent was obtained from the individual(s) for the publication of any potentially identifiable images or data included in this article.
Author contributions
SF: Data curation, Formal analysis, Funding acquisition, Writing – original draft, Writing – review & editing. LY: Data curation, Investigation, Methodology, Writing – review & editing. JH: Methodology, Resources, Software, Writing – review & editing. GZ: Data curation, Writing – review & editing. DW: Conceptualization, Methodology, Writing – review & editing.
Funding
The author(s) declare that financial support was received for the research and/or publication of this article. The present study was supported by China Postdoctoral Science Foundation (2023M741105), Central Finance Forestry Science and Technology Promotion Demonstration Fund Project (E (2025) TG27), China Agriculture Research System of MOF and MARA (CARS-18-SYZ10), China Agriculture Research System of MOF and MARA (CARS-18-SYZ10), Hubei Province Agricultural Science and Technology Innovation Center (2024-620-000-001-009).
Conflict of interest
The authors declare that the research was conducted in the absence of any commercial or financial relationships that could be construed as a potential conflict of interest.
Generative AI statement
The author(s) declare that no Generative AI was used in the creation of this manuscript.
Publisher’s note
All claims expressed in this article are solely those of the authors and do not necessarily represent those of their affiliated organizations, or those of the publisher, the editors and the reviewers. Any product that may be evaluated in this article, or claim that may be made by its manufacturer, is not guaranteed or endorsed by the publisher.
Supplementary material
The Supplementary Material for this article can be found online at: https://www.frontiersin.org/articles/10.3389/fpls.2025.1580890/full#supplementary-material
References
Ali, Q., Ahmad, M., Kamran, M., Ashraf, S., Shabaan, M., Babar, B. H., et al. (2023). Synergistic effects of rhizobacteria and salicylic acid on maize Zea mays salt-stress tolerance. Plants 12, 5219. doi: 10.3390/plants12132519
Amarakoon, D., Thavarajah, D., Mcphee, K., Thavarajah, P. (2012). Iron-, zinc-, and magnesium-rich field peas (Pisum sativum L.) with naturally low phytic acid: A potential food-based solution to global micronutrient malnutrition. J. Food Composition Anal. 27, 8–13. doi: 10.1016/j.jfca.2012.05.007
Amirbakhtiar, N., Ismaili, A., Ghaffari, M.-R., Mirdar Mansuri, R., Sanjari, S., Shobbar, Z.-S. (2021). Transcriptome analysis of bread wheat leaves in response to salt stress. PloS One 16, e0254189. doi: 10.1371/journal.pone.0254189
Bailey, T. L., Boden, M., Buske, F. A., Frith, M., Grant, C. E., Clementi, L., et al. (2009). MEME Suite: tools for motif discovery and searching. Nucleic Acids Res. 37, W202–W208. doi: 10.1093/nar/gkp335
Ben Amor, N., Jiménez, A., Boudabbous, M., Sevilla, F., Abdelly, C. (2020). Chloroplast implication in the tolerance to salinity of the halophyte Cakile maritima. Russian J. Plant Physiol. 67, 507–514. doi: 10.1134/S1021443720030048
Cantalapiedra, C. P., Hernández-Plaza, A., Letunic, I., Bork, P., Huerta-Cepas, J. (2021). eggNOG-mapper v2: functional annotation,orthology assignments, and domain prediction at the metagenomic scale. Mol. Biol. Evol. 38, 5825–5829. doi: 10.1093/molbev/msab293
Chen, C., Wu, Y., Li, J., Wang, X., Zeng, Z., Xu, J., et al. (2023). TBtools-II: A “one for all, all for one. Bioinf. platform Biol. big-data mining Mol. Plant 16, 1733–1742.
Chen, S., Zhou, Y., Chen, Y., Gu, J. (2018). fastp: an ultra-fast all-in-one FASTQ preprocessor. Bioinformatics 34, i884–i890. doi: 10.1093/bioinformatics/bty560
Cubas, P., Lauter, N., Doebley, J., Coen, E. (1999). The TCP domain: a motif found in proteins regulating plant growth and development. Plant J. 18, 215–222. doi: 10.1046/j.1365-313X.1999.00444.x
Danisman, S. (2016). TCP transcription factors at the interface between environmental challenges and the plant’s growth responses. Front. Plant Sci. 7, 1930. doi: 10.3389/fpls.2016.01930
Deng, W., Zhang, K., Liu, S., Zhao, P. X., Xu, S., Wei, H. (2018). JRmGRN: joint reconstruction of multiple gene regulatory networks with common hub genes using data from multiple tissues or conditions. Bioinformatics 34, 3470–3478. doi: 10.1093/bioinformatics/bty354
Edgar, R. C. (2022). Muscle5: high-accuracy alignment ensembles enable unbiased assessments of sequence homology and phylogeny. Nat. Commun. 13, 6968. doi: 10.1038/s41467-022-34630-w
El-Gebali, S., Mistry, J., Bateman, A., Eddy, S. R., Luciani, A., Potter, S. C., et al. (2018). The Pfam protein families database in 2019. Nucleic Acids Res. 47, D427–D432.
Grela, E. R., Kiczorowska, B., Samolińska, W., Matras, J., Kiczorowski, P., Rybiński, W., et al. (2017). Chemical composition of leguminous seeds: part I—content of basic nutrients, amino acids, phytochemical compounds, and antioxidant activity. Eur. Food Res. Technol. 243, 1385–1395. doi: 10.1007/s00217-017-2849-7
Guindon, M. F., Cazzola, F., Palacios, T., Gatti, I., Bermejo, C., Cointry, E. (2021). Biofortification of pea (Pisum sativum L.): a review. J. Sci. Food Agric. 101, 3551–3563. doi: 10.1002/jsfa.v101.9
Hamouda, M. M., Badr, A., Ali, S. S., Adham, A. M., Ahmed, H. I. S., Saad-Allah, K. M. (2023). Growth, physiological, and molecular responses of three phaeophyte extracts on salt-stressed pea (Pisum sativum L.) seedlings. J. Genet. Eng. Biotechnol. 21, 32. doi: 10.1186/s43141-023-00483-z
Hu, B., Jin, J., Guo, A., Zhang, H., Luo, J., Gao, G. (2014). GSDS 2.0: an upgraded gene feature visualization server. Bioinformatics 31, 1296–1297. doi: 10.1093/bioinformatics/btu817
Ijaz, U., Pervaiz, T., Ahmed, T., Seemab, R., Shahid, M., Noman, M., et al. (2020). Plant cis-regulatory elements: methods of identification and applications. Asian J. Agric. Biol. 8, 207–222. doi: 10.35495/ajab.2019.08.352
Ilyas, M., Maqsood, M. F., Shahbaz, M., Zulfiqar, U., Ahmad, K., Naz, N., et al. (2024). Alleviating salinity stress in canola (Brassica napus L.) through exogenous application of salicylic acid. BMC Plant Biol. 24, 611.
Kim, D., Paggi, J. M., Park, C., Bennett, C., Salzberg, S. L. (2019). Graph-based genome alignment and genotyping with HISAT2 and HISAT-genotype. Nat. Biotechnol. 37, 907–915. doi: 10.1038/s41587-019-0201-4
Kosugi, S., Ohashi, Y. (2002). DNA binding and dimerization specificity and potential targets for the TCP protein family. Plant J. 30, 337–348. doi: 10.1046/j.1365-313X.2002.01294.x
Krzywinski, M., Schein, J., Birol, I., Connors, J., Gascoyne, R., Horsman, D., et al. (2009). Circos: an information aesthetic for comparative genomics. Genome Res. 19, 1639–1645. doi: 10.1101/gr.092759.109
Langfelder, P., Horvath, S. (2008). WGCNA: an R package for weighted correlation network analysis. BMC Bioinf. 9, 559. doi: 10.1186/1471-2105-9-559
Lescot, M., Déhais, P., Thijs, G., Marchal, K., Moreau, Y., Van De Peer, Y., et al. (2002). PlantCARE, a database of plant cis-acting regulatory elements and a portal to tools for in silico analysis of promoter sequences. Nucleic Acids Res. 30, 325–327. doi: 10.1093/nar/30.1.325
Letunic, I., Bork, P. (2021). Interactive Tree Of Life (iTOL) v5: an online tool for phylogenetic tree display and annotation. Nucleic Acids Res. 49, W293–W296. doi: 10.1093/nar/gkab301
Li, J., Han, G., Sun, C., Sui, N. (2019). Research advances of MYB transcription factors in plant stress resistance and breeding. Plant Signaling Behav. 14, 1613131. doi: 10.1080/15592324.2019.1613131
Li, H., Wen, X., Huang, X., Wei, M., Chen, H., Yu, Y., et al. (2022). Genome-wide identification and characterization of TCP gene family members in Melastoma candidum. Molecules 27, 9036. doi: 10.3390/molecules27249036
Liao, Y., Smyth, G. K., Shi, W. (2013). featureCounts: an efficient general purpose program for assigning sequence reads to genomic features. Bioinformatics 30, 923–930. doi: 10.1093/bioinformatics/btt656
Ling, L., Zhang, W., An, Y., Du, B., Wang, D., Guo, C. (2020). Genome-wide analysis of the TCP transcription factor genes in five legume genomes and their response to salt and drought stresses. Funct. Integr. Genomics 20, 537–550. doi: 10.1007/s10142-020-00733-0
Liu, N., Lyu, X., Zhang, X., Zhang, G., Zhang, Z., Guan, X., et al. (2024). Reference genome sequence and population genomic analysis of peas provide insights into the genetic basis of Mendelian and other agronomic traits. Nat. Genet. 56, 1964–1974. doi: 10.1038/s41588-024-01867-8
Mudryj, A. N., Yu, N., Aukema, H. M. (2014). Nutritional and health benefits of pulses. Appl. Physiol. Nutr. Metab. 39, 1197–1204. doi: 10.1139/apnm-2013-0557
Mukhopadhyay, P., Tyagi, A. K. (2015). OsTCP19 influences developmental and abiotic stress signaling by modulatingABI4-mediated pathways. Sci. Rep. 5, 9998. doi: 10.1038/srep09998
Murakami, K., Ichinohe, Y., Koike, M., Sasaoka, N., Iemura, S.-I., Natsume, T., et al. (2013). VCP is an integral component of a novel feedback mechanism that controls intracellular localization of catalase and H2O2 levels. PloS One 8, e56012. doi: 10.1371/journal.pone.0056012
Otlewska, A., Migliore, M., Dybka-Stępień, K., Manfredini, A., Struszczyk-Świta, K., Napoli, R., et al. (2020). When salt meddles between plant, soil, and microorganisms. Front. Plant Sci. 11, 553087. doi: 10.3389/fpls.2020.553087
Pan, J., Ju, Z., Ma, X., Duan, L., Jia, Z. (2024). Genome-wide characterization of TCP family and their potential roles in abiotic stress resistance of oat (Avena sativa L.). Front. Plant Sci. 15, 1382790. doi: 10.3389/fpls.2024.1382790
Parida, A. K., Das, A. B., Mittra, B. (2003). Effects of nacl stress on the structure, pigment complex composition, and photosynthetic activity of mangrove Bruguiera parviflora chloroplasts. Photosynthetica 41, 191–200. doi: 10.1023/B:PHOT.0000011951.37231.69
Poblaciones, M. J., Rengel, Z. (2018). The effect of processing on Pisum sativum L. biofortified sodium selenate J. Plant Nutr. Soil Sci. 181, 932–937. doi: 10.1002/jpln.201800251
Price, M. N., Dehal, P. S., Arkin, A. P. (2010). FastTree 2 – Approximately maximum-likelihood trees for large alignments. PloS One 5, e9490. doi: 10.1371/journal.pone.0009490
Rashid, E., Hussain, Z., Nawaz, M., Rashid, S. (2023). Evaluation of pea genotypes for salt stress tolerance. SABRAO J. Breed. Genet. 55, 1423–1434. doi: 10.54910/sabrao2023.55.4.35
Rath, M., Challa, K. R., Sarvepalli, K., Nath, U. (2022). CINCINNATA-like TCP transcription factors in cell growth – an expanding portfolio. Front. Plant Sci. 13, 825341. doi: 10.3389/fpls.2022.825341
Sabri Dashti, D., Meng, Y., Roitberg, A. E. (2012). pH-replica exchange molecular dynamics in proteins using a discrete protonation method. J. Phys. Chem. B 116, 8805–8811. doi: 10.1021/jp303385x
Savadel, S. D., Hartwig, T., Turpin, Z. M., Vera, D. L., Lung, P., Sui, X., et al. (2021). The native cistrome and sequence motif families of the maize ear. PloS Genet. 17, e1009689. doi: 10.1371/journal.pgen.1009689
Shannon, P., Markiel, A., Ozier, O., Baliga, N. S., Wang, J. T., Ramage, D., et al. (2003). Cytoscape: a software environment for integrated models of biomolecular interaction networks. Genome Res. 13, 2498–2504. doi: 10.1101/gr.1239303
Shen, W., Le, S., Li, Y., Hu, F. (2016). SeqKit: A cross-platform and ultrafast toolkit for FASTA/Q file manipulation. PloS One 11, e0163962. doi: 10.1371/journal.pone.0163962
Singh, G., Gudi, S., Upadhyay, P., Shekhawat, P. K., Nayak, G., Goyal, L., et al. (2022). Unlocking the hidden variation from wild repository for accelerating genetic gain in legumes. Front. Plant Sci. 13, 1035878. doi: 10.3389/fpls.2022.1035878
Sui, N., Yang, Z., Liu, M., Wang, B. (2015). Identification and transcriptomic profiling of genes involved in increasing sugar content during salt stress in sweet sorghum leaves. BMC Genomics 16, 534. doi: 10.1186/s12864-015-1760-5
Tang, H., Bowers, J. E., Wang, X., Ming, R., Alam, M., Paterson, A. H. (2008). Synteny and collinearity in plant genomes. Science 320, 486–488. doi: 10.1126/science.1153917
Venner, S., Feschotte, C., Biémont, C. (2009). Dynamics of transposable elements: towards a community ecology of the genome. Trends Genet. 25, 317–323. doi: 10.1016/j.tig.2009.05.003
Voorrips, R. E. (2002). MapChart: software for the graphical presentation of linkage maps and QTLs. J. Heredity 93, 77–78. doi: 10.1093/jhered/93.1.77
Wang, J., Chitsaz, F., Derbyshire, M. K., Gonzales, N. R., Gwadz, M., Lu, S., et al. (2022a). The conserved domain database in 2023. Nucleic Acids Res. 51, D384–D388. doi: 10.1093/nar/gkac1096
Wang, X., Song, Z., Ti, Y., Liu, Y., Li, Q. (2022b). Physiological response and transcriptome analysis of Prunus mume to early salt stress. J. Plant Biochem. Biotechnol. 31, 330–342. doi: 10.1007/s13562-021-00680-2
Wang, Y., Tang, H., Debarry, J. D., Tan, X., Li, J., Wang, X., et al. (2012). MCScanX: a toolkit for detection and evolutionary analysis of gene synteny and collinearity. Nucleic Acids Res. 40, e49–e49. doi: 10.1093/nar/gkr1293
Wang, D., Zhang, Y., Zhang, Z., Zhu, J., Yu, J. (2010). KaKs_Calculator 2.0: A toolkit incorporating gamma-series methods and sliding window strategies. Genomics Proteomics Bioinf. 8, 77–80. doi: 10.1016/S1672-0229(10)60008-3
Wu, T., Hu, E., Xu, S., Chen, M., Guo, P., Dai, Z., et al. (2021). clusterProfiler 4.0: A universal enrichment tool for interpreting omics data. Innovation 2. doi: 10.1016/j.xinn.2021.100141
Wu, Y., Zhang, J., Li, C., Deng, X., Wang, T., Dong, L. (2023). Genome-wide analysis of TCP transcription factor family in sunflower and identification of HaTCP1 involved in the regulation of shoot branching. BMC Plant Biol. 23, 222. doi: 10.1186/s12870-023-04211-0
Xu, Y., Wang, L., Liu, H., He, W., Jiang, N., Wu, M., et al. (2022). Identification of TCP family in moso bamboo (Phyllostachys edulis) and salt tolerance analysis of PheTCP9 in transgenic Arabidopsis. Planta 256, 5. doi: 10.1007/s00425-022-03917-z
Yang, D., Wang, T., Zhang, J., Li, X.-Z., He, Y., Xiao, R., et al. (2020). Genome-wide association study identifies genetic susceptibility loci and pathways of radiation-induced acute oral mucositis. J. Trans. Med. 18, 224. doi: 10.1186/s12967-020-02390-0
Yu, Z., Tian, C., Guan, Y., He, J., Wang, Z., Wang, L., et al. (2022). Expression analysis of TCP transcription factor family in autopolyploids of Chrysanthemum nankingense. Front. Plant Sci. 13, 860956. doi: 10.3389/fpls.2022.860956
Zhang, L., Li, C., Yang, D., Wang, Y., Yang, Y., Sun, X. (2021). Genome-wide analysis of the TCP transcription factor genes in Dendrobium catenatum Lindl. Int. J. Mol. Sci. 22, 10269. doi: 10.3390/ijms221910269
Zhang, X., Tang, L., Nie, J., Zhang, C., Han, X., Li, Q., et al. (2023). Structure and activation mechanism of the rice Salt Overly Sensitive 1 (SOS1) Na+/H+ antiporter. Nat. Plants 9, 1924–1936. doi: 10.1038/s41477-023-01551-5
Keywords: TCP gene family, Pisum sativum, salt stress, tissue-specific expression, WGCNA
Citation: Fangyuan S, Yong L, Huang J, Zhiyue G and Wen D (2025) Integrating genome and transcriptome-wide data to explore the expression dynamics of TCP genes in Pisum sativum under salt stress. Front. Plant Sci. 16:1580890. doi: 10.3389/fpls.2025.1580890
Received: 21 February 2025; Accepted: 05 March 2025;
Published: 01 May 2025.
Edited by:
Kai-Hua Jia, Shandong Academy of Agricultural Sciences, ChinaReviewed by:
Han Yang, Xianghu Laboratory, ChinaHailong Yu, Qingdao University of Science and Technology, China
Copyright © 2025 Fangyuan, Yong, Huang, Zhiyue and Wen. This is an open-access article distributed under the terms of the Creative Commons Attribution License (CC BY). The use, distribution or reproduction in other forums is permitted, provided the original author(s) and the copyright owner(s) are credited and that the original publication in this journal is cited, in accordance with accepted academic practice. No use, distribution or reproduction is permitted which does not comply with these terms.
*Correspondence: Deng Wen, MTU3Mzg4MjE0NjdAMTYzLmNvbQ==