 Yahong Chen1†
 Quaid Hussain
- 1College of Life Sciences, Wuchang University of Technology, Wuhan, Hubei, China
- 2Wuhan Academy of Agricultural Sciences, Wuhan, Hubei, China
- 3College of Life Sciences and Oceanography, Shenzhen University, Shenzhen, China
- 4Baokang County Forestry Bureau, Xiangyang, Hubei, China
Paeonia ostii is a commercially important ornamental and traditional medicinal plant esteemed in China. Salt stress is a widespread abiotic stress that significantly affects plant growth and development, and moderate stress can significantly promote the synthesis of plant secondary metabolites, requiring clarification of its underlying molecular mechanisms. The Salt Overly Sensitive 1 (SOS1) gene family is essential for salt stress tolerance, encoding Na+/H+ antiporters that preserve ion homeostasis and reduce cellular damage. This study conducted an extensive genome-wide analysis of the SOS1 gene family in Paeonia ostii, encompassing gene identification, characterization, three-dimensional and secondary structure prediction, gene structure and motif analysis, multiple alignments, phylogenetic tree construction, chromosomal localization, cis-regulatory element analysis, synteny analysis, Ka/Ks calculation, and gene expression analysis under salt stress treatments in three cultivars. Our findings identified 19 SOS1 genes within the P. ostii genome, demonstrating unique structural and functional attributes. All SOS1 genes were located on the plasma membrane and distributed across five chromosomes and two scaffolds. The conserved motif analysis results indicated that the SOS1 homologs had comparable protein structures. The coding sections of 19 PoSOS1 genes comprise amino acid sequences varying from 455 to 859, whereas the exons encompass amino acids ranging from 3 to 20. Furthermore, we discovered that the 2.5 kb upstream promoter region of the PoSOS1s gene has many cis-elements linked to phytohormones and stress responses. The phylogenetic study categorized the PoSOS1 genes into three subfamilies. In total, 38 miRNAs that target 19 PoSOS1 genes from 18 distinct families were identified. Conversely, gene expression analysis revealed six differentially expressed SOS1 genes in three distinct cultivars subjected to salt stress, with all six genes down-regulated and only one gene up-regulated in the QF-230 cultivar after six days of salt stress. This study offers new insights into the SOS1 gene family in P. ostii, elucidating its function in salt stress tolerance and establishing a foundation for future research on the functional characterization of SOS1 genes in P. ostii.
1 Introduction
Over 800 million hectares of arable land worldwide are affected by soil salinization and alkalization. In China, saline-alkali soils constitute 25% of the total arable land area but remain underutilized (Liu and Wang, 2021). Plants are susceptible to adverse environmental conditions due to their sessile nature (Hussain et al., 2021). However, their survival in natural habitats depends on adaptations to both abiotic and biotic stressors (Shang et al., 2024). Salinity hinders plant growth and development through water deficit, ionic toxicity (primarily Na+ and Cl- accumulation), and nutrient imbalances. In salinity-affected regions, crop yields have been reported to decrease by 20–50% (Isayenkov and Maathuis, 2019; Isayenkov, 2012; Muhammad et al., 2024; Eswar et al., 2021). Besides, former research had demonstrated that moderate stress could significantly promote the synthesis of plant secondary metabolites; the expressions of PAL, 4CL, C4H, and COMT genes and their protein contents were up-regulated under low salt stress, which was positively correlated with the relative contents of phenolic acid and flavonoid, chlorogenic acid and luteolin (Cai et al., 2020, 2021; Khare et al., 2020).
The Salt Overly Sensitive (SOS) signaling pathway, critical for plant salt-stress responses, consists of three core components: SOS1, SOS2, and SOS3 (Liang et al., 2023; Cheng et al., 2019). SOS1 is a plasma membrane-localized Na+/H+ antiporter that mediates Na+ efflux from root cells and xylem loading to facilitate long-distance ion transport (Świeżawska et al., 2018; Shi et al., 2000). The SOS1 homologs in Arabidopsis thaliana were originally designated as AtNHX1 to AtNHX8. AtSOS1 exhibits tissue-specific expression patterns, with high abundance in root epidermal cells, xylem parenchyma, and vascular tissues, indicating its dual role in rhizosphere Na+ exclusion and systemic ion homeostasis (Ali et al., 2021; Keisham et al., 2018; Liang et al., 2023; Gao et al., 2016).
Paeonia sect. Moutan, commonly known as the tree peony or “King of Flowers” in China, belongs to the Paeoniaceae family. This culturally significant species has been cultivated for over 1,500 years, with documented uses in traditional medicine, ornamental horticulture, and oil production (Zhang et al., 2017, 2014). Officially recognized as an industrial oil crop by Chinese authorities, P. ostii demonstrates exceptional adaptability to marginal lands, with cultivation spanning over 20 provinces due to its high seed yield (greater than 20% oil content), drought tolerance, and nutritional value (Li et al., 2015; Zhao et al., 2021). Soil salinization has impeded the advancement of the oil tree peony business. It has led to a diminished emergence rate, protracted development, and even mortality of seedlings, reducing crop yield and quality and resulting in significant economic losses for cultivators (Xiong et al., 2019). Consequently, it is essential to investigate the enhancement of tree peony salt tolerance, which can offer theoretical support for the sustainable advancement of the tree peony business (Shi et al., 2023). Investigating the characteristics of salt-tolerant gene families in Paeonia ostii (a traditional Chinese medicinal herb) holds significant potential for developing novel salt-tolerant cultivars. Such advancements would enhance the utilization value of saline-alkali lands, expand the cultivation range of Paeonia ostii, and provide additional land resources for cultivating this traditional medicinal herb.
Despite extensive characterization of SOS1 in model plants, this gene family remains uncharacterized in Paeonia ostii. Thus, this research represents the initial attempt to perform a genome-wide analysis to identify SOS1 genes within the genome of P. ostii. This study aimed to identify and characterize 19 SOS1 genes and then investigate their expression levels in three cultivars, QF-11, QF-12, and QF-230, and their response to salt treatments. We employed comparative genomics and phylogenomic approaches to investigate the evolutionary trajectory, structural diversification, and stress-responsive expression patterns of SOS1 genes in P. ostii. This study provides a foundational framework for molecular breeding programs to enhance salt tolerance in P. ostii, while elucidating conserved and lineage-specific adaptations in SOS-mediated ion homeostasis.
2 Results
2.1 Identification of the PoSOS1s family and its physicochemical properties
Nineteen (19) SOS1 transporter family genes were discovered in the P. ostii genome (Supplementary Table S1). The proposed protein sequences demonstrated significant diversity, with amino acid lengths ranging from 455 (Pos.gene10758.mRNA-1) to 859 (Pos.gene18168.mRNA-1). Seven genes produced polypeptides containing fewer than 800 amino acids, while the other 12 encoded polypeptides varied from approximately 803 to 859 amino acids, averaging a length of 762 amino acids. The statistical analysis indicated that the coding sequence (CDS) lengths varied from 1365 (Pos.gene10758.mRNA-1) to 2577 (Pos.gene18168.mRNA-1), with an average length of 2285. The relative molecular weight varied between 49803.54 and 95407.53 daltons (Da), with a mean of 83732.63 Da. The isoelectric points varied from 5.57 to 9.37, averaging 7.21. The protein Pos.gene62206.mRNA-1 exhibited the highest instability index (II) value of 46.64, whereas Pos.gene1017.mRNA-1 displayed the lowest instability index value of 31.68, resulting in a mean value of 38.11. The aliphatic index of the SOS1 family varied from 92.79 to 127.54, with a mean of 112.25. The grand average hydropathy index (GRAVY) values for 19 PoSOS1s varied from 0.263 to 0.724, signifying a hydrophobic nature. Identifying the subcellular location of SOS1 proteins will facilitate the comprehension of their molecular function. Predictions of subcellular localization suggested that members of the PoSOS1 family were predominantly located in the plasma membrane (Table 1). All PoSOS1 proteins were anticipated to possess transmembrane domains, with the number of domains ranging from 9 to 13 based on the specific gene. The PoSOS1 transporter family comprises three proteins with nine transmembrane domains and five proteins with ten transmembrane domains. Three proteins possessed 11 transmembrane domains, seven included 12, and Pos.gene78717.mRNA-1 exhibited a maximum of 13 transmembrane domains (Figure 1). Protein sequence alignment was conducted based on the presence of the Pfam (PF00999) domain and its similarity to query sequences (Supplementary Figure S1).
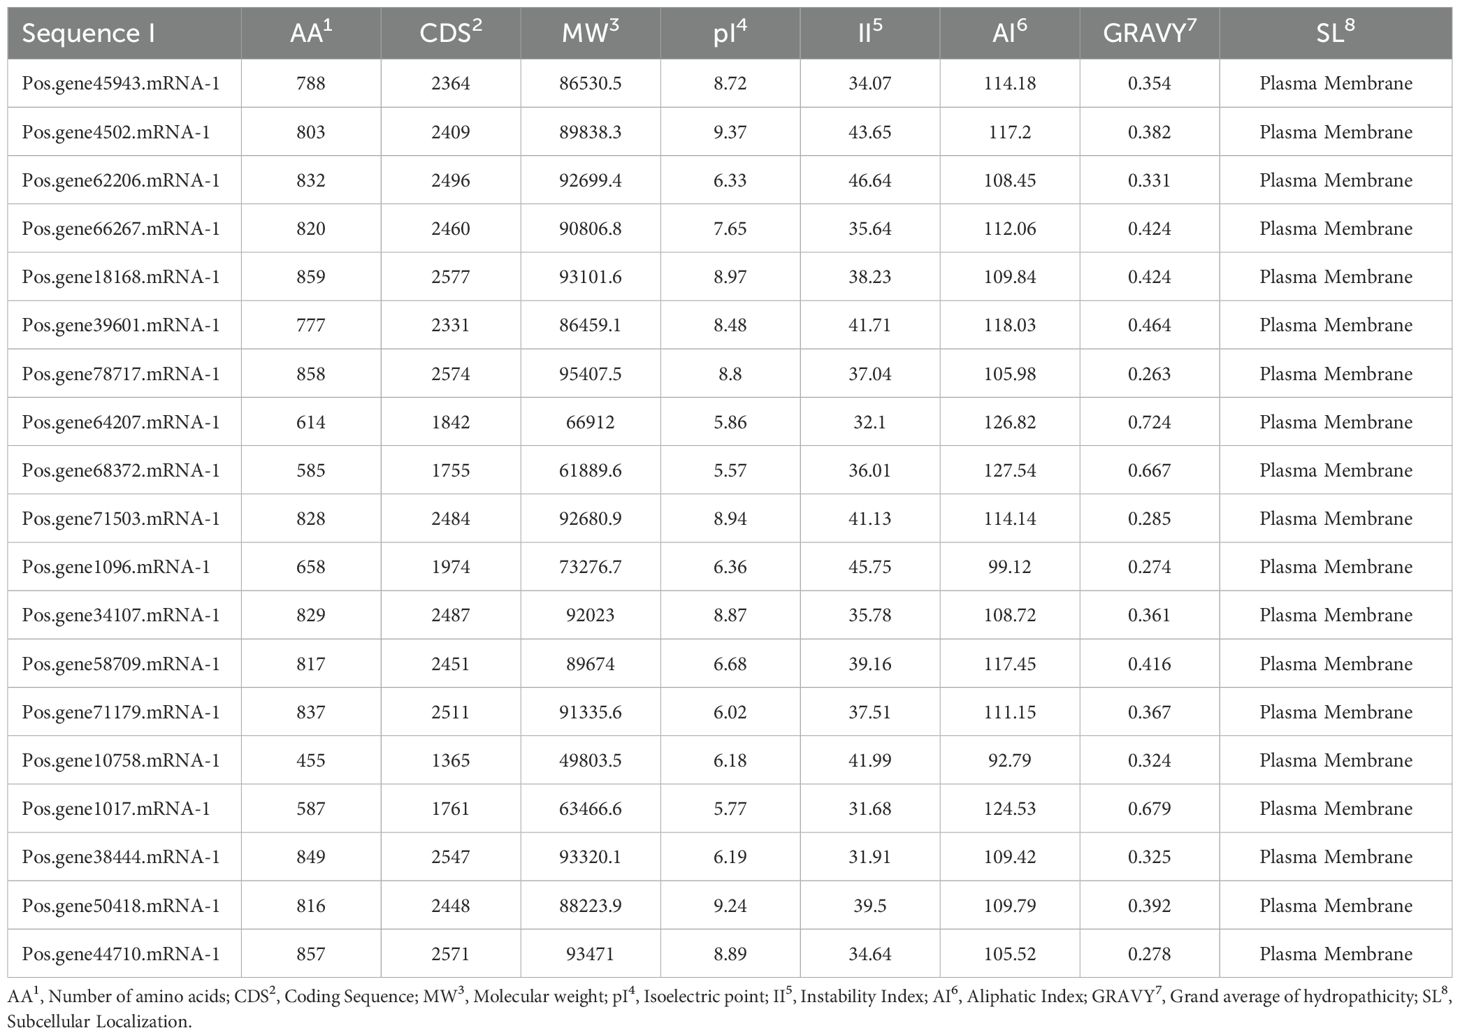
Table 1. General properties of PoSOS1 proteins.
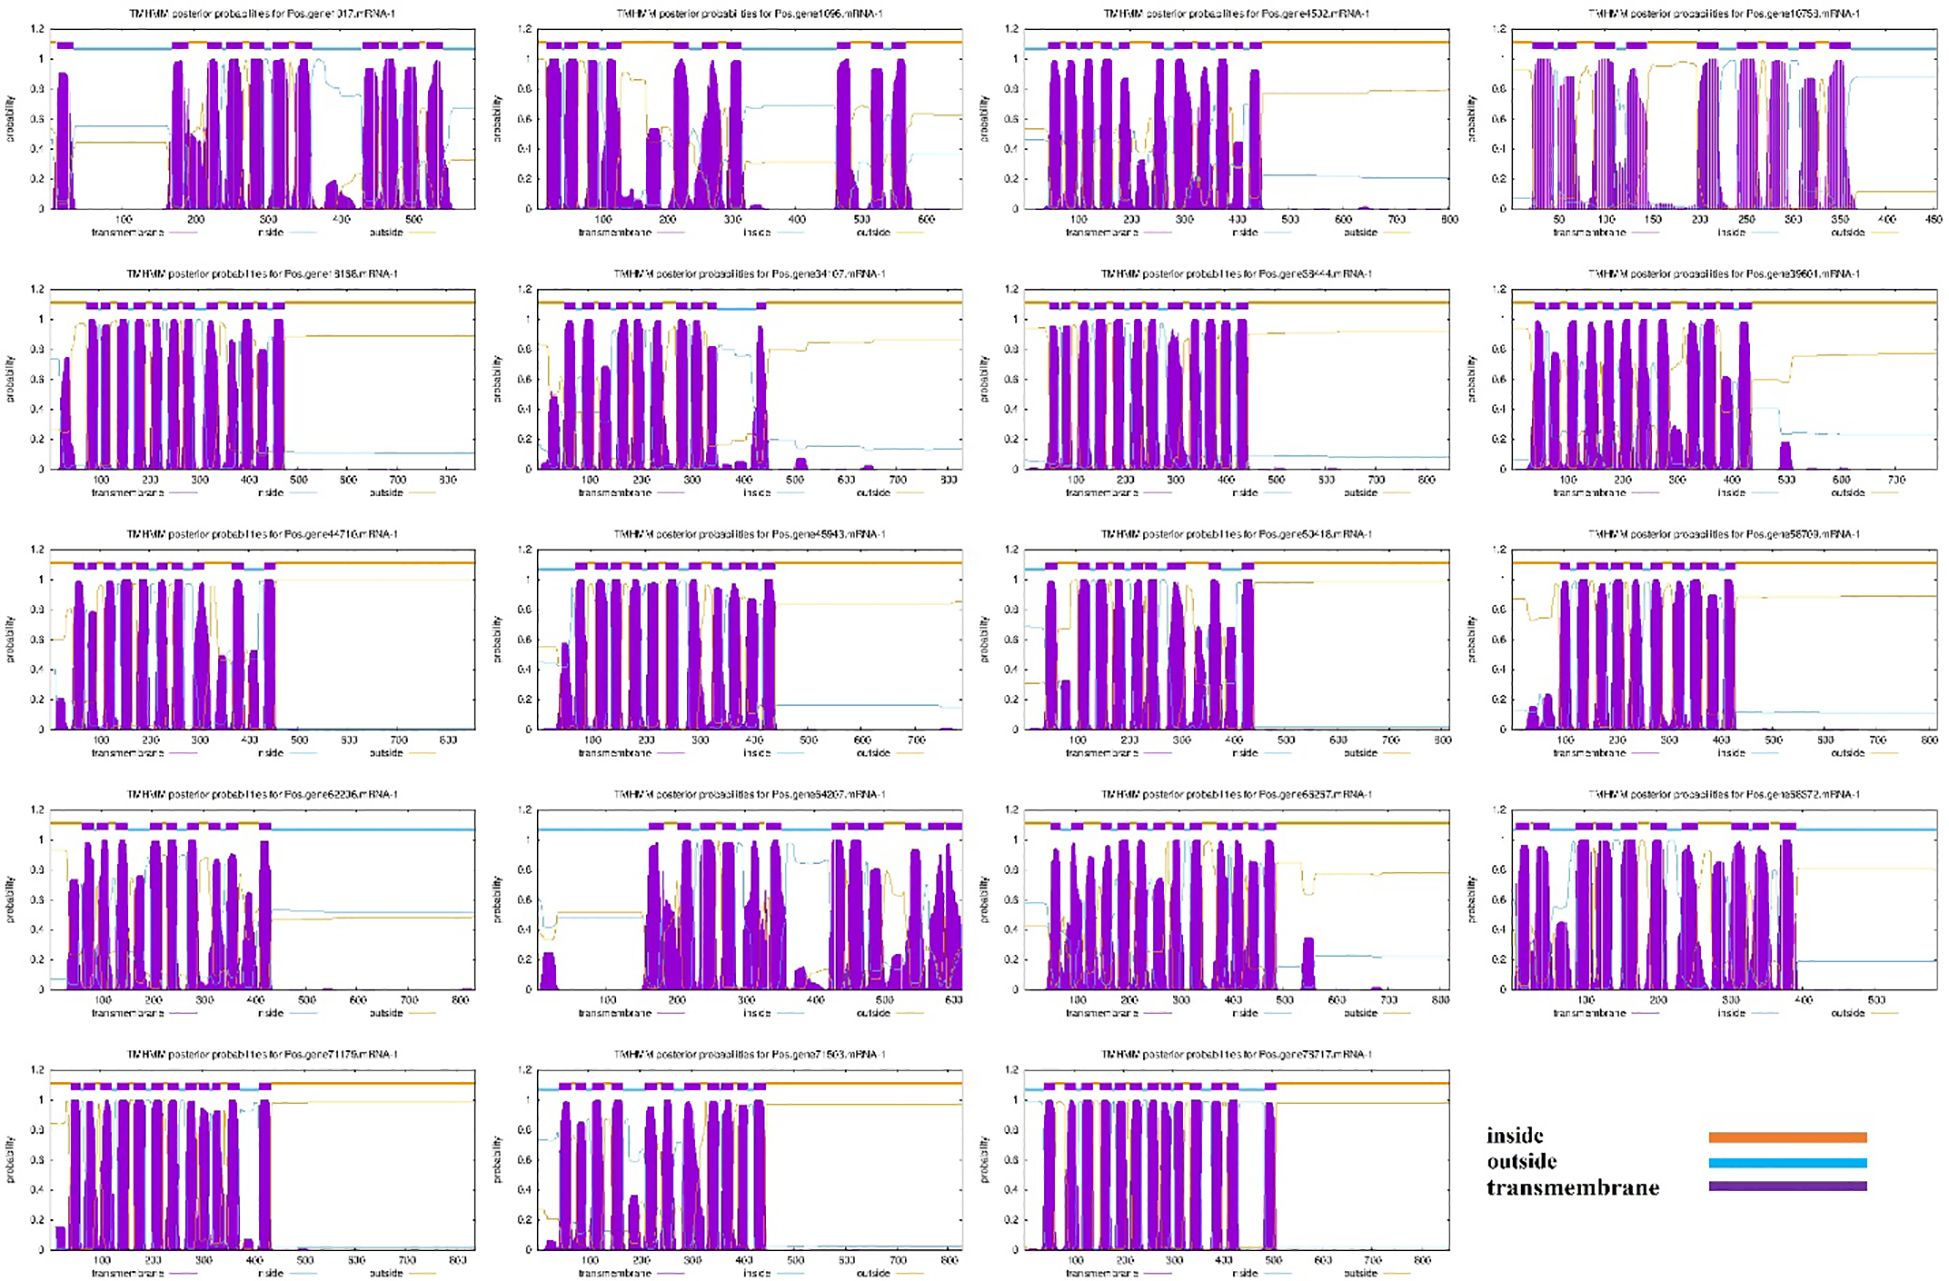
Figure 1. Transmembrane domains in PoSOS1 family members. The blue line denotes the outside, the orange line signifies the inside, and the purple line indicates the transmembrane region.
2.2 SOS1 protein phylogenetic relationships
The evolutionary relationships between several plant species were evaluated using a phylogenetic tree. Paeonia ostii, Kandelia obovata, and potato full-length protein sequences were obtained. A neighbor-joining tree was created utilizing 76 SOS1 proteins by repeated sequence alignment with the MEGA-X MUSCLE tool (Figure 2). This phylogenetic tree utilized protein sequences from 19 (Paeonia ostii), 20 (Kandelia obovata), and 37 (Solanum tuberosum). The SOS1 proteins were categorized into three groups: group 1 (light green), group 2 (orange), and group 3 (light blue) (Figure 2). The group had 40 SOS1 proteins, which were classified into various categories according to their species-specific traits. This subgroup consisted of 14 Paeonia ostii (Pos) proteins, five Kandelia obovata (Ko) proteins, and 21 Potato (PGSC) proteins. Group II comprised 22 SOS1 proteins, including two from Paeonia ostii (Pos), ten from Kandelia obovata (Ko), and ten from Potato (PGSC). Group III comprised 14 SOS1 proteins, including three from Paeonia ostii (Pos), five from Kandelia obovata (Ko), and six from Potato (PGSC). The data presented in Figure 2 indicate that Group I displayed a higher abundance of PoSOS1 members than Groups II and III. The PoSOS1 proteins are more similar to their counterparts in Kandelia obovata than those in the Potato.
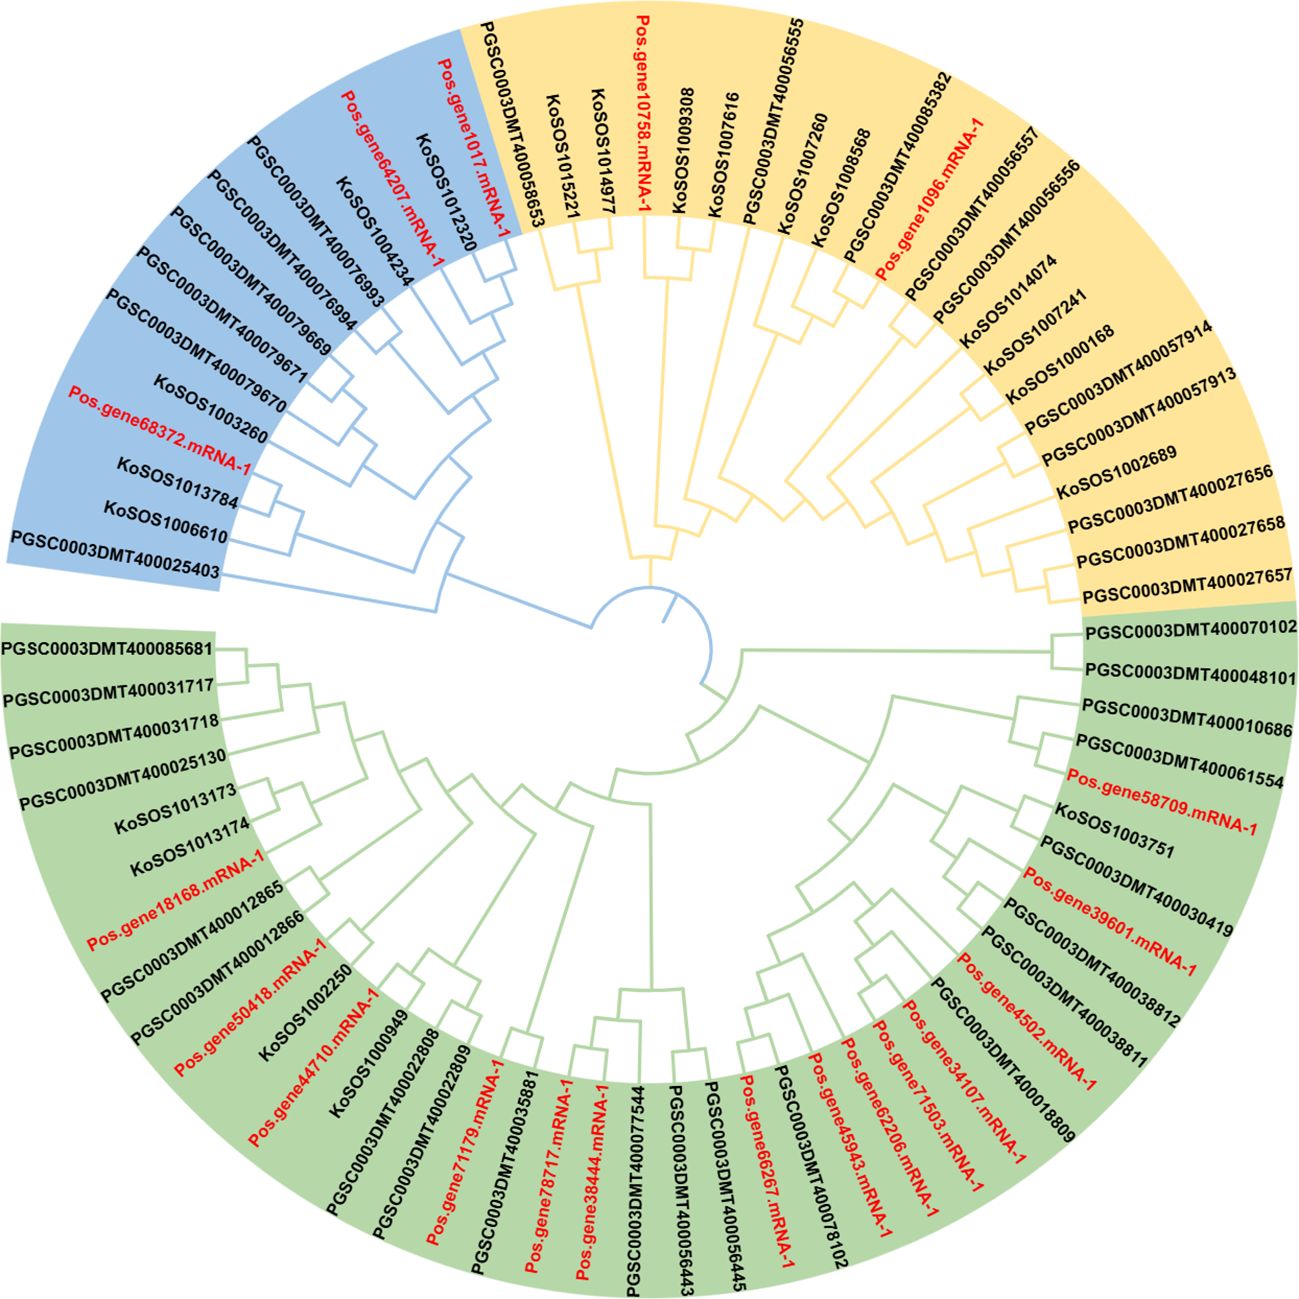
Figure 2. A phylogenetic analysis of SOS1 proteins from Paeonia ostii (Pos), Kandelia obovata (Ko), and Potato (PGSC) was conducted utilizing the maximum likelihood method. The SOS1 proteins were categorized into three distinct groups: Group 1 (light green), Group 2 (orange), and Group 3 (light blue), with each group denoted by a unique color. The red color text showed P. ostii SOS1 proteins.
2.3 Locations of PoSOS1s on chromosomes in the Paeonia ostii genome
A chromosomal map of PoSOS1s was created using the genome sequences of Paeonia ostii to understand better the process underlying the genomic distribution of PoSOS1s on the species’ chromosomes (Figure 3). The map analysis indicated that 17 of the 19 PoSOS1 genes resided on the P. ostii chromosome, while the remaining two were on the scaffold. Genes that encode members of the SOS1 protein family were located on all five chromosomes. Six genes (Pos.gene18168.mRNA-1, Pos.gene39601.mRNA-1, Pos.gene4502.mRNA-1, Pos.gene45943.mRNA-1, Pos.gene62206.mRNA-1, Pos.gene66267.mRNA-1) were located on chromosome 1, one gene (Pos.gene78717.mRNA-1) on chromosome 2, two genes (Pos.gene64207.mRNA-1, Pos.gene68372.mRNA-1) on chromosome 3, three genes (Pos.gene1096.mRNA-1, Pos.gene34107.mRNA-1, Pos.gene71503.mRNA-1) on chromosome 4, and five genes (Pos.gene1017.mRNA-1, Pos.gene10758.mRNA-1, Pos.gene38444.mRNA-1, Pos.gene58709.mRNA-1, Pos.gene71179.mRNA-1) on chromosome 5. While the two genes Pos.gene50418.mRNA-1 and Pos.gene44710.mRNA-1 were located on unchr_scaffold_1 and unchr_scaffold_972. The genes were predominantly uniformly allocated throughout the five chromosomes and two scaffolds (Figure 3; Supplementary Table S3).
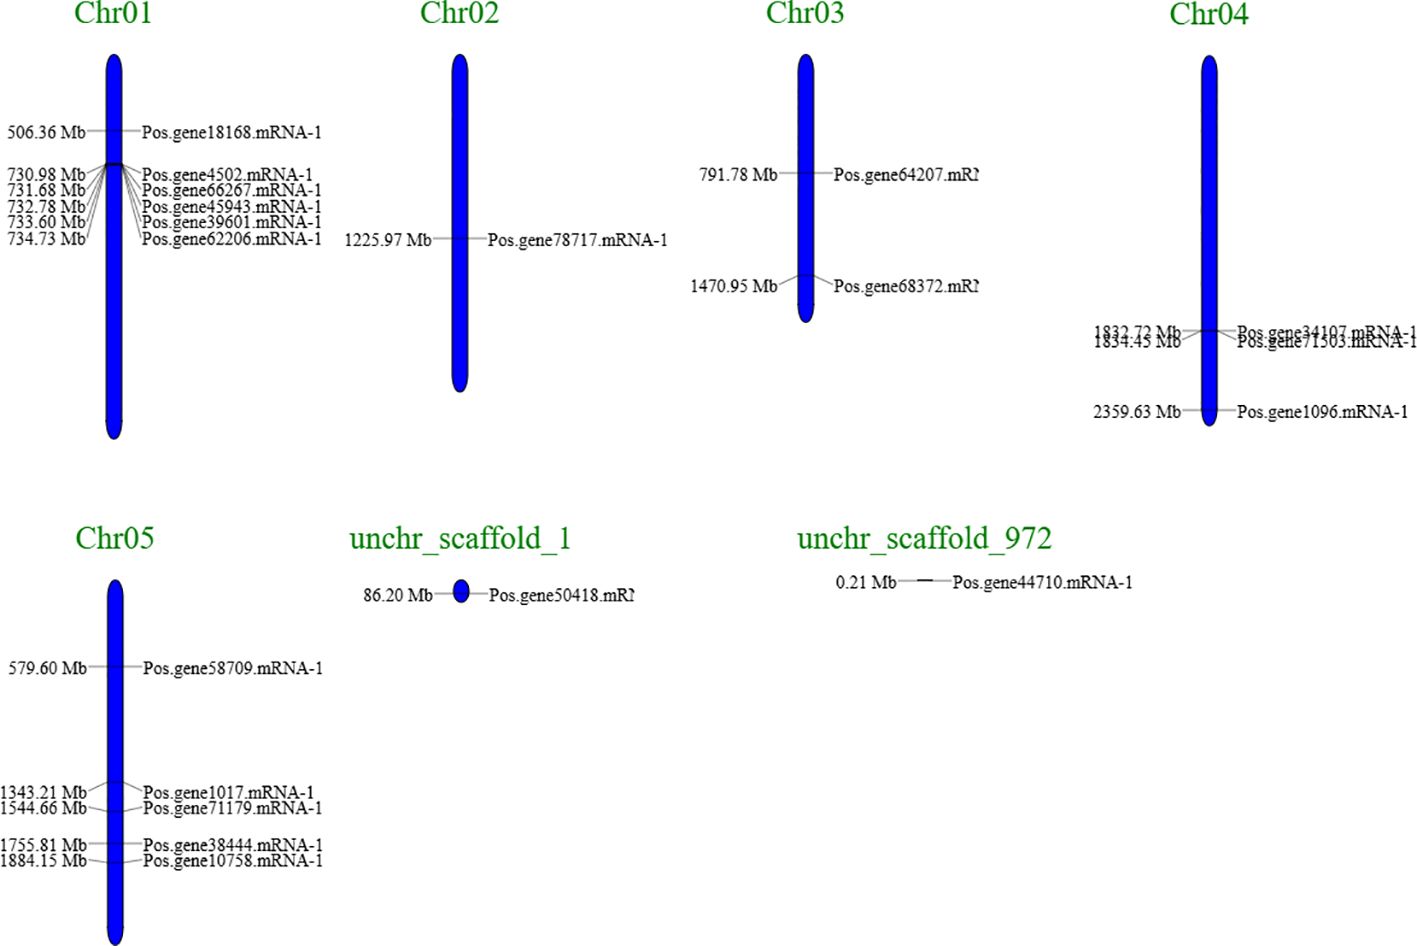
Figure 3. A schematic representation of the SOS1 gene distribution in Paeonia ostii included two scaffolds and five chromosomes, with the gene’s name on the right. The black inscriptions on the chromosomes denote the position of the SOS1 genes. The chromosomal numbers are located at the apex of each chromosome (Chr).
2.4 PoSOS1s collinearity analysis
The collinearity analysis results are presented in Figure 4, which shows the genomic relationships between Paeonia ostii, Kandelia obovata, and Potato. In this analysis, we used 19 Paeonia ostii genes as a query to search against a database of 57 genes, comprising 20 genes from Kandelia obovata and 37 genes from Potato. The results were visualized using a ‘score/max’ ratio coloring scheme, where blue (≤0.25) indicates low collinearity, green (≤0.50) indicates moderate collinearity, orange (≤0.75) indicates high collinearity, and red (>0.75) indicates very high collinearity. As shown in Figure 4, a clear pattern of collinearity is evident between the Paeonia ostii genes and their counterparts in Kandelia obovata and Potato, with several regions exhibiting high collinearity (orange to red). These findings suggest that conserved genomic areas exist across the three species.
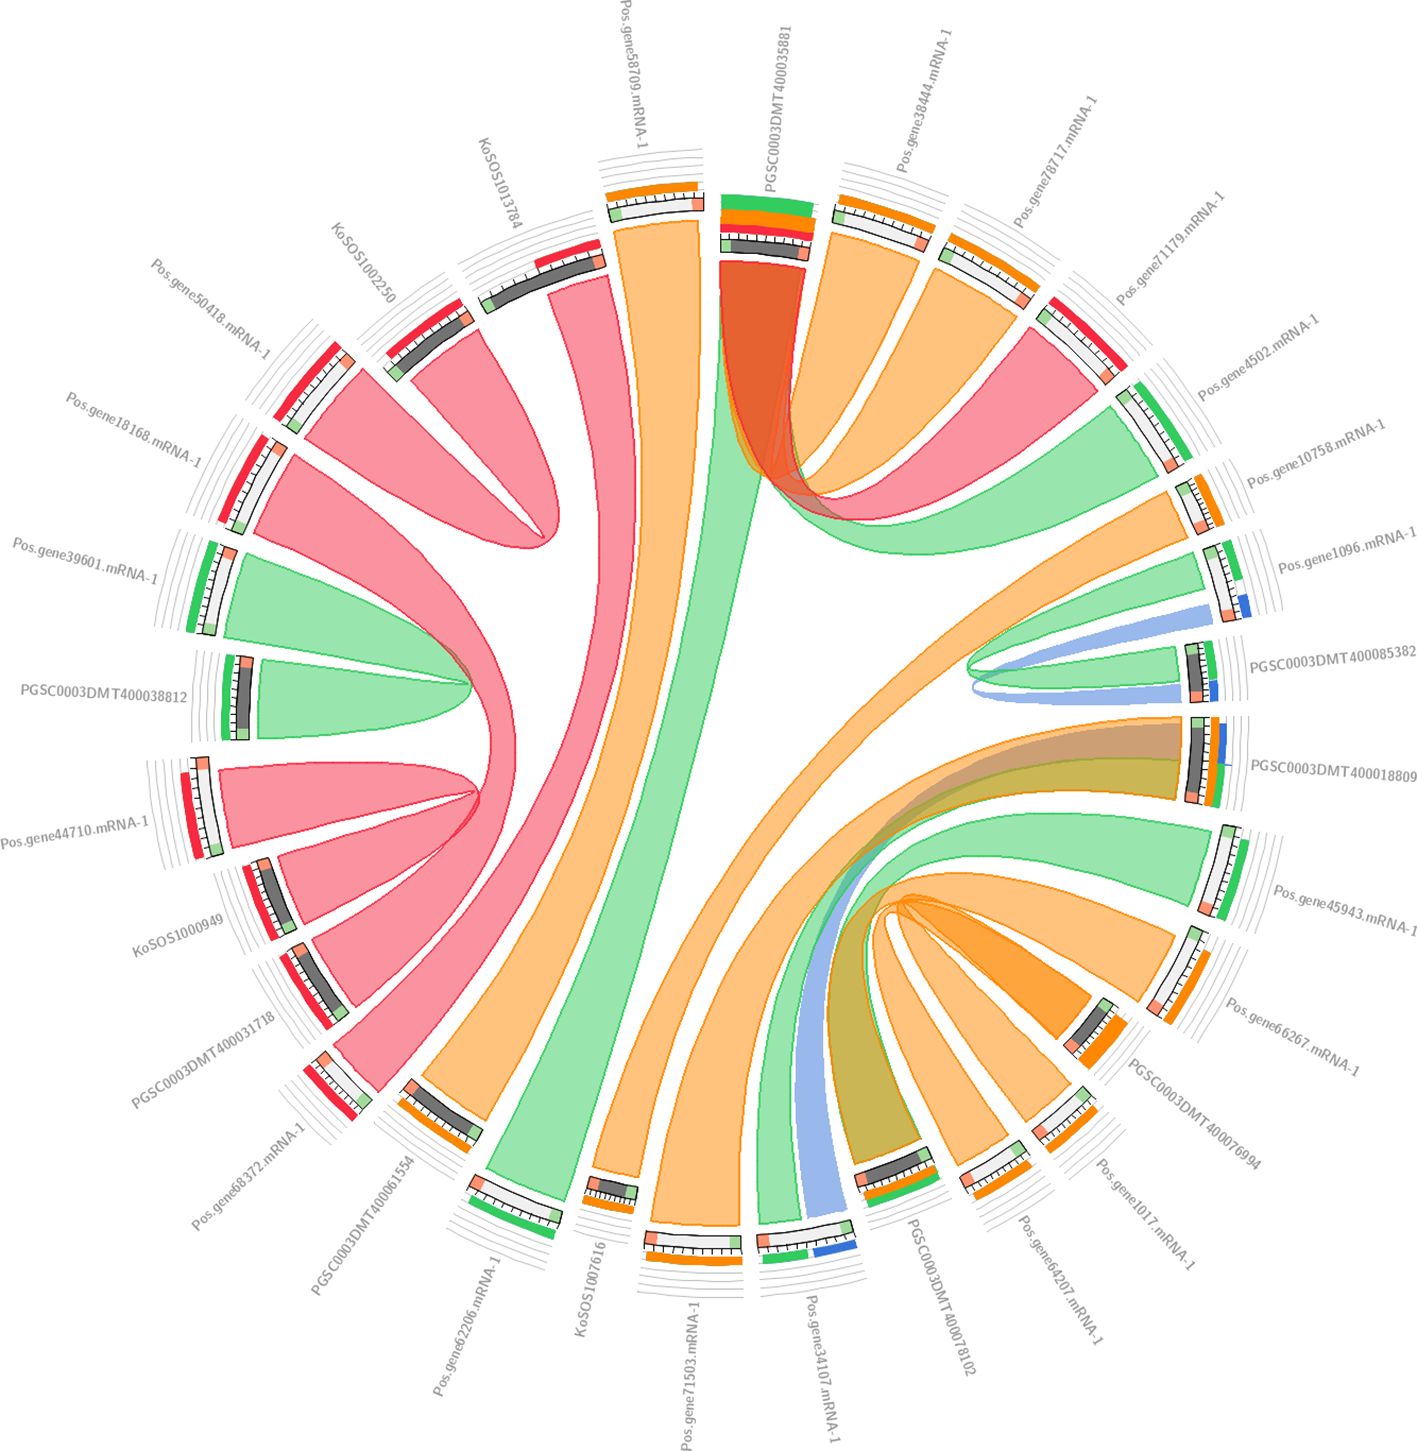
Figure 4. Collinearity analysis results between Paeonia ostii, Kandelia obovata, and Potato. In Circos, the colors blue <=25%, green <=50%, orange <=75%, and red >75% all display their sequential identity in the explosion.
2.5 Investigation of the SOS1 gene structure and conserved motifs
An investigation of gene structure and conserved motifs was done to elucidate the association between the structure and function of PoSOS1 proteins, creating distinct phylogenies. A phylogenetic tree was created using the individual sequences of the SOS1 protein. The SOS1 proteins were classified into three groups: Group 1, green color text; Group II, orange color text; and Group III, blue color text. The study examined the exon-intron configurations of the SOS1 genes to explore gene expansion within the Paeonia ostii family. Examining exon-intron architectures and conserved motifs, as depicted in Figure 5, we identified that the SOS1 gene displays a variable number of exons (from 3 to 20) and introns (from 4 to 21). Group I included a relatively limited number of introns, ranging from 4 to 9, whereas Groups II and III exhibited a more extensive range, from 19 to 21. Pos.gene64207.mRNA-1 exhibited the maximum quantity of exons (20) and introns (21), as illustrated in Figure 5. The study demonstrated that the SOS1 genes in Paeonia ostii exhibit a highly conserved gene structure, signifying a notable similarity to those in closely related species. To further examine the evolutionary variety of the PoSOS1 family, the conserved motifs of the 19 PoSOS1 proteins were analyzed using MEME online software, identifying 15 distinct conserved motifs (designated motifs 1–15) (Figure 5). The conserved motifs in all SOS1 genes displayed a variation of two to 15. The results showed that motifs 2, 5, and 6 have been detected in 17 proteins. Motif 7 was identified in 13 proteins, and motifs 1, 3, 4, 8, 9, and 10 were identified in 14 proteins. We also found that 15 motifs were primarily distributed in Groups 1 (14-15), while four motifs, including 2, 5, 6, 10, and 15 were found in Group 2, and motifs 2, 5, and 10 were found in Group 3. Motif 10 identified two copies in protein Pos.gene71503.mRNA-1.
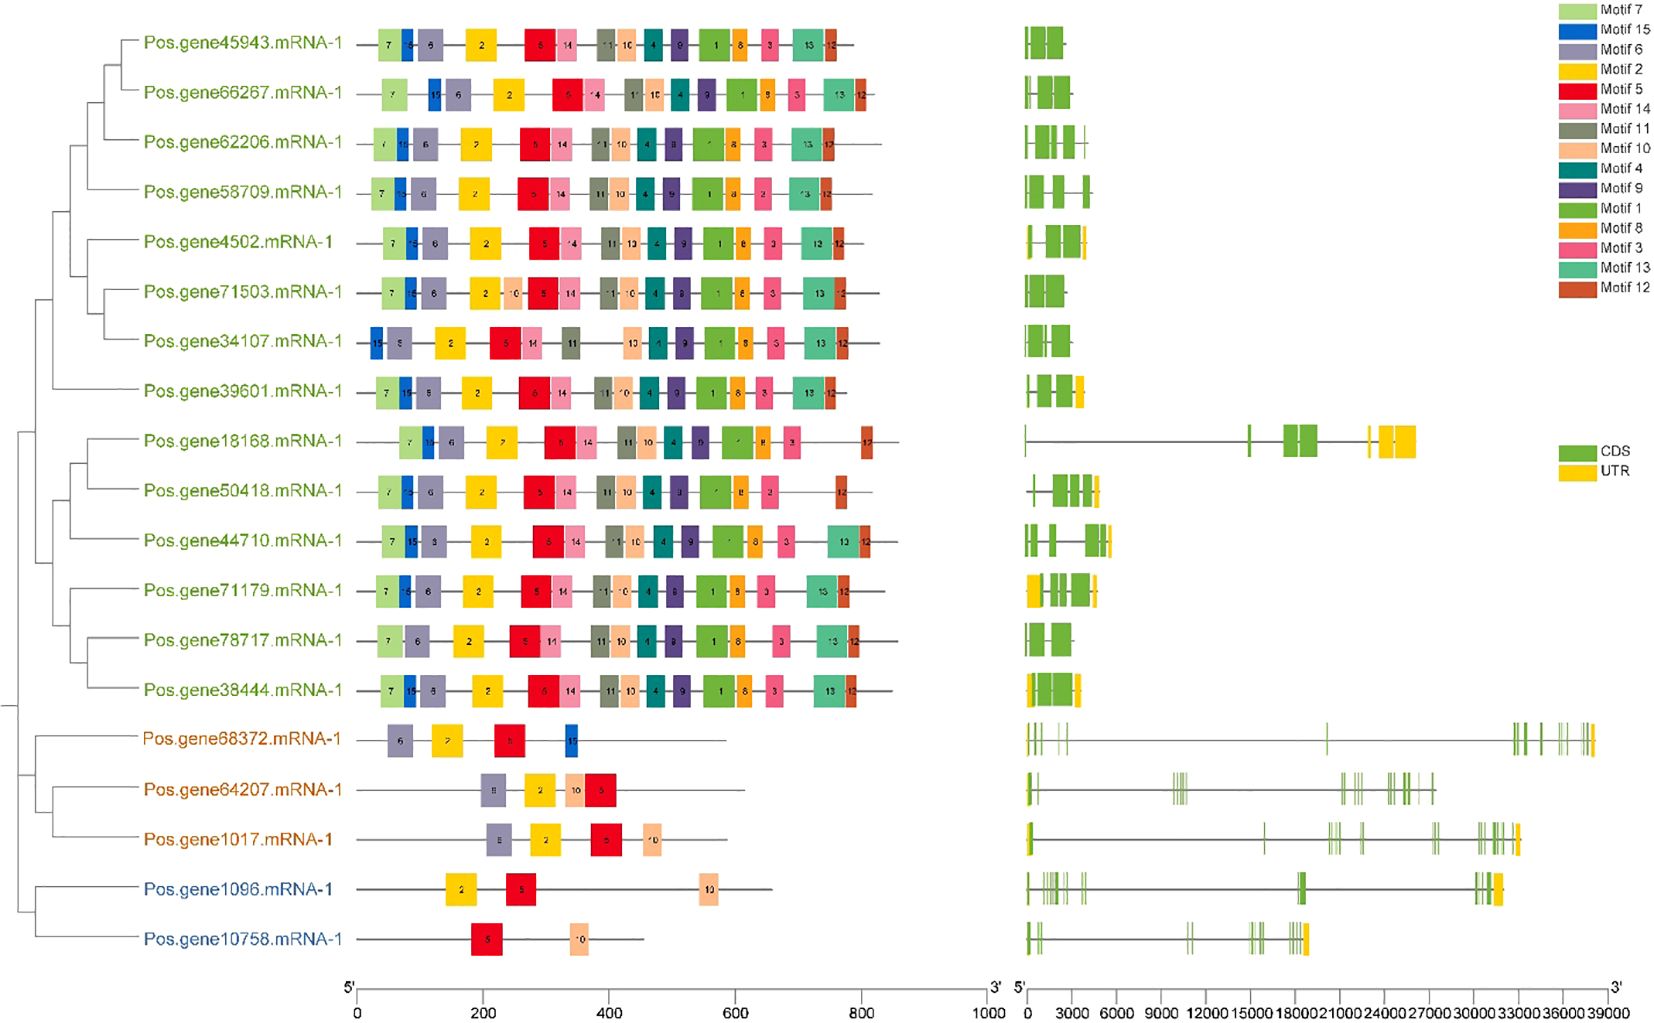
Figure 5. Investigations were undertaken about the gene structure and motif composition of the SOS1 gene family in Paeonia ostii. In the phylogenetic tree, the green text shows Group I, the orange color shows Group II and the blue text shows Group III. The SOS1 genes identified in the genome were categorized into three distinct categories based on their evolutionary relationships, with particular attention to the gene structure of the SOS1s. The UTR sections are graphically represented in yellow, whereas the CDS or exons are also depicted in green. A black horizontal line denotes introns. Furthermore, the conserved patterns in the SOS1s are defined by a specific letter. Vibrantly hued boxes featuring various patterns are exhibited.
2.6 Variation across the SOS1 family in terms of 3D and secondary structure
All PoSOS1 proteins were subjected to 3D modeling (Figure 6), and the detailed results of the projected templates are presented in Supplementary Table S2. Four unique templates were discovered, including c5bz2A, c8pvrA, c4bwzA, and c5bz3A, which displayed a 100% confidence level. The high confidence level of various templates proposes reliable structural estimates. Briefly, six proteins, including Pos.gene34107.mRNA-1, Pos.gene62206.mRNA-1, Pos.gene64207.mRNA-1, Pos.gene66267.mRNA-1, Pos.gene71179.mRNA-1, and Pos.gene71503.mRNA-1 were modeled based on the “c4bwzA” template, while five proteins, including Pos.gene1017.mRNA-1, Pos.gene18168.mRNA-1, Pos.gene38444.mRNA-1, Pos.gene45943.mRNA-1, and Pos.gene68372.mRNA-1 were modeled based on the “c5bz2A” template. The other six proteins include Pos.gene39601.mRNA-1, Pos.gene44710.mRNA-1, Pos.gene4502.mRNA-1, Pos.gene50418.mRNA-1, Pos.gene58709.mRNA-1, and Pos.gene78717.mRNA-1 were modeled based on the “c5bz3A” template, while two proteins, including Pos.gene10758.mRNA-1 and Pos.gene1096.mRNA-1 were modeled based on the “c8pvrA” template. The flexible structures emphasized by coils may aid the functional adaptability of PoSOS1 proteins.
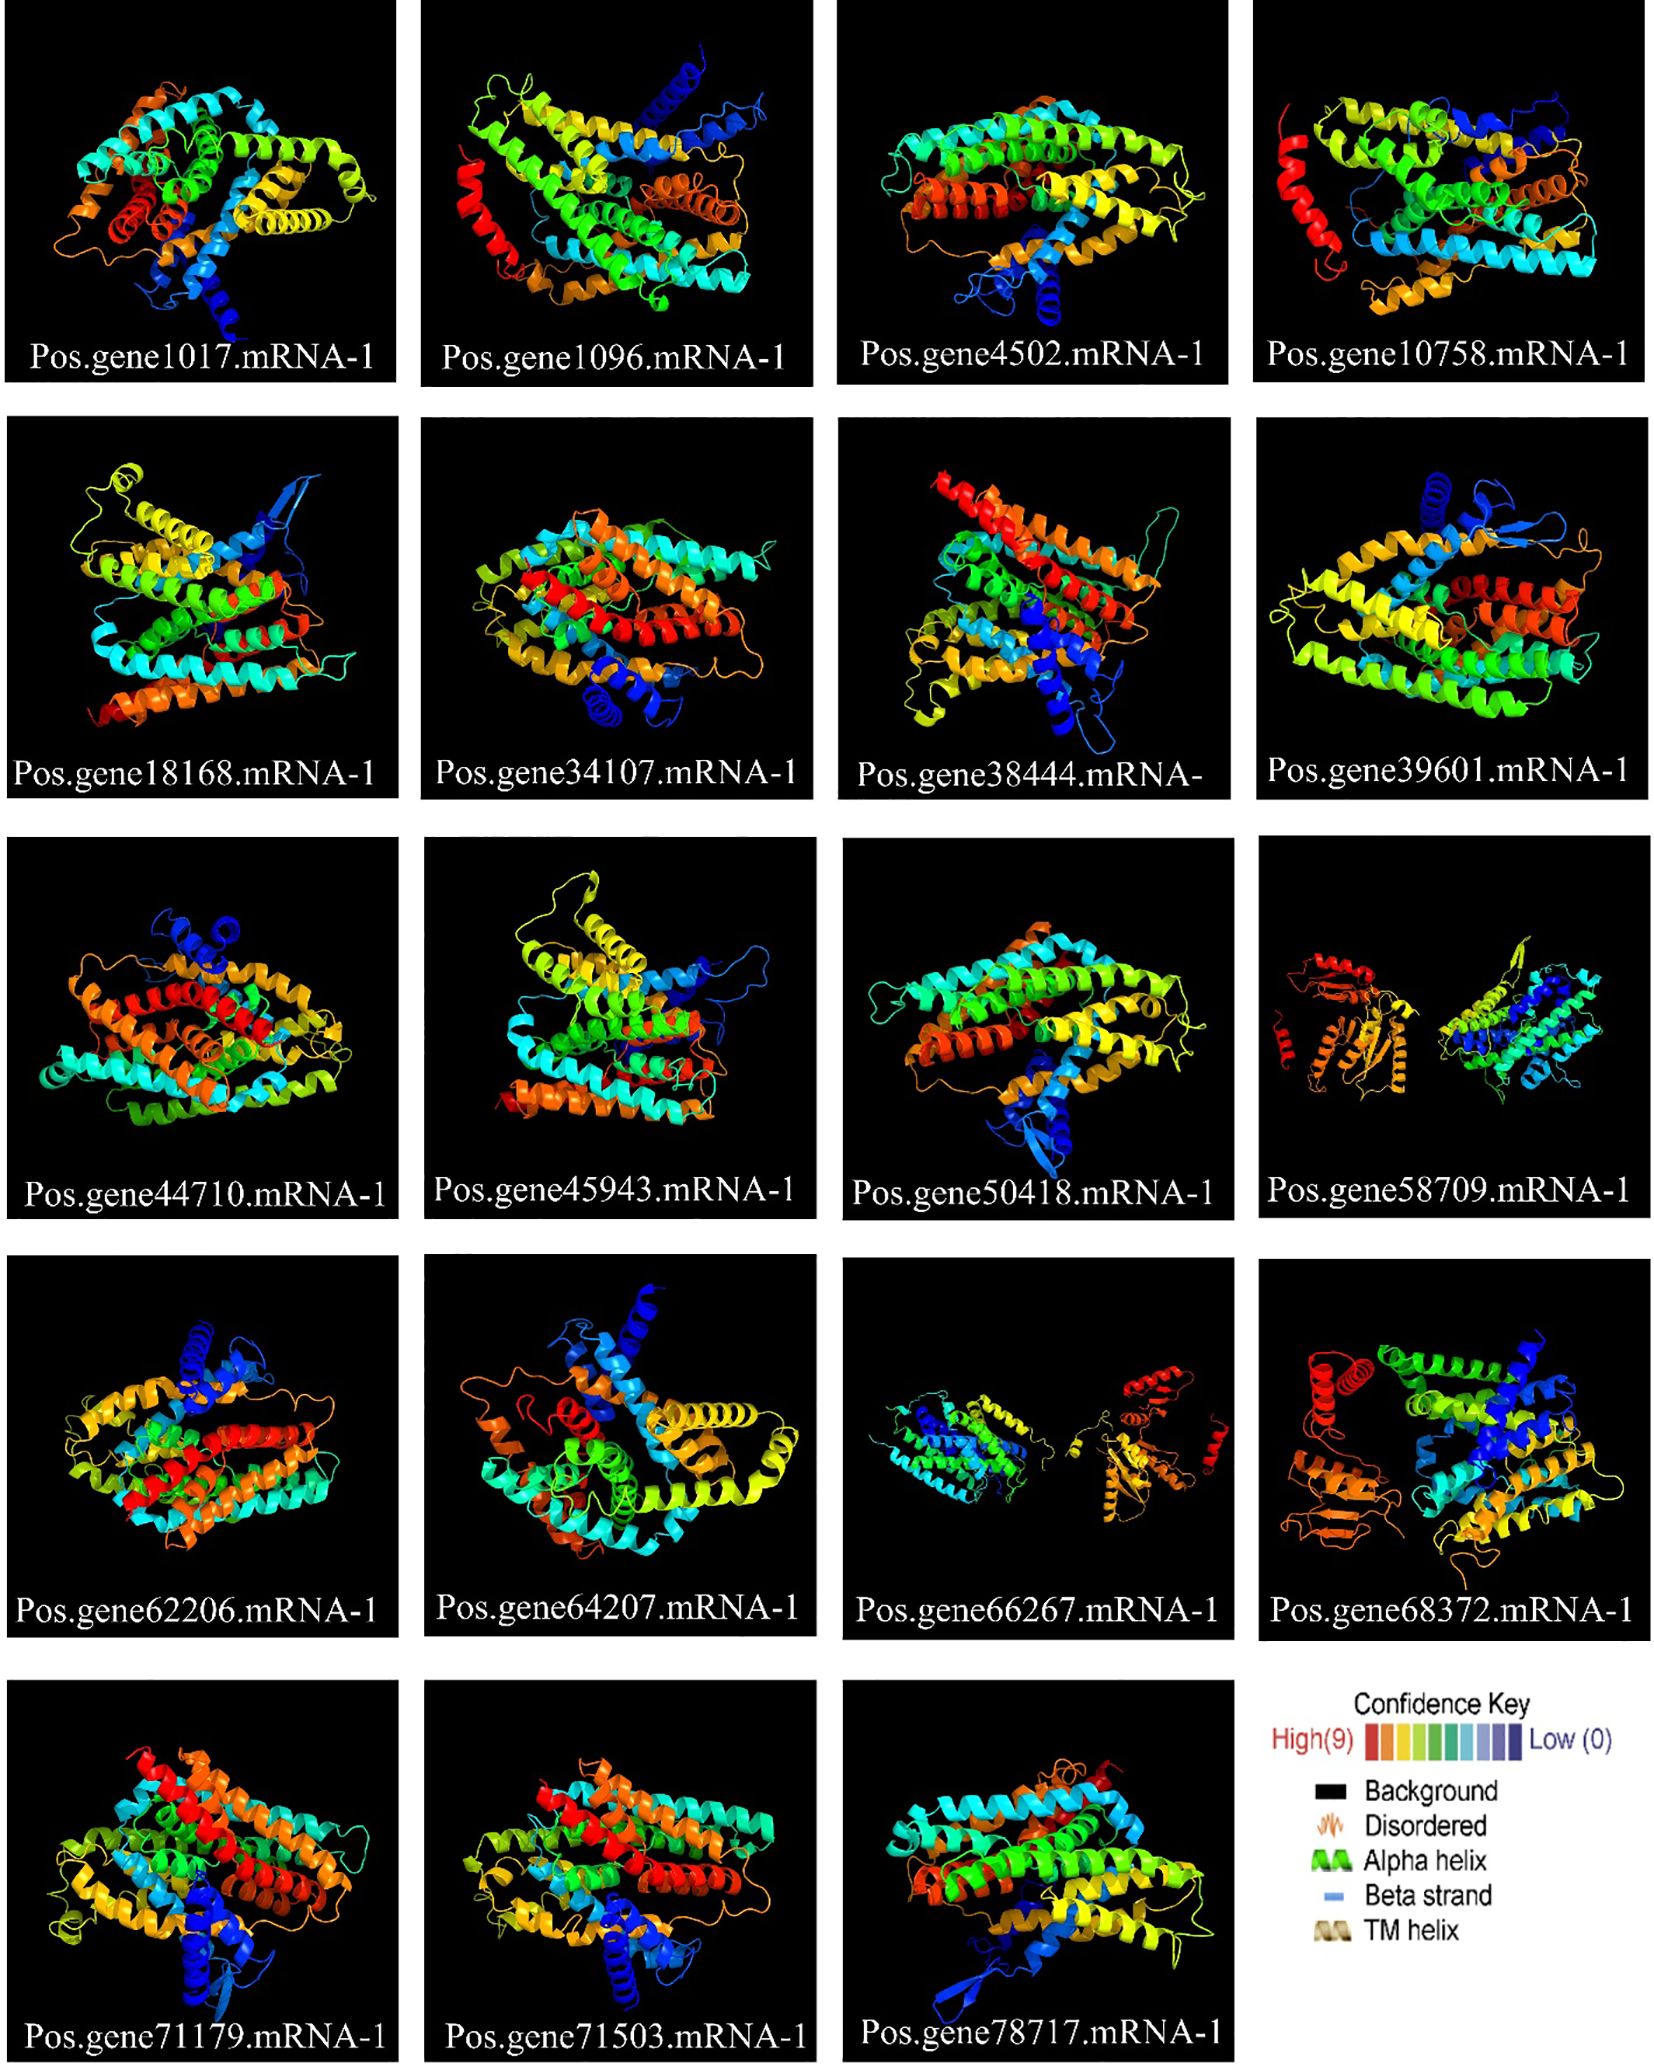
Figure 6. Protein 3D structures and modeling. Also, see Supplementary Table S4 for detailed results.
The secondary protein structure results showed transmembrane (TM) helices, beta strands, alpha helices, and protein disorder (Supplementary Table S4). Among all the 19 PoSOS1 proteins, the alpha helix ranged from 43% (Pos.gene78717.mRNA-1) to 65% (Pos.gene64207.mRNA-1), beta-strand ranged from 0% (Pos.gene10758.mRNA-1) to 11% (Pos.gene34107.mRNA-1), transmembrane (TM) helix ranged from 28% (Pos.gene78717.mRNA-1) to 45% (Pos.gene10758.mRNA-1 and Pos.gene64207.mRNA-1), and disordered ranged from 12% (Pos.gene68372.mRNA-1) to 24% (Pos.gene1017.mRNA-1) (Supplementary Table S4). These scores advise significant adaptability in the structural elements of PoSOS1 proteins, implying diverse functional roles. The broad scope of secondary structure elements highlights these proteins’ structural complexity and possible adaptability.
2.7 Prediction of cis-elements in the promoter sequences of PoSOS1 genes
To clarify which hormonal, environmental stress, or developmental-related signal elements are involved in these PoSOS1s, we performed a promoter analysis using the PlantCARE server. A total of 10 critical cis-acting elements, including abscisic acid, auxin, circadian control, defense and stress, drought, gibberellin, light, low-temperature, MeJA, and salicylic acid, were annotated from the 2,500 bp upstream promoter region of the 19 PoSOS1 genes (Figure 7). Concerning the PoSOS1 genes, it is noteworthy that among all 10 cis-acting elements, light-responsive cis-regulatory elements accounted for the most significant proportion (84.41%). Hormone-related cis-elements, including abscisic acid, auxin, gibberellin, MeJA, and salicylic acid, accounted for 29.65%, 9.05%, 11.56%, 42.21%, and 7.54%. In contrast, abiotic stress-related elements, including circadian control, defense and stress, drought, light, and low-temperature, accounted for 2.06%, 3.82%, 3.82%, 84.41%, and 5.88% of the total (Figure 8). The variation in the response components demonstrated the regulatory functions of PoSOS1 genes in numerous physiological and biological processes (Supplementary Table S5).
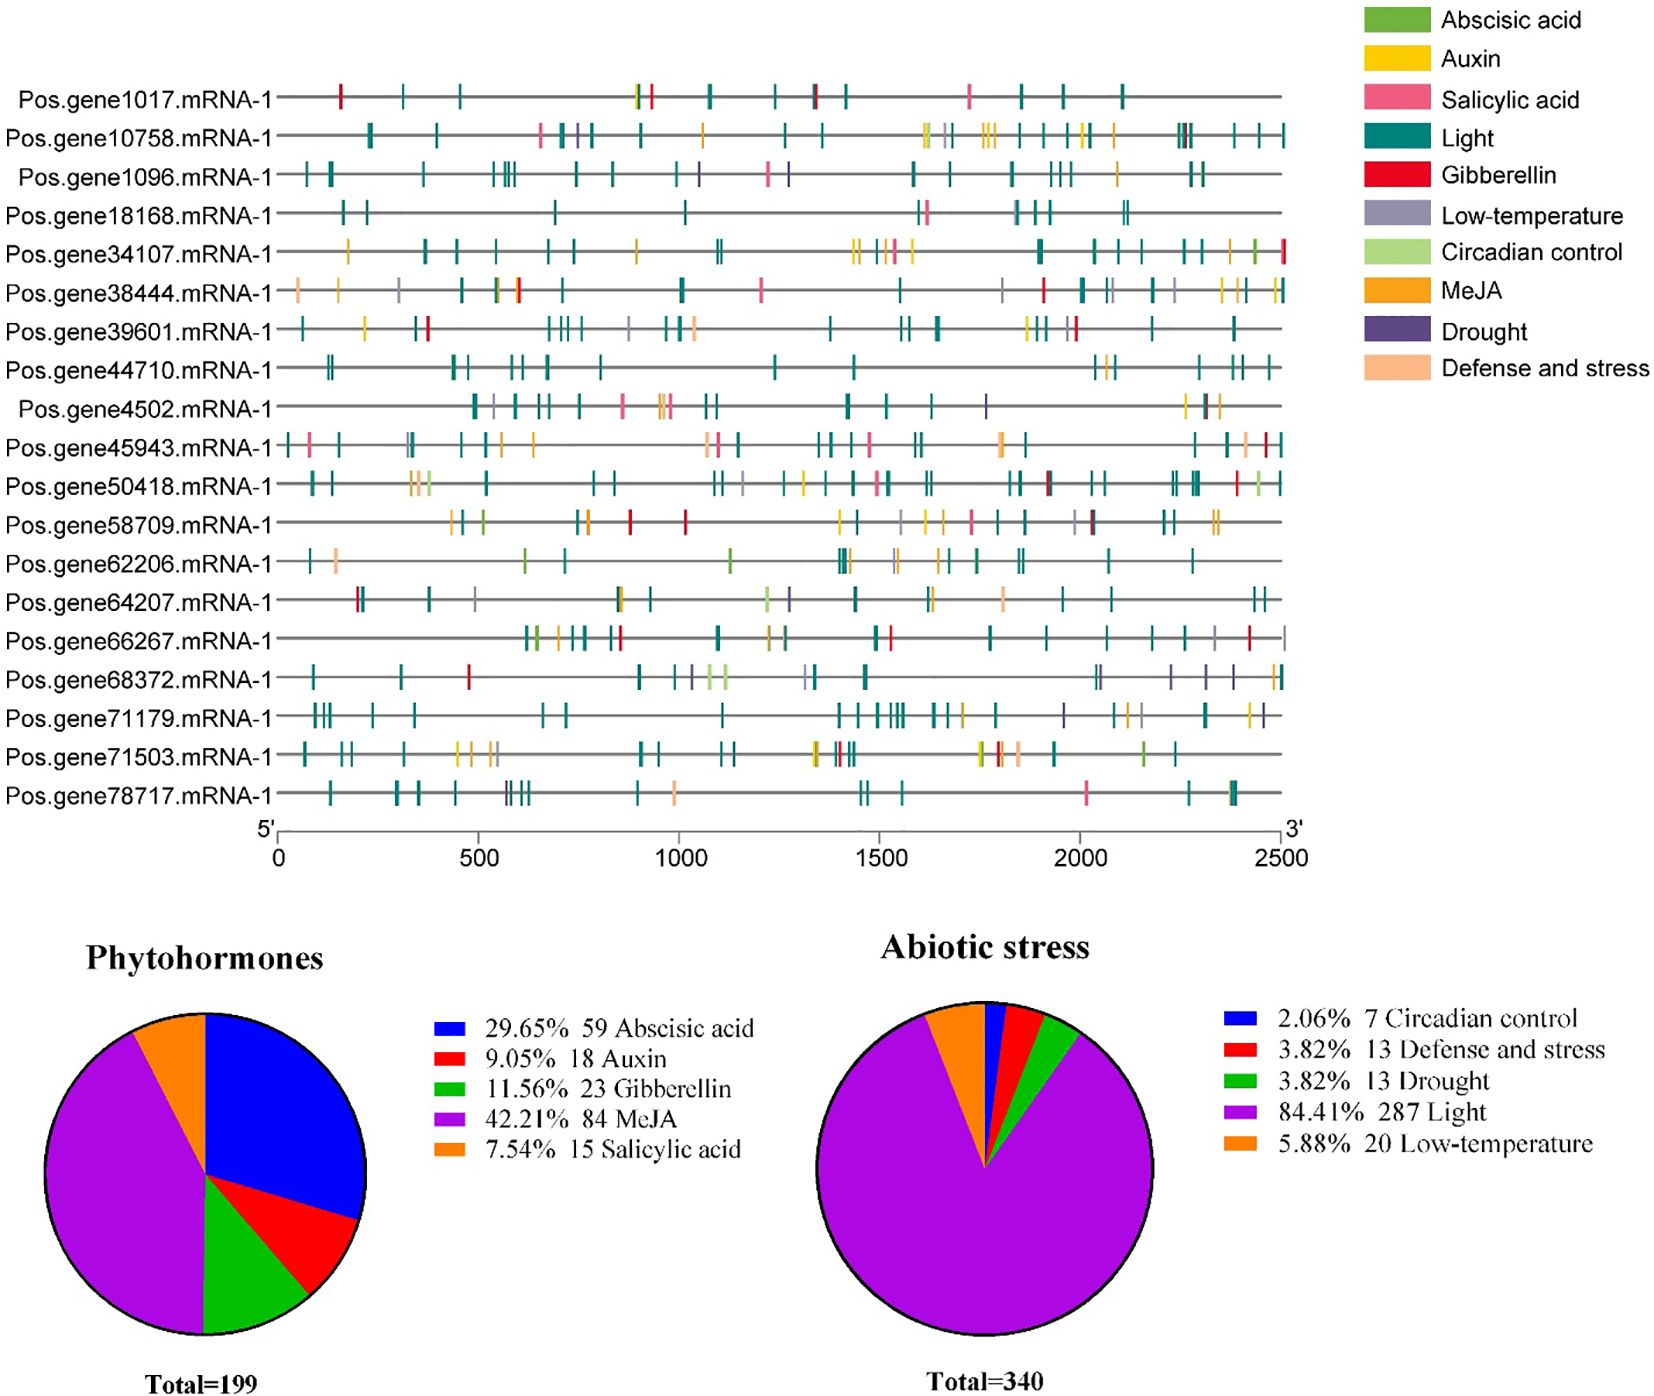
Figure 7. The anticipated cis-regulatory regions within the promoter of the PoSOS1 genes. This legend employs diverse colors to represent distinct cis-elements metaphorically. Diverse cis-elements involved in abiotic stress and phytohormone responses are shown with diverse colors.
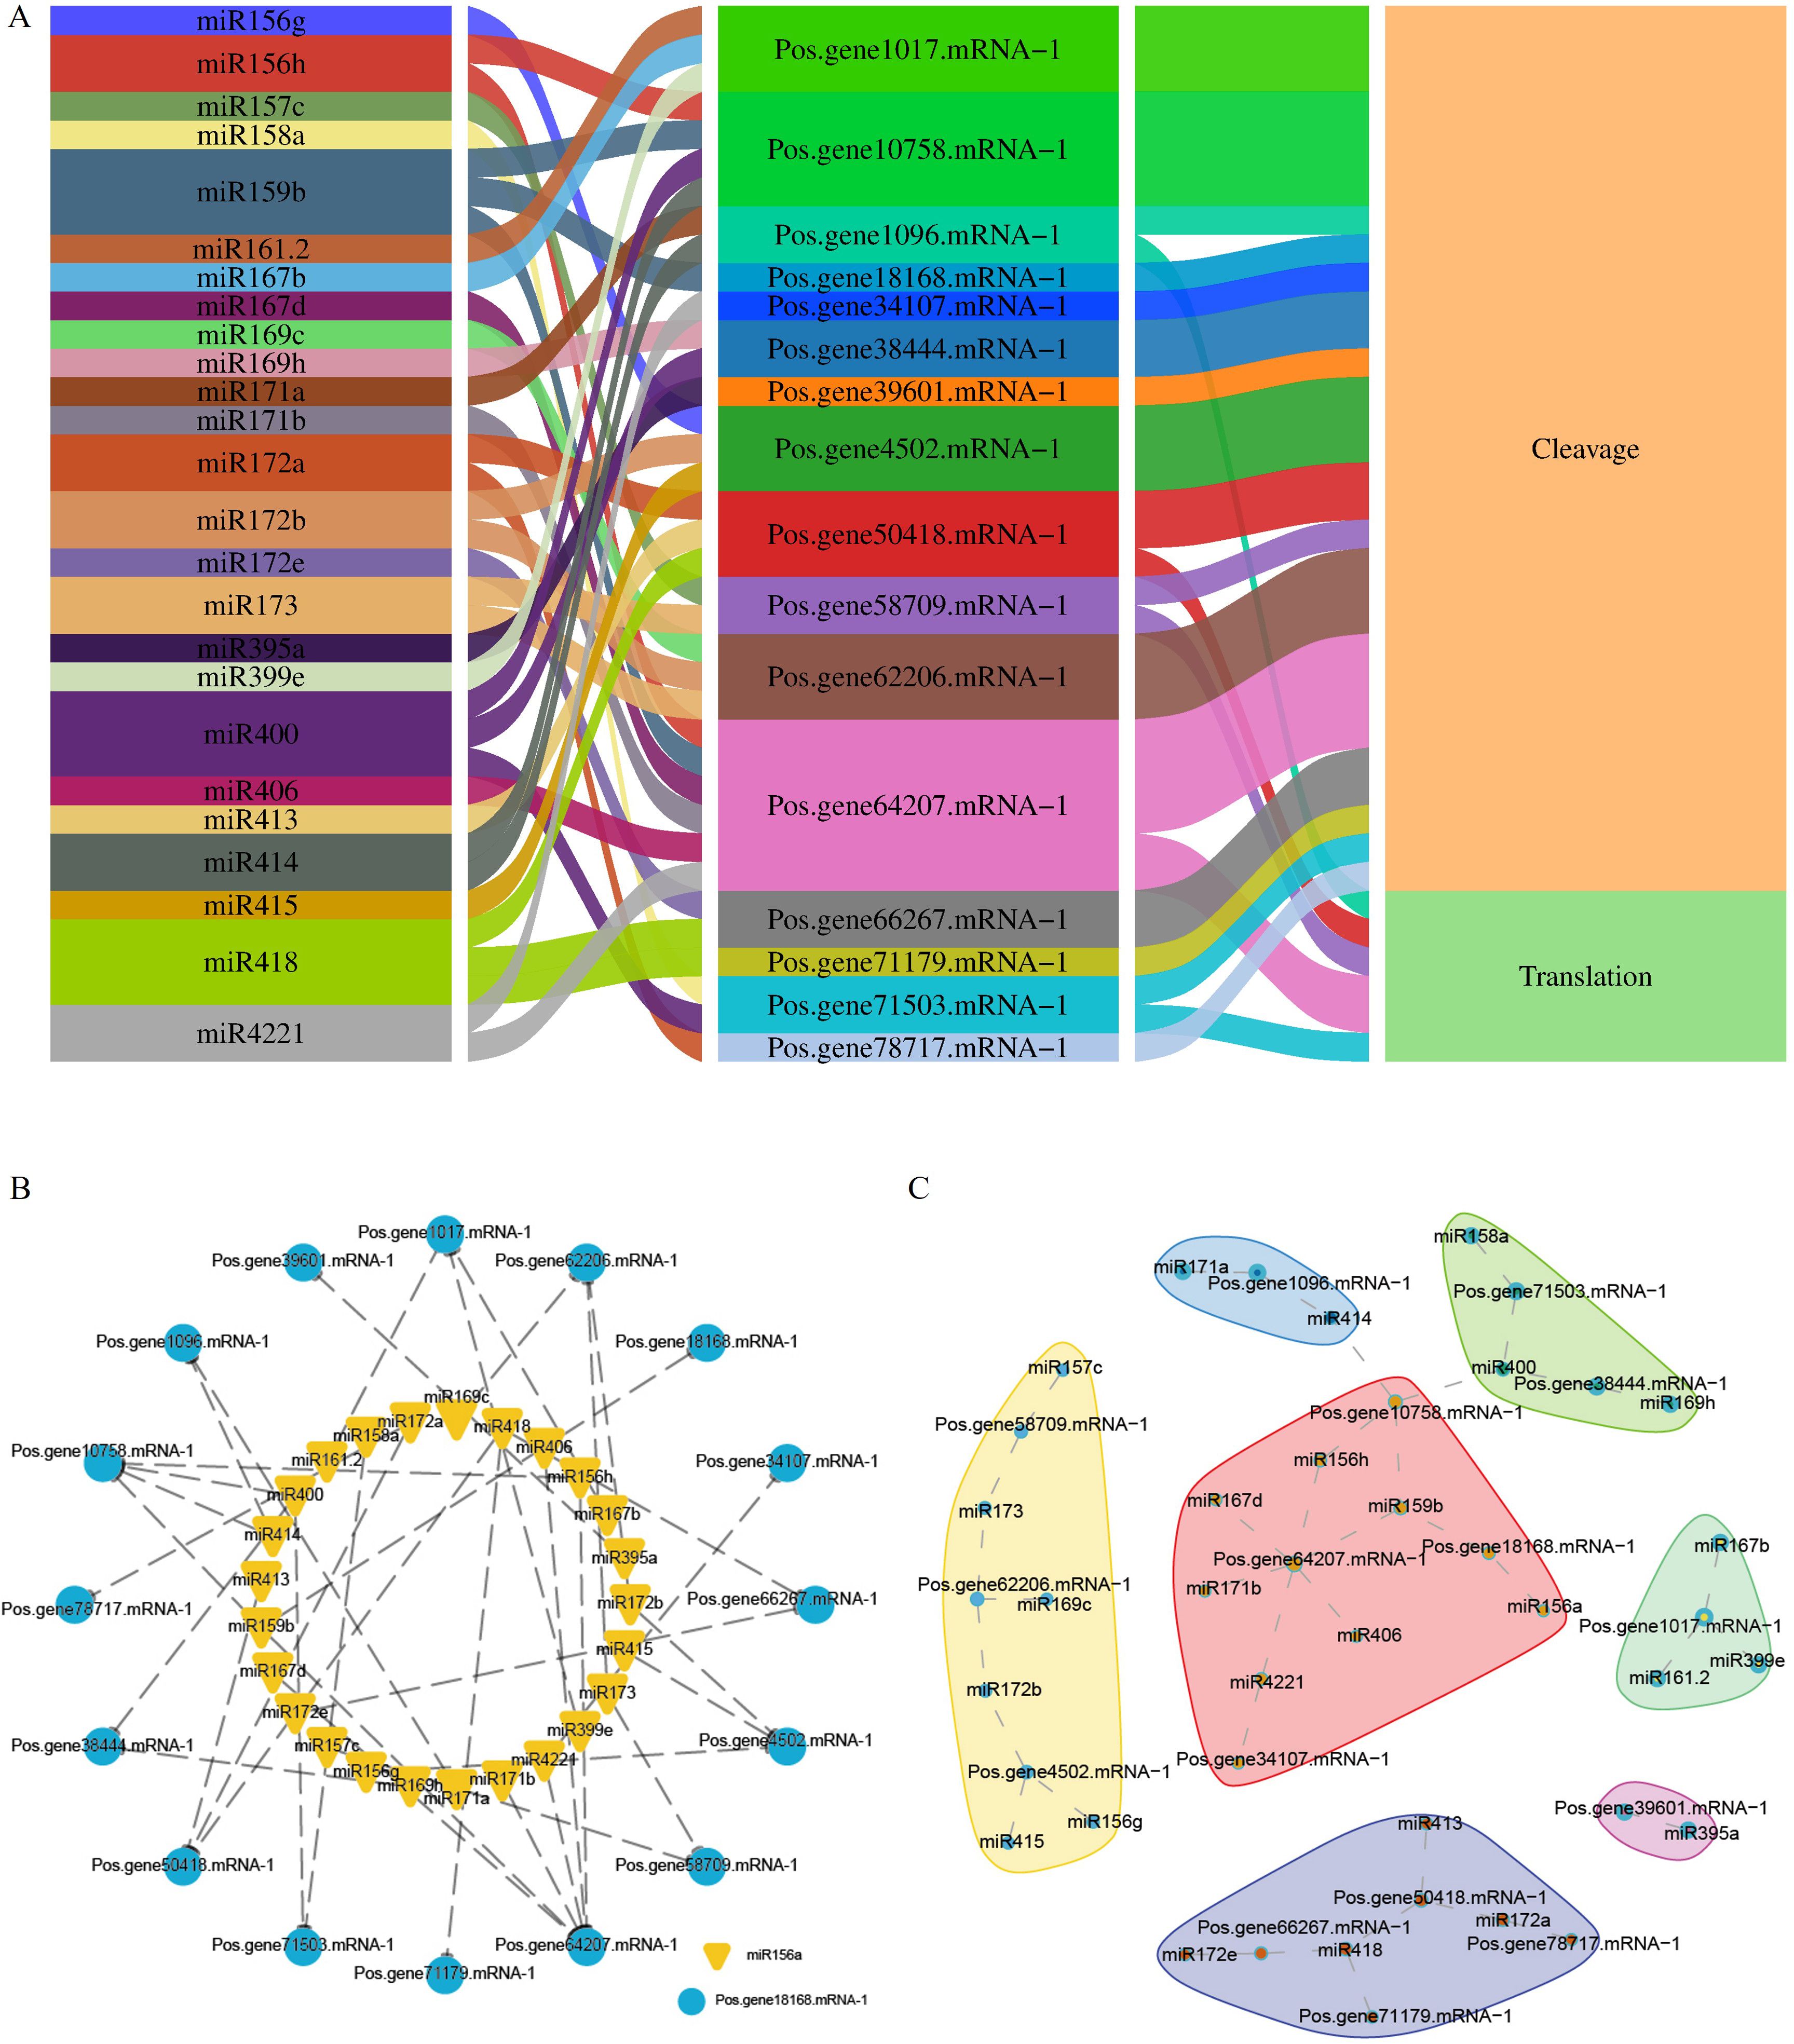
Figure 8. miRNA interactions with PoSOS1 genes. (A) A Sankey diagram shows the connections among miRNAs, target genes, and their inhibitory effects. (B, C) Correlation and network analysis display the predicted miRNA interactions with PoSOS1 genes.
2.8 Ka/Ks calculation and Protein pairwise similarity matrix of PoSOS1 proteins
The selection pressure between tandem and segmental duplications was evaluated by computation of the Ka/Ks ratio. Concerning the evolutionary mechanism, genes are subjected to various forms of selection pressure, indicated by the ratios of Ka/Ks < 1, Ka/Ks = 1, and Ka/Ks > 1, corresponding to purifying selection, neutral selection, and positive selection. A collinearity association test investigated gene duplication within the PoSOS1 gene family. For five pairs of PoSOS1 members, the Ka/Ks ratio was <1, suggesting that all PoSOS1 duplicated genes were under purifying or negative selection. In one pair, Pos.gene18168.mRNA-1 and Pos.gene50418.mRNA-1, the Ka (nonsynonymous) value was 0.2268, but the Ks (synonymous) value was NaN, so the Ka/Ks value was NaN (Table 2). To investigate the similarities among the 19 PoSOS1 proteins, we generated a protein pairwise similarity matrix using TBtool v2.516. The matrix shows the pairwise similarity scores between each pair of proteins, ranging from 2.57 to 73.71. The similarity matrix is shown in Supplementary Table S6. The matrix is symmetric, with the diagonal elements representing the self-similarity of each protein.
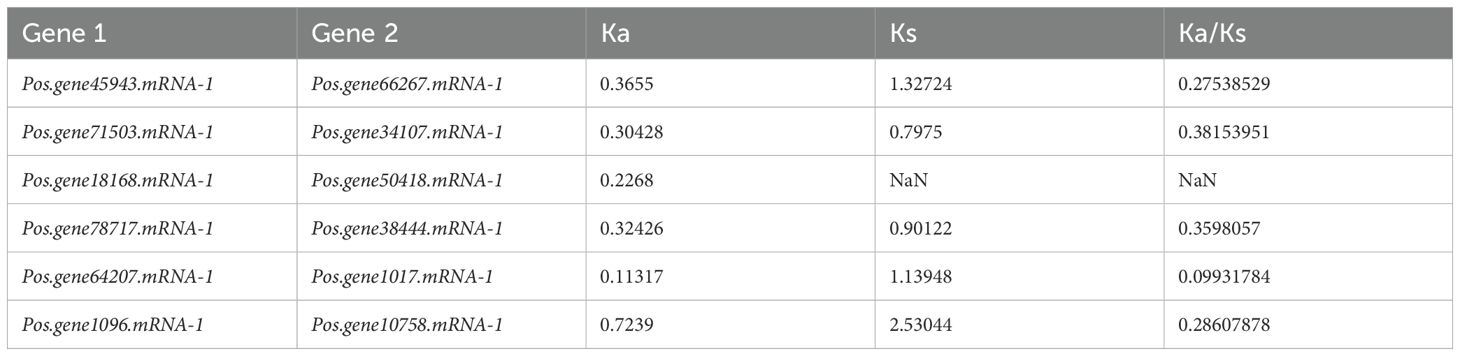
Table 2. Ka/Ks analysis of PoSOS1 genes.
2.9 Identification of miRNAs that target PoSOS1 genes
This study identified 38 miRNAs that target 19 genes from 18 distinct families (Figure 8A). In total, 27 miRNAs influenced 13 PoSOS1 genes through cleavage, while six miRNAs affected five PoSOS1 genes via translation. Notably, four miRNAs—miR159b, miR400, miR414, and miR4221—demonstrated inhibitory effects on different genes (Figure 8A). These findings indicate that various miRNAs play a role in the post-transcriptional regulation of PoSOS1 genes by interacting with them through cleavage and translation. Figures 8B, C illustrates the correlations and networks between miRNA-targeted and PoSOS1 genes. The results indicated that the Pos.gene1017.mRNA-1 was targeted by three miRNAs (miR161.2, miR167b, miR399e), whereas Pos.gene10758.mRNA-1 was targeted by four miRNAs (miR156h, miR159b, miR400, miR414). Six miRNAs, such as miR156h, miR167d, miR171b, miR406, miR159b, and miR4221 targeted one gene (Pos.gene64207.mRNA-1). Similarly, the six genes, including Pos.gene1096.mRNA-1, Pos.gene18168.mRNA-1, Pos.gene38444.mRNA-1, Pos.gene58709.mRNA-1, Pos.gene66267.mRNA-1, and Pos.gene71503.mRNA-1 were targeted by each two miRNAs (Figures 8B, C).
2.10 Expression analysis of PoSOS1 genes under salt stress
Quantitative RT-PCR analysis of six SOS1 genes in salt-stressed Paeonia suffruticosa cultivars (QF-11, QF-12, and QF-230) revealed distinct temporal expression patterns. Five genes showed significant downregulation across all time points compared to controls; their expression was markedly higher on day 6 than on days 3 and 9, with day 3 exhibiting the lowest transcript levels (Figure 9). Notably, Pos.gene68372.mRNA-1 displayed unique dynamics, peaking in upregulation on day 6 before declining sharply by day 9 (Figure 9). Cultivar-specific responses were evident, with QF-11 showing the most severe suppression on day 3. At the same time, all cultivars shared the trend of partial transcriptional recovery on day 6, followed by renewed suppression on day 9, suggesting a biphasic stress response on day 6, representing a critical transitional phase before sustained repression.
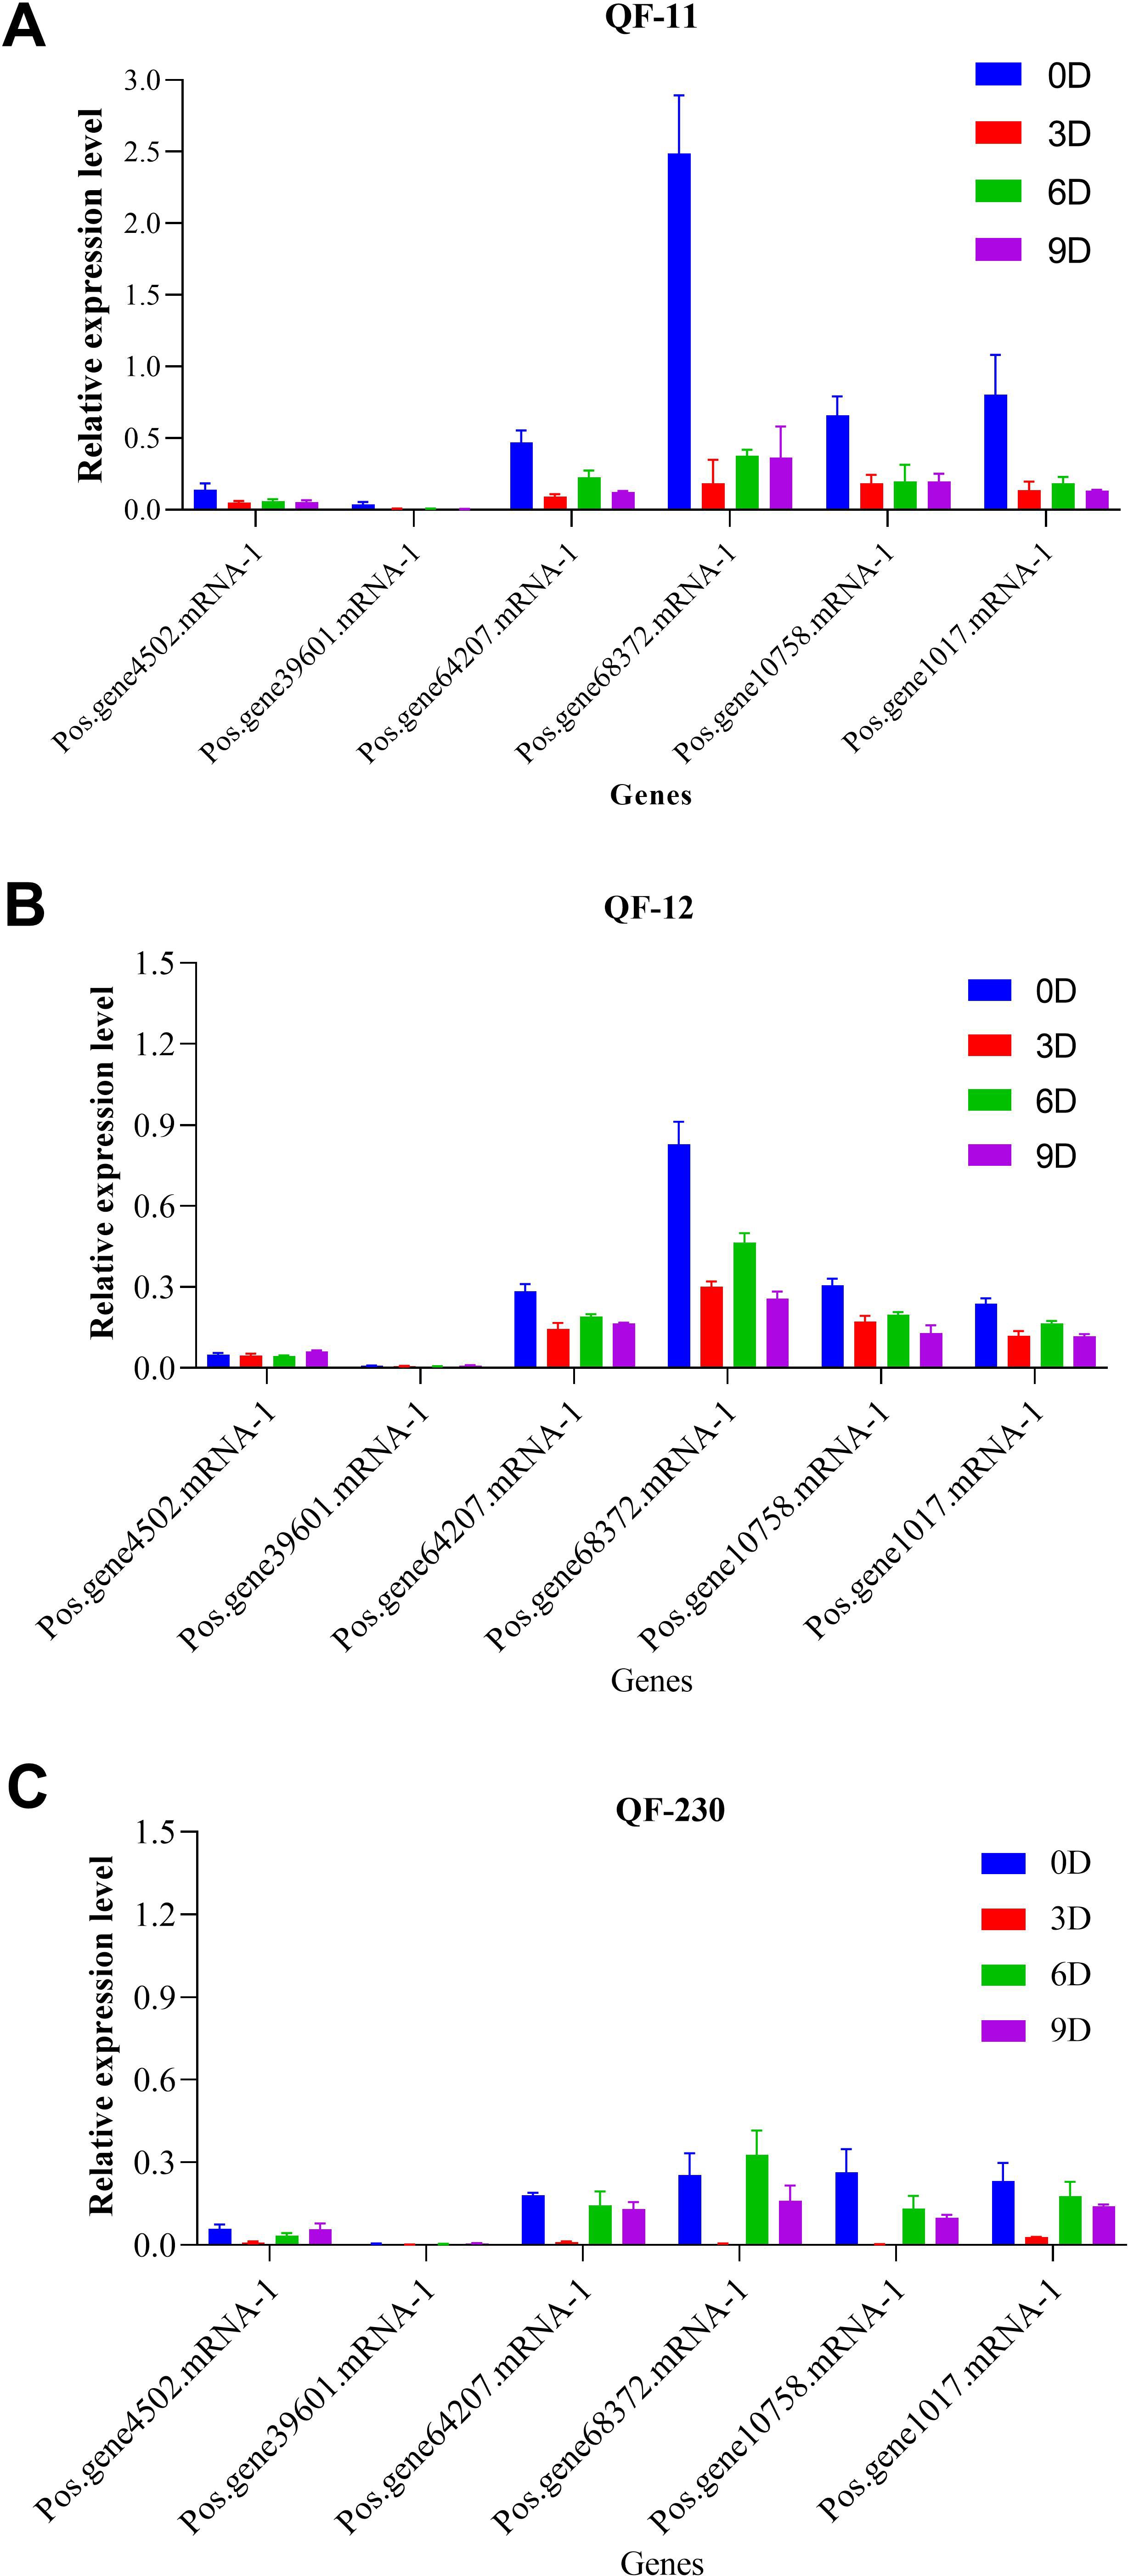
Figure 9. Expression levels of the SOS1 genes in the three cultivars QF-11, QF-12, and QF-230 leaves of seedling-stage P. ostii plants under various salt stress conditions, as assessed by qRT-PCR analysis. The vertical axis represents relative gene expression, whereas the horizontal axis denotes genes.
3 Discussion
Salt stress is a major abiotic stress that severely impacts plant growth, development, and productivity worldwide (Hussain et al., 2021). Paeonia ostii, an economically significant ornamental and traditional medicinal plant in China, is no exception (Yang et al., 2025). Elucidating the underlying molecular mechanisms of salt stress tolerance in P. ostii is crucial for developing strategies to improve its salt tolerance and ensure sustainable cultivation (Li et al., 2024; Chen et al., 2024). The Salt Overly Sensitive 1 (SOS1) gene family plays a vital role in plant salt tolerance by regulating ion homeostasis and transport (Shang et al., 2024). Our results revealed 19 SOS1 genes in the P. ostii genome, exhibiting distinct structural and functional characteristics. Multiple SOS1 genes in P. ostii suggest that this plant species may have evolved complex mechanisms to regulate ion homeostasis and transport under salt stress conditions (Zhu, 2003). Researchers identified 119, 37, 20, and 12 SOS1 gene families in wheat (Jiang et al., 2021), potato (Liang et al., 2023), Kandelia obovata (Shang et al., 2024), and tuber mustard (Cheng et al., 2019), respectively. The SOS1 protein, encoded by the SOS1 gene, functions as a proposed plasma membrane Na+/H+ antiporter, facilitating the expulsion of Na+ ions from plant cells. As a result, it keeps the K+ and Na+ levels in plant cells balanced and stops the accumulation of Na+ in plant cells (Zhang et al., 2022). Our research identified more SOS1 gene families within the P. ostii genome, which is significant. Our research reveals the presence of 19 SOS1 homologs in the genome of P. ostii. The quantity of SOS1 genes in the P. ostii genome surpasses that in tuber mustard, primarily because P. ostii is a diploid species (Cheng et al., 2019).
The chromosomal localization of the SOS1 genes on five chromosomes and two scaffolds indicates that these genes may have undergone duplication and rearrangement events during the evolution of P. ostii. Comprehending PoSOS1’s subcellular localization is essential for elucidating its function. All KoSOS1 proteins have been demonstrated to localize to the plasma membrane in Paeonia ostii, corroborating findings from prior work in Potato (Liang et al., 2023). Phylogenetic analysis clustered the PoSOS1 genes into three subfamilies, suggesting that these genes may have distinct functions and regulatory mechanisms. Interestingly, all three plant species had three subfamilies, indicating that genetic expansion occurred before these species diverged. A phylogenetic analysis showed that the closest link was between PoSOS1 and wheat (TaSOS1) (Jiang et al., 2021).
One possible source of information on functional diversification during evolution is the intron-exon gene structure (Hussain et al., 2022). The gene structure of PoSOS1 was analyzed, leading to the identification of three different patterns. The PoSOS1 genes exhibited exon counts between 3 and 20, whereas intron counts varied from 4 to 21. The gene structure pattern seen in this study corresponds with the gene structure patterns identified in potatoes, as documented in prior research (Shang et al., 2024). The cis-elements and functional characterization of SOS1 gene promoters have been identified in many species, including Kandelia obovate (Shang et al., 2024), wheat (Jiang et al., 2021), tuber mustard (Cheng et al., 2019), and potato (Liang et al., 2023). This work examined the promoter cis-elements of SOS1 homologs in P. ostii. All promoters exhibited a variety of cis-elements responsive to plant hormones and abiotic stressors. The promoter cis-elements of SOS1 genes in P. ostii, as indicated by prior studies in other species, suggest that the expression patterns of SOS1 homologs are modulated by hormonal and abiotic stresses, implying that these homologs may be involved in mediating the response of P. ostii to such stresses. The results indicated that PoSOS1s may significantly contribute to the response to phytohormones and abiotic stressors (Shang et al., 2024; Liang et al., 2023; Cheng et al., 2019).
Gene expression analysis uncovered six differentially expressed SOS1 genes under salt stress, with only one gene up-regulated in the QF230 cultivar and five genes down-regulated compared to the control. The up-regulation of the SOS1 gene under salt stress suggests that these genes may be crucial in maintaining ion homeostasis and transport in P. ostii. Similar findings were made regarding the up-and-down-regulation of SOS1 genes in potatoes (Liang et al., 2023) and Kandelia obovata (Shang et al., 2024) during salt stress. Employing the PoSOS1 genes as practical genetic modifiers would increase plants’ and crops’ resistance to elevated salt concentrations.
4 Materials and methods
4.1 Identification and characterization of SOS1 genes in Paeonia ostii genome
The genomic data of P. ostii (CNA0050666) were obtained from the China National Gene Bank (https://ftp.cngb.org/pub/CNSA/data5/CNP0003098/CNS0560369/CNA0050666/) (Yuan et al., 2022). The screening aimed to identify all members of the SOS1 gene family in P. ostii. The hidden Markov model (HMM) files for the SOS1 domain (PF00999) were obtained from the Pfam database (http://pfam-legacy.xfam.org/, accessed on 17 August 2023). The HMMER tool was subsequently employed to discover the SOS1 proteins inside the P. ostii genome. The SOS1 (Na+/H+ exchanger) domain of all candidate SOS1 proteins was identified using the conserved domain database Batch CD-Search (https://www.ncbi.nlm.nih.gov/Structure/bwrpsb/bwrpsb.cgi). Nineteen (19) potential SOS1 genes were found. The online platform (http://web.expasy.org/Compute-pI/) was employed to forecast fundamental physicochemical characteristics. TMHMM-2.0: https://services.healthtech.dtu.dk/service.php?TMHMM-2.0 was utilized to predict transmembrane helices in proteins.
4.2 Phylogenetic tree construction
Using MEGA12’s default parameters, MUSCLE was used to align several sequences. Phylogenetic analysis was conducted using SOS1 protein sequences from three species: Paeonia ostii, Kandelia obovata, and Solanum tuberosum. The neighbor-joining (NJ) method, utilizing 1000 bootstrap replicates, was employed to generate a phylogenetic tree. A pairwise deletion mode was employed to validate the dissimilarity regions capable of producing the topology of the NJ tree. The phylogenetic tree was visualized and refined using iTOL (https://itol.embl.de/) (Hussain et al., 2023).
4.3 Prediction of chromosomal localization
We utilized the China National Gene Bank (https://ftp.cngb.org/pub/CNSA/data5/CNP0003098/CNS0560369/CNA0050666/, to ascertain the genomic locations and protein sequences of all Paeonia ostii SOS1 genes, and we evaluated the distribution of SOS1 genes on scaffolds or chromosomes (Yuan et al., 2022). SOS1 genes were identified on the chromosomes of Paeonia ostii utilizing MapGene2Chromosome (MG2C; http://mg2c.iask.in/mg2c v2.0/).
4.4 Collinearity analysis and Ka/Ks calculation
The syntenic relationships of the SOS1 genes among Paeonia ostii, Kandelia obovata, and Potato were analyzed using the Circletto online program (https://bat.infspire.org/circoletto/). Paeonia ostia (Pos) protein sequences were utilized as query sequences, whereas Kandelia obovata (Ko) and 21 Potato (PGSC) protein sequences served as databases. Distinct colors—blue, green, orange, and red—represented <25%, <50%, <75%, and >75% identity of the protein sequences in the BLAST analysis, respectively. Ultimately, Circos was computed and illustrated according to the blast score and subsequently updated in Adobe Illustrator CC2019. The Ka and Ks substitution rates and the Ka/Ks ratios of nucleotides were annotated and computed using TBtool v2.516 (Waheed et al., 2024).
4.5 Analysis of conserved motif and gene structure
The gene structure of PoSOS1s was examined using TBtool v2.516 software, utilizing the gene structure annotation file in GFF3 format from P. ostii. The conserved motifs of PoSOS1s were examined using MEME (Multiple Em for Motif Elicitation) v5.3.3 (http://meme-suite.org/tools/meme) with default parameters. The XML file containing motif pattern data acquired from MEME was utilized to produce schematic diagrams of motif distribution using TBtool v2.516 software (Waheed et al., 2024).
4.6 Three-dimensional structure and subcellular localization
Secondary structures and 3D modeling of all SOS1 proteins were performed via the Phyre2 online site with default settings (https://www.sbg.bio.ic.ac.uk/phyre2/html/page.cgi?id=index).
The subcellular localization of the SOS1 family genes was predicted using the online program CELLO v.2.5, a software application for subcellular localization prediction accessible at http://cello.life.nctu.edu.tw/.
4.7 Analysis of cis-regulatory elements
SOS1 family members’ upstream sequences totaling 2,500 bp were gathered from the Paeonia ostii genome assembly database. The PlantCARE tool (http://bioinformatics.psb.ugent.be/webtools/plantcare/html/) identified CREs among the acquired sequences. Based on the frequency count of each CRE motif, the most common CREs found for the SOS1 genes were used to create Figure 6 in TBtool v2.516.
4.8 Estimation of miRNA targets and their functional annotation
The psRNATarget website was utilized to identify potential miRNA target sites. The CDS sequences of all PoSOS1 genes were uploaded to the site (https://www.zhaolab.org/psRNATarget/), using Arabidopsis data as a reference under the default settings parameters. The diagram depicting the interaction between miRNA and target genes and PoSOS1 genes was generated using https://www.bioinformatics.com.cn/plot_basic_miRNA_target_network_plot_197.
4.9 Plant material and environmental conditions
Three 6-year-old Paeonia suffruticosa (tree peony) individuals (cultivar codes: QF-11, QF-12, QF-230) cultivated at the Paeonia Germplasm Repository of Wuhan Academy of Agricultural Sciences Forestry and Fruit Research Institute (Hongshan District, Wuhan, China) were selected for salt stress experiments. At the initial bud stage, tender leaf samples were collected from three untreated control plants at 10:30 AM. Subsequently, each plant was irrigated with 4 L of 10 g/L sodium chloride (NaCl) solution. The rhizosphere soil was immediately covered with a waterproof film to prevent rainwater infiltration. Treated leaves were sampled at 10:30 AM on days 3, 6, and 9 post-treatments. All collected tissues were flash-frozen in dry ice and stored at -80°C for subsequent RNA extraction. Six SOS1 gene family members were identified from the published Paeonia ostii ‘Feng Dan’ genome, and the coding DNA sequences (CDS) were retrieved to design RT-PCR primers using Primer 5 software (http://www.premierbiosoft.com/). The normalization utilized the endogenous reference gene PoPUF1639. Details of the primer sequences can be found in Table 3.
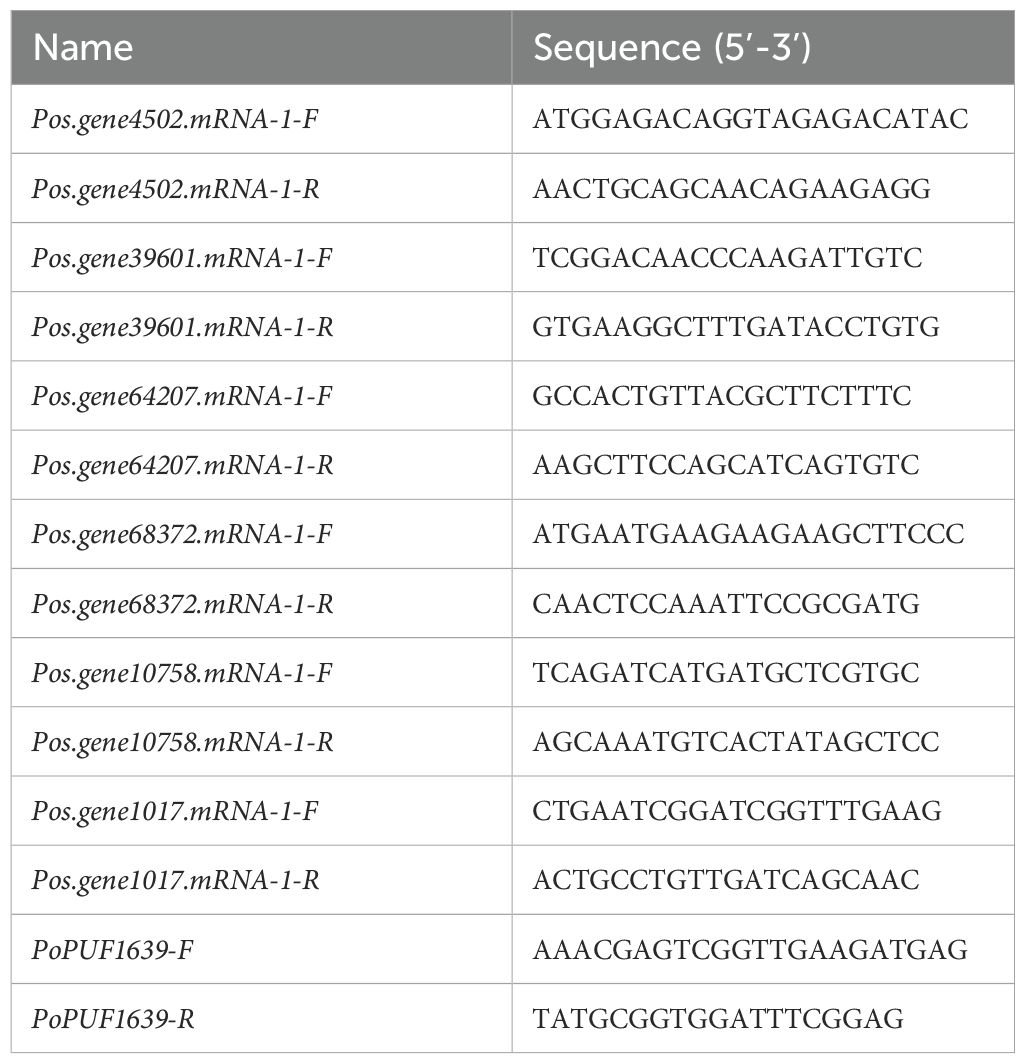
Table 3. PoSOS1 genes Primers.
4.10 Quantitative real-time PCR assays
The TaKaRa MiniBEST Plant RNA Extraction kit (9769, Takara) extracted total RNA from leaf samples following the product instructions. The concentration and purity of RNA were measured using a Thermo Scientific™ NanoDrop™ spectrophotometer. First-strand cDNA was synthesized from 1 μg of total RNA utilizing the PrimeScript™ RT Reagent Kit (RR047A, Takara) in a Life Technologies PCR machine. Quantitative PCR was conducted using a Longgene CFX96 Real-Time System with the TB Green™ Premix Ex Taq™ II Kit (CN830B, Takara). The reactions comprised 2 μL of diluted cDNA template in 20 μL, with three technical duplicates for each sample. Thermal cycling parameters adhered to manufacturer standards. Threshold cycle (Ct) values were evaluated with the 2^ (-ΔΔCt) methodology.
4.11 Statistical analysis
The statistical program GraphPad Prism 9 (https://www.graphpad.com) was used to create the graphs, and the data was analyzed using one-way ANOVA in SPSS version 13.0. The results were displayed as the three replicates’ mean SD (standard deviation).
5 Conclusions
In conclusion, this study provides a comprehensive genome-wide identification and characterization of the SOS1 gene family in Paeonia ostii. Our results reveal the complexity and diversity of the SOS1 gene family in P. ostii and provide new insights into their evolutionary relationships, gene structure, and expression patterns under salt stress conditions. Identifying differentially expressed SOS1 genes under salt stress treatments suggests their potential role in salt stress tolerance in P. ostii. This study lays the foundation for further research on the functional characterization of SOS1 genes in P. ostii. It provides valuable resources for breeding programs to improve salt stress tolerance in P. ostii. Furthermore, our findings contribute to a better understanding of the molecular mechanisms underlying salt stress tolerance in plants and may have implications for developing salt-tolerant crops.
Data availability statement
The datasets presented in this study can be found in online repositories. The names of the repository/repositories and accession number(s) can be found in the article/Supplementary Material.
Author contributions
YC: Writing – original draft, Writing – review & editing. HL: Writing – review & editing, Writing – original draft. ZW: Writing – original draft, Writing – review & editing. QH: Writing – original draft, Writing – review & editing. XZ: Writing – original draft, Writing – review & editing. FC: Writing – review & editing, Writing – original draft. XW: Writing – review & editing, Writing – original draft.
Funding
The author(s) declare that financial support was received for the research and/or publication of this article. This work was supported by the Excellent Young and Middle-aged Scientific and Technological Innovation Team Program of Hubei Province (T2023042), the Research and Development Fund of Wuchang University of Technology (X2024ZZ001), the Hubei Provincial Central Guidance for Local Science and Technology Development Special Fund (2022BGE228), the Wuhan key research and development program (2024020702030110), and the Wuhan Academy of Agricultural Sciences innovation system science and technology strong foundation project--Subject innovation project (XKCX202405-3, XKCX202521).
Conflict of interest
The authors declare that the research was conducted in the absence of any commercial or financial relationships that could be construed as a potential conflict of interest.
Generative AI statement
The author(s) declare that no Generative AI was used in the creation of this manuscript.
Publisher’s note
All claims expressed in this article are solely those of the authors and do not necessarily represent those of their affiliated organizations, or those of the publisher, the editors and the reviewers. Any product that may be evaluated in this article, or claim that may be made by its manufacturer, is not guaranteed or endorsed by the publisher.
Supplementary material
The Supplementary Material for this article can be found online at: https://www.frontiersin.org/articles/10.3389/fpls.2025.1614011/full#supplementary-material
Supplementary Figure 1 | Multiple SOS1 protein sequence alignment.
References
Ali, A., Raddatz, N., Pardo, J. M., and Yun, D. J. (2021). HKT sodium and potassium transporters in Arabidopsis thaliana and related halophyte species. Physiol. Plant 171, 546–558. doi: 10.1111/ppl.13166
Cai, Z., Chen, H., Chen, J., Yang, R., Zou, L., Wang, C., et al. (2020). Metabolomics characterizes the metabolic changes of Lonicerae Japonicae Flos under different salt stresses. PLoS One 15, e0243111. doi: 10.1371/journal.pone.0243111
Cai, Z., Liu, X., Chen, H., Yang, R., Chen, J., Zou, L., et al. (2021). Variations in morphology, physiology, and multiple bioactive constituents of Lonicerae Japonicae Flos under salt stress. Sci. Rep. 11, 3939. doi: 10.1038/s41598-021-83566-6
Chen, Z., Luan, Y., Zhao, D., and Tao, J. (2024). Isolation and functional analysis of drought related PobZIP4 transcription factor in Paeonia ostii. Sci. Hortic. (Amsterdam). 332, 113187. doi: 10.1016/j.scienta.2024.113187
Cheng, C., Zhong, Y., Wang, Q., Cai, Z., Wang, D., and Li, C. (2019). Genome-wide identification and gene expression analysis of SOS family genes in tuber mustard (Brassica juncea var. Tumida). PLoS One 14, 1–19. doi: 10.1371/journal.pone.0224672
Eswar, D., Karuppusamy, R., and Chellamuthu, S. (2021). Drivers of soil salinity and their correlation with climate change. Curr. Opin. Environ. Sustain. 50, 310–318. doi: 10.1016/j.cosust.2020.10.015
Gao, J., Sun, J., Cao, P., Ren, L., Liu, C., Chen, S., et al. (2016). Variation in tissue Na+ content and the activity of SOS1 genes among two species and two related genera of Chrysanthemum. BMC Plant Biol. 16, 98. doi: 10.1186/s12870-016-0781-9
Hussain, Q., Asim, M., Zhang, R., Khan, R., Farooq, S., and Wu, J. (2021). Transcription factors interact with ABA through gene expression and signaling pathways to mitigate drought and salinity stress. Biomolecules 11, 1159. doi: 10.3390/biom11081159
Hussain, Q., Ye, T., Shang, C., Li, S., Nkoh, J. N., Li, W., et al. (2023). Genome-wide identification, characterization, and expression analysis of the copper-containing amine oxidase gene family in mangrove Kandelia obovata. Int. J. Mol. Sci. 24, 17312. doi: 10.3390/ijms242417312
Hussain, Q., Zheng, M., Chang, W., Ashraf, M. F., Khan, R., Asim, M., et al. (2022). Genome-wide identification and expression analysis of SnRK2 gene family in dormant vegetative buds of Liriodendron chinense in response to abscisic acid, chilling, and photoperiod. Genes (Basel). 13, 1305. doi: 10.3390/genes13081305
Isayenkov, S. V. (2012). Physiological and molecular aspects of salt stress in plants. Cytol. Genet. 46, 302–318. doi: 10.3103/S0095452712050040
Isayenkov, S. V. and Maathuis, F. J. M. (2019). Plant salinity stress: Many unanswered questions remain. Front. Plant Sci. 10. doi: 10.3389/fpls.2019.00080
Jiang, W., Pan, R., Buitrago, S., Wu, C., Abou-Elwafa, S. F., Xu, Y., et al. (2021). Conservation and divergence of the TaSOS1 gene family in salt stress response in wheat (Triticum aestivum L.). Physiol. Mol. Biol. Plants 27, 1245–1260. doi: 10.1007/s12298-021-01009-y
Keisham, M., Mukherjee, S., and Bhatla, S. C. (2018). Mechanisms of sodium transport in plants—Progresses and challenges. Int. J. Mol. Sci. 19, 647. doi: 10.3390/ijms19030647
Khare, S., Singh, N. B., Singh, A., Hussain, I., Niharika, K., Yadav, V., et al. (2020). Plant secondary metabolites synthesis and their regulations under biotic and abiotic constraints. J. Plant Biol. 63, 203–216. doi: 10.1007/s12374-020-09245-7
Li, L., He, S., Zhang, P., Li, D., Song, Y., Shang, W., et al. (2024). Integration of Genome-Wide Identification and Transcriptome Analysis of Class III Peroxidases in Paeonia ostii: Insight into Their Roles in Adventitious Roots, Heat Tolerance, and Petal Senescence. Int. J. Mol. Sci. 25, 12122. doi: 10.3390/ijms252212122
Li, S. S., Wang, L. S., Shu, Q. Y., Wu, J., Chen, L. G., Shao, S., et al. (2015). Fatty acid composition of developing tree peony (Paeonia section Moutan DC.) seeds and transcriptome analysis during seed development. BMC Genomics 16, 1–14. doi: 10.1186/s12864-015-1429-0
Liang, L., Guo, L., Zhai, Y., Hou, Z., Wu, W., Zhang, X., et al. (2023). Genome-wide characterization of SOS1 gene family in potato (Solanum tuberosum) and expression analyses under salt and hormone stress. Front. Plant Sci. 14. doi: 10.3389/fpls.2023.1201730
Liu, L. and Wang, B. (2021). Protection of halophytes and their uses for cultivation of saline-alkali soil in China. Biol. (Basel). 10, 353. doi: 10.3390/biology10050353
Muhammad, M., Waheed, A., Wahab, A., Majeed, M., Nazim, M., Liu, Y. H., et al. (2024). Soil salinity and drought tolerance: An evaluation of plant growth, productivity, microbial diversity, and amelioration strategies. Plant Stress 11, 100319. doi: 10.1016/j.stress.2023.100319
Shang, C., Sihui, L., Li, C., Hussain, Q., Chen, P., Hussain, M. A., et al. (2024). SOS1 gene family in mangrove (Kandelia obovata): Genome-wide identification, characterization, and expression analyses under salt and copper stress. BMC Plant Biol. 24, 805. doi: 10.1186/s12870-024-05528-0
Shi, H., Ishitani, M., Kim, C., and Zhu, J. K. (2000). The Arabidopsis thaliana salt tolerance gene SOS1 encodes a putative Na+/H+ antiporter. Proc. Natl. Acad. Sci. U.S.A. 97, 6896–6901. doi: 10.1073/pnas.120170197
Shi, X., Xue, X., Xu, H., Yang, Y., Kuang, Z., and Hou, X. (2023). Amelioration of salt-induced damage on Paeonia ostii ‘Fengdan’ by exogenous application of silicon. Agronomy 13, 1349. doi: 10.3390/agronomy13051349
Świeżawska, B., Duszyn, M., Jaworski, K., and Szmidt-Jaworska, A. (2018). Downstream targets of cyclic nucleotides in plants. Front. Plant Sci. 9. doi: 10.3389/fpls.2018.01428
Waheed, A., Chen, Y., Rizwan, H. M., Adnan, M., Ma, X., and Liu, G. (2024). Genomic characterization and expression profiling of the lytic polysaccharide monooxygenases AA9 family in thermophilic fungi Thermothelomyces fergusii in response to carbon source media. Int. J. Biol. Macromol. 265, 130740. doi: 10.1016/j.ijbiomac.2024.130740
Xiong, Y., Liang, H., Yan, H., Guo, B., Niu, M., Chen, S., et al. (2019). NaCl-induced stress: physiological responses of six halophyte species in in vitro and in vivo culture. Plant Cell. Tissue Organ Cult. 139, 531–546. doi: 10.1007/s11240-019-01697-1
Yang, X., Guo, Q., Liu, S., Wang, D., Zuo, D., Niu, T., et al. (2025). Genome-wide characterization of the MADS-box gene family in Paeonia ostii and expression analysis of genes related to floral organ development. BMC Genomics 26, 49. doi: 10.1186/s12864-024-11197-y
Yuan, J., Jiang, S., Jian, J., Liu, M., Yue, Z., Xu, J., et al. (2022). Genomic basis of the giga-chromosomes and giga-genome of tree peony Paeonia ostii. Nat. Commun. 13, 7328. doi: 10.1038/s41467-022-35063-1
Zhang, M., Cao, J., Zhang, T., Xu, T., Yang, L., Li, X., et al. (2022). A putative plasma membrane Na+/H+ Antiporter GmSOS1 is critical for salt stress tolerance in Glycine max. Front. Plant Sci. 13. doi: 10.3389/fpls.2022.870695
Zhang, H., Li, X., Wu, K., Wang, M., Liu, P., Wang, X., et al. (2017). Antioxidant activities and chemical constituents of flavonoids from the flower of Paeonia ostii. Molecules 22, 5. doi: 10.3390/molecules22010005
Zhang, C., Wang, W., Wang, Y., Gao, S., Du, D., Fu, J., et al. (2014). Anthocyanin biosynthesis and accumulation in developing flowers of tree peony (Paeonia suffruticosa) “Luoyang Hong. Postharvest Biol. Technol. 97, 11–22. doi: 10.1016/j.postharvbio.2014.05.019
Zhao, D., Luan, Y., Shi, W., Zhang, X., Meng, J., and Tao, J. (2021). A Paeonia ostii caffeoyl-CoA O-methyltransferase confers drought stress tolerance by promoting lignin synthesis and ROS scavenging. Plant Sci. 303, 110765. doi: 10.1016/j.plantsci.2020.110765
Keywords: Paeonia ostii, SOS1 gene family, salinity stress, miRNAs, expression analysis
Citation: Chen Y, Liang H, Wang Z, Hussain Q, Zhang X, Chen F and Wang X (2025) Genome-wide identification, characterization, and expression analysis of the SOS1 gene family in the medicinal plant Paeonia ostii under salt stress. Front. Plant Sci. 16:1614011. doi: 10.3389/fpls.2025.1614011
Received: 18 April 2025; Accepted: 19 June 2025;
Published: 30 July 2025.
Edited by:
Irfan Ali Sabir, South China Agricultural University, ChinaReviewed by:
Mohammad Faizan, Maulana Azad National Urdu University, IndiaWajid Zaman, Yeungnam University, Republic of Korea
Copyright © 2025 Chen, Liang, Wang, Hussain, Zhang, Chen and Wang. This is an open-access article distributed under the terms of the Creative Commons Attribution License (CC BY). The use, distribution or reproduction in other forums is permitted, provided the original author(s) and the copyright owner(s) are credited and that the original publication in this journal is cited, in accordance with accepted academic practice. No use, distribution or reproduction is permitted which does not comply with these terms.
*Correspondence: Fazhi Chen, ZmF6aGNoOTBAMTYzLmNvbQ==; Xiaohua Wang, bXNuaG0xMjNAZ21haWwuY29t
†These authors have contributed equally to this work