Abstract
The number of four-seed pods (NFSP) in soybean is an important yield trait and a quantitative trait regulated by multiple genes. Mapping quantitative trait nucleotide (QTN), mining major genes, and screening excellent breeding schemes for NFSP are of great significance for breeding high-yielding soybean varieties. In this study, a germplasm population (GP) containing 455 soybean varieties was planted in five environments to investigate NFSP. Single-nucleotide polymorphism (SNP) genotype data were obtained based on the Axiom_SoyaSNP 180K chip, and a genome-wide association study (GWAS) was used to locate QTNs, which were used to predict candidate genes and simulate breeding. The results showed that there was genetic variation in NFSP and different gene expression in various environments. The broad-sense heritability of NFSP over multiple environments was 72.7%. A total of 89 QTNs correlated with the number of four pods were identified on 20 chromosomes, including 34 stable QTNs repeatedly detected by multiple methods or in multiple environments and four QTNs with an additive by environment interaction effect. In the decay regions of 34 stable QTNs, three genes related to NFSP in soybean were screened and verified by haplotype analysis, namely, Glyma.13G105400, Glyma.04G063700, and Glyma.04G063100. Multiple regression analysis of 89 QTNs on NFSP was used to establish molecular-assisted selection models for five environments, which could explain 44.82%–55.06% of the phenotypic variation in NFSP. Based on this model, 153 breeding schemes were selected for five environments, which could achieve the breeding goals of NFSP over 43, 43, 25, 31, and 40 under 21AC, 21XY, 23WD, 23QQHE, and 23AC environments, respectively. These results laid the foundation for understanding the genetic mechanism of pod formation in soybean and molecular breeding of high-yielding varieties.
1 Introduction
Soybean [Glycine max (L.) Merr.] is rich in protein and oil and is widely used in food, feed, environmental protection, medicine, and other fields. The breeding of high-seed-yield varieties is always an important goal of soybean breeding. Pod number is one of the important yield components, and it also has different degrees of promoting or inhibiting effects on other traits. Among various pod traits, the number of four-seed pods (NFSP) is a potential factor affecting yield and one of the key targets of soybean germplasm selection for high yield (Ning et al., 2018; Liu et al., 2019).
To improve the breeding efficiency of pod number, linkage analysis and genome-wide association study (GWAS) were used to map the quantitative trait locus (QTL) and quantitative trait nucleotide (QTN) associated with NFSP. Currently, 117 QTLs and 154 QTNs for pod and seed number-related traits have been listed in the SoyBase website (www.soybase.org). In addition, Vieira et al. (2006) detected two QTLs for pod number per plant using a recombinant inbred line (RIL) population. Liu et al. (2019) used a population of four-way RIL population to map 76 QTLs related to pod number, containing 23 NFSP QTLs. Li et al. (2021) constructed chromosome segment substitution lines (CSSLs) and fine-mapped an NFSP QTL on chromosome 7, which was narrowed to 321 kb. Zheng et al. (2022) used this population to localize seven, two, and six QTLs associated with the ratio of two-, three-, and four-seed pod number, respectively. Cao et al. (2023) used these CSSLs to detect 22 QTLs controlling the ratio of four-seed pod number.
The development of the soybean pod is affected by a variety of regulatory pathways, among which the calcium signaling pathway and the abscisic acid pathway have been found. Studies have shown that abscisic acid secreted by soybean roots can control early pod expansion during the critical period of 3–5 days after flowering (Liu et al., 2004). Abscisic acid in the seed or pod can affect early pistillate abortion by inhibiting cell division (Dembinska et al., 1992; Setter and Flannigan, 2001; Liu et al., 2003; Yang et al., 2020, 2017; Zhang et al., 2021). The first identified gene controlling NFSP is Ln, which affects pod formation by controlling early flowering cell division and expansion (Jeong et al., 2012; Fang et al., 2013; Sayama et al., 2017). Liu et al. (2015) found that the development of four-seed pods is associated with a complex network involving multiple physiological and metabolic pathways. Fang et al. (2021) found that a differentially expressed gene, Glyma.10G089300, encodes a 5-kDa photosystem II protein, which is involved in the energy conversion of photosynthesis. Four differentially expressed genes (DEGs) encoded calproteins and a WRKY transcription factor—Glyma.10G089300, Glyma.10G089300, Glyma.10G002200, Glyma.09G280200, and Glyma.04G136200—and played a significant role in the plant–pathogen interaction pathway, which suggested that the proportion of NFSP in above-ground plants may be affected by the action of underground roots. In addition, they identified two pectin-related DEGs (Glyma.13G060900 and Glyma.13G064700) that overlapped with a major QTL on chromosome 13 controlling four fruit size traits, which may be important candidate genes affecting the proportion of NFSP.
Traditional breeding is conducted according to the determination of phenotypes in field experiments. However, the limitations of traditional breeding are a long breeding cycle and environmental influences, which lead to poor accuracy and low efficiency. Simulation breeding based on molecular breeding knowledge can avoid the blindness of traditional breeding, improve breeding efficiency, and reduce cost by predicting the breeding value of target traits under different parental cross combinations and breeding methods in a specific environment. At present, there are relatively few studies on crop simulation breeding because there are few simulation breeding platform software available for systematic analysis. Blib is a multi-module simulation platform that can handle more complex genetic effects and models (Zhang et al., 2022). One of the main and unified application modules is in silico breeding (ISB), which can be used to study simulated breeding programs for plant clones, pure lines, and hybrids (Li et al., 2025).
Summarizing the above studies, it can be seen that there are problems in the related studies on pod number traits. First, the breeding traits are mostly focused on the total pod number per plant, and there are few in-depth studies on two-pod number, three-pod number, and NFSP. Second, most of the molecular marker techniques are based on the simple sequence repetition (SSR) framework maps to map QTLs. The low marker density of genetic maps is not conducive to subsequent gene mining and molecular marker-assisted selection studies (Tischner et al., 2003; Sun et al., 2006; Vieira et al., 2006; Chen et al., 2007; Palomeque et al., 2009, 2010; Li et al., 2008; Zhang et al., 2010; Jeong et al., 2011; Liu et al., 2011; Ragin et al., 2012; Kuroda et al., 2013; Shim et al., 2017; Liu et al., 2019). Compared with linkage analysis, genome-wide single-nucleotide polymorphism (SNP)-based association analysis is easier to comprehensively and deeply understand the genetic basis of breeding traits (Fang et al., 2017; Hao et al., 2012; Hu et al., 2014; Qi et al., 2014; Zhang et al., 2015).
In this study, the multi-locus random-SNP effect mixed linear model (mrMLM) and 3VmrMLM methods were first applied to analyze the GWAS of NFSP in a germplasm population in five environments. Based on the detected QTNs, candidate genes were predicted, and the optimal breeding schemes were selected. This study provided a theoretical basis and technical support for understanding the genetic basis of soybean pod formation and the genetic improvement of high-yielding soybean cultivars.
2 Materials and methods
2.1 Genetic material
The germplasm population (GP) containing 455 soybean varieties previously constructed by our research group, including four landraces, 387 domestic varieties, and 44 foreign varieties (Li et al., 2020), was used as the genetic material for QTN localization, candidate gene prediction, and simulated breeding studies (Supplementary Table S1).
2.2 Field experiment design and trait investigation
GPs were planted in five environments, namely, in Acheng (E126.95°, N45.52°) in 2021 (21AC), Xiangyang (E126.94°, N45.74°) in 2021 (21XY), Acheng (E126.95°, N45.74°) in 2023 (23AC), Qiqihar (E123.92°, N47.35°) in 2023 (23QQ), and Wudalianchi (E126.21°, N48.52°) in 2023 (23WD). A field experiment was conducted using a completely randomized block design with three replications. The plot contained three rows with a length of 5 m and a row spacing of 0.67. The details of planting density, fertilizer application, and sowing date for each environment are listed in Supplementary Table S2. Field management was consistent with local soybean production conditions. At the maturity stage, 10 plants per variety were randomly selected to investigate NFSP, and the average value was used as the phenotypic data for NFSP of each variety.
2.3 Phenotypic variation analysis
The mean, standard deviation, minimum, maximum, range, kurtosis, skewness, and coefficient of variation were calculated for the population phenotypic data. The generalized linear model method was used to conduct an analysis of variance with the variation sources of block, environment, genotype, and genotype × environment interaction effect. The mixed linear model method was used to calculate the variance component, and the heritability was estimated based on the variance component. The following formula was used to calculate the multi-environment generalized heritability of the GP.
where , and R represent broad-sense heritability, genetic variance, genotype × environment interaction variance, error variance, number of environments, and number of blocks, respectively.
The above statistical analysis was performed using SAS 9.2 (SAS Institute, Cary, NC, USA).
2.4 Genome-wide association analysis
In previous studies, the Axiom®_SoyaSNP 180K chip has been used to identify SNP genotypes in the population, and 109,676 SNP markers have been obtained. By structural analysis, the population was divided into two subgroups, comprising 132 and 323 individuals, respectively. The attenuation distance was determined to be 86K by analysis of linkage disequilibrium (Li et al., 2020).
Seven multi-locus genetic model methods were used to realize the GWAS of soybean NFSP, including the mrMLM (Wang et al., 2016), fast multi-locus random-effect mixed linear model (FASTmrMLM) (Tamba et al., 2017), fast multi-locus random-SNP-effect efficient mixed model association (FASTmrEMMA) (Wen et al., 2018), polygenic-background-control-based least angle regression plus empirical Bayes (pLARmEB) (Zhang et al., 2017), iterative sure independence screening EM-Bayesian LASSO algorithm (ISIS EM-BLASSO) (Tamba et al., 2017), integration of Kruskal–Wallis test with empirical Bayes (pKWmEB) (Ren et al., 2018), and IIIVmrMLM (Li et al., 2022a; Li et al., 2022b).
The above analysis processes were implemented through two R software packages: mrMLM.GUI (https://cran.r-project.org/web/packages/mrMLM.GUI/index.html) and 3VmrMLM (https://github.com/YuanmingZhang65/IIIVmrMLM). The parameters of the R software were set as default values: the critical value of the p-value in the first stage of mrMLM, FASTmrEMMA, pLARmEB, pKWmEB, and ISIS EM-BLASSO was set to 0.01, and the critical value of the p-value of the FASTmrEMMA method was set to 0.005. In the second stage, the critical value of the log of odd (LOD) value of the R software was set to 3, and the critical value of the p-value was set to 0.0002. Likelihood=“REML”, SearchRadius=100, CriLOD=3, SelectVariable=143, and Bootstrap=FALSE. The parameter settings for the IIIVmrMLM method were the same as those for the preceding method.
2.5 Prediction of NFSP-related candidate genes
First, all the genes in the Phytozome website (https://phytozome-next.jgi.doe.gov) were downloaded from the linkage disequilibrium region of the mapped stable QTNs (43 kb upstream and downstream of the QTN site). Then, pathway analysis was conducted using the Kyoto Encyclopedia of Genes and Genomes (KEGG) (https://www.kegg.jp), and the candidate genes related to NFSP were preliminarily predicted based on gene function annotation and relevant literature review.
2.6 Haplotype analysis
A resequencing analysis was conducted on 202 germplasm resources in the GP group, and the NFSP phenotypic data were measured. The target gene sequences were extracted using the Vcftools software (https://vcftools.github.io/downloads.html), and the site variations were analyzed to classify the allelic variations. Combined with the NFSP phenotypic data of soybeans, the haplotype analysis of the non-synonymous mutation variation sites in the coding region was performed using the Haploview software (https://www.broadinstitute.org/haploview/downloads#JAR).
2.7 Construction of molecular marker-assisted selection model and simulation breeding
The two SNP genotypes of each significant QTN were assigned −1 and 1, and then the molecular marker-assisted selection (MAS) models of 89 QTNs for NFSP were established by multiple regression analysis. The superior allele of each QTN was determined based on the effect size of each QTN. When the effect value of QTNs was positive, the genotype encoding 1 was considered the superior allele. Conversely, when the effect value was negative, the genotype coding −1 was the superior allele. For each QTN, the percentage of superior alleles in all individuals was the ratio of the number of varieties containing superior alleles to the total number of varieties. For each variety, the proportion of superior alleles was calculated by dividing the number of superior alleles by the total number of QTNs. The molecular MAS model was constructed using the SAS 9.2 software (SAS Institute, Cary, NC, USA).
To achieve the goal of improving NFSP, hybrid combinations capable of aggregating superior QTN allelic variations were screened. According to the design of a half-diallel cross, 455 parents were paired two by two, resulting in a total of 103,285 hybrid combinations, with single crosses being conducted. After hybridization, the modified pedigree method (Ped) and the bulk selection method (Blk) were applied. The F2 generation was set with population sizes of 200, 500, and 800 individuals. Therefore, each hybrid combination had six breeding schemes, namely, Ped200, Ped500, Ped800, Blk200, Blk500, and Blk800. The population sizes for F1, F3, F4, F5, F6, and F7 were 10, 30, 30, 50, 50, and 50 plants, respectively. Inter-generation selection was adopted in the F2, F4, F6, and F7 generations, while intra-generation selection was used in the F5 generation. The process of each breeding scheme followed the procedure shown in Figure 1.
Figure 1

Flowchart of simulating breeding scheme treated by single-cross combination pedigree (top) and bulk (bottom) selection methods. “Pedigree” represents the individual harvest of selected plants within a family, while “bulk” represents the mixed harvest of selected plants within a family. “AF” represents selection among families, and “WF” represents selection within families. The decimal numbers represent the selection ratio, and in each generation, families with the highest phenotypes were selected according to the given ratio. For F1, 10 plants of each hybrid were planted; for F2, 200/500/800 plants of each line were planted; for F3 and F4, 30 plants of each line were planted; and for F5–F7, 50 plants of each line were planted.
3 Results and analysis
3.1 Phenotypic variation in population NFSP
The statistical results of phenotypic data of the soybean NFSP in the GP under five environments are shown in Figure 2. In the frequency distribution of NFSP in the GP across the five environments, a skewed distribution toward lower values was observed. In the 21AC, 21XY, and 23AC environments, the frequency of NFSP of 3 was the highest, accounting for 22.20%, 19.11%, and 19.45%, respectively, followed by 6, 9, and 12. In the 23QQ and 23WD environments, the frequency of NFSP of 6 was the highest, accounting for 25.06% and 28.42%, respectively, followed by NFSP values of 3 and 9.
Figure 2
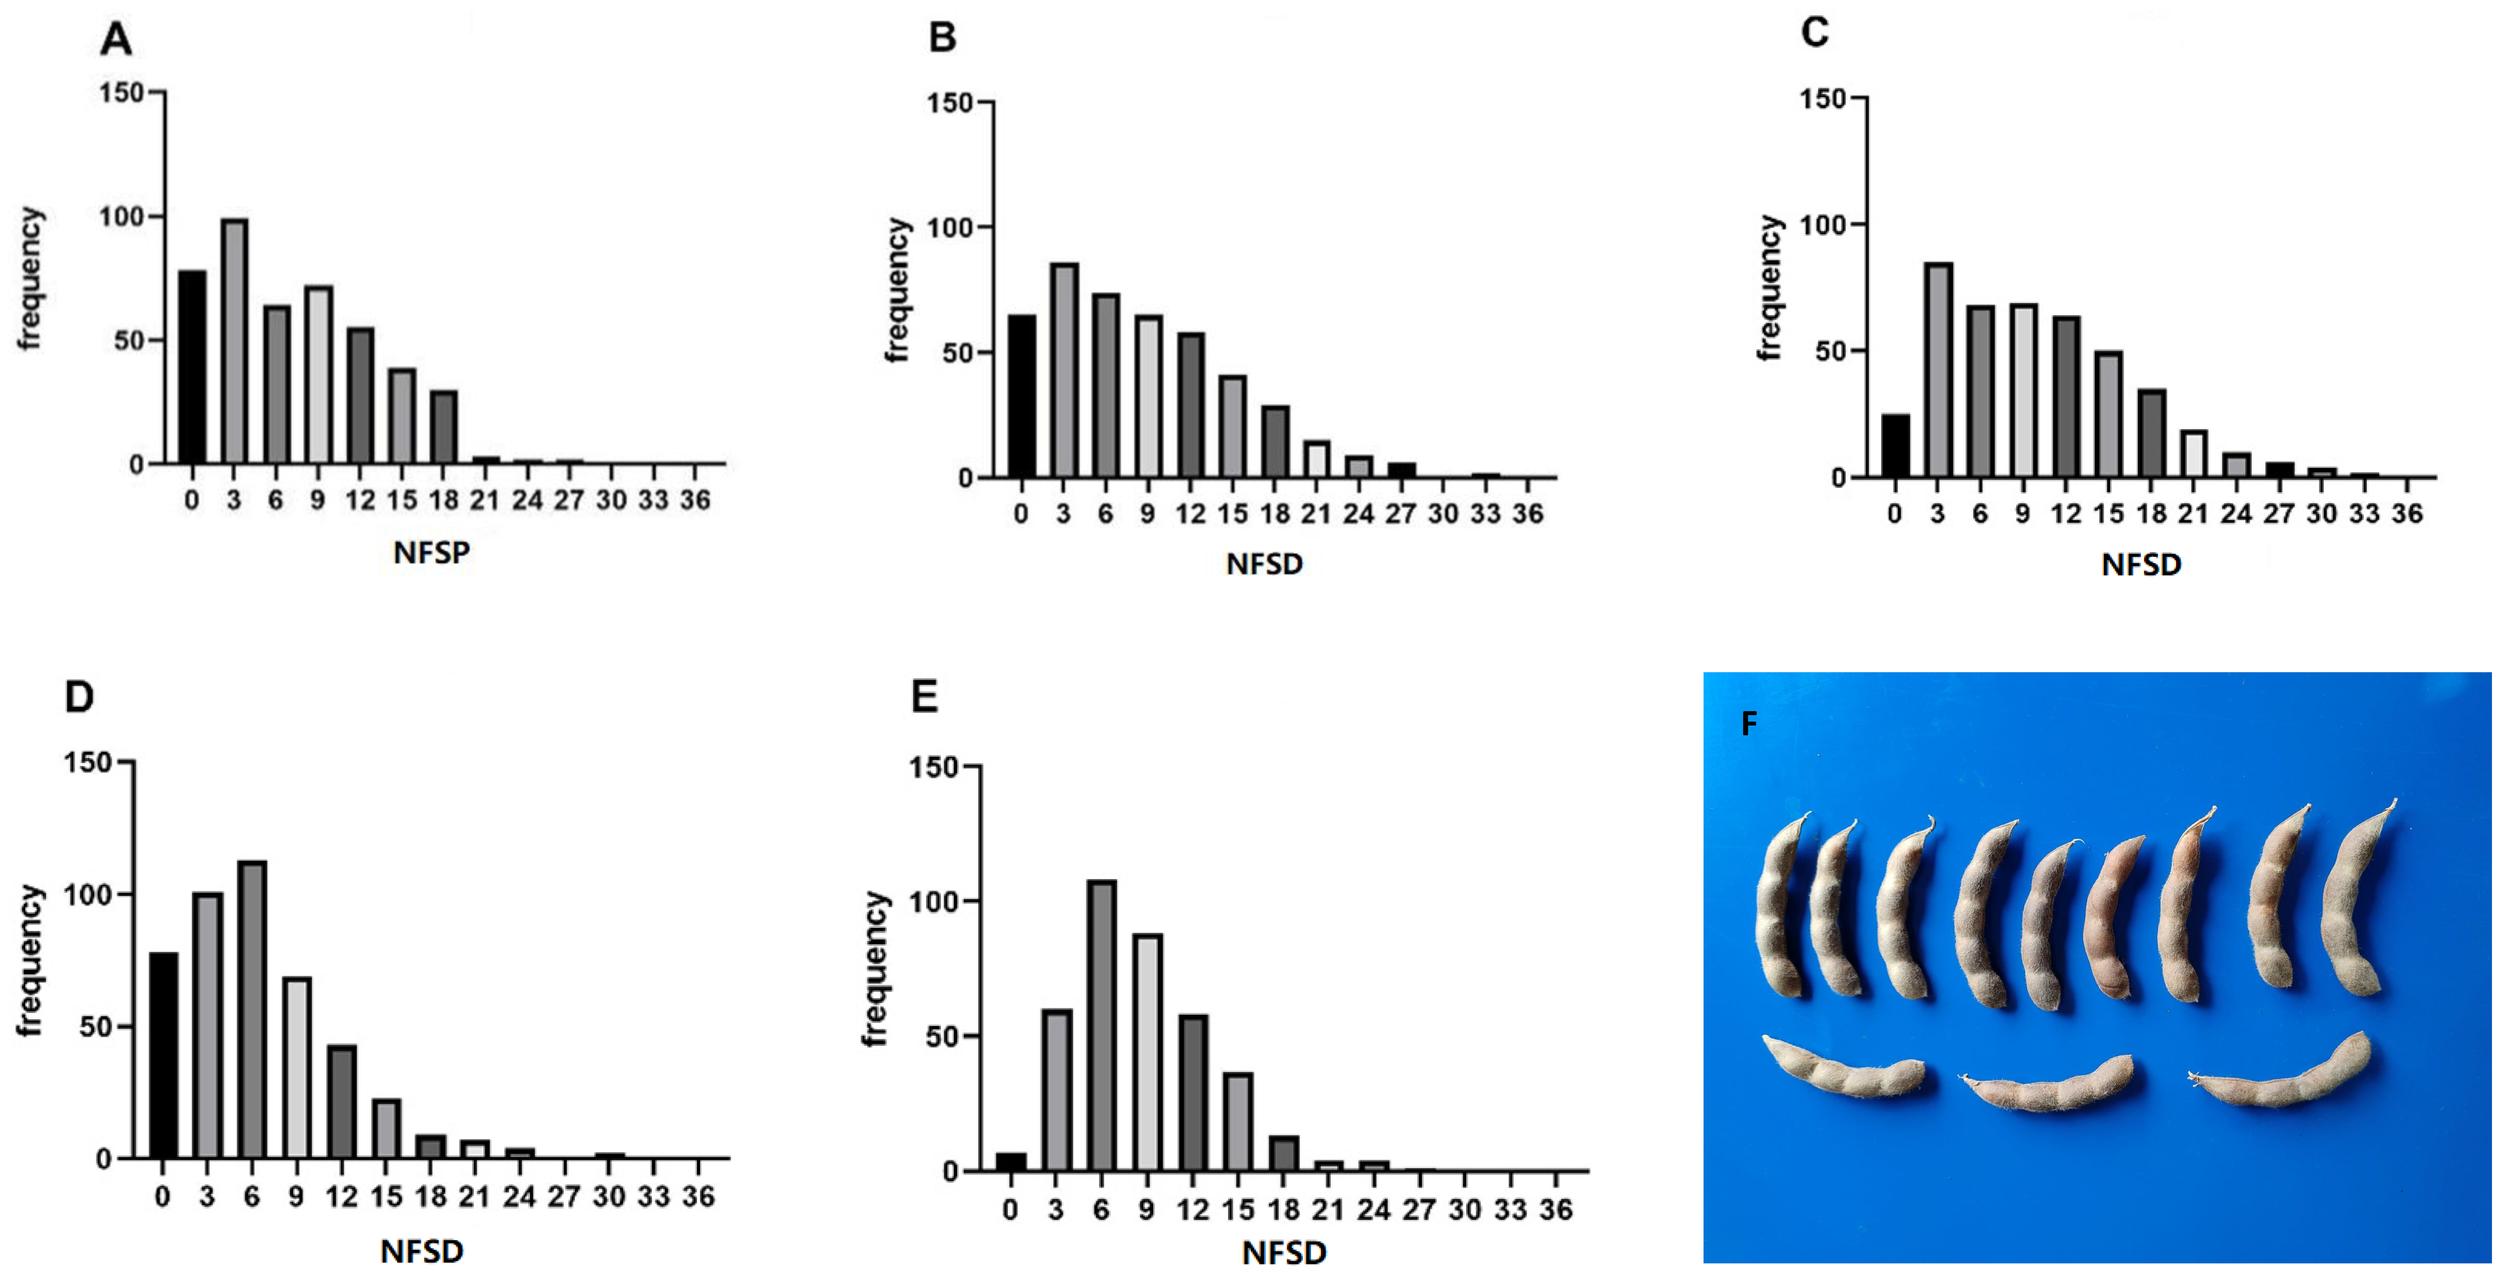
Frequency distribution of NFSP in five environments. The frequency distribution of the soybean NFSP phenotype in the five environments of (A) 21AC, (B) 21XY, (C) 23AC, (D) 23QQ, and (E) 23WD. (F) The morphological photo of four-seed pods. NFSP, number of four-seed pods.
The descriptive analysis of NFSP in the GP under five environments is presented in Table 1. The absolute values of kurtosis of the population in different environments were close to 1, indicating that the NFSP phenotypic data of the GP basically followed a continuous variation distribution. The coefficient of variation was relatively large in each environment, and the genotype variance was extremely significant, suggesting that there was genetic variation in NFSP among different varieties within the GP. The means, standard deviations, and ranges varied significantly among different environments, and the genotype by environment interaction effect was extremely significant, indicating that NFSP had different expressions in different environments, and different QTNs and genes could be identified in different environments.
Table 1
| Environment | Mean | SD | Coefficient of variation % | Min | Max | Range | Skew | Kurt |
|---|---|---|---|---|---|---|---|---|
| 21AC | 6.58 | 5.89 | 89.62 | 0.00 | 35.00 | 35.00 | 0.92 | 0.89 |
| 21XY | 7.64 | 6.67 | 87.24 | 0.00 | 32.00 | 32.00 | 0.82 | 0.18 |
| 23AC | 9.14 | 6.73 | 73.57 | 0.00 | 32.00 | 32.00 | 0.72 | 0.14 |
| 23QQ | 5.71 | 5.51 | 96.62 | 0.00 | 35.00 | 35.00 | 1.63 | 4.09 |
| 23WD | 7.71 | 4.61 | 59.79 | 0.00 | 25.00 | 25.00 | 0.87 | 0.85 |
Statistical analysis of four-seed pod numbers from GP in five environments.
GP, germplasm population.
The broad-sense heritability of NFSP was higher in multiple environments (Table 2), indicating that most genes controlling NFSP could be stably expressed in different environments, while a few genes were differentially expressed among environments.
Table 2
| Source | DF | SS | MS | F | Pr > F | σ2 |
|---|---|---|---|---|---|---|
| E(r) | 10 | 325.526 | 32.553 | 1.36 | 0.1928 | |
| E | 4 | 8,236.062 | 2,059.016 | 85.97 | <0.0001 | |
| G | 454 | 111,474.39 | 245.538 | 10.25 | <0.0001 | 12.421 |
| E * G | 1,705 | 119,204.369 | 69.915 | 2.92 | <0.0001 | 15.357 |
| Error | 4,318 | 103,412.378 | 23.949 | 23.949 | ||
| Total | 6,491 | 343,364.569 | ||||
| h2 | 0.727 |
Variance analysis and heritability of four-seed pod numbers.
3.2 QTNs associated with NFSP in soybean
A total of 89 QTNs controlling NFSP were detected on 20 chromosomes through seven methods in the mrMLM package, with a phenotypic contribution rate ranging from 0% to 11.47% (Supplementary Table S3). The mrMLM, FASTmrMLM, FASTmrEMMA, pLARmEB, pKWmEB, ISIS EM-BLASSO, and 3VmrMLM methods detected 31, 21, 9, 29, 33, 30, and 22 QTNs, respectively. Among them, the pKWmEB method detected the largest number (33 QTNs), while the FASTmrEMMA method detected the fewest number (nine QTNs). A total of 73 QTNs related to NFSP were detected in a single environment by applying the mrMLM, FASTmrMLM, FASTmrEMMA, pLARmEB, pKWmEB, ISIS, and EM-BLASSO methods. In the 21AC, 21XY, 23AC, 23QQ, and 23WD environments, 15, 18, 14, 22, and 7 QTNs were detected, respectively. Further analysis revealed that 34 QTNs related to soybean NFSP could be co-located by multiple methods or in multiple environments (Table 3). Among them, five QTNs were detected in multiple environments by multiple methods: AX-90314196 was detected in the 21XY and 23AC environments by methods mrMLM, ISIS EM-BLASSO, and IIIVmrMLM, and AX-90322106 was detected in the 21AC and 23QQ environments by methods pLARmEB, pKWmEB, and ISIS EM-BLASSO. AX-90435702 was detected by methods mrMLM, FASTmrMLM, pLARmEB, pKWmEB, and ISIS EM-BLASSO in the 21AC and 21XY environments; AX-90439914 was detected by methods mrMLM, FASTmrMLM, pLARmEB, and IIIVmrMLM in the 23AC and 23QQ environments; and AX-90487461 was detected by methods mrMLM, FASTmrMLM, FASTmrEMMA, pKWmEB, and ISIS EM-BLASSO in the 21XY and 23AC environments. Two of the six QTNs detected in a single environment were AX-90308949 and AX-90454301. Seven QTNs, AX-90384913, AX-90437943, AX-90458599, AX-90501229, AX-90486841, AX-90513557, and AX-90514080, were detected by five methods, and the other QTN was detected by two or three methods.
Table 3
| Method | Environment | Marker name | Chromosome | Position | QTN effect | LOD | r2 (%) | Reference |
|---|---|---|---|---|---|---|---|---|
| 1, 2, 5, 6 | 21XY | AX-90512118 | 1 | 4,439,457 | −1.31 to 0.78 | 3.04–5.92 | 1.08–4.02 | |
| 5, 6 | 23WD | AX-90523633 | 2 | 50,947,645 | 0.59–0.77 | 3.01–3.82 | 2.77–5.06 | |
| 2, 4 | 23AC | AX-90388204 | 3 | 47,091,631 | 0–1.92 | 3.25–3.26 | 0–1.43 | |
| 4, 5, 6 | 21AC; 23QQ | AX-90322106 | 4 | 5,248,031 | −1.09 to 0.7 | 3.22–7.44 | 2.13–3.63 | Ning et al., 2018 |
| 1, 2 | 21AC | AX-90355916 | 4 | 5,276,195 | −1.25 to 0.85 | 3.17–3.65 | 2.04–4.12 | Ning et al., 2018 |
| 3, 6 | 21AC | AX-90497448 | 5 | 36,641,584 | −2.02 to 1.03 | 3.41–3.64 | 1.75–2.14 | Liu et al., 2019 |
| 4, 5, 7 | 21AC | AX-90310000 | 5 | 41,763,073 | 1–4.78 | 0.51–4.53 | 0.43–2.73 | |
| 3, 5, 6 | 23WD | AX-90385665 | 9 | 2,222,201 | −1.6 to 1.66 | 3.39–4.15 | 2.11–2.9 | Liu et al., 2019 |
| 1, 6 | 23QQ | AX-90380549 | 9 | 26,246,922 | 1.01–1.41 | 3.03–3.88 | 1.4–2.55 | Liu et al., 2019 |
| 1, 2, 3, 4, 6 | 23AC | AX-90514080 | 9 | 27,126,425 | −1.94 to 0.92 | 3.21–3.94 | 1.41–2.64 | Liu et al., 2019 |
| 1, 2, 4 | 21AC | AX-90433162 | 9 | 41,044,657 | −1.82 to 0.81 | 4.24–7.16 | 1.74–4.26 | Ning et al., 2018 Vieira et al., 2006 |
| 1, 2, 4, 5, 6, 7 | 23AC | AX-90308949 | 9 | 45,912,518 | 1.25–12.29 | 0.86–7.66 | 1.74–6.23 | |
| 1, 2, 4, 5, 6 | 21XY | AX-90486841 | 10 | 47,767,513 | 0.85–1.22 | 3.61–6.16 | 1.6–4.04 | Liu et al., 2011 |
| 1, 2, 4, 7 | 23AC; 23QQ | AX-90439914 | 10 | 49,967,144 | −1.01 to 9.08 | −0.73 to 4.29 | 1.34–3.25 | |
| 1, 2, 4, 5, 6 | 23AC | AX-90437943 | 11 | 2,180,923 | 0.86–1.09 | 3.28–4.53 | 1.55–3.67 | Ning et al., 2018 |
| 1, 4, 5, 6 | 23QQ | AX-90314120 | 11 | 6,038,751 | 1.12–1.81 | 3.14–4.97 | 0.94–4.89 | Sun et al., 2006 |
| 1, 5 | 23WD | AX-90305288 | 11 | 7,262,127 | −2.39 to 1.6 | 3.54–5.35 | 6.6–6.81 | Sun et al., 2006 Zhang et al., 2010 |
| 5, 6 | 23QQ | AX-90477061 | 12 | 6,109,948 | −1.31 to 1.24 | 4.75–5.25 | 2.41–3.89 | |
| 2, 3, 6 | 23WD | AX-90414576 | 12 | 6,226,984 | −1.8 to 0 | 3.04–3.62 | 0–2.01 | |
| 1, 2, 4, 5, 6 | 21XY | AX-90458599 | 13 | 19,283,704 | −1.85 to 1.6 | 3.12–5.44 | 3.05–5.03 | Tischner et al., 2003 |
| 1, 2, 4, 5, 6 | 23QQ | AX-90513557 | 13 | 21,995,904 | −1.49 to 0.84 | 3.42–6.39 | 1.55–4.55 | Tischner et al., 2003 |
| 1, 2, 4, 5 | 21XY | AX-90453898 | 13 | 29,844,012 | 0.84–1.33 | 3.69–4.58 | 1.45–3.67 | Fang et al., 2017 |
| 1, 2, 4, 5, 6 | 23AC | AX-90384913 | 13 | 36,034,579 | 1–1.49 | 3.05–4.5 | 1.86–3.37 | |
| 1, 6, 7 | 21XY; 23AC | AX-90314196 | 14 | 3,021,120 | −0.99 to 10.95 | 0.79–3.56 | 1.54–1.81 | |
| 1, 2, 5, 7 | 21XY | AX-90329712 | 15 | 12,203,882 | −2.54 to 41.82 | −1.58 to 4.36 | 1.3–5.25 | Ning et al., 2018 |
| 1, 2, 4, 5, 6 | 21AC; 21XY | AX-90435702 | 16 | 1,543,661 | −1.82 to 0.76 | 3.2–6.4 | 1.8–6.53 | |
| 1, 2, 4, 6 | 23AC | AX-90326632 | 16 | 31,040,785 | −1.25 to 0.82 | 3.11–4.08 | 1.44–3.38 | Tischner et al., 2003 Ning et al., 2018 |
| 1, 2, 4, 5, 6 | 23QQ | AX-90501229 | 18 | 17,683,013 | −1.46 to 0.92 | 3.9–5.91 | 1.83–4.25 | |
| 1, 4 | 23QQ | AX-90410394 | 19 | 40,694,436 | 0.91–0.97 | 4.6–5.46 | 2.26–2.82 | Ning et al., 2018 |
| 1, 2, 3, 5, 6 | 21XY; 23AC | AX-90487461 | 20 | 34,521,486 | 1.33–3.97 | 5.08–12.83 | 6.19–8.85 | Li et al., 2008 Jeong et al., 2011 |
| 1, 2, 3, 4, 5, 6 | 21AC | AX-90454301 | 20 | 34,958,132 | 1.46–3 | 5.41–10.43 | 5.63–11.47 | Li et al., 2008 Jeong et al., 2011 |
Stable QTNs related to four-seed pod numbers detected by multiple methods or multiple environments.
QTNs, quantitative trait nucleotides.
In addition, four QTNs with additive and environmental interaction effects were detected by the IIIVmrMLM method (Table 4), and the ratio of phenotypic variation explained by these QTNs ranged from 0.572% to 1.1794%. The main effect of AX-90514080 also reached a significant level (Table 3).
Table 4
| Marker | Chromosome | Position (bp) | LOD | add * env1 | add * env2 | add * env3 | add * env4 | add * env5 | Variance | R2 (%) | p-Value | Significance | Reference |
|---|---|---|---|---|---|---|---|---|---|---|---|---|---|
| AX-90398950 | 4 | 38,248,564 | 7.8689 | −0.4376 | 0.8195 | 0.366 | 0.2973 | −1.0451 | 0.4355 | 1.1794 | 2.5874E−07 | SIG | |
| AX-90514080 | 9 | 27,126,425 | 3.8134 | −0.8767 | 0.0584 | 0.0916 | 0.2861 | 0.4405 | 0.2112 | 0.572 | 0.00150352 | SUG | Liu et al., 2019 |
| AX-90428842 | 16 | 714,535 | 7.4222 | −0.2328 | 0.9509 | 0.1954 | 0.0778 | −0.9913 | 0.3971 | 1.0752 | 6.8477E−07 | SIG | |
| AX-90329698 | 18 | 6,515,078 | 5.7243 | −1.0801 | 0.0742 | 0.2831 | 0.168 | 0.5548 | 0.3177 | 0.8602 | 2.6766E−05 | SUG |
QTN based on the additive by environment interaction effect via IIIVmrMLM method.
add * env1, add * env2, add * env3, add * env4, and add * env5 represent additive by environment interaction effect under five environments.
SIG, significant; SUG, suggested.
3.3 Prediction and haplotype analysis of NFSP-related candidate genes
In the decay regions (43 kb before and after) of 34 stable QTNs associated with soybean NFSP, a total of 267 genes were retrieved from the Phytozome website (Supplementary Table S4). Further enrichment analysis by the KEGG pathway showed that these genes could be divided into six categories and 37 metabolic pathways (Figure 3).
Figure 3
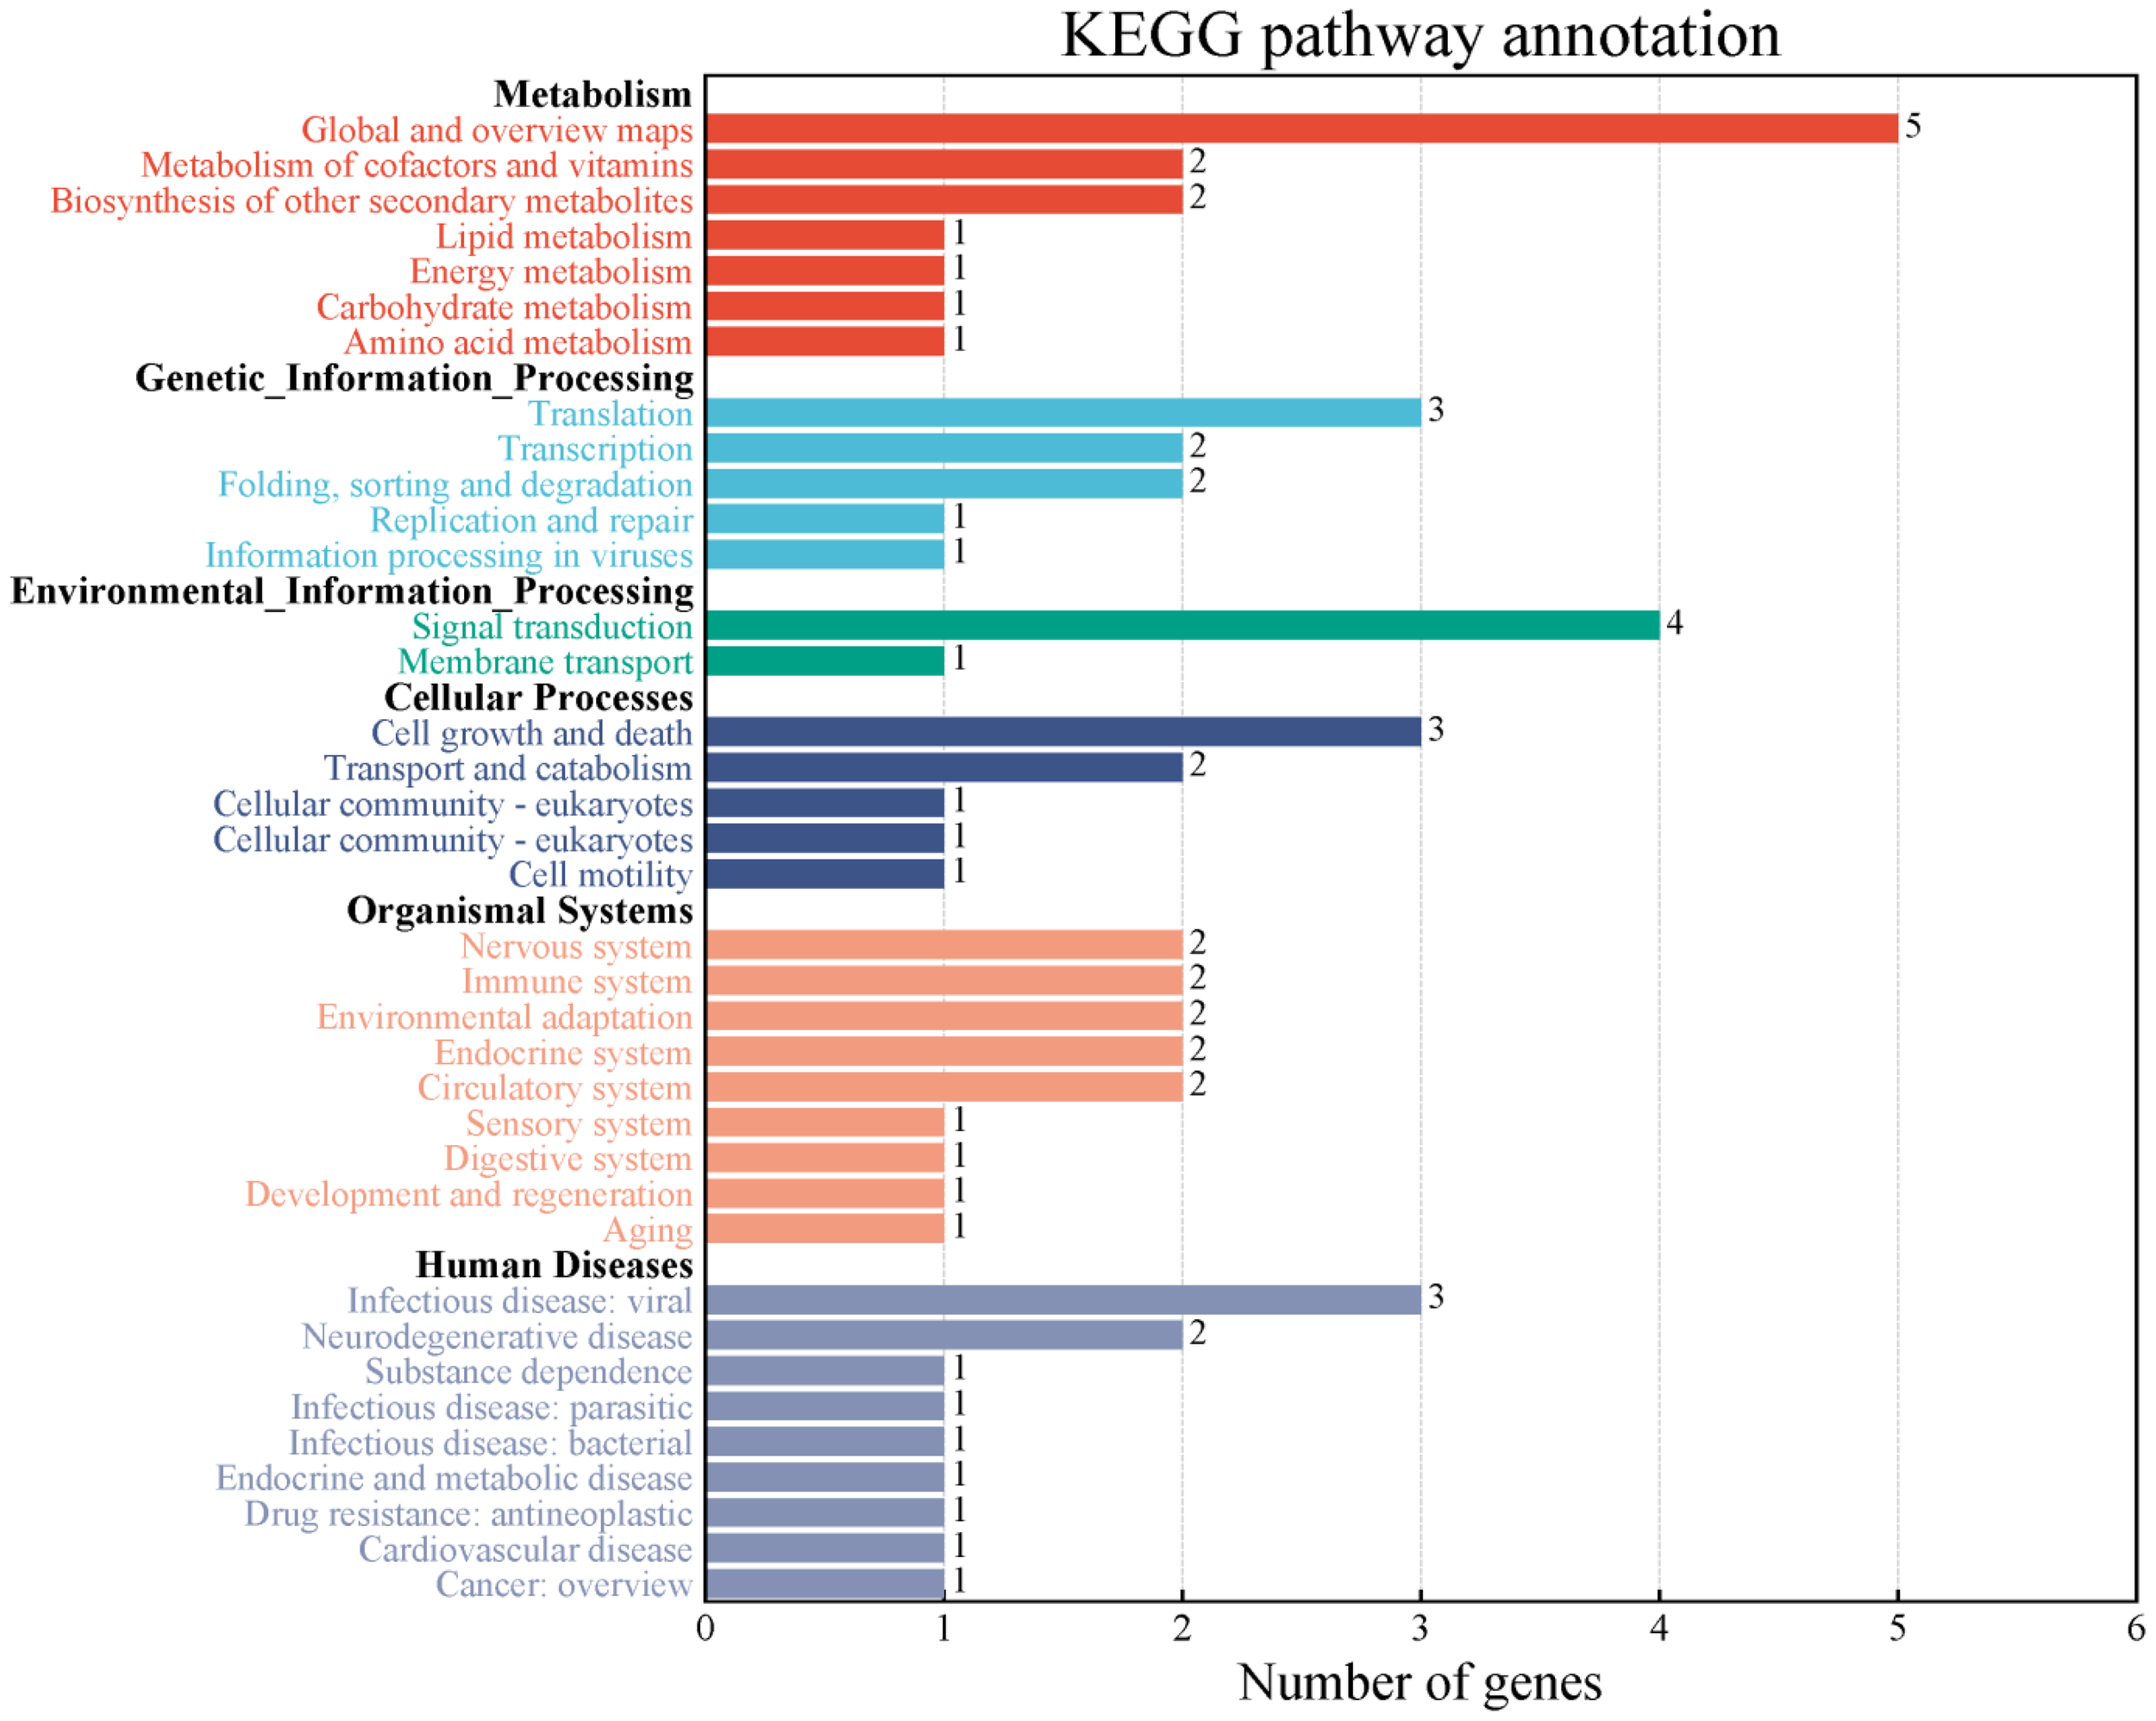
Two-classification summary of genes through KEGG pathway enrichment analysis. KEGG, Kyoto Encyclopedia of Genes and Genomes.
Through literature search and the National Center of Biotechnology Information (NCBI) website (www.ncbi.nlm.nih.gov), 49 genes possibly related to NFSP were further screened by analyzing gene function annotations (Supplementary Table S5). Using the resequencing data of 202 germplasm resources, the non-synonymous mutation sites in the coding regions of the above 49 genes were found through the Vcftools software, and the coding region sequence variation of three genes, Glyma.13G105400, Glyma.04G063700, and Glyma.04G063100, were found (Table 5). Among them, Glyma.13G105400 was a DNA-binding protein due to a base mutation resulting in the conversion of alanine to valine. Glyma.04G063700 changed from methionine to isoleucine, and the functional annotation was the zinc lipoprotein superfamily. Glyma.04G063100 changed from phenylalanine to leucine, and the functional annotation was the protein kinase superfamily.
Table 5
| Genes | Marker | Mutation site | Mutation base | Functional annotation |
|---|---|---|---|---|
| Glyma.04G063100 | AX-90322106 | 5,212,739 | A–G | Protein kinase superfamily protein |
| Glyma.04G063700 | AX-90322106 | 5,257,832 | G–A | RING/FYVE/PHD zinc finger superfamily protein |
| Glyma.13G105400 | AX-90513557 | 22,769,101 | C–T | Basic helix-loop-helix (bHLH) DNA-binding family protein |
Three candidate genes with significant variation and their mutation sites.
According to the sequence variation of the coding region, the three genes showed two allelic genotypes, Hap1 and Hap2, forming two haplotypes. Combined with phenotypic data and grouped by haplotype, the difference in NFSP was tested for significance, and there were significant differences in NFSP among haplotypes of each gene, as shown in Figure 4. The NFSP value of Hap1 of Glyma.13G105400, Glyma.04G063700, and Glyma.04G063100 genes was higher than that of Hap2.
Figure 4
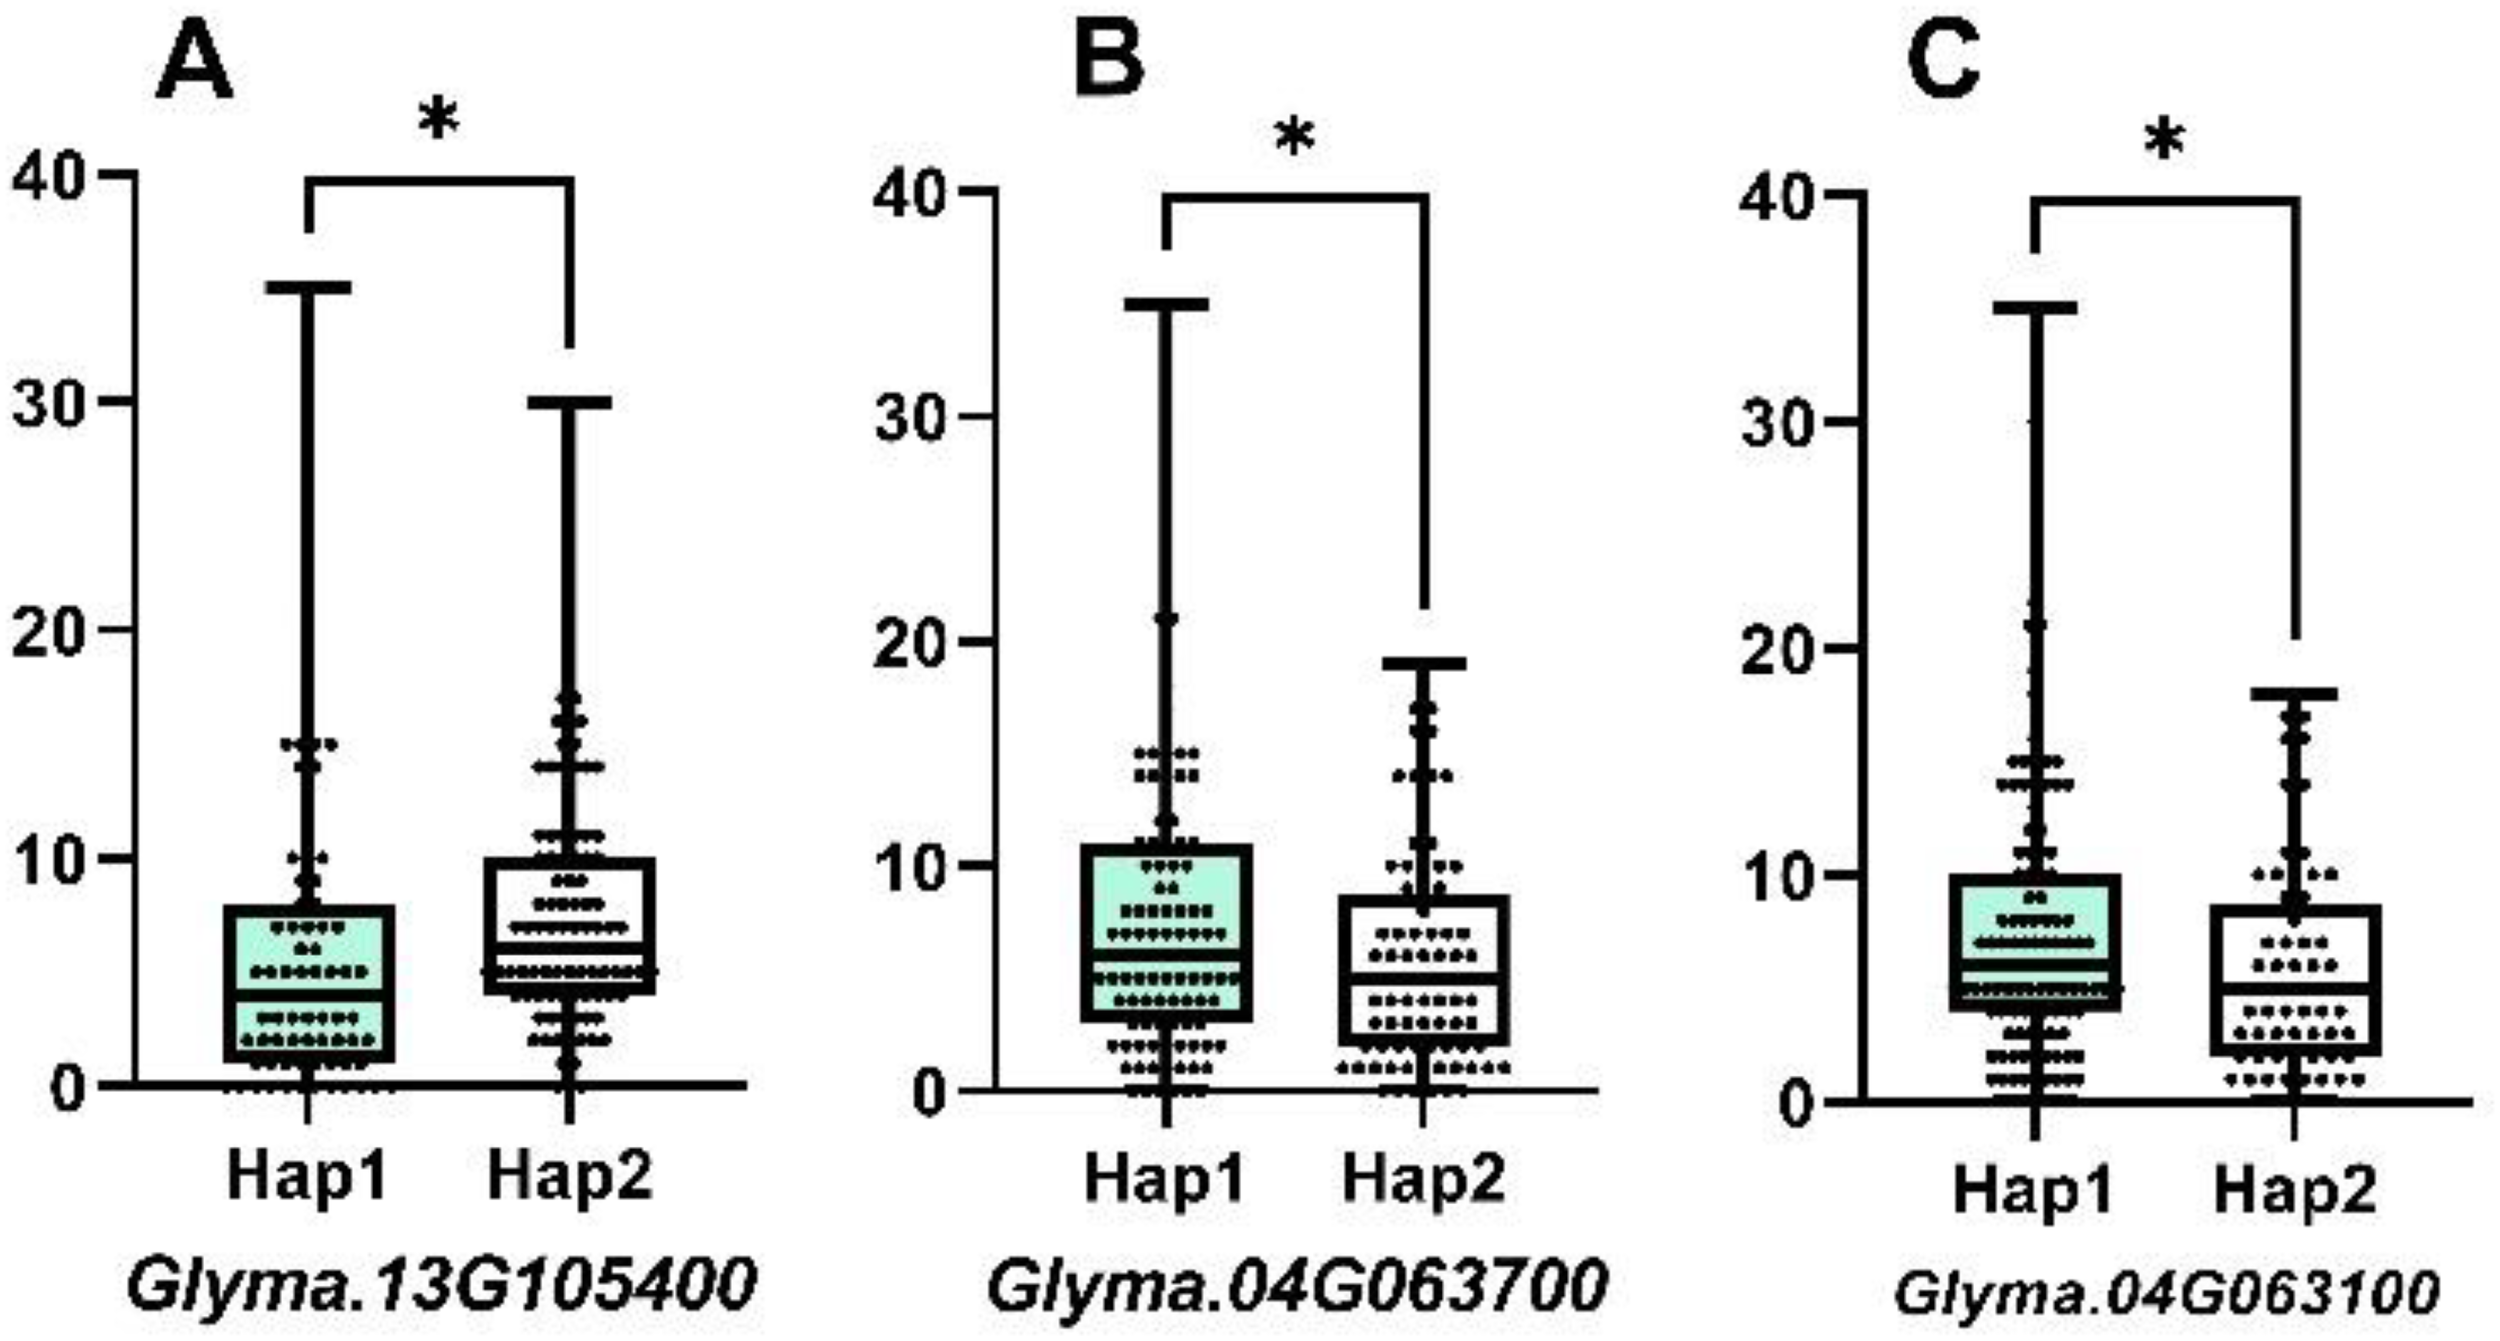
The difference between two haplotypes of three candidate genes. For Glyma.13G105400, the mean of Hap1 is 5.803, n1 = 76, the mean of Hap2 is 7.606, n2 = 104, p-value is 0.0365, and r2 = 0.02434. For Glyma.04G063700, the mean of Hap1 is 7.571, n1 = 105, the mean of Hap2 is 5.845, n2 = 84, p-value is 0.0403, and r2 = 0.02229. For Glyma.04G063100, the mean of Hap1 is 7.504, n1 = 113, the mean of Hap2 is 5.735, n2 = 68, p-value is 0.0406, and r2 = 0.02321.
3.4 Optimal breeding schemes for NFSP
Using the genotypes and the NFSP phenotypic data of a single plant in five environments (Supplementary Table S6) of 455 varieties in the GP, MAS models were established for five environments, and the regression effects of 89 QTNs on a single NFSP reached a significant level in all five environments. In the five environments of 23AC, 21XY, 21AC, 23WD, and 23QQ, the model could explain 50.1%, 55.06%, 52.35%, 44.82%, and 50.56%, respectively, of the phenotypic variation in NFSP (Supplementary Table S7).
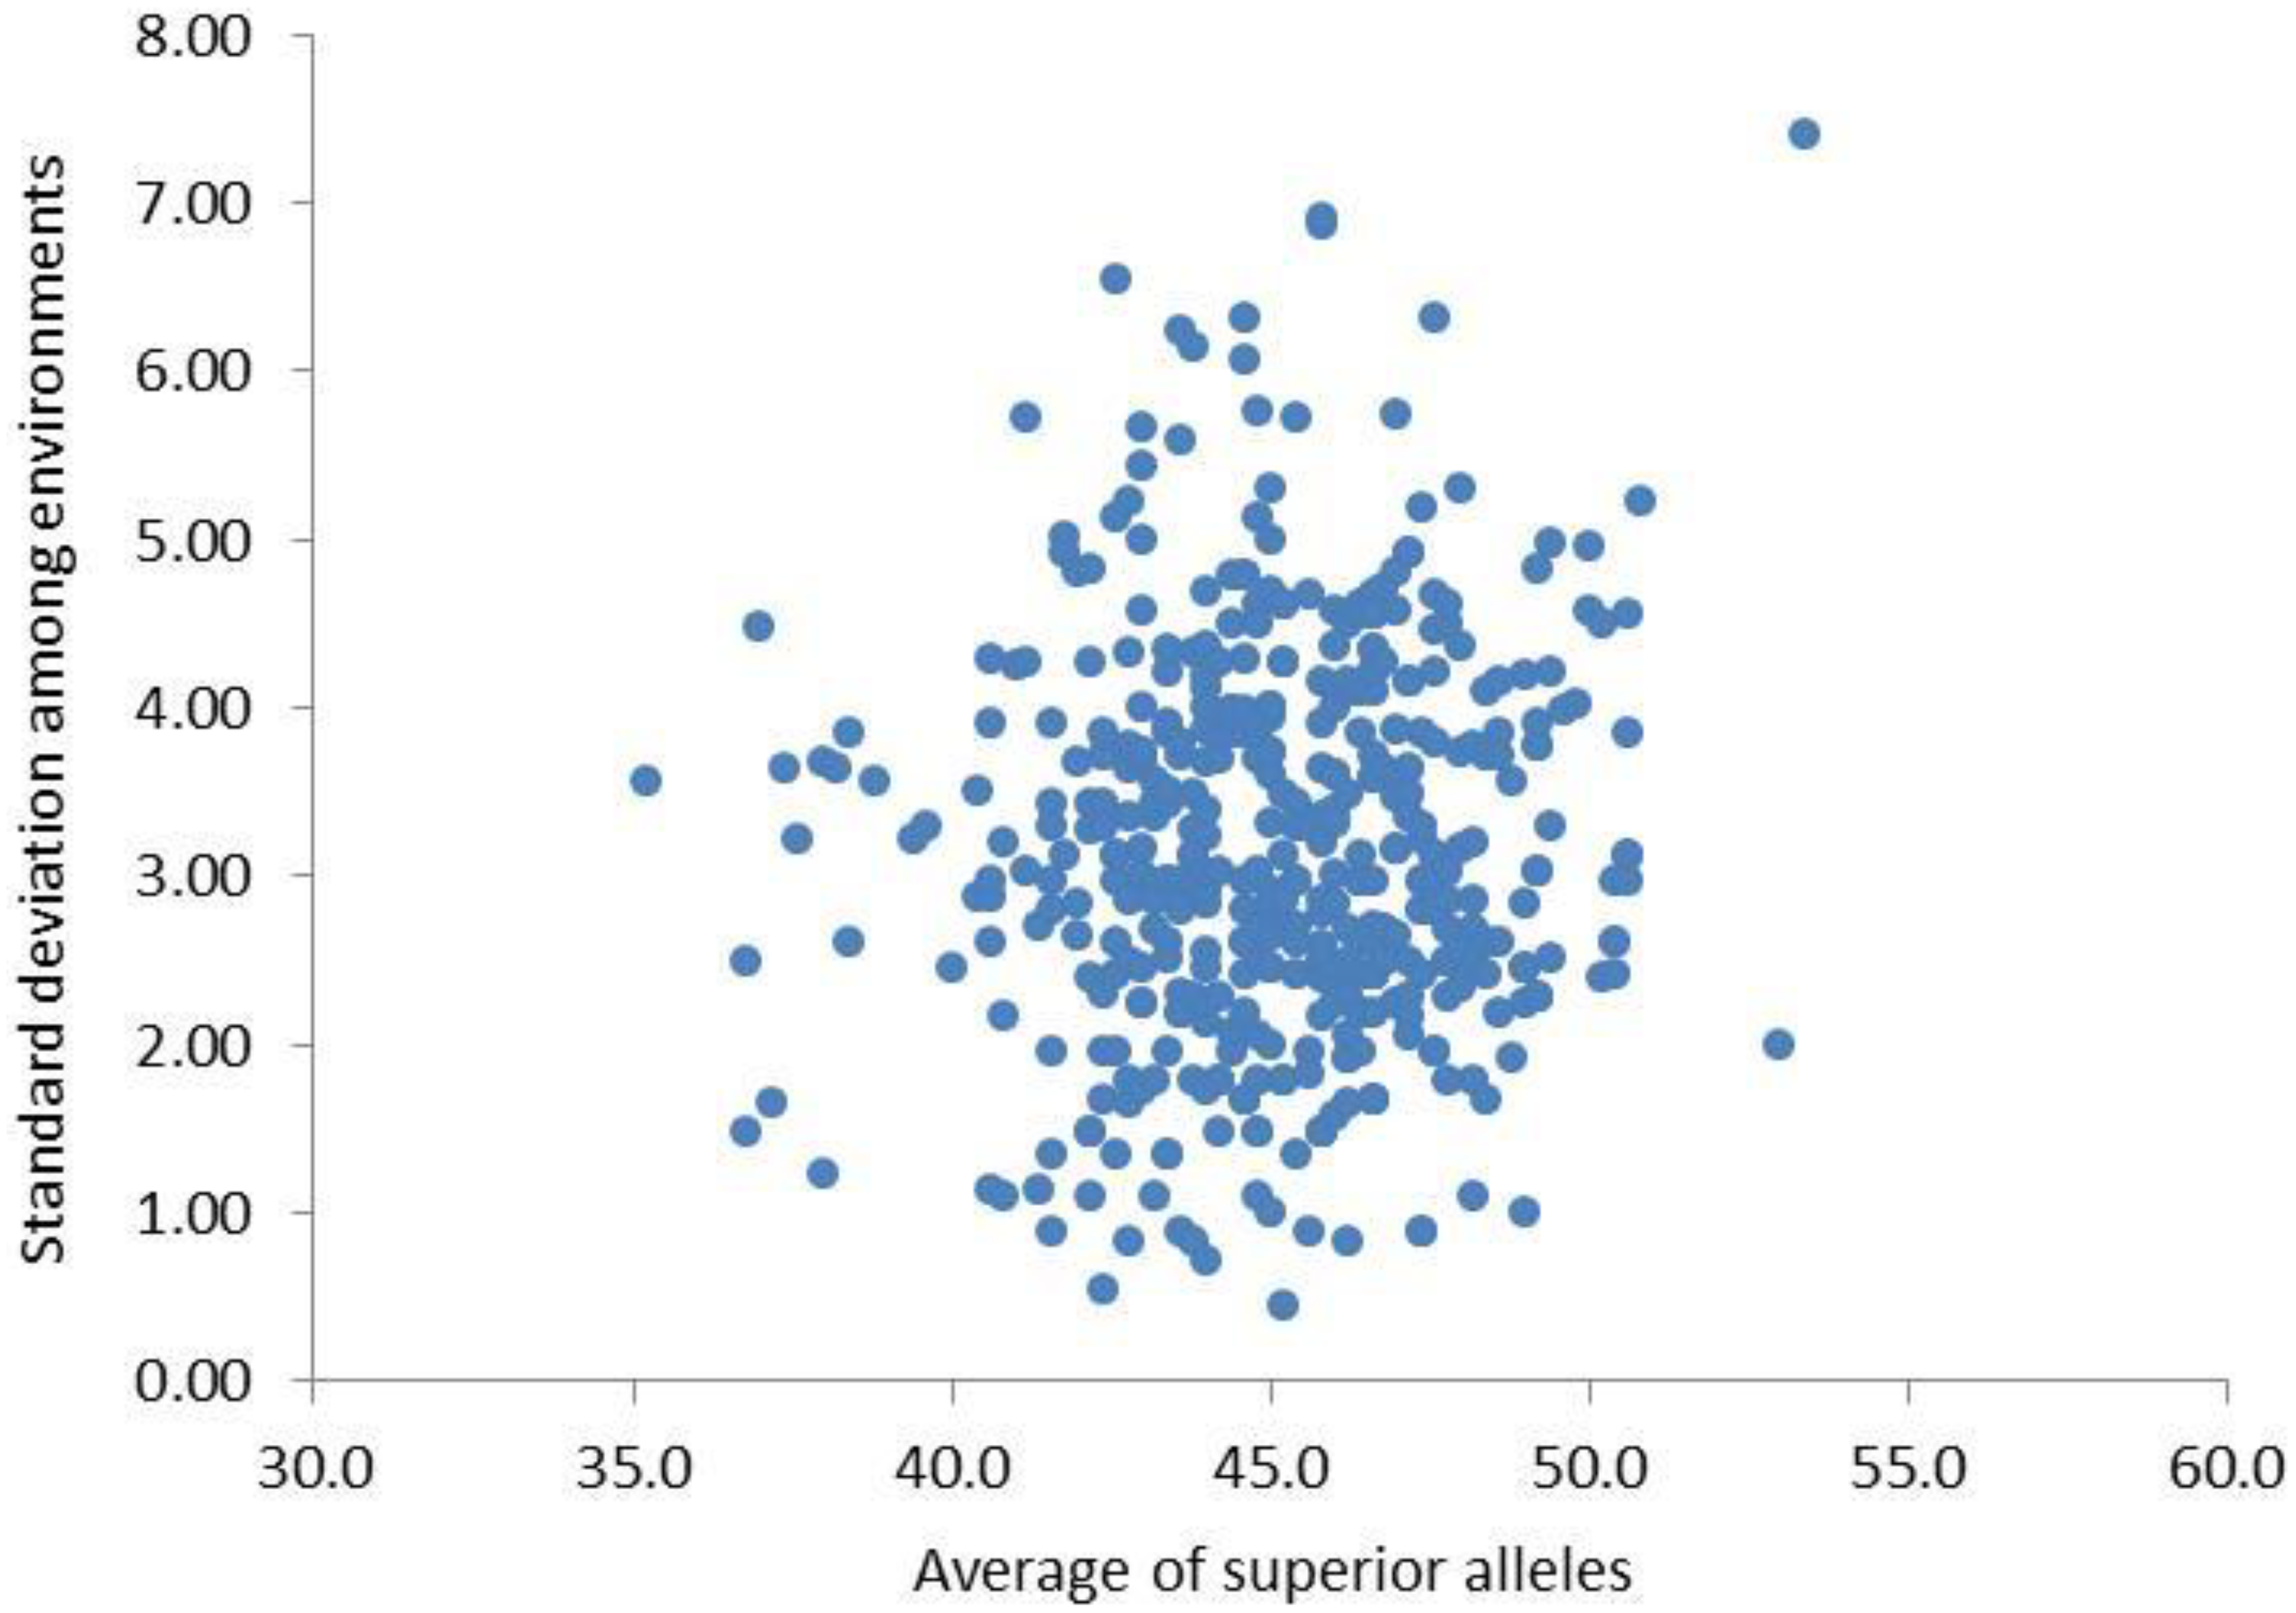
Based on the genetic effect values of QTNs in the above MAS model, the synergistic alleles of the two alleles of QTNs were defined as superior alleles. Among the five environments, there was little difference in the range of the number of superior alleles (NSA) in the original population (parents), which were close to normal distribution (Table 6). The mean and standard deviation of NSA for each individual varied greatly among different environments, indicating that the NSA of each individual was affected by the environment, which laid the genetic basis of genotype × environment interaction in NFSP (Figure 5).
Table 6
| Number of superior alleles | Environment | ||||
|---|---|---|---|---|---|
| 21AC | 21XY | 23AC | 23QQ | 23WD | |
| 31 | 0 | 0 | 0 | 0 | 1 |
| 32 | 0 | 1 | 2 | 1 | 0 |
| 33 | 0 | 0 | 1 | 1 | 1 |
| 34 | 0 | 3 | 0 | 2 | 1 |
| 35 | 0 | 3 | 3 | 4 | 2 |
| 36 | 6 | 4 | 1 | 4 | 4 |
| 37 | 3 | 8 | 2 | 13 | 3 |
| 38 | 7 | 14 | 2 | 13 | 6 |
| 39 | 5 | 14 | 5 | 18 | 11 |
| 40 | 19 | 26 | 10 | 33 | 11 |
| 41 | 24 | 30 | 10 | 35 | 27 |
| 42 | 24 | 43 | 21 | 44 | 34 |
| 43 | 41 | 50 | 35 | 39 | 38 |
| 44 | 44 | 51 | 44 | 50 | 68 |
| 45 | 52 | 37 | 44 | 50 | 43 |
| 46 | 43 | 47 | 36 | 32 | 56 |
| 47 | 43 | 38 | 32 | 25 | 46 |
| 48 | 26 | 24 | 59 | 33 | 39 |
| 49 | 27 | 16 | 40 | 18 | 19 |
| 50 | 29 | 16 | 42 | 16 | 10 |
| 51 | 25 | 10 | 28 | 6 | 13 |
| 52 | 11 | 10 | 14 | 6 | 11 |
| 53 | 9 | 5 | 8 | 7 | 7 |
| 54 | 9 | 2 | 8 | 3 | 4 |
| 55 | 3 | 1 | 5 | 0 | 0 |
| 56 | 3 | 1 | 2 | 1 | 0 |
| 57 | 1 | 0 | 1 | 0 | 0 |
| 58 | 0 | 0 | 0 | 0 | 0 |
| 59 | 0 | 1 | 0 | 0 | 0 |
| 60 | 0 | 0 | 0 | 1 | 0 |
| 61 | 1 | 0 | 0 | 0 | 0 |
The frequency of NSA of NFSP in the original population under five environments.
NSA, number of superior alleles; NFSP, number of four-seed pods.
Figure 5
Mean and standard deviation of NSA of 455 varieties in five environments. NSA, number of superior alleles.
For the single-cross combination of two parents, after seven generations of selection of each breeding scheme, the number of hybrid offspring obtained by each breeding scheme, the genotype values, and the NSA contained are shown in Table 7. In the five environments of 23AC, 21XY, 21AC, 23WD, and 23QQ, the range of NSA (minimum to maximum value) of the hybrid offspring obtained by various breeding schemes was higher than that of the parents (original populations), indicating that NSA can be increased after selection by various breeding schemes. In the five environments, the maximum and mean values of the NFSP genotypes of the hybrid offspring obtained by various breeding schemes were higher than those of the parents (original populations), indicating that an individual NFSP could be improved after selection by various breeding schemes.
Table 7
| Environment | Population | Number of individuals | Number of superior alleles | Genotype value | |||
|---|---|---|---|---|---|---|---|
| Min | Max | Mean | SD | ||||
| 21AC | Original population | 455 | 36~61 | 0.00 | 24.52 | 8.63 | 4.56 |
| Progeny-200Ped | 8,263 | 34~67 | 0.00 | 43.70 | 19.71 | 8.46 | |
| Progeny-200Blk | 20,657 | 36~66 | 0.00 | 45.99 | 18.09 | 7.81 | |
| Progeny-500Ped | 20,657 | 36~65 | 0.00 | 47.53 | 19.87 | 8.52 | |
| Progeny-500Blk | 20,675 | 36~66 | 0.15 | 47.05 | 18.30 | 7.90 | |
| Progeny-800Ped | 33,051 | 35~67 | 0.00 | 47.67 | 19.93 | 8.52 | |
| Progeny-800Blk | 20,657 | 35~65 | 0.00 | 46.45 | 18.35 | 7.91 | |
| 21XY | Original population | 455 | 32~59 | 0.00 | 26.59 | 7.62 | 5.13 |
| Progeny-200Ped | 8,263 | 39~64 | 2.66 | 44.74 | 20.77 | 5.79 | |
| Progeny-200Blk | 20,657 | 36~64 | 2.72 | 42.66 | 19.83 | 5.57 | |
| Progeny-500Ped | 20,657 | 39~64 | 2.77 | 44.02 | 20.94 | 5.85 | |
| Progeny-500Blk | 20,657 | 38~64 | 3.39 | 43.06 | 20.28 | 5.63 | |
| Progeny-800Ped | 33,051 | 38~64 | 2.60 | 48.57 | 21.06 | 5.79 | |
| Progeny-800Blk | 20,657 | 38~63 | 1.80 | 42.99 | 20.33 | 5.65 | |
| 23WD | Original population | 455 | 31~54 | 0.00 | 17.06 | 7.61 | 3.25 |
| Progeny-200Ped | 8,263 | 38~61 | 1.59 | 26.93 | 14.04 | 3.15 | |
| Progeny-200Blk | 20,657 | 38~63 | 1.42 | 25.16 | 13.90 | 3.14 | |
| Progeny-500Ped | 20,657 | 36~62 | 3.04 | 28.59 | 14.06 | 3.15 | |
| Progeny-500Blk | 20,657 | 38~62 | 1.85 | 26.91 | 14.11 | 3.19 | |
| Progeny-800Ped | 33,051 | 37~63 | 1.31 | 26.68 | 14.09 | 3.16 | |
| Progeny-800Blk | 20,657 | 38~62 | 2.99 | 27.27 | 14.15 | 3.17 | |
| 23QQHE | Original population | 455 | 32~60 | 0.00 | 20.14 | 5.66 | 3.99 |
| Progeny-200Ped | 8,263 | 39~65 | 5.04 | 30.99 | 16.82 | 3.79 | |
| Progeny-200Blk | 20,657 | 36~66 | 1.97 | 30.53 | 16.20 | 3.88 | |
| Progeny-500Ped | 20,657 | 37~67 | 3.68 | 32.48 | 16.85 | 3.82 | |
| Progeny-500Blk | 20,657 | 39~66 | 2.79 | 34.65 | 16.46 | 3.89 | |
| Progeny-800Ped | 33,051 | 37~69 | 3.74 | 32.73 | 16.89 | 3.84 | |
| Progeny-800Blk | 20,657 | 37~66 | 3.80 | 31.35 | 16.52 | 3.86 | |
| 23AC | Original population | 455 | 32~57 | 0.00 | 22.54 | 8.97 | 5.19 |
| Progeny-200Ped | 8,263 | 34~64 | 0.00 | 42.87 | 17.16 | 5.43 | |
| Progeny-200Blk | 20,657 | 37~66 | 0.00 | 40.29 | 16.97 | 5.21 | |
| Progeny-500Ped | 20,657 | 35~68 | 0.00 | 43.32 | 17.27 | 5.46 | |
| Progeny-500Blk | 20,657 | 34~65 | 0.00 | 43.29 | 17.31 | 5.31 | |
| Progeny-800Ped | 20,657 | 35~64 | 0.00 | 44.99 | 17.23 | 5.51 | |
| Progeny-800Blk | 20,657 | 36~65 | 0.00 | 43.48 | 17.27 | 5.29 | |
NSA and genotype values of the parents and offspring screened by various breeding schemes in five environments.
NSA, number of superior alleles.
With the increase of F2 population size, the number of individuals selected by the pedigree method increased, but there was no effect on the number of outstanding offspring individuals selected by the bulk selection method. At the small F2 population size (200), the number of individuals selected by the bulk selection method was more than that by the pedigree method. At a large F2 population size (800), the number of individuals selected by the pedigree method was more than that by the bulk selection method. For the same F2 scale scheme, the standard deviation of the NFSP of the offspring from the pedigree method and the bulk selection method was quite different. For the 21AC, 21XY, and 23AC environments, the standard deviation of the NFSP of the offspring from the pedigree method was higher than that of the bulk selection method, indicating that the variation of the offspring of the pedigree method was better than that of the bulk selection method in these three environments. However, for 23QQ, the standard deviation of the NFSP of offspring treated by the pedigree method was lower than that of offspring treated by the bulk selection method, indicating that the variation range of offspring treated by the bulk selection method was better than that treated by the pedigree method in the 23QQ environment.
The distribution of the number of individuals of each NFSP type in the selected offspring lines of each breeding program in each environment is listed in Supplementary Table S8. The distribution of NFSP genotype values of the selected offspring in each breeding program all presented a normal distribution. For each environment, based on the principle that the highest genotype value is the best breeding goal, the cross combinations and their selection methods with the genotype values distributed in the highest two intervals were determined as the best breeding scheme.
In the 21AC, 21XY, 23WD, 23QQ, and 23AC environments, the breeding goals were determined as NFSP values of over 43, 43, 25, 31, and 40, respectively. A total of 153 schemes were selected from five environments, including 40, 9, 48, 14, and 42 breeding schemes selected from 25, 5, 26, 9, and 28 hybrid combinations, respectively (Supplementary Table S9). Except for the CX094/CX246, CX097/CX426, and CX097/CX448 combinations, all hybrid combinations were only selected in one environment (Figure 6).
Figure 6
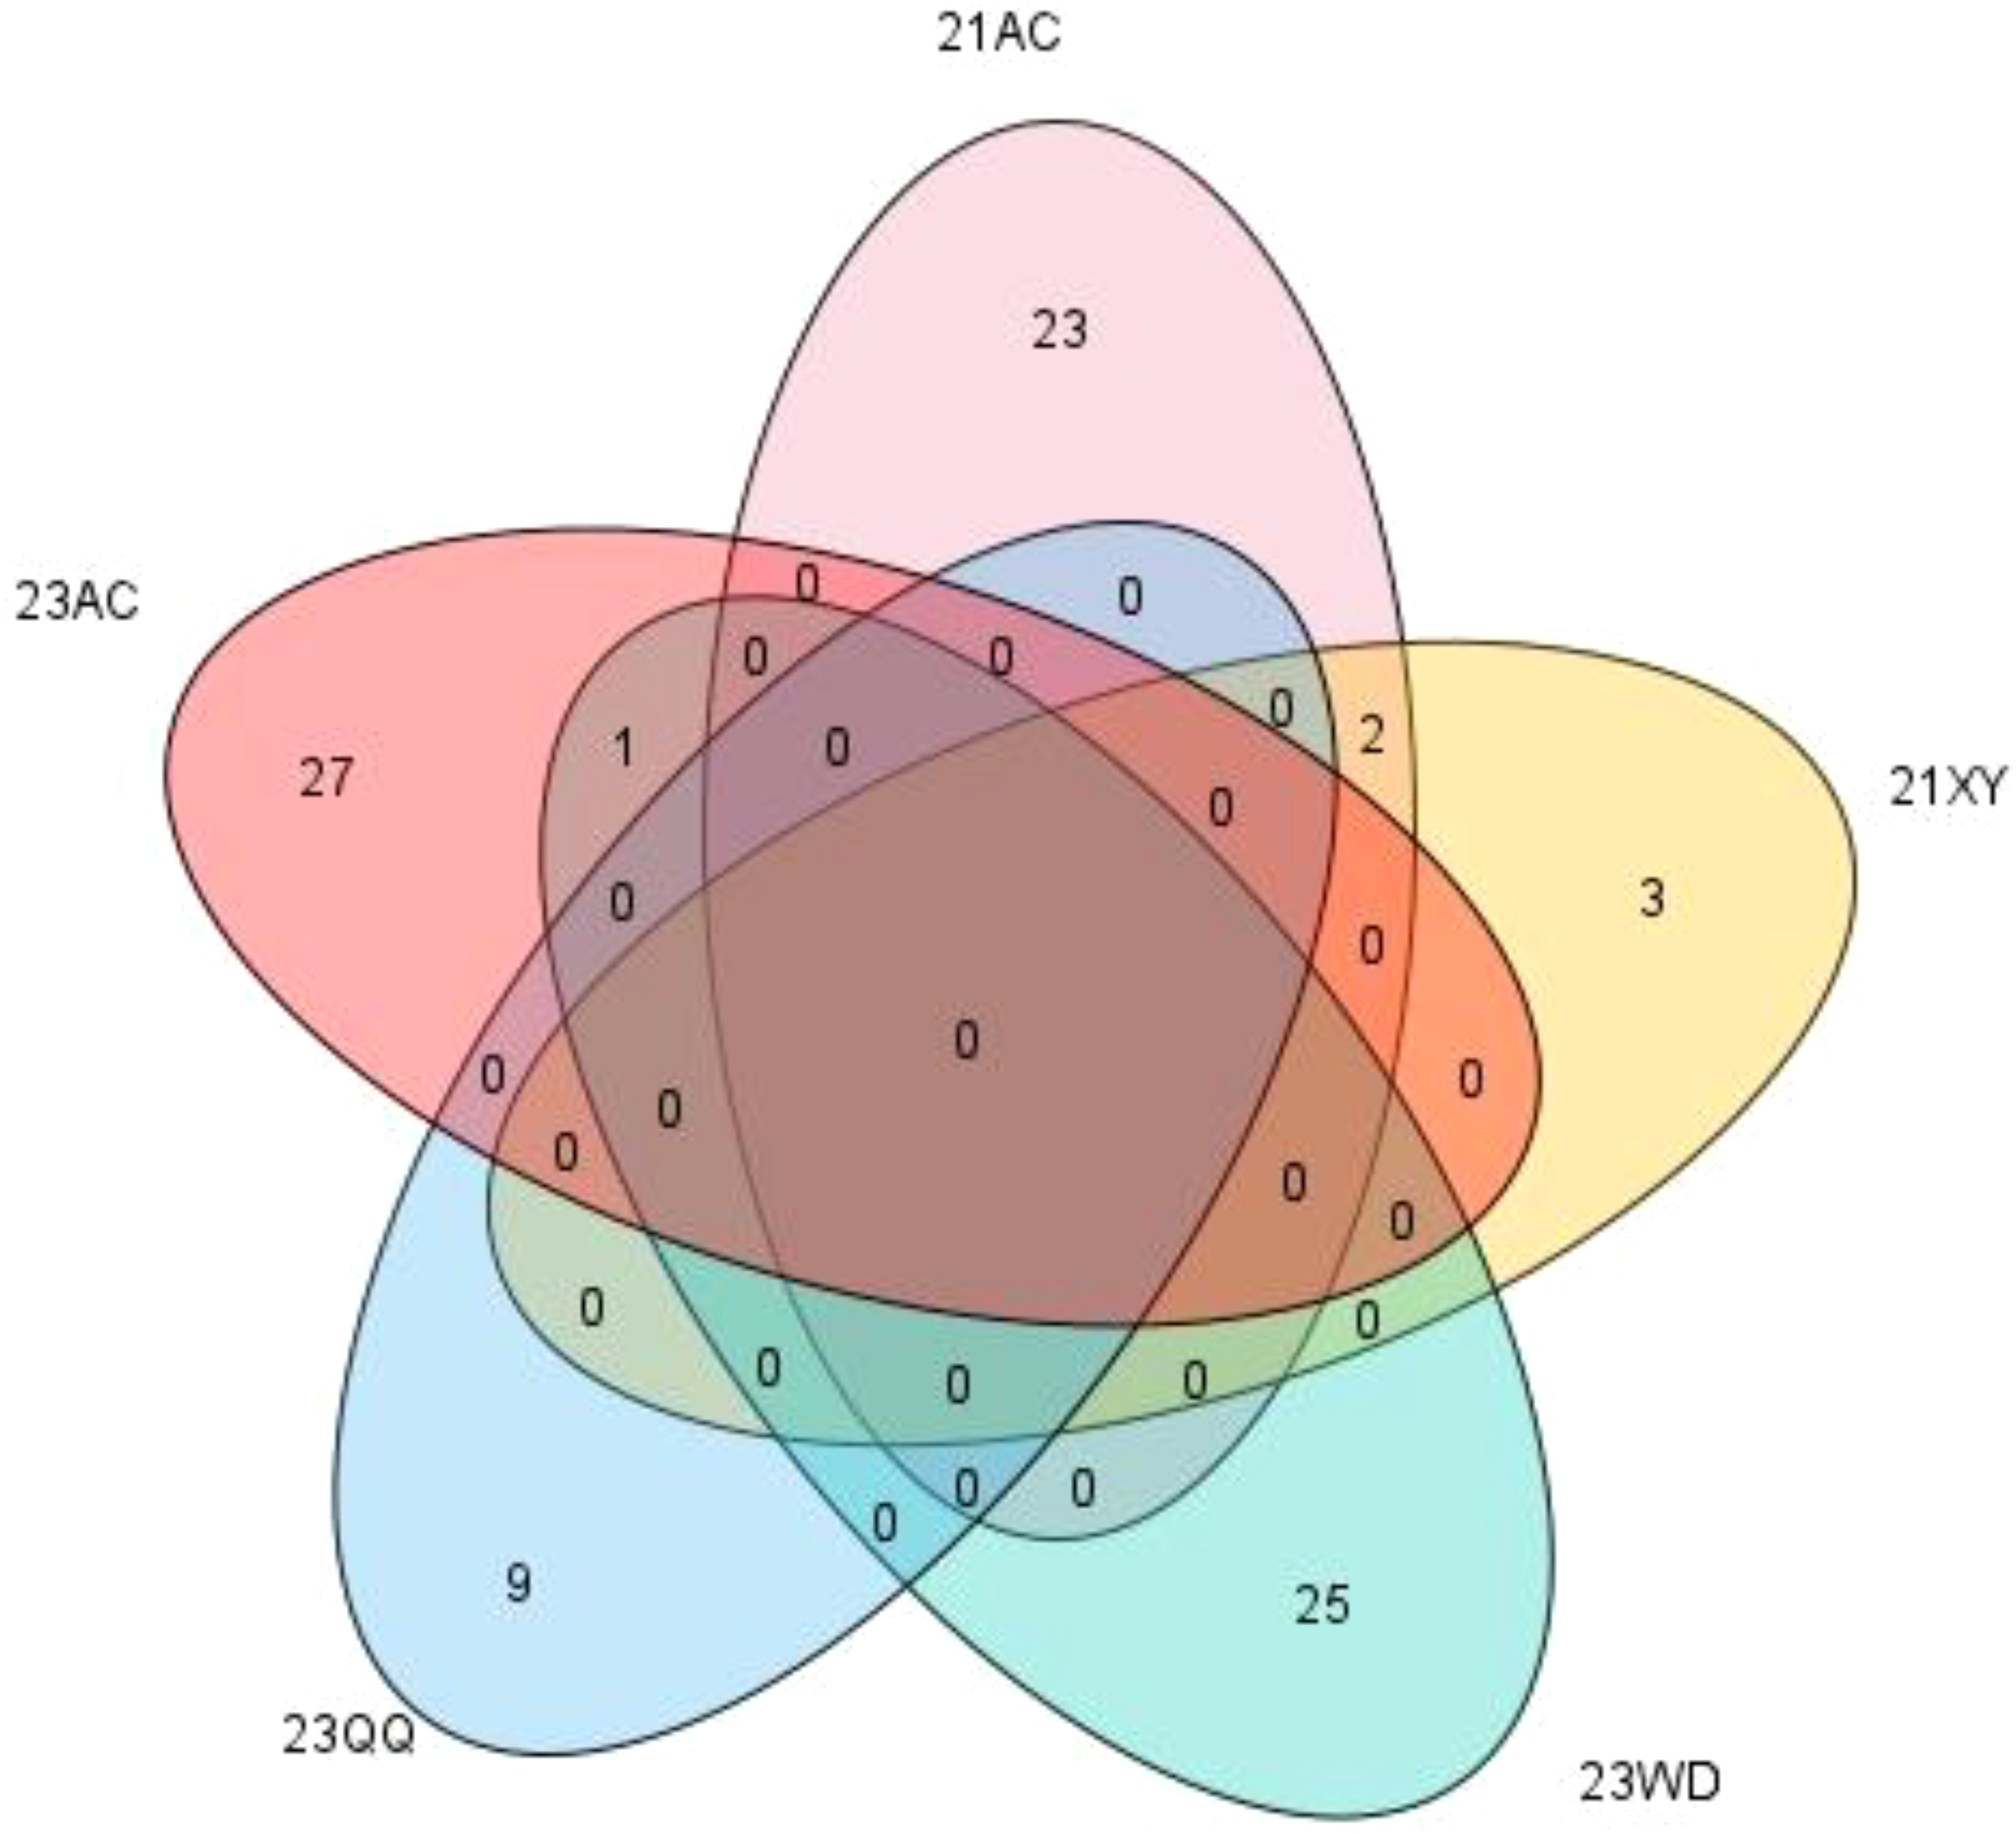
The number of hybrid combinations selected for different environments.
4 Discussion
4.1 Genetic characteristics of soybean NFSP
Extensive studies have been conducted on the genetic characteristics of pod number-related traits in different genetic populations of soybeans. The number of pods per plant in the RIL population derived from Charleston × Dongnong 594 showed a normal distribution (Chen et al., 2007). The number of pods per plant in the RIL population derived from Bogao × Nannong94–156 presented a normal distribution at all growth stages (Zhang et al., 2010). In this study, the NFSP of the germplasm population consisting of 455 varieties showed a skewed continuous distribution in five environments. This is due to the different genetic bases of the natural germplasm population and the RIL population. The former is composed of varieties selected by artificial or natural selection, while the latter is formed by the genetic recombination of allelic variations carried by two of four parental varieties.
NFSP in soybean is a quantitative trait controlled by multiple genes. In the present research, a total of 89 QTNs were detected in five environments, namely, 21AC, 21XY, 23AC, 23QQ, and 23WD, with the phenotypic contribution rate of individual QTNs ranging from 0% to 11.47%, indicating that NFSP is controlled by both major and minor genes. This is similar to the phenotypic contribution rate of 23 NFSP QTLs detected in the four-way recombinant inbred line population, which ranged from 2.24% to 10.8% (Liu et al., 2019). Notably, among all the QTNs identified in this study, AX-90454301 (Gm20:34958132) had a phenotypic contribution rate of 5.63%–11.47%, which is considered a major gene and is located in close proximity to the reported Ln gene for four-seeded pods (Gm20: 35827672–35830107) (Jeong et al., 2012) (Table 4).
The heritability of pod number per plant in a single environment of the RIL derived from BARC-8 and Garimpo was 74.29%, and the genotype × environment interaction effect reached a significant level (Vieira et al., 2006). The heritability of NFSP in different sites in a single environment of the four-way recombinant inbred line population derived from (Kenfeng 14× Kenfeng 15) × (Hei Nong 48× Kenfeng 19) was 21.25%–53.74% (Liu et al., 2019). In this study, the genotype × environment interaction variance of NFSP in five environments reached a significant level, and the heritability was 72.7%, which was similar to the traits related to pod number in the RIL populations in previous studies, indicating that NFSP not only had a stable genetic basis in multiple environments but also had specific genetic basis in different environments. In this project, a total of 89 QTNs were detected in five environments, and among all QTNs, five could be repeatedly detected in more than two environments (Table 4), indicating that these QTNs were multi-environment general QTNs, while the remaining 84 QTNs belonged to environment-specific QTNs.
4.2 Co-localization analysis of QTNs for NFSP in multiple genetic backgrounds
Among the 34 QTNs repeatedly identified in multiple environments and by methods in this study, 19 were co-located with genomic regions related to pod number identified in previous studies (Table 4). Specifically, AX-90322106, AX-90355916, AX-90437943, AX-90329712, and AX-90410394 were located in the study by Ning et al. (2018). AX-90497448, AX-90385665, AX-90380549, and AX-90514080 were co-located with QTLs identified by Liu et al. (2019). AX-90486841 was within the interval identified by Liu et al. (2011). AX-90314120 was within the interval identified. AX-90458599 and AX-90513557 were co-located with the intervals identified by Tischner et al. (2003). AX-90433162 was detected in the studies by Ning et al. (2018) and Vieira et al. (2006). AX-90305288 was detected in the studies by Sun et al. (2006) and Zhang et al. (2010). AX-90453898 was co-located with the results of Fang et al. (2017). AX-90326632 was repeatedly detected by Tischner et al. (2003) and Ning et al. (2018). AX-90487461 and AX-90454301 were located in the studies by Li et al. (2009) and Jeong et al. (2011). The remaining 15 QTNs were newly discovered in this study and require further research for validation.
4.3 Analysis of NFSP candidate genes in soybean
This study predicted a total of three genes related to NFSP in soybeans, namely, Glyma.13G105400, Glyma.04G063700, and Glyma.04G063100. Among them, the function annotation of the Glyma.13G105400 gene is a basic helix-loop-helix (bHLH) DNA-binding family protein. It activates DNA transcription factors and participates in the binding of specific DNA sequences, which may be related to seed meiosis. The function annotation of the Glyma.04G063100 gene is a protein kinase superfamily protein. The protein kinase superfamily is widely present in flowering plants and usually plays a regulatory role in metabolism and cell division. The function annotation of the Glyma.04G063700 gene is RING/FYVE/PHD zinc finger superfamily protein. In Arabidopsis thaliana, this gene shows negative regulation when expressed and is related to photoperiod, flowering time, or degree regulation. Based on the above analysis, it can be considered that Glyma.13G105400, Glyma.04G063700, and Glyma.04G063100 can be used as target genes for the next step in research. Their specific functions can be verified through experiments related to functional validation, contributing to breeding programs.
4.4 Studies on simulating breeding
In traditional breeding, it is based on the phenotypes of target traits to select parents and screen individuals of the hybrid combination. This entire breeding cycle often takes several years, and it is uncertain whether an ideal variety can be selected. Simulation breeding, in contrast, utilizes computer models and algorithms to predict the genotype values of the offspring from various genetic combinations based on the genotypes of molecular markers associated with the target traits and to simulate and analyze various environments and breeding schemes, thereby enabling the selection of hybrid combinations and breeding schemes (Li et al., 2025). Zhang et al. (2022) introduced the use of the Blib platform to handle various complex genetic effects and genetic models. You et al. (2022) and Wang et al. (2023) respectively conducted predictions on flaxseed and wheat hybrid combinations. This study applied the ISI module (Li et al., 2025) to simulate breeding schemes processed by the pedigree method and the mixed-selection method for single-cross combinations. Among all 455 parent combinations, 153 breeding schemes from 70 combinations were selected. Through these schemes, individuals with multiple NFSP genotype values in various environments could be screened. During the analysis, two points were considered. First, the molecular marker effect models should be constructed for each environment using all QTNs. For multi-environment experiments, due to the genotype × environment interaction effect, the genetic effect of each allele variant of QTNs varies in different environments. When the contribution to the phenotype is small, QTNs will not be detected. To evaluate the effects of all QTNs in different environments, molecular marker effect models should be constructed for each environment using all QTNs. Therefore, the first step in the simulation study of this research was to construct molecular marker effect models in five environments, which could explain 44.82% to 55.06% of the NFSP variation, also indicating the influence of the QTN × environment interaction effect on the contribution rate of the phenotype. Second, the selection of the optimal hybrid combination should be based on the distribution of the breeding values of the simulated offspring population. Breeding value is the sum of the effects of all allelic variations at the gene loci of an individual’s target trait and thus can be used as the basis for individual selection. In this study, since all individuals in the germplasm resource population were used as parents for the simulation study, the number of hybrid combinations was large, and the scale of the selected offspring population was also large. When organizing the simulation results, the frequency distribution of the breeding values of all selected offspring was first conducted, and then the selection range of the breeding values was determined based on the characteristics of the breeding trait and the scale of the breeding population, thereby screening excellent hybrid combinations. In this study, the frequency distribution of the offspring individuals selected by each breeding scheme in each environment was conducted, and then the individuals categorized into the two highest groups were selected as the hybrid combinations based on the requirements of the NFSP breeding trait and the scale of the breeding population.
5 Conclusion
In this study, a genome-wide association analysis was conducted on the number of four-seeded pods of a germplasm resource population comprising 455 soybean varieties under five environments. A total of 89 significant QTNs were identified, and three genes related to the formation of NFSP in soybeans, namely, Glyma.13G105400, Glyma.04G063700, and Glyma.04G063100, were identified. A molecular-assisted selection model containing 89 QTNs was constructed for each of the five environments, and a total of 153 breeding programs were selected. The results of this study lay the foundation for dissecting the genetic mechanism of soybean pod formation and for cultivating high-yielding varieties.
Statements
Data availability statement
The original contributions presented in the study are included in the article/Supplementary Material. Further inquiries can be directed to the corresponding authors.
Author contributions
MY: Funding acquisition, Investigation, Data curation, Writing – review & editing. XS: Software, Writing – review & editing, Data curation, Methodology. ZY: Writing – review & editing. HS: Writing – review & editing, Data curation. SD: Writing – review & editing, Investigation. JZ: Writing – review & editing, Data curation. BH: Supervision, Data curation, Writing – review & editing. W-XL: Writing – review & editing, Conceptualization, Project administration. HN: Conceptualization, Validation, Methodology, Data curation, Writing – original draft, Writing – review & editing, Formal Analysis, Resources. WL: Data curation, Writing – review & editing, Investigation.
Funding
The author(s) declare that financial support was received for the research and/or publication of this article. This study was supported by Longjiang Science and Technology Talent Spring Goose Support Program (Project Number: CYQN24063 to MY) and China Agriculture Research System of MOF and MARA (CARS-04 to MY).
Acknowledgments
All the authors sincerely thank professor Jiankang Wang from the Institute of Crop Sciences, Chinese Academy of Agricultural Sciences for his guidance on data analysis.
Conflict of interest
The authors declare that the research was conducted in the absence of any commercial or financial relationships that could be construed as a potential conflict of interest.
Generative AI statement
The author(s) declare that no Generative AI was used in the creation of this manuscript.
Publisher’s note
All claims expressed in this article are solely those of the authors and do not necessarily represent those of their affiliated organizations, or those of the publisher, the editors and the reviewers. Any product that may be evaluated in this article, or claim that may be made by its manufacturer, is not guaranteed or endorsed by the publisher.
Supplementary material
The Supplementary Material for this article can be found online at: https://www.frontiersin.org/articles/10.3389/fpls.2025.1614971/full#supplementary-material
References
1
CaoF. B.WeiR. R.XieJ. G.HouL. L.KangC. R.ZhaoT. Y.et al. (2023). Fine mapping and candidate gene analysis of proportion of four-seed pods by soybean CSSLs. Front. Plant Sci.13. doi: 10.3389/fpls.2022.1104022
2
ChenQ. S.ZhangZ. C.LiuC. Y.XinD. W.QiuH. M.ShanD. P.et al. (2007). QTL analysis of major agronomic traits in soybean. Agric. Sci. China6, 399–405. doi: 10.1016/S1671-2927(07)60062-5
3
DembinskaO.LalondeS.SainiH. S. (1992). Evidence against the regulation of grain set by spikelet abscisic acid levels in water-stressed wheat. Plant Physiol.100, 1599–1602. doi: 10.1104/pp.100.3.1599
4
FangT.BaiY.HuangW.YuanZ.LuanX.SunL. (2021). Identification of potential gene regulatory pathways affecting the ratio of four-seed pod in soybean. Front. Genet.12. doi: 10.3389/FGENE.2021.717770
5
FangC.LiW.LiG. (2013). Cloning of ln gene through combined approach of map-based cloning and association study in soybean. J. Genet. Genomics40, 93–96. doi: 10.1016/j.jgg.2013.01.002
6
FangC.MaY. M.WuS. W.LiuZ.WangZ.YangR.et al. (2017). Genome-wide association studies dissect the genetic networks underlying agronomical traits in soybean. Genome Biol.18, 161. doi: 10.1186/s13059-017-1289-9
7
HaoD. R.ChengH.YinZ. T.CuiS. Y.ZhangD.WangH.et al. (2012). Identification of single nucleotide polymorphisms and haplotypes associated with yield and yield components in soybean (Glycine max) landraces across multiple environments. Theor. Appl. Genet.124, 447–458. doi: 10.1007/s00122-011-1719-0
8
HuZ. B.ZhangD.ZhangG. Z.KanG. Z.HongD. L.YuD. Y. (2014). Association mapping of yield-related traits and SSR markers in wild soybean (Glycine soja Sieb. and Zucc.). Breed Sci.63, 441–449. doi: 10.1270/jsbbs.63.441
9
JeongN.MoonJ. K.KimH. S.KimC. G.JeongS. C. (2011). Fine genetic mapping of the genomic region controlling leaflet shape and number of seeds per pod in the soybean. Theor. Appl. Genet.122, 865–874. doi: 10.1007/s00122-010-1492-5
10
JeongN. N.SuhS. J.KimM. H.LeeS.MoonJ. K.KimH. S.et al. (2012). Ln is a key regulator of leaflet shape and number of seeds per pod in soybean [J. Plant Cell.24, 4807–4818. doi: 10.1105/tpc.112.104968
11
KurodaY.KagaA.TomookaN.YanoH.TakadaY.KatiS.et al. (2013). QTL affecting fitness of hybrids between wild and cultivated soybeans in experimental fields. Ecol. Evol.3, 2150–2168. doi: 10.1002/ece3.606
12
LiC.JiangH.ZhangW.QiuP.LiuC.LiW.et al. (2008). QTL analysis of seed and pod traits in soybean. Mol. Plant Breed. 6 (6), 1091–1100.
13
LiY. Y.LiuC. Y.WangN. N.ZhangZ. G.HouL. L.XinD. W.et al. (2021). Fine mapping of a QTL locus (QNFSP07-1) and analysis of candidate genes for four-seeded pods in soybean. Mol. Breed.41, 1–16. doi: 10.1007/s11032-021-01265-6
14
LiH. H.ZhangL. Y.GaoS.WangJ. K. (2025). Prediction by simulation in plant breeding. Crop J.13, 501–509. doi: 10.1016/j.cj.2024.12.018
15
LiM.ZhangY. W.XiangY.LiuM. H.ZhangY. M. (2022b). IIIVmrMLM: The R and C++ tools associated with 3VmrMLM, a comprehensive GWAS method for dissecting quantitative traits. Mol. Plant15, 1251–1253. doi: 10.1016/J.MOLP.2022.06.002
16
LiM.ZhangY. W.ZhangZ. C.XiangY.LiuM. H.ZhouY. H.et al. (2022a). A compressed variance component mixed model for detecting QTNs and QTN-by-environment and QTN-by-QTN interactions in genome-wide association studies. Mol. Plant15, 630–650. doi: 10.1016/J.MOLP.2022.02.012
17
LiX.ZhangK.SunX.HuangS.WangJ.YangC.et al. (2020). Detection of QTL and QTN and candidate genes for oil content in soybean using a combination of four-way-RIL and germplasm populations. Crop J.8, 802–811. doi: 10.1016/j.cj.2020.07.004
18
LiuF. L.AndersenM. N.JensenC. R. (2003). Loss of pod set caused by drought stress is associated with water status and ABA content of reproductive structures in soybean. Funct. Plant Biol.30, 271–280. doi: 10.1071/FP02185
19
LiuF. L.AndersenM. N.JensenC. R. (2004). Root signal controls pod growth in drought-stressed soybean during the critical, abortion-sensitive phase of pod development. Field Crops Res.85, 159–166. doi: 10.1016/S0378-4290(03)00164-3
20
LiuW. X.KimM. Y.VanK.LeeY.-H.LiH. L.LiuX. H.et al. (2011). QTL identification of yield-related traits and their association with flowering and maturity in soybean. J. Crop Sci. Biotech14, 65–70. doi: 10.1007/s12892-010-0115-7
21
LiuS. P.XueH.ZhangK. X.WangP.SunD. Q.LiW. B.et al. (2019). Mapping QTL affecting the vertical distribution and seed set of soybean [Glycine max (L.) Merr.] pods. Crop J.7, 694–706. doi: 10.1016/j.cj.2019.04.004
22
LiuZ. Z.YaoD.ZhangJ.LiZ. L.Ma.J.LiuS. Y.et al. (2015). Identification of genes associated with the increased number of four-seed pods in soybean (Glycine max L.) using transcriptome analysis. Genet. Mol. Res.14, 18895–18912. doi: 10.4238/2015.December.28.39
23
NingH. L.YuanJ. Q.DongQ. Z.LiW. X.XueH.WangY.et al. (2018). Identification of QTLs related to the vertical distribution and seed-set of pod number in soybean [Glycine max (L.) merri. PloS One13, e0195830. doi: 10.1371/journal.pone.0195830
24
PalomequeL.LiuL. J.LiW. B.HedgesB.CoberE. R.RajcanI.et al. (2009). QTL in mega-environments: II. Agronomic trait QTL co-localized with seed yield QTL detected in a population derived from a cross of high-yielding adapted x high-yielding exotic soybean lines. Theor. Appl. Genet.119, 429–436. doi: 10.1007/s00122-009-1048-8
25
PalomequeL.LiuL. J.LiW. B.HedgesB. R.CoberE. R.SmidM. P. (2010). Validation of mega-environment universal and specific QTL associated with seed yield and agronomic traits in soybeans. Theor. Appl. Genet.120, 997–1003. doi: 10.1007/s00122-009-1227-7
26
QiX. P.LiM. W.XieM.LiuX.NiM.ShaoG. H.et al. (2014). Identification of a novel salt tolerance gene in wild soybean by whole-genome sequencing. Nat. Commun.5, 4340. doi: 10.1038/ncomms5340
27
RaginB.RichardB.WillsheanaC.StellaK.KhalidM.Masum.A.et al. (2012). Genetic analysis of yield components in the PI 438489B by ‘Hamilton’ recombinant inbred line (RIL) population of soybean [Glycine max (L.) Merr. J. Ag Sci.4, 98–105. doi: 10.5539/jas.v4n9p98
28
RenW. L.WenY. J.DunwellJ. M.ZhangY. M. (2018). pKWmEB: integration of Kruskal–Wallis test with empirical Bayes under polygenic background control for multi-locus genome-wide association study. Heredity120, 208–218. doi: 10.1038/s41437-017-0007-4
29
SayamaT.TanabataT.SarutaM.YestsuyaT.AuaiT.KagaA.et al. (2017). Confirmation of the pleiotropic control of leaflet shape and number of seeds per pod by the Ln gene in induced soybean mutants. Breed. Sci67, 363–369. doi: 10.1270/jsbbs.16201
30
SetterT. L.FlanniganB. A. (2001). Water deficit inhibits cell division and expression of transcripts involved in cell proliferation and endoreduplication in maize endosperm. J. Exp. Botany52, 1401–1408. doi: 10.1093/jexbot/52.360.1401
31
ShimS.KimM. Y.Ha.J.LeeY. H.LeeS. H. (2017). Identification of QTLs for branching in soybean (Glycine max (L.) Merrill). Euphytica213, 213–225. doi: 10.1007/s10681-017-2016-z
32
SunD.LiW. B.ZhangZ. C.ChenQ. S.NingH. L.QiuL. J.et al. (2006). Quantitative trait loci analysis for the developmental behavior of Soybean (Glycine max L. Merr.). Theor. Appl. Genet.112, 665–673. doi: 10.1007/s00122-005-0169-y
33
TambaC. L.NiY. L.ZhangY. M. (2017). Iterative sure independence screening EM-bayesian LASSO algorithm for multi-locus genome-wide association studies. PloS Comput. Biol.13, e1005357. doi: 10.1371/journal.pcbi.1005357
34
TischnerT.AllphinL.ChaseK.OrfJ. H.LarkK. G. (2003). Genetics of seed abortion and reproductive traits in soybean. Crop Sci.43, 464–473. doi: 10.2135/cropsci2003.4640
35
VieiraA. J. D.OliveiraD. A.SoaresT. C. B.SchusterI.PiovesanN. D.MartínezC. A.et al. (2006). Use of the QTL approach to the study of soybean trait relationships in two populations of recombinant inbred lines at the F7 and F8 generations. Braz. J. Plant Physiol.18, 281–290. doi: 10.1590/S1677-04202006000200004
36
WangS. B.FengJ. Y.RenW. L.HuangB.ZhouL.WenY. J.et al. (2016). Improving power and accuracy of genome-wide association studies via a multilocus mixed linear model methodology. Sci. Rep.6, 19444. doi: 10.1038/srep19444
37
WangX. B.MaoW. W.WangY. F.LouH. Y.GuanP. F.ChenY. M.et al. (2023). Breeding design in wheat by combining the QTL information in a GWAS panel with a general genetic map and computer simulation. Crop J.11, 1816–1827. doi: 10.1016/J.CJ.2023.10.001
38
WenY. J.ZhangH.NiY. L.HuangB.ZhangJ.FengJ. Y.et al. (2018). Methodological implementation of mixed linear models in multi-locus genome-wide association studies. Brief Bioinform.19, 700–712. doi: 10.1093/bib/bbw145
39
YangS.LiL.Zhang.J.GengY.GuoF.WangJ. J.et al. (2017). Transcriptome and differential expression profiling analysis of the mechanism of Ca2+Regulation in peanut (Arachis hypogaea) pod development. Front. Plant Sci28. doi: 10.3389/fpls.2017.01609
40
YangS.WangJ.TangZ.GuoF.ZhangJ. L.MengJ. J.et al. (2020). Transcriptome of peanut kernel and shell reveals the mechanism of calcium on peanut pod development. Sci. Rep.10, 1–13. doi: 10.1038/s41598-020-72893-9
41
YouF. M.ZhengC.BartaulaS.KhanN.WangJ.CloutierS. (2022). “Genomic cross prediction for linseed improvement,” in Accelerated Plant Breeding, Volume 4: Oil Crops. Eds. GosalS. S.WaniS. H. (Springer International Publishing, Cham, Switzerland).
42
ZhangD.ChengH.WangH.ZhangH. Y.LiuC. Y.YuD. Y. (2010). Identification of genomic regions determining flower and pod numbers development in soybean (Glycine max L). J. Genet. Genom.37, 545–556. doi: 10.1016/S1673-8527(09)60074-6
43
ZhangJ.FengJ. Y.NiY. L.WenY. J.NiuY.TambaC. L.et al. (2017). pLARmEB: integration of least angle regression with empirical Bayes for multilocus genome-wide association studies. Heredity118, 517–524. doi: 10.1038/hdy.2017.8
44
ZhangZ. Q.FuD.SunZ. H.JuC. F.MiaoC. C.WangZ. Q.et al. (2021). Tonoplast-associated calcium signaling regulates manganese homeostasis in Arabidopsis. Mol. Plant14, 805–819. doi: 10.1016/J.MOLP.2021.03.003
45
ZhangH.HaoD. R.HélderM. S.YinZ. T.HuZ. B.ZhangG. Z.et al. (2015). Genetic dissection of the relationship between plant architecture and yield component traits in soybean (Glycine max) by association analysis across multiple environments. Pla Breed.135, 564–572. doi: 10.1111/pbr.12305
46
ZhangL. Y.LiH. H.WangJ. K. (2022). Blib is a multi-module simulation platform for genetics studies and intelligent breeding. Commun. Biol.5, 1167. doi: 10.1038/S42003-022-04151-9
47
ZhengH. Y.HouL. L.XieJ. G.CaoF. B.WeiR. R.YangM. L.et al. (2022). Construction of chromosome segment substitution lines and inheritance of seed-pod characteristics in wild soybean. Front. Plant Sci.13. doi: 10.3389/fpls.2022.869455
Summary
Keywords
soybean, number of four-seed pods, quantitative trait nucleotide, candidate genes, breeding schemes
Citation
Yuan M, Sun X, Yu Z, Sun H, Dong S, Zhang J, Hu B, Li W-X, Ning H and Lu W (2025) QTN mapping, gene prediction, and simulation breeding of four-seed pod numbers in soybean. Front. Plant Sci. 16:1614971. doi: 10.3389/fpls.2025.1614971
Received
20 April 2025
Accepted
19 June 2025
Published
25 July 2025
Volume
16 - 2025
Edited by
Frédéric Marsolais, Agriculture and Agri-Food Canada (AAFC), Canada
Reviewed by
Richard Oteng-Frimpong, CSIR-Savanna Agricultural Research Institute, Ghana
Bahram Samanfar, Agriculture and Agri-Food Canada (AAFC), Canada
Updates
Copyright
© 2025 Yuan, Sun, Yu, Sun, Dong, Zhang, Hu, Li, Ning and Lu.
This is an open-access article distributed under the terms of the Creative Commons Attribution License (CC BY). The use, distribution or reproduction in other forums is permitted, provided the original author(s) and the copyright owner(s) are credited and that the original publication in this journal is cited, in accordance with accepted academic practice. No use, distribution or reproduction is permitted which does not comply with these terms.
*Correspondence: Wen-Xia Li, liwenxia@neau.edu.cn; Hailong Ning, ninghailong@neau.edu.cn; Wencheng Lu, luwencheng@haas.cn
†These authors have contributed equally to this work
Disclaimer
All claims expressed in this article are solely those of the authors and do not necessarily represent those of their affiliated organizations, or those of the publisher, the editors and the reviewers. Any product that may be evaluated in this article or claim that may be made by its manufacturer is not guaranteed or endorsed by the publisher.