 Shaojun Ling1,2,3*†
 Qiongqiong Lin1,2,3†
 Biaofeng Zhou1,2,3
 Yiye Liang1,2,3Wenji Luo1,2,3Zhao Shen1,2,3Jingshu Wang1,2,3Jingwei Niu1,2,3Liangjing Qiao1,2,3
 Baosheng Wang1,2,3
 Hui Liu1,2,3*
- 1Guangdong Provincial Key Laboratory of Applied Botany, South China Botanical Garden, Chinese Academy of Sciences, Guangzhou, China
- 2State Key Laboratory of Plant Diversity and Specialty Crops, South China Botanical Garden, Chinese Academy of Sciences, Guangzhou, China
- 3South China National Botanical Garden, Guangzhou, China
The demand for plant-based, low-calorie natural sweeteners is increasing. Four dihydrochalcones (DHCs), namely phloretin, phlorizin, trilobatin, and sieboldin, have been identified in the leaves of Lithocarpus litseifolius. These compounds serve as natural flavor sweeteners with potential health-promoting effects. However, the biosynthetic pathways of these DHCs are not yet fully understood. In this study, the content of four DHCs was quantified using LC-MS/MS across five developmental stages (S1–S5) of L. litseifolius leaves. Our results revealed an accumulation pattern where DHC levels peaked at stage S3, followed by a sharp decrease at stages S4 and S5, with the exception of sieboldin, which maintained high levels. We elucidated the complete biosynthetic pathway of DHCs, involving 82 candidate enzyme-encoding genes, including five PALs, three C4Hs, 13 4CLs, 18 CDBRs, five CHSs, 14 P2’GTs, 12 P4’GTs, nine F3’Hs, and three CH3Hs, and found that either tandem duplication or proximal duplication may have contributed to the expansion of key genes such as CDBR, P2’GT, and P4’GT. Furthermore, we reconstructed 11 regulatory networks of DHCs, two modules were positively related to the contents of phloretin, phlorizin, and trilobatin (r = 0.54–0.69, P < 0.05), while two other modules were associated with sieboldin accumulation (r = 0.59–0.74, P < 0.05). We also identified MYB, WD40-like, WRKY, and bHLH transcription factors as potential regulators in the biosynthesis of four DHCs. We found two biosynthetic gene clusters of DHCs, including nine and four genes encoding CDBR and P2’GT, respectively. Syntenic and phylogenetic analyses revealed that these two BGCs may have experienced independent evolutionary processes within the Fagaceae family. Our study provides a theoretical foundation for the resource development and utilization of sweet tea. It also paves the way for the development of high-quality natural sweeteners.
1 Introduction
Obesity, a global public-health issue driven by sedentary lifestyles and over-consumption of calories, is a primary risk factor for diabetes. In response, the food and beverage industry has promoted non-sugar sweeteners like aspartame, sucralose, and saccharin to reduce calorie intake (Kroger et al., 2006). However, the long-term negative effects of artificial sweeteners on human health were well documented (Brown et al., 2010; Castro-Muñoz et al., 2022; Ray and Palui, 2025), thus fueling the demand for natural alternatives (Wang and Lin, 2025). Recent research has focused on the commercialization of plant-derived sweeteners, such as stevia and monk fruit, which are considered healthier and more sustainable alternatives (Kumar et al., 2021; Chowdhury et al., 2022; Debras et al., 2022). Yet their limitations, such as the bitter aftertaste of stevia and the supply constraints of monk fruit, highlight the need for novel compounds. Dihydrochalcones (DHCs), a flavonoid subclass, present a viable solution (Dwivedi, 2022). Approximately 256 DHCs have been identified across 30 plant families (Rivière, 2016), and compounds like phloretin and phlorizin have been shown to modulate obesity-related biological pathways (Ehrenkranz et al., 2005; Dugé de Bernonville et al., 2010; Szliszka et al., 2010). Notably, trilobatin and phlorizin are 300 times sweeter than sucrose, serving as stable sweeteners and bitterness blockers (Tomás-Barberán and Clifford, 2000; Wang et al., 2020; Lou et al., 2023). DHCs combine sweet taste with obesity-related pathway regulation, making them ideal natural sweeteners for the food industry.
DHCs were first isolated from Malus species, though their concentrations are extremely low (Gosch et al., 2010; Gutierrez et al., 2018). However, the content of DHCs in tender leaves of Lithocarpus litseifolius is several times higher than that in apple peels (Qin and Liu, 2003; Wang et al., 2022; Zheng et al., 2025). Compared with stevia and monk fruit, Lithocarpus litseifolius can grow new leaves quickly after picking and pruning, allowing large-scale acquisition of leaves, thus showing obvious resource advantages. Moreover, its sweetness has a slow onset and a slow dissipation, with extremely stable properties (Tan et al., 2022). This makes L. litseifolius leaves an inexpensive source for dihydrochalcone production. Lithocarpus litseifolius, commonly known as sweet tea, is a species in the genus Lithocarpus of the family Fagaceae, which is an evergreen tree widely distributed in southern China (Cheng et al., 2016). Historically, L. litseifolius has been used to prepare medicinal drinks, and has been developed into sweet tea due to its high content of DHCs (Shang et al., 2022). This beverage is non-toxic, high in sweetness, and low in calories, making it an effective option for diabetes prevention and management (Qin and Liu, 2003; Lou et al., 2023; Wang et al., 2022). However, the biosynthesis mechanisms of DHCs in sweet tea remain partially understood. Identifying key candidate genes and regulatory pathways is crucial for enabling metabolic engineering to enhance DHC production, thus accelerating their application in medicine, food, and healthcare products.
So far, the biosynthetic pathways of phloretin, phlorizin, and trilobatin have been proposed (Wang et al., 2022; Lou et al., 2023). Specifically, glycosyltransferases related to the synthesis of phlorizin and trilobatin in sweet tea have been identified (Zhang et al., 2023), providing a fundamental understanding of the complete metabolic pathway of DHCs. DHCs are considered essential precursors and intermediates in the flavonoid synthesis pathway (Gosch et al., 2009; Barreca et al., 2014), yet the factors driving the metabolic diversity of DHCs remain unclear. Gene duplication, especially in enzymes like acyltransferases, methyltransferases, and glycosyltransferases, drives metabolite diversification (Leong and Last, 2017; Louveau and Osbourn, 2019; Hansen et al., 2021). Additionally, the biosynthesis gene clusters (BGCs) serve as synergistic factors in metabolic diversification (Liu et al., 2020; Zhou and Liu, 2022; Wang et al., 2024), and the discovery of BGCs for plant metabolites has opened new avenues for rapidly obtaining the biosynthetic pathways of target products (Ji et al., 2024; Zhu et al., 2024). Notably, while recent genomic studies have shed light on DHCs pathways (Lou et al., 2023; Zhang et al., 2023), critical gaps still persist: (1) the transcriptional regulatory networks governing phlorizin/trilobatin synthesis remain unmapped; (2) the biosynthetic pathway of sieboldin, a key bitterness modulator, remains uncharacterized; and (3) genomic mining of BGCs and their possible evolutionary dynamics and functional diversification across Lithocarpus species remain unresolved.
In this study, we determined the content of four DHCs during the development of tender leaves of sweet tea using LC-MS/MS. After that, we integrated genomic, metabolomic, and transcriptomic data to elucidate the complete biosynthetic pathway of DHCs, identifying candidate genes and key transcription factors (TFs). Furthermore, we conducted genome mining to identify duplicated genes and potential BGCs. The inter-species syntenic analysis and phylogenetic reconstruction within the Fagaceae family, shed light on the organization and evolution of candidate genes in BGCs.
2 Materials and methods
2.1 Plant material and sampling
A healthy sweet tea tree located in the South China National Botanical Garden was selected for transcriptomic and metabolomic analysis. The genome of this tree has been assembled and annotated (Liu et al., 2023), providing crucial genomic resources for this study. Leaves at five distinct developmental stages (S1–S5, ranging from leaf bud to mature leaf; Figure 1) were collected at approximately 10-day intervals, with the first sampling conducted on February 3, 2023, for transcriptomic and metabolomic profiling.
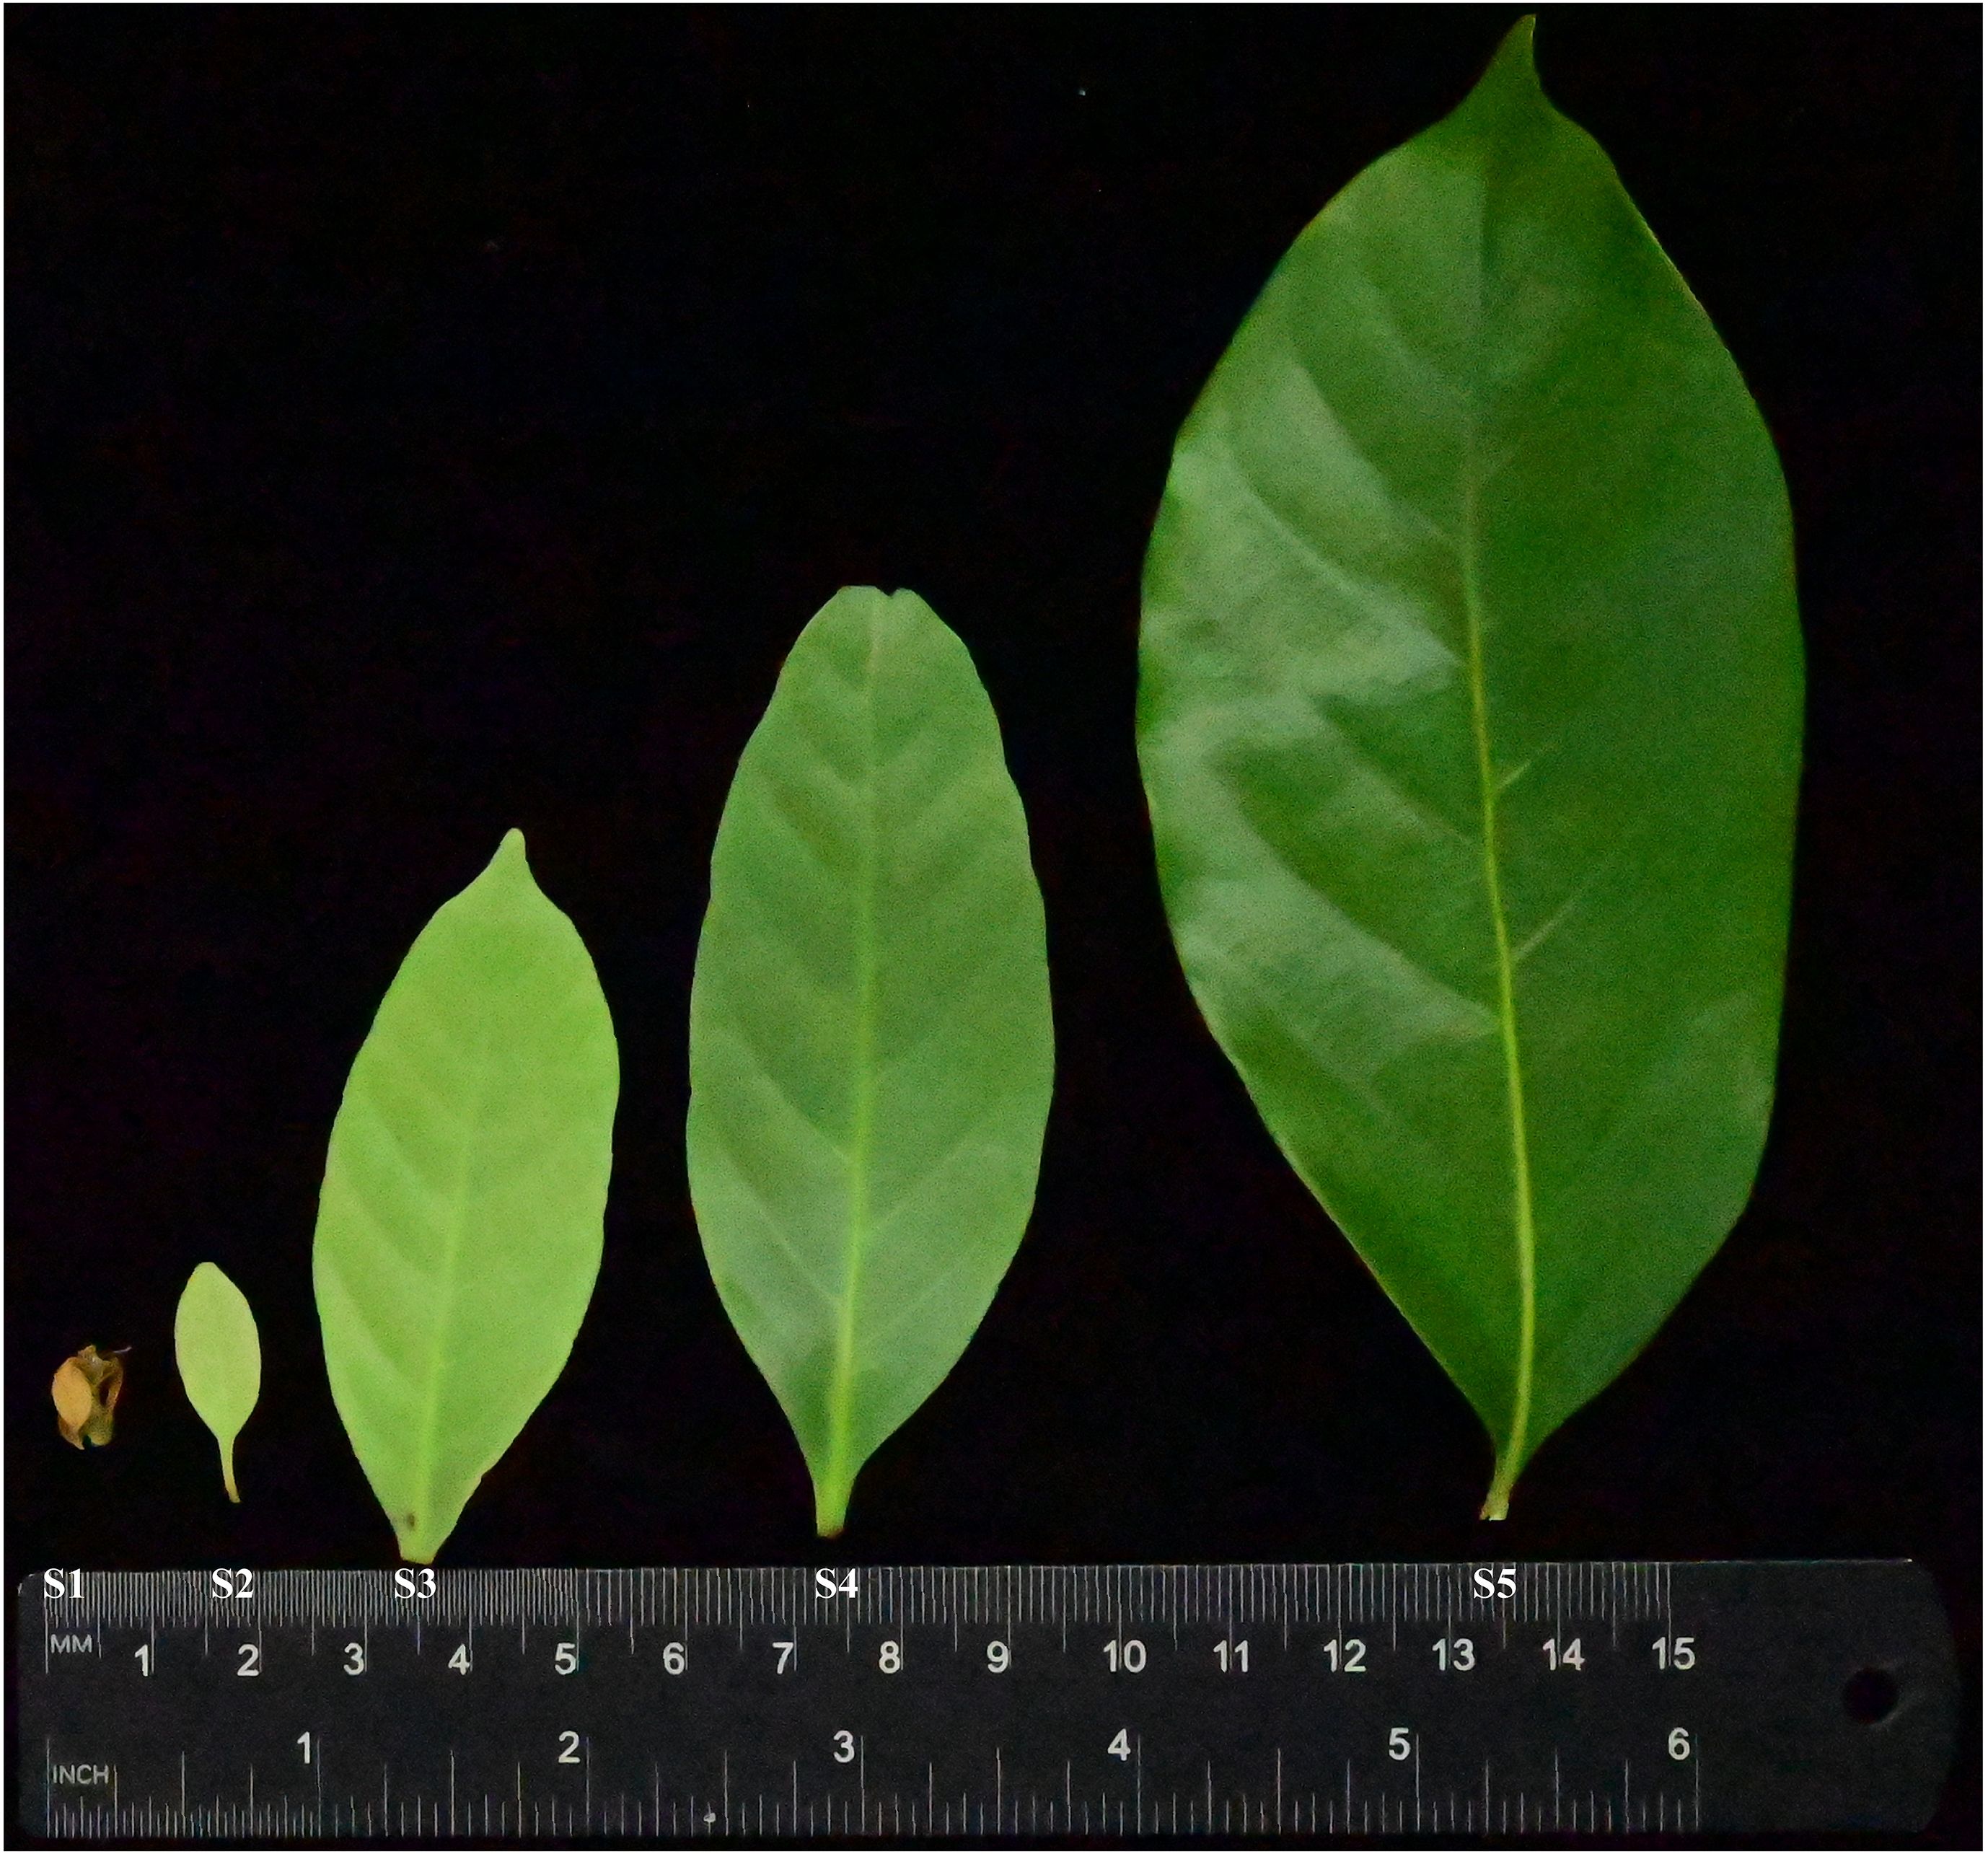
Figure 1. Leaf development stages (S1–S5) of sweet tea. S1 was described as newly-emerged juvenile leaves on February 03, 2023. S2–S5 were described as tender leaves collected at approximately 10-day intervals.
2.2 Gene expression and metabolite profiling
Gene expression and metabolite patterns were investigated in leaves at five stages (S1–S5), with each stage including three biological replicates (Figure 1).
Transcriptomes were sequenced on the Illumina NovaSeq 6000 platform, generating approximately 90 Gb of 150 bp paired-end reads. High-quality reads were obtained by removing adapter sequences and filtering low-quality reads using Trimmomatic v0.40 (Bolger et al., 2014). To quantify gene expression levels, the clean reads were mapped to the sweet tea genome using HISAT2 v2.2.1 (Kim et al., 2019), and the counts for mapped reads were normalized by transcripts per million (TPM) using StringTie v2.2.1 (Pertea et al., 2015).
Quasi-targeted metabolomics was performed to analyze leaf metabolites. Briefly, leaves were subjected to liquid chromatography tandem mass spectrometry (LC-MS/MS), and multiple reaction monitoring (MRM) was applied to identify and quantify the metabolites. Metabolite quantification was conducted using daughter ions (Q3), while metabolite identification was carried out using parent ions (Q1), Q3, retention time (RT), declustering potential (DP), and collision energy (CE). The identified metabolites were annotated using Kyoto Encyclopedia of Genes and Genomes (KEGG, http://www.genome.jp/kegg/) and LIPID MAPS (http://www.lipidmaps.org/) databases. Tukey’s Honestly Significant Difference (HSD) test was performed to evaluate the statistical significance of content variations among samples. Pearson correlation between the gene expression level and the content of DHC metabolites was calculated using the cor function in R program.
2.3 Identification of candidate DHC biosynthesis genes
The complete DHC biosynthetic pathway involves nine well-characterized enzymes (Gosch et al., 2009; Gutierrez et al., 2018; Wang et al., 2022; Yahyaa et al., 2016), including phenylalanine ammonia-lyase (PAL), cinnamate 4-hydroxylase (C4H), 4-coumarate-CoA ligase (4CL), hydroxycinnamoyl-CoA double bond reductase (CDBR), chalcone synthase (CHS), phlorizin 2’-O-glycosyltransferase (P2’GT), phlorizin 4’-O-glycosyltransferase (P4’GT), flavonoid 3’-hydroxylase (F3’H), and chalone-3-hydroxylase (CH3H). To identify the DHC biosynthesis genes in sweet tea, we performed homologous alignment using BLASTP v2.13.0+ with the following settings: E-value < 1e-10, identity > 50%, and coverage > 85%, comparing the reference protein sequences of the above nine key enzymes obtained from UniProt (https://uniprot.org/) with the potential protein sequences of sweet tea.
2.4 Identification of duplicated genes
To characterize candidate genes involved in DHC biosynthesis, duplicated genes in sweet tea and 11 Fagaceae species were identified using “DupGen_finder-unique.pl” implemented in the DupGen_finder pipeline (Qiao et al., 2019), with Nelumbo nucifera (Li et al., 2020) serving as the outgroup. The identified duplicated genes were divided into five non-redundant categories, depending on their suspected origin: whole-genome duplication (WGD), tandem duplication (TD), proximal duplication (PD), transposed duplication (TRD), and dispersed duplication (DSD).
2.5 Weighted gene co-expression network analysis
To identify co-expression networks associated with DHCs biosynthesis, genes were grouped into modules with strongly covarying patterns across the five developmental stages of leaves using WGCNA v1.72-1 (Langfelder and Horvath, 2008), based on gene expression data with TPM > 0.5 in all samples. The modules were identified using the automatic network construction and module detection function (blockwiseModules implemented in WGCNA), with the following parameters: corType = “pearson’’, TOMType = “unsigned’’, minModuleSize = 200, mergeCutHeight = 0.15, deepSplit = 2, and maxBlockSize = 15,000. Pearson correlation between the eigengene values of modules and the content of DHC metabolites was calculated using the cor function in R program. The modules of the co-expression network were visualized using Cytoscape v3.10.0 (Shannon et al., 2003).
2.6 Biosynthetic gene clusters prediction and synteny analyses
Potential biosynthetic gene clusters (BGCs) associated with candidate genes involved in DHCs biosynthesis were predicted using plantiSMASH v2.0.0-beta (Kautsar et al., 2017, 2018). To analyze the local synteny of gene-pairs in potential BGCs, we generated microsynteny plots via the ‘synteny’ function in LAST (Kiełbasa et al., 2011). Whole genome synteny analysis between sweet tea and 11 Fagaceae species was performed using JCVI v1.2.7 (Tang et al., 2008).
2.7 Phylogenetic analyses
To investigate the conservation and evolution dynamics of predicted BGCs involved in DHC biosynthesis within the Fagaceae family, we constructed the phylogenetic relationship of sweet tea and 11 other Fagaceae species. First, a total of 3,498 single-copy orthologous genes from 12 species were identified using OrthoFinder v2.5.4 (Emms and Kelly, 2019). These genes were aligned using MAFFT v7.505 (Katoh and Standley, 2013), followed by the removal of gap positions using trimAl v1.4.rev15 (Capella-Gutiérrez et al., 2009). A maximum likelihood (ML) tree was constructed based on concatenated alignment using IQ-TREE v2.0.5 (Nguyen et al., 2015). We estimated the divergence time of the 12 Fagaceae species using MCMCTree in the PAML package v4.9j (Yang, 2007). Specifically, the split time of genus Fagus and other Fagaceae species at 82–81 million years ago (Ma; Grímsson et al., 2016), and the divergence time of Castanopsis and Castanea at 53–52 Ma was included to constrain the age of nodes (Wilf et al., 2019).
3 Results
3.1 Variation in DHC content during leaf development
The relative metabolic contents of four DHCs (phloretin, phlorizin, trilobatin, and sieboldin) were measured in leaves of sweet tea at five developmental stages (S1-S5; Figure 1). The concentration of DHCs varied significantly across the five stages of leaf development. Specifically, leaves at stage S3, approximately 20 days after leaf bud flush, displayed the highest DHC content. The concentration of sieboldin remained consistently high throughout the period from stage S2 to stage S5, while the concentration of the other DHCs declined sharply after stage S3 (Figure 2A).
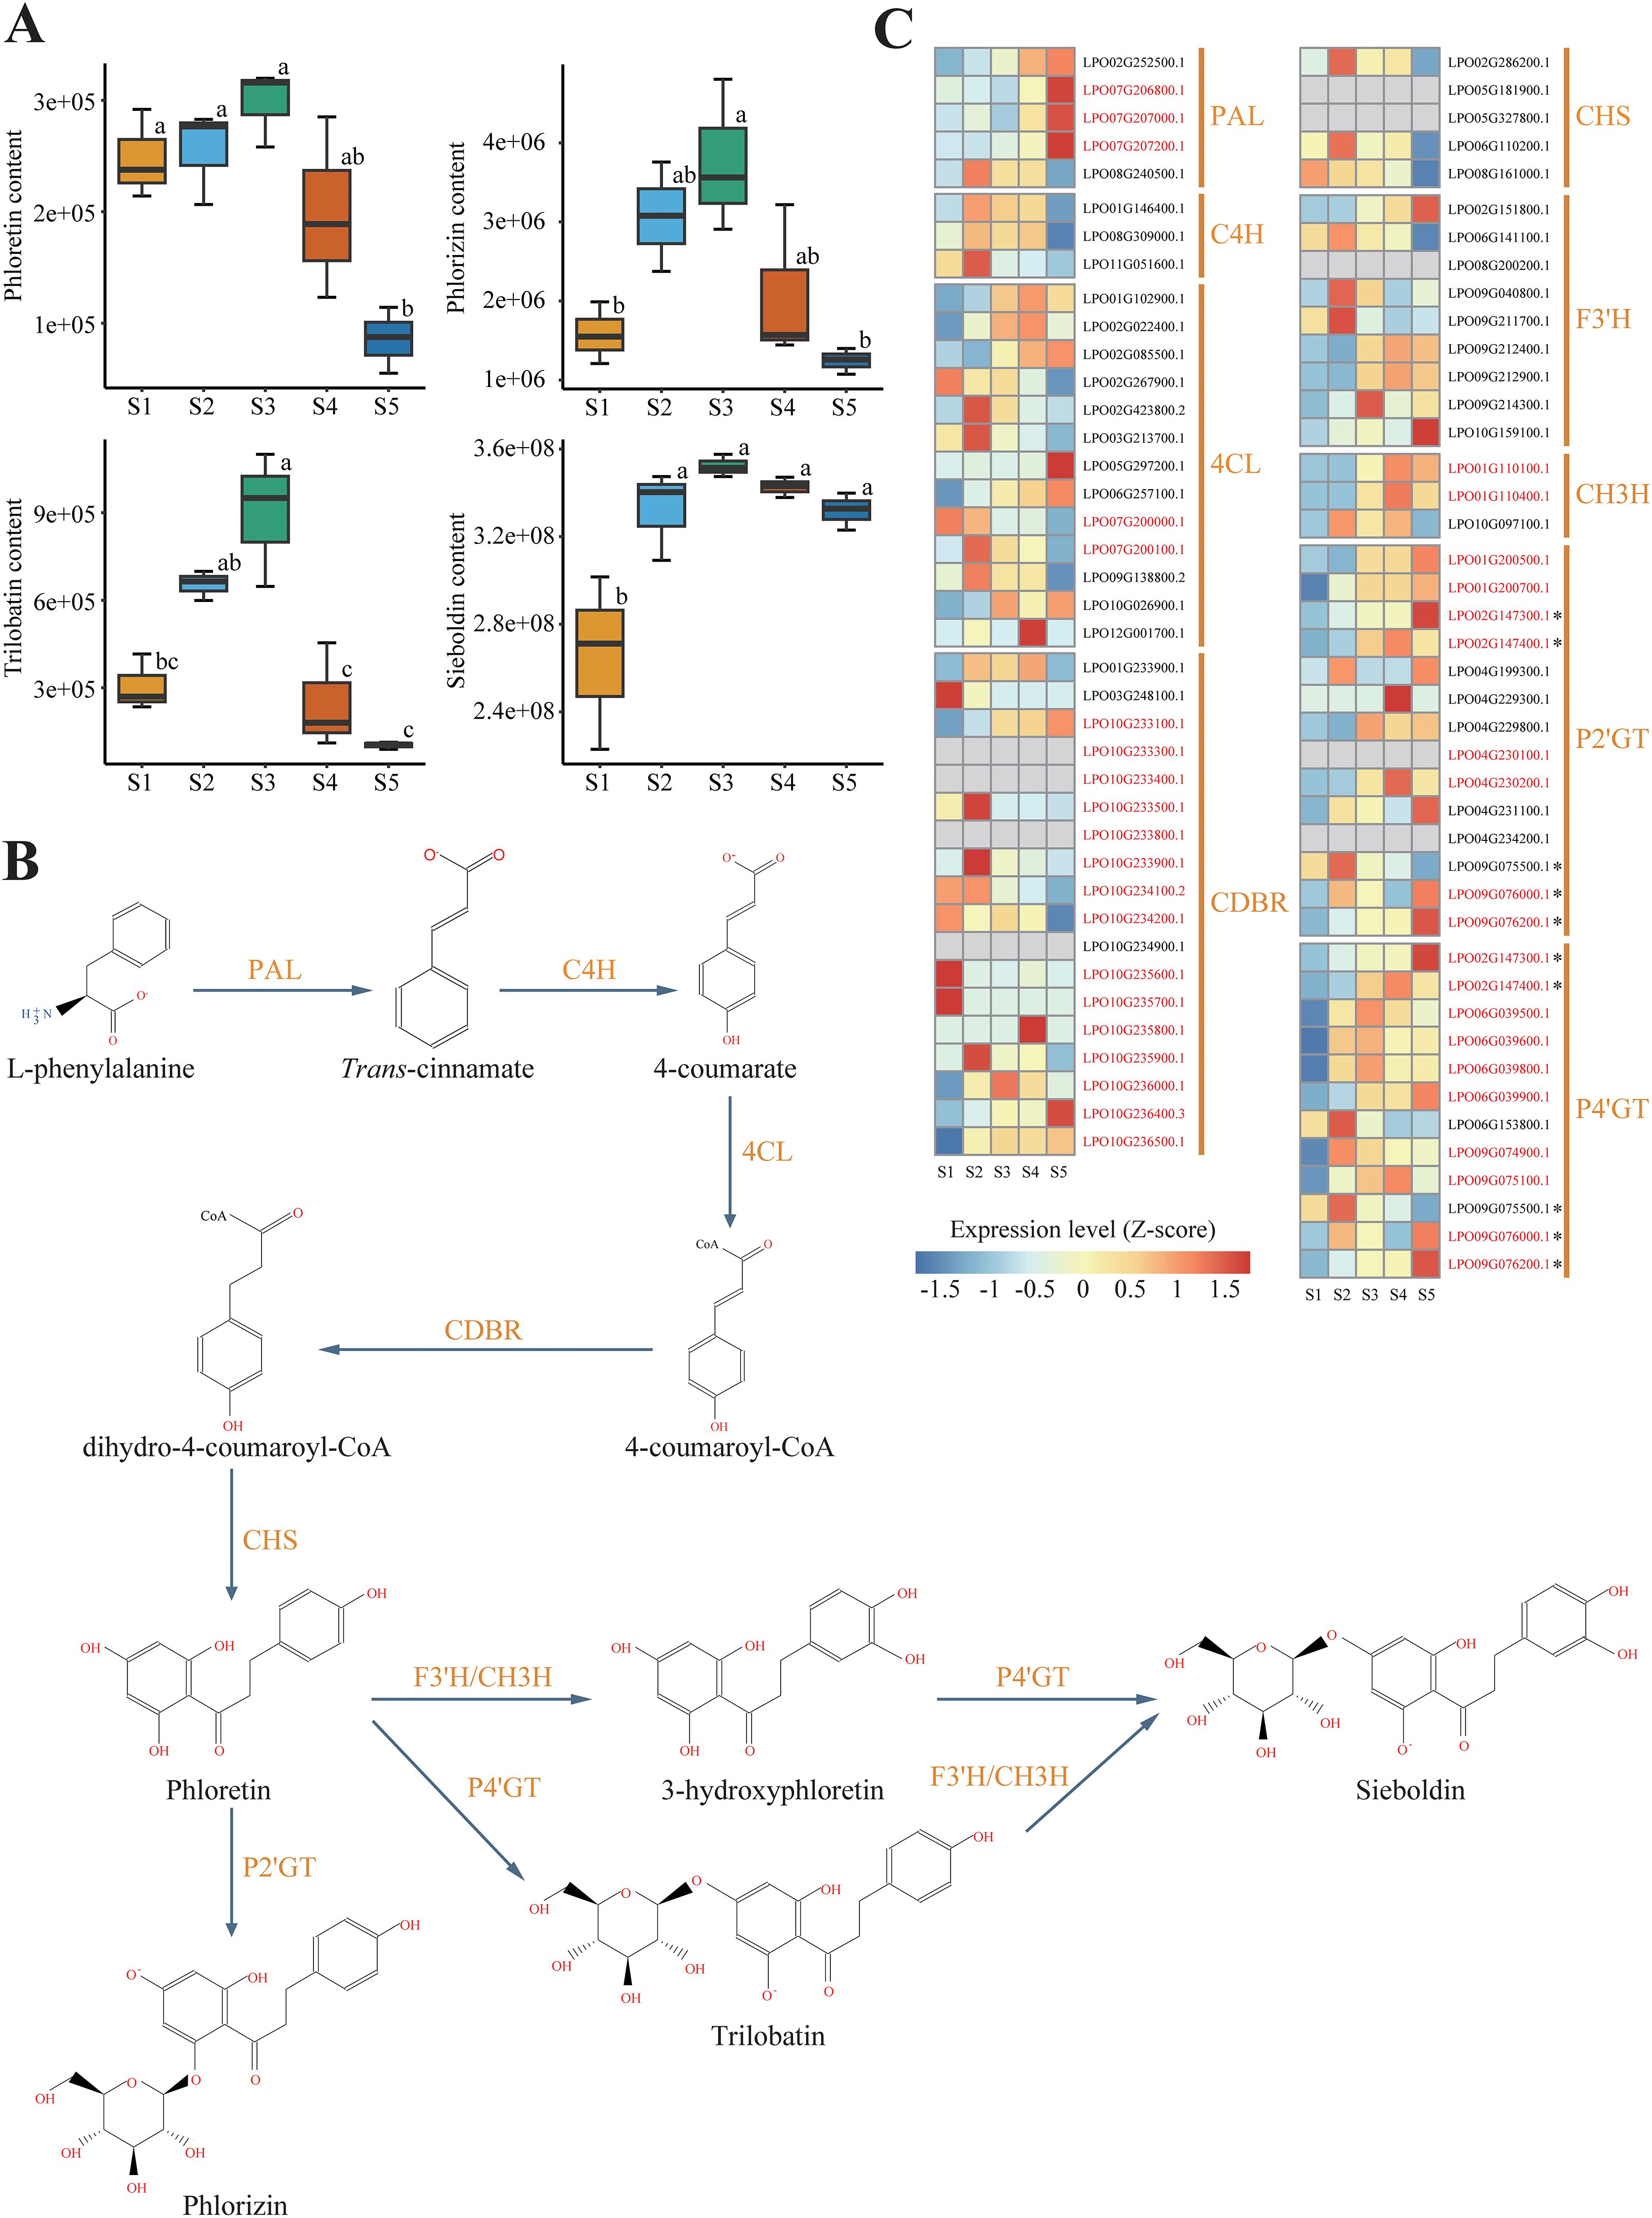
Figure 2. Biosynthesis of Dihydrochalcone (DHC) in sweet tea. (A) Boxplot analysis of the contents of DHCs, including phloretin, phlorizin, trilobatin, and sieboldin, in leaves at different developmental stages. Different letters denote statistically significant differences (P < 0.05; Tukey’s HSD test). (B) The biosynthetic pathway of DHC in sweet tea. PAL, phenylalanine ammonia-lyase; C4H, cinnamate 4-hydroxylase; 4CL, 4-coumarate-CoA ligase; CDBR, hydroxycinnamoyl-CoA double bond reductase; CHS, chalcone synthase; P2’GT, phlorizin 2’-O-glycosyltransferase; P4’GT, phlorizin 4’-O-glycosyltransferase; F3’H, flavonoid 3’-hydroxylase; CH3H, chalone-3-hydroxylase. (C) Heatmap presenting the expression levels of genes encoding DHC biosynthesis enzyme in leaves at five different developmental stages. Gray boxes denote genes that show no expression at any of the developmental stages. Genes highlighted in red indicate those derived from tandem duplication (TD) or proximal duplication (PD). The asterisk represents five genes encoding P2’GT or P4’GT, which cannot be assigned to a specific one.
3.2 Candidate genes in DHCs biosynthesis
We reconstructed the complete biosynthetic pathway of DHCs based on the high-quality genome of sweet tea, and measured the expression levels of candidate enzyme-encoding genes involved in the pathway (Figures 2B, C). We identified 82 genes potentially participating in DHCs biosynthesis of sweet tea, including five PALs, three C4Hs, 13 4CLs, 18 CDBRs, five CHSs, 14 P2’GTs, 12 P4’GTs, nine F3’Hs, and three CH3Hs (Table 1). Based on the gene expression levels associated with DHCs biosynthesis enzymes, we noted that several key genes showed high expression during the synthesis of four DHCs, including two PALs, two C4Hs, 10 4CLs, eight CDBRs, three CHSs, three F3’Hs, three CH3Hs, one P2’GT, and five P4’GTs (Supplementary Figure S1). For instance, the high expression levels of three CHS genes (LPO02G286200.1, LPO06G110200.1, and LPO08G161000.1) in stage S2 were positively related to higher concentrations of phloretin biosynthesis (r = 0.66–0.89, P < 0.05; Supplementary Figure S1). For phlorizin biosynthesis, one P2’GT gene (LPO09G075500.1) was highly expressed in stage S2 (r = 0.50, P < 0.05; Supplementary Figure S1).
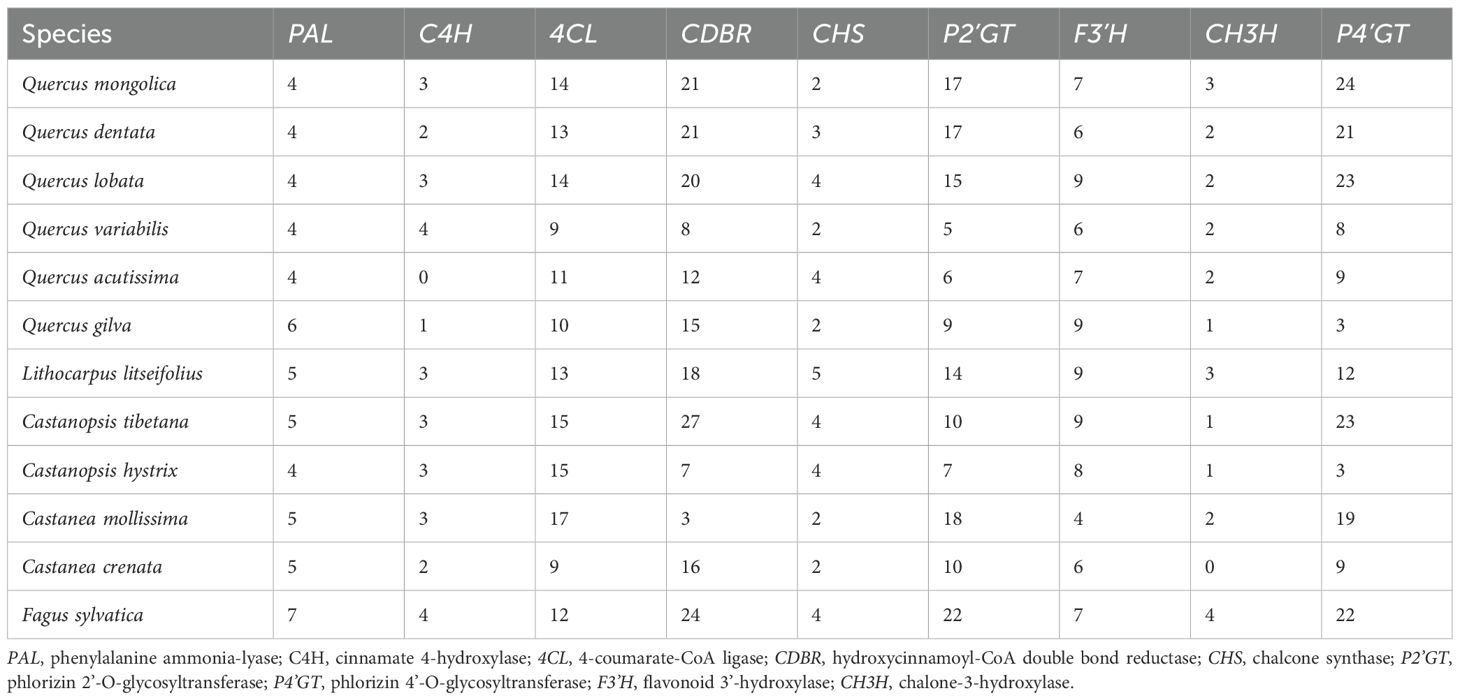
Table 1. Number of enzyme-coding genes in dihydrochalcone (DHC) biosynthesis of sweet tea.
The number of genes identified in each category enzyme-encoding gene within sweet tea closely resembled that of other Fagaceae species (Table 1). Moreover, five categories of duplicated genes detected in sweet tea exhibited strong similarity to their counterparts in other Fagaceae plants (Supplementary Figure S2). TD or PD increased the copy number of genes involved in DHC biosynthesis of sweet tea, specifically those encoding CDBR, P2’GT, and P4’GT enzymes (Figure 2C). Five genes encoding P2’GT or P4’GT could not be clearly assigned to a specific type. Four of these genes were derived from TD (LPO02G147300.1 and LPO02G147400.1) or PD (LPO09G076000.1 and LPO09G076200.1). In addition, the expression patterns of these four TD- or PD-derived genes were different from each other, which may indicate the functional divergence after gene duplication (Figure 2C).
3.3 Co-expression network and TFs involved in DHCs biosynthesis
To obtain insights into the regulation of DHCs biosynthesis, we constructed a gene co-expression network. A total of 11 modules, each containing 370–7,493 genes, were identified in the co-expression network (Figure 3A). Among the 11 modules, the magenta- and black-coded modules were positively correlated with the contents of phloretin, phlorizin, and trilobatin (r = 0.54–0.69, P < 0.05), while the green- and brown-coded modules were positively correlated with sieboldin content (r = 0.59–0.74, P < 0.05; Figure 3A). The magenta- and black-coded modules contained eight core genes in DHCs biosynthesis including one PAL (LPO08G240500.1), two C4Hs (LPO08G309000.1 and LPO01G146400.1), two CDBRs (LPO10G236000.1 and LPO01G233900.1), one 4CL (LPO07G200100.1), one CHS (LPO02G286200.1), one CH3H (LPO10G097100.1) (Figures 3B, C), whereas the green- and brown-coded modules comprised five core DHC biosynthesis genes including one 4CL (LPO02G022400.1), one P2’GT/P4’GT (LPO02G147400.1), and three P4’GTs (LPO06G039500.1, LPO09G075100.1, and LPO02G147400.1) (Figures 3D, E).
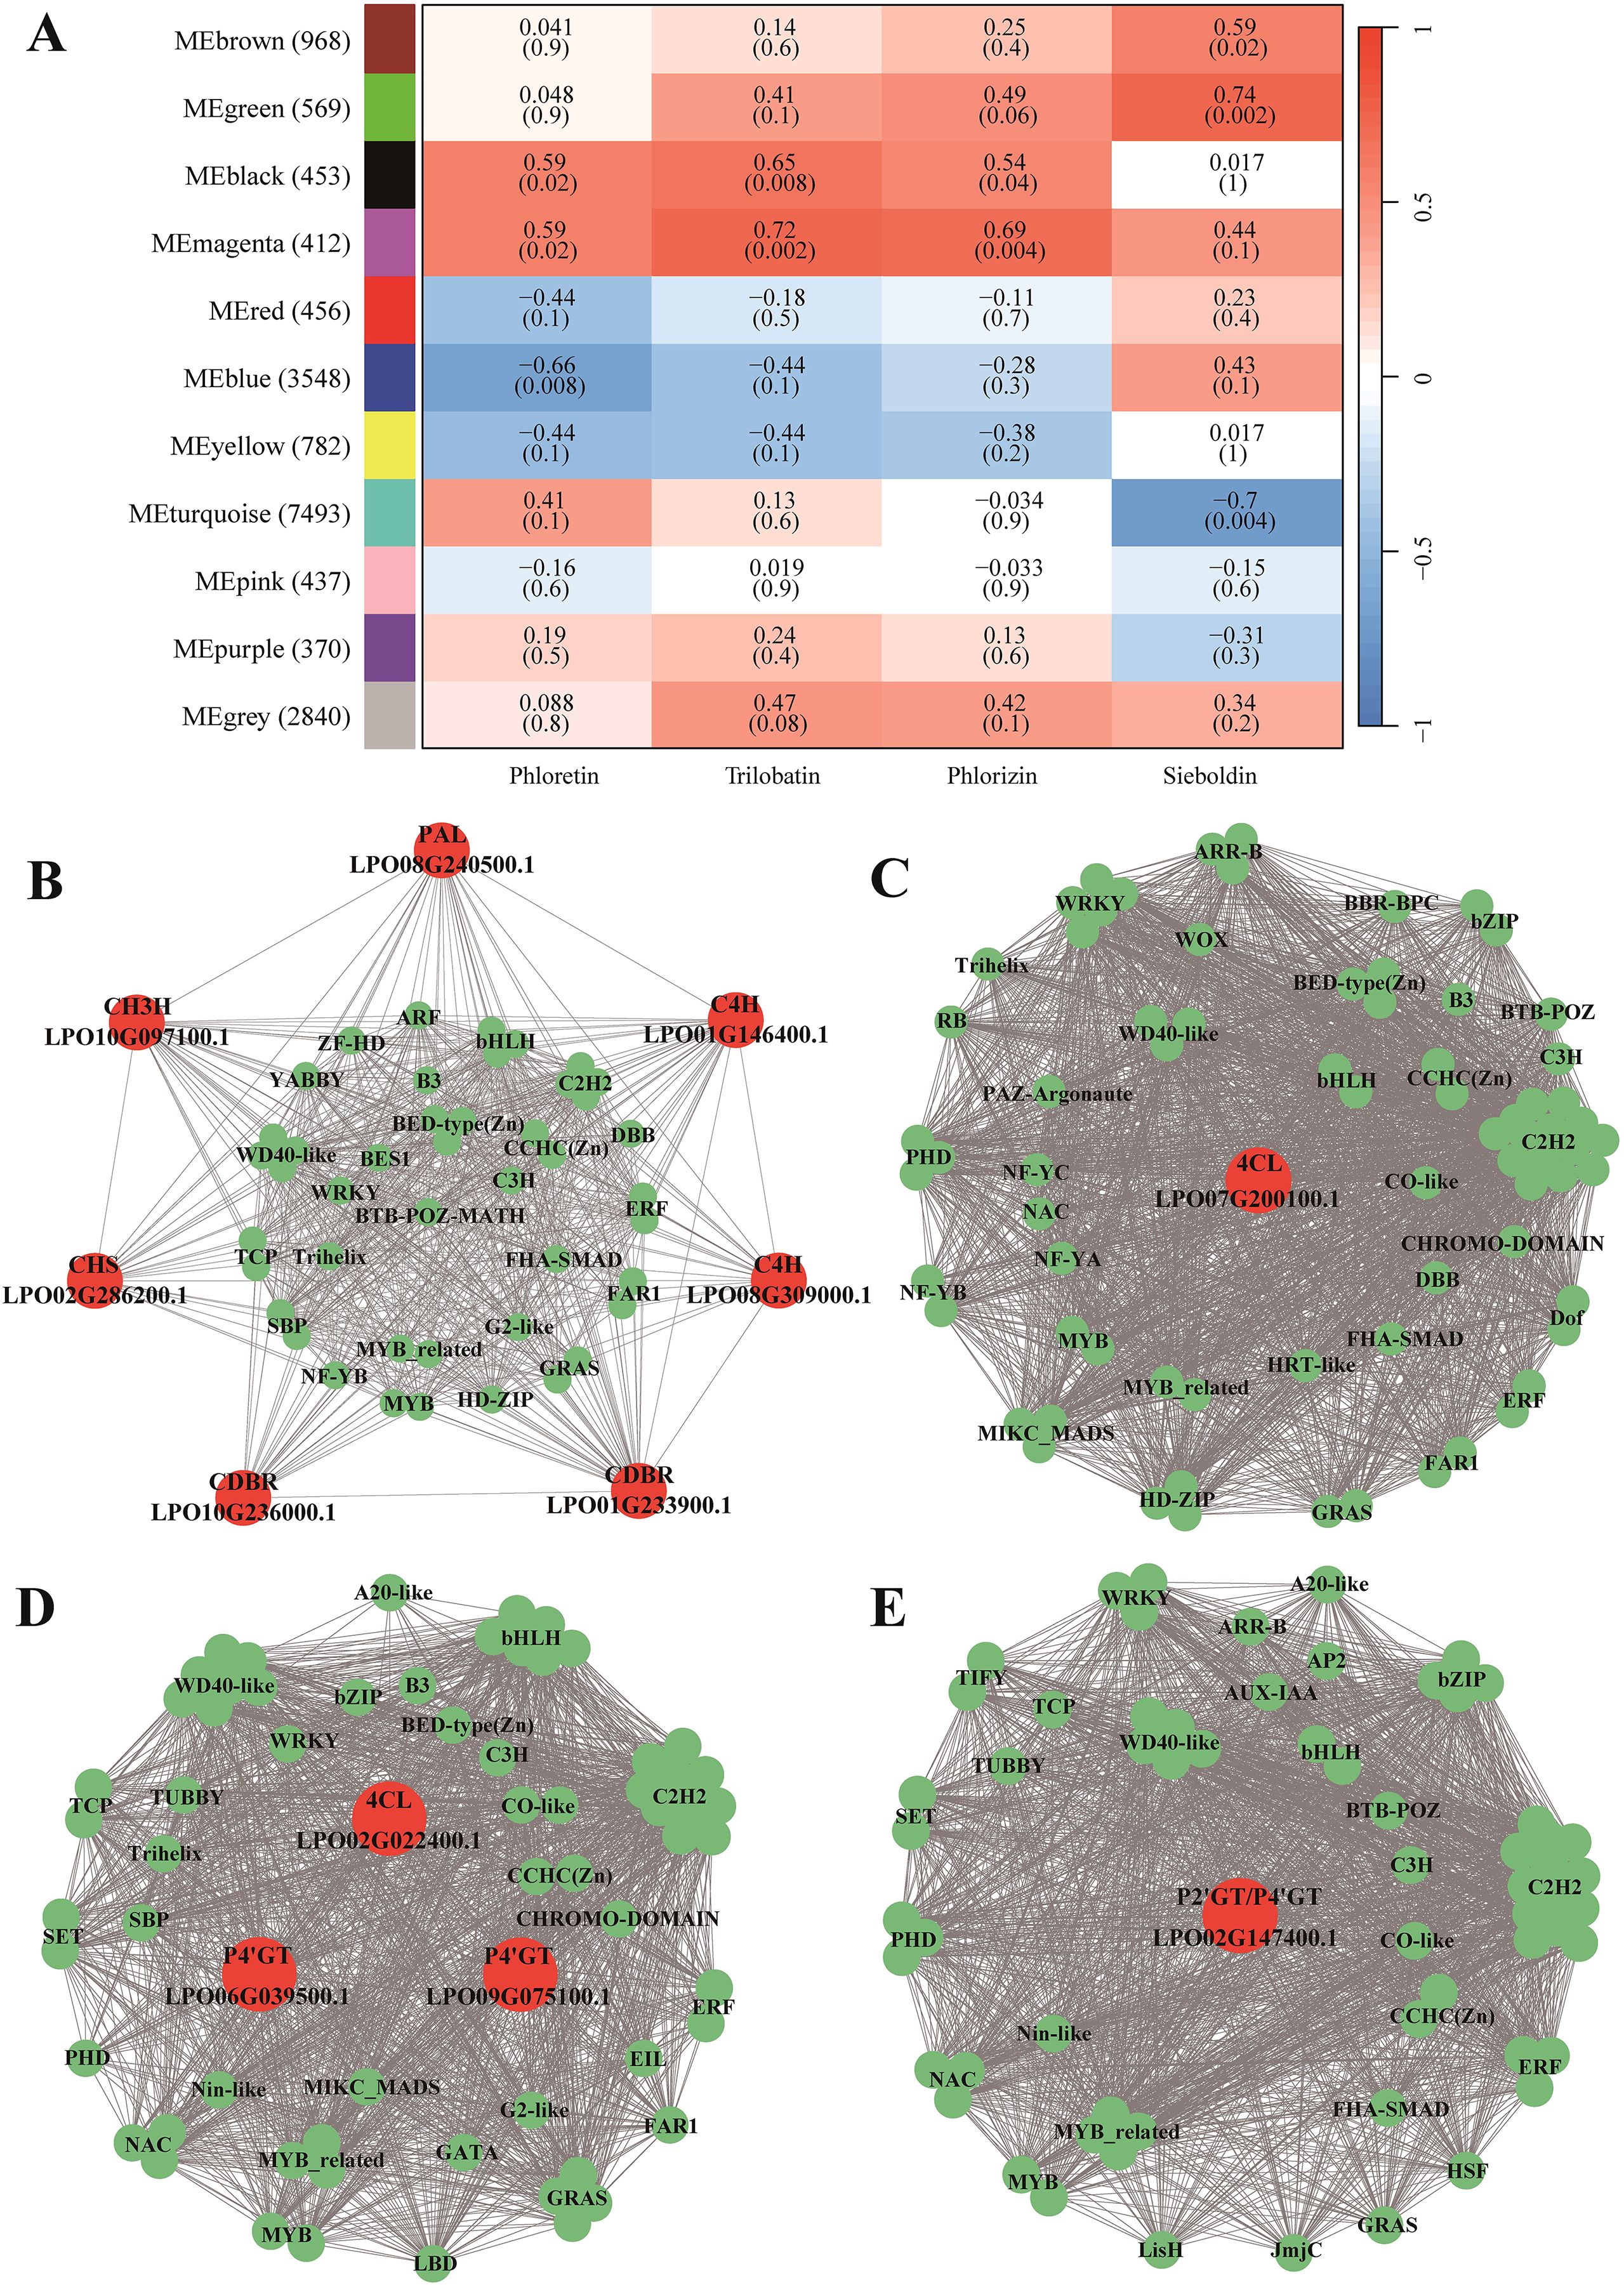
Figure 3. Transcriptional regulatory network governing DHC biosynthesis in sweet tea. (A) Correlations between the modules of the co-expression regulatory network and DHC metabolites. (B–E) Interactions between the candidate genes in DHC biosynthesis and transcription factors (TFs) within magenta (B), black (C), green (D), and brown (E) modules. Red and green circles represent candidate genes and TFs in DHC biosynthesis, respectively.
To identify transcription factors (TFs) involved in the biosynthesis pathway of DHCs, we selected those TFs that exhibited direct interactions with the candidate genes in the network modules. Specifically, we focused on TFs represented as the first-order neighbor nodes within the modules (Figures 3B–E). In the magenta-coded module, we found a total of 44 TFs belonging to 26 families involved in the regulation of seven genes, including one PAL, two C4Hs, two CDBRs, one CHS, and one CH3H. In the black-coded module, 73 TFs from 26 families were implicated in the regulation of a single gene, 4CL. In the green-coded module, 63 TFs from 30 families participated in regulating two genes, one 4CL and one P4’GT. In the brown-coded module, 63 TFs from 28 families were involved in the regulation of either P2’GT or P4’GT (LPO02G147400.1) (Supplementary Table S1).
3.4 Putative biosynthesis gene clusters involved in DHCs biosynthesis
The BGC-detecting tool plantiSMASH was used to identify potential BGCs involved in DHCs biosynthesis. A total of 61 putative BGCs were identified in the sweet tea genome, including eight BGCs that comprise 19 genes involved in the biosynthesis of DHCs. Notably, six of these eight BGCs contain only a single gene (Supplementary Table S2). Among the identified clusters, two BGCs (BGC1 and BGC2) were predicted to contain more than three genes associated with DHC biosynthesis. The BGC1 cluster, located on chromosome 10, consists of 21 genes, including 12 that encode dehydrogenase and nine undefined genes. Of the 12 alcohol-dehydrogenase-encoding genes, nine are CDBR genes, which are critical for DHC biosynthesis (Figure 4A). This cluster is most likely to be involved in essential metabolic processes relevant to DHC synthesis (Supplementary Table S2). The BGC2 cluster, located on chromosome 4, is thought to be involved in the synthesis of saccharide-terpene compounds (Supplementary Table S2). It contains 15 genes, with eight encoding glycosyltransferases and seven encoding other types of proteins. Significantly, four of the eight glycosyltransferase-encoding genes are P2’GT genes in DHCs biosynthesis (Figure 4A). Moreover, the nine CDBRs and four P2’GTs are unevenly distributed across these two BGCs. They are not arranged contiguously, but are instead each associated with one of the respective BGCs (Figure 4A).
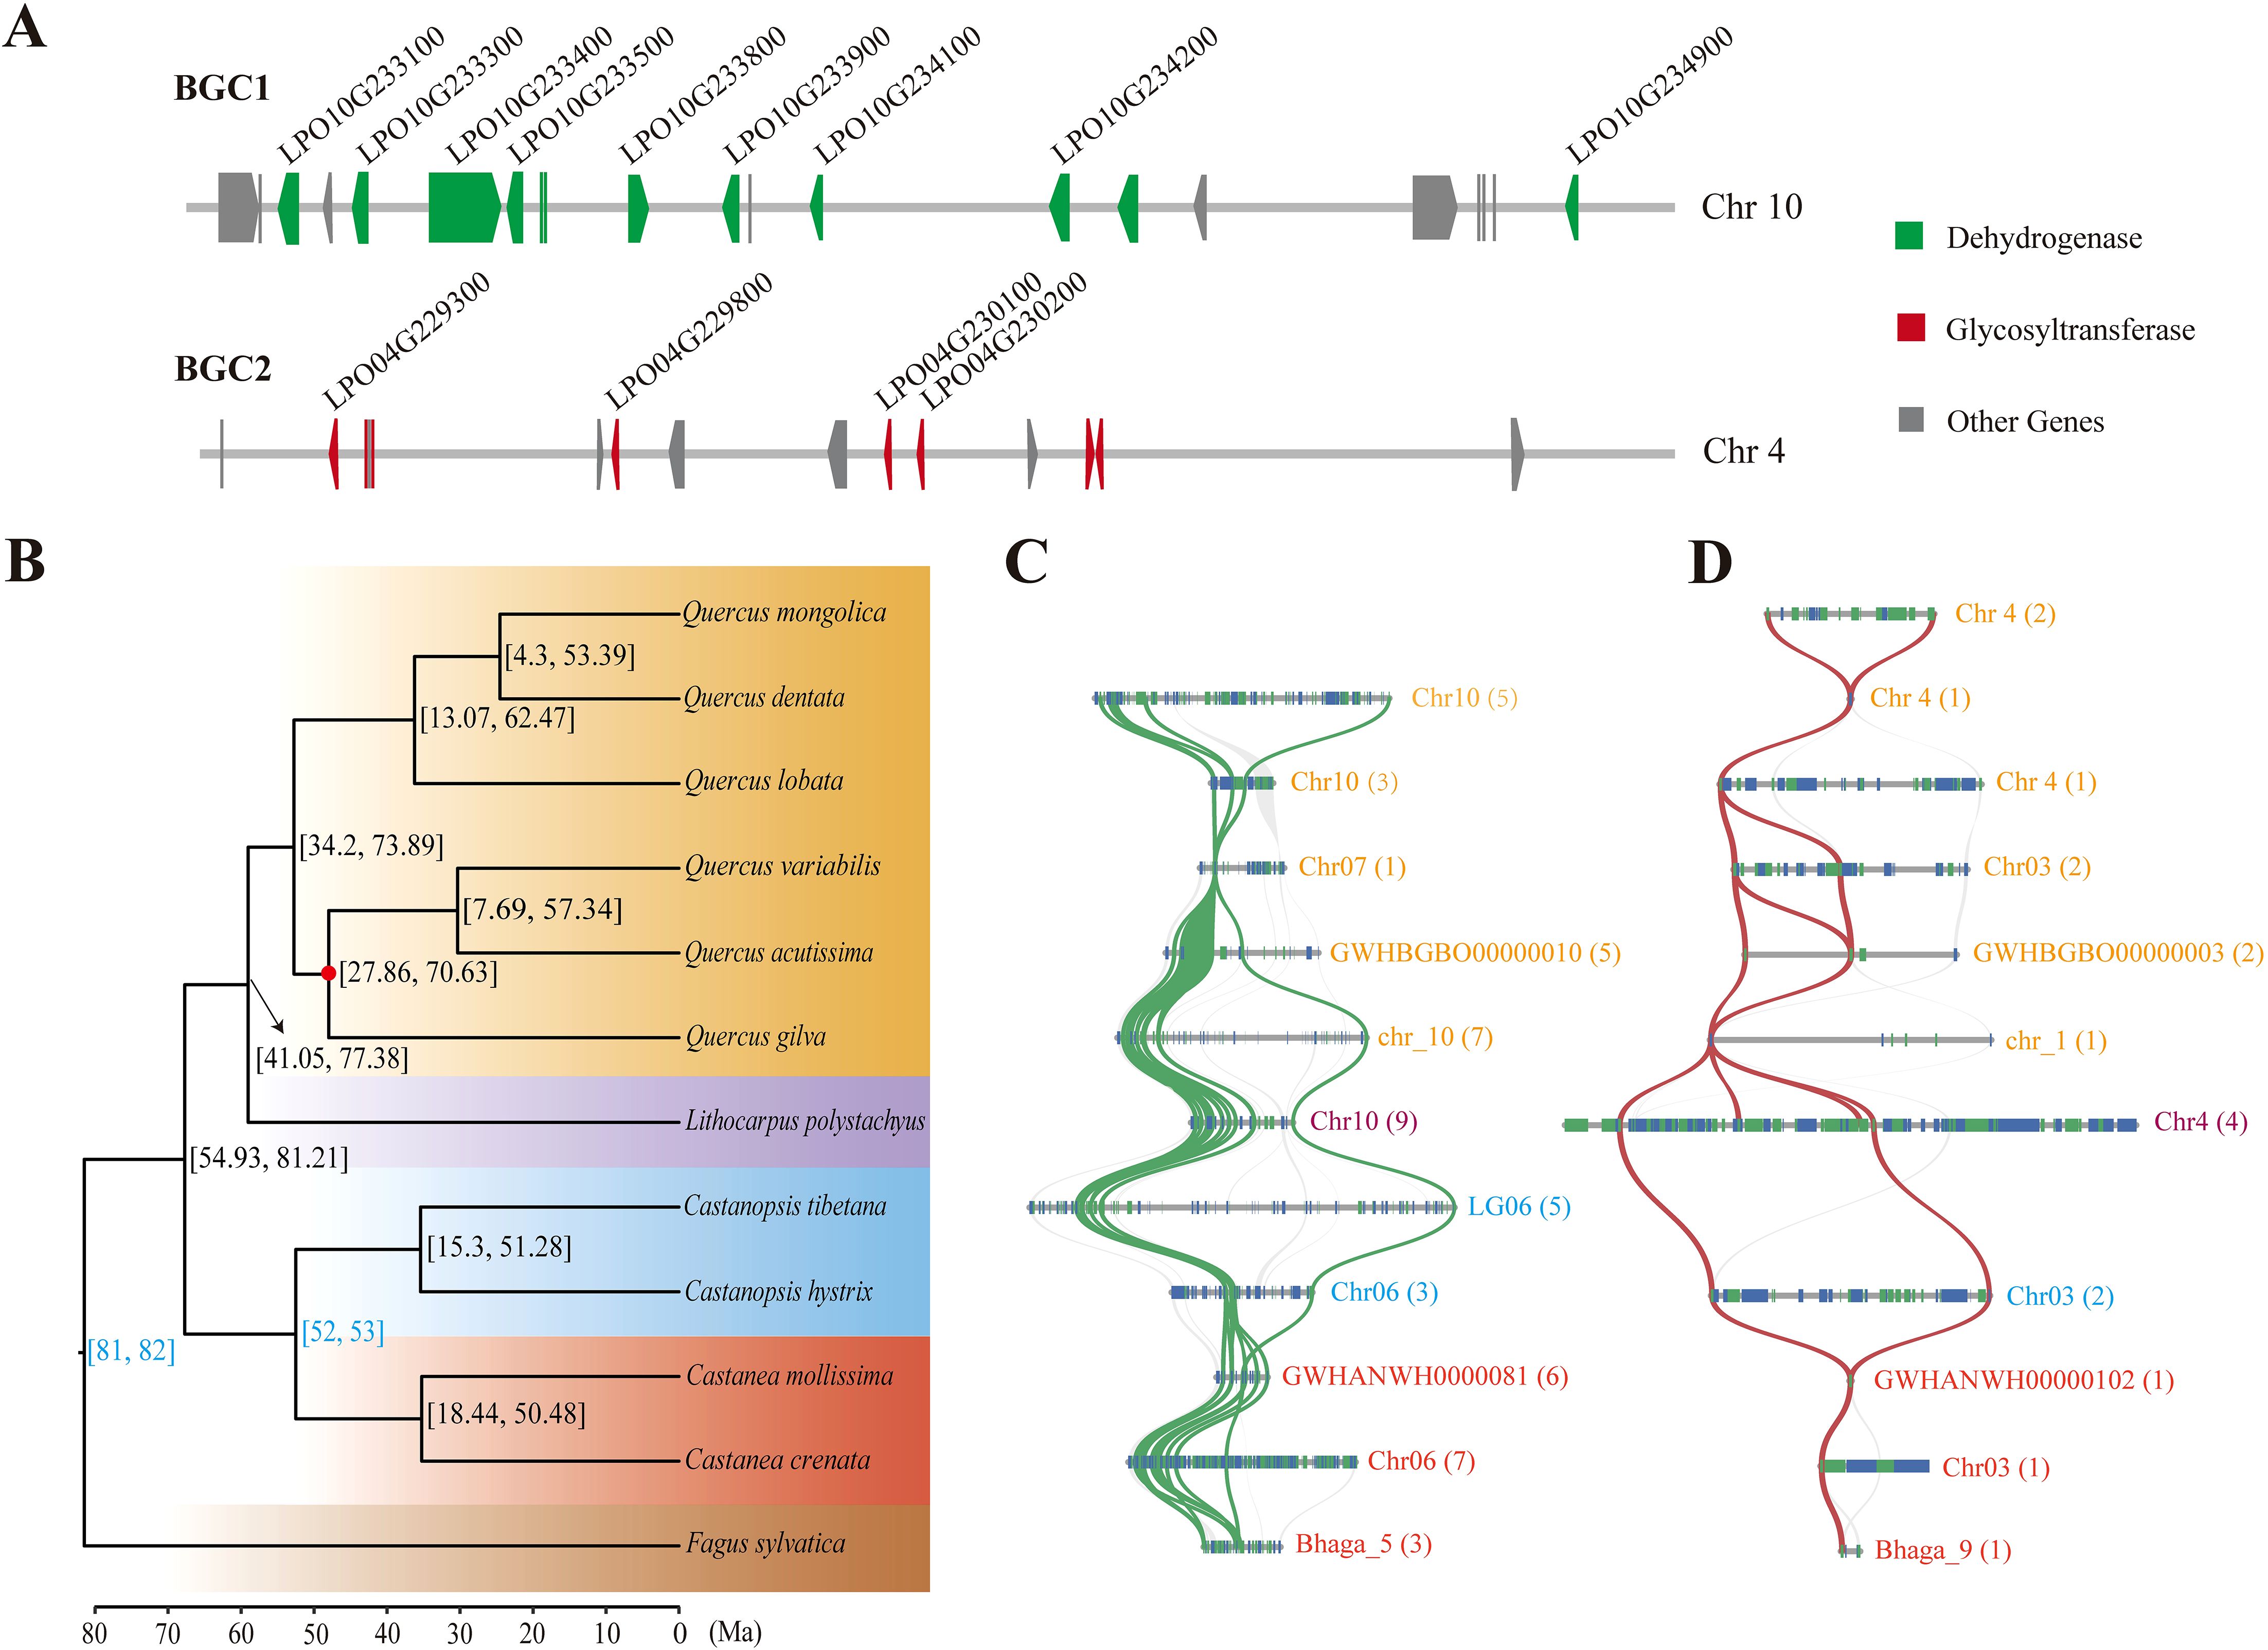
Figure 4. Phylogenomic evolution of Fagaceae species and evolution of the two biosynthesis gene clusters (BGCs). (A) BGC1 and BGC2, two biosynthetic gene clusters in the sweet tea genome, including the CDBR and P2’GT genes respectively. Each dark gray box represents a gene locus, the green and dark red boxes represent genes encoding dehydrogenase and glycosyltransferase respectively, and the candidate genes of CDBR and P2’GT in DHCs biosynthesis were shown in black words. The arrow of box represents the encoding direction of the gene. (B) Phylogeny of sweet tea and 11 other Fagaceae species. The numbers in the square brackets show the 95% confidence intervals of the divergence time. Two fossil calibrations are shown in blue. The red dot at the branch node indicates support lower than 100%. The background color represents different genera of Fagaceae. (C) The syntenic genome regions for BGC1 of sweet tea within Fagaceae. (D) The syntenic genome regions for BGC2 of sweet tea within Fagaceae. Each blue and green box represents the encoding direction of a gene locus. Syntenic gene pairs of CDBR and P2’GT were linked by green and red ribbons respectively. The color of pseudochromosome name for each Fagaceae species corresponds to the background color of phylogenomic tree, and the number of syntenic genes of other Fagaceae with sweet tea BGC1 and BGC2 was shown in brackets.
3.5 Phylogenetic relationship and synteny of two BGCs across Fagaceae species
The phylogenetic analysis revealed that sweet tea has the closest relationship with the genus Quercus, diverging from Quercus at ~59 Ma, with a 95% highest posterior density (HPD) interval of 41.05−77.38 Ma (Figure 4B). Syntenic patterns exhibiting a 1:1 correspondence were observed between sweet tea and 11 other Fagaceae species (Supplementary Figure S3). Two BGCs show conserved synteny across various Fagaceae species. However, Quercus mongolica lacks genes syntenic to BGC1, while Castanopsis tibetana lacks genes syntenic to BGC2 (Figures 4C, D). At the genomic loci harboring syntenic genes of BGC1 in Q. dentata and Q. variabilis, uncharacterized BGCs are present (Supplementary Figure S4). In contrast, these BGCs are absent in the corresponding genomic regions of other species. Furthermore, the number of syntenic genes identified in other Fagaceae species is lower than the counts of CDBR and P2’GT genes present within the two BGCs of sweet tea. In particular, only one or two syntenic genes of BGC2 were found in other Fagaceae species, suggesting a potential reduction in the genetic content related to DHC biosynthesis in these species (Figures 4C, D).
4 Discussion
4.1 Accumulation patterns of DHCs in sweet tea leaves
Phlorizin, trilobatin, and sieboldin are three typical sweeteners in the leaves of sweet tea (Yang et al., 1991; Liao et al., 2003). The content of DHCs in leaves is significantly affected by the maturation process (Wang et al., 2022). Therefore, we examined the variation in DHC levels across five distinct developmental stages, from tender to mature leaves. Our analysis revealed an accumulation pattern for phlorizin and trilobatin, with the highest level at stage S3, followed by a sharp decrease at stages S4 and S5. In contrast, sieboldin levels remained high starting from stage S2 onward. The decline in phlorizin and trilobatin levels mirrors the variation of DHC concentrations observed in apple foliage (Hunter and Hull, 1993). However, phloridzin content increases consistently with leaf maturity in sweet tea from Sichuan province (He et al., 2012). The contents of DHCs are influenced by multiple factors, including environmental conditions (Yang et al., 2021; Wang et al., 2022). A decrease in latitude, accompanied by an increase in mean annual temperature and precipitation, positively impacts the growth and development of the sweet tea tree (Huang et al., 2018, 2019). In apple leaves, the deficiency of phlorizin will lead to the narrowing of leaves and the weakening of both the photosynthetic capacity and resistance (Zhou et al., 2019). Compared to Sichuan province, the tropical climate of Guangdong province, characterized by high temperatures and abundant precipitation, accelerates plant leaf growth, leading to rapid metabolism and increased phlorizin consumption, ultimately reducing its accumulation in this region. This finding suggests that, in Guangdong province, the optimal harvest time for phlorizin and trilobatin is approximately 20 days after the emergence of leaf bud. In contrast, it is recommended to collect leaves at the S5 stage to achieve optimal yields of sieboldin, as the content of sieboldin continuously increases with the growth of leaves.
4.2 Candidate genes and TFs involved in DHCs biosynthesis
Based on the nine well-characterized enzymes involved in the complete DHC biosynthetic pathway (Gosch et al., 2009; Yahyaa et al., 2016; Gutierrez et al., 2018; Wang et al., 2022), we used genomic data to identify potential candidate genes in sweet tea. Additionally, through Pearson correlation analysis, we pinpointed key genes that were positively correlated with higher concentrations of DHCs in sweet tea, including two PALs, two C4Hs, 10 4CLs, eight CDBRs, three CHSs, three F3’Hs, three CH3Hs, one P2’GT, and five P4’GTs. These genes are hypothesized to play roles in the DHC biosynthetic pathway, though their specific functional roles remain to be experimentally validated. For example, PAL is the rate-limiting enzyme in the flavonoids pathways, supplying precursors for downstream metabolites (Dong and Lin, 2021; Zhao et al., 2021). Our analysis revealed that two PAL genes were positively correlated with the DHCs accumulation, which might suggest that these two genes play a crucial role at the initiation of the DHC biosynthetic pathway. Moreover, CDBR catalyzes the first committed step in DHC biosynthesis, converting 4-coumaryl-CoA to dihydro-4-coumaryl-CoA (Ibdah et al., 2014). Our study identified 10 CDBR genes associated with DHC synthesis, highlighting their crucial role in phloretin precursor biosynthesis. While we identified 14 candidate genes encoding P2’GT, only one has been confirmed as essential for the biosynthesis of phlorizin. Additionally, we identified five P4’GT genes, which are tentatively proposed to be involved in the step prior to the synthesis of trilobatin and sieboldin; however, their specific functional roles and the exact pathway they contribute to remain underexplored and require in-depth functional validation to clarify, particularly to identify whether any of these P4’GT genes exert a dominant influence during the synthesis of trilobatin and sieboldin.
The biosynthesis of DHCs involves not only genes encoding enzymes but also transcription factors (TFs) that regulate these processes. In our study, 13 core genes involved in DHC biosynthesis were found to be regulated; our co-expression network analysis revealed strong correlation between TFs such as MYB, WD40-like, WRKY, and bHLH with the core biosynthesis genes. MYB and bHLH are widely distributed in plants, and it has been confirmed that they play a crucial regulatory role in the biosynthesis of flavonoids and phenolic acids (Xu et al., 2015; Pratyusha and Sarada, 2022). Notably, two transcription factors containing MYB-like DNA-binding domains have been shown to regulate DHC glycoside patterns in various apple tissues (Wang et al., 2023). Additionally, MYB frequently interacts with bHLH and WD40 to initiate the transcription of specific genes (Pratyusha and Sarada, 2022). Therefore, the TFs identified in our study, along with the candidate DHC biosynthesis genes, represent potential targets for further functional studies in sweet tea.
Genes duplication has played a crucial role in the diversification of metabolites (Leong and Last, 2017; Louveau and Osbourn, 2019; Hansen et al., 2021). In our study, TD or PD increased the copy number of genes encoding PAL, 4CL, CDBR, CH3H, P2’GT, and P4’GT enzymes. Our findings suggest that the biosynthesis of trilobatin and sieboldin is regulated by five tandem-arranged P4’GT genes (LPO02G147400.1, LPO06G039500.1, LPO06G039600.1, LPO06G039800.1, and LPO09G074900.1). Additionally, two 4CLs, four CDBRs, and three CH3Hs were formed through tandem duplication. This genetic pattern strongly suggests that TD may serve as a regulatory mechanism in the DHC biosynthetic pathway. Yet, comprehensive experimental studies are needed to clarify and validate the exact role of TD in this pathway.
4.3 The BGCs in DHCs biosynthesis of sweet tea
There have been no previous reports regarding the BGCs involved in the biosynthesis of DHCs in plants. In this study, we report two BGCs that include candidate CDBR and P2’GT genes, which may catalyse the synthesis of precursor of phloretin, and phlorizin, respectively. Phylogenetic and syntenic analyses of BGC1 in Fagaceae family reveal an ancient gene cluster inherited from a common ancestor, co-inherited by several Quercus and Lithocarpus species, indicating their shared evolutionary heritage. In contrast, BGC2 is found exclusively in sweet tea, strongly suggesting that it likely originated independently in Fagaceae, though this remains to be supported by direct experimental evidence. Compelling evidence indicates that the plant BGCs reported so far have originated through processes such as gene duplication, relocation, and neofunctionalization (Nützmann et al., 2016). BGC1 contains nine candidate genes encoding CDBR enzyme, eight of which originated from gene duplication, while the uncharacterized BGC of Q. variabilis contains only one CDBR gene. The synteny observed between BGC1 and the uncharacterized BGC of Q. variabilis, supports the hypothesis that an original founder gene of CDBR first acquired additional genes, with subsequent gene duplication events leading to the establishment of the BGC1 architecture. BGC2 is composed of four P2’GT genes, two of which were produced through gene duplication; however, the specific formation process remains unclear.
Determining the association between a predicted BGC and its metabolites remains a significant challenge. BGC1 contains nine CDBR genes, four of which are crucial for the regulation of the phlorizin precursor substances. Among them, one is regulated by a transcription factor. While only one P2’GT gene is involved in the synthesis of phlorizin, this gene is absent in BGC2. Therefore, the specific functions of this gene cluster still require further exploration.
5 Conclusion
The tender leaves of sweet tea provide an ideal resource for the extraction and utilization of DHCs. Metabolomic analysis revealed that four DHCs reached their highest contents approximately 20 days after the emergence of leaf buds, while sieboldin exhibited a high level. By integrating genomic, transcriptomic, and metabolomic data, we reconstructed the biosynthetic pathway for DHCs and identified 82 enzyme-encoding genes. Two PALs, eight CDBRs, three CHSs, one P2’TG, and five P4’GTs genes play pivotal roles in regulating DHC biosynthesis. Furthermore, TD or PD promotes the assembly of these genes. Co-expression network analysis revealed that four modules were positively correlated with DHC levels, suggesting that MYB, WD40-like, WRKY, and bHLH TFs may regulate the biosynthesis. Two BGCs were characterized using genome mining, and BGC1 may have evolved from an ancient gene cluster in the Fagaceae family. In contrast, BGC2 emerged concurrently with the formation of L. litseifolius. The genomic, transcriptomic, and metabolomic resources, along with the experimental results presented in this study, will promote the efficient utilization of sweet tea as a herbal medicine and facilitate further functional genomic studies in the future.
Data availability statement
The datasets presented in this study can be found in online repositories. The names of the repository/repositories and accession number(s) can be found in the article/Supplementary Material.
Author contributions
SL: Methodology, Visualization, Writing – original draft. QL: Visualization, Writing – original draft. BZ: Formal Analysis, Writing – original draft. YL: Formal Analysis, Writing – original draft. WL: Formal Analysis, Methodology, Writing – original draft. ZS: Methodology, Writing – original draft. JW: Methodology, Writing – original draft. JN: Methodology, Writing – original draft. LQ: Methodology, Writing – original draft. BW: Conceptualization, Supervision, Writing – review & editing. HL: Conceptualization, Investigation, Visualization, Writing – original draft, Writing – review & editing.
Funding
The author(s) declare that financial support was received for the research and/or publication of this article. This work was performed under the National Natural Science Foundation of China (42301057), Hainan Provincial Natural Science Foundation of China (422QN269), Guangdong Flagship Project of Basic and Applied Basic Research (2023B0303050001), Guangdong Science and Technology Plan Project (2023B1212060046).
Conflict of interest
The authors declare that the research was conducted in the absence of any commercial or financial relationships that could be construed as a potential conflict of interest.
Generative AI statement
The author(s) declare that no Generative AI was used in the creation of this manuscript.
Publisher’s note
All claims expressed in this article are solely those of the authors and do not necessarily represent those of their affiliated organizations, or those of the publisher, the editors and the reviewers. Any product that may be evaluated in this article, or claim that may be made by its manufacturer, is not guaranteed or endorsed by the publisher.
Supplementary material
The Supplementary Material for this article can be found online at: https://www.frontiersin.org/articles/10.3389/fpls.2025.1629266/full#supplementary-material
References
Barreca, D., Bellocco, E., Laganà, G., Ginestra, G., and Bisignano, C. (2014). Biochemical and antimicrobial activity of phloretin and its glycosylated derivatives present in apple and kumquat. Food Chem. 160, 292–297. doi: 10.1016/j.foodchem.2014.03.118
Bolger, A. M., Lohse, M., and Usadel, B. (2014). Trimmomatic: A flexible trimmer for Illumina Sequence Data. Bioinformatics 30, 2114–2120. doi: 10.1093/bioinformatics/btu170
Brown, R., Ann De Banate, M., and Rother, K. (2010). Artificial Sweeteners: A systematic review of metabolic effects in youth. Int. J. Pediatr. Obes. 5, 305–312. doi: 10.3109/17477160903497027
Capella-Gutiérrez, S., Silla-Martínez, J. M., and Gabaldón, T. (2009). trimAl: a tool for automated alignment trimming in large-scale phylogenetic analyses. Bioinformatics 25, 1972–1973. doi: 10.1093/bioinformatics/btp348
Castro-Muñoz, R., Correa-Delgado, M., Córdova-Almeida, R., Lara-Nava, D., Chávez-Muñoz, M., Velásquez-Chávez, V. F., et al. (2022). Natural sweeteners: Sources, extraction and current uses in foods and food industries. Food Chem. 370, 130991. doi: 10.1016/j.foodchem.2021.130991
Cheng, J., Lyu, L. S., Shen, Y. B., Li, K. X., Liu, Z. H., Wang, W. X., et al. (2016). Population structure and genetic diversity of Lithocarpus litseifolius (Fagaceae) assessed using microsatellite markers. Nor. J. Bot. 34, 752–760. doi: 10.1111/njb.01111
Chowdhury, A. I., Alam, M. R., Raihan, M. M., Rahman, T., Islam, S., and Halima, O. (2022). Effect of stevia leaves (Stevia rebaudiana Bertoni) on diabetes: A systematic review and meta-analysis of preclinical studies. Food Sci. Nutr. 10, 2868–2878. doi: 10.1002/fsn3.2904
Debras, C., Chazelas, E., Srour, B., Druesne-Pecollo, N., Esseddik, Y., Szabo de Edelenyi, F., et al. (2022). Artificial sweeteners and cancer risk: Results from the NutriNet-Santé population-based cohort study. PloS Med. 19, e1003950. doi: 10.1371/journal.pmed.1003950
Dong, N. Q. and Lin, H. X. (2021). Contribution of phenylpropanoid metabolism to plant development and plant-environment interactions. J. Integr. Plant Biol. 63, 180–209. doi: 10.1111/jipb.13054
Dugé de Bernonville, T., Guyot, S., Paulin, J. P., Gaucher, M., Loufrani, L., Henrion, D., et al. (2010). Dihydrochalcones: Implication in resistance to oxidative stress and bioactivities against advanced glycation end-products and vasoconstriction. Phytochemistry 71, 443–452. doi: 10.1016/j.phytochem.2009.11.004
Dwivedi, R. S. (2022). “Dihydrochalcones flavonoid super sweet principles,” in Alternative Sweet and Supersweet Principles. Ed. Dwivedi, R. S. (Springer Singapore press, Singapore), 405–469. doi: 10.1007/978-981-33-6350-2_10
Ehrenkranz, J. R. L., Lewis, N. G., Kahn, C. R., and Roth, J. (2005). Phlorizin: a review. Diabetes/Metab. Res. 21, 31–38. doi: 10.1002/dmrr.532
Emms, D. M. and Kelly, S. (2019). OrthoFinder: Phylogenetic orthology inference for comparative genomics. Genome Biol. 20, 238. doi: 10.1186/s13059-019-1832-y
Gosch, C., Halbwirth, H., Kuhn, J., Miosic, S., and Stich, K. (2009). Biosynthesis of phloridzin in apple (Malus × domestica Borkh.). Plant Sci. 176, 223–231. doi: 10.1016/j.plantsci.2008.10.011
Gosch, C., Halbwirth, H., and Stich, K. (2010). Phlorizin: biosynthesis, distribution and physiological relevance in plants. Phytochemistry 71, 838–843. doi: 10.1016/j.phytochem.2010.03.003
Grímsson, F., Grimm, G. W., Zetter, R., and Denk, T. (2016). Cretaceous and Paleogene Fagaceae from North America and Greenland: evidence for a Late Cretaceous split between Fagus and the remaining Fagaceae. Acta Palaeobot. 56, 247–305. doi: 10.1515/acpa-2016-0016
Gutierrez, B. L., Arro, J., Zhong, G. Y., and Brown, S. K. (2018). Linkage and association analysis of dihydrochalcones phloridzin, sieboldin, and trilobatin in Malus. Tree Genet. Genomes 14, 19. doi: 10.1007/s11295-018-1304-7
Hansen, C. C., Nelson, D. R., Møller, B. L., and Werck-Reichhart, D. (2021). Plant cytochrome P450 plasticity and evolution. Mol. Plant 14, 1244–1265. doi: 10.1016/j.molp.2021.06.028
He, C. N., Peng, Y., Xiao, W., and Xiao, P. (2012). Quick determination of five sweet constituents in Duosuike Tiancha by RSLC. China J. Chin. Mater. Med. 37, 961–965. doi: 10.4268/cjcmm20120720
Huang, X., Liang, W., Li, B., Wang, K., Chen, J., and Li, K. (2019). On leaf morphological and venation of Lithocarpus polystachyus from different provenances. J. Beihua. Univ. Nat. Sci. 20, 237–243. doi: 10.11713/j.issn.1009-4822.2019.02.021
Huang, X., Wang, K., Li, B., Liang, W., Chen, J., Lan, J., et al. (2018). Variation comparison of seedling growth and physiological characteristics of different provenances of Lithocarpus polystachyus. Guangxi For. Sci. 47, 409–414. doi: 10.19692/j.cnki.gfs.2018.04.005
Hunter, M. D. and Hull, L. A. (1993). Variation in concentrations of phlorizin and phloretin in apple foliage. Phytochemistry 34, 1251–1254. doi: 10.1016/0031-9422(91)80010-X
Ibdah, M., Berim, A., Martens, S., Valderrama, A. L. H., Palmieri, L., Lewinsohn, E., et al. (2014). Identification and cloning of an NADPH-deoendent hydroxycinnamoyl-CoA double bond reductase involved in dihydrochalcone formation in Malus × domestica Borkc. Phytochemistry 107, 24–31. doi: 10.1016/j.phytochem.2014.07.027
Ji, W., Osbourn, A., and Liu, Z. (2024). Understanding metabolic diversification in plants: branchpoints in the evolution of specialized metabolism. Phil. Trans. R. Soc B 379, 20230359. doi: 10.1098/rstb.2023.0359
Katoh, K. and Standley, D. M. (2013). MAFFT multiple sequence alignment software version 7: Improvements in performance and usability. Mol. Biol. Evol. 30, 772–780. doi: 10.1093/molbev/mst010
Kautsar, S. A., Suarez Duran, H. G., Blin, K., Osbourn, A., and Medema, M. H. (2017). PLANTISMASH: automated identification, annotation and expression analysis of plant biosynthetic gene clusters. Nucleic Acids Res. 45, W55–W63. doi: 10.1101/083535
Kautsar, S. A., Suarez Duran, H. G., and Medema, M. H. (2018). Genomic identification and analysis of specialized metabolite biosynthesis gene clusters in plants using PLANTISMASH. Methods Mol. Biol. 1795, 173–188. doi: 10.1007/978-1-4939-7874-8_15
Kiełbasa, S. M., Wan, R., Sato, K., Horton, P., and Frith, M. C. (2011). Adaptive seeds tame genomic sequence comparison. Genome Res. 21, 487–493. doi: 10.1101/gr.113985.110
Kim, D., Paggi, J. M., Park, C., Bennett, C., and Salzberg, S. L. (2019). Graph-based genome alignment and genotyping with HISAT2 and HISAT-genotype. Nat. Biotechnol. 37, 907–915. doi: 10.1038/s41587-019-0201-4
Kroger, M., Meister, K., and Kava, R. (2006). Low-calorie sweeteners and other sugar substitutes: A review of the safety issues. Compr. Rev. Food Sci. F. 5, 35–47. doi: 10.1111/j.1541-4337.2006.tb00081.x
Kumar, S., Tyagi, P. K., Gola, D., Mishra, A. K., and Arya, A. (2021). “Plant-based sweeteners and their applications in modern lifestyle,” in Non-Timber Forest Products. Eds. Husen, A., Bachheti, R. K., and Bachheti, A. (Springer press, Cham), 75–103.
Langfelder, P. and Horvath, S. (2008). WGCNA: an R package for weighted correlation network analysis. BMC Bioinform. 9, 559. doi: 10.1186/1471-2105-9-559
Leong, B. J. and Last, R. L. (2017). Promiscuity, impersonation and accommodation: evolution of plant specialized metabolism. Curr. Opin. Struc. Biol. 47, 105–112. doi: 10.1016/j.sbi.2017.07.005
Li, Y., Zhu, F. L., Zheng, X. W., Hu, M. L., Dong, C., Diao, Y., et al. (2020). Comparative population genomics reveals genetic divergence and selection in lotus, Nelumbo nucifera. BMC Genomics 21, 146. doi: 10.1186/s12864-019-6376-8
Liao, X. F., Yu, R., and Xiao, K. F. (2003). Compositions of natural wilding Lithocarpus polystachyus Rehd. Biomass Chem. Eng. 37, 32–34.
Liu, Z., Suarez Duran, H. G., Harnvanichvech, Y., Stephenson, M. J., Schranz, M. E., Nelson, D., et al. (2020). Drivers of metabolic diversification: how dynamic genomic neighbourhoods generate new biosynthetic pathways in the Brassicaceae. New Phytol. 227, 1109–1123. doi: 10.1111/nph.16338
Liu, H., Zhang, R., Zhou, B. F., Shen, Z., Chen, X. Y., Gao, J., et al. (2023). Chromosome-scale genome assembly of sweet tea (Lithocarpus polystachyus Rehder). Sci. Data 10, 873. doi: 10.1038/s41597-023-02791-y
Lou, W., Mu, X., Liu, J., Xun, M., and Hu, Y. (2023). Study on the differences of metabolites and their bioactivities of Lithocarpus under different processing method. Food Biosci. 54, 102817. doi: 10.1016/j.fbio.2023.102817
Louveau, T. and Osbourn, A. (2019). The sweet side of plant-specialized metabolism. Cold Spring Harbor Perspect. Biol. 11, a034744. doi: 10.1101/cshperspect.a034744
Nguyen, L. T., Schmidt, H. A., von Haeseler, A., and Minh, B. Q. (2015). IQ-TREE: A fast and effective stochastic algorithm for estimating maximum-likelihood phylogenies. Mol. Biol. Evol. 32, 268–274. doi: 10.1093/molbev/msu300
Nützmann, H. W., Huang, A., and Osbourn, A. (2016). Plant metabolic clusters-from genetics to genomics. New Phytol. 211, 771–789. doi: 10.1111/nph.13981
Pertea, M., Pertea, G. M., Antonescu, C. M., Chang, T. C., Mendell, J. T., and Salzberg, S. L. (2015). StringTie enables improved reconstruction of a transcriptome from RNA-seq reads. Nat. Biotechnol. 33, 290–295. doi: 10.1038/nbt.3122
Pratyusha, D. S. and Sarada, D. V. L. (2022). MYB transcription factors-master regulators of phenylpropanoid biosynthesis and diverse developmental and stress responses. Plant Cell Rep. 41, 2245–2260. doi: 10.1007/s00299-022-02927-1
Qiao, X., Li, Q., Yin, H., Qi, K., Li, L., Wang, R., et al. (2019). Gene duplication and evolution in recurring polyploidization-diploidization cycles in plants. Genome Biol. 20, 38. doi: 10.1186/s13059-019-1650-2
Qin, X. D. and Liu, J. K. (2003). A new sweet dihydrochalcone-glucoside from leaves of Lithocarpus pachyphyllus (Kurz) Rehd. (Fagaceae). Z. für Naturforschung C 58c, 759–761. doi: 10.1515/znc-2003-9-1029
Ray, S. and Palui, R. (2025). Artificial sweeteners: benefits, risks and controversy. Apollo Med. 22, 228–233. doi: 10.1177/09760016251336000
Rivière, C. (2016). Dihydrochalcones: occurrence in the plant kingdom, chemistry and biological activities. Stud. Nat. Prod. Chem. 51, 253–381. doi: 10.1016/B978-0-444-63932-5.00007-3
Shang, A., Liu, H. Y., Luo, M., Xia, Y., Yang, X., Li, H. Y., et al. (2022). Sweet tea (Lithocarpus polystachyus rehd.) as a new natural source of bioactive dihydrochalcones with multiple health benefits. Crit. Rev. Food Sci. 62, 917–934. doi: 10.1080/10408398.2020.1830363
Shannon, P., Markiel, A., Ozier, O., Baliga, N. S., Wang, J. T., Ramage, D., et al. (2003). Cytoscape: a software environment for integrated models of biomolecular interaction networks. Genome Res. 13, 2498–2504. doi: 10.1101/gr.1239303
Szliszka, E., Czuba, Z. P., Mazur, B., Paradysz, A., and Krol, W. (2010). Chalcones and dihydrochalcones augment TRAIL-mediated apoptosis in prostate cancer cells. Molecules 15, 5336–5353. doi: 10.3390/molecules15085336
Tan, J. Z., Liao, N., Zhang, B. T., and Fan, B. (2022). Research on development and application of natural sweeteners. China Food Additives 1, 32–39. doi: 10.19804/j.issn1006-2513.2022.01.006
Tang, H., Bowers, J., Wang, X., Ming, R., Alam, M., and Paterson, A. H. (2008). Synteny and collinearity in plant genomes. Science 320, 486–488. doi: 10.1126/science.1153917
Tomás-Barberán, F. A. and Clifford, M. (2000). Flavanones, chalcones and dihydrochalcones-nature, occurrence and dietary burden. J. Sci. Food Agr. 80, 1073–1080. doi: 10.3390/molecules15085336
Wang, Y., Ding, Y., Zhao, Q., Wu, C., Deng, C. H., Wang, J., et al. (2023). Dihydrochalcone glycoside biosynthesis in Malus is regulated by two MYB-like transcription factors and is required for seed development. Plant J. 116, 1492–1507. doi: 10.1111/tpj.16444
Wang, Y. K., Hu, S. Y., Xiao, F. Y., Dong, Z. B., Ye, J. H., Zheng, X. Q., et al. (2022). Dihydrochalcones in sweet tea: biosynthesis, distribution and neuroprotection function. Molecules 27, 8794. doi: 10.3390/molecules27248794
Wang, Y. and Lin, L. (2025). Naturally occurring and artificial nonnutritive sweeteners: potential impacts on metabolic diseases. eFood 6, e70028. doi: 10.1002/efd2.70028
Wang, Y., Yauk, Y. K., Zhao, Q., Hamiaux, C., Xiao, Z., Gunaseelan, K., et al. (2020). Biosynthesis of the dihydrochalcone sweetener trilobatin requires phloretin glycosyltransferase2. Plant Physiol. 184, 738–752. doi: 10.1104/pp.20.00807
Wang, M., Zhang, S., Li, R., and Zhao, Q. (2024). Unraveling the specialized metabolic pathways in medicinal plant genomes: a review. Front. Plant Sci. 15. doi: 10.3389/fpls.2024.1459533
Wilf, P., Nixon, K. C., Gandolfo, M. A., and Cúneo, N. R. (2019). Eocene Fagaceae from Patagonia and Gondwanan legacy in Asian rainforests. Science 364, eaaw5139. doi: 10.1126/science.aaw5139
Xu, C., Liberatore, K. L., MacAlister, C. A., Huang, Z., Chu, Y. H., Jiang, K., et al. (2015). A cascade of arabinosyltransferases controls shoot meristem size in tomato. Nat. Genet. 47, 784–792. doi: 10.1038/ng.3309
Yahyaa, M., Davidovich-Rikanati, R., Eyal, Y., Sheachter, A., Marzouk, S., Lewinsohn, E., et al. (2016). Identification and characterization of UDP-glucose: Phloretin 4’-O-glycosyltransferase from Malus x domestica Borkh. Phytochemistry 130, 47–55. doi: 10.1016/j.phytochem.2016.06.004
Yang, Z. (2007). PAML 4: Phylogenetic analysis by maximum likelihood. Mol. Biol. Evol. 24, 1586–1591. doi: 10.1093/molbev/msm088
Yang, X., Yang, Z., and Wang, Y. (2021). Active component content in different Lithocarpus litseifolius populations related to meteorologic and soil factors. J. Cent. South Univ. Fore. Technol. 41, 34–41. doi: 10.14067/j.cnki.1673-923x.2021.07.005
Yang, D. J., Zhong, Z. C., and Xiao, Z. Y. (1991). Chemical components of manyspike tanoak (Lithocarpus polystachyus) I. Sweet constituents. Chin. Tradit. Herbal Drugs 22, 99–101.
Zhang, J., Jiao, M., Cheng, W., Song, X., Wang, S., Zhao, X., et al. (2023). Identification and functional analysis of glycosyltransferase catalyzing the synthesis of phlorizin and trilobatin in Lithocarpus polystachyus Rehd. Ind. Crop Prod. 192, 116056. doi: 10.1016/j.indcrop.2022.116056
Zhao, T., Li, R., Yao, W., Wang, Y., Zhang, C., and Li, Y. (2021). Genome-wide identification and characterisation of phenylalanine ammonia-lyase gene family in grapevine. J. Hortic. Sci. Biotechnol. 96, 456–468. doi: 10.1080/14620316.2021.1879685
Zheng, J., Pan, W., Liu, M., Yu, Y., Zhao, Y., Su, K., et al. (2025). Antioxidant profiling and quality assessment of Lithocapus polystachyus sweet tea using LC-ECD and LC-MS/MS. Sci. Rep. 15, 13163. doi: 10.1038/s41598-025-97875-7
Zhou, K., Hu, L., Li, Y., Chen, X., Zhang, Z., Liu, B., et al. (2019). MdUGT88F1-mediated phloridzin biosynthesis regulates apple development and Valsa canker resistance. Plant Physiol. 180, 2290–2305. doi: 10.1104/pp.19.00494
Zhou, X. and Liu, Z. (2022). Unlocking plant metabolic diversity: A (pan)-genomic view. Plant Commun. 3, 100300. doi: 10.1016/j.xplc.2022.100300
Keywords: biosynthetic pathway, candidate genes, transcription factors, comparative genomics, biosynthetic gene clusters
Citation: Ling S, Lin Q, Zhou B, Liang Y, Luo W, Shen Z, Wang J, Niu J, Qiao L, Wang B and Liu H (2025) Integrated metabolomic and transcriptomic analysis reveals the biosynthesis mechanism of dihydrochalcones in sweet tea (Lithocarpus litseifolius). Front. Plant Sci. 16:1629266. doi: 10.3389/fpls.2025.1629266
Received: 19 May 2025; Accepted: 21 July 2025;
Published: 04 August 2025.
Edited by:
Moonhyuk Kwon, Gyeongsang National University, Republic of KoreaReviewed by:
Jiang Shi, Chinese Academy of Agricultural Sciences, ChinaLi Ren, China Academy of Chinese Medical Sciences, China
Copyright © 2025 Ling, Lin, Zhou, Liang, Luo, Shen, Wang, Niu, Qiao, Wang and Liu. This is an open-access article distributed under the terms of the Creative Commons Attribution License (CC BY). The use, distribution or reproduction in other forums is permitted, provided the original author(s) and the copyright owner(s) are credited and that the original publication in this journal is cited, in accordance with accepted academic practice. No use, distribution or reproduction is permitted which does not comply with these terms.
*Correspondence: Shaojun Ling, bGluZ3NqQHNjYmcuYWMuY24=; Hui Liu, aHVpLmxpdUB1bXUuc2U=
†These authors have contributed equally to this work and share first authorship