 Hailei Liao1
 Fang Wu
 Lijuan Wang
- 1College of Basic Medical Science, Ningxia Medical University, Yinchuan, China
- 2Guyuan Branch of Ningxia Academy of Agricultural and Forestry Sciences, Guyuan, China
- 3Life College, Ningxia University, Yinchuan, China
- 4Institute of Forestry and Grassland Ecology, NingXia Academy of Agriculture and Forestry Sciences, Yinchuan, China
Introduction: Honeysuckle (Lonicera japonica Thunb.) is a key medicinal plant whose bioactive flavonoids underpin its antiviral, anti-inflammatory, and antioxidant properties. However, the genetic and metabolic mechanisms controlling flavonoid accumulation and the associated flower color variation between different cultivars remain largely unexplored, limiting targeted breeding for enhanced therapeutic quality.
Methods: A comparative analysis was conducted using two distinct honeysuckle varieties—'Luyu No.1' (white-yellow flowers) and 'Honghua' (red-pink flowers)—at the optimal harvest stage ('Dabai period'). An integrated transcriptomics (RNA-seq) and widely targeted metabolomics approach was employed to identify differentially expressed genes (DEGs) and differentially accumulated metabolites (DAMs) between the varieties.
Results: Transcriptomic profiling revealed 5,901 DEGs, with significant enrichment in the phenylpropanoid and flavonoid biosynthesis pathways. Key structural genes (PAL, CHS, F3H, FLS, DFR, and ANS) were markedly up-regulated in 'Honghua'. Metabolomic analysis identified 399 flavonoids, including 228 DAMs. The 'Honghua' variety exhibited a 2.32-fold higher total flavonoid content, with substantially elevated levels of anthocyanidins (87.58-fold), flavanols (7.66-fold), and chalcones (6.17-fold). Critical medicinal compounds such as quercetin-3-O-rhamnoside and luteolin-7-O-glucoside were significantly enriched in 'Honghua'. Integrated analysis highlighted the co-expression of transcription factors (MYB, bHLH, NAC) with flavonoid pathways. Crucially, the anthocyanin-modifying enzymes F3’M and 3RT were up-regulated by 22.12- and 3.03-fold, respectively, in 'Honghua', while a potential repressor, TCP15 (bHLH), was down-regulated.
Discussion: The results demonstrate that the red-pink pigmentation and superior medicinal quality of 'Honghua' are driven by a coordinated gene-metabolite network that fluxes metabolic intermediates towards anthocyanin and other flavonoid end-products. The pronounced up-regulation of F3’M and 3RT is identified as a key biochemical determinant for anthocyanin diversification and color development. This study provides the first comprehensive framework for flavonoid biosynthesis in honeysuckle, establishing a genetic basis for breeding cultivars with high flavonoid content and enhanced pharmacological value.
1 Introduction
Honeysuckle (Lonicera japonica Thunb.), a traditional medicinal plant from the Caprifoliaceae family, is primarily made from dried flower buds or early-blooming flowers (Law et al., 2024). Traditionally, it has been used for heat-clearing, detoxifying, and dispelling wind-heat (Huo et al., 2024), treating conditions like furuncles, carbuncles, sore throat, erysipelas, dysentery, and colds. Modern research shows honeysuckle has antiviral (Ma et al., 2024), anti-inflammatory, and antioxidant effects (Ma et al., 2025), earning its reputation as “antibiotics in traditional Chinese medicine.” It contains various compounds, such as volatile oils, flavonoids, organic acids, iridoid glycosides, and triterpene saponins, making it useful in clinical, pharmaceutical, health care, and cosmetic applications.
Honeysuckle, although not indigenous to the Ningxia Hui Autonomous Region, has been successfully cultivated there since 2021 on selenium-enriched sandy soil. Two major varieties, ‘Luyu No.1’ (characterized by white-yellow floral buds) and ‘Honghua’ (distinguished by red-pink floral buds), represent predominant types currently grown in the region and display marked differences in pigmentation. Notably, this variation in coloration is closely correlated with well-documented differences in their flavonoid composition, particularly anthocyanin levels—key bioactive compounds that contribute to honeysuckle’s pharmacological properties, including antioxidant and antiviral activities (Zheng et al., 2022). Therefore, these two varieties provide a valuable comparative system for investigating the molecular mechanisms governing flavonoid biosynthesis, accumulation patterns, and flower color differentiation, all of which have direct implications for medicinal efficacy. The ‘Dabai period’, corresponding to the stage of maximal accumulation of bioactive constituents, represents the optimal time for harvest. Honeysuckle buds are abundant in bioactive flavonoids (Li et al., 2024), such as rutin, luteolin, loniceroside, quercetin, and hyperoside, which exhibit a broad spectrum of therapeutic effects, including antioxidant, anti-inflammatory, antiviral, immunomodulatory, cardioprotective, and diuretic properties (Yang et al., 2023). It is well established that variations among honeysuckle varieties result in differences in the content of their bioactive components (Hou et al., 2025). However, the molecular basis underlying the differential accumulation of these flavonoids across cultivars remains poorly understood.
Advances in high-throughput sequencing and systems biology have made multiomics approaches essential for understanding plant growth and development at systemic and cellular levels (Li et al., 2023. Metabolomics analyzes small molecule metabolites qualitatively and quantitatively, while transcriptomics tracks gene expression changes. Integrating metabolomics and transcriptomics via ‘metabolite and gene’ co-expression analysis improves the elucidation of metabolic biosynthesis and regulation mechanisms and aids in identifying candidate genes (Liu et al., 2023). For example, Zhang et al. (2021) found increased activity of anthocyanin biosynthesis-related genes in jujube fruits, with kaempferol 3-O-glucoside and delphinidin 3-O-glucoside accumulation contributing to red peel coloration. Wu et al. (2016) combined transcriptomic and metabolomic analyses to identify key flavonoid pathway genes, revealing blue water lily flower color formation. Guo et al. (2019) linked differential gene expression in the flavonoid pathway to tea leaf color differences. Zhuang et al. (2019) showed that dihydroflavonols are transferred to anthocyanin biosynthesis, causing pigment differences in purple and green radish root peels.
In this study, ‘Luyu No.1’ and ‘Honghua’ honeysuckle varieties were analyzed using metabolomics to investigate flavonoid composition differences and their synthesis mechanisms. Transcriptomics was used to identify key genes and transcription factors related to flavonoid synthesis, exploring the genetic basis of flower color changes. The study aims to clarify the molecular mechanisms of flower color differences under consistent ecological conditions and identify critical genes involved in active component synthesis. These findings will provide a theoretical basis for anthocyanin synthesis research and breeding improvements, as well as support the development of gene-specific markers and targeted breeding strategies.
2 Materials and methods
2.1 Plant materials and growth conditions
The Lonicera japonica Thunb. cultivars ‘Luyu No. 1’ and ‘Honghua’ were grown in the standardized field of the Ningxia honeysuckle planting base (37°20′11.053”N, 105°15′11.053”E). Flowers at the Dabai stage, characterized by stick-shaped buds before blooming (Figure 1A), were harvested using diagonal sampling. Three replicates, each from at least three plants, were collected. Samples were split into two groups: one for biochemical validation and the other frozen at -80 °C for sequencing and analysis.
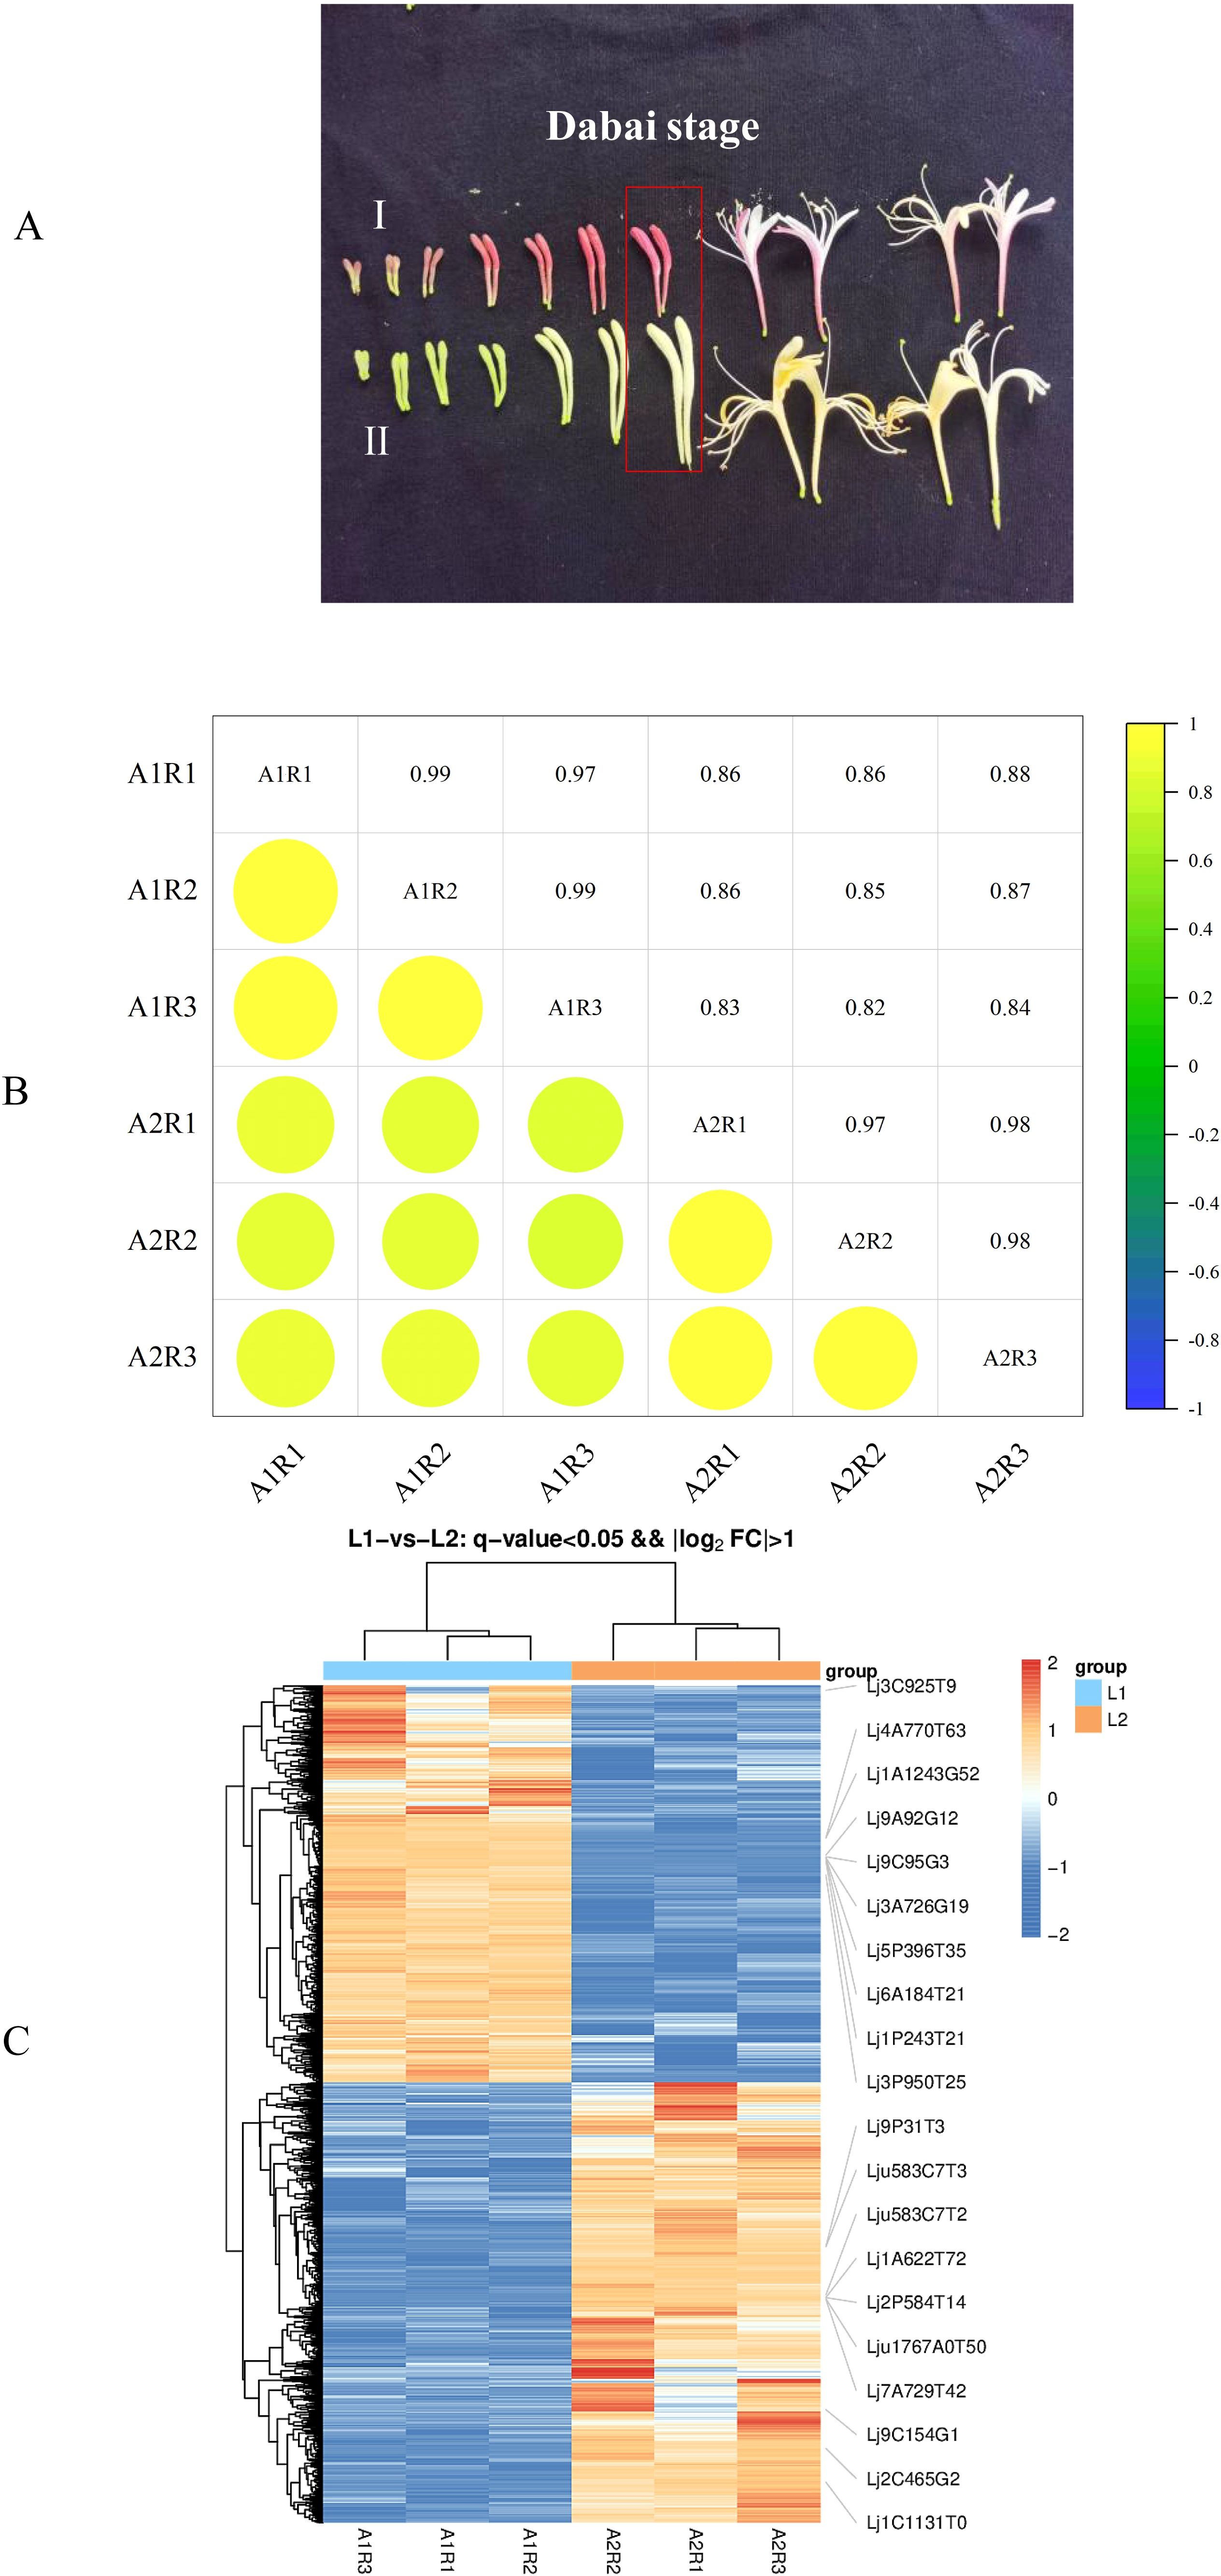
Figure 1. (A) Fresh flower appearance of ‘Honghua’(I) and ‘Luyu No.1’ (II), (B) An Individual correlation analyses between 6 transcriptome samples of ‘Honghua’ and ‘Luyu No.1’, (C) Volcano map of DEGs.
2.2 RNA extraction and Illumina sequencing
Total RNA and mRNA extraction for sequencing was performed using Metwell Biotechnology Co., Ltd. (Wuhan, China). To ensure the RNA met the quality requirements for library construction, its purity, concentration, and integrity were assessed using the NanoPhotometer® spectrophotometer (IMPLEN, CA, USA), the Qubit® RNA Assay Kit in the Qubit® 2.0 Fluorometer (Life Technologies, CA, USA), and the RNA Nano 6000 Assay Kit on the Bioanalyzer 2100 System (Agilent Technologies, CA, USA). The cDNA library was constructed using the cDNA Library Construction Kit (Beijing Genomics Institute, Shenzhen, China) and sequenced on the Illumina NovaSeq 6000 platform at Metwell Biotechnology Co., Ltd. (Wuhan, China).
2.3 Sequence annotation and classification
New transcript information was extracted from the comparison results of spliced transcripts and genome annotation, and then the sequence of new genes was collected from the genome. Using BlastX, the sequences were explored for annotation against the NCBI nonredundant (NR, http://www.ncbi.nlm.nih.gov) protein database with a cut-of E-value of 10–5. Blast2GO (version: 2.5.0, parameters: default) was used to retrieve Gene Ontology (GO) terms from the annotation of high scoring BLAST matches against the NCBI NR protein database (E-value ≤ 1.0×10⁻⁵, http://www.ncbi.nlm.nih.gov) Then, the GO categories were sorted with in-house Perl scripts. The Kyoto Encyclopedia of Genes and Genomes pathways (KEGG, http://www.genome.jp/kegg) were annotated against the KEGG database using Blast all software (version:2.2.23, parameters:default). In addition, the sequences were annotated by aligning them in the Cluster of Orthologous Groups of proteins (KOG, https://www.ncbi.nlm.nih.gov/COG/), and the manual annotation and reviewing of protein sequences were conducted with the SwissProt (http://www.expasy.ch/sprot) and Protein family databases (Pfam, https://www.ebi.ac.uk/interpro/entry/pfam/). The Plant Transcription Factor Database (Plant TFDB) and PlnTFDB were used to annotate and classify the transcription factors (TFs) using iTAK (v1.7a).
2.4 Analysis of differentially expressed genes
Using ‘Luyu No. 1’ flowers as the control, transcriptome data from ‘Honghua’ flowers were analyzed via high-throughput sequencing technology. The number of reads per gene was quantified based on alignment results and gene location information on the Lonicera japonica reference genome. Gene expression levels were calculated as fragments per kilobase of transcript per million fragments mapped (FPKM), normalized by gene length and mapped read count. Differential expression analysis between the two groups was performed using DESeq2 version 1.22.1. The false discovery rate (FDR) was estimated by adjusting p-values with the Benjamini- Hochberg method. Differentially expressed genes (DEGs) were identified using thresholds of |log2Fold Change| ≥ 1.5 and FDR < 0.05. Subsequently, GO function enrichment, KOG annotation, and KEGG pathway enrichment analyses were conducted for the DEGs.
2.5 Real−time quantitative RT-PCR analysis
Real-time quantitative PCR (RT-qPCR) was employed to validate the reliability of the RNA-seq results. Seven key candidate genes, which play critical roles in flavonoid metabolism, were selected for analysis. The same RNA samples used in the transcriptome analysis were reverse transcribed into cDNA using the HiScript® II Q RT SuperMix for qPCR (+gDNA wiper) kit (Vazyme Biotech Co., Ltd., Nanjing, China). Primers were designed using Primer Premier 5.0 software and synthesized by Shanghai Shenggong Biotechnology Co., Ltd. The primer sequences are listed in Supplementary Table S1. The constitutively expressed honeysuckle Actin gene (GenBank: KY114518) was used as an internal control for normalizing gene expression levels. Real-time PCR was performed in a 20 μL reaction mixture containing 50 ng of template cDNA, 10 μL of 2× Universal SYBR Green Fast qPCR Mix (ABclonal Technology Co., Ltd., Wuhan, China), 0.4 μL of each primer, and ddH2O. Amplification was carried out on the qTOWER Real-Time PCR Instrument (Analytik Jena AG, Germany) under the following thermal cycling conditions: 95 °C for 3 min, followed by 40 cycles of 95 °C for 5 s and 60 °C for 30 s. Relative gene expression levels were calculated using the 2−ΔΔCt method. To ensure reproducibility and reliability, three independent biological replicates per sample and three technical replicates per biological replicate were conducted.
2.6 Sample preparation and LC-MS
The flowers were freeze-dried (Scientz-100F) and ground into powder (Retsch MM 400). Approximately 50 mg of the powder was mixed with 1.2 mL of 70% methanol, vortexed for 30 s every 30 min over six cycles, and centrifuged at 12,000 rpm for 3 min. The supernatant was filtered (SCAA-104, 0.22 μm) and analyzed by UPLC-ESI-MS/MS (UPLC: Shimadzu Nexera X2; MS: Applied Biosystems 6500 Q TRAP). Conditions included an Agilent SB-C18 column (1.8 µm, 2.1 mm × 100 mm), mobile phase of water (A, 0.1% formic acid) and acetonitrile (B, 0.1% formic acid), and a gradient program starting at 95% A/5% B. Within 9 min, the gradient reached 5% A/95% B and was maintained for 1 min before reverting to 95% A/5% B within 1.1 min and held for 2.9 min. Flow rate was 0.35 mL/min, column temperature 40 °C, and injection volume 2 μL. ESI source parameters: temperature 500 °C, ion spray voltage 5500 V (positive)/-4500 V (negative), gases set to 50/60/25 psi, and CAD high.
2.7 Metabolome analysis
Principal component analysis (PCA) was performed using the PrComp function (v3.5.1). Differential metabolites were identified based on variable importance in projection (VIP ≥ 1) and absolute log2 fold change (|log2FC| ≥ 1.0). VIP values were derived from orthogonal partial least squares discriminant analysis (OPLS-DA) results using the R package MetaboAnalystR (v1.0.1). Prior to OPLS-DA, the data were preprocessed with log2 transformation and mean centering. To ensure model reliability and prevent overfitting, a permutation test was conducted with 200 permutations.
2.8 Comprehensive integrated analysis of transcriptional and metabolic profiles
Based on the identification of differentially expressed genes and metabolites involved in flavonoid metabolism, transcriptomic and metabolomic data were integrated and mapped onto the KEGG pathway diagram to further elucidate the relationships between these genes and their corresponding metabolites.
2.9 Statistical analysis
All experimental data were presented in triplicate. Data analysis was performed using SPSS 17.0 software. All data are expressed as mean ± standard deviation (SD). Comparisons between and within groups were conducted using Duncan’s multiple range test. Student’s t-test was applied to calculate P-values, with P < 0.05 indicating statistically significant differences.
3 Results
3.1 RNA-seq analysis
To summarize the transcriptomic differences between ‘Luyu No. 1’ and ‘Honghua’ flowers, six cDNA samples per type (three biological replicates each) were sequenced using Illumina NovaSeq6000. After quality control, 290.78 million clean reads were obtained, with Q30 values of 95.27%–96.88% and GC content of 44.97%–45.19%. The reads were aligned to the Lonicera japonica reference genome, resulting in mapping rates of 94.74%–95.91% (Supplementary Table S2). To assess the reliability of transcriptome sequencing data, Pearson correlation analysis was performed on flower samples of ‘Luyu No. 1’ and ‘Honghua’ during the Dabai stage. The correlation coefficient (0.82 < R² < 1, Figure 1B) indicated high gene homogeneity across the six samples. These results confirmed the high quality and integrity of the RNA-seq data, ensuring their suitability for subsequent analyses.
3.2 DEG analysis of ‘Luyu No. 1’ and ‘Honghua’
To identify DEGs, a comparative transcriptome analysis was conducted between ‘Luyu No. 1’ and ‘Honghua’ buds, with ‘Luyu No. 1’ as the control. A total of 5901 DEGs were detected (Supplementary Table 2), including 2799 up-regulated and 3102 down-regulated genes (Figure 1C), indicating significant differences in gene expression patterns.
The Gene Ontology (GO) database categorizes genes into three main groups: Cellular Component (CC), Biological Process (BP), and Molecular Function (MF). GO annotation revealed that DEGs were classified into these three categories. GO enrichment analysis further showed that among the top 20 enriched terms, defense response (1287 DEGs), ADP binding (738 DEGs), and lipid droplet (670 DEGs) were prominent (Figure 2A).
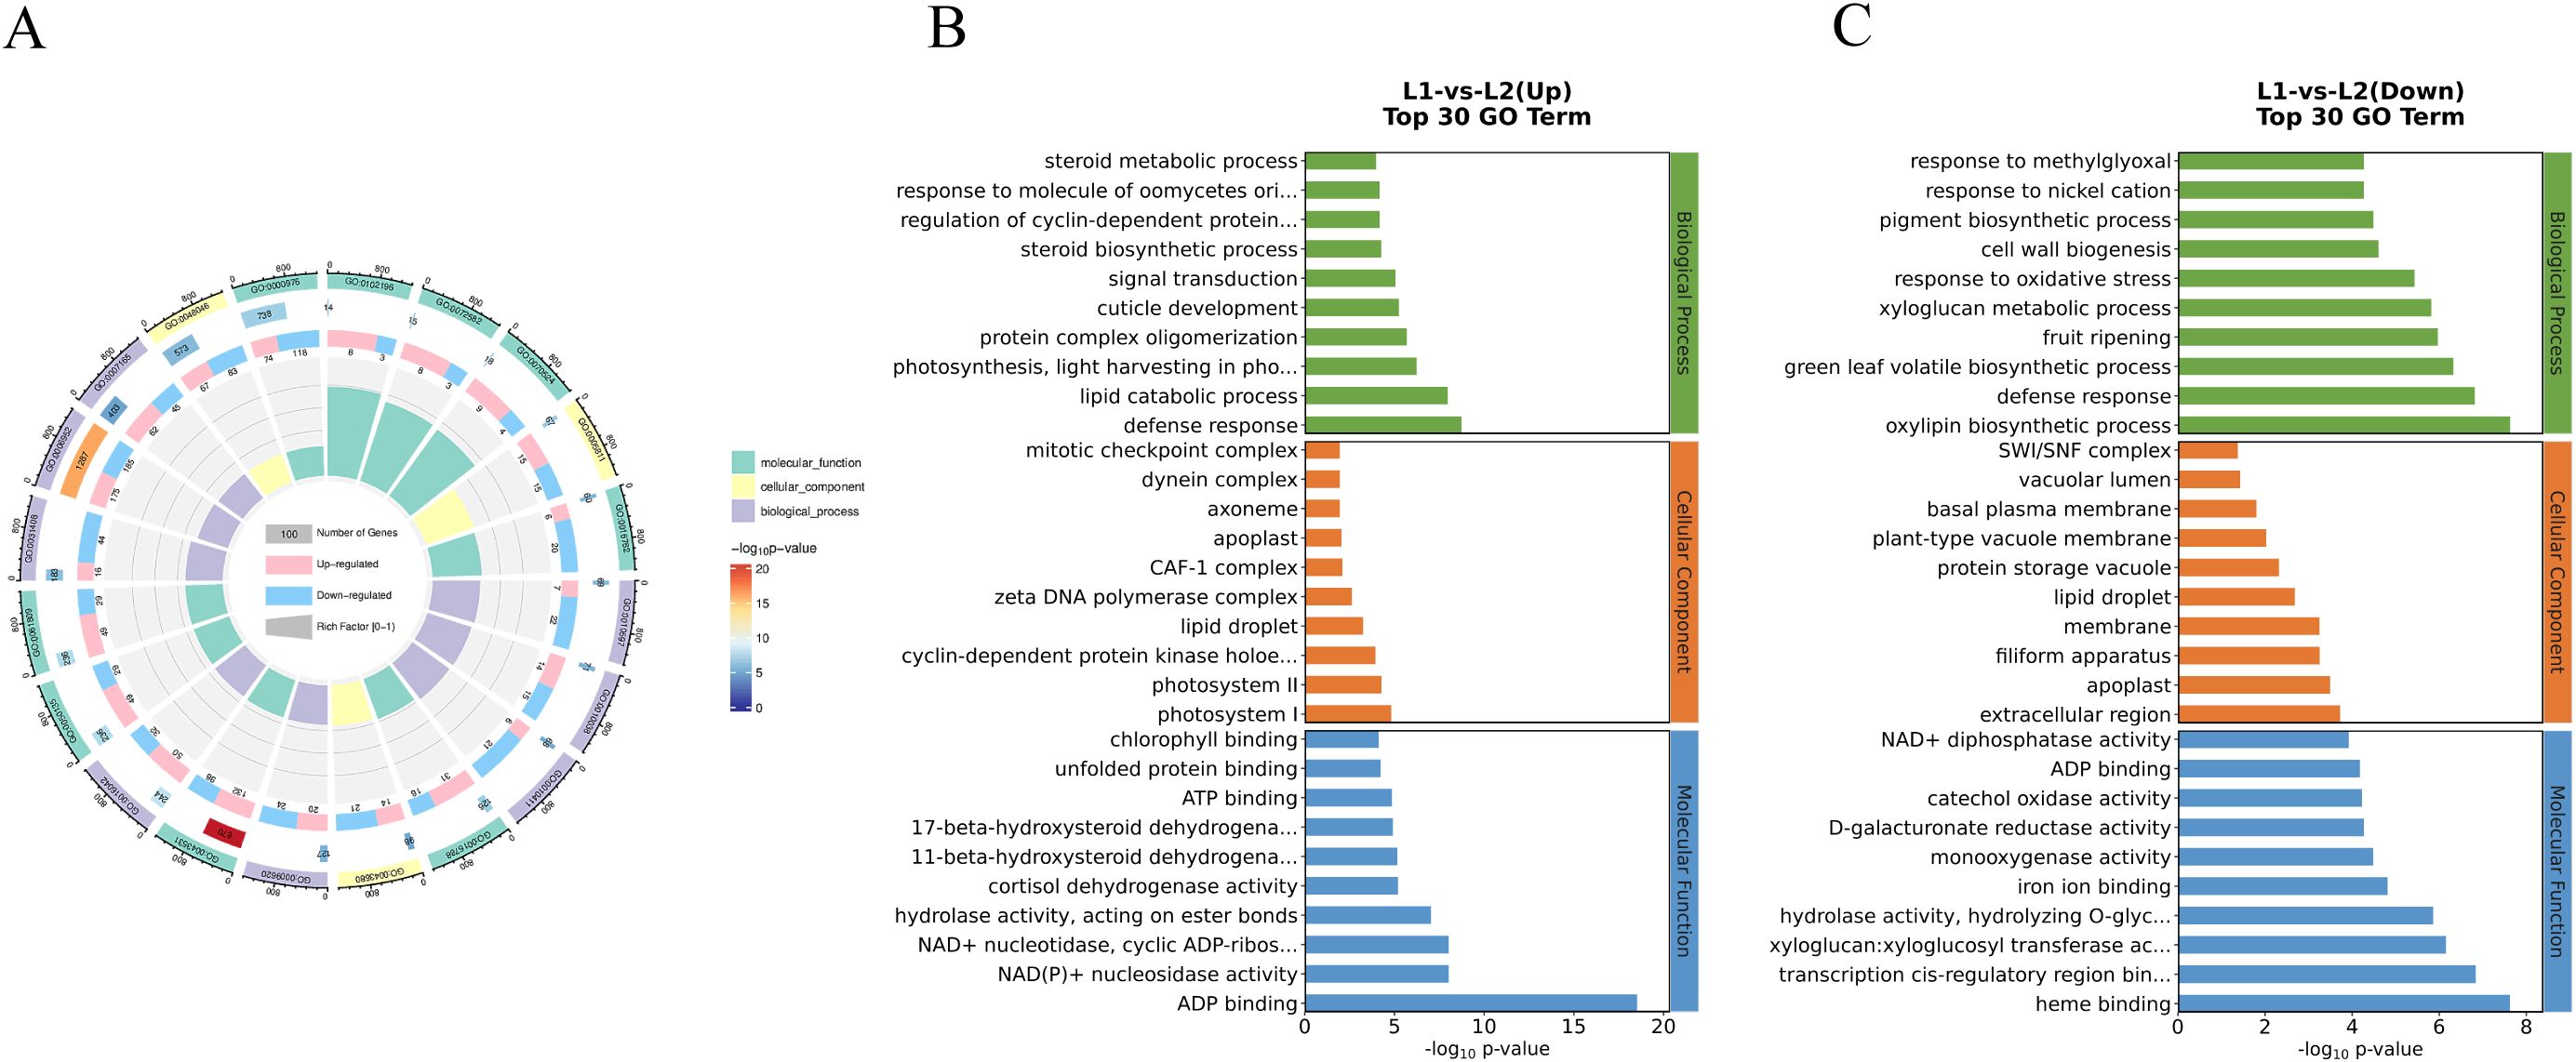
Figure 2. GO enrichment of DEGs. (A) Total DEGs of ‘Honghua’ and ‘Luyu No.1’, (B) Up DEGs of ‘Honghua’ and ‘Luyu No.1’, (C) Down DEGs of ‘Honghua’ and ‘Luyu No.1’.
For up-regulated DEGs, ATP-binding and defense response were the primary subcategories (Figure 2B). For down-regulated DEGs (Figure 2C), extracellular region, membrane and apoplas were notable in CC; oxylipin biosynthetic process, defense response, and green leaf volatile biosynthetic process were key in BP; heme binding, transcription cis-regulatory region binding and xyloglucan:xyloglucosyl transferase activity were abundant in MF.
KEGG analysis annotated 112 pathways, with significant enrichment in metabolic pathways, carbohydrate metabolism, amino acid metabolism, lipid metabolism, secondary metabolite biosynthesis, terpenoid and polyketide metabolism, and xenobiotics biodegradation. Notably, the 20 most enriched pathways included phenylpropanoid biosynthesis, alpha-linolenic acid metabolism, flavonoid biosynthesis, terpenoid backbone biosynthesis, and carotenoid biosynthesis (Figure 3A). These results suggest that DEGs may influence bioactive compound accumulation in flowers.
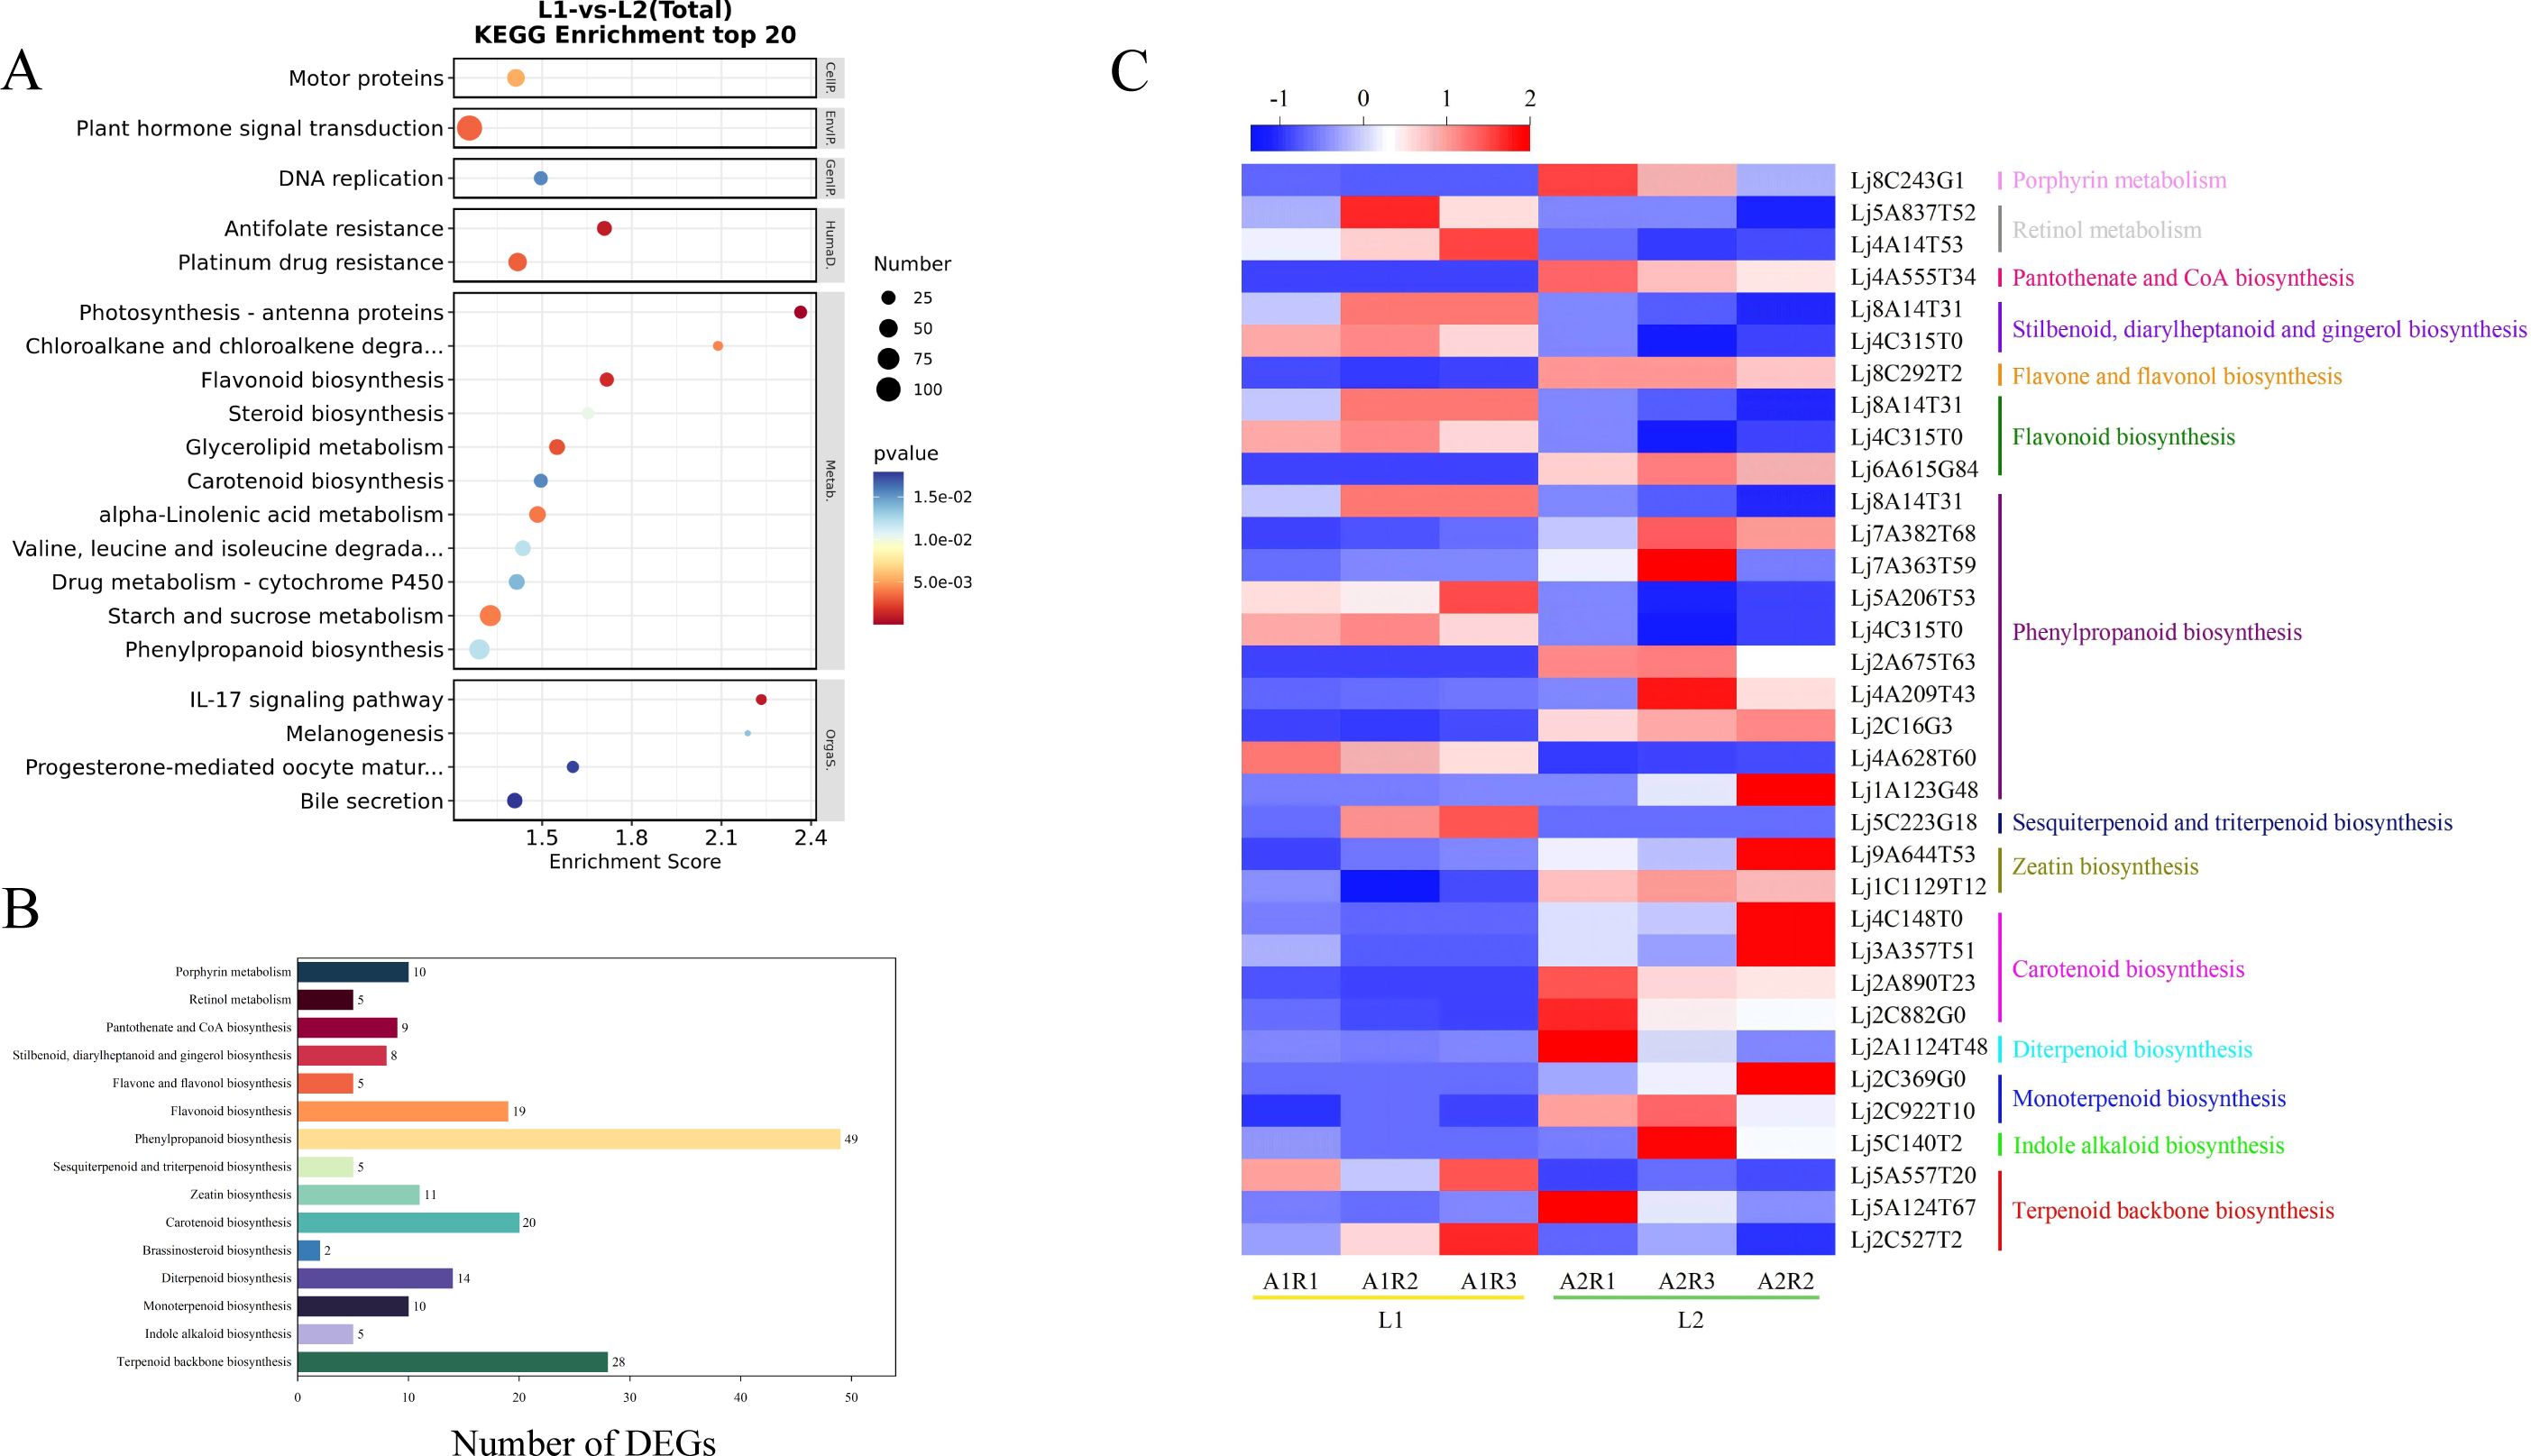
Figure 3. (A) KEGG analysis of DEGs, (B) The KEGG pathways of DEGs related to bioactive ingredients metabolism, (C) Heatmap of 34 DEGs related to metabolism of active ingredients.
3.3 Analysis of DEGs related to the metabolism of bioactive ingredients
A total of 112 metabolic pathways were identified in the KEGG database, including 26 pathways related to bioactive compound metabolism. Among these, phenylpropanoid biosynthesis had the most DEGs (187), followed by flavonoid metabolism (66 DEGs) and vitamin metabolism (45 DEGs). The terpenoid metabolic pathway, which includes backbone, monoterpene, diterpene, brassinosteroid, carotenoid, zeatin, and sesquiterpene/triterpene biosynthesis, contained 90 DEGs (Figure 3B). These results suggest that many candidate genes are involved in the metabolism of bioactive compounds such as flavonoids and terpenoids in flowers.
Based on KEGG annotation and NR/PubMed databases, 34 DEGs related to bioactive compound metabolism were identified (Table 1). Transcriptome FPKM analysis (Figure 3C) showed that compared to ‘Honghua’, ‘Luyu No. 1’ had higher expression of 13 genes and lower expression of 21 genes. Key enzymes included four for carotenoid biosynthesis (abscisic-aldehyde oxidase, aldehyde oxidase 4, 15-cis-zeta-carotene isomerase, abscisic acid 8’-hydroxylase CYP707A1) and two for zeatin biosynthesis (zeatin O-glucosyltransferase, cytokinin dehydrogenase 6). One gene each was identified for monoterpenoid, diterpenoid, indole alkaloid, pantothenate/CoA, and flavone/flavonol biosynthesis. Notably, all these DEGs were downregulated in ‘Luyu No. 1’.
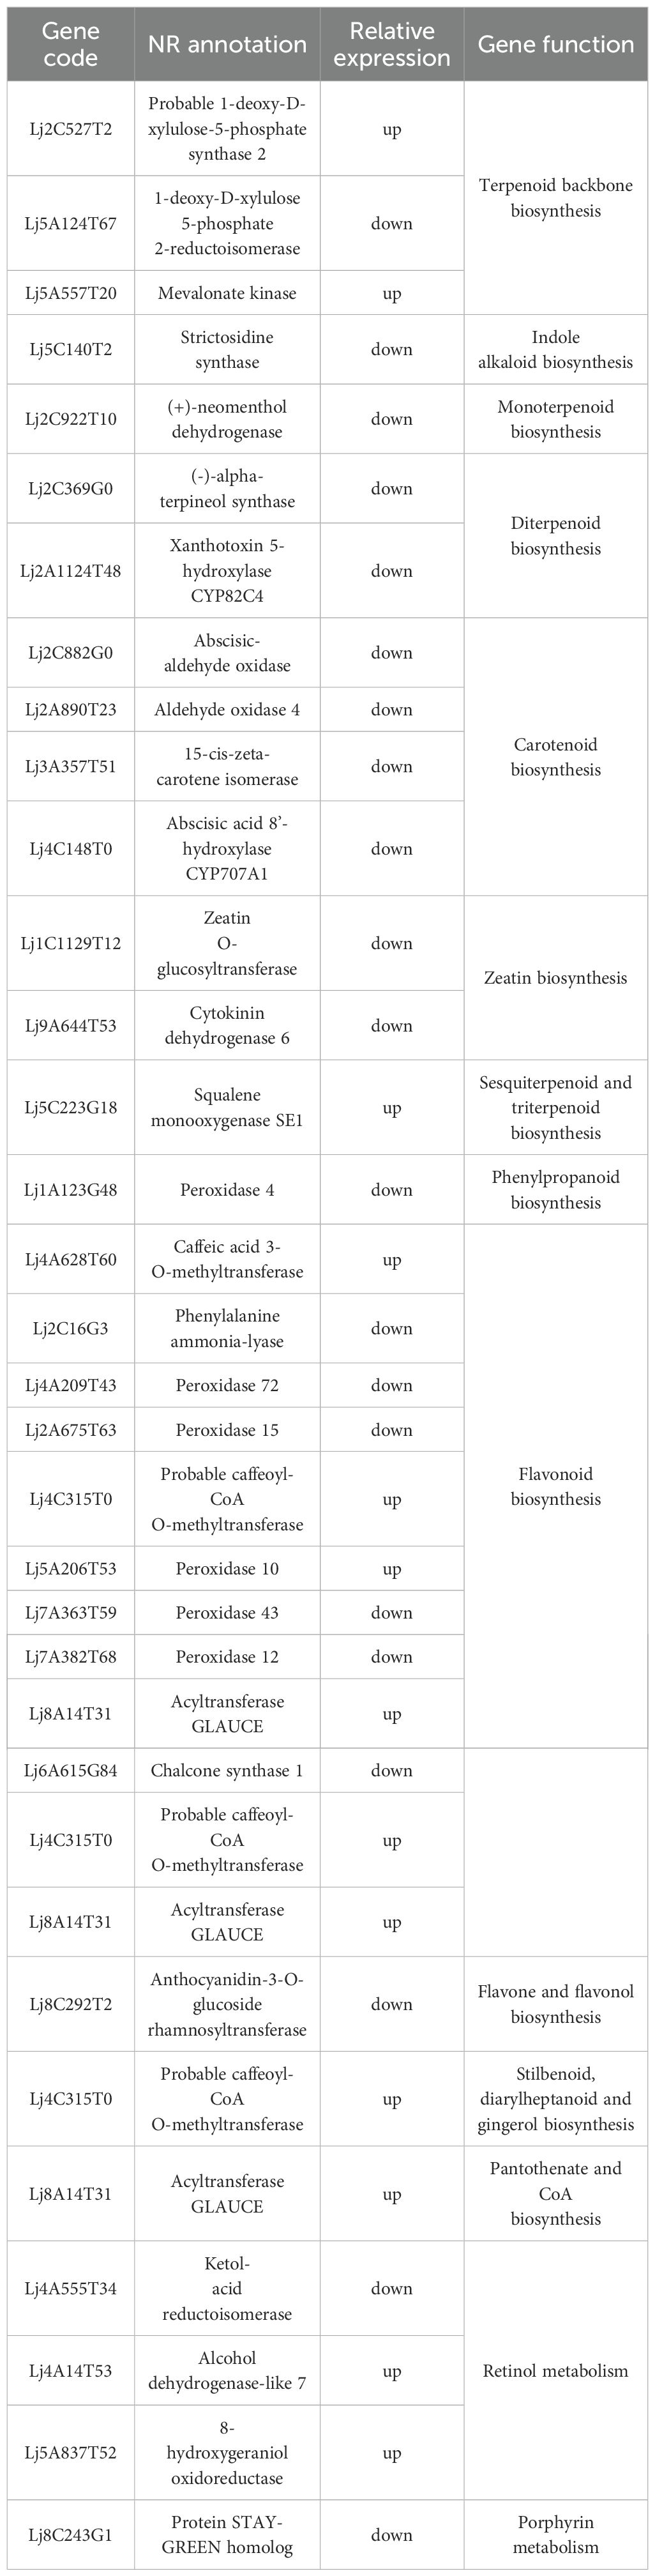
Table 1. DEGs related to bioactive ingredients metabolism.
Additionally, 49 genes encoding 10 enzymes in the phenylpropanoid biosynthesis pathway were identified, including peroxidases (4, 72, 15, 10, 43, 12), caffeic acid 3-O-methyltransferase, phenylalanine ammonia-lyase, caffeoyl-coao-methyltransfer ase, and acyltransferase GLAUCE. Other notable genes included three for terpenoid backbone biosynthesis, three for flavonoid biosynthesis, two for porphyrin metabolism, two for stilbenoid/diarylheptanoid/gingerol biosynthesis, and one for sesquiterpene/triterpene biosynthesis and retinol metabolism. Genes involved in stilbenoid/diarylheptanoid/gingerol biosynthesis, retinol metabolism, and sesquiterpene/triterpene biosynthesis were upregulated in ‘Luyu No. 1’ (Figure 3C).
3.4 Analysis of transcription factors related to bioactive ingredient metabolism
Transcription factors (TFs) regulate plant metabolism, growth, development, and stress responses by modulating gene expression. This study identifies TFs involved in the biosynthesis of active components in honeysuckle by analyzing transcriptome data from ‘Luyu No. 1’ and ‘Honghua’, providing insights into their mechanisms. In the transcriptome data, 1,586 unigenes were annotated as TFs, representing 67 families (Figure 4).
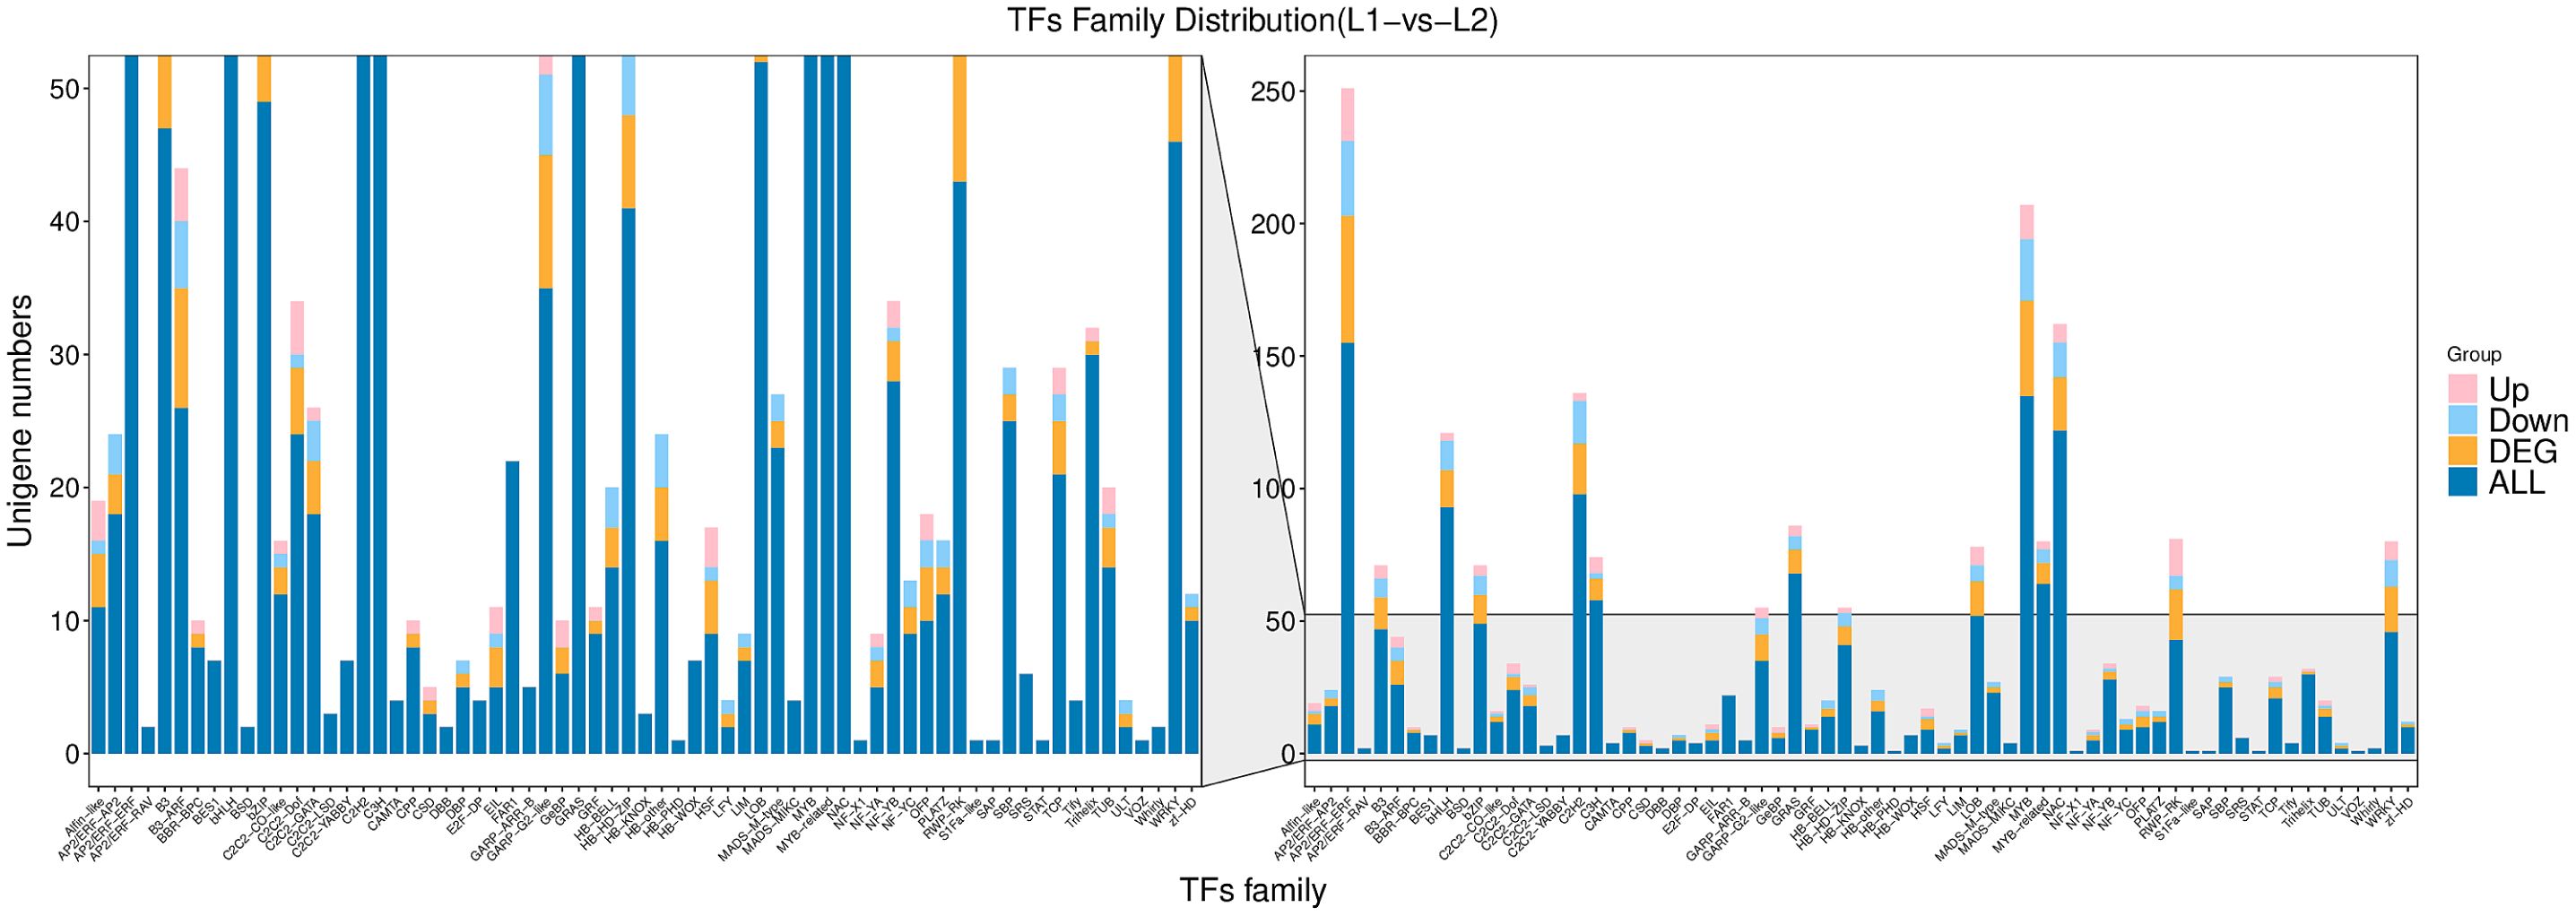
Figure 4. Transcription factors family distribution of ‘Honghua’ vs ‘Luyu No.1’.
The top 10 families include AP2/ERF-ERF (155), MYB (135), NAC (122), C2H2 (98), bHLH (93), GRAS (68), MYB-related (64), C3H (58), LOB (52), and bZIP (49). Enrichment analysis showed that 27 TF families are involved in flavonoid biosynthesis. Among these, seven differentially expressed TFs were identified: MYB3 (Lj4A178G43), MYB4 (Lj3A874T74), MYB20 (Lj3A1064T98), EOBII (Lj7A593T47, Lju41A37T46), NAC078 (Lju124C9T3), and TCP15 (bHLH Lj9C462T10). Compared to ‘Luyu No. 1’, TCP15 was significantly downregulated in ‘Honghua’, while other TFs were upregulated (Figure 4).
3.5 Analysis of metabolome between ‘Luyu No. 1’ and ‘Honghua’
Metabolome analysis identified 1,950 differentially available metabolites (DAMs) (Supplementary 3). Samples from ‘Luyu No. 1’ and ‘Honghua’ showed distinct clustering via Pearson’s correlation coefficient-based PLS-DA, with significant inter-group separation and good intra-group reproducibility confirmed by quality control samples (Figure 5A). The metabolites were predominantly flavonoids, phenolic acids, terpenoids, lignans, coumarins, amino acids and derivatives, alkaloids, lipids, quinones, organic acids, nucleotides and derivatives, steroids, tannins, and others (Figures 5B, C).
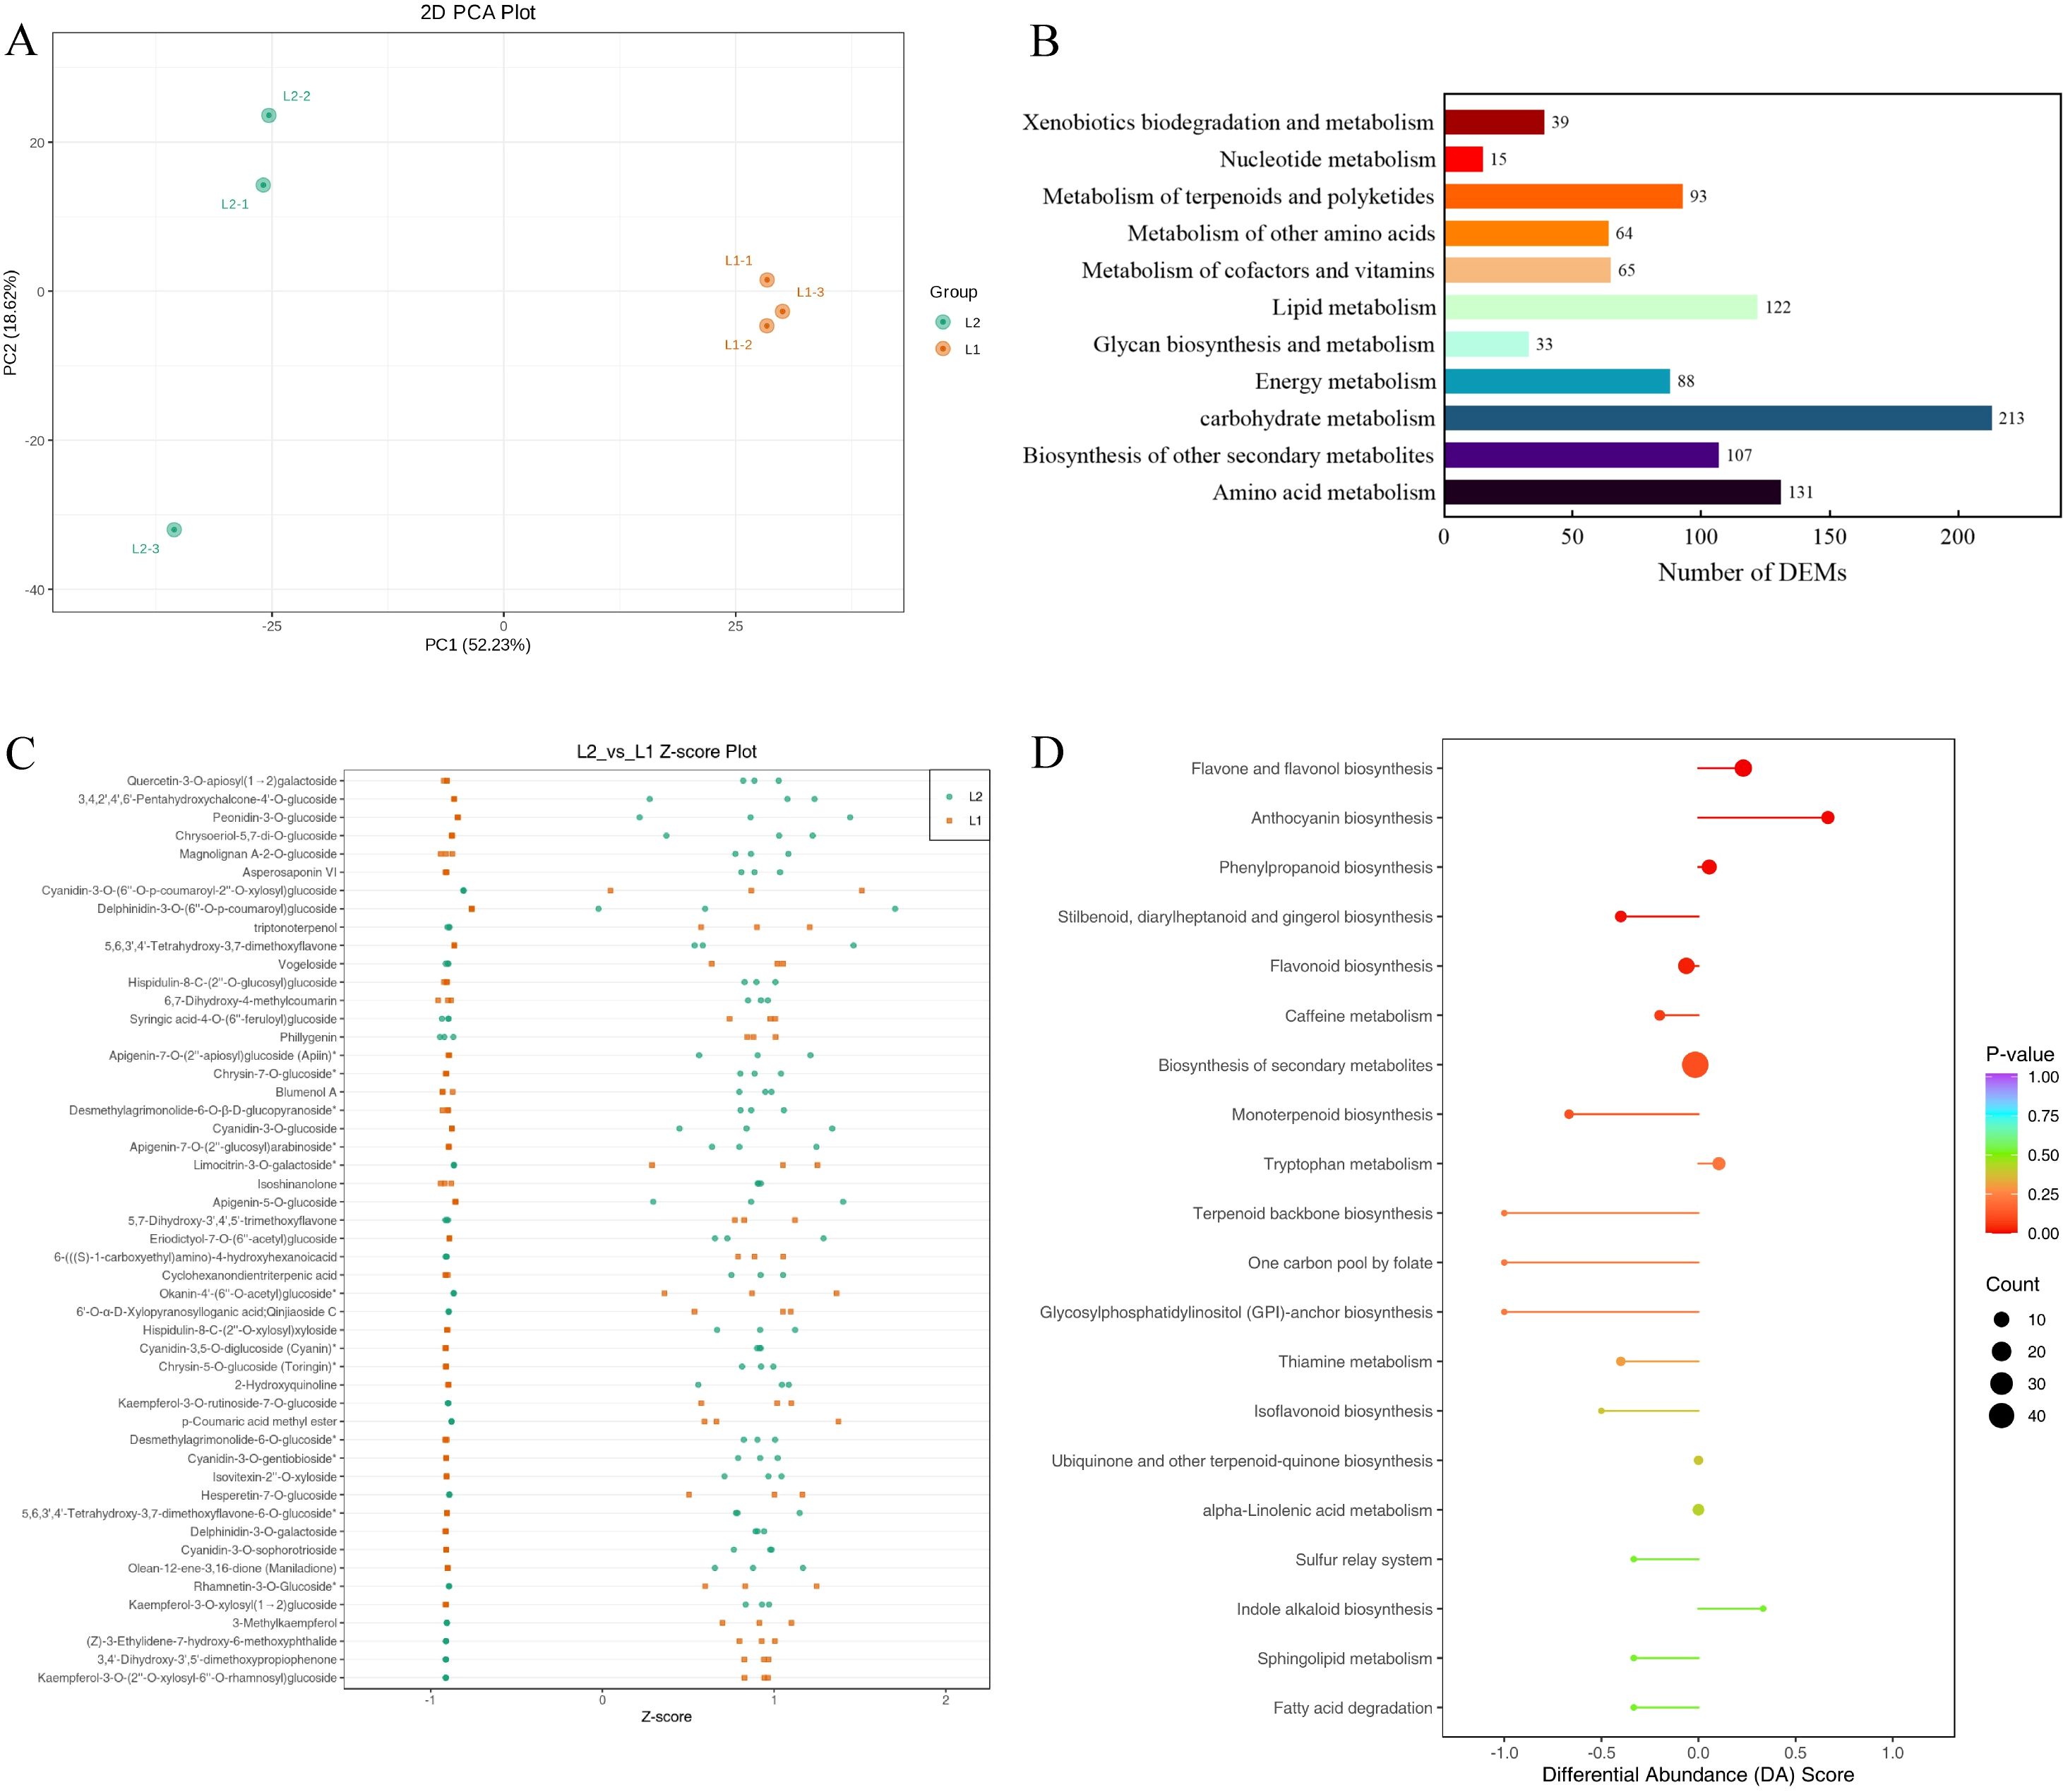
Figure 5. Metabolome analysis of ‘Honghua’ and ‘Luyu No.1’ flower in Dabai stage. (A) Scores scatter plot of the flower metabolome at Dabai stage as determined by PCA, (B) The KEGG pathways related to bioactive ingredients metabolism, (C) The distribution of differential metabolites among different groups, (D) Comprehensive analysis of global alterations in metabolic pathways.
Compared to ‘Luyu No. 1’, ‘Honghua’ exhibited up-regulation of 307 DAMs and down-regulation of 368 DAMs (Supplementary 3), with many belonging to phenolic acids and flavonoids (Figure 5D). These DAMs were enriched in pathways such as flavone/flavonol biosynthesis (Figure 6A), anthocyanin biosynthesis, phenylpropanoid biosynthesis (Figure 6B, flavonoid biosynthesis, and secondary metabolite biosynthesis, Table 2).
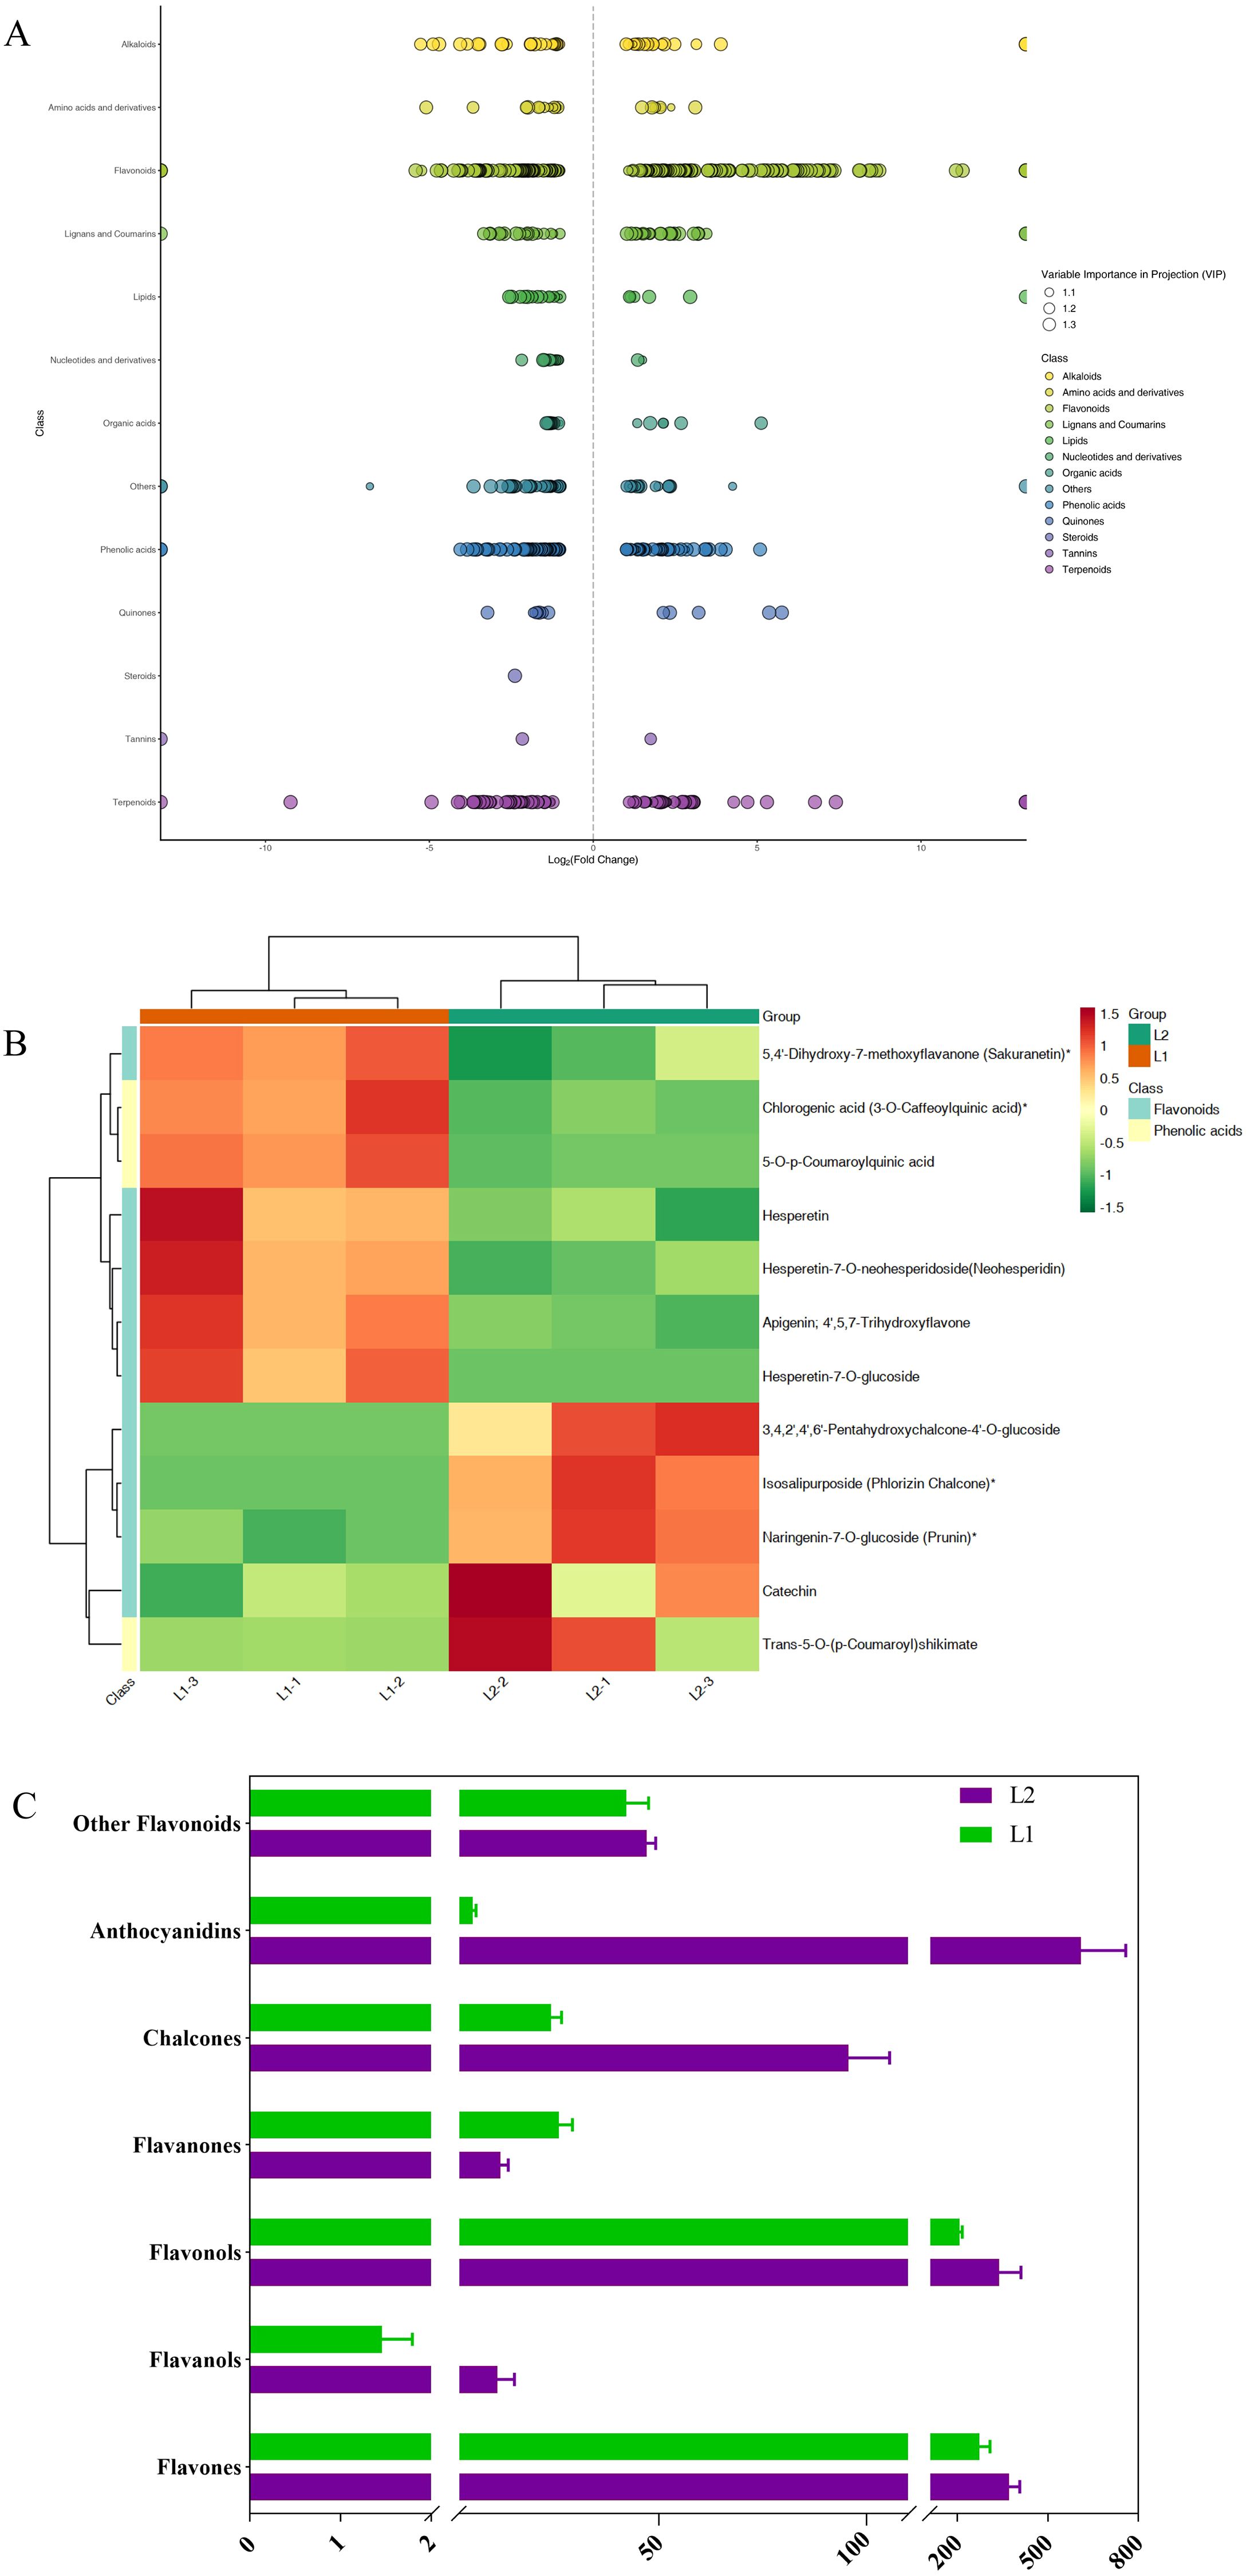
Figure 6. (A) Scatter plot of differential metabolites, (B) Clustered heatmap of differential metabolites in the ko00940 pathway, (C) Relative content of different flavonoid categories, L1: ‘Luyu No.1’; L2: ‘Honghua’.
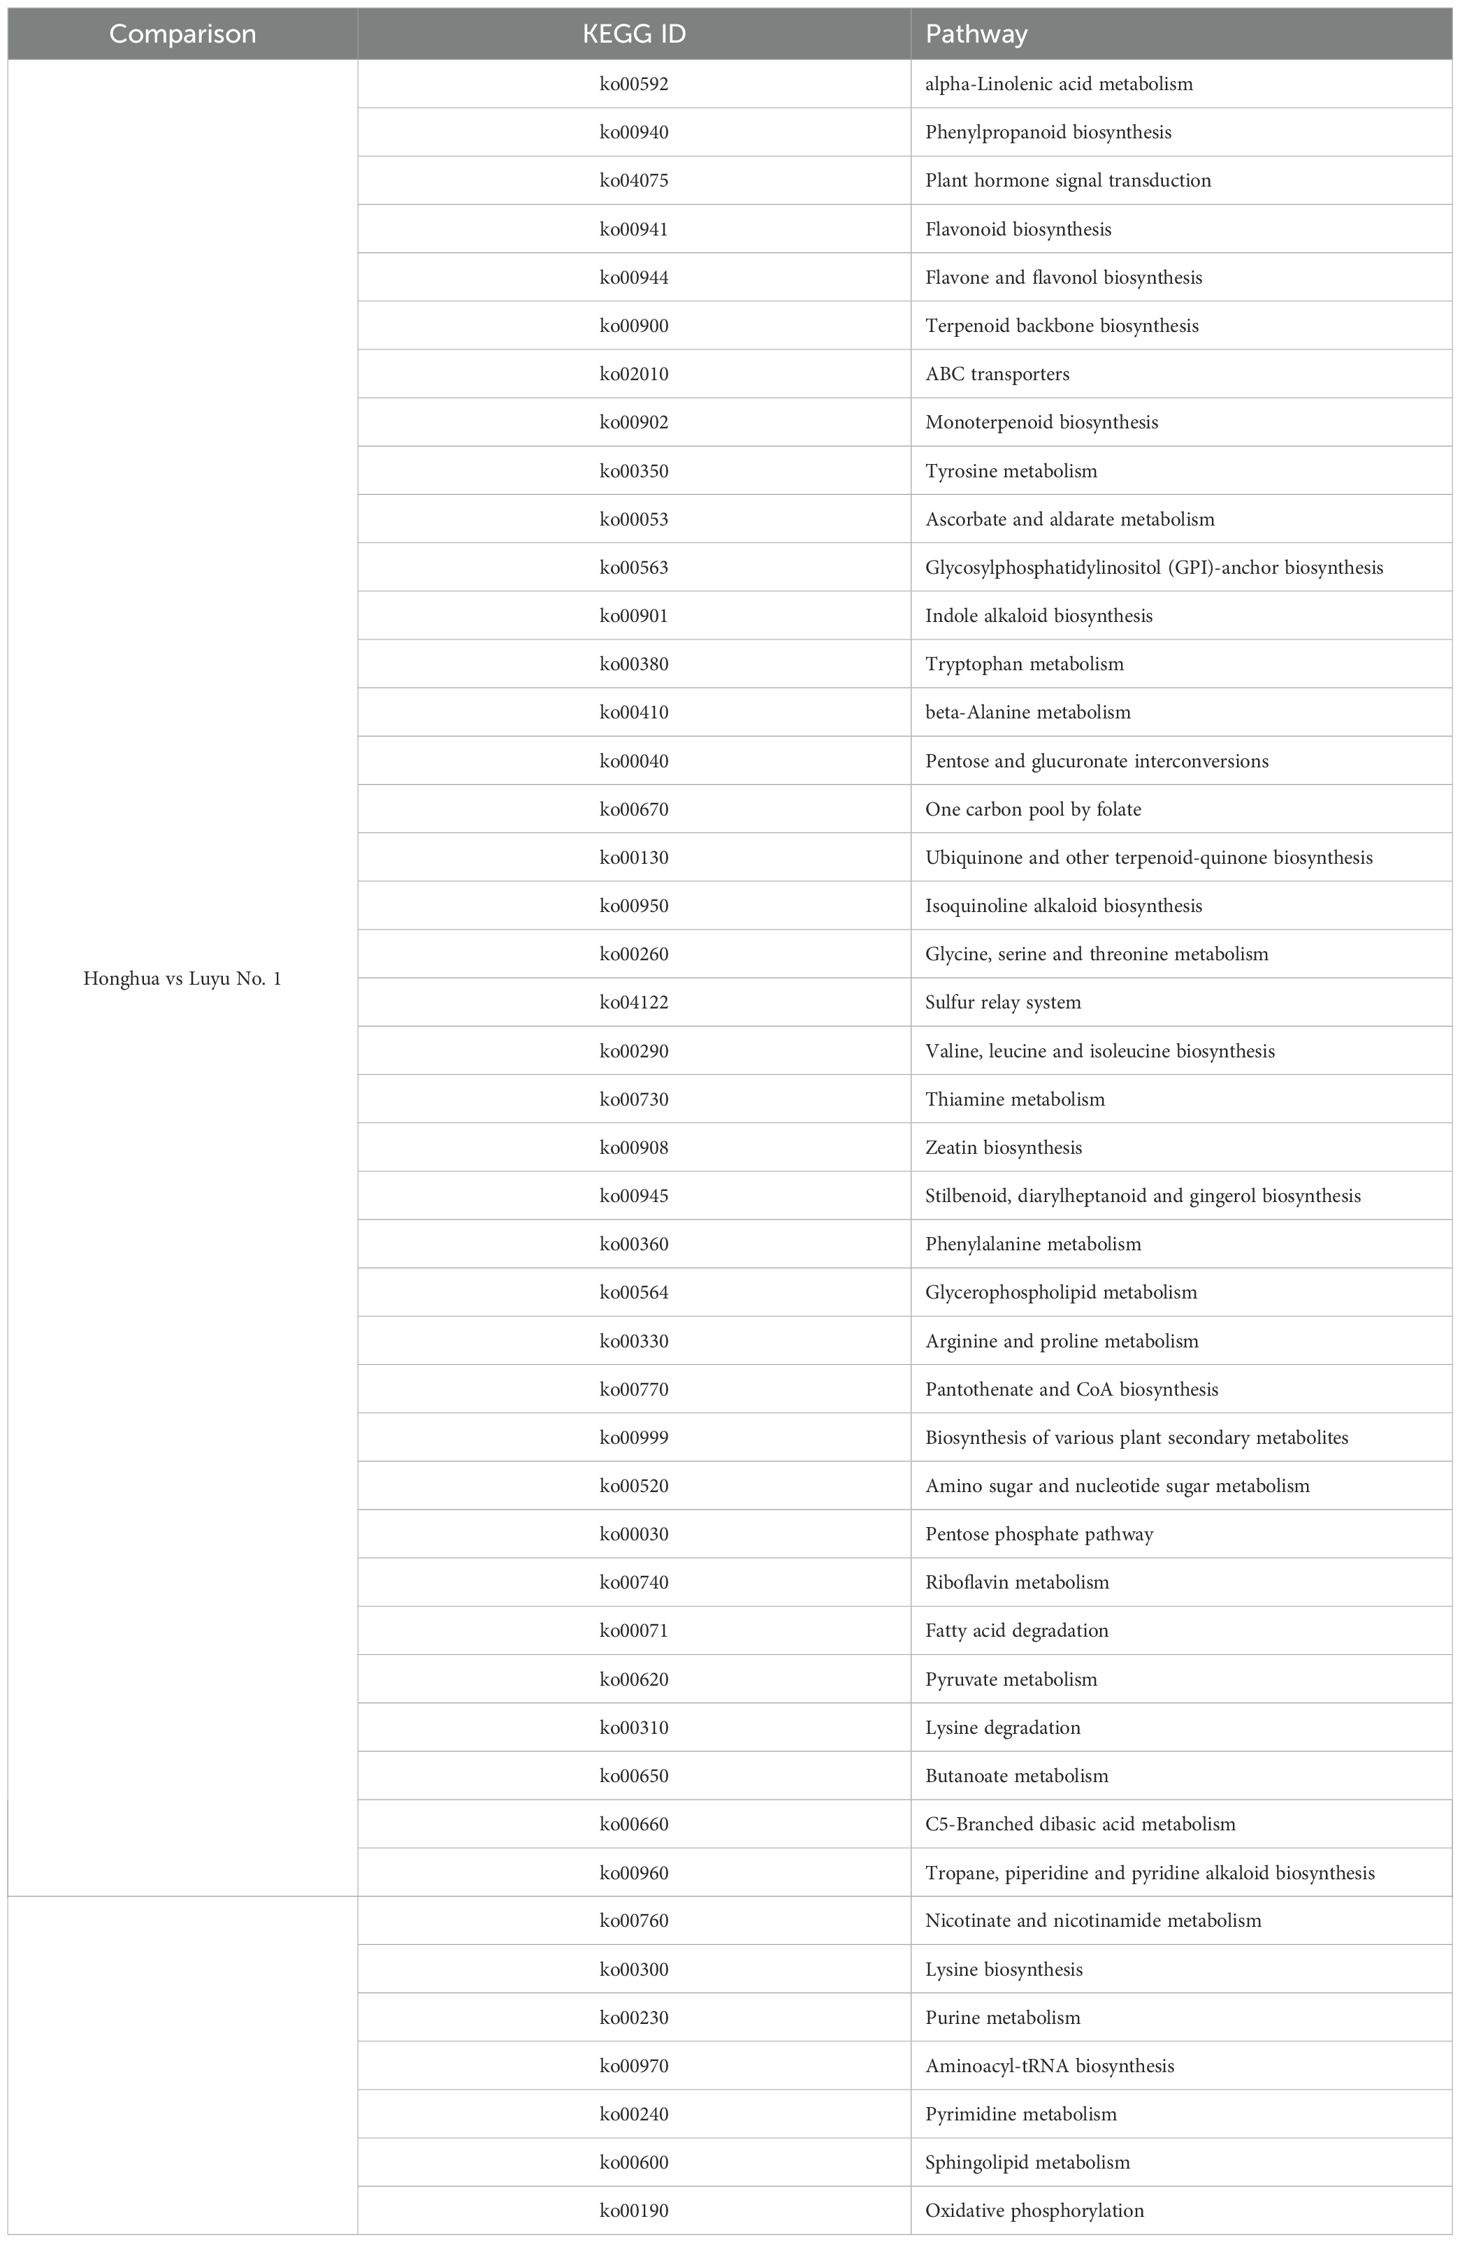
Table 2. Common enriched pathway of DEGs and DEMs between Honghua vs Luyu No. 1.
Flavonoids are the primary secondary metabolites in honeysuckle, with 227 detected in this study. As shown in Figure 6C, ‘Honghua’ had 2.32 times the total flavonoid content of ‘Luyu No. 1’. Flavonoids were classified into flavones, flavanols, flavonols, flavanones, chalcones, anthocyanins, and others. Comparative analysis revealed higher levels of flavones, flavanols, anthocyanidins, chalcones, and flavonols in ‘Honghua’. Specifically, anthocyanidins, flavanols, and chalcones were 87.58 times, 7.66 times, and 6.17 times higher, respectively (Figure 6C).
3.6 Integrated transcriptome and targeted-metabolome analysis
To elucidate the differences between ‘Luyu No. 1’ and ‘Honghua’, an integrated analysis of gene expression and metabolite accumulation was performed. Differentially expressed genes (DEGs) and metabolites (DEMs) were mapped to KEGG pathways, revealing 25 significantly enriched pathways in Honghua compared to Luyu No. 1 (Figure 7A).
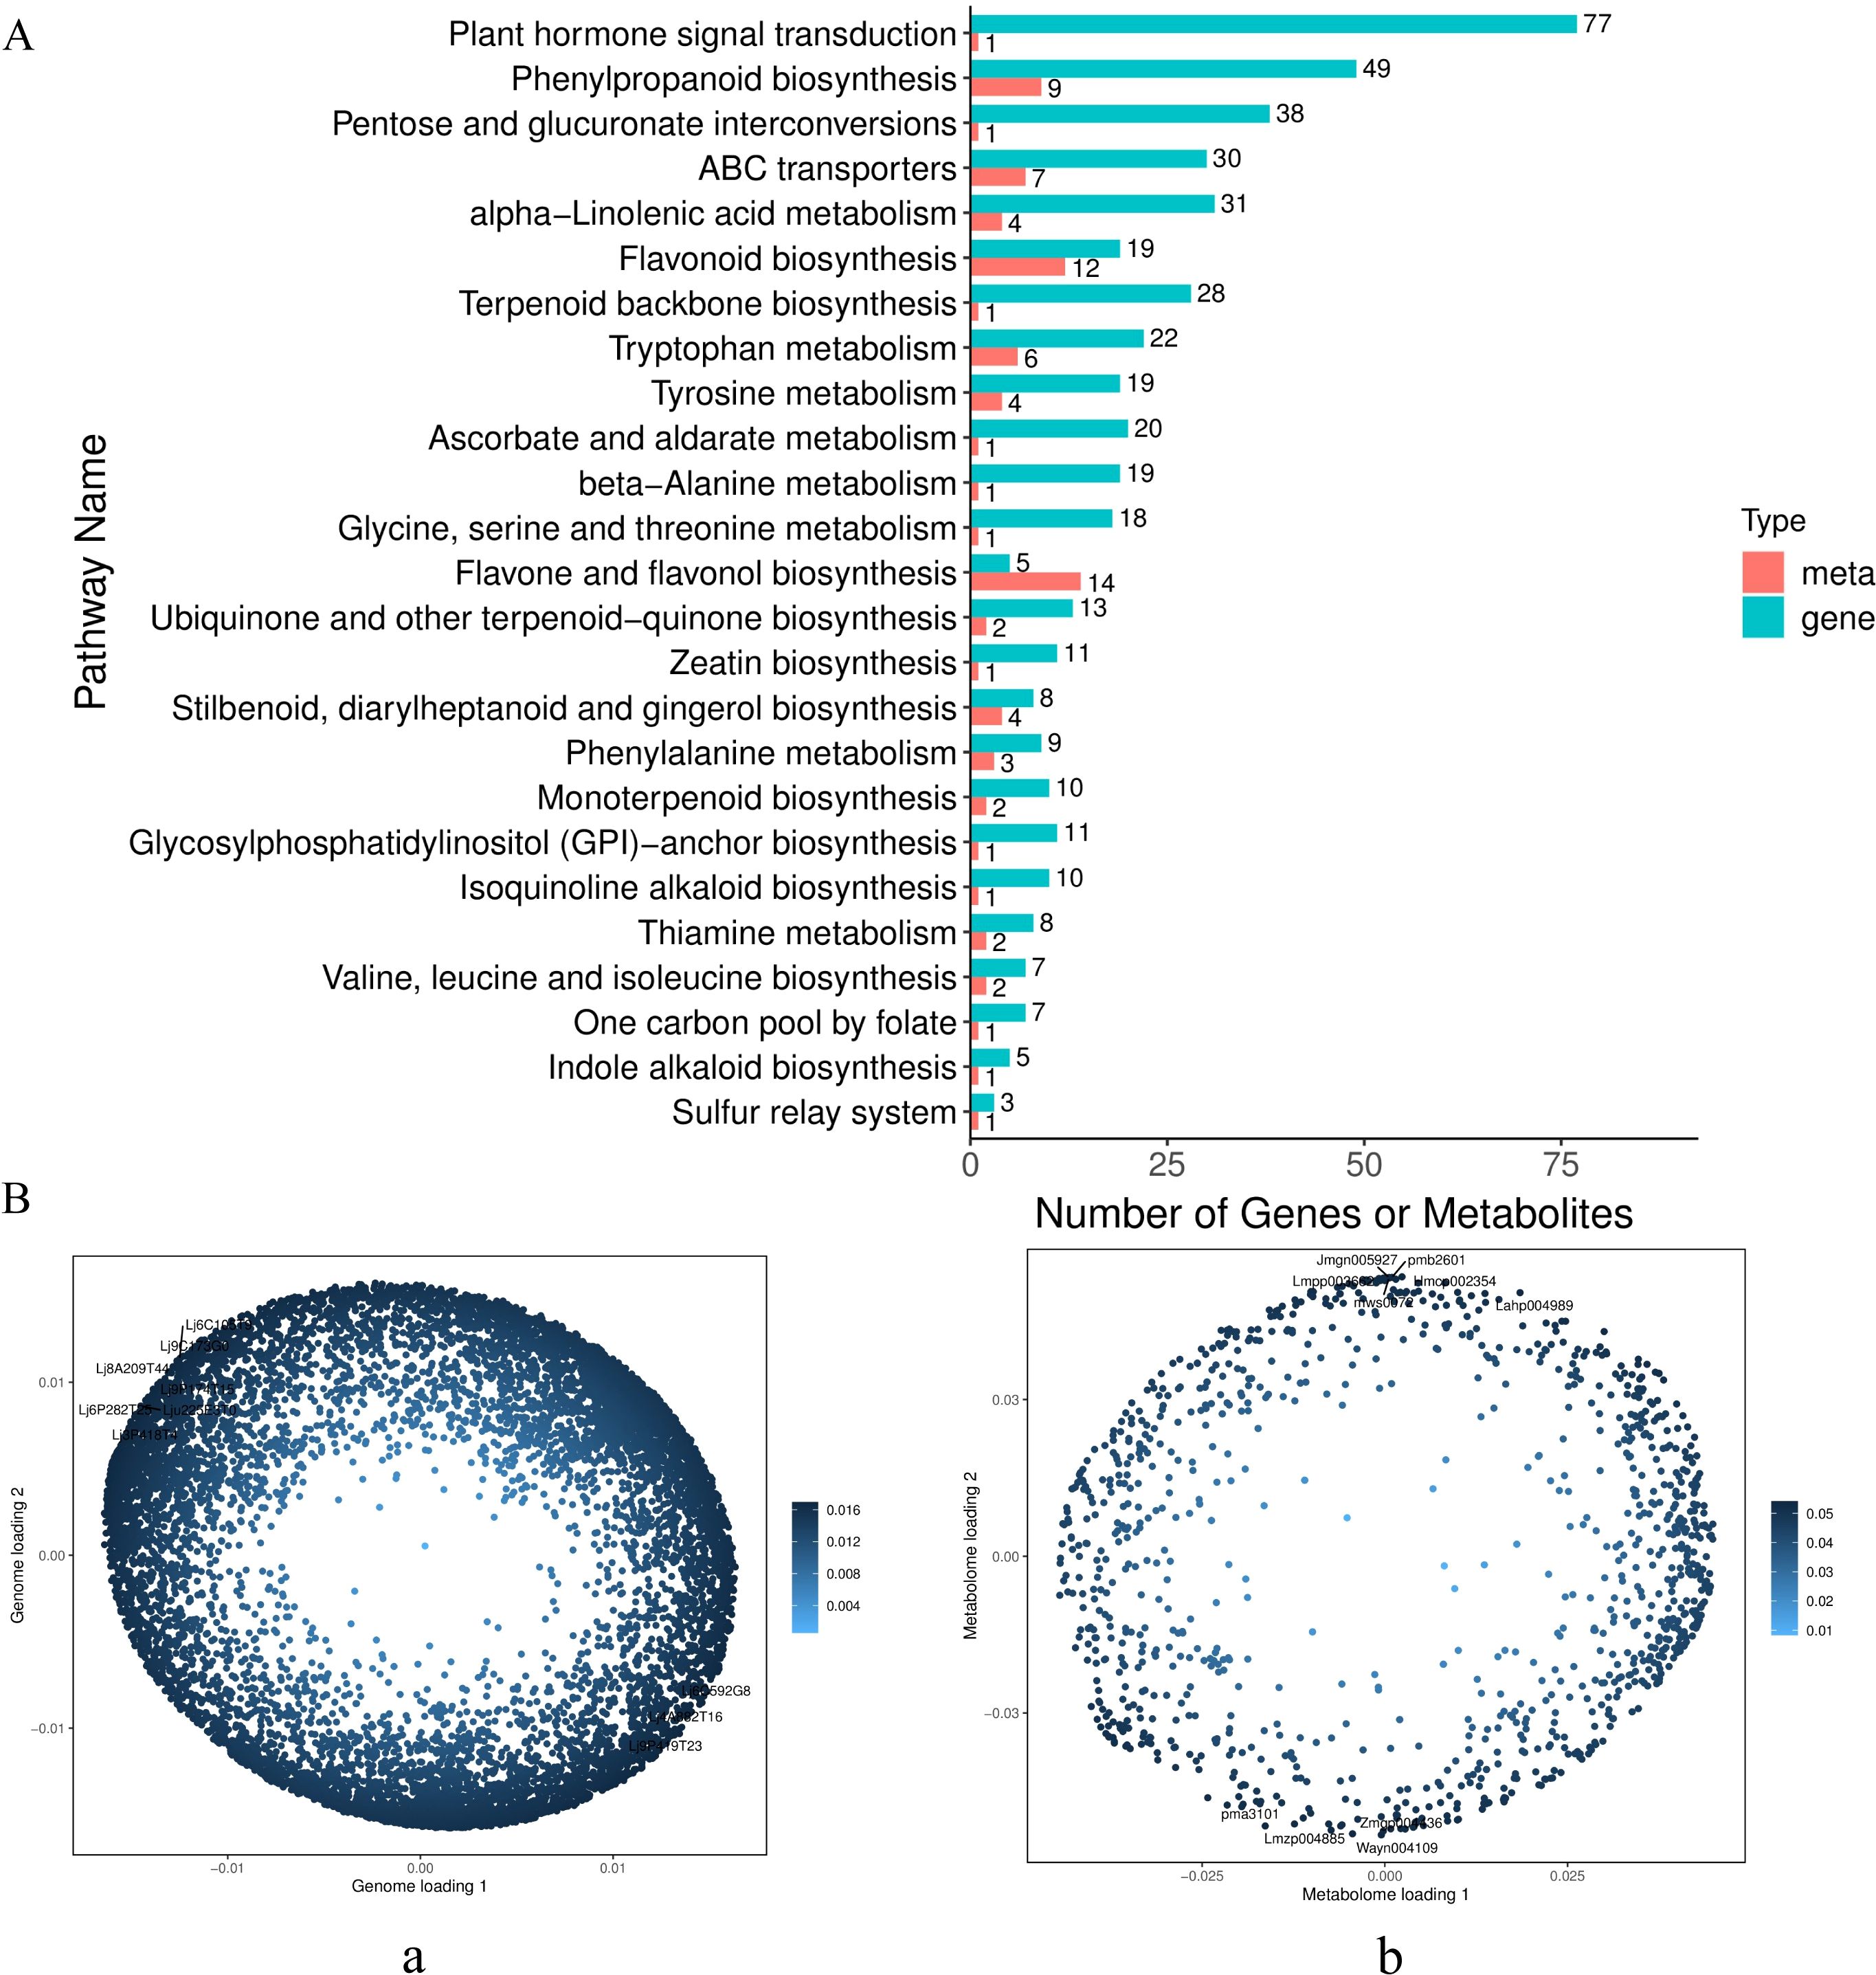
Figure 7. Transcriptome-metabolome correlation analysis. (A) KEGG enrichment correlation analysis of Honghua vs Luyu No.1 (B) Left, transcriptome loading plot (a) (The first ten load gene IDs Lj9P419T23, Lj6C592G8, Lj8A209T44, Lj6P282T25, Lj9C173G0, Lj6C105T9, Lju225E3T0, Lj3P418T4, Lj9P174T15, Lj4A882T16); right, metabolome loading plot (b) (The first ten load meta IDs pma3101, Lahp004989, Hmcp002354, pmb2601, Jmgn005927, Wayn004109, Zmgp004436, Lmzp004885, mws0072).
For further insights, Orthogonal Projections to Latent Structures (O2PLS) modeling was applied to identify variables with high correlations across datasets. The loadings plots highlighted significant variables influencing phenological indicators. The distance from the origin or bar height represented the strength of correlation, with darker colors indicating stronger correlations. Among the top 10 substances influencing other omics layers, six flavonoids were identified: 3,7,3’-tri-O- methylquercetin-4’-O-β-D-apiofuranosyl-(1→2)-O-β-D-glucopyranoside (Lahp004989), 2-hydroxynaringenin (Jmgn005927), okanin-4’-(6’’-O-acetyl) glucoside (Zmgp004436), tricin (Lmzp004885), apigenin-5-O-glucoside (mws0072), and delphinidin-3-O-(6’’-O-p-coumaroyl) glucoside (Lmpp003662) (Figure 7B).
Given the significant differences observed, flavonoid biosynthesis was selected as a focal point for further investigation. Correlation analysis identified key metabolites and genes associated with flavonoid synthesis. Using a significance threshold of P < 0.05, 21 DEGs and 22 DEMs were found to be significantly associated (Figure 8). Specifically, among these, 20 DEGs were upregulated, 1 downregulated, 4 metabolites were upregulated, and 7 downregulated (Supplementary 3).
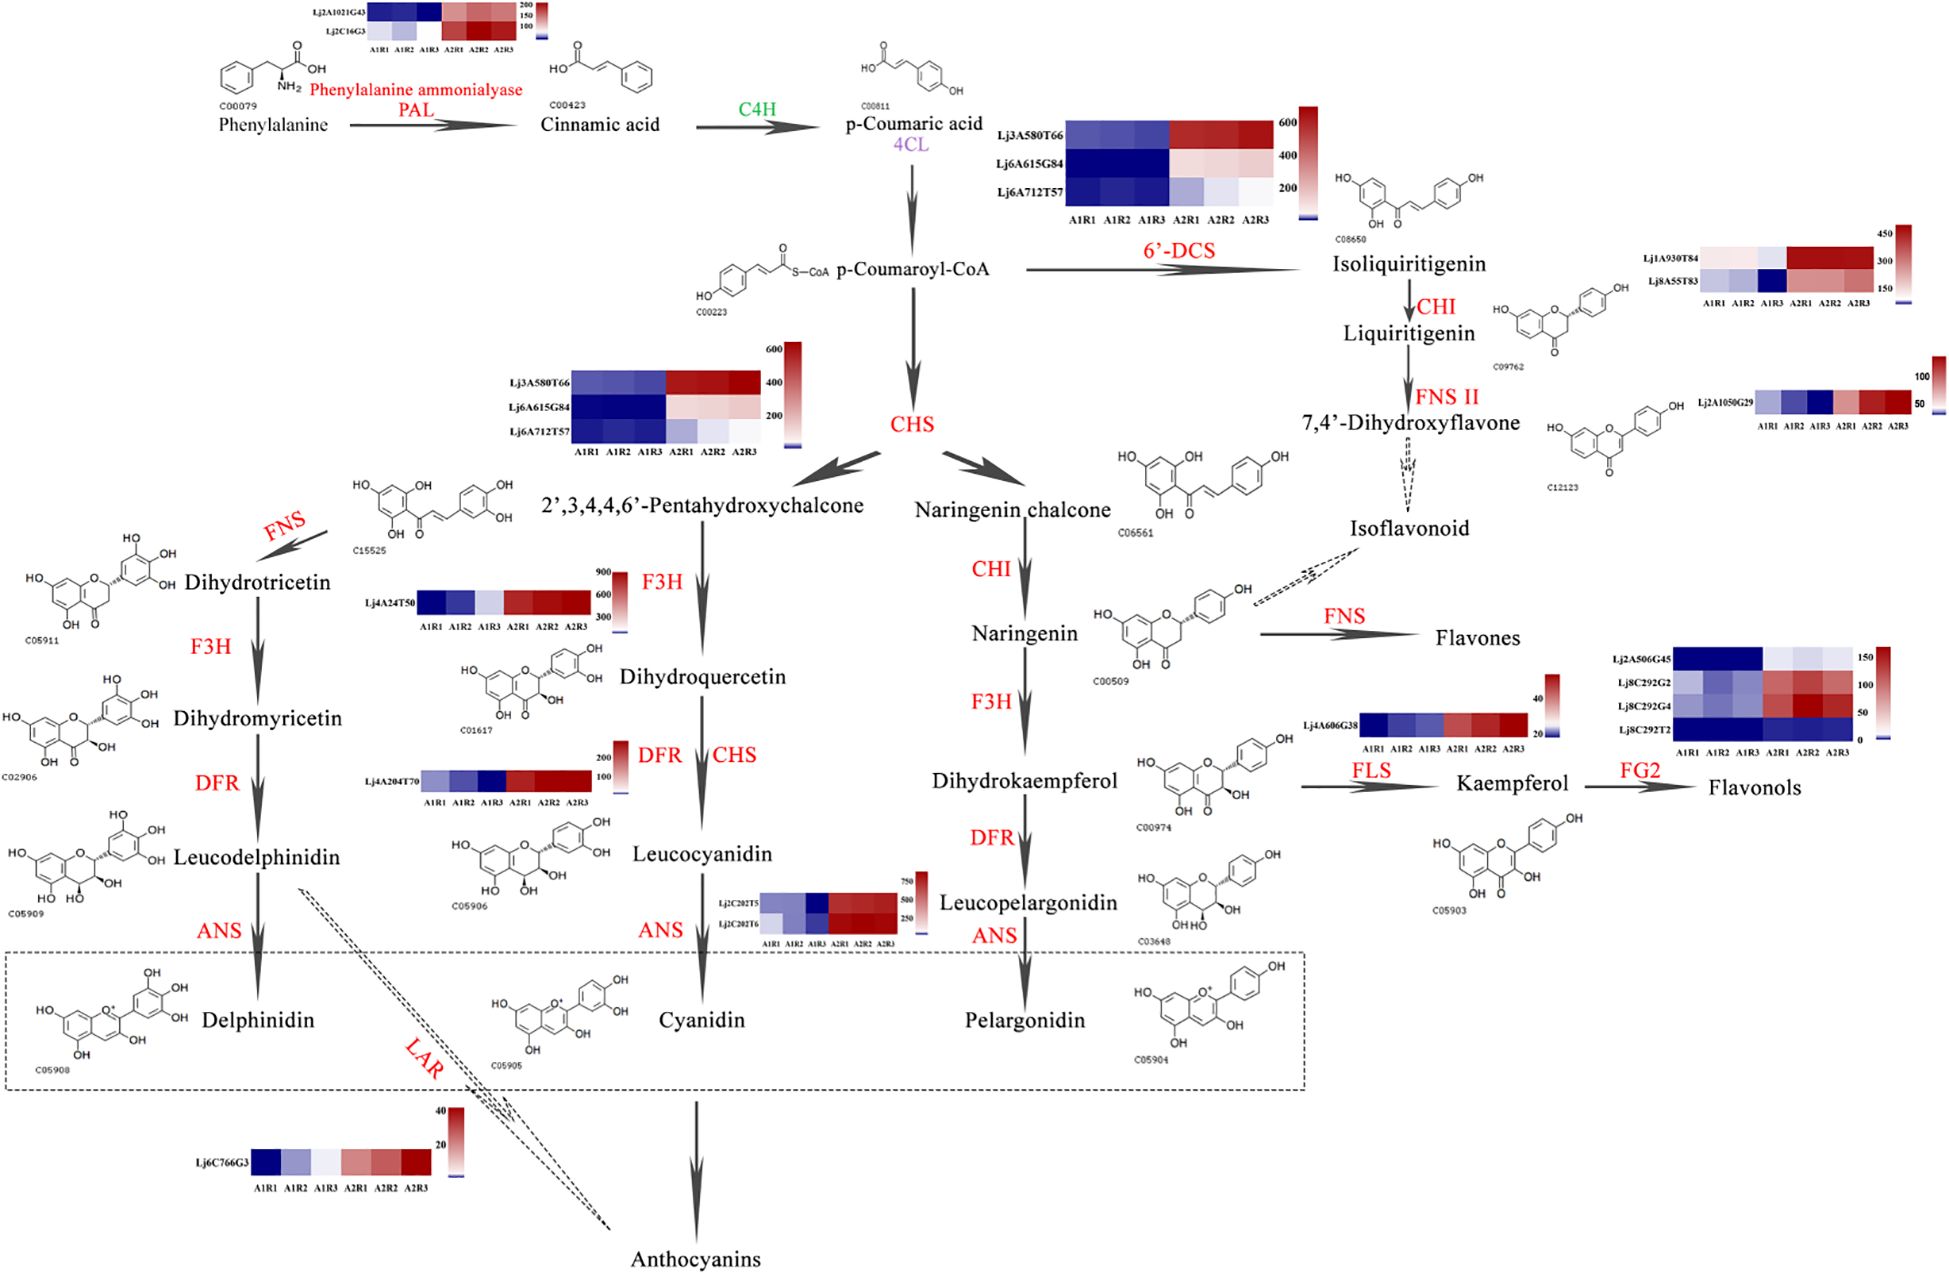
Figure 8. Schematic representation of the favonoid biosynthesis pathway coupled with heatmaps of relevant genes involved in the pathway. The enzyme names are abbreviated as follows: PAL, phenylalanine ammonialyase; C4H, cinnamic acid 4-hydroxylase; 4CL, 4-coumarate: CoA ligase; CHS, chalcone synthase; CHI, chalcone isomerase; FNS, favone synthase; FNSII, flavone synthaseII; F3H, favanone 3-hydroxylase; 6-DCS, 6-deoxychalcone synthase; F3’H, favonoid 3-hydroxylase; FLS, favonol synthase; DFR, dihydrofavonol 4-reductase; ANS, anthocyanidin synthase; LAR, leucoanthocyanidin reductase.
3.7 Analysis of differentially expressed genes related to flavonoid biosynthesis in ‘Luyu No. 1’ and ‘Honghua’
Flavonoids, the major bioactive components of honeysuckle, exhibit a range of beneficial biological and pharmacological properties. Phenylalanine, the precursor of flavonoid biosynthesis, is converted into p-coumaroyl-CoA via phenylalanine ammonia-lyase (PAL) and subsequently undergoes further enzymatic transformations to produce various flavonoid classes, including flavones, isoflavonoids, flavonols, and anthocyanins.
Specifically, p-coumaroyl-CoA is catalyzed by chalcone synthase (CHS) to form 2’,3,4,4’,6’-pentahydroxychalcone and naringenin chalcone. Naringenin chalcone is then acted upon by chalcone isomerase (CHI) to produce naringenin, which can be further metabolized into flavones by flavone synthase (FNS), or into dihydrokaempferol by flavanone 3-hydroxylase (F3H). Dihydrokaempferol is subsequently transformed into flavonols by flavonol synthase (FLS) and flavonol-3-O-glucoside L-rhamnosyltransferase. Additionally, p-coumaroyl-CoA can also serve as a precursor for isoliquiritigenin, leading to the synthesis of isoflavonoids.
In Honghua, genes involved in flavonoid biosynthesis, such as PAL, CHI, CHS, FNS, F3H, dihydroflavonol 4-reductase (DFR), anthocyanidin synthase (ANS), and flavonol glycosyltransferase (FG2), exhibited significant upregulation compared to Luyu No. 1 (Figure 8). Given that p-coumaric acid serves as a key precursor for flavonoid biosynthesis, our findings suggest that variations in p-coumaric acid levels may significantly influence flavonoid synthesis in different honeysuckle varieties.
3.8 Integrated metabolome and transcriptome analysis of flavonoid differences between ‘Luyu No. 1’ and ‘Honghua’
The primary flavonoid differential metabolites identified in honeysuckle varieties (Figure 9.) include aayafolin, 3,7-di-O-methylquercetin, quercetin-3-O-rhamnoside, luteolin-7-O-glucoside, apigenin, quercetin-3-O-robinobioside, kaempferol-3-O- galactoside, apigenin-7-O-(2’’-apiosyl) glucoside, kaempferol-3-O-robinobioside, kaempferol-3-O-robinotrioside, and quercetin-3-O-sambubioside. Notably, aayafolin, 3,7-di-O-methylquercetin, and apigenin are more abundant in ‘Luyu No. 1’, whereas quercetin-3-O-rhamnoside, luteolin-7-O-glucoside, quercetin-3-O-robinobioside, kaempferol-3-O-galactoside, apigenin-7-O-(2’’-apiosyl) glucoside, kaempferol-3-O- robinobioside, kaempferol-3-O-robinotrioside, and quercetin-3-O-sambubioside are more abundant in ‘Honghua’.

Figure 9. Correlation analysis of metabolites related to flavonoid synthesis-related genes. (A) Correlation analysisof the contents of aayafolin, 3,7-di-0-methylquercetin and apigenin with the genes related toflavonoid synthesis. (B)Correlation analysis of the contents of quercetin-3-0-rutinoside, quercetin-3.-rhamnoside, quercetin-3-0-sambubioside, kaempferol-3-0-galactoside, kaempferol-3-0rhamnoside, kaempferol-3-0-rutinoside, apigenin-7-0-(2"-apiosyl) glucoside and luteolin-7-0.glucoside with the genes related to flavonoid synthesis.
The differences in flavonoid content among varieties can be attributed to the differential expression of biosynthetic genes. Specifically, the expression levels of Lj2A506G45, Lj8C292G2, Lj8C292T2, Lj8C292G4, and Lj9A470T61 influence the activities of anthocyanin-3-O-glucoside rhamnosyltransferase and flavonoid 3’-monooxygenase. In ‘Honghua’, higher expression of Lj2A56G45, Lj9A470T61, Lj8C292T2, and Lj8C292G4 negatively correlates with the levels of aayafolin, 3,7-di-O-methylquercetin, and apigenin, leading to their higher abundance in ‘Luyu No. 1’ (Figure 9A).
Conversely, elevated expression of Lj8C292G2 and Lj9A470T61 positively correlates with quercetin-3-O-rutinoside levels in ‘Honghua’, enhancing the activities of anthocyanin-3-O-glucoside rhamnosyltransferase and flavone 3’-monooxygenase, which results in higher quercetin-3-O-rutinoside levels in ‘Honghua’ compared to ‘Luyu No. 1’. Additionally, high expression of Lj8C292T2 and Lj8C292G4 in ‘Honghua’ increases the activity of anthocyanin-3-O-glucoside rhamnosyltransferase, contributing to higher levels of luteolin-7-O-glucoside, quercetin-3-O-rhamnoside, kaempferol-3-O-galactoside, apigenin-7-O-(2’’-apiosyl) glucoside, kaempferol-3 -O-rhamnoside, kaempferol-3-O-rutinoside, and quercetin-3-O-sambubioside in ‘Honghua’ (Figure 9B).
3.9 Quantitative Real-time PCR validation of gene expression profiles
Eight representative differentially expressed genes (DEGs) from ‘Luyu No. 1’ and ‘Honghua’ were selected for RT-qPCR validation. The selection criterion was based on genes exhibiting an expression level at least twice that of the other variety at this stage. The validation results showed a high degree of consistency with the transcriptome data (Figure 10), confirming the reliability of the transcriptome analysis. The eight candidate genes exhibited two predominant expression patterns. Specifically, the expression levels of chalcone synthase (Lj3A580T66), chalcone isomerase (Lj1A930T84), flavone synthase (Lj2A1050G29), flavonol synthase (Lj4A606G38), bifunctional dihydroflavonol 4-reductase (Lj4A204T70), and phenylalanine ammonia-lyase (Lj2A1021G43) were significantly upregulated in ‘Honghua’. In contrast, the expression of cinnamate 4-hydroxylase 3 (Lj5C749T5) was down- regulated in’ Honghua’.
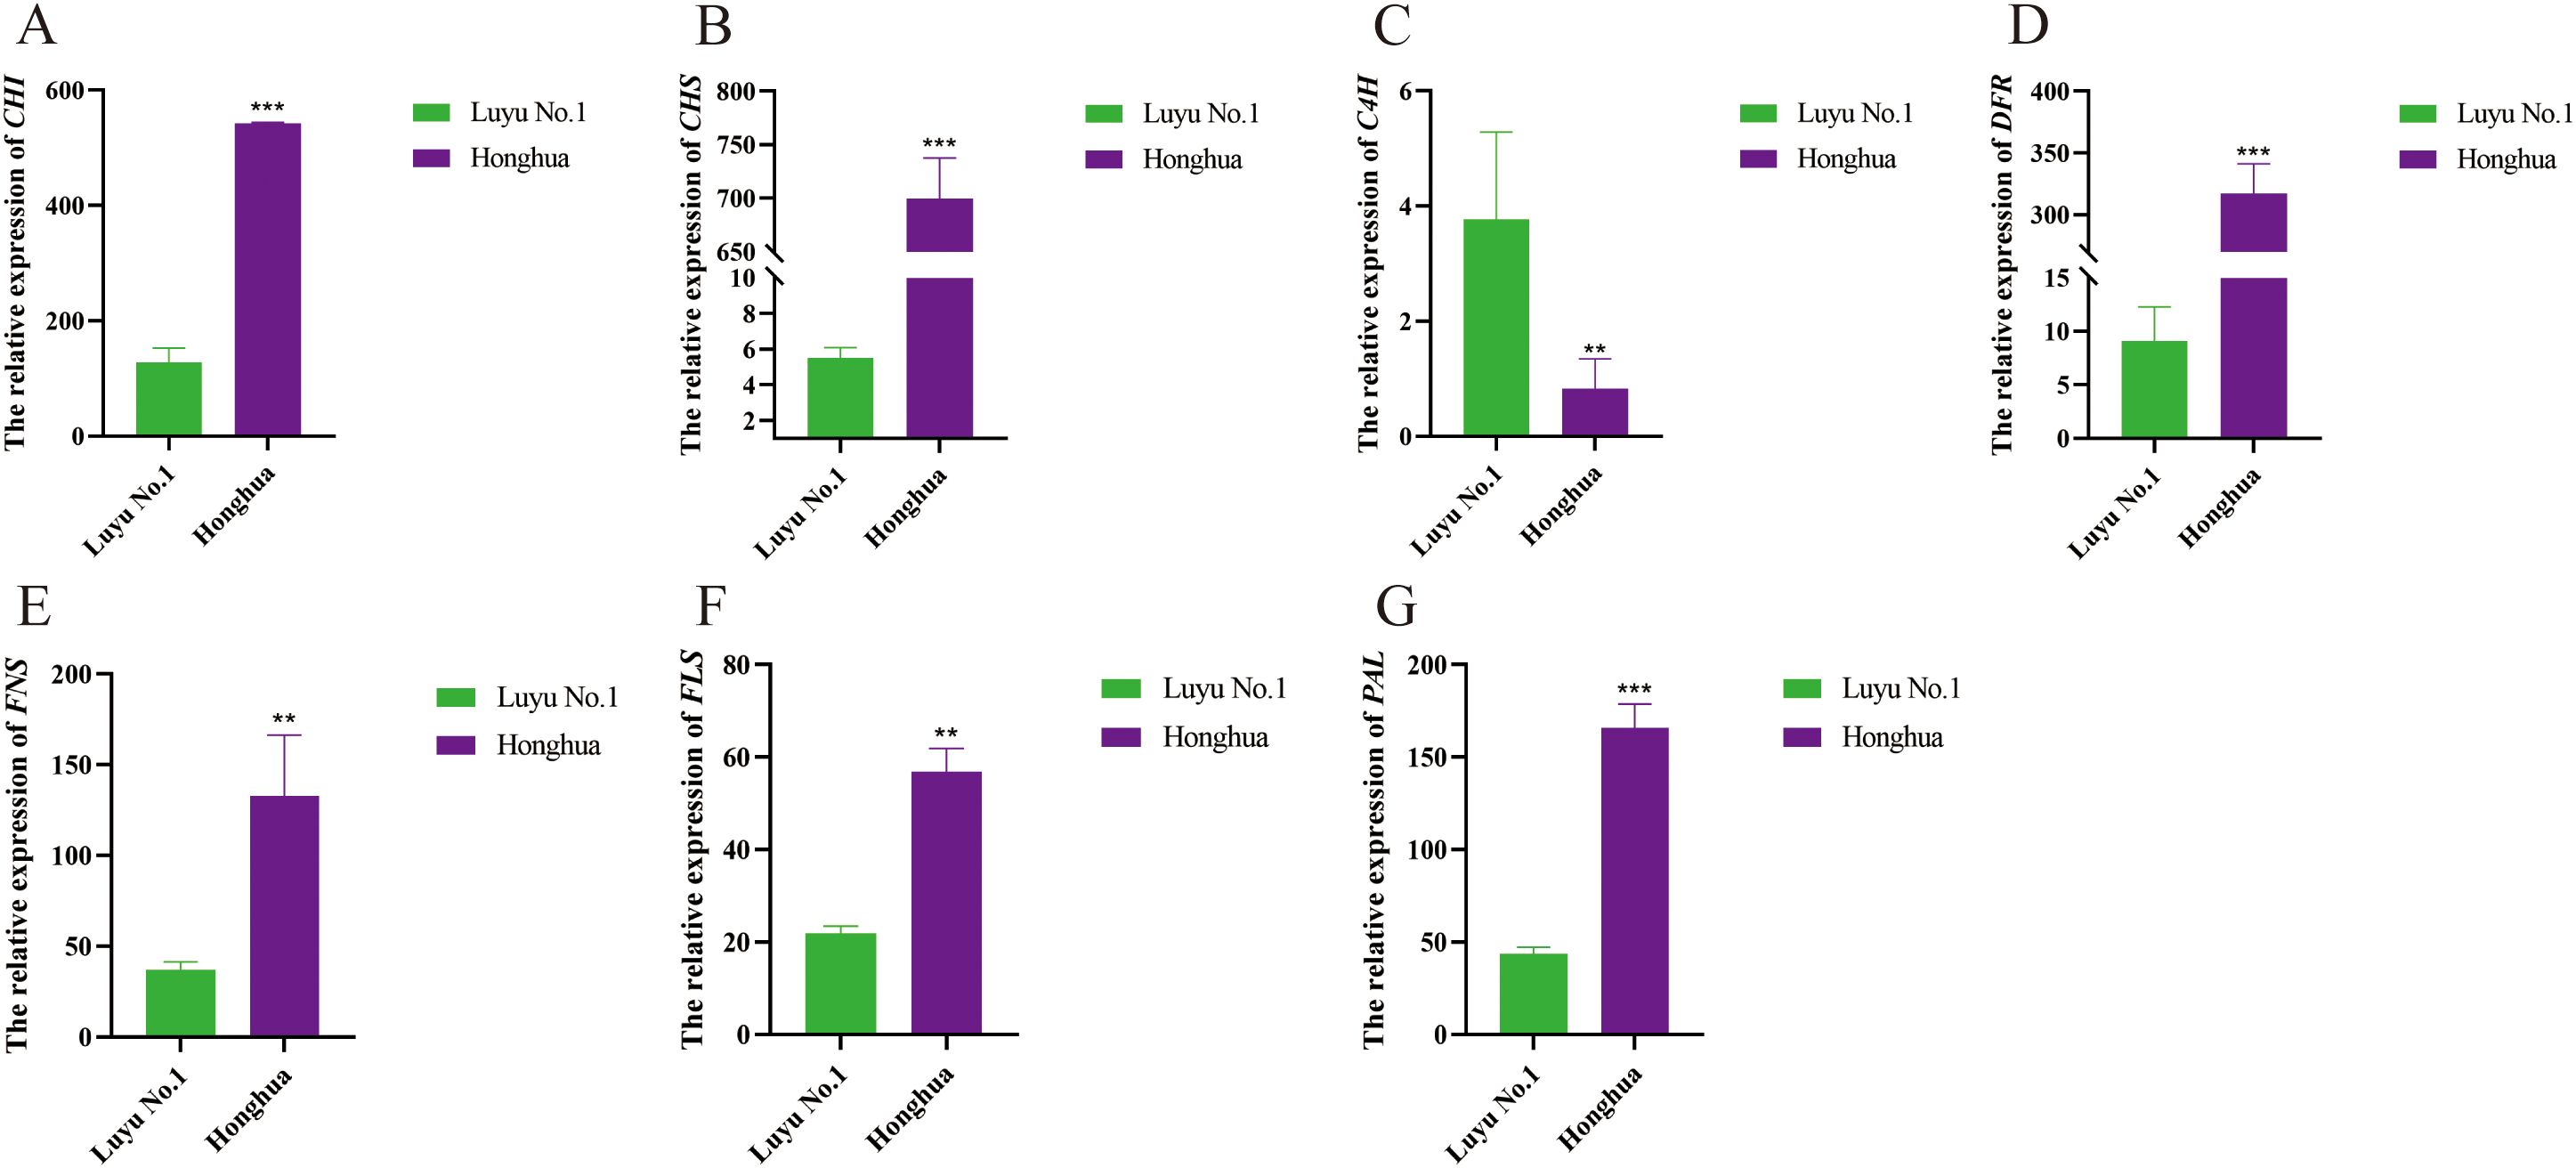
Figure 10. Relative expression levels of three transcription factors in different tissues of ‘Honghua’ and ‘Luyu No.1’. (A) CHI, (B) CHS, (C) C4H, (D) DFR, (E) FNS, (F) FLS, (G) PAL. Asterisks’*’ represent statistical differences in the same index between different species, with p<0.05 being a significant difference (**p<0.01, ***p<0.001).
4 Discussion
Honeysuckle, a traditional medicinal herb and food supplement, is renowned for its rich content of bioactive compounds, including flavonoids, volatile oils, organic acids, saponins, and iridoid glycosides (Lee et al., 2021). These compounds endow honeysuckle with significant antiviral properties, contributing to its heat-clearing and detoxification effects, as well as its involvement in inflammation treatment and antitumor processes (Muro et al., 2025). Among these bioactive compounds, flavonoids are particularly noteworthy. They are derived from flavone (2-phenylchromene) and include its isomers and hydrogenated reduction products. As plant secondary metabolites, flavonoids predominantly exist as glycosides or carbon glycosyls combined with sugars, although some occur in free form (Okom et al., 2025). Flavonoids are the major bioactive components in honeysuckle, and they exhibit a range of beneficial biological and pharmacological properties (Guo et al., 2025). For instance, flavonoids isolated from honeysuckle buds have been shown to inhibit the respiratory syncytial virus and effectively treat respiratory viral infections (Xu et al., 2024). Additionally, these flavonoids can suppress the release of inflammatory mediators such as TNF-α and IL-6, thereby alleviating inflammatory responses (Lu et al., 2024).
Previous studies have identified a wide variety of flavonoids in different plant species. For example, 37 differential flavonoids have been identified in tomatoes using UPLC-MS/MS, 41 flavonoids in kiwifruit (with 7 differing significantly between two varieties) (Liu et al., 2025), and 254 flavonoids in five citrus varieties (with 169 differentially accumulated) (Cao et al., 2023). Research on flavonoid metabolomics has predominantly focused on anthocyanin biosynthesis in differently colored varieties, such as figs (Mao et al., 2024), Many flower Solomon seal (Fan et al., 2023), and sweet potatoes (Sun et al., 2025), where significant variations in anthocyanin composition have been observed. In the present study, a comprehensive metabolomic analysis of Dabai-period buds from two honeysuckle varieties, ‘Luyu No. 1’ and ‘Honghua,’ revealed the presence of 399 flavonoids, including 19 chalcones, 161 flavones, 143 flavonols, 17 flavanols, 13 flavanones, 27 anthocyanidins, and 14 others. Notably, 228 flavonoids differed between the two varieties, specifically 14 chalcones, 80 flavones, 75 flavonols, 6 flavanols, 21 flavanones, 20 anthocyanidins, and 11 others. These differences in flavonoid abundance likely contribute to the quality variations observed among honeysuckle varieties.
The biosynthetic pathway of flavonoids involves numerous structural and regulatory genes (Yang et al., 2024). In this study, 5901 differentially expressed genes (DEGs) were identified during the Dabai-period bud development of ‘Luyu No. 1’ and ‘Honghua’ using Illumina sequencing. Functional annotation revealed transcripts encoding genes involved in bioactive compound metabolism. Combining annotations from the NR and PubMed databases, 34 DEGs related to flavonoid, carotenoid, monoterpenoid, alkaloid, and vitamin metabolic pathways were identified. Specifically, 18 DEGs encoding 11 enzymes, including PAL, CHS, CHI, F3H, FLS, flavone synthase II, FG2, ANS, DFR, and LAR, were found to be involved in flavonoid biosynthesis. Among these, one gene was downregulated, while 20 were upregulated in ‘Honghua’.
These findings demonstrate a strong correlation and functional consistency with the observation that the total flavonoid content in ‘Honghua’ is 2.32-fold higher than that in ‘Luyu No. 1’. This suggests that the upregulated genes may actively enhance flavonoid accumulation, whereas the downregulated gene could serve as a limiting factor in ‘Luyu No. 1’. The identification of these genes provides key candidate targets for elucidating the molecular mechanisms underlying flavonoid biosynthesis in the two cultivars and facilitates the development of high-flavonoid honeysuckle varieties with improved medicinal value.
Notably, the flavonoid pathway produces multiple enzyme metabolites, including anthocyanins (Zhao et al., 2022). Since these compounds share an upstream pathway, the DEGs are also involved in flavone, isoflavone, and flavonol metabolism. In this study, the isoflavone content was lower in ‘Luyu No. 1’ than in ‘Honghua,’ while flavanone levels were significantly higher in ‘Luyu No. 1.’ This difference may result from the differential expression of pivotal genes such as PAL, 4CL, CHS and FNS. Specifically, PAL is the first enzyme in phenylpropanoid biosynthesis, making its expression crucial for flavonoid biosynthesis (Chen et al., 2024). PAL expression was considerably higher in ‘Honghua,’ making it a key candidate gene for studying flavonoid and isoflavone differences between the varieties.
The regulation of flavonoid synthesis in different varieties primarily occurs at the transcriptional level. Transcription factors such as bHLH, MYB, and EOBII are involved in this process (Chen et al., 2025). In this study, several transcription factors were differentially expressed: MYB (MYB3, MYB4, MYB20, EOBII), NAC078, and bHLH (TCP15). Notably, MYB3, MYB4, and MYB20 were all downregulated in ‘Honghua.’ Lj3A874T74, a gene closely related to MYB4 (a well-characterized repressor of flavonoid biosynthesis genes in other plant species) was significantly downregulated in ‘Honghua’ (Soostani et al., 2025). This downregulation may alleviate the transcriptional repression of key flavonoid biosynthetic enzymes, thereby contributing to the elevated flavonoid accumulation observed in this variety. Conversely, the sustained expression of Lj3A874T74 in ‘Luyu No. 1’ may partially account for the reduced flavonoid content in that variety.
EOBII is a member of the MYB transcription factor family that plays a regulatory role in anthocyanin and flavonol metabolism (Qi et al., 2021; Aharoni et al., 2001). Functionally characterized homologs of EOBII, including Antirrhinum majus MYB305/MYB340 and Nicotiana NlxNs MYB305, have been shown to directly activate genes within the flavonoid biosynthetic pathway, particularly those involved in flavonol glycosylation (Yang et al., 2025; Liu et al., 2021). The upregulation of Lj7A593T47 and Lju41A37T46—identified as EOBII homologs—in ‘Honghua’ suggests their potential involvement in promoting flavonol biosynthesis in honeysuckle, which is consistent with the observed accumulation of specific flavonol content in this variety.
Furthermore, the pronounced upregulation of TCP15 (bHLH Lj9C462T10) in ‘Honghua’ is particularly noteworthy. bHLH transcription factors are well-established regulators that commonly form heterodimeric complexes with MYB transcription factors to activate the expression of late-stage biosynthetic genes within the flavonoid and anthocyanin biosynthetic pathways (Baudry et al., 2004). Functionally characterized homologs such as CsbHLH62 (involved in catechin biosynthesis in tea), AtGL3/EGL3 (regulating flavonoid biosynthesis in Arabidopsis), SlAN1 (associated with anthocyanin accumulation in tomato), CmbHLH2 (linked to anthocyanin biosynthesis in chrysanthemum), and AtTT8 (a key regulator of anthocyanin gene expression in Arabidopsis) collectively illustrate the evolutionarily conserved role of this transcription factor family in promoting flavonoid biosynthesis (Castillejo et al., 2020; Deng et al., 2022; Liu et al., 2023; Hong et al., 2021). The elevated expression level of TCP15 in ‘Honghua’ strongly implies its involvement in enhancing flavonoid biosynthesis, with likely contributions to anthocyanin accumulation in this red-pink-flowered cultivar. Nevertheless, definitive elucidation of its specific target genes and interacting partners—particularly MYB cofactors—requires further functional characterization in honeysuckle.
Among the structural genes involved in flavonoid biosynthesis, the differential expression patterns of those encoding anthocyanidin-3-O-glucoside rhamnosyl- transferase (3RT) and flavonoid 3’-monooxygenase (F3’M) merit in-depth functional analysis due to their significant influence on flavonoid chemistry and pigmentation. Specifically, 3RT catalyzes the transfer of a rhamnose moiety to the glucose residue at the 3-hydroxyl position of anthocyanidins. This glycosylation event is critically important as it markedly enhances the stability and water solubility of anthocyanins (Li et al., 2022), thereby directly influencing pigment accumulation and color intensity (Kroon et al., 1994). Functional studies in Petunia hybrida have demonstrated that loss-of-function mutations in the 3RT gene (Rt) result in a pronounced shift in flower color from blue-purple to pink, primarily due to the reduced stability of unmodified anthocyanin molecules (Kroon et al., 1994). In our study, the coordinated and significantly elevated expression of multiple 3RT genes (Lj8C292G2, Lj8C292T2, Lj8C292G4, Lj2A506G45) in ‘Honghua’—resulting in a cumulative 22.12-fold increase in transcript levels for this enzyme class—strongly indicates that enhanced anthocyanin rhamnosylation serves as a key molecular mechanism underlying the remarkable 87.58-fold increase in anthocyanidin content and the stable, intense red-pink pigmentation characteristic of this variety.
F3’M, a cytochrome P450 enzyme commonly classified as CYP75B, catalyzes the hydroxylation of the 3’ position on the B-ring of flavonoid substrates. As a key branch-point enzyme in the flavonoid pathway, it mediates the conversion of dihydrokaempferol to dihydroquercetin and kaempferol to quercetin. This enzymatic activity determines the type of anthocyanins synthesized and significantly influences the resulting pigment hue (ranging from red to purple to blue) (Tanaka et al., 2005). The functional importance of F3’M in determining color intensity is well documented across multiple species: Wild tomato species with deep red fruit peels exhibit high F3’M activity, whereas cultivated varieties with reduced activity accumulate pelargonidin derivatives, leading to an orange-red pigmentation (Butelli et al., 2008).
Enhanced expression of F3’M has been shown to intensify red coloration in transgenic tomato lines. In roses, deep red cultivars such as ‘Rouge Meilland’ display higher F3’M expression compared to pink-flowered varieties (Schmitzer et al., 2010). Similarly, red-fleshed strawberry cultivars (‘Festival’) exhibit elevated F3’M levels, while white-fleshed mutants (‘White Carolina’) carry loss-of-function mutations in this gene (Edger et al., 2019). CRISPR-mediated knockout of F3’M in strawberries results in a shift toward orange-red pigmentation (Zhou et al., 2020), and RNAi-mediated silencing of F3’M in petunia leads to orange-red flowers (Fukuchi-Mizutani et al., 2003). Overexpression of F3’M genes in carnations transforms pale pink petals into deep red or purple hues, and overexpression of CmF3’M in chrysanthemum increases cyanidin content, shifting flower color from pink to deep red (Noda et al., 2017).
In our study, the 3.03-fold upregulation of F3’M (Lj9A470T61) in ‘Honghua’ relative to ‘Luyu No. 1’ aligns closely with the observed metabolic profile in ‘Honghua’, which includes significantly elevated levels of quercetin derivatives such as quercetin-3-O-rutinoside (rutin), quercetin-3-O-rhamnoside (hyperoside), and luteolin-7-O-glucoside—all metabolites characterized by a 3’,4’-dihydroxylated B-ring structure dependent on F3’M activity. This enhanced 3’ hydroxylation capacity likely plays a pivotal role in the intense red-pink pigmentation of ‘Honghua’ by promoting the biosynthesis of cyanidin-derived anthocyanins and specific flavon(ol) glycosides.
Integrated transcriptomic and metabolomic analyses have revealed the key role of flavonoid metabolism in mediating color formation in plant tissues, including leaves, petals, and fruits. Studies have shown that tissue-specific coloration is regulated by differential activation of flavonoid biosynthetic pathways and accumulation of secondary metabolites (Gonzalez et al., 2008). In fruit, Mou et al. (2015) identified incomplete flavonoid pathway activation as a determinant of anthocyanin patterns in tomao. Similarly, Park et al. (2016) compared three sweet potato cultivars with distinct flesh colors (white, orange, and purple), identifying seven differentially accumulated flavonoids. Their analysis highlighted MYB transcription factors, bHLH regulators, and UFGT enzymes as critical genetic factors for pigmentation differences.
Multi-omics approaches have also clarified the mechanisms of foliar coloration. Wang et al. (2022) characterized leaf color differentiation in Docynia delavayi, linking it to core flavonoid biosynthesis pathways. Research on Rhododendron dauricum showed that inter-cultivar leaf color differences arise from coordinated regulation of anthocyanin and catechin biosynthesis, with key genes clustered in flavonoid pathways (Wang et al., 2024).
Floral pigmentation studies have yielded similar findings. Cai et al. (2024) deciphered Phyllostachys nigra color formation, linking it to flavonoid pathways and regulatory genes. Lv et al. (2023) found that pigment formation in two brown cotton fibers cultivars result from metabolic flux redirection at the dihydroflavonol branch point, favoring anthocyanin biosynthesis. Previous studies have shown that identifying genes related to flavonoid and anthocyanin metabolism is crucial for understanding red pigment formation (Wang et al., 2022; Liu et al., 2023). Structural genes involved in flavonoid and anthocyanin biosynthesis have been identified in various plant species (Kroon et al., 1994).
In this study, integrated transcriptomic and metabolomic analyses demonstrated that the flavonoid biosynthesis pathway plays a significant role in determining honeysuckle coloration. Key upstream genes, including PAL, 4CL, CHS, and FNS, were significantly upregulated, thereby ensuring an adequate supply of metabolic precursors for downstream biosynthetic processes. As previously elaborated, anthocyanidin-3-O-glucoside rhamnosyltransferase (3RT), encoded by Lj8C292G2, Lj8C292T2, Lj8C292G4, and Lj2A506G45, serves a crucial function in anthocyanin biosynthesis by enhancing pigment stability and water solubility (Li et al., 2022; Kroon et al., 1994). Similarly, flavonoid 3’-monooxygenase (F3’M), encoded by Lj9A470T61, represents a key regulatory enzyme in both anthocyanin and flavonol biosynthesis. It promotes the accumulation of 3’-hydroxylated flavonoids, which are associated with intensified red and purple pigmentation in plants (Butelli et al., 2008; Tanaka et al., 2005; Noda et al., 2017).
In ‘Honghua’, the expression levels of both 3RT and F3’M genes were elevated by 22.12-fold and 3.03-fold, respectively, compared to ‘Luyu No. 1’. This enhanced gene expression correlates directly with their established biochemical roles and is likely responsible for the observed increases in several flavonoid glycosides, including quercetin-3-O-rutinoside (rutin), luteolin-7-O-glucoside, quercetin-3-O-rhamnoside (hyperoside), kaempferol-3-O-galactoside, apigenin-7-O-(2’’-apiofuranosyl)glucoside, kaempferol-3-O-rhamnoside, kaempferol-3-O-rutinoside, and quercetin-3-O- sophoroside, relative to ‘Luyu No. 1’. Therefore, the differential expression patterns of 3RT and F3’M are strongly associated with the distinct color phenotype observed between these two honeysuckle varieties. Future research should aim to further elucidate the regulatory mechanisms governing these genes, perform functional validation studies to establish causal relationships, and explore their potential applications in breeding programs designed to enhance both the pigmentation and medicinal properties of honeysuckle.
5 Conclusions
In summary, integrated transcriptomic and metabolomic analyses have demonstrated that variations in genes associated with flavonoid biosynthesis and anthocyanin profiles represent key determinants of medicinal quality differences among honeysuckle varieties. A total of 228 differentially accumulated flavonoids, 11 structural genes involved in flavonoid biosynthesis, and 5 transcription factors (including MYB, bHLH, and NAC) were identified. Further analysis revealed that the expression levels of the key enzyme-encoding genes 3RT and F3’M are strongly correlated with the accumulation of critical flavonoid metabolites such as quercetin-3-O-rutinoside (rutin), luteolin-7-O-glucoside, and quercetin-3-O- rhamnoside (hyperoside). These correlations are mechanistically linked to enhanced anthocyanin stability (mediated by 3RT) and B-ring hydroxylation (catalyzed by F3’M), both of which favor red pigmentation. Significant differences in flavonoid biosynthesis between the two varieties were observed, indicating regulation by a complex metabolic network. The functional roles of structural genes such as 3RT and F3’M, as well as the regulatory mechanisms of the identified transcription factors (MYB, bHLH, NAC), require further experimental validation to transition from correlative observations to causal relationships. This study provides novel insights into the molecular mechanisms underlying flavonoid biosynthesis in honeysuckle and establishes a theoretical foundation for genetic improvement and metabolic engineering strategies aimed at enhancing its medicinal properties.
Data availability statement
The datasets presented in this study can be found in online repositories. The names of the repository/repositories and accession number(s) can be found in the article/Supplementary Material.
Author contributions
HLL: Investigation, Validation, Data curation, Writing – original draft. FW: Investigation, Writing – original draft, Formal Analysis, Data curation. JX: Software, Writing – original draft, Investigation, Methodology. WH: Writing – original draft, Data curation, Methodology. XZ: Methodology, Investigation, Resources, Writing – review & editing. HL: Resources, Writing – review & editing, Supervision. ML: Conceptualization, Writing – review & editing, Supervision, Resources. JD: Writing – review & editing, Project administration, Conceptualization, Resources. LW: Funding acquisition, Writing – review & editing, Resources, Project administration, Conceptualization.
Funding
The author(s) declare financial support was received for the research and/or publication of this article. This work was supported by Ningxia Agricultural Science and Technology Independent Innovation Fund (NGSB-2021-16-01), the Ningxia Natural Science Foundation (2024AAC03197), and the National Natural Science Foundation of China (NSFC32160094).
Acknowledgments
We thank all members of the ‘Research and Demonstration of Critical Technologies for the Utilization and Industrialization of Traditional Chinese Medicine Resources in Ecological Restoration within the Central Arid Zone’ team for their dedicated work on the different field trials and valuable support throughout the development of this study.
Conflict of interest
The authors declare that the research was conducted in the absence of any commercial or financial relationships that could be construed as a potential conflict of interest.
Generative AI statement
The author(s) declare that no Generative AI was used in the creation of this manuscript.
Any alternative text (alt text) provided alongside figures in this article has been generated by Frontiers with the support of artificial intelligence and reasonable efforts have been made to ensure accuracy, including review by the authors wherever possible. If you identify any issues, please contact us.
Publisher’s note
All claims expressed in this article are solely those of the authors and do not necessarily represent those of their affiliated organizations, or those of the publisher, the editors and the reviewers. Any product that may be evaluated in this article, or claim that may be made by its manufacturer, is not guaranteed or endorsed by the publisher.
Supplementary material
The Supplementary Material for this article can be found online at: https://www.frontiersin.org/articles/10.3389/fpls.2025.1636028/full#supplementary-material
References
Aharoni, A., De Vos, C. H., Wein, M., Sun, Z., Greco, R., Kroon, A., et al. (2001). The strawberry FaMYB1 transcription factor suppresses anthocyanin and flavonol accumulation in transgenic tobacco. Plant J. 28, 319–332. doi: 10.1046/j.1365-313X.2001.01154.x
Baudry, A., Caboche, M., and Lepiniec, L. (2004). AtGL3/EGL3 interacts with MYB transcription factors to synergistically activate flavonoid biosynthesis in Arabidopsis. Plant Cell 16, 2987–2999. doi: 10.1105/tpc.104.025502
Butelli, E., Titta, L., Giorgio, M., Mock, H. P., Matros, A., Peterek, S., et al. (2008). Enrichment of tomato fruit with health-promoting anthocyanins by expression of select transcription factors. Nat. Biotechnol. 26, 1301–1308. doi: 10.1038/nbt.1506
Cai, O., Zhang, H., Yang, L., Wu, H., Qin, M., Yao, W., et al. (2024). Integrated transcriptome and metabolome analyses reveal bamboo culm color formation mechanisms involved in anthocyanin biosynthetic in Phyllostachys nigra. Int. J. Mol. Sci. 25, 1738. doi: 10.3390/ijms25031738
Cao, Y. X., Ji, P., Wu, F. L., Dong, J. Q., Li, C. C., Ma, T., et al. (2023). Lonicerae Japonicae Caulis: A review of its research progress of active metabolites and pharmacological effects. Front. Pharmacol. 14. doi: 10.3389/fphar.2023.1277283
Castillejo, C., Waurich, V., Wagner, H., Ramos, R., Oiza, N., Muñoz, P., et al. (2020). Allelic variation of MYB10 is the major force controlling natural variation in skin and flesh color in strawberry (Fragaria spp.) fruit. Plant Cell 32, 3723–3749. doi: 10.1105/tpc.20.00474
Chen, J. Y., Li, W. W., Zhang, W. E., Li, C. X., Wang, R. P., Pan, X. J., et al. (2025). Combined transcriptional and metabolomic analysis of flavonoids in the regulation of female flower bud differentiation in Juglans sigillata Dode. BMC Plant Biol. 25, 1–18. doi: 10.1186/s12870-025-06121-9
Chen, C., Wang, P., Yan, Y., Jiao, Z., Xie, S., Li, Y., et al. (2024). Integrated metabolome and transcriptome analysis provide insight into the biosynthesis of flavonoids in Panax japonicus. Front. Plant Sci. 15. doi: 10.3389/fpls.2024.1432563
Deng, Y., Li, X., and Wang, C. (2022). CsbHLH62 drives flavanol biosynthesis in tea leaves by targeting key genes in the flavanol synthesis pathway. Plant Physiol. Biochem. 190, 123–135. doi: 10.1016/j.plaphy.2022.05.001
Edger, P. P., Poorten, T. J., VanBuren, R., Hardigan, M. A., Colle, M., McKain, M. R., et al. (2019). Origin and evolution of the octoploid strawberry genome. Nat. Genet. 51, 541–547. doi: 10.1038/s41588-019-0356-4
Fan, R., Zhu, C., Qiu, D., Mao, G., Mueller-Roeber, B., and Zeng, J. (2023). Integrated transcriptomic and metabolomic analyses reveal key genes controlling flavonoid biosynthesis in Citrus grandis ‘Tomentosa’ fruits. Plant Physiol. Biochem. 196, 210–221. doi: 10.1016/j.plaphy.2023.01.050
Fukuchi-Mizutani, M., Okuhara, H., Fukui, Y., Nakao, M., and Katsumoto, Y. (2003). Biochemical and molecular characterization of a novel UDP-glucose:anthocyanin 3’-O-glucosyltransferase, a key enzyme for blue anthocyanin biosynthesis, from gentian. Plant Physiol. 132, 1652–1663. doi: 10.1104/pp.102.018242
Gonzalez, A., Zhao, M., and Lloyd, A. M. (2008). The AtTT8-MYB75-TTG1 complex directly activates anthocyanin biosynthetic genes in Arabidopsis. Proc. Natl. Acad. Sci. 105, 11376–11381. doi: 10.1073/pnas.0804344105
Guo, L., Qiao, J., Zhang, L., Ma, K., Yang, H., Zhao, J., et al. (2025). Metabolome reveals high nitrogen supply decreases the antioxidant capacity of blue honeysuckle (Lonicera caerulea L.) by regulating flavonoids. Food Chem. 15, 480. doi: 10.1016/j.foodchem.2025.143954
Guo, Y., Zhu, C., Zhao, S., Zhang, S., Wang, W., Fu, H., et al. (2019). De novo transcriptome and phytochemical analyses reveal differentially expressed genes and characteristic secondary metabolites in the original oolong tea (Camellia sinensis) cultivar “Tieguanyin” compared with cultivar “Benshan. BMC Genomics 20, 265–276. doi: 10.1186/s12864-019-5643-z
Hong, Y., Wei, Z., and Zhao, M. (2021). CmbHLH2 positively regulates anthocyanin accumulation in chrysanthemum petals via direct promoter binding. Horticulture Res. 8, 1–12. doi: 10.1038/s41438-021-00543-w
Hou, C., Huang, L., Li, Z., Sun, N., Yang, S., Li, J., et al. (2025). Domestication of medicinal plants (Lonicera japonica Thunb.) in China: Comparison of morphological, resistance and biochemical traits between wild and cultivated populations. Front. Plant Sci. 15. doi: 10.3389/fpls.2024.1501396
Huo, L. C., Liu, N. Y., Wang, C. J., Luo, Y., and Liu, J. X. (2024). Lonicera japonica protects Pelodiscus sinensis by inhibiting the biofilm formation of Aeromonas hydrophila. Appl. Microbiol. Biotechnol. 108, 67. doi: 10.1007/s00253-023-12910-9
Kroon, J., Souer, E., Graaff, A., Xue, Y. B., Mol, J., and Koes, R. (1994). Cloning and structural analysis of the anthocyanin pigmentation gene Rt of Petunia hybrida: Characterization of insertion mutations in the Rt and Bz loci. Plant J. 5, 69–80. doi: 10.1046/j.1365-313X.1994.5010069.x
Law, S. K., Wu, X. X., Jiang, Z., Tong, C. W. S., Chow, W. Y. L., and Au, D. C. T. (2024). Pharma cological activities of Lonicerae japonicae flos and its derivative “Chrysoeriol skin Diseases. Molecules 29, 1972. doi: 10.3390/molecules29091972
Lee, Y. R., Chang, C. M., Yeh, Y. C., Huang, C. F., Lin, F. M., Huang, J. T., et al. (2021). Honeysuckle aqueous extracts induced let-7a suppress ev71 replication and pathogenesis in vitro and in vivo and is predicted to inhibit SARS-CoV-2. Viruses 13, 308. doi: 10.3390/v13020308
Li, H., Fan, C., Liu, J., Wang, B., and Li, H. (2022). Integration of full-length transcriptomes and anthocyanin metabolite analysis for understanding fruit coloration mechanism in Schisandra chinensis. Physiol. Mol. Biol. Plants 28, 921–933. doi: 10.1007/s12298-022-01179-3
Li, L., Zhang, H., Liu, J., Huang, T., Zhang, X., Xie, H., et al. (2023). Grain color formation and analysis of correlated genes by metabolome and transcriptome in different wheat lines at maturity. Front. Nutr. 10. doi: 10.3389/fnut.2023.1112497
Li, L., Zhang, S., Yu, B., Liu, S. Q., and Xiong, Y. (2024). Fractionating the flavonoids in Lonicerae japonicae Flos and Lonicerae flos via solvent extraction coupled with automated solid-phase extraction. Foods 13, 3861. doi: 10.3390/foods13233861
Liu, T., Bai, H., Wang, H., Li, Y., and Wang, Z. (2025). Anti-inflammatory effects and mechanism of Plantago asiatica L. and Lonicera japonica Thunb. extracts based on canine and feline kidney cell models. J. Ethnopharmacology 338, 119069. doi: 10.1016/j.jep.2024.119069
Liu, X., Liu, H., Tian, B., Shi, G., Liu, C., Guo, J., et al. (2023). Metabolome and transcriptome analyses of anthocyanin biosynthesis reveal key metabolites and candidate genes in purple wheat (Triticum aestivum L.). Physiologia plantarum 175, e13921. doi: 10.1111/ppl.13921
Liu, Y., Ma, K., Qi, Y., Lv, G., Ren, X., Liu, Z., et al. (2021). Transcriptional regulation of anthocyanin synthesis by MYB-bHLH-WDR complexes in kiwifruit (Actinidia chinensis). J. Agric. Food Chem. 69, 3677–3691. doi: 10.1021/acs.jafc.1c00323
Liu, Y., Zhang, J., and Chen, K. (2023). SlAN1 specifically regulates anthocyanin biosynthesis and pericarp coloration during tomato fruit development. New Phytol. 238, 1650–1665. doi: 10.1111/nph.18872
Lu, H. X., Yan, W., Yuan, X., Kang, Y. B., Liu, Z. J., and Guo, Q. (2024). Lonicera Japonica Caulis ameliorates LPS and TNF-α-induced HT-29 cell injury by inhibiting the MAPK/ERK/JNK/p38 pathway. Biomed. Environ. Sci. 37, 805–810. doi: 10.3967/bes2024.091
Lv, Y. P., Zhao, G., Xie, Y. F., Owusu, A. G., Wu, Y., and Gao, J. S. (2023). Transcriptome and metabolome profiling unveil pigment formation variations in brown cotton lines (Gossypium hirsutum L.). Int. J. Mol. Sci. 24, 5249. doi: 10.3390/ijms24065249
Ma, X., Sun, C. Y., Zhang, Y., Li, J., and Zhao, D. S. (2025). The hepatoprotective effect of Lonicera japonica Flos on rats with high-fat diet-induced non-alcoholic fatty liver disease. Fitoterapia 183, 106516. doi: 10.1016/j.fitote.2025.106516
Ma, P., Yuan, L., Jia, S., Ma, P., Yuan, L., Jia, S., et al. (2024). Lonicerae Japonicae Flos with the homology of medicine and food: A review of active ingredients, anticancer mechanisms, pharmacokinetics, quality control, toxicity and applications. Front. Oncol. 14. doi: 10.3389/fonc.2024.1446328
Mao, J., Gao, Z., Wang, X., Yao, D., Lin, M., and Chen, L. (2024). Integrated transcriptome and targeted metabolome analyses provide insights into flavonoid biosynthesis in kiwifruit (Actinidia chinensis). Sci. Rep. 14, 19417. doi: 10.1038/s41598-024-70600-6
Mou, W. S., Li, D. D., Luo, Z. S., Mao, L. C., and Ying, T. J. (2015). Transcriptomic analysis reveals possible influences of ABA on secondary metabolism of pigments, flavonoids and antioxidants in tomato fruit during ripening. PloS One 10, e0129598. doi: 10.1371/journal.pone.0129598
Muro, P., Jing, C., Zhao, Z., Jin, T., and Mao, F. (2025). The emerging role of honeysuckle flower in inflammatory bowel disease. Front. Nutr. 12. doi: 10.3389/fnut.2025.1525675
Noda, N., Yoshioka, S., Kishimoto, S., Nakayama, M., Douzono, M., Tanaka, Y., et al. (2017). Generation of blue chrysanthemums by anthocyanin B-ring hydroxylation and glucosylation and its coloration mechanism. Sci. Adv. 3, e1602785. doi: 10.1126/sciadv.1602785
Okom, S. U., Okpoghono, J., and Onyesom, I. (2025). In vivo antiplasmodial activity of alkaloids, flavonoids and ethanol extracts from stem and leaves of Phyllanthus amarus. Discover Appl. Sci. 7, 1–8. doi: 10.1007/s42452-025-06769-w
Park, S. Y., Lee, S. Y., Yang, J. W., Lee, J. S., Oh, S. D., Oh, S., et al. (2016). Comparative analysis of phytochemicals and polar metabolites from colored sweet potato (Ipomoea batatas L.) tubers. Food Sci. Biotechnol. 25, 283–291. doi: 10.1007/s10068-016-0041-7
Qi, Y., Li, C., Duan, C., Gu, C., and Zhang, Q. (2021). Integrated metabolomic and transcriptomic analysis reveals the flavonoid regulatory network by Eutruma EsMYB90. Int. J. Mol. Sci. 22, 8751. doi: 10.3390/ijms22168751
Schmitzer, V., Veberic, R., Osterc, G., and Stampar, F. (2010). Color and phenolic content changes during flower development in groundcover rose. J. Am. Soc. Hortic. Sci. 135, 195–202. doi: 10.21273/JASHS.135.3.195
Soostani, S. B., Ranjbar, M., Memarian, A., Mohammadi, M., and Yaghini, Z. (2025). Investigating the effect of chitosan on the expression of P5CS, PIP, and PAL genes in rapeseed (Brassica napus L.) under salt stress. BMC Plant Biol. 25. doi: 10.1186/s12870-025-06187-5
Sun, J., Yishake, H., Wang, M., Zhang, H., and Yan, J. (2025). Integrated transcriptome and targeted metabolome for resolving flavonoid biosynthesis in figs (Ficus carica Linn.). Biology 14, 184. doi: 10.3390/biology14020184
Tanaka, Y., Katsumoto, Y., Brugliera, F., and Mason, J. (2005). Genetic engineering in floriculture. Plant Cell Tissue Organ Culture 80, 1–24. doi: 10.1007/s11240-004-0739-8
Wang, D., Liu, G., Yang, J., Shi, G., Niu, Z., Liu, H., et al. (2024). Integrated metabolomics and transcriptomics reveal molecular mechanisms of corolla coloration in Rhododendron dauricum L. Plant Physiol. Biochem. 207, 108438. doi: 10.1016/j.plaphy.2024.108438
Wang, Y., Song, Y., and Wang, D. (2022). Transcriptomic and metabolomic analyses providing insights into the coloring mechanism of Docynia delavayi. Foods 11, 2899. doi: 10.3390/foods11182899
Wu, Q., Wu, J., Li, S. S., Zhang, H. J., Feng, C. Y., Yin, D., et al. (2016). Transcriptome sequencing and metabolite analysis for revealing the blue flower formation in waterlily. BMC Genomics 17, 897–909. doi: 10.1186/s12864-016-3226-9
Xu, F., Qin, Y., and Guan, C. (2024). Discovery of components in honeysuckle for treating COVID-19 and diabetes based on molecular docking, network analysis and experimental validation. Natural product Res. 39 (12), 3459–3463. doi: 10.1080/14786419.2024.2340040
Yang, L., Tian, L., Shi, J., and Wei, A. (2025). Transcriptome and metabolome profiling provide insights into flavonoid biosynthesis and the mechanism of color formation in Zanthoxylum bungeanum Maxim. Plants 14, 558. doi: 10.3390/plants14040558
Yang, Z. Q., Wang, S. B., Wei, L. L., Huang, Y. M., Liu, D. X., Jia, Y. P., et al. (2023). BnlR: A multi-omics database with various tools for Brassica napus research and breeding. Mol. Plant 16, 775–789. doi: 10.1016/j.molp.2023.03.007
Yang, L., Yang, Q., Zhang, L., Ren, F., Zhang, Z., and Jia, Q. (2024). Integrated metabolomics and transcriptomics analysis of flavonoid biosynthesis pathway in Polygonatum cyrtonema Hua. Molecules 29, 2248. doi: 10.3390/molecules29102248
Zhang, Q., Wang, L., Wang, Z., Zhang, R., Liu, P., Liu, M., et al. (2021). The regulation of cell wall lignification and lignin biosynthesis during pigmentation of winter jujube. Horticulture Res. 8, 238–244. doi: 10.1038/s41438-021-00670-4
Zhao, D., Zhao, L., Liu, Y., Zhang, A., Xiao, S., Dai, X., et al. (2022). Metabolomic and transcriptomic analyses of the flavonoid biosynthetic pathway for the accumulation of anthocyanins and other flavonoids in sweet potato root skin and leaf vein base. J. Agric. Food Chem. 70, 2574–2588. doi: 10.1021/acs.jafc.1c05388
Zheng, S., Liu, S., Hou, A., Wang, S., Na, Y., Hu, J., et al. (2022). Systematic review of Lonicerae Japonicae Flos: A significant food and traditional Chinese medicine. Front. Pharmacol. 13. doi: 10.3389/fphar.2022.1013992
Zhou, J., Zeng, L., Liu, J., and Xing, D. (2020). CRISPR/Cas9-mediated knockout of F3’M in strawberry redirects anthocyanin synthesis. Plant Biotechnol. J. 18, 2050–2062. doi: 10.1111/pbi.13365
Keywords: Lonicera japonica, flavonoid biosynthesis, transcriptomics, metabolomics, anthocyanins, MYB transcription factors
Citation: Liao H, Wu F, Xie J, He W, Zhang X, Dai J, Liu H, Li M and Wang L (2025) Integrated metabolomic and transcriptomic analysis elucidates transcriptional regulation of flavonoid biosynthesis in differentially pigmented honeysuckle (Lonicera japonica) varieties. Front. Plant Sci. 16:1636028. doi: 10.3389/fpls.2025.1636028
Received: 27 May 2025; Accepted: 20 August 2025;
Published: 11 September 2025.
Edited by:
Efficient Nsikayezwe Ncube, Tshwane University of Technology, South AfricaReviewed by:
Jiabao Ye, Yangtze University, ChinaYueya Zhang, The University of Chicago, United States
Copyright © 2025 Liao, Wu, Xie, He, Zhang, Dai, Liu, Li and Wang. This is an open-access article distributed under the terms of the Creative Commons Attribution License (CC BY). The use, distribution or reproduction in other forums is permitted, provided the original author(s) and the copyright owner(s) are credited and that the original publication in this journal is cited, in accordance with accepted academic practice. No use, distribution or reproduction is permitted which does not comply with these terms.
*Correspondence: Hua Liu, bnhobXNsaXVAMTYzLmNvbQ==; Ming Li, bG0ubnhwbEAxNjMuY29t; Lijuan Wang, bW5uNzE3QDE2My5jb20=