 Kai Zhao
 Yafei You1
- 1College of Pharmacy, Heilongjiang University of Chinese Medicine, Harbin, China
- 2College of Basic Medical Sciences, Mudanjiang Medical University, Mudanjiang, China
Introduction: Both Paeoniae Radix Alba (RAP) and Paeoniae Radix Rubra (RRP) are important botanical drugs used in Asian countries. Although they are both derived from the roots of Paeonia lactiflora Pall., they exhibit distinct pharmacological properties due to differences in germplasm and processing methods. Due to overwhelming market demand, the cultivated varieties have become the primary source to compensate for insufficient wild resources, which have led to decreased medicinal quality. This study aimed to address this quality decline and put forward a hypothesis that exogenous nitric oxide (NO) induces the reactive oxygen species (ROS)-mediated enhancement of secondary metabolism in fresh roots of P. lactiflora, thereby improving medicinal quality.
Methods: Fresh roots of P. lactiflora germplasm for Paeoniae Radix Rubra production (RRP-germplasm) and for Paeoniae Radix Alba production (RAP-germplasm) were treated with sodium nitroprusside (SNP) at concentrations of 0.0, 0.1, 0.5, or 2.5 mmol/L to induce ROS bursts.
Results: In the fresh roots of RRP-germplasm treated with 0.5 mmol/L SNP, the secondary metabolites paeoniflorin, albiflorin, oxypaeoniflorin, gallic acid, catechin, and paeonol were elevated by 19.1%, 205.4%, 115.4%, 19.9%, 201.0%, and 585.2%, respectively, and in the fresh roots of RAP-germplasm treated with 2.5 mmol/L SNP, the major secondary metabolites paeoniflorin, albiflorin, oxypaeoniflorin, gallic acid, catechin, and benzoic acid showed increases of 25.4%, 70.4%, 95.1%, 6.7%, 86.5%, and 33.6%, respectively. Moreover, experiments involving combined treatment with SNP and ROS scavengers demonstrated that ROS act as the key mediator linking exogenous NO to the secondary metabolism of P. lactiflora: scavenging ROS significantly attenuated the SNP-induced accumulation of target secondary metabolites.
Discussion: Combined with the above findings of SNP promoting secondary metabolite synthesis, this study confirms that exogenous NO can improve the quality of cultivated RAP and RRP via ROS-mediated secondary metabolism, and clarifies the NO-ROS-secondary metabolism regulatory axis, offering insights for other medicinal plants’ quality improvement.
1 Introduction
Paeoniae Radix Rubra is primarily produced in Inner Mongolia and Hebei provinces in Northeast China, while Paeoniae Radix Alba is mainly produced in Zhejiang and Anhui provinces in China (Ma et al., 2024a). As bulk medicinal materials commonly used in Asian countries, these two herbs share the same botanical origin and medicinal part, and the Chinese Pharmacopoeia editions consistently classify the dried root of P. lactiflora as “Paeoniae Radix Rubra” and the dried root that goes through parboiling and removing its outer skin as “Paeoniae Radix Alba” (Pharmacopoeia Commission of the People’s Republic of China, 2020). In fact, Paeoniae Radix Rubra is derived from wild germplasm of P. lactiflora, whereas Paeoniae Radix Alba originates from the cultivated variety P. lactiflora ‘Baishao’ (Yao et al., 2020). The bioactive compounds, such as paeoniflorin, albiflorin, catechin, and paeonol, vary greatly between them (Fan et al., 2014; Liu et al., 2015). Paeoniae Radix Rubra contains higher levels of paeoniflorin, catechin, and paeonol, and its effects are mainly achieved by inhibiting the release of inflammatory factors such as tumor necrosis factor-α and interleukin-6, as well as scavenging ROS and other oxidative stress products, thereby exhibiting notable microcirculation-improving, analgesic, anti-inflammatory, antibacterial, and antiviral effects, and it is commonly used for treating hemorheological abnormalities, inflammatory conditions, and infection-related diseases. Paeoniae Radix Alba is richer in albiflorin, and its effects are mainly achieved by regulating the activity of T lymphocytes and B lymphocytes to enhance immune function, while promoting the expression of anti-apoptotic proteins in hepatocytes and inhibiting hepatocyte necrosis, thereby excelling in hematopoietic promotion, immune enhancement, hepatoprotection, and antitumor effects, and it is more suitable for patients with chronic anemia, immunodeficiency, hepatic disorders, and cancer (Zhang et al., 2013). A large demand for both Paeoniae Radix Rubra and Paeoniae Radix Alba makes the cultivated ones the predominant commercial source. However, the cultivated materials exhibit inferior quality; How to improve the quality of cultivated products has become crucial for enhancing clinical efficacy.
Notably, the medicinal components of traditional Chinese herbs are typically secondary metabolites, and environmental stress serves as a fundamental trigger for their biosynthesis of secondary metabolites in plants. Moderate environmental stressors can effectively promote the biosynthesis of secondary metabolites (Alami et al., 2024). Therefore, strategic application of environmental stress may rapidly improve the quality of herbal medicinal materials.
ROS are inevitable products of metabolic processes in living organisms. At appropriate concentrations, ROS are indispensable for the formation of disulfide bonds (-S-S-) in proteins (Tu and Weissman, 2004; Malhotra and Kaufman, 2007), contributing to the formation of the unique structures of enzymes and other functional proteins and regulating plant growth and development (Buchanan and Luan, 2005; Akter et al., 2015). Under normal physiological conditions, ROS are maintained at a relatively stable level. However, when plants are exposed to environmental stresses such as drought, waterlogging, salinity, heat shock, chilling injury, or UV radiation, disturbed metabolic activity leads to excessive production of ROS in chloroplasts, mitochondria, peroxisomes, and other organelles. During photosynthesis in chloroplasts, photosystem I generates increased superoxide anion (O2·-) through the Mehler reaction by transferring more electrons to O2 (Asada, 2006; Khorobrykh et al., 2020). In mitochondria, electron leakage from complexes I and III of the electron transport chain during oxidative phosphorylation for Adenosine Triphosphate (ATP) production partially reduces O2 to O2·- (Hansen et al., 2006). Additionally, the photorespiration process involves glycolate oxidase catalyzing the oxidation of glycolate to glyoxylate, accompanied by the production of ROS such as H2O2 (Miller et al., 2010). ROS include O2·-, H2O2, ·OH, 1O2, etc (Droge, 2002). It has been proven that ROS accumulation is an inevitable consequence of environmental stress, with a 10-fold increase in H2O2 and a 3-fold increase in O2·- under adverse conditions (Shen et al., 2020). The excessive generation of ·OH and O2·- with high activity can readily trigger cascading oxidative damage, subsequently alter adjacent molecular structures, compromise biomembrane stability, cause DNA damage, break peptide chains, and induce protein cross-linking, disrupt metabolic pathways, and program cell death (Grimm et al., 2012; Van Ruyskensvelde et al., 2018; Xie et al., 2019). The immobility of plants inevitably leads to elevated ROS levels when exposed to environmental stress. Given the potent protein-damaging effects of ROS, which often overwhelm antioxidant enzymes under severe stress, the fundamental reason why plants can survive is that they have evolved secondary metabolism and utilize secondary metabolites, usually the active components of herbal medicine, to scavenge excess ROS. Therefore, the outbreak of ROS caused by environmental stress is a basic factor that enhances secondary metabolism and improves the quality of medicinal materials.
NO, a reactive nitrogen species (RNS), can induce the production of ROS such as O2·- through redox cycles and modulation of RNS-ROS interactions (Heinrich et al., 2013; Del Río L, 2015), trigger physiological responses in plants under stress, and enhance the quality of medicinal materials. In contrast to the negatively charged O2·-, NO is an electrically neutral small molecule with both lipophilic and hydrophilic properties, and can freely traverse cell membranes and distribute widely in the cellular environment. Additionally, NO contains unpaired electrons, allowing it to react with O2·- to form peroxynitrite, a less toxic compound that mitigates stress-induced damage in plants. These properties underscore the critical role of NO in plant growth, development, and environmental adaptation (Delledonne et al., 1998a). It has been demonstrated that exogenous NO stress can increase the biosynthesis of secondary metabolites in plants (Song et al., 2023; Zhang et al., 2025). SNP, a commonly used exogenous NO donor, contains a labile Fe-NO bond in its molecule, enabling the rapid release of a large amount of NO.
Against this background, to investigate the biological mechanisms of SNP in enhancing the quality of Radix Paeoniae Rubra and Radix Paeoniae Alba, this study treated isolated fresh roots of P. lactiflora with SNP solutions of different concentrations, and its research contents include: (1) investigating the effect of exogenous NO on O2·- and H2O2 to verify whether ROS are products of NO-induced stress; (2) examining the effect of exogenous NO on MDA to verify whether NO can induce the physiological effects of environmental stress; (3) exploring the effect of exogenous NO on antioxidant enzymes to investigate the patterns and the limitations of these enzymes in scavenging ROS; (4) assessing the effect of exogenous NO on secondary metabolism to verify whether NO can regulate metabolic pathways and enhance secondary metabolism; and (5) evaluating the effect of ROS scavengers on the reversal of NO-induced effects to confirm whether ROS act as the key mediators linking exogenous NO to the secondary metabolism of P. lactiflora. This study centers on medicinal material quality, using fresh medicinal parts to clarify the association between environmental stress and secondary metabolism, elucidate the formation mechanism of the quality of medicinal materials, and explore new approaches to improving quality.
2 Materials and instruments
2.1 Materials
The experimental materials were obtained from four-year-old cultivated RRP-germplasm and RAP-germplasm of P. lactiflora, grown at the medicinal herbs production base in the Greater Khingan Mountains region of Heilongjiang Province, China. The fresh roots were harvested on October 5, 2024, with more than 10 intact plants of each variety selected as research subjects, totaling 15 kg of fresh roots, authenticated by Professor Xiang-cai Meng, Heilongjiang University of Chinese Medicine.
2.2 Reagents
Protein quantification (TP) assay kit, H2O2 assay kit, MDA assay kit, superoxide dismutase (SOD) assay kit, catalase (CAT) assay kit, peroxidase (POD) assay kit, and phenylalanine ammonia-lyase (PAL) assay kit (Nanjing Jiancheng Bioengineering Institute, Nanjing, China, batch numbers: 20241231, 20250103, 20250106, 20241226, 20250104, 20241231, and 20241106, respectively); plant 1,3-bisphosphoglycerate (1,3-DPG) enzyme-linked immunosorbent assay (ELISA) kit and plant 3-Hydroxy-3-Methylglutaryl-CoA reductase (HMGR) ELISA kit (Jiangsu Jingmei Biotechnology Co., Ltd., Nanjing, China, batch numbers: 20250228 and 20250409, respectively); O2·- level detection kit (Beijing Solarbio Science & Technology Co., Ltd., Beijing, China, batch number: 2501001001); methanol (analytical grade, Tianjin Fuyu Fine Chemical Co., Ltd., Tianjin, China, batch number: 20240509); phosphoric acid (analytical grade, Tianjin Hengxing Chemical Reagent Manufacturing Co., Ltd., Tianjin, China, batch number: 20240406); acetonitrile (HPLC grade, Beijing Dikma Technologies Inc., Beijing, China, batch number: 20240318); sodium nitroprusside (Zhengzhou Pini Chemical Reagent Factory, Zhengzhou, China, batch number: 20240521); glacial acetic acid (analytical grade, Tianjin Tianli Chemical Reagent Co., Ltd., Tianjin, China, batch number: 20231108); paeoniflorin, albiflorin, oxypaeoniflorin, gallic acid, catechin, paeonol, benzoic acid, and benzoylpaeoniflorin (Chengdu Alfa Biotechnology Co., Ltd., Chengdu, China, batch numbers: AFCE0452, MRDE0804, AFCC0904, AFDG1553, AFBF2708, AFBG1209, AFCJ1302, and AFCC0952, respectively; purity ≥98.0%); physiological saline (Harbin Sanlian Pharmaceutical Co., Ltd., Harbin, China, batch number: 20241102); phosphate buffer (pH 7.2, Shanghai Aladdin Biochemical Technology Co., Ltd., Shanghai, China, batch number: 20241219); α-tocopherol (Shanghai Aladdin Biochemical Technology Co., Ltd., Shanghai, China, batch number: 20250904); and N-acetyl-L-cysteine (Guangzhou Chemical Reagent Factory, Guangzhou, China, batch number: 20250820).
3 Methods
3.1 Sample handling
3.1.1 Treatment of fresh roots of P. lactiflora with different SNP concentrations
Fresh, intact roots of RRP-germplasm and RAP-germplasm were divided into four groups according to diameter (within ±0.5 cm ranges), length (within ±5 cm ranges), and weight (within ±50 g ranges). An appropriate amount of fresh samples were selected, surface soil was cleaned off, and the samples were uniformly sprayed with SNP solutions at concentrations of 0.0 (CK), 0.1, 0.5, and 2.5 mmol/L, respectively. Spraying was performed every 8 hours until the surfaces of fresh roots reached water saturation, and the entire process was conducted in the dark for 3 days. The samples were collected on the 0th, 1st, 2nd, and 3rd days, with a sampling interval of 24 h. The sampling methods were as follows: (1) Each sample was derived from at least 5 plants. Using an AG135 analytical balance (0.1 mg precision; METTLER, Switzerland), precisely 50 aliquots of 0.3 g each were weighed and stored at -80°C in a freezer. These aliquots were used for the determination of O2·-, H2O2, MDA, and 1,3-DPG contents, as well as the activities of SOD, CAT, POD, PAL, and HMGR. During the determination process, absorbance values were read using a Thermo microplate reader (Thermo Inc., USA) to calculate the content of each index. (2) Fresh roots (>200 g per group) were used: for RRP-germplasm, after removing root tips, root bases, and fine roots, the roots were sun-dried; for RAP-germplasm, after the same pretreatment, the roots were boiled in water, peeled, and then sun-dried. The dried roots were pulverized and passed through a No. 3 sieve, and these powdered samples were used for the determination of the contents of paeoniflorin, albiflorin, oxypaeoniflorin, gallic acid, catechin, paeonol, benzoic acid, and benzoylpaeoniflorin. Quantitative analysis was performed using a Model 1200 HPLC (Agilent Technologies Inc., USA). All samples were processed in triplicate.
3.1.2 Combined treatment of fresh roots of RRP-germplasm with SNP and ROS scavengers
Additional fresh roots of RRP-germplasm meeting the same selection criteria as Section 2.1.1 were divided into four groups: water control group (CK), SNP treatment group, SNP +α-tocopherol (α-Toc) group, and SNP + N-acetylcysteine (NAC) group. The CK group was sprayed with distilled water; the SNP treatment group was sprayed with 0.5 mmol/L SNP solution; and the combined groups were first sprayed with 0.5 mmol/L SNP solution, followed by 0.1 mmol/L α-Toc or 1.0 mmol/L NAC solution (2-hour interval between sprays). For all groups, spraying was performed every 8 hours until the solution was about to drip, with the entire process conducted in the dark for 3 days. Samples were collected on Days 0, 1, 2, and 3 (24-hour intervals), following the sampling protocol in Section 2.1.1 with modifications as follows: (1) Each sample was derived from at least 5 plants. 30 aliquots of 0.3 g each were precisely weighed and stored at -80°C. These aliquots were used only for determining O2·-, H2O2, and MDA contents. (2) Fresh roots (>200 g per group) were processed by removing root tips, root bases, and fine roots, then sun-drying, pulverizing, and passing through a No. 3 sieve. These powdered samples were used for determining paeoniflorin and 7 other components. The instruments used in this experiment were the same as those in Section 2.1.1. All samples were processed in triplicate.
3.2 Determination of ROS level
The levels of O2·- and H2O2 are determined using O2·- detection kits and H2O2 assay kits (Zhang et al., 2025), with the results expressed in μmol/g and mmol/g, respectively.
3.3 Determination of MDA level
The MDA content in fresh roots is quantified using an MDA assay kit with a thiobarbituric acid (TBA) method (Zhang et al., 2025), and the results are reported in nmol/g.
3.4 Measurement of antioxidant enzyme activities
The activities of SOD, POD, and CAT in fresh roots are assessed using their respective assay kits (Zhang et al., 2025), with all results expressed in U/g.
3.5 Determination of 1,3-DPG level
The 1,3-DPG content in fresh roots is measured using a plant-specific 1,3-DPG ELISA kit (Song et al., 2023), and the results are presented in μmol/L.
3.6 Measurement of PAL and HMGR activities
The activities of PAL and HMGR in fresh roots are evaluated using their respective assay kits (Shen et al., 2020; Song et al., 2023), with the results reported in U/g and μg/L, respectively.
3.7 Determination of secondary metabolite level
3.7.1 Preparation of reference standard solutions
An appropriate amount of paeoniflorin, albiflorin, oxypaeoniflorin, gallic acid, catechin, paeonol, benzoic acid, and benzoylpaeoniflorin was accurately weighed and placed in a volumetric flask. The mixture was dissolved in 50% methanol to prepare a mixed reference standard solution containing the eight components. The final concentrations of these eight components in the solution were 1.058, 1.047, 0.687, 0.560, 0.550, 0.488, 0.753, and 0.525 g/L, respectively.
3.7.2 Preparation of the test solution
0.20 g of the medicinal powder was accurately weighed and transferred into a stoppered conical flask. 20.0 mL of 50% methanol solution was precisely added, the flask was stoppered tightly, and subsequently weighed. The mixture was allowed to soak for 4 hours, followed by ultrasonication (200 W power, 40 kHz frequency) carried out for 30 minutes. After cooling, the flask was reweighed, and the lost mass was replenished with 50% methanol. The solution was centrifuged at 4000 r/min for 5 minutes, the supernatant was collected, and filtered through a 0.22 μm microporous membrane to obtain the final test solution.
3.7.3 Chromatographic conditions
The separation is performed on a Diamonsil C18 column (250 mm × 4.6 mm, 5 μm) using a mobile phase consisting of acetonitrile (A) and a pH 2.7 phosphoric acid aqueous solution (B) under gradient elution as follows: 0~20 min, 5% A to 15% A; 20~40 min, 15% A to 20% A; 40~50 min, 20% A; 50~80 min, 20% A to 40% A; 80~90 min, 40% A to 5% A; 90~100 min, 5% A. The column temperature is maintained at 25°C, with an injection volume of 10 μL and a flow rate of 1 mL/min. Detection is carried out at a wavelength of 230 nm (Supplementary Figure 1).
3.7.4 Methodological investigation
3.7.4.1 Linear relationship
The prepared mixed reference solution as described in Section 2.7.1 was serially diluted with 50% methanol to prepare a series of concentrations. Under the aforementioned chromatographic conditions, the solutions were injected, and the peak areas of paeoniflorin, albiflorin, oxypaeoniflorin, gallic acid, catechin, paeonol, benzoic acid, and benzoylpaeoniflorin were recorded. Regression analysis was performed using the mass concentration as the abscissa (X) and the peak area as the ordinate (Y). The regression equations, coefficients of determination (R²), and linear ranges for the eight components were calculated, demonstrating good linearity within the specified ranges (Supplementary Table 1).
3.7.4.2 Precision
The same sample solution was analyzed under the aforementioned chromatographic conditions with six replicate injections to determine intra-day precision, followed by analyzing it over three consecutive days to assess inter-day precision. The relative standard deviations (RSD) of intra-day and inter-day precision for the eight components were 1.80%, 1.19%, 0.49%, 0.72%, 1.08%, 1.42%, 0.84%, and 1.53%; and 1.41%, 1.10%, 0.69%, 0.56%, 0.97%, 0.76%, 0.53%, and 0.79%, respectively, demonstrating excellent precision.
3.7.4.3 Stability
The same sample solution was analyzed at 0, 2, 4, 8, 12, and 24 h under the aforementioned chromatographic conditions. The RSD values of the eight components were 1.24%, 0.94%, 0.81%, 0.82%, 1.32%, 1.08%, 0.81%, and 1.09%, respectively, demonstrating that the sample solution remained stable within 24 h.
3.7.4.4 Reproducibility
Six sample solutions were prepared from the same test material and analyzed under the aforementioned chromatographic conditions. The RSD values for the eight components were determined to be 1.13%, 0.54%, 0.61%, 0.79%, 1.02%, 0.59%, 1.07%, and 0.95%, respectively, demonstrating excellent repeatability of the analytical method.
3.7.4.5 Spike recovery test
Six portions of Paeoniae Radix Rubra powder were accurately weighed, and appropriate amounts of the corresponding reference standards of known concentration were added to each portion to prepare six test solutions. The samples were then analyzed under the established chromatographic conditions. The recovery rates of the eight components were determined to be 100.2%, 99.5%, 99.1%, 99.9%, 99.4%, 98.8%, 100.3%, and 98.2%, with corresponding RSD values of 1.08%, 1.38%, 1.22%, 1.56%, 0.91%, 0.85%, 1.26%, and 1.30%, respectively, demonstrating satisfactory recovery and accuracy with the proposed method.
3.7.5 Data processing methods
The data were processed using Microsoft Office Excel 2021 (Microsoft Corporation, USA), and graphs were generated with Prism 8 (GraphPad Software, USA). All data are presented as mean ± standard deviation (Mean ± S.D.). Statistical analyses were performed using independent samples t-tests in IBM SPSS 28.0 (IBM Corporation, USA). A statistically significant difference was defined as *P< 0.05 or **P< 0.01.
4 Results
4.1 ROS level in fresh roots of P. lactiflora
4.1.1 ROS level in fresh roots of RRP-germplasm
Compared with day 0, the O2·- level in the water (CK) group showed no significant change trend, while all SNP-treated groups exhibited an initial increase followed by a decrease. The O2·- level in the 0.1, 0.5, and 2.5 mmol/L SNP groups all peaked on day 1, showing an increase of 61.5%, 130.8%, and 182.7% respectively, with the 2.5 mmol/L SNP group showing the most pronounced elevation (Figure 1A). Similarly, compared with day 0, the H2O2 level in the water group showed no significant change trend, while all SNP-treated groups exhibited an initial increase followed by a decrease. The H2O2 level in the 0.1, 0.5, and 2.5 mmol/L SNP groups peaked on days 2, 1, and 2, respectively, showing increases of 58.7%, 121.7%, and 93.5%, with the 0.5 mmol/L group showing the most pronounced elevation (Figure 1B). The ROS levels in all SNP-treated groups were significantly higher than those in the CK group, indicating that SNP could induce ROS production.
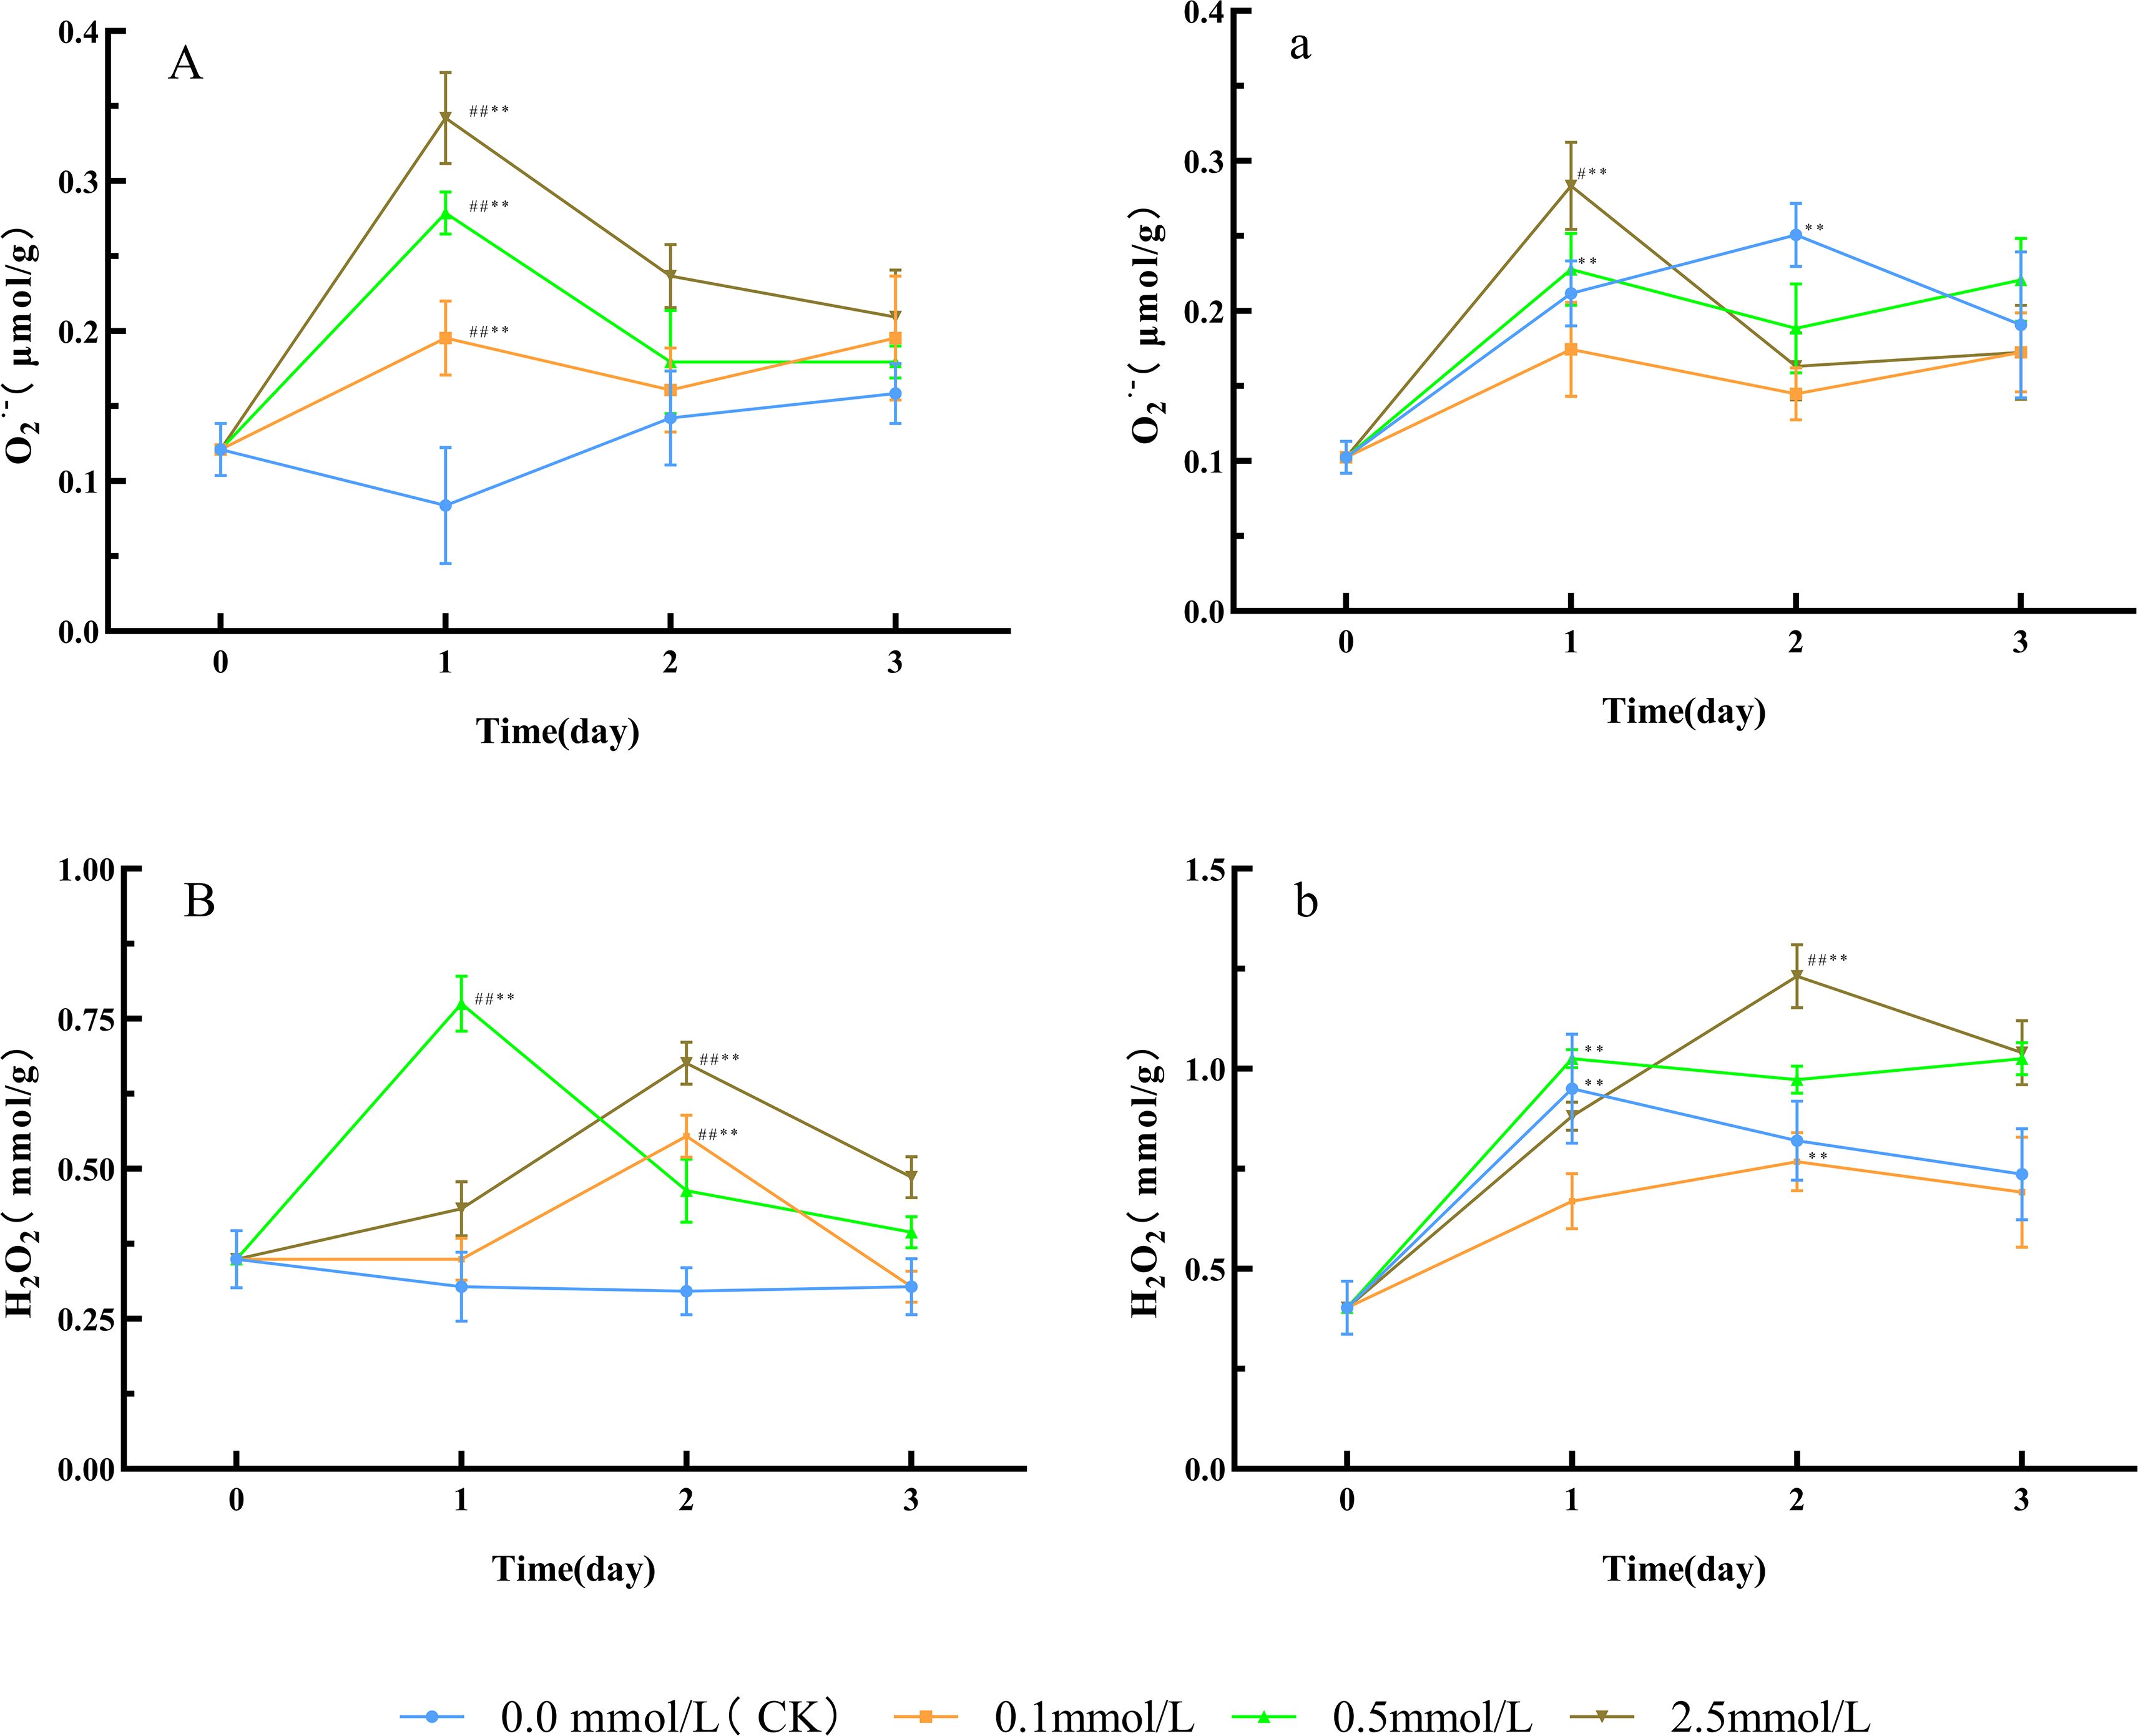
Figure 1. ROS level changes in Paeoniae Radix Rubra (A, B) and Paeoniae Radix Alba (a, b) under different SNP concentrations. Data are presented as ± s (n = 3, error bars: SD). Significance: */** vs day 0 (*P < 0.05, **P < 0.01); #/## vs 0.0 mmol/L SNP (#P < 0.05, ## P < 0.01). Groups: 0.0 mmol/L SNP (CK, blue), 0.1 mmol/L SNP (orange), 0.5 mmol/L SNP (green), 2.5 mmol/L SNP (brown).A/a: O2·- contents (μmol/g); B/b: H2O2 contents (mmol/g).
4.1.2 ROS level in fresh roots of RAP-germplasm
Compared with day 0, the 0.1 mmol/L SNP group showed no significant change in O2·- level, while the other groups exhibited an initial increase followed by a decrease. The O2·- level in the 0.0, 0.5, and 2.5 mmol/L SNP groups peaked on days 2, 1, and 1, respectively, with an increase of 145.5%, 122.7%, and 177.3%, respectively, and the 2.5 mmol/L SNP group showed the most pronounced elevation (Figure 1a). Regarding H2O2 levels, compared to day 0, all SNP-treated groups showed an initial increase followed by a decrease in H2O2 levels, with the most pronounced elevation observed in the 2.5 mmol/L SNP group. The H2O2 levels in the 0, 0.1, 0.5, and 2.5 mmol/L SNP groups peaked on days 1, 2, 1, and 2, respectively, exhibiting an increase of 135.8%, 90.6%, 154.7%, and 205.7% (Figure 1b). These results indicate that the ROS levels in all groups generally displayed an initial rise followed by a decline, and the increases were positively correlated with SNP concentration.
4.2 MDA level in fresh roots of P. lactiflora
4.2.1 MDA level in fresh roots of RRP-germplasm
Compared with day 0, the MDA contents in the water (CK) group showed a slight increasing trend, while all SNP-treated groups exhibited greater increases than those in the CK group. The most pronounced elevation was observed in the 2.5 mmol/L SNP group. The MDA contents in the 0.1, 0.5, and 2.5 mmol/L SNP groups peaked on days 2, 2, and 3 of treatment, respectively, with increases of 100.1%, 147.8%, and 173.9% (Figure 2A). In all SNP-treated groups, the MDA levels were significantly higher than those in the CK group, indicating that SNP caused substantial cellular damage.
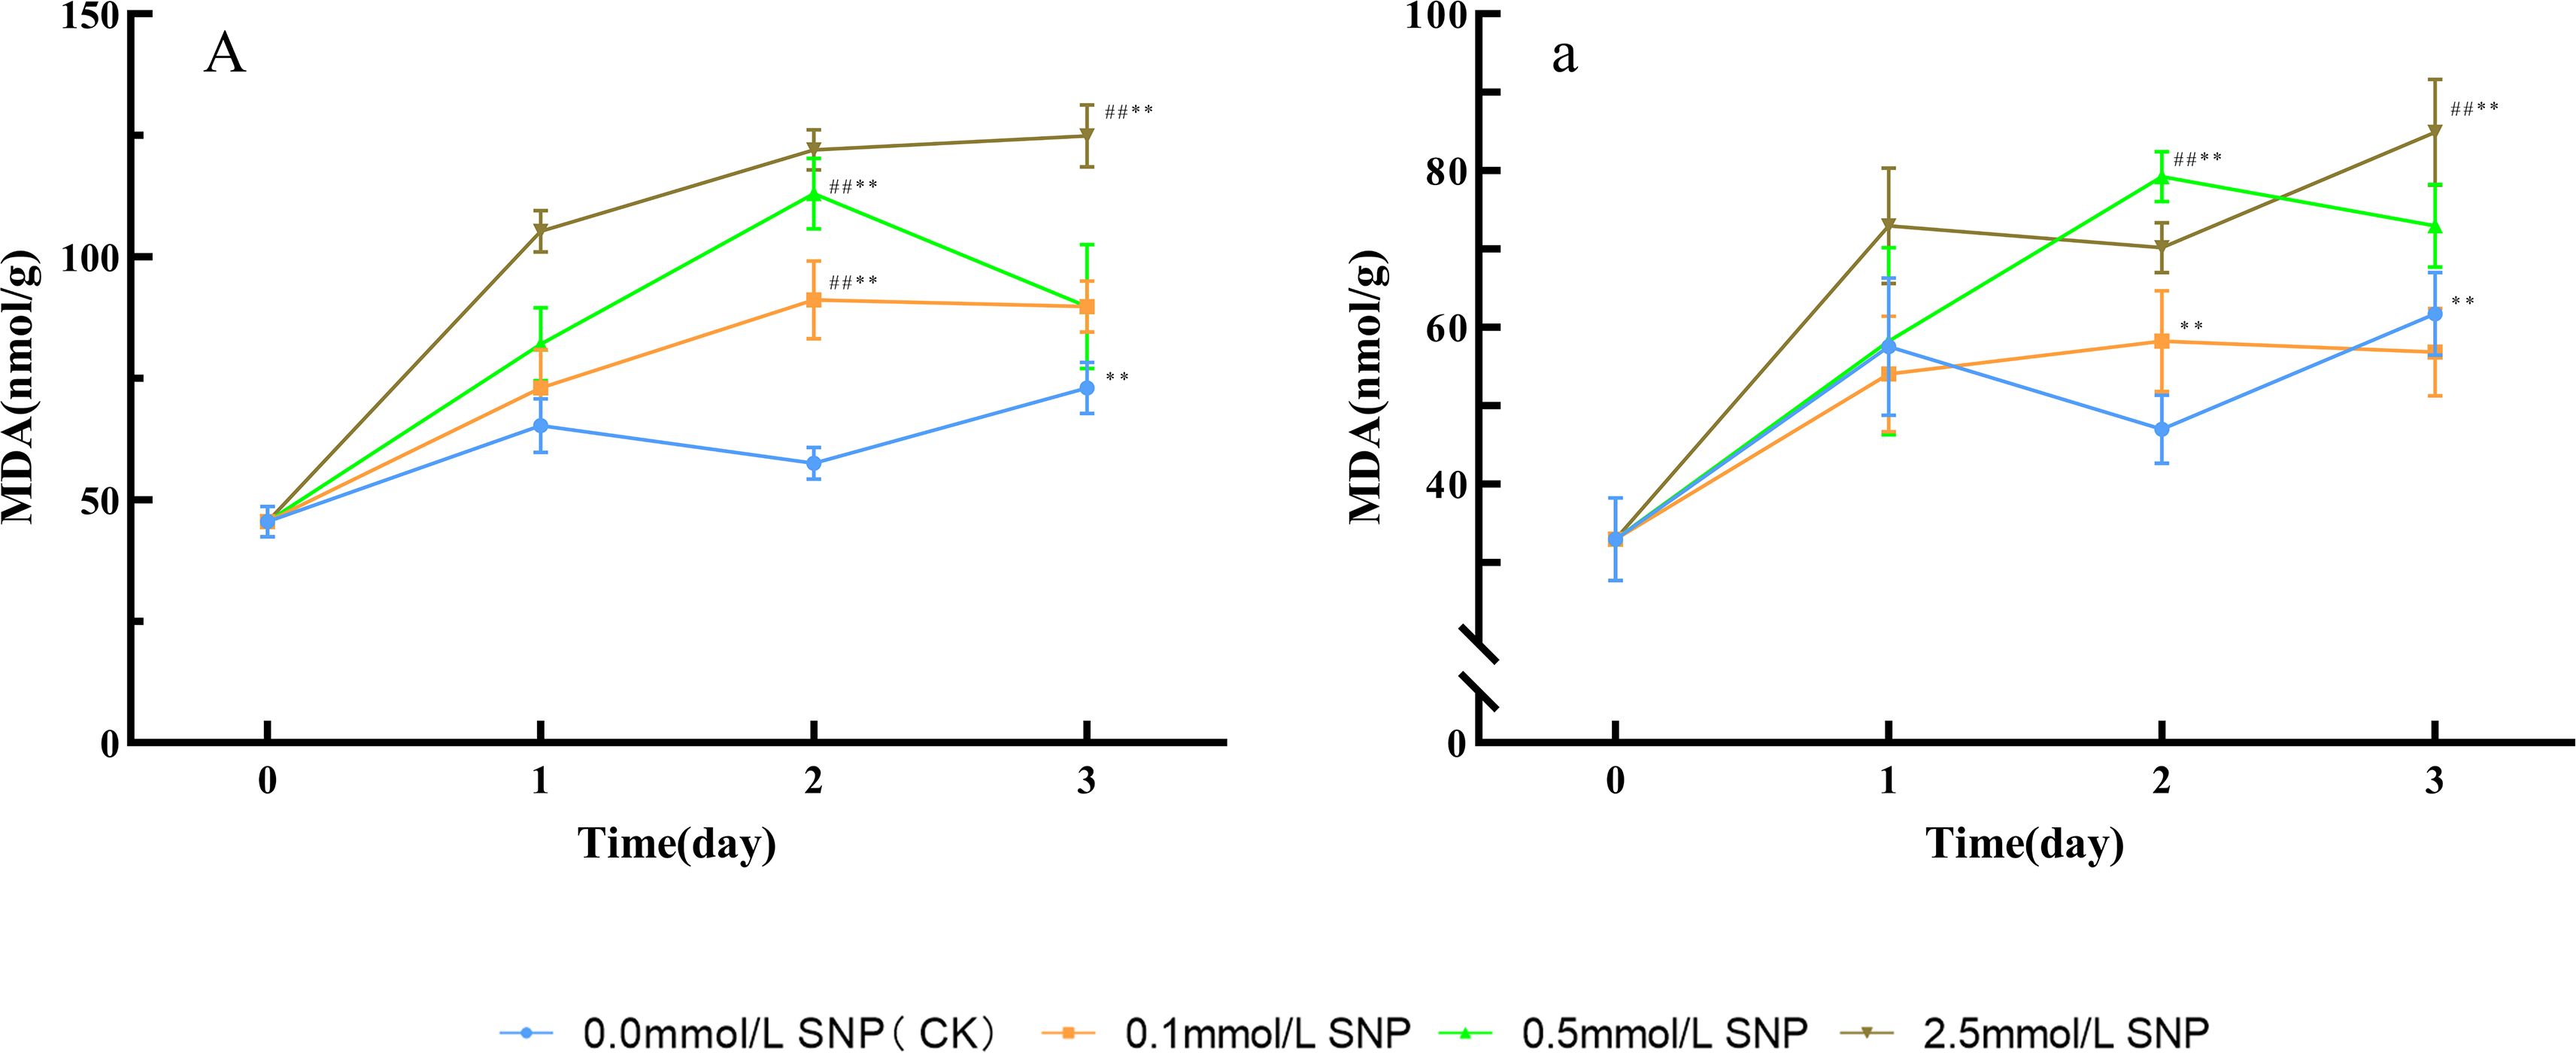
Figure 2. MDA content changes in Paeoniae Radix Rubra (A) and Paeoniae Radix Alba (a) under different SNP concentrations. Data are presented as ± s (n = 3, error bars: SD). Significance: */** vs day 0 (*P < 0.05, **P < 0.01); #/## vs 0.0 mmol/L SNP (#P < 0.05, ##P < 0.01). Groups: 0.0 mmol/L SNP (CK, blue), 0.1 mmol/L SNP (orange), 0.5 mmol/L SNP (green), 2.5 mmol/L SNP (brown). A/a: MDA contents (nmol/g).
4.2.2 MDA level in fresh roots of RAP-germplasm
Compared with day 0, the MDA contents in the water and 0.1 mmol/L SNP groups showed minor fluctuations, while the other two groups exhibited an upward trend, with the most significant increase observed in the 2.5 mmol/L SNP group. The MDA contents in the 0.5 and 2.5 mmol/L SNP groups peaked on days 2 and 3 of treatment, respectively, showing increases of 140.4% and 157.4% compared to day 0 (Figure 2a).
4.3 Antioxidant enzyme activities in fresh roots of P. lactiflora
4.3.1 Antioxidant enzyme activities in fresh roots of RRP-germplasm
Compared with day 0, the SOD activities in the water (0 mmol/L SNP/CK) group showed no significant change trend. The 0.1 mmol/L SNP group exhibited a gradual increasing trend, while the other two groups had an initial increase followed by a decrease. The SOD activities in the 0.1, 0.5, and 2.5 mmol/L SNP groups reached their peaks on days 3, 1, and 1 of treatment, respectively, showing increases of 36.3%, 55.9%, and 36.7%, with the 0.5 mmol/L SNP group showing the most pronounced elevation (Figure 3A). Similarly, compared with day 0, the CAT activities in the water group showed no significant change trend, while all other SNP groups exhibited an initial increase followed by a decrease. Among them, the 0.5 mmol/L SNP group demonstrated the most pronounced elevation. The CAT activities in the 0.1, 0.5, and 2.5 mmol/L SNP groups peaked on days 2, 1, and 1, respectively, showing increases of 45.8%, 111.7%, and 81.1% (Figure 3B). Likewise, compared with day 0, the POD activities in the water group showed no significant change trend, while all other SNP-treated groups exhibited an initial increase followed by a decrease. The POD activities in the 0.1, 0.5, and 2.5 mmol/L SNP groups peaked on day 2, increasing by 57.6%, 89.6%, and 65.6%, respectively, with the 0.5 mmol/L SNP group showing the most pronounced rise (Figure 3C). It is not difficult to find that from days 1 to 3, the antioxidant enzyme activities in all SNP-treated groups were higher than those in the CK group, while the CK group showed almost no change, indicating that antioxidant enzymes play a crucial role in the early stages of SNP treatment.
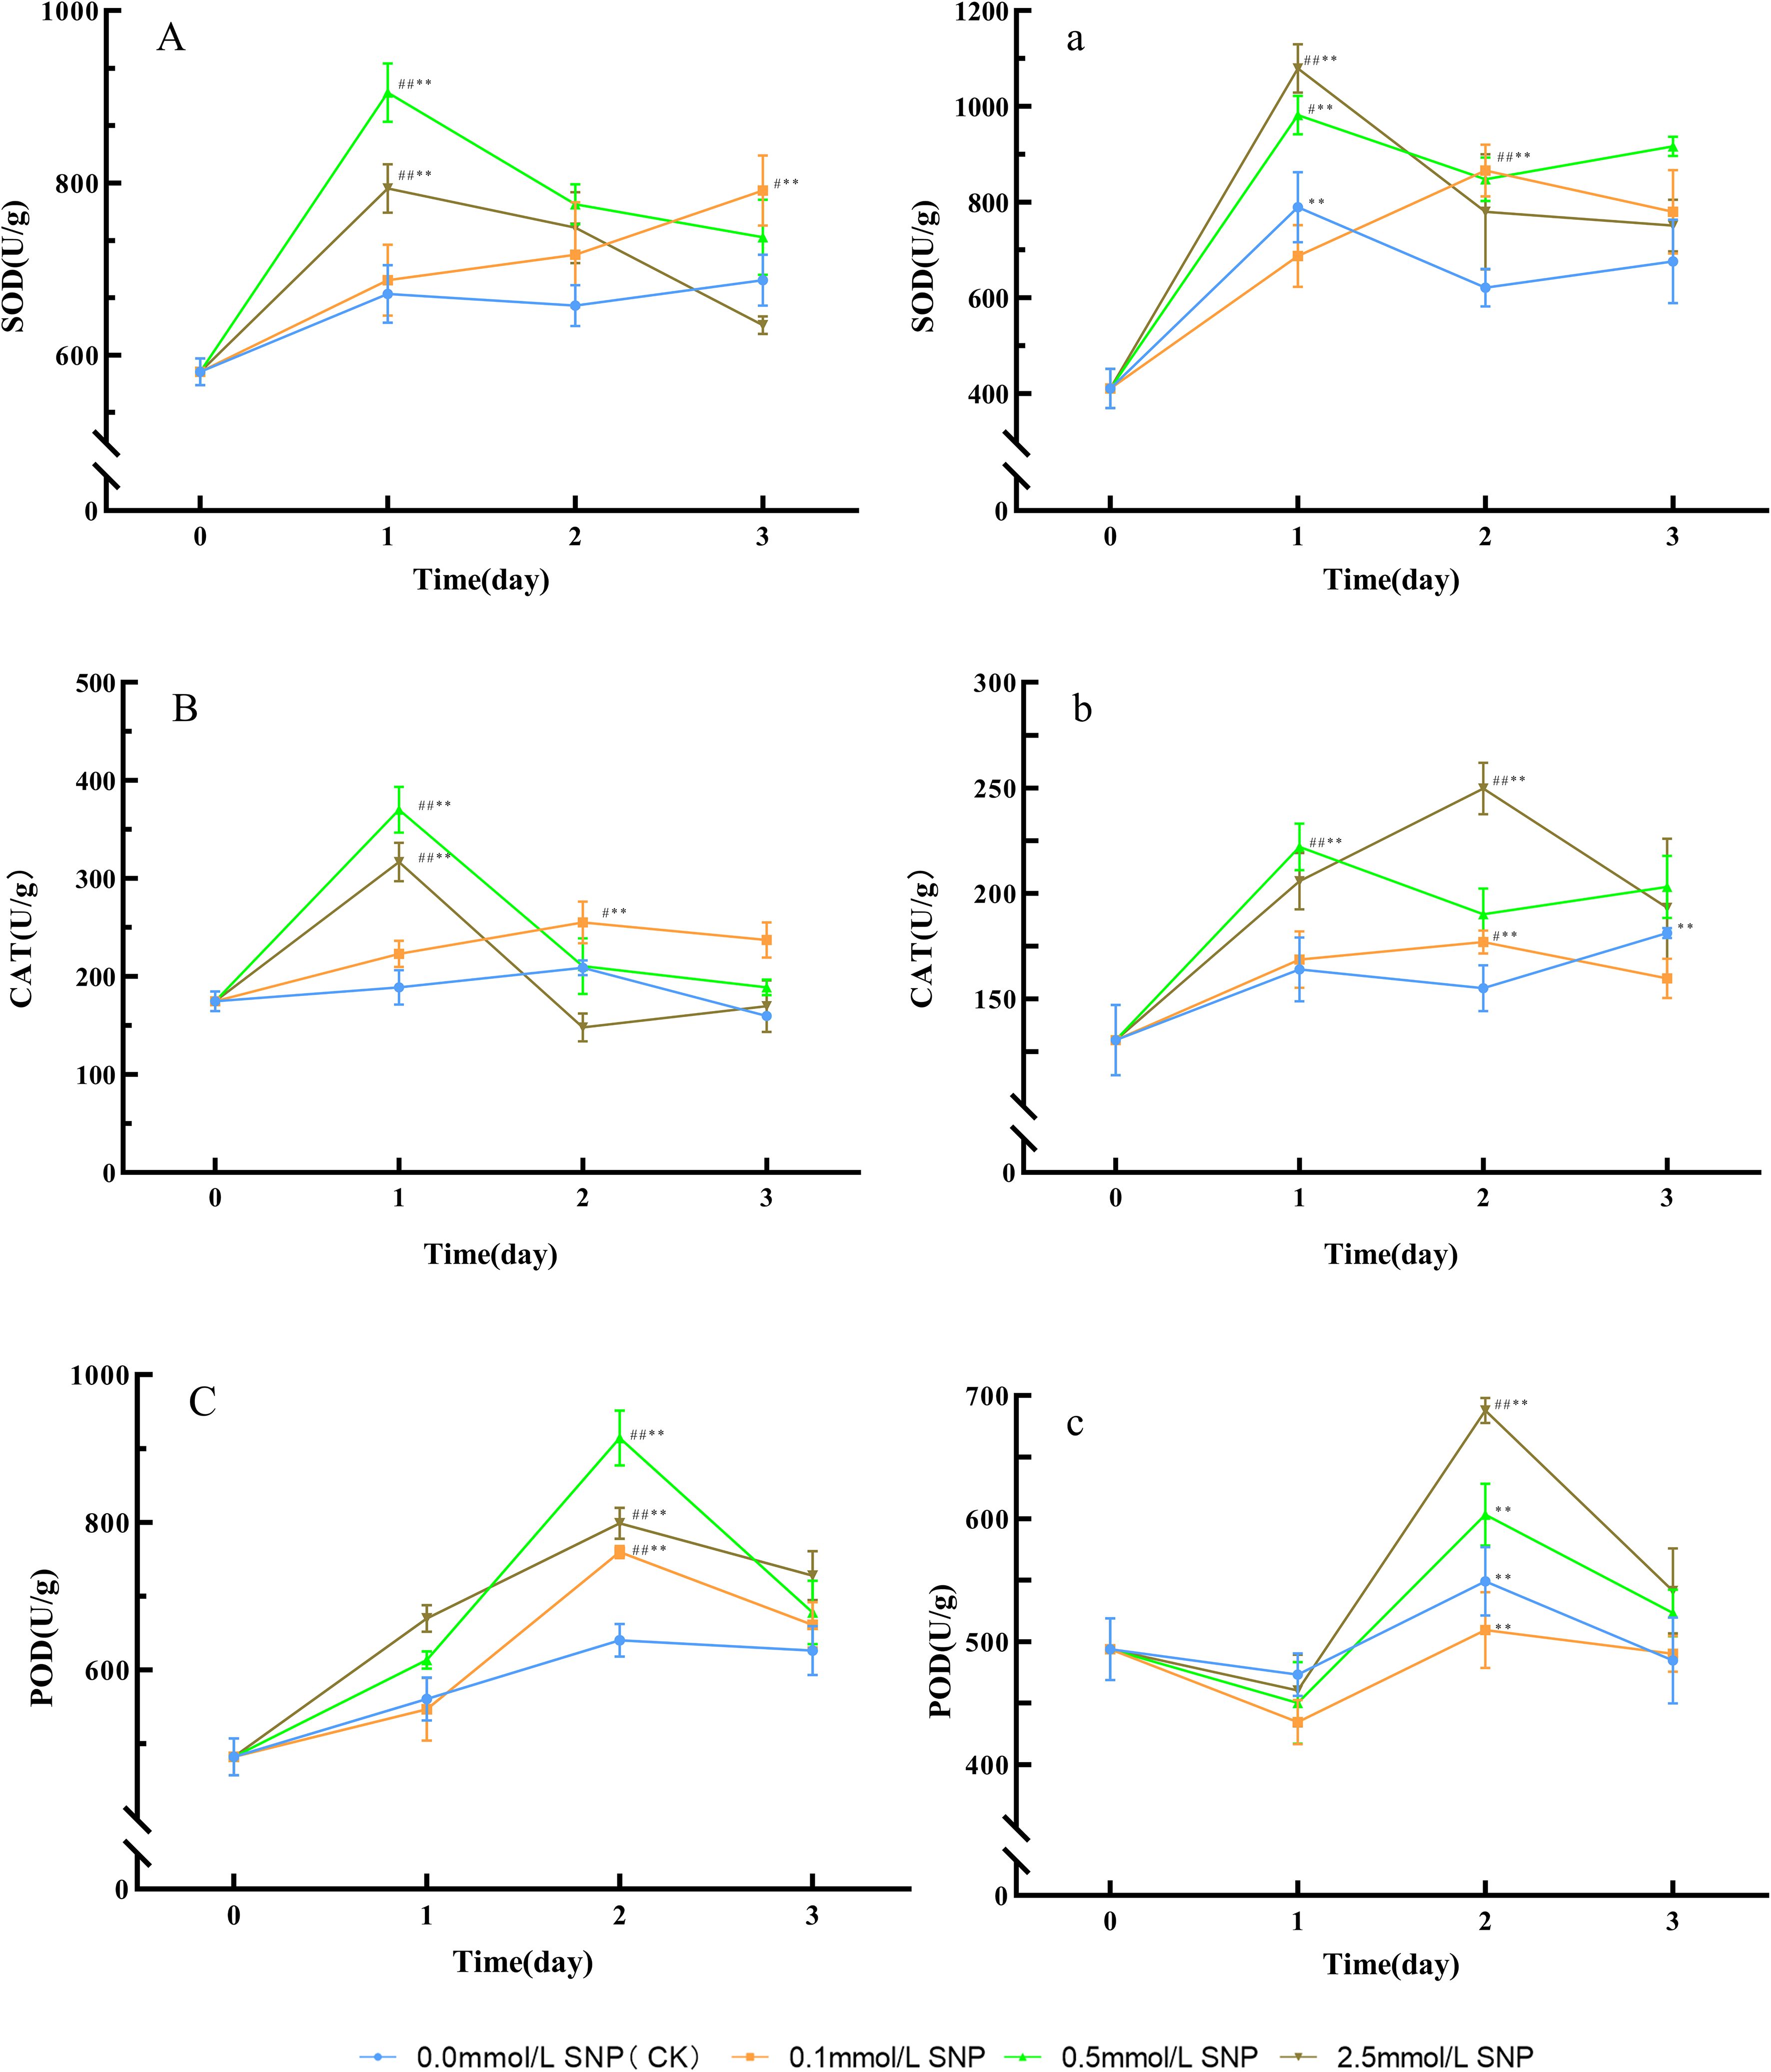
Figure 3. Antioxidant enzyme activities changes in Paeoniae Radix Rubra (A–C) and Paeoniae Radix Alba (a–c) under different SNP concentrations. Data are presented as ± s (n = 3, error bars: SD). Significance: */** vs day 0 (*P < 0.05, **P < 0.01); #/## vs 0.0 mmol/L SNP (#P < 0.05, ##P < 0.01). Groups: 0.0 mmol/L SNP (CK, blue), 0.1 mmol/L SNP (orange), 0.5 mmol/L SNP (green), 2.5 mmol/L SNP (brown). (A, a): SOD activities; (B, b) CAT activities; (C, c) POD activities (all units: U/g).
4.3.2 Antioxidant enzyme activities in fresh roots of RAP-germplasm
Compared with day 0, the SOD activities in all groups showed an initial increase followed by a decline. The SOD activities in the water, 0.1, 0.5, and 2.5 mmol/L SNP groups reached peaks on days 1, 2, 1, and 1 of treatment, respectively, with increases of 92.3%, 111.0%, 139.2%, and 163.0%, with the most pronounced increase observed in the 2.5 mmol/L SNP group (Figure 3a). Regarding CAT activities, compared with day 0, the CAT activities in the water and 0.1 mmol/L SNP groups showed minor fluctuations, while the other two SNP groups exhibited an initial increase followed by a decline. The CAT activities in the 0.5 and 2.5 mmol/L SNP groups peaked on days 1 and 2 of treatment, respectively, showing increases of 70.3% and 91.6%, with the 2.5 mmol/L SNP group showing the most pronounced elevation (Figure 3b). As for POD activities, compared with day 0, the POD activities in all treatment groups generally showed an initial decrease followed by an increase and subsequent decline. All groups peaked on day 2, showing increases of 49.3%, 38.5%, 64.0%, and 87.1%, respectively, with the 2.5 mmol/L SNP group showing the most significant increase (Figure 3c).
4.4 PAL and HMGR activities in fresh roots of P. lactiflora
4.4.1 PAL and HMGR activities in fresh roots of RRP-germplasm
Compared with day 0, the PAL activities in the water and 0.1 mmol/L SNP groups showed no significant changes, while the other two groups exhibited an initial increase followed by a decrease. The 0.5 mmol/L SNP group had the most pronounced enhancement in PAL activities, reaching its peak on day 1 with a 34.1% increase. The 2.5 mmol/L SNP group peaked on day 2 of treatment, showing a 26.0% elevation (Figure 4A). For HMGR activities, compared with day 0, the HMGR activities in the water and 0.1 mmol/L SNP groups showed minor fluctuations, while the other two groups exhibited an initial increase followed by a decrease. The 0.5 mmol/L SNP group had the most significant enhancement in HMGR activities. Both the 0.5 and 2.5 mmol/L SNP groups reached peaks on day 2, with increases of 61.2% and 35.3%, respectively (Figure 4B).
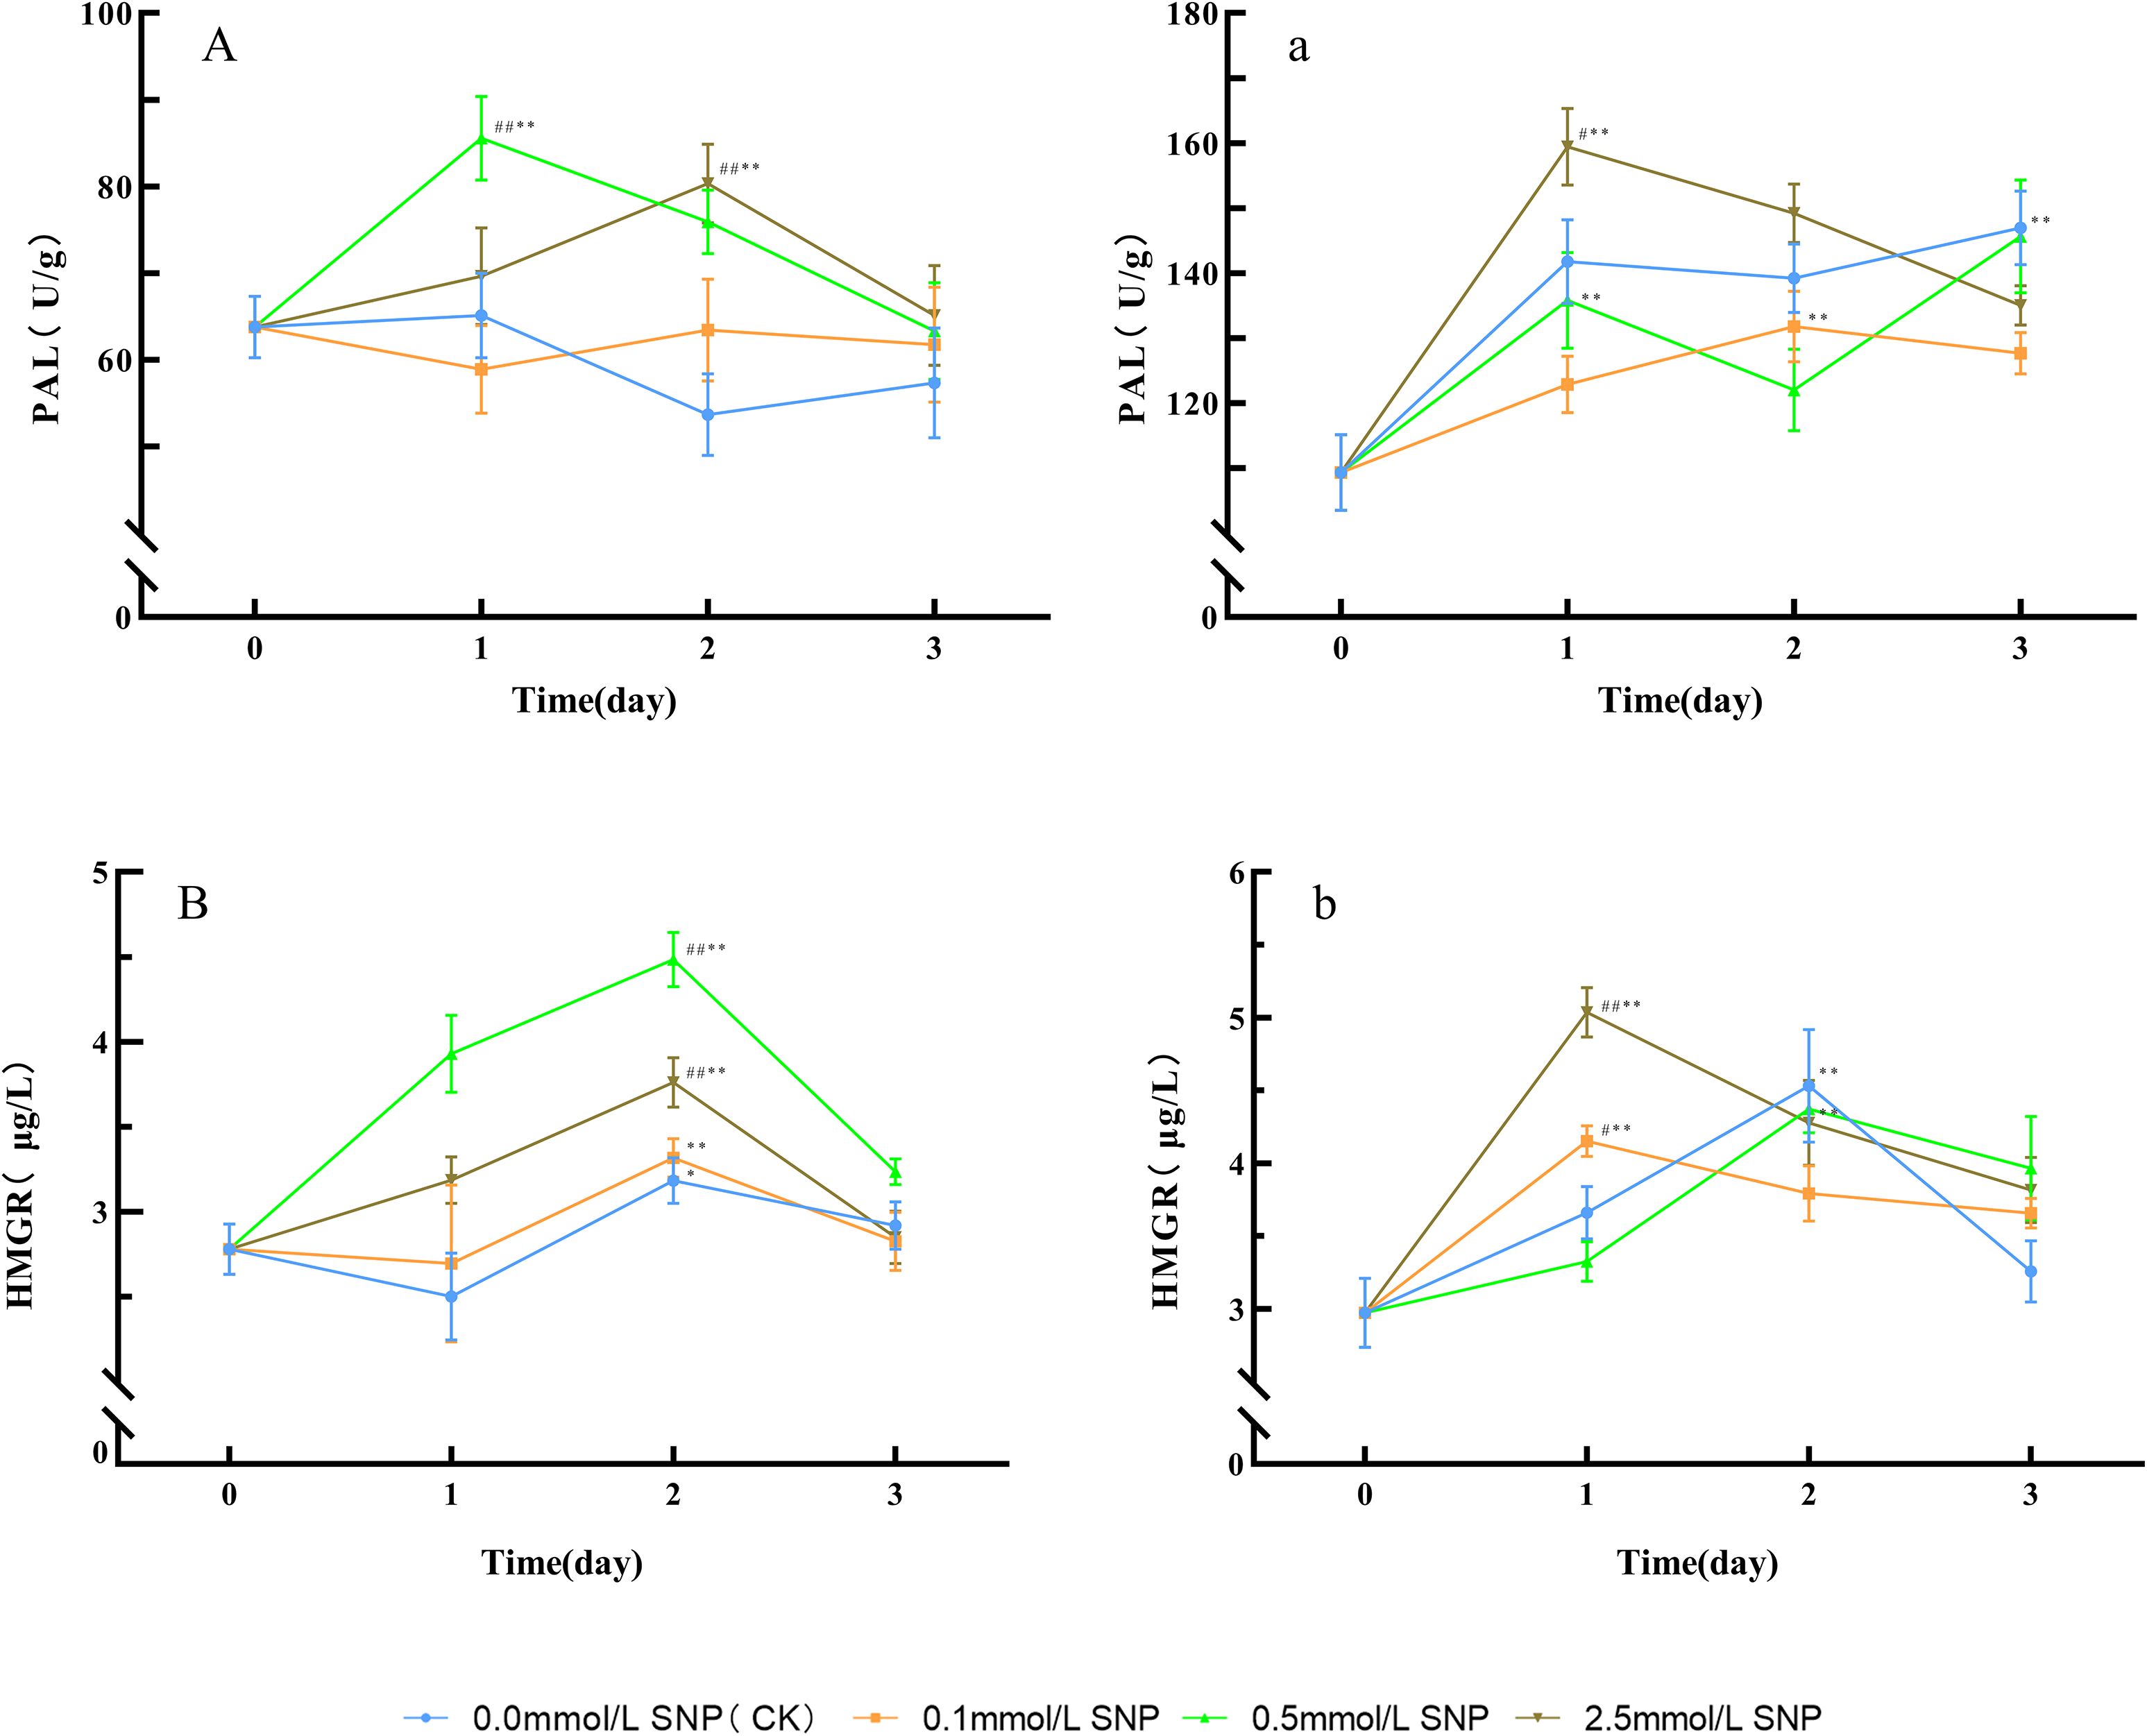
Figure 4. Changes in key enzyme activities in secondary metabolism in Paeoniae Radix Rubra (A, B) and Paeoniae Radix Alba (a, b) under different SNP concentrations. Data are presented as ± s (n = 3, error bars: SD). Significance: */** vs day 0 (*P < 0.05, **P < 0.01); #/## vs 0.0 mmol/L SNP (#P < 0.05, ##P < 0.01). Groups: 0.0 mmol/L SNP (CK, blue), 0.1 mmol/L SNP (orange), 0.5 mmol/L SNP (green), 2.5 mmol/L SNP (brown). (A, a) PAL activities (U/g); (B, b) HMGR activities (μg/L).
4.4.2 PAL and HMGR activities in fresh roots of RAP-germplasm
Compared with day 0, the PAL activities in all groups showed an initial increase followed by a gradual decline. All groups reached their peaks on days 3, 2, 1, and 1, respectively, showing increases of 34.5%, 20.5%, 33.2%, and 45.8%, with the 2.5 mmol/L SNP group showing the most pronounced enhancement (Figure 4a). Regarding HMGR activities, compared with day 0, the HMGR activities in all groups initially increased and subsequently decreased. All groups peaked on days 2, 1, 2, and 1, respectively, with increases of 52.4%, 39.8%, 47.3%, and 69.6%, with the 2.5 mmol/L SNP group showing the most significant increase (Figure 4b). These results indicate that the application of an appropriate concentration of exogenous NO contributes to the increase in the activities of PAL and HMGR.
4.5 Level of secondary metabolites in fresh roots of P. lactiflora
4.5.1 Level of secondary metabolites in fresh roots of RRP-germplasm
Compared with day 0, the paeoniflorin in the water group showed a gradual decreasing trend, while the 2.5 mmol/L SNP group exhibited no significant changes, the remaining two groups exhibited an initial increase followed by a decrease, with the 0.5 mmol/L SNP group displaying the most pronounced elevation. Both the 0.1 and 0.5 mmol/L SNP groups reached their peaks on day 1, showing increases of 8.8% and 19.1%, respectively (Figure 5A). Regarding oxypaeoniflorin, compared with day 0, the oxypaeoniflorin in the water group showed a gradual decreasing trend, while all SNP-treated groups exhibited an initial increase followed by a decrease. The 0.1, 0.5, and 2.5 mmol/L SNP groups reached their peaks on days 1, 1, and 2 of treatment, respectively, showing increases of 40.2%, 115.4%, and 69.0%, the 0.5 mmol/L SNP group with the most significant elevation (Figure 5B). For albiflorin, compared with day 0, the albiflorin in the 2.5 mmol/L SNP group showed a gradual decreasing trend, while the other three groups exhibited an initial increase followed by a decrease. The 0.0, 0.1, and 0.5 mmol/L SNP groups reached their peaks on days 2, 1, and 1 of treatment, respectively, with increases of 114.3%, 85.0%, and 205.4%, the 0.5 mmol/L SNP group with the most significant increase (Figure 5C). As for catechin, compared with day 0, the catechin in the water and 0.1 mmol/L SNP groups showed no significant changes, while the other two groups exhibited an initial increase followed by a decreasing trend. Both the 0.5 and 2.5 mmol/L SNP groups reached their peaks on day 1, showing increases of 201.0% and 122.7%, respectively, the 0.5 mmol/L SNP group with the most pronounced elevation (Figure 5D). In terms of gallic acid, compared with day 0, the gallic acid in the water and 0.1 mmol/L SNP groups showed no significant changes, while the other two groups exhibited an initial increase followed by a decreasing trend. The 0.5 and 2.5 mmol/L SNP groups reached their peaks on days 1 and 2 of treatment, respectively, showing increases of 19.9% and 30.9%, respectively, the 2.5 mmol/L SNP group with the most pronounced increase (Figure 5E). Benzoic acid showed a different pattern; compared with day 0, the benzoic acid in the water group showed a gradual decreasing trend. The 0.5 mmol/L SNP group exhibited no significant changes, while the other two groups exhibited an initial increase followed by a decrease. Both the 0.1 and 2.5 mmol/L SNP groups reached their peaks on day 1, showing increases of 22.3% and 50.4%, respectively, the 2.5 mmol/L SNP group displaying the most pronounced increase (Figure 5F). However, benzoylpaeoniflorin differed from the above substances in its trend; compared with day 0, the benzoylpaeoniflorin in the 2.5 mmol/L SNP group showed an initial decrease followed by an upward trend, returning to the baseline level on day 3 of treatment, while the other three groups exhibited a continuous downward trend throughout the experimental period (Figure 5G). Finally, for paeonol, compared with day 0, the paeonol in the water group showed a gradual decreasing trend, while all SNP-treated groups exhibited an initial increase followed by a decrease. The 0.1, 0.5, and 2.5 mmol/L SNP groups all reached peaks on day 1 of treatment, showing increases of 138.3%, 585.2%, and 228.1%, respectively, the 0.5 mmol/L SNP group with the most significant elevation (Figure 5H). These results indicate that spraying 0.5 mmol/L SNP solution has a relatively good effect on increasing the secondary metabolites in the fresh roots of RRP-germplasm.
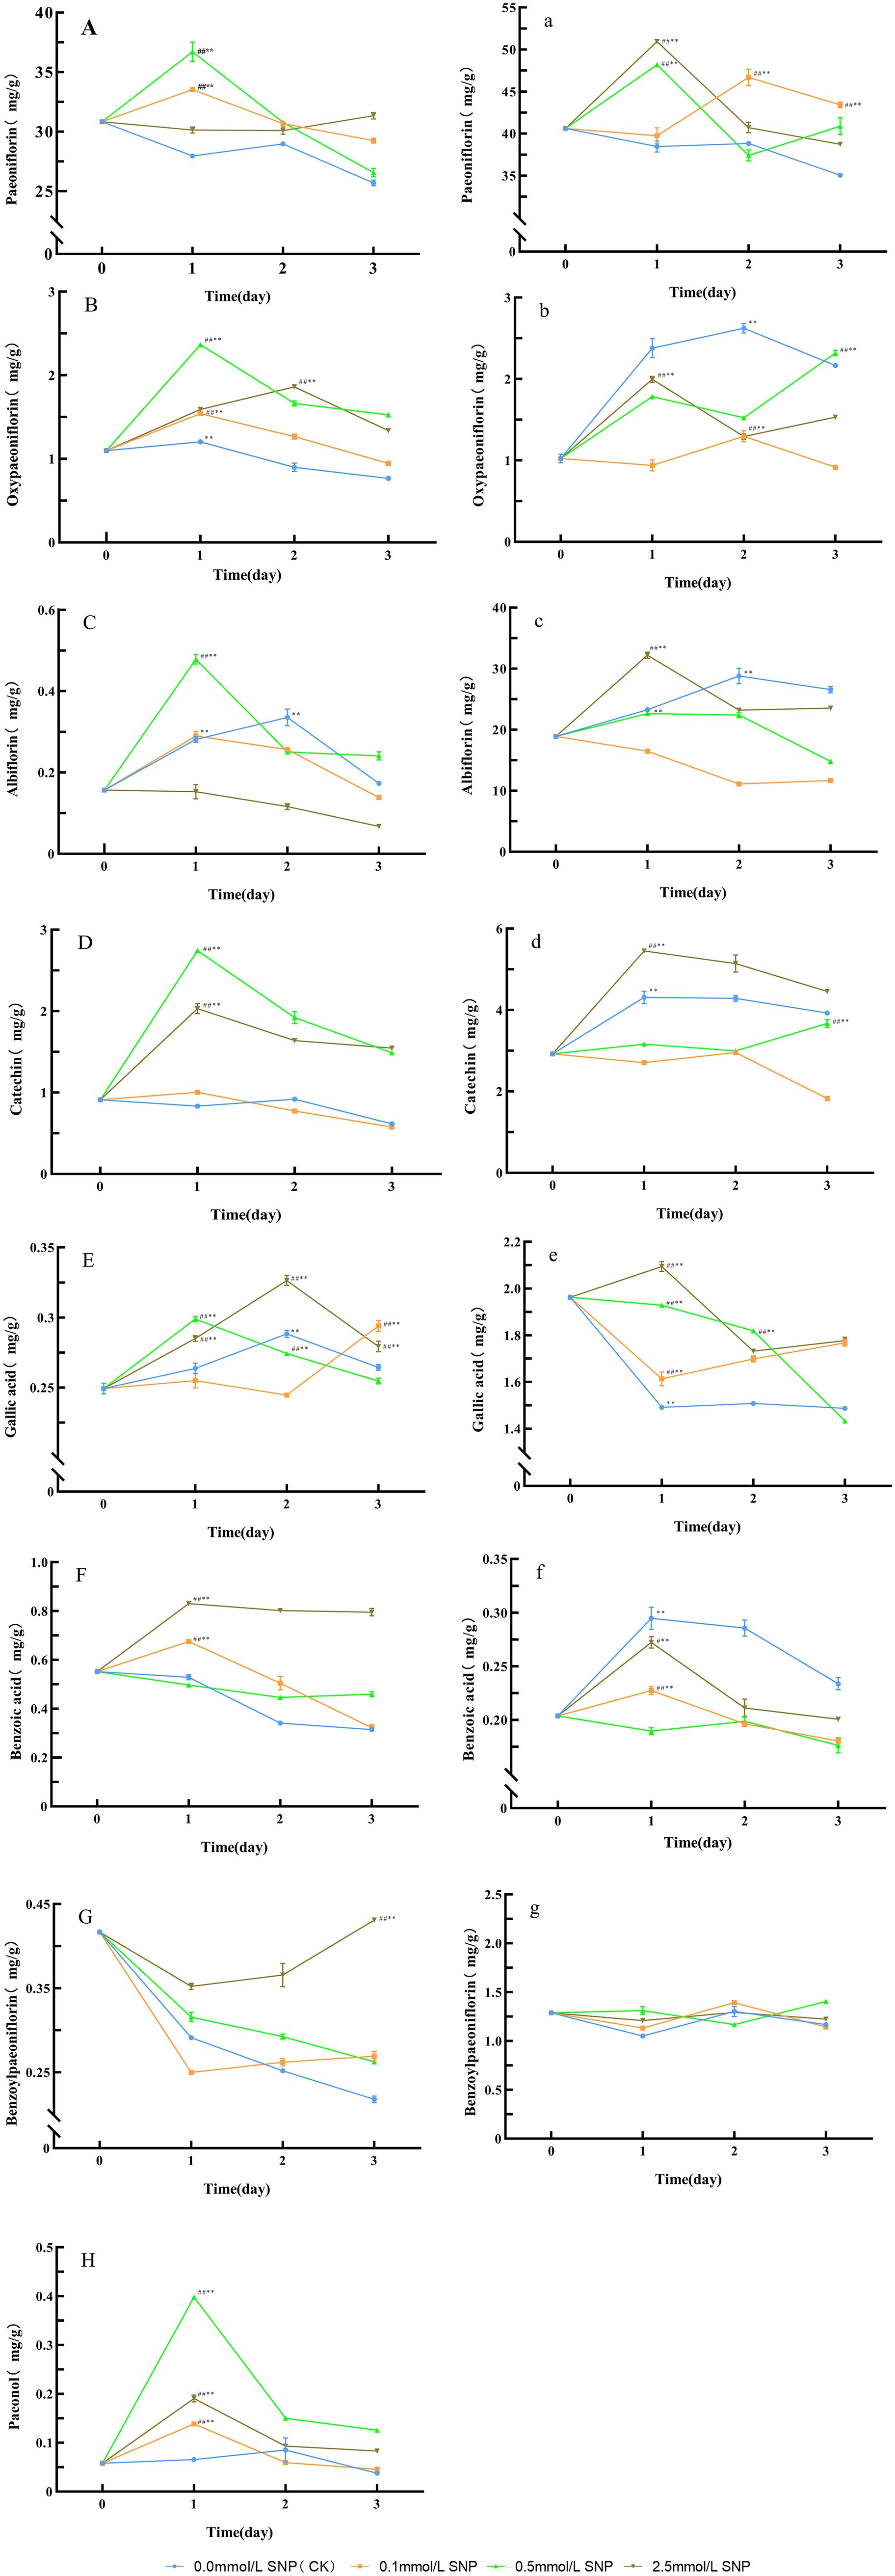
Figure 5. Changes in secondary metabolites levels in Paeoniae Radix Rubra (A–H) and Paeoniae Radix Alba(a–g) under different SNP concentrations. Data are presented as ± s (n = 3, error bars: SD). Significance: */** vs day 0 (*P < 0.05, **P < 0.01); #/## vs 0.0 mmol/L SNP (#P < 0.05, ##P < 0.01). Groups: 0.0 mmol/L SNP (CK, blue), 0.1 mmol/L SNP (orange), 0.5 mmol/L SNP (green), 2.5 mmol/L SNP (brown). (A, a) Paeoniflorin content; (B, b) Oxypaeoniflorin content; (C, c) Albiflorin content; (D, d) Catechin content; (E, e) Gallic acid content; (F, f) Benzoic acid content; (G, g) Benzoylpaeoniflorin content; (H) Paeonal content (all units: mg/g).
4.5.2 Level of secondary metabolites in fresh roots of RAP-germplasm
Compared with day 0, the paeoniflorin in the water group showed a gradual decreasing trend, while the other three groups exhibited an initial increase followed by a decrease. The 0.1, 0.5, and 2.5 mmol/L SNP groups reached their peaks on days 2, 1, and 1, respectively, with increases of 15.0%, 18.6%, and 25.4%, respectively, the 2.5 mmol/L SNP group with the most significant elevation (Figure 5a). Regarding oxypaeoniflorin, compared with day 0, the 0.1 mmol/L SNP group showed no significant change in oxypaeoniflorin contents, while the 0.5 mmol/L SNP group exhibited a gradual increasing trend, the remaining two groups exhibiting an initial increase followed by a decrease. The 0, 0.5, and 2.5 mmol/L groups reached their peaks on days 2, 3, and 1 of treatment, respectively, showing increases of 156.4%, 126.7%, and 95.1%, respectively, the water group showing the most pronounced elevation (Figure 5b). For albiflorin, compared with day 0, the albiflorin in the 0.1 mmol/L SNP group showed a gradual decreasing trend, while the other three groups exhibited an initial increase followed by a decrease. The 0.0, 0.5, and 2.5 mmol/L SNP groups reached their peaks on days 2, 1, and 1 of treatment, respectively, with increases of 52.4%, 19.9%, and 70.4%, respectively, the 2.5 mmol/L SNP group with the most significant increase (Figure 5c). As for catechin, compared with day 0, the catechin in the 0.1 and 0.5 mmol/L SNP groups showed no significant change trend, while the remaining two groups exhibited an initial increase followed by a decrease. Both the 0.0 and 2.5 mmol/L SNP groups reached their peaks on day 1, showing increases of 47.4% and 86.5%, respectively, the 2.5 mmol/L SNP group with the most pronounced elevation (Figure 5d). In terms of gallic acid, compared with day 0, only the 2.5 mmol/L SNP group exhibited an initial increase followed by a decrease in gallic acid level, reaching its peak on day 1 of treatment with a 6.7% increase compared to day 0. The other three groups generally showed a downward trend (Figure 5e). For benzoic acid, compared with day 0, the 0.1 mmol/L SNP group showed no significant change in benzoic acid contents, while the other three groups exhibited an initial increase followed by a decreasing trend. The peaks for the 0, 0.5, and 2.5 mmol/L SNP groups were all observed on day 1 of treatment, showing increases of 44.7%, 11.6%, and 33.6%, respectively, the water group with the most pronounced elevation (Figure 5f). Finally, for benzoylpaeoniflorin, compared with day 0, the level of benzoylpaeoniflorin in all groups showed no significant change trend, with relatively minor fluctuations overall (Figure 5g). These results indicate that spraying 2.5 mmol/L SNP solution has a relatively good effect on increasing the secondary metabolites in the fresh roots of RAP-germplasm.
4.6 1,3-DPG level in fresh roots of P. lactiflora
4.6.1 1,3-DPG level in fresh roots of RRP-germplasm
Compared with day 0, the 1,3-DPG contents in the water group showed no significant change trend, while all other groups exhibited an initial increase followed by a decrease. The 0.5 mmol/L SNP group demonstrated the most pronounced increase, reaching its peak on day 1 with a 128.8% elevation. In contrast, both the 0.1 and 2.5 mmol/L SNP groups peaked on day 2, showing increases of 43.4% and 93.7%, respectively (Figure 6A).
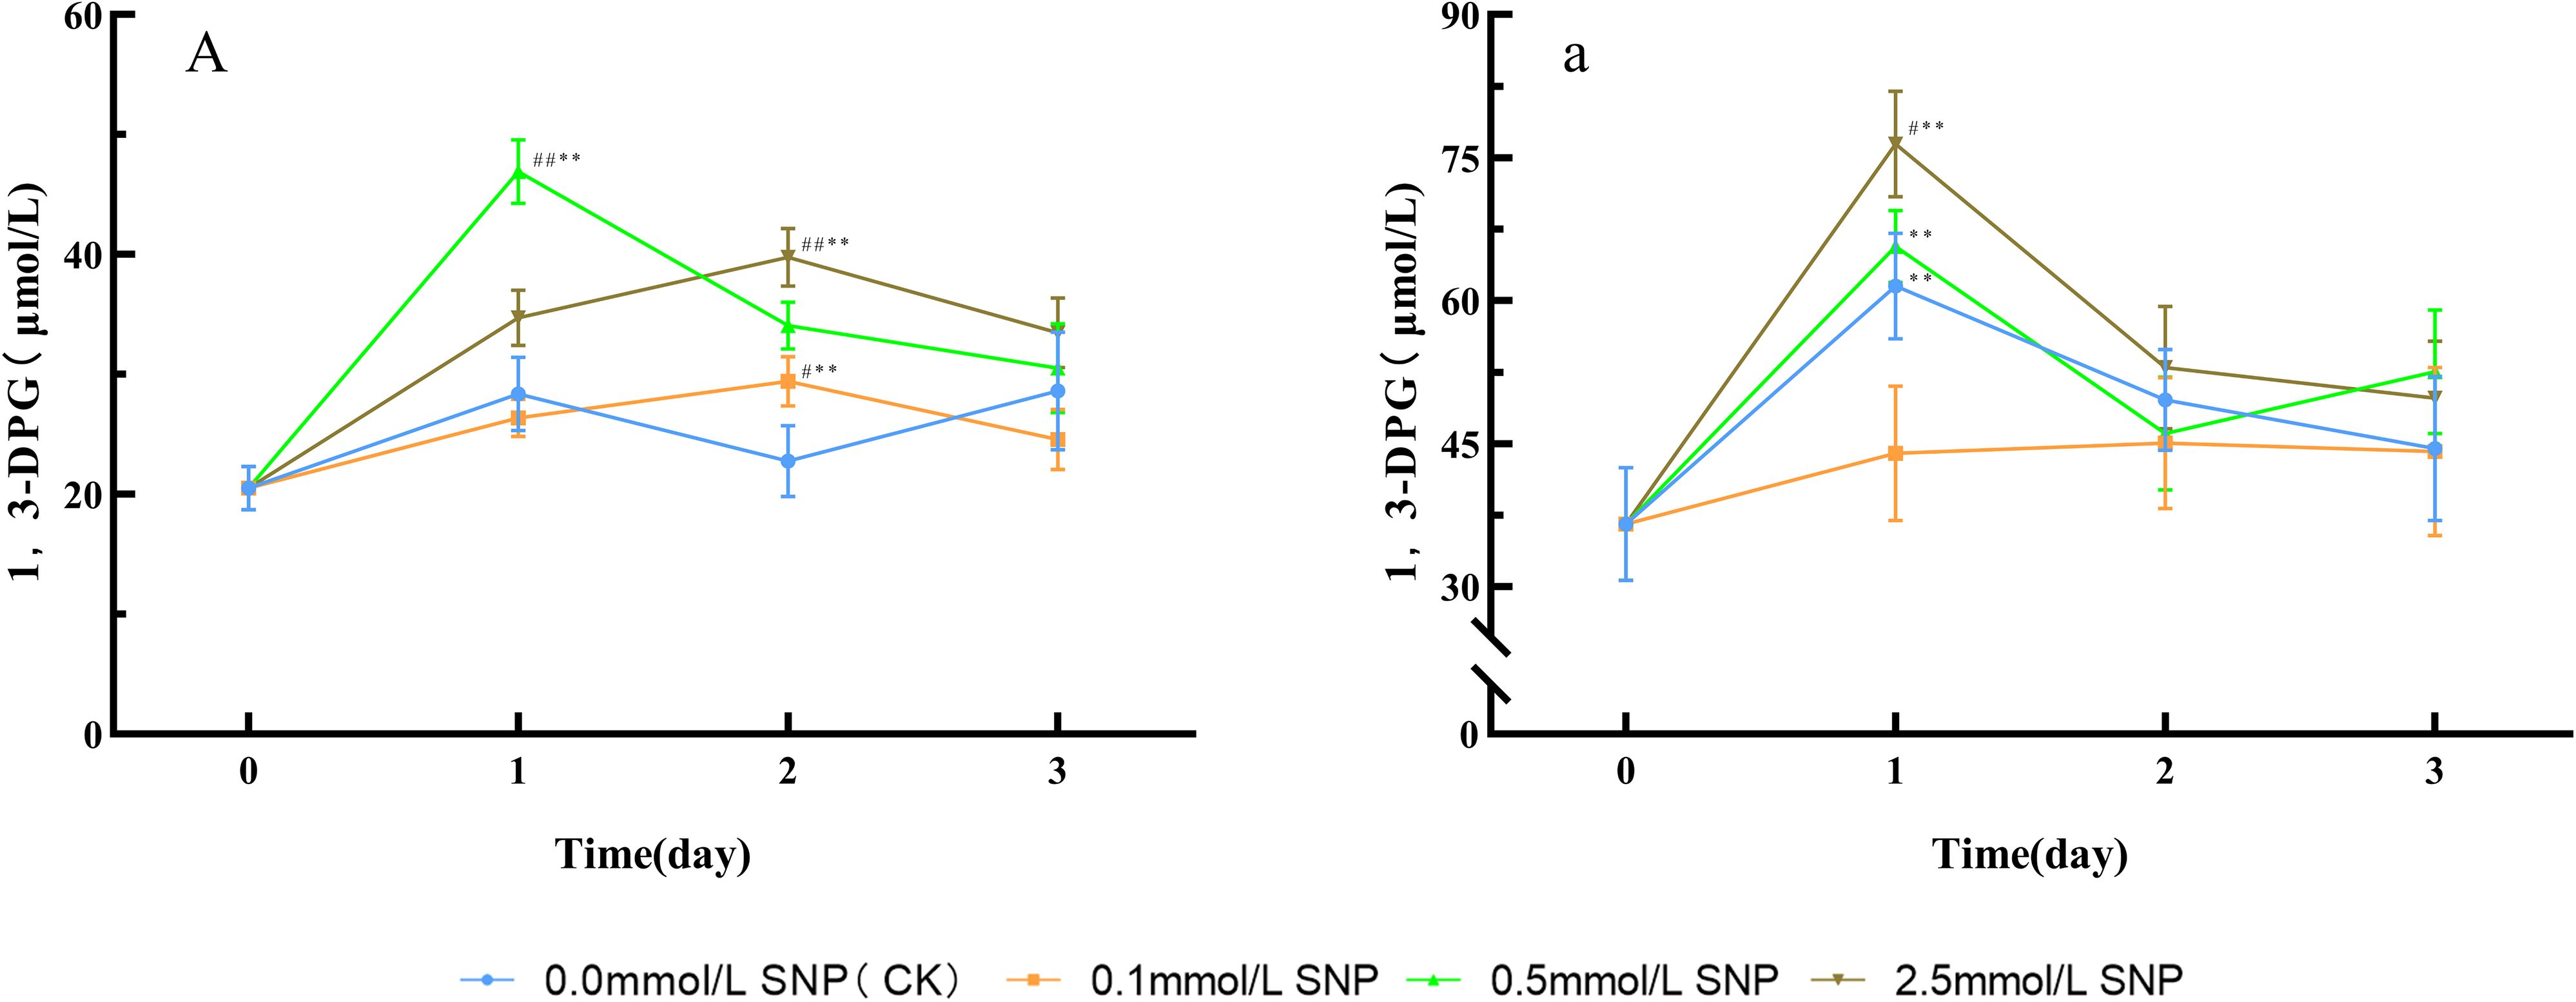
Figure 6. Changes in 1,3-DPG levels in Paeoniae Radix Rubra (A) and Paeoniae Radix Alba (a) under different SNP concentrations. Data are presented as ± s (n = 3, error bars: SD). Significance: */** vs day 0 (*P < 0.05, **P < 0.01); #/## vs 0.0 mmol/L SNP (#P < 0.05, ##P < 0.01). Groups: 0.0 mmol/L SNP (CK, blue), 0.1 mmol/L SNP (orange), 0.5 mmol/L SNP (green), 2.5 mmol/L SNP (brown). A/a: 1,3-DPG contenst (μmol/L).
4.6.2 1,3-DPG level in fresh roots of RAP-germplasm
Compared with day 0, the 0.1 mmol/L SNP group showed no significant changes in 1,3-DPG contents, while the other groups exhibited a trend of initial increase followed by a decrease. The 0.0, 0.5, and 2.5 mmol/L SNP groups reached peaks on day 1 of treatment, with increases of 68.3%, 79.6%, and 109.1%, respectively, the 2.5 mmol/L SNP group with the most pronounced elevation (Figure 6a).
4.7 Effect of SNP and ROS scavengers on ROS and MDA
When RRP-germplasm fresh roots were treated with 0.5 mmol/L SNP alone, the levels of O2·-, H2O2, and MDA were significantly higher than those in the control group, indicating that SNP successfully induced ROS outburst in fresh roots. However, after the subsequent application of 0.1 mmol/L α-Toc and 1.0 mmol/L NAC following SNP treatment, the levels of O2·-, H2O2, and MDA in fresh roots were significantly decreased compared with those in the 0.5 mmol/L SNP alone group, closer to the levels in the control group. These results demonstrated that α-Toc and NAC could effectively scavenge the ROS induced by SNP in RRP-germplasm fresh roots.
4.8 Dependence of SNP-induced secondary metabolism on ROS
When RRP-germplasm fresh roots were treated with 0.5 mmol/L SNP alone, the levels of paeoniflorin, albiflorin, oxypaeoniflorin, gallic acid, catechin, and paeonol were significantly higher than those in the control group, indicating that SNP could effectively induce secondary metabolism in fresh roots. When 0.1 mmol/L α-Toc and 1.0 mmol/L NAC were subsequently applied after SNP treatment, the levels of these secondary metabolites were significantly lower than those in the 0.5 mmol/L SNP alone group, closer to the levels in the control group, indicating that the inductive effect of SNP on the secondary metabolism of RRP-germplasm depended on ROS accumulation.
5 Discussion
When plants are subjected to environmental stress, their cells maintain ROS homeostasis through multidimensional mechanisms, including enzymatic activity regulation, enhanced secondary metabolism, and osmotic balance adjustment. As scavengers of ROS and cytoprotective agents, secondary metabolites serve as core defensive compounds in plants, and become the active pharmaceutical ingredients of medicinal herbs. The formation of the quality of herbal medicines is essentially the process of biosynthesis of secondary metabolites triggered by environmental stress signals, more accurately, it is a process of plant adaptation to ecological stress. Therefore, the content of pharmacologically active ingredients can be improved by constructing the physiological state of plants under adverse conditions.
5.1 Effect of SNP on ROS and MDA levels
The impact of different stresses on ROS in plants varies depending on the stress type and plant species, but they all lead to a significant increase in ROS levels. For instance, under salt stress, the H2O2 level in Cucumis sativus L. roots increases by approximately 30.0% after 1 hour of treatment (Kabała et al., 2022). Low-temperature treatment increases H2O2 levels in strawberry leaves (Fragaria × ananassa Duch.) by nearly 2-fold (Ya et al., 2011). High-temperature stress causes the O2·- levels in wheat (Triticum aestivum L.) to rise by 50.0% (Pradhan and Prasad, 2015). NO can impair complexes III and IV in the mitochondrial electron transport chain, thereby exacerbating electron leakage and promoting the generation of O2·-. In addition, NO can directly activate the plasma membrane nicotinamide adenine dinucleotide phosphate hydrogen (NADPH) oxidase or via the calcium-protein kinase–mediated signaling cascade, thereby inducing the production of ROS (Delledonne et al., 1998b; Corpas et al., 2011; Yun et al., 2011). High concentrations of ROS can initiate free radical chain reactions in membrane lipid peroxidation, damaging the ultrastructure of plant cells and inducing membrane denaturation, which leads to reduced selective permeability, disruption of cellular compartmentalization, and an imbalance in material exchange between the cell and its environment, ultimately leading to cellular dysfunction (Pratt et al., 2011). As a key toxic byproduct of membrane lipid peroxidation, MDA can further induce protein cross-linking and DNA damage, so it has become a critical indicator for assessing oxidative cellular damage and stress resistance (Peng et al., 2022). Figure 1 shows that SNP rapidly increased O2·- levels in P. lactiflora fresh roots, followed by a swift rise in H2O2 level; subsequently, MDA contents in all groups showed significant elevation (Figure 2), indicating that exogenous NO can induce a rapid short-term increase in ROS, and cause damage to plant cells. SNP can replicate the physiological state of plants under stress conditions.
5.2 Effects of SNP on antioxidant enzyme activities
The ROS scavenging system in plants consists of enzymatic and non-enzymatic components, and they dynamically complement each other to form a precisely regulated antioxidant network (Ahmad et al., 2010; Wang et al., 2024). O2·- is the earliest ROS generated and readily induces the Fenton reaction to produce ·OH, a kind of ROS with the highest toxicity, and causes severe cellular damage (Phua et al., 2021). SOD, as the only enzyme capable of specifically catalyzing O2·-, forms the first line of antioxidant defense (Case, 2017). Taking Cu-Zn SOD as an example, when O2·- levels rise, Cu²+ is reduced to Cu+, catalyzing the disproportionation of two O2·- into H2O2 and O2. This substrate-inducible characteristic ensures that SOD activity exhibits a positive correlation with O2·- within physiological ranges. Since its catalytic efficiency directly determines the subsequent cascade reactions of CAT and POD, SOD plays a central role in ROS metabolism (Sheng et al., 2014). H2O2 can readily penetrate biological membranes and react with cytoplasmic components, oxidizing thiol groups and metal cofactors, thereby inactivating proteins and enzymes while impairing NADPH oxidase. This process exacerbates the collapse of the antioxidant system (Kunkemoeller and Kyriakides, 2017). CAT, a tetrameric enzyme containing iron porphyrin as its prosthetic group (Baker et al., 2023), decomposes H2O2 into H2O and O2 via a disproportionation reaction. It requires the successive collisions of two H2O2 at the active site to initiate the reaction, making CAT the most specialized and direct enzyme for H2O2 clearance (Yang and Poovaiah, 2002). Unlike CAT, POD is a heme-rich oxidoreductase. Its heme group can undergo a cyclic transition between the oxidized (Fe³+) and reduced (Fe²+) states, enabling it to withstand intense oxidative stress from ROS (Bauer and Bauer, 2002). Furthermore, the hydrophobic cavity within its tertiary structure shields the active site from radical attacks (Gray and Winkler, 2021). Therefore, even when ROS concentrations increase, POD still maintains excellent stability (Amin et al., 2024). Under stress conditions, certain secondary metabolites—such as phenolic compounds (catechin, paeonol, and baicalein)—can serve as substrates to supply electrons and facilitate the continuous reduction of H2O2 by POD (Niu and Liao, 2016).
SNP increased ROS levels, and modulated protein disulfide bonds, and enhanced antioxidant enzyme activity (Figures 1, 3). In both types of fresh P. lactiflora roots, SOD activities significantly increased within 0~1 day after SNP exposure (Figure 3), promoting O2·- reduction in all groups by days 2~3 (Figure 1). CAT and POD showed synergistic and complementary effects in the clearance of H2O2. When the activity of one enzyme decreased, the activity of another enzyme increased correspondingly. In the fresh roots of the RRP-germplasm, CAT and POD activities peaked at days 1 and 2, respectively, after SNP treatment, whereas in the RAP-germplasm, CAT activity peaked during days 1~2, and POD activity reached a peak on day 2. The synergistic action of both enzymes effectively reduced H2O2 levels (Figure 1). Notably, POD maintained persistently high activity during the late stress phase (days 2~3) in all treated groups, indicating that POD plays a critical role in H2O2 clearance (Figure 3), leading to a reduction in ROS levels in the fresh roots of the two P. lactiflora germplasms. However, as the stress intensity increased or the duration of stress was extended, the activities of various antioxidant enzymes declined rapidly within 2~3 days of treatment (Figure 3). This phenomenon may be attributed to the high ROS, which oxidize amino acid residues in enzyme proteins, such as cysteine, methionine, and tyrosine, disrupt the homeostasis of disulfide bonds (-S-S-) or induce peptide chain cross-linking, and further cause the dissociation of metal cofactors—including Cu²+ in Cu/Zn-SOD and Fe²+ in CAT—from the active center. These changes collectively destroy the spatial conformation of antioxidant enzymes such as SOD, CAT, and POD, thereby inactivating their catalytic functions (Karamat et al., 2024). Figure 2 shows that MDA contents remained consistently elevated, suggesting that the decline in antioxidant enzyme activity may indeed be caused by ROS. These observations collectively suggest that antioxidant enzymes may not be the primary means of ROS clearance under severe stress conditions, implying potential contributions from secondary metabolites.
5.3 SNP modulates secondary metabolites in P. lactiflora
Unlike animals, plants cannot escape adverse conditions, which inevitably leads to the overproduction of ROS (Ali et al., 2023). In response, plants have evolved a unique strategy to cope with stress, involving activating gene expression, regulating the activity of antioxidant enzymes, and reconstructing primary and secondary metabolic pathways. When the ROS generated exceed the scavenging capacity of the antioxidant enzyme system, plants enhance their secondary metabolites to protect plant tissues from oxidative stress (Miller et al., 2010). The main secondary metabolites of P. lactiflora include monoterpenes and phenolic compounds, such as paeoniflorin, albiflorin, oxypaeoniflorin, gallic acid, catechin, paeonol, and benzoylpaeoniflorin. Among them, catechin, gallic acid, and paeonol belong to different subclasses of phenolic compounds, all containing phenolic hydroxyl groups, with the ability to scavenge H2O2, inhibit NADPH oxidase (Ma et al., 2024b), chelate transition metal ions such as Fe²+ and Cu²+, block the Fenton reaction, and suppress the generation of ROS (Kubo et al., 2010), thereby reducing the oxidative damage caused by ROS to DNA and proteins, and protecting the enzyme system from damage (Fraga et al., 2019). The monoterpene compound paeoniflorin possesses electrophilicity due to its conjugated benzene ring system and β-D-glucopyranosyl group, and can directly capture and neutralize free radicals (Nakayama and Uno, 2024; Zhao et al., 2024). As an isomer of paeoniflorin, albiflorin contains an ester glycoside group that confers strong electron-donating capacity, and it can not only directly eliminate ROS, but also maintain the function of mitochondrial membrane potential and electron transport chain, so as to reduce the production of ROS caused by electron leakage (Suh et al., 2013). Because the synthesis of secondary metabolites consumes substantial amounts of NADPH and ATP, the continuous production of secondary metabolites in plants under suitable conditions will significantly inhibit their growth and development. Only under stress can the plants’ defense response be activated and energy resources reallocated for the production of defensive compounds (Pant et al., 2021), resulting in secondary metabolites being synthesized in large quantities (Ozyigit et al., 2023). When plants are subjected to environmental stresses such as pathogen infection, ultraviolet radiation, or mechanical damage, ROS activate the phenylpropanoid pathway and enhance the activity of PAL (Moghaddam et al., 2019; Wang et al., 2019), a key rate-limiting enzyme for flavonoid synthesis (MacDonald and D’Cunha, 2007). For instance, under salt stress, the activation of PAL in Brassica oleracea L. stimulates the production of flavonoid compounds such as rutin and quercetin (Yang et al., 2018). HMGR is a rate-limiting enzyme involved in the synthesis of the monoterpenoid skeleton in the mevalonate pathway (Zheng et al., 2022). It can also be regulated by ROS and enhance the biosynthesis of paeoniflorin, albiflorin, benzoylpaeoniflorin, and oxypaeoniflorin in P. lactiflora (Xu et al., 2023). Under drought stress, the tanshinone and cryptotanshinone in Salvia miltiorrhiza Bunge increase remarkably (Yang et al., 2018); the atractylodin, atractylon, and atractylenolide II are substantially elevated in Atractylodes chinensis (DC.) Koidz (Zhao et al., 2023). The secondary metabolites of medicinal plants are usually medicinal components. Figures 7, 8 show that the inductive effect of SNP on the secondary metabolism of RRP-germplasm depended on the ROS accumulation it induced, and this inductive effect was significantly attenuated when antioxidants scavenged ROS, which confirmed that increased ROS under stress conditions was the fundamental cause of enhanced secondary metabolism.
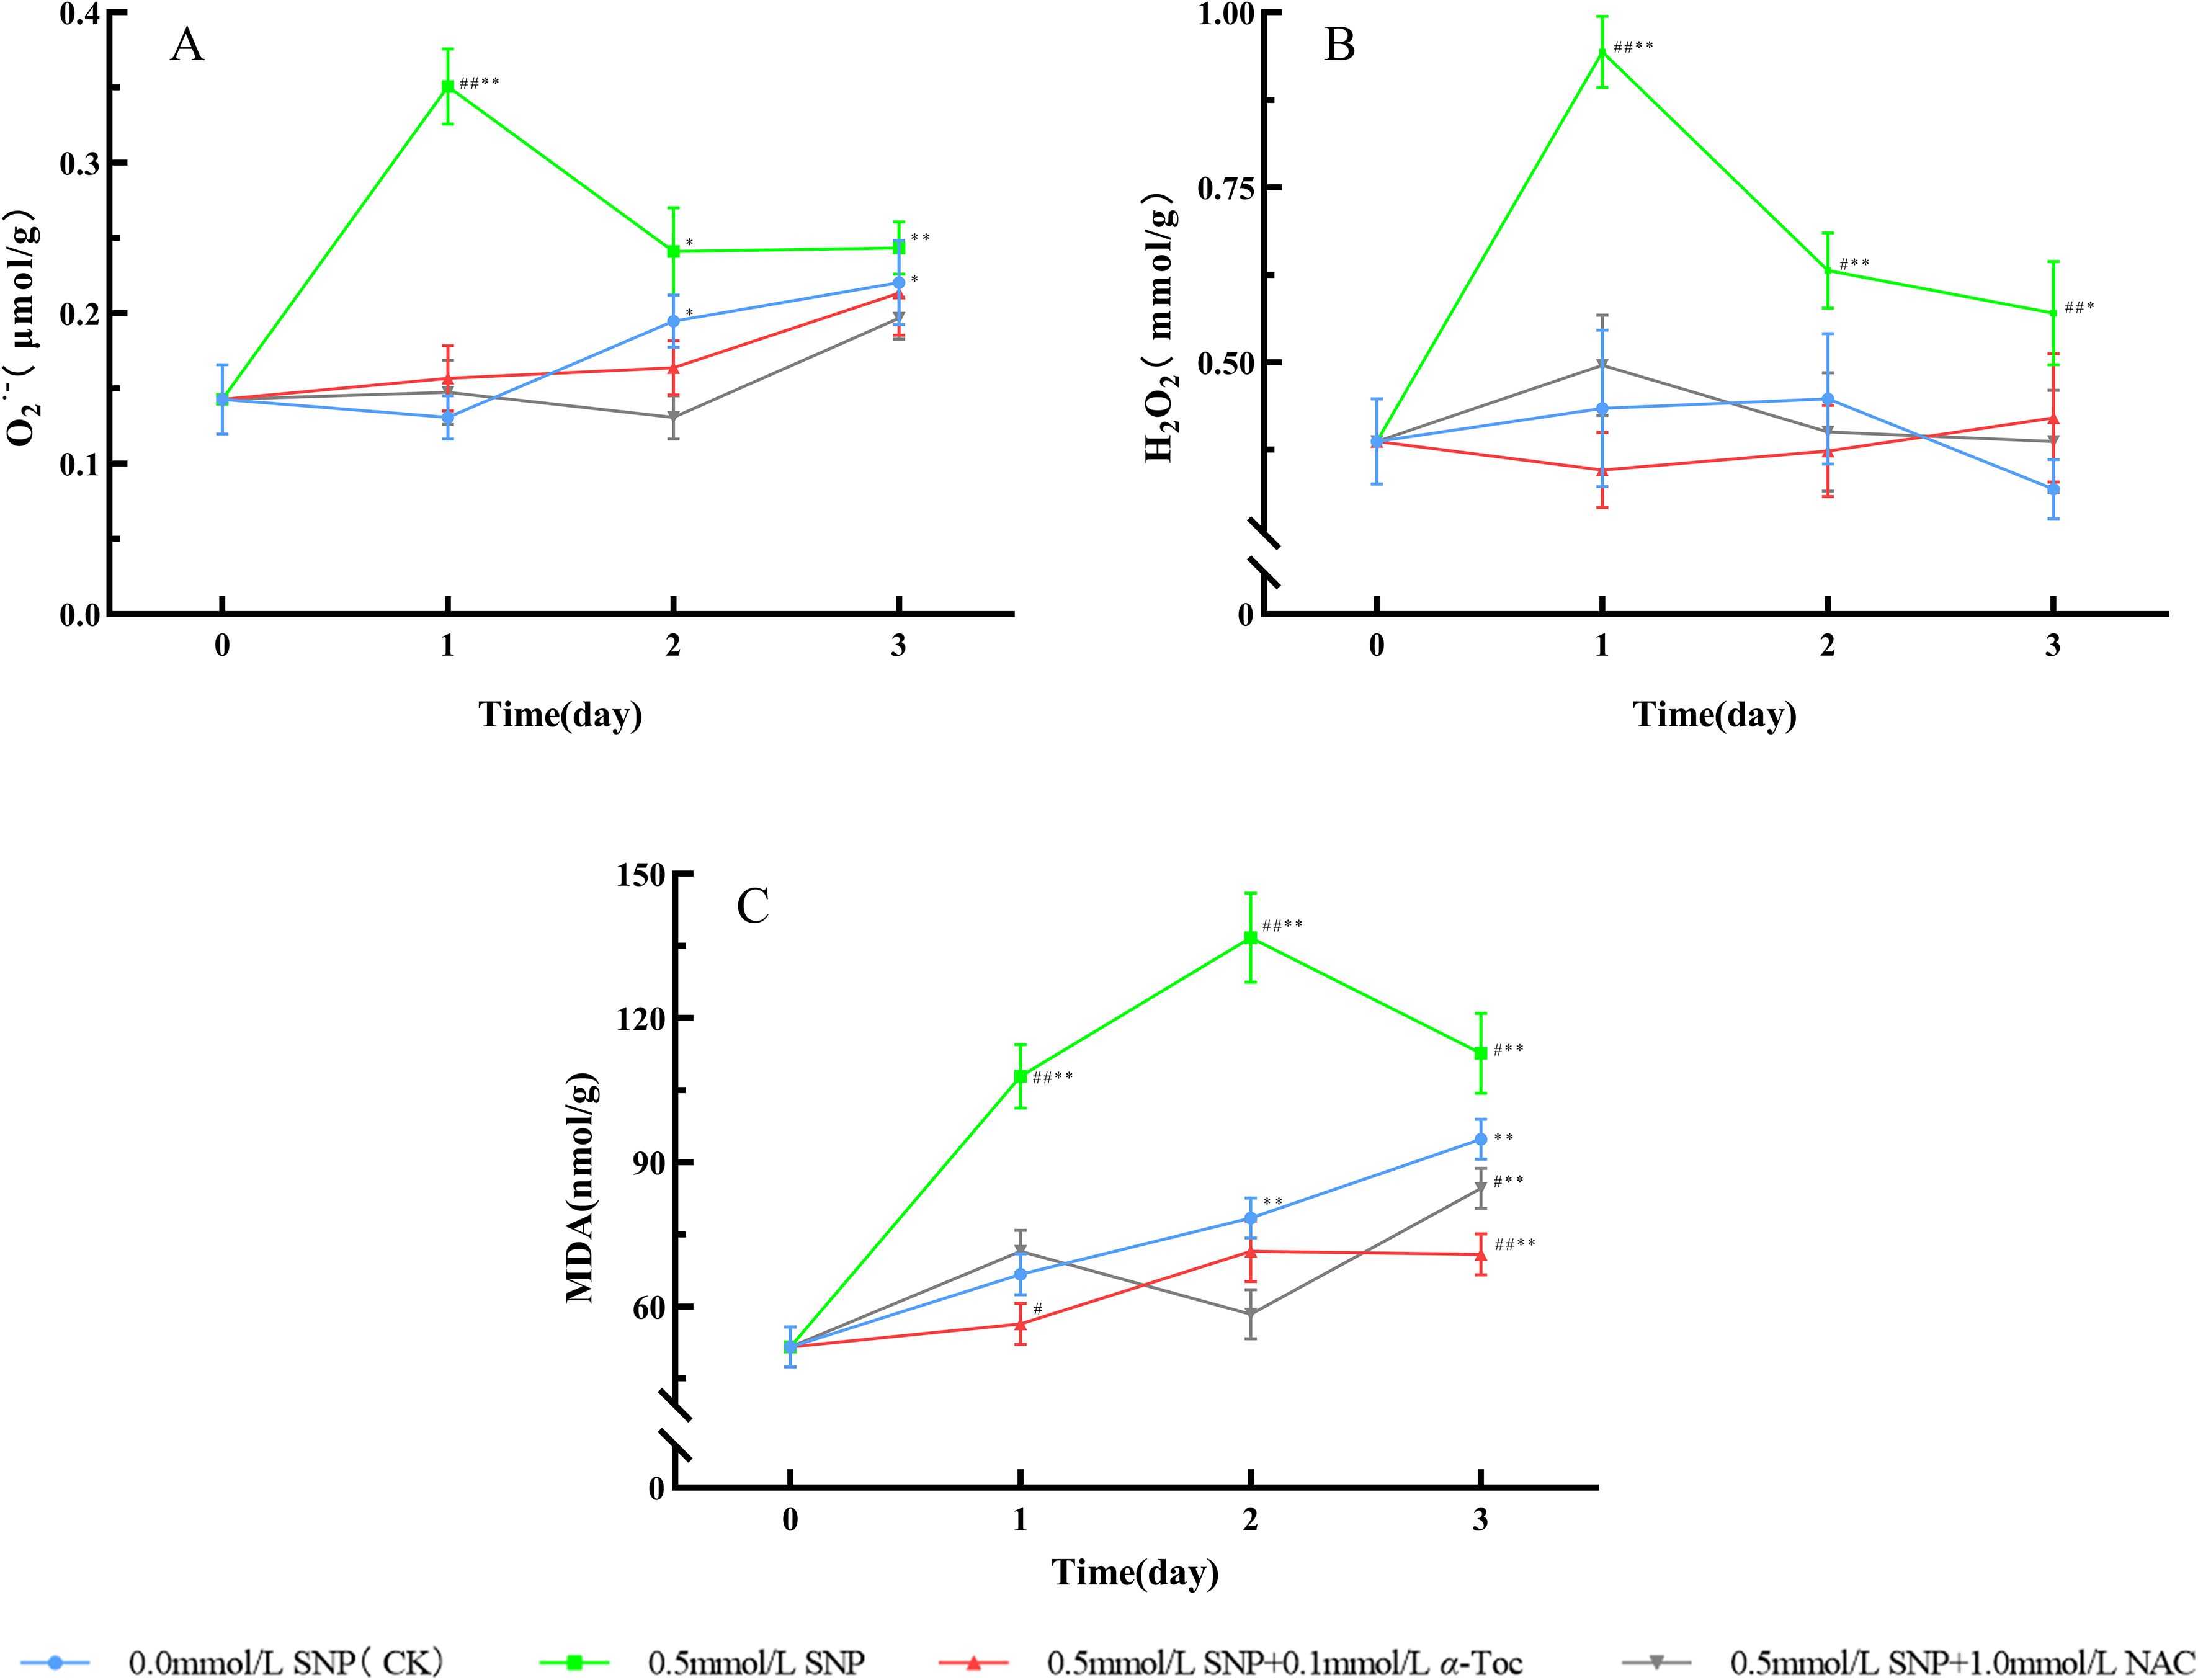
Figure 7. ROS Levels and MDA Changes in Paeoniae Radix Rubra (A–C). Data are presented as ± s (n = 3, error bars: SD). Significance: */** vs day 0 (*P < 0.05, **P < 0.01); #/## vs 0.0 mmol/L SNP (#P < 0.05, ##P < 0.01).Groups: 0.0 mmol/L SNP (CK, blue), 0.5 mmol/L SNP (green), 0.5 mmol/L SNP + 0.1 mmol/L α-Toc(red), 0.5 mmol/L SNP + 1.0 mmol/L NAC (gray). (A) O2·- contents (μmol/g); (B) H2O2 contents (mmol/g); (C) MDA contents (nmol/g).
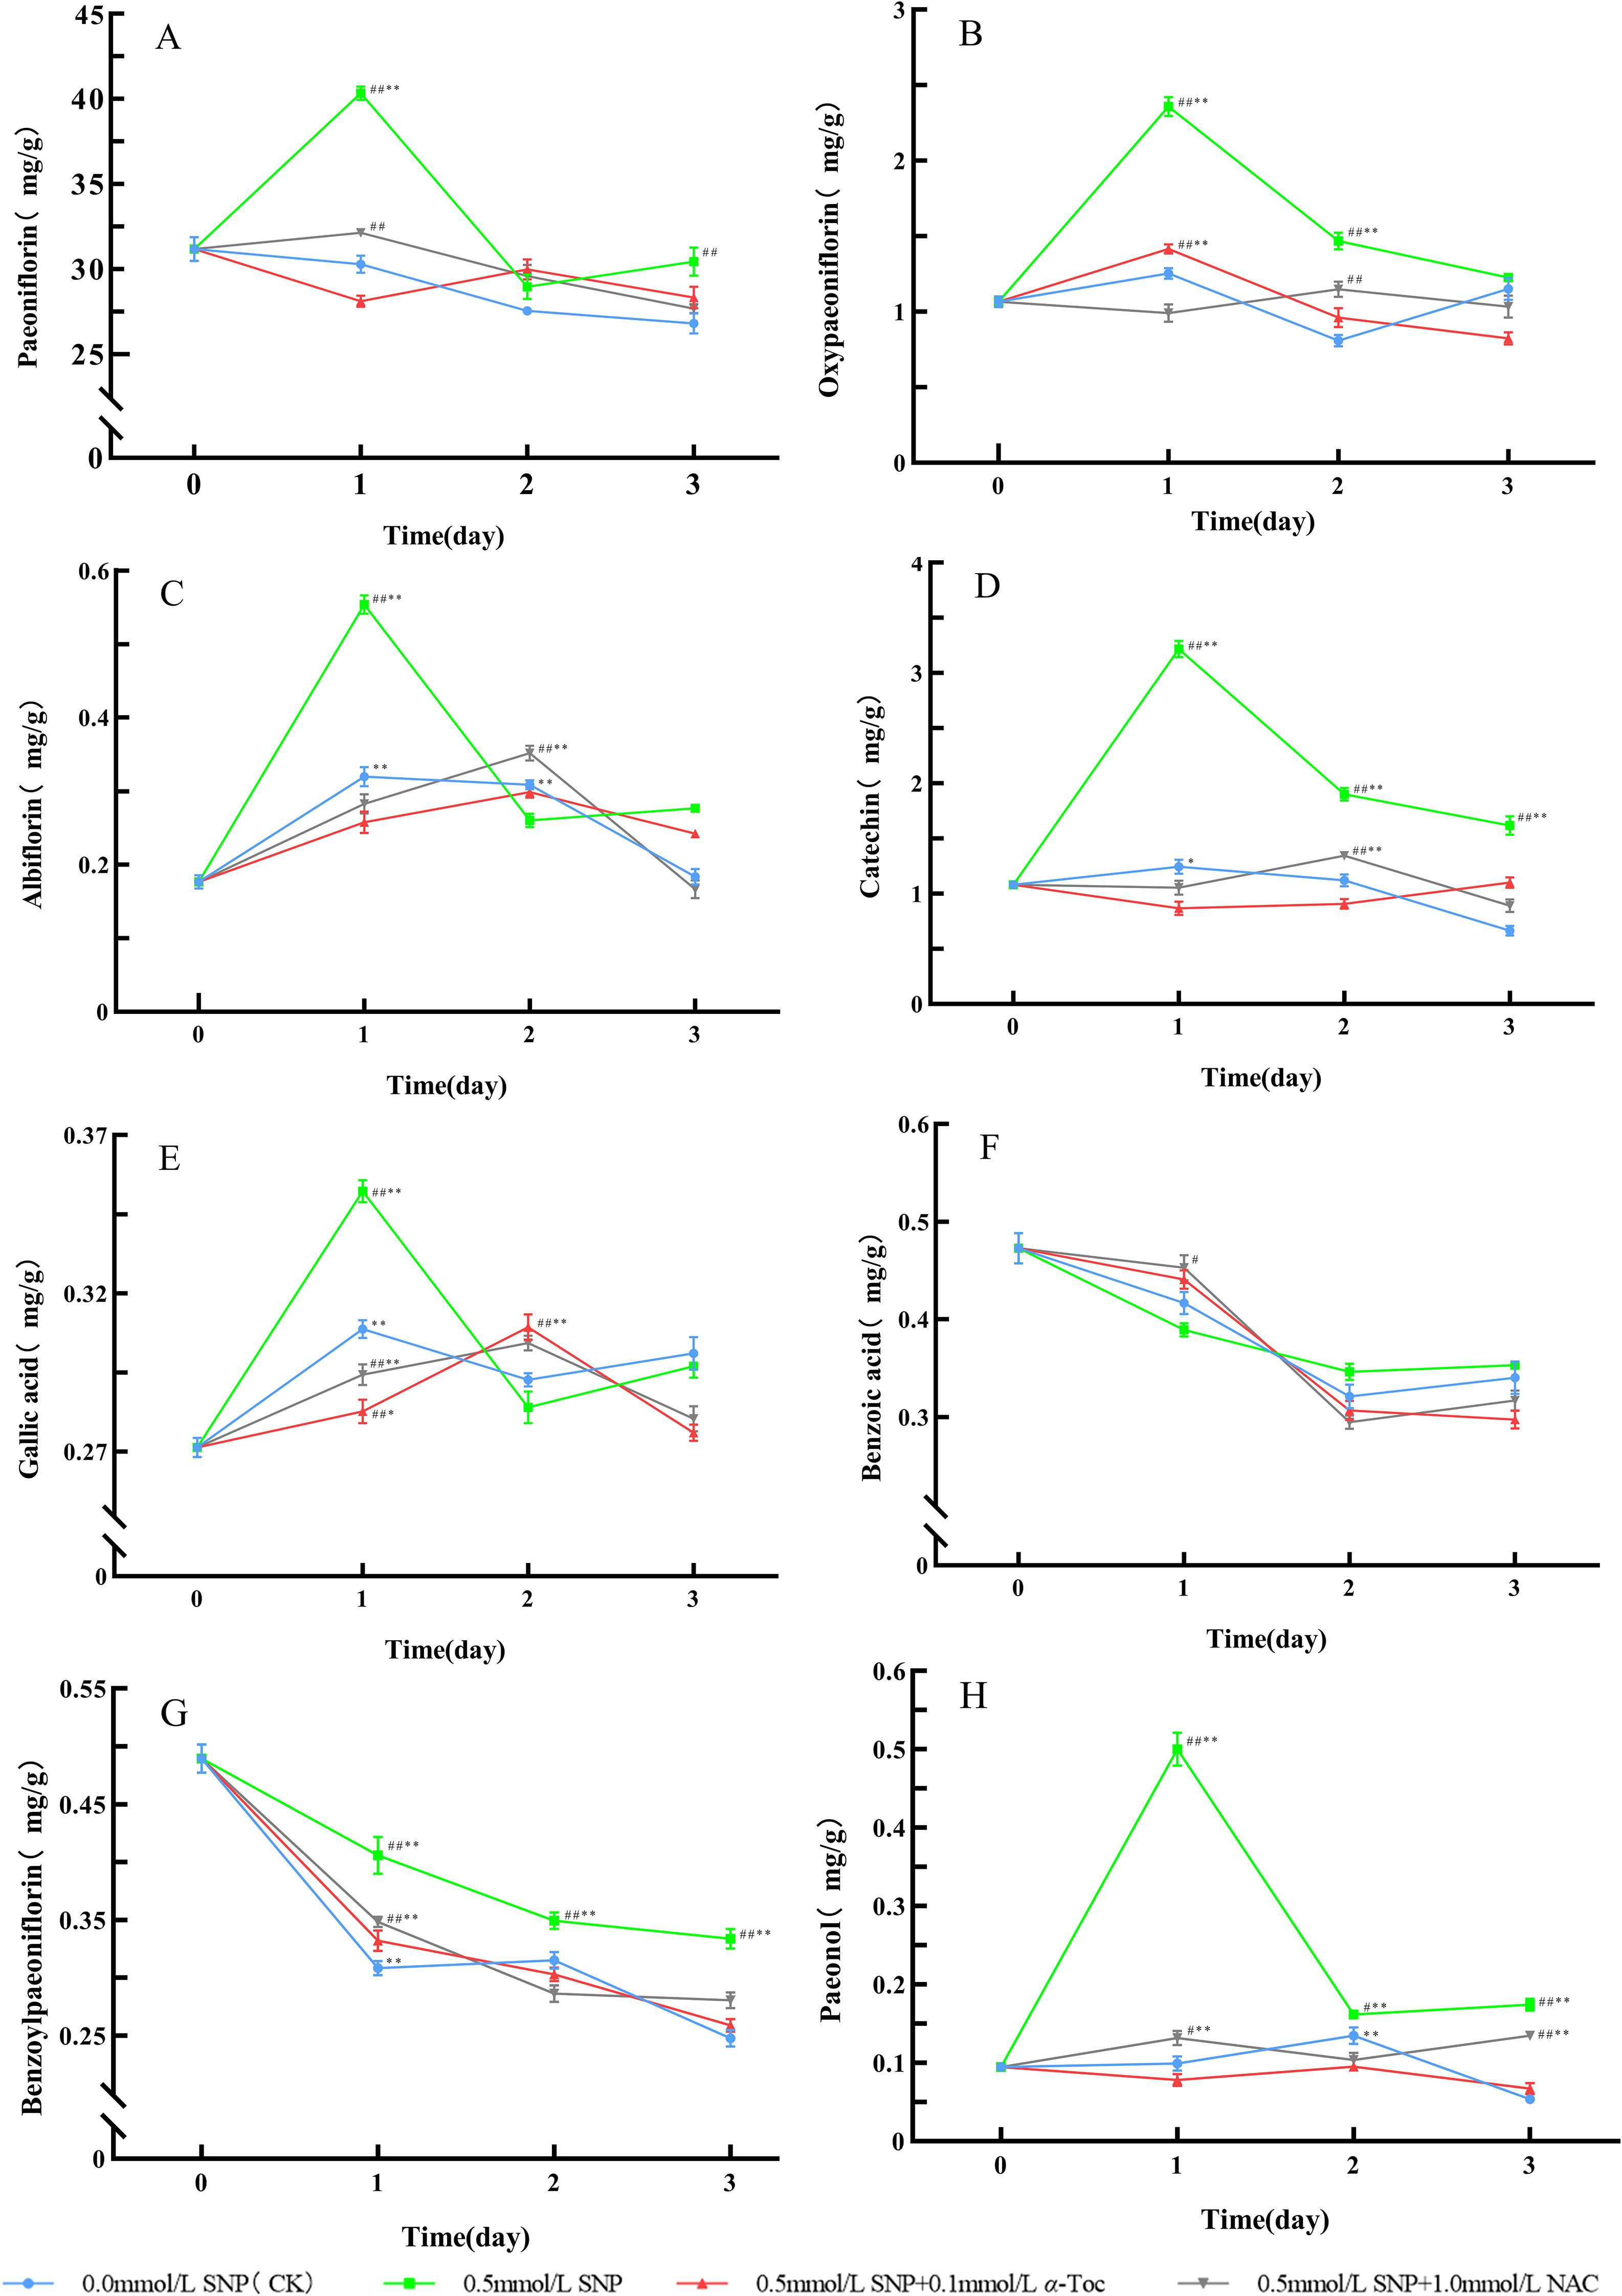
Figure 8. Changes in Secondary Metabolites Levels in Paeoniae Radix Rubra (A–H). Data are presented as ± s (n = 3, error bars: SD).Significance: */** vs day 0 (*P < 0.05, **P < 0.01); #/## vs 0.0 mmol/L SNP (#P < 0.05, ##P < 0.01).Groups: 0.0 mmol/L SNP (CK, blue), 0.5 mmol/L SNP (green), 0.5 mmol/L SNP + 0.1 mmol/L α-Toc(red), 0.5 mmol/L SNP + 1.0 mmol/L NAC (gray) (A) Paeoniflorin content; (B) Oxypaeoniflorin content; (C) Albiflorin content; (D) Catechin content; (E) Gallic acid content; (F) Benzoic acid content; (G) Benzoylpaeoniflorin content; (H) Paeonol content (all units: mg/g).
Figure 4 shows that the SNP enhanced the activities of PAL and HMGR, resulting in increased flavonoids and monoterpenoids in all treatment groups (Figure 5). During SNP treatment, the intracellular ROS levels exhibited a trend consistent with PAL and HMGR activities, both of which increased first and then decreased. Catechin, paeoniflorin, albiflorin, and oxypaeoniflorin in the 0.5 mmol/L SNP group of RRP-germplasm and the 2.5 mmol/L SNP group of RAP-germplasm increased by 201.0%, 19.1%, 205.4%, 115.4% and 86.5%, 25.4%, 70.4%, 95.1%, respectively, on the first day of treatment (Figure 5), which indicates the difference in the responses of different germplasms of the same species to SNP. In RRP-germplasm, the 2.5 mmol/L SNP group showed poor enhancement effects, maybe due to the higher ROS damaging PAL and HMGR (Figure 4), while the 0.0 and 0.1 mmol/L SNP groups had lower ROS, insufficient to fully activate the self-defense system (Figures 3, 4), and limited secondary metabolite synthesis. In RAP-germplasm, however, the 2.5 mmol/L SNP group exhibited the highest activity of PAL and HMGR, with the overall secondary metabolites significantly exceeding those of the 0.1 and 0.5 mmol/L SNP groups, suggesting that RAP-germplasm possesses stronger stress tolerance compared to RRP-germplasm. Figure 5 shows that excess H2O as a form of adversity stress can also enhance ROS accumulation in RAP-germplasm and increase some secondary metabolites, but has a very limited effect on the improvement of major active ingredients such as paeoniflorin and albiflorin, the effect of which is much lower than that of the 2.5 mmol/L SNP group (P < 0.01).During the treatment of P. lactiflora fresh roots, with the enhancement of the synthesis of related antioxidants, especially secondary metabolites, ROS decreased rapidly (Figures 1, 3–5), indicating that secondary metabolites play an important role in adapting to severe stress.
Phenylalanine and isopentenyl pyrophosphate are both intermediates linking primary and secondary metabolism, and the enhanced activities of PAL and HMGR (Figure 4) will lead to more primary metabolites being used for the biosynthesis of secondary metabolites. 1,3-DPG is a metabolic intermediate in glycolysis, and the increase in its content reflects an enhancement of glycolytic flux (Muñoz-Bertomeu et al., 2010). This study used isolated roots of P. lactiflora, with no material originating from photosynthesis; thus, the increased 1,3-DPG must have derived from the breakdown of sugars. The increased paeoniflorin, albiflorin, catechin, and other components were synthesized from non-pharmaceutical carbohydrates; thus, the quality of the drug improved significantly.
5.4 Effects of SNP on quality and specific compound accumulation in P. lactiflora
A plant species with a wide distribution can form multiple ecotypes due to diverse ecological conditions, generating different germplasms which exhibit significantly varied responses to specific environmental stresses, including drought, saline-alkaline stress, high-temperature stress, and biotic stresses. After long-term natural selection and artificial selection, the same plant species has formed unique physiological and biochemical adaptation mechanisms, and its secondary metabolism has changed (Jiang et al., 2025). In this study, the RRP-germplasm treated with 0.5 mmol/L SNP increased paeoniflorin, catechin, and paeonol contents by 19.1%, 201.0%, and 585.2%, respectively; the RAP-germplasm treated with 2.5 mmol/L SNP markedly increased albiflorin and oxypaeoniflorin contents by 70.4% and 95.1%, respectively. This study showed that SNP had different effects on different germplasms of the same species, but both germplasms could significantly improve the quality of medicinal materials.
6 Conclusion
The active components of medicinal plants are generally secondary metabolites of plants, and the quality formation mechanism of medicinal plants is essentially the adaptation mechanism of plants to ecological stress. This study successfully simulated the physiological state of plants under ecological stress conditions by using exogenous NO. In fresh roots of P. lactiflora, the ROS content increased, and the antioxidant enzyme activities as well as the content of secondary metabolites increased significantly; these two factors acted synergistically to scavenge excess ROS and reduce the damage caused by ROS to the plant. However, with the increase in stress intensity, antioxidant enzyme activities decreased, while the activities of key secondary metabolism enzymes increased, which promoted the biosynthesis of specific medicinal components, thereby improving the quality of cultivated P. lactiflora. Specifically, in the fresh roots of RRP-germplasm treated with 0.5 mmol/L SNP, the secondary metabolites paeoniflorin, albiflorin, oxypaeoniflorin, gallic acid, catechin, and paeonol were elevated by 19.1%, 205.4%, 115.4%, 19.9%, 201.0%, and 585.2%, respectively; in the fresh roots of RAP-germplasm treated with 2.5 mmol/L SNP, the major secondary metabolites paeoniflorin, albiflorin, oxypaeoniflorin, gallic acid, catechin, and benzoic acid showed increases of 25.4%, 70.4%, 95.1%, 6.7%, 86.5%, and 33.6%, respectively. Notably, the magnitude of the increase in active ingredient content observed in this study has rarely been reported in previous research. Compared with field plant treatments that are difficult to precisely control, isolated fresh root tissue treatment has significant advantages such as active metabolism, sensitive response, controllable conditions, and prevention of irreversible damage to the plant. This in vitro targeted induction model exhibits greater superiority and feasibility in increasing the content of target components, providing an innovative technical approach for the standardized and high-quality production of P. lactiflora.
Data availability statement
The original contributions presented in the study are included in the article/Supplementary Material. Further inquiries can be directed to the corresponding author/s.
Author contributions
KZ: Investigation, Validation, Project administration, Formal Analysis, Software, Data curation, Writing – original draft. YY: Writing – review & editing, Software, Data curation, Investigation. DD: Writing – review & editing. QD: Data curation, Investigation, Writing – review & editing. ZG: Data curation, Writing – review & editing, Software. LL: Conceptualization, Investigation, Writing – review & editing, Funding acquisition. XM: Resources, Supervision, Funding acquisition, Writing – review & editing, Conceptualization.
Funding
The author(s) declare that financial support was received for the research and/or publication of this article. This research was financially supported by the National Natural Science Foundation of China (U20A2040) and the Heilongjiang TCM Culture Research Project (ZY2023-005).
Acknowledgments
We would like to thank XM of Heilongjiang University of Chinese Medicine for technical assistance in identifying the four-year-old fresh roots of Paeonia lactiflora Pall.
Conflict of interest
The authors declare that the research was conducted in the absence of any commercial or financial relationships that could be construed as a potential conflict of interest.
Generative AI statement
The author(s) declare that no Generative AI was used in the creation of this manuscript.
Any alternative text (alt text) provided alongside figures in this article has been generated by Frontiers with the support of artificial intelligence and reasonable efforts have been made to ensure accuracy, including review by the authors wherever possible. If you identify any issues, please contact us.
Publisher’s note
All claims expressed in this article are solely those of the authors and do not necessarily represent those of their affiliated organizations, or those of the publisher, the editors and the reviewers. Any product that may be evaluated in this article, or claim that may be made by its manufacturer, is not guaranteed or endorsed by the publisher.
Supplementary material
The Supplementary Material for this article can be found online at: https://www.frontiersin.org/articles/10.3389/fpls.2025.1660058/full#supplementary-material
References
Ahmad, P., Jaleel, C. A., Salem, M. A., Nabi, G., and Sharma, S. (2010). Roles of enzymatic and nonenzymatic antioxidants in plants during abiotic stress. Crit. Rev. Biotechnol. 30, 161–175. doi: 10.3109/07388550903524243
Akter, S., Huang, J., Waszczak, C., Jacques, S., Gevaert, K., Van Breusegem, F., et al. (2015). Cysteines under ROS attack in plants: a proteomics view. J. Exp. Bot. 66, 2935–2944. doi: 10.1093/jxb/erv044
Alami, M. M., Guo, S., Mei, Z., Yang, G., and Wang, X. (2024). Environmental factors on secondary metabolism in medicinal plants: exploring accelerating factors. Medicinal Plant Biol. 3, e016. doi: 10.48130/mpb-0024-0016
Ali, S., Tyagi, A., and Bae, H. (2023). ROS interplay between plant growth and stress biology: Challenges and future perspectives. Plant Physiol. Biochem. 203, 108032. doi: 10.1016/j.plaphy.2023.108032
Amin, B., Atif, M. J., Kandegama, W., Nasar, J., Alam, P., Fang, Z., et al. (2024). Low temperature and high humidity affect dynamics of chlorophyll biosynthesis and secondary metabolites in Cucumber. BMC Plant Biol. 24, 903. doi: 10.1186/s12870-024-05615-2
Asada, K. (2006). Production and scavenging of reactive oxygen species in chloroplasts and their functions. Plant Physiol. 141, 391–396. doi: 10.1104/pp.106.082040
Baker, A., Lin, C. C., Lett, C., Karpinska, B., Wright, M. H., and Foyer, C. H. (2023). Catalase: A critical node in the regulation of cell fate. Free Radic. Biol. Med. 199, 56–66. doi: 10.1016/j.freeradbiomed.2023.02.009
Bauer, M. and Bauer, I. (2002). Heme oxygenase-1: redox regulation and role in the hepatic response to oxidative stress. Antioxid Redox Signal. 4, 749–758. doi: 10.1089/152308602760598891
Buchanan, B. B. and Luan, S. (2005). Redox regulation in the chloroplast thylakoid lumen: a new frontier in photosynthesis research. J. Exp. Bot. 56, 1439–1447. doi: 10.1093/jxb/eri158
Case, A. J. (2017). On the origin of superoxide dismutase: an evolutionary perspective of superoxide-mediated redox signaling. Antioxidants (Basel). 6, 82. doi: 10.3390/antiox6040082
Corpas, F. J., Leterrier, M., Valderrama, R., Airaki, M., Chaki, M., Palma, J. M., et al. (2011). Nitric oxide imbalance provokes a nitrosative response in plants under abiotic stress. Plant Sci. 181, 604–611. doi: 10.1016/j.plantsci.2011.04.005
Delledonne, M., Xia, Y., Dixon, R. A., and Lamb, C. (1998a). Nitric oxide functions as a signal in plant disease resistance. Nature. 394, 585–588. doi: 10.1038/29087
Delledonne, M., Xia, Y., Dixon, R. A., and Lamb, C. (1998b). Nitric oxide functions as a signal in plant disease resistance. Nature. 394, 585–588. doi: 10.1038/29087
Del Río L, A. (2015). ROS and RNS in plant physiology: an overview. J. Exp. Bot. 66, 2827–2837. doi: 10.1093/jxb/erv099
Droge, W. (2002). Free radicals in the physiological control of cell function. Physiol. Rev. 82, 47–95. doi: 10.1152/physrev.00018.2001
Fan, M., Xing, J., Li, Z., and Qin, X. (2014). Comparison on chemical constituents between Paeoniae Alba Radix and Paeoniae Rubra Radix using NMR based metabolomic approach. Chin. Traditional Herbal Drugs 45, 3230–3237. doi: 10.7501/j.issn.0253-2670.2014.22.004
Fraga, C. G., Croft, K. D., Kennedy, D. O., and Tomás-Barberán, F. A. (2019). The effects of polyphenols and other bioactives on human health. Food Funct. 10, 514–528. doi: 10.1039/c8fo01997e
Gray, H. B. and Winkler, J. R. (2021). Functional and protective hole hopping in metalloenzymes. Chem. Sci. 12, 13988–14003. doi: 10.1039/d1sc04286f
Grimm, S., Höhn, A., and Grune, T. (2012). Oxidative protein damage and the proteasome. Amino Acids 42, 23–38. doi: 10.1007/s00726-010-0646-8
Hansen, J. M., Go, Y. M., and Jones, D. P. (2006). Nuclear and mitochondrial compartmentation of oxidative stress and redox signaling. Annu. Rev. Pharmacol. Toxicol. 46, 215–234. doi: 10.1146/annurev.pharmtox.46.120604.141122
Heinrich, T. A., da Silva, R. S., Miranda, K. M., Switzer, C. H., Wink, D. A., and Fukuto, J. M. (2013). Biological nitric oxide signalling: chemistry and terminology. Br. J. Pharmacol. 169, 1417–1429. doi: 10.1111/bph.12217
Jiang, Z., van Zanten, M., and Sasidharan, R. (2025). Mechanisms of plant acclimation to multiple abiotic stresses. Commun. Biol. 8, 655. doi: 10.1038/s42003-025-08077-w
Kabała, K., Reda, M., Wdowikowska, A., and Janicka, M. (2022). Role of plasma membrane NADPH oxidase in response to salt stress in cucumber seedlings. Antioxidants (Basel). 11, 1534. doi: 10.3390/antiox11081534
Karamat, A., Tehrani, R., Foster, G. D., and Van Aken, B. (2024). Plant responses to per- and polyfluoroalkyl substances (PFAS): a molecular perspective. Int. J. Phytoremediation. 26, 219–227. doi: 10.1080/15226514.2023.2232874
Khorobrykh, S., Havurinne, V., Mattila, H., and Tyystjärvi, E. (2020). Oxygen and ROS in photosynthesis. Plants (Basel). 9, 91. doi: 10.3390/plants9010091
Kubo, I., Masuoka, N., Ha, T. J., Shimizu, K., and Nihei, K. (2010). Multifunctional antioxidant activities of alkyl gallates. Open Bioactive Compounds J. 3, 1–11. doi: 10.2174/1874847301003010001
Kunkemoeller, B. and Kyriakides, T. R. (2017). Redox signaling in diabetic wound healing regulates extracellular matrix deposition. Antioxid Redox Signal. 27, 823–838. doi: 10.1089/ars.2017.7263
Liu, J., Chen, L., Fan, C. R., Li, H., Huang, M. Q., Xiang, Q., et al. (2015). Qualitative and quantitative analysis of major constituents of Paeoniae Radix Alba and Paeoniae Radix Rubra by HPLC-DAD-Q-TOF-MS/MS. Zhongguo Zhong Yao Za Zhi. 40, 1762–1770. doi: 10.4268/cjcmm20150926
Ma, C., Miao, Q. L., Song, X. B., Zhao, X. Y., Li, Y. Z., Zou, M., et al. (2024a). Paeonol potentiates colistin efficacy against K. pneumoniae by promoting membrane disruption and oxidative damage. Phytomedicine. 135, 156061. doi: 10.1016/j.phymed.2024.156061
Ma, W., Ren, H., Meng, X., Liu, S., Du, K., Fang, S., et al. (2024b). A review of the ethnopharmacology, phytochemistry, pharmacology, pharmacokinetics and quality control of Paeonia lactiflora Pall. J. Ethnopharmacol. 335, 118616. doi: 10.1016/j.jep.2024.118616
MacDonald, M. J. and D’Cunha, G. B. (2007). A modern view of phenylalanine ammonia lyase. Biochem. Cell Biol. 85, 273–282. doi: 10.1139/o07-018
Malhotra, J. D. and Kaufman, R. J. (2007). Endoplasmic reticulum stress and oxidative stress: a vicious cycle or a double-edged sword? Antioxid Redox Signal. 9, 2277–2293. doi: 10.1089/ars.2007.1782
Miller, G., Suzuki, N., Ciftci-Yilmaz, S., and Mittler, R. (2010). Reactive oxygen species homeostasis and signalling during drought and salinity stresses. Plant Cell Environ. 33, 453–467. doi: 10.1111/j.1365-3040.2009.02041.x
Moghaddam, A.-H., Arouiee, A., Moshtaghi, N., and Azizi, M. (2019). Physiological and biochemical changes induced by UV-B radiation in rosemary plants grown under salinity stress. J. Ecol. Eng. 20, 217–228. doi: 10.12911/22998993/105360
Muñoz-Bertomeu, J., Cascales-Miñana, B., Alaiz, M., Segura, J., and Ros, R. (2010). A critical role of plastidial glycolytic glyceraldehyde-3-phosphate dehydrogenase in the control of plant metabolism and development. Plant Signal Behav. 5, 67–69. doi: 10.4161/psb.5.1.10200
Nakayama, T. and Uno, B. (2024). Concerted two-proton-coupled electron transfer from piceatannol to electrogenerated superoxide in N, N-dimethylformamide. ACS Omega. 9, 24889–24898. doi: 10.1021/acsomega.4c01742
Niu, L. and Liao, W. (2016). Hydrogen Peroxide Signaling in Plant Development and Abiotic Responses: Crosstalk with Nitric Oxide and Calcium. Front Plant Sci. 7, 230. doi: 10.3389/fpls.2016.00230
Ozyigit, I. I., Dogan, I., Hocaoglu-Ozyigit, A., Yalcin, B., Erdogan, A., Yalcin, I. E., et al. (2023). Production of secondary metabolites using tissue culture-based biotechnological applications. Front. Plant Sci. 14. doi: 10.3389/fpls.2023.1132555
Pant, P., Pandey, S., and Dall’Acqua, S. (2021). The influence of environmental conditions on secondary metabolites in medicinal plants: A literature review. Chem. Biodivers 18, e2100345. doi: 10.1002/cbdv.202100345
Peng, W., Wang, N., Wang, S., Wang, J., and Dong, Y. (2022). Effects of exogenous caffeic acid, L-phenylalanine and naCl treatments on main active components content and in vitro digestion of germinated tartary buckwheat. Foods. 11, 3682. doi: 10.3390/foods11223682
Pharmacopoeia Commission of the People’s Republic of China (2020). Pharmacopoeia of the people’s republic of China Vol. 108 (Beijing, China: China Medical Science Press).
Phua, S. Y., De Smet, B., Remacle, C., Chan, K. X., and Van Breusegem, F. (2021). Reactive oxygen species and organellar signaling. J. Exp. Bot. 72, 5807–5824. doi: 10.1093/jxb/erab218
Pradhan, G. P. and Prasad, P. V. (2015). Evaluation of wheat chromosome translocation lines for high temperature stress tolerance at grain filling stage. PloS One 10, e116620. doi: 10.1371/journal.pone.0116620
Pratt, D. A., Tallman, K. A., and Porter, N. A. (2011). Free radical oxidation of polyunsaturated lipids: New mechanistic insights and the development of peroxyl radical clocks. Acc Chem. Res. 44, 458–467. doi: 10.1021/ar200024c
Shen, Y., Cong, W., Zhang, A. H., and Meng, X. (2020). Complexity of active medicinal ingredients in radix scutellariae with sodium hydrosulfite exposure. PloS One 15, e238927. doi: 10.1371/journal.pone.0238927
Sheng, Y., Abreu, I. A., Cabelli, D. E., Maroney, M. J., Miller, A. F., Teixeira, M., et al. (2014). Superoxide dismutases and superoxide reductases. Chem. Rev. 114, 3854–3918. doi: 10.1021/cr4005296
Song, X. W., Yao, Y., Yu, P. C., Zhang, W., Liu, W. F., Wang, L. Y., et al. (2023). Sodium nitroprusside improved the quality of Radix Saposhnikoviae through constructed physiological response under ecological stress. Sci. Rep. 13, 15823. doi: 10.1038/s41598-023-43153-3
Suh, K. S., Choi, E. M., Lee, Y. S., and Kim, Y. S. (2013). Protective effect of albiflorin against oxidative-stress-mediated toxicity in osteoblast-like MC3T3-E1 cells. Fitoterapia 89, 33–41. doi: 10.1016/j.fitote.2013.05.016
Tu, B. P. and Weissman, J. S. (2004). Oxidative protein folding in eukaryotes: mechanisms and consequences. J. Cell Biol. 164, 341–346. doi: 10.1083/jcb.200311055
Van Ruyskensvelde, V., Van Breusegem, F., and van der Kelen, K. (2018). Post-transcriptional regulation of the oxidative stress response in plants. Free Radic. Biol. Med. 122, 181–192. doi: 10.1016/j.freeradbiomed.2018.02.032
Wang, P., Liu, W. C., Han, C., Wang, S., Bai, M. Y., and Song, C. P. (2024). Reactive oxygen species: Multidimensional regulators of plant adaptation to abiotic stress and development. J. Integr. Plant Biol. 66, 330–367. doi: 10.1111/jipb.13601
Wang, F., Xiao, K., Jiang, S., Qu, M., Lian, L., He, W., et al. (2019). Mechanisms of reactive oxygen species in plants under drought stress. Chin. Sci. Bulletin. 64, 1765–1779. doi: 10.1360/N972018-01116
Xie, X., He, Z., Chen, N., Tang, Z., Wang, Q., and Cai, Y. (2019). The roles of environmental factors in regulation of oxidative stress in plant. BioMed. Res. Int. 2019, 9732325. doi: 10.1155/2019/9732325
Xu, P., Hu, Y., Zhan, L., Wu, X., Lou, K., Chen, R., et al. (2023). Study on the spatio-temporal expression pattern and their correlation of monoterpene glycosides content and the biosynthesis-related gene in paeonia lactiflora pall. Chin. J. Modern Appl. Pharm. 40, 1490–1498. doi: 10.13748/j.cnki.issn1007-7693.20221072
Ya, L., Haoru, T., and Yong, Z. (2011). Production of reactive oxygen species and antioxidant metabolism about strawberry leaves to low temperatures. J. Agric. Science. 3, 89–96. doi: 10.5539/jas.v3n2p89
Yang, T. and Poovaiah, B. W. (2002). Hydrogen peroxide homeostasis: activation of plant catalase by calcium/calmodulin. Proc. Natl. Acad. Sci. U S A. 99, 4097–4102. doi: 10.1073/pnas.052564899
Yang, L., Wen, K. S., Ruan, X., Zhao, Y. X., Wei, F., and Wang, Q. (2018). Response of plant secondary metabolites to environmental factors. Molecules 23, 762. doi: 10.3390/molecules23040762
Yao, J., Wang, W., Guo, S., and Meng, X. (2020). Different germplasm of paeoniae radix alba and paeoniae radix rubra. Modern Chin. Med. 22, 1933–1937. doi: 10.13313/j.issn.1673-4890.20200804001
Yun, B. W., Feechan, A., Yin, M., Saidi, N. B., Le Bihan, T., Yu, M., et al. (2011). S-nitrosylation of NADPH oxidase regulates cell death in plant immunity. Nature. 478, 264–268. doi: 10.1038/nature10427
Zhang, J. J., Li, W., Wang, L. L., Huang, Y. F., Wang, C., Wang, J. X., et al. (2013). Varieties, functions and clinical applications of Chishao and Baishao: a literature review. Zhongguo Zhong Yao Za Zhi. 38, 3595–3601. doi: 10.4268/cjcmm20132037
Zhang, W., Yu, P., Liu, W., Wang, L., Song, X., Yao, Y., et al. (2025). Mechanism of sodium nitroprusside regulating ginseng quality. Sci. Rep. 15, 1562. doi: 10.1038/s41598-025-85905-3
Zhao, K., Long, X., Li, J., Wang, Y., Lan, P., and Wang, Y. (2024). Anti-oxidant activity of 1-(1H-imidazo[4,5-c] pyridin-4-yl) ethenone, a Maillard reaction product derived from fructose and histidine. J. Sci. Food Agric. 104, 9548–9558. doi: 10.1002/jsfa.13779
Zhao, K., Yao, J., Yu, P., Song, X., Yao, Y., He, L., et al. (2023). Biological mechanism of drought improving quality of rhizoma atractylodis. Chinensis. Chin. J. Exp. Traditional Med. Formulae 29, 180–187. doi: 10.13422/j.cnki.syfjx.20230514
Keywords: Paeoniae Radix Rubra, Paeoniae Radix Alba, nitric oxide, reactive oxygen species, secondary metabolites, quality of medicinal herbs
Citation: Zhao K, You Y, Deng D, Du Q, Guo Z, Liu L and Meng X (2025) Biological mechanisms of sodium nitroprusside in enhancing quality of Radix Paeoniae Rubra and Radix Paeoniae Alba. Front. Plant Sci. 16:1660058. doi: 10.3389/fpls.2025.1660058
Received: 05 July 2025; Accepted: 27 October 2025;
Published: 12 November 2025.
Edited by:
Shifeng Cao, Zhejiang Wanli University, ChinaReviewed by:
Yueya Zhang, The University of Chicago, United StatesYi Liu, Lushan Botanical Garden (CAS), China
Copyright © 2025 Zhao, You, Deng, Du, Guo, Liu and Meng. This is an open-access article distributed under the terms of the Creative Commons Attribution License (CC BY). The use, distribution or reproduction in other forums is permitted, provided the original author(s) and the copyright owner(s) are credited and that the original publication in this journal is cited, in accordance with accepted academic practice. No use, distribution or reproduction is permitted which does not comply with these terms.
*Correspondence: Xiangcai Meng, bWVuZ3hpYW5nY2FpMDAwQDE2My5jb20=