 Jiantang Xu1,2†
 Tianjin Liu1,2†
 Hui Lin1,2,3Rong Huang1,2Meixia Chen1,2,3Pingping Fang1,2*
 Xiaoping Niu1,2*
- 1Key Lab of Genetics, Breeding and Multiple Utilization of Crops, Ministry of Education, College of Life Science, College of Agriculture, Fujian Agriculture and Forestry University, Fuzhou, China
- 2Fujian Provincial Key Laboratory of Haixia Applied Plant Systems Biology, College of Life Science, College of Agriculture, Fujian Agriculture and Forestry University, Fuzhou, China
- 3College of Life Science, Industry and University Research Cooperation Demonstration Base in Fujian Province, Ningde Normal University, Ningde, China
Caffeic acid O-methyltransferase (COMT) catalyzes the penultimate methylation in monolignol biosynthesis, controlling lignin composition and abiotic-stress tolerance. Kenaf (Hibiscus cannabinus L.), a fast bast-fiber crop rich in lignin, is valued for its mechanical strength and resilience to salinity. However, the COMT gene family has not yet been systematically characterized in this species. Here, we integrated phylogenetics, synteny, promoter and transcriptome analyses to create a comprehensive profile of kenaf COMT genes. Genome-wide screening identified 81 HcCOMT genes. Phylogenetic reconstruction with COMTs from Arabidopsis thaliana and Gossypium hirsutum resolved 10 distinct clades. Synteny analysis revealed 2 collinear blocks with Arabidopsis and 14 with cotton, whereas intraspecific duplication events indicated recent lineage-specific expansion. Promoter analysis identified numerous cis-elements responsive to light, phytohormones and abiotic stress, suggesting complex transcriptional regulation. Transcriptome mining uncovered 6 candidate genes with pronounced tissue specificity and salt responsiveness; qRT-PCR confirmed these patterns in root, stem and leaf tissues under 200 mM NaCl: HcCOMT28 and HcCOMT29 were repressed in the leaf, whereas HcCOMT11, HcCOMT12, HcCOMT13, and HcCOMT17 were up-regulated, consistent with altered lignin deposition patterns. Our findings provide a comprehensive genomic resource delineating the structure, evolution, and salt-responsive expression of the kenaf COMT family, and establish a foundation for elucidating the molecular mechanisms underlying lignin-mediated salt tolerance and for breeding elite kenaf cultivars with tailored fiber properties.
1 Introduction
Lignin is the principal hydrophobic polymer that impacts mechanical rigidity and hydrophobicity to secondary-thickened plant cell walls. It is synthesized from three hydroxylated and methoxylated phenylpropane alcohols: p-coumaryl (H), coniferyl (G) and sinapyl (S) alcohols, via oxidative coupling reactions that are catalyzed predominantly by class III peroxidases and laccases (Tu et al., 2010; Liu et al., 2018). By encrusting the polysaccharide matrix, lignin reinforces vascular tissues, enables long-distance water transport, and erects a physical barrier against insects, pathogens and abiotic stresses, thereby enhancing lodging resistance and stress tolerance (Moura et al., 2010; Liu et al., 2018). Biosynthetically, lignin originates from phenylalanine through the general phenylpropanoid pathway, followed by a series of hydroxylation, O-methylations, CoA-ligations, and NADPH-dependent reductions that generate the three monolignols (Vanholme et al., 2019). These monomers are exported to the apoplast, where they undergo radical coupling to form the heterogeneous lignin polymer embedded in the secondary cell wall (Vanholme et al., 2010; Abdelaziz et al., 2016; Tuskan et al., 2019; Vanholme et al., 2019). Among the genes governing lignin composition, caffeoyl-CoA 3-O-methyltransferase (COMT) is a pivotal O-methyltransferase that channels metabolic flux towards S-lignin by catalyzing the methylation of 5-hydroxyconiferyl alcohol and its aldehyde/CoA esters (Vanholme et al., 2019; Wu et al., 2021). Alteration in COMT activity can shift lignin composition and architecture, affecting hydrophobicity, elasticity, and cation exchange potential of the cell wall. In the context of salt stress, enhanced S-unit lignin deposition has been associated with reduced Na+ influx, improved water-use efficiency, and stabilization of cell wall structure under osmotic pressure (Moura et al., 2010; Vanholme et al., 2019). Recent studies further demonstrate that COMT expression is dynamically regulated under both salinity and drought, directly linking lignin remodeling to stress resilience mechanisms (Huang et al., 2024). Collectively, these findings underscore COMT as a mechanistic bridge between lignin biochemistry and salt tolerance, providing a molecular target for engineering stress-resilient crops. All COMTs share a conserved C-terminal methyltransf-2 domain harboring the S-adenosyl-L-methionine (SAM)/SAH-binding pocket and the substrate-binding site, where the N-terminal helical domain, composed of nine heptad repeats, mediates homo- and heterodimerization that is essential for efficient catalysis and protein-protein interactions (Vanholme et al., 2010; Zagel et al., 2013).
COMT genes have undergone dynamic evolution driven by whole-genome duplication (WGD) and dispersed duplication events (Huang et al., 2013; Liu et al., 2021). Since the first report of a COMT multigene family in Populus tremuloides (Bugos et al., 1991), extensive genome-wide surveys have revealed substantial family expansions: 33 COMT gene members identified in Oryza sativa (Liang et al., 2022), 7 members in Eucalyptus grandis (Carocha et al., 2015), 23 members in Catalpa bungei (Lu et al., 2019), 92 in blueberries (Liu et al., 2021), 25 in Populus trichocarpa (Shi et al., 2010), and 25 in Betula pendula (Chen et al., 2020b). Functionally, COMT show maximal activity in lignifying tissues, such as stem segments display the highest transcript levels (Lv et al., 2011). RNA-mediated suppression of COMT in Brassica napus decreases stem lignin without compromising seed oil quality (Oraby and Ramadan, 2014), whereas its overexpression in Arabidopsis promotes biomass accumulation and salt tolerance through enhanced melatonin biosynthesis (Lee et al., 2014; Yang et al., 2019). Moreover, Sorghum bicolor COMT participates in tricin (a flavone lignin monomer) biosynthesis by methylating luteolin and selgin (Eudes et al., 2017), and Populus COMT4 alters lignin crosslinking by increasing G-unit incorporation (Cai et al., 2016). Despite these advances, the COMT gene family remains uncharacterized in kenaf (Hibiscus cannabinus L.).
Kenaf (Hibiscus cannabinus L.), belonging to the Malvaceae family, is an industrial crop holding high cellulosic fiber and lignin content, predominantly grown in Asia and Africa (Ayadi et al., 2011; Niu et al., 2017). Kenaf is an appealing fiber and lignin source for paper manufacture, owing to its environmentally friendly nature, such as biodegradability, renewability, and low energy consumption (Bhardwaj et al., 2005; Villar et al., 2009; Niu et al., 2017). It also has great potential for utilization in oil absorption, animal feed, and value-added industrial products (Ayadi et al., 2011; Niu et al., 2017). Moreover, it is reported that kenaf can survive in water-deficient areas and adapt well to diverse adverse stresses, such as high salinity, drought and extreme temperature (Bhardwaj et al., 2005; Niu et al., 2017). Its inherent tolerance to drought, salinity, and extreme temperatures makes it an ideal model for dissecting fiber development and stress adaptation. However, the evolutionary relationship, structural features, and functional divergence of the COMT family in H. cannabinus have not yet been investigated.
Here, we performed a comprehensive genome-wide identification and characterization of the COMT gene family in kenaf. We reconstructed the phylogeny of COMT proteins across land plants, investigated the duplication history and conserved motifs of HcCOMT members, and profiled their transcriptional responses to salt stress in the salt-tolerant cultivar Fuhong18 and the salt-sensitive cultivar Zanyin1, and detected potential interactions among HcCOMT members using protein-protein interaction assays. These findings establish a foundation for elucidating the molecular mechanisms underlying lignin deposition and stress adaptation in kenaf and provide valuable genetic resources for fiber crop improvement.
2 Materials and methods
2.1 Identification and characteristics of COMT genes in kenaf
The kenaf (Hibiscus cannabinus L.) genome assembly (Accession: GWHACDB00000000.1, BioProject: PRJCA000871, BioSample: SAMC036340, released on 1 July 2021) together with its corresponding CDS and protein sequences were retrieved from Genome Warehouse of the BIG Data Center (BIGD, https://bigd.big.ac.cn/gwh). To obtain a comprehensive COMT gene set, we integrated homology- and domain-based searches. First, the 16 functionally characterized COMT proteins from Arabidopsis thaliana were used as queries to identify homologous genes using a BLASTp search (BLOSUM62 matrix, E-value ≤ 1 ×10⁻⁵) against the kenaf proteome. Putative hits were subsequently screened for the presence of the methyltransf-2 domain (PF00891) using the Hidden Markov Model (HMM) profile downloaded from the Pfam database (http://pfam.xfam.org). All candidates were further validated with the NCBI-CDD (https://www.ncbi.nlm.nih.gov/cdd) and SMART (http://smart.embl-heidelberg.de/) to confirm domain integrity. Proteins lacking the canonical SAM-binding motif and substrate-binding pocket were discarded. Physicochemical parameters: such as molecular weight (MW), isoelectric point (pI), and grand average of hydrophilicity (GRAVY), which are valuable for hypothesizing about its functional roles, potential interaction partners, and its suitability for specific cellular environments, were calculated with the ExPASy ProtParam server (https://www.expasy.org/resources/compute-pI-mw). Subcellular localization of HcCOMT were predicted independently by WOLF-PSORT (http://wolfpsort.hgc.jp/) and CELLO (http://cello.life.nctu.edu.tw/) under the “plant” settings; only consensus predictions were retained.
2.2 Phylogenetics, gene structure, and chromosomal distribution
To assess the evolutionary conservation and functional divergence of COMT across taxa, full-length COMT proteins from three representative plant species were aligned with MAFFT software (Katoh and Standley, 2013). A Maximum Likelihood (ML) phylogeny was then inferred with IQ-TREE (v3.0.0) using 1000 bootstrap replicates to estimate node support. Exon-intron architectures of HcCOMTs were visualized with GSDS 2.0 (http://gsds.gao-lab.org) using the corresponding genome annotation file. Conserved motifs (width 6–50 aa, maximum 15 motifs) were identified by MEME (http://meme-suite.org/meme/) and mapped onto the phylogeny. Secondary structures of HcCOMTs were predicted by PSIPRED workbench (https://bioinf.cs.ucl.ac.uk/psipred/), tertiary topology homology models were generated by SWISS-MODEL, and model quality was assessed by QMEAN and PROCHECK (Biasini et al., 2014). Chromosomal locations were extracted from the genome GFF and plotted with MapChart 2.2 software (Voorrips, 2002). For promoter analysis, 2000 bp upstream of the translation start codon of each HcCOMT was scanned against the PlantCARE database to identify cis-regulatory elements responsive to phytohormones and abiotic stresses (Lescot et al., 2002). GO enrichment analysis was used agriGO v 2.0 database (http://systemsbiology.cau.edu.cn/agriGOv2/index.php) to identify significant GO terms among the COMT-associated genes. Statistical significance was assessed using the hypergeometric test with a Benjamini-Hochberg false discovery rate (FDR) correction, and terms with FDR-adjusted p < 0.05 were considered significantly enriched. The background set consisted of all annotated genes in the kenaf genome.
2.3 Gene duplication and synteny analysis
Paralogous pairs were identified via an all-vs-all BlastP (E-value ≤ 1 ×10⁻¹⁰) followed by MCScanX (http://chibba.pgml.uga.edu/mcscan2/) with default parameters (Wang et al., 2012, 2024). Segmental and tandem duplications were classified according to the criteria of Guo et al. (2013). Synteny blocks between H. cannabinus, Arabidopsis thaliana, and Gossypium hirsutum were inferred by TBtools software (v 1.092) using protein identity ≥ 70% and coverage ≥ 80% (Chen et al., 2020a). Non-synonymous substitution rate (Ka), synonymous substitution rate (Ks) value, and Ka/Ks ratios for the paralogs COMT gene pairs were calculated by the KaKs-Calculator implemented in TBtools. Divergence time (T) was estimated under a neutral evolutionary rate of 1.5 × 10⁻⁸ substitutions site-1 year-1 for dicots (Koch et al., 2003).
2.4 Protein-protein interaction prediction
Putative functional partnerships of HcCOMT proteins were inferred with the STRING database (https://string-db.org/), with Gossypium hirsutum selected as the reference species due to its close phylogenetic relationship to kenaf. Only interactions with a confidence score threshold of 0.9 were retained to minimize false positives.
2.5 Plant materials and salt-stress treatments
Two kenaf varieties, salt-tolerant cultivar Fuhong18 and salt-sensitive cultivar Zanyin1, were used for salt stress treatments. After surface-sterilization, seeds were germinated on moist filter paper and transferred to nutritional soil (pH 6.5 – 7.0, electrical conductivity of approximately 1.2 – 1.5 dS/m, and an organic matter content of around 2.0–2.5%). Seedlings were grown in an artificial climate chamber (28 °C, 16 h photoperiod with light intensity 300 µmol·m−2 s−1, relative humidity 50 ± 10%). At the 5-leaf-stage, uniform seedlings were irrigated with 200 mM NaCl solution until the soil reached field capacity. Plants were then maintained under the same salinity regime by watering with the same NaCl solution at regular intervals to sustain a stable salt-stress environment, and control plants received water only. Leaves, stems, and roots were harvested at 0-, 7-, 14-, and 21-days post-treatment. Three biological replicates per tissue per time-point were snap-frozen in liquid nitrogen and stored at − 80 °C.
2.6 RNA extraction and quantitative real-time PCR
Total RNA was isolated using the RNAprep Pure Plant Kit (Tiangen, Beijing, China) following the manufacture’s protocol for polysaccharide-rich tissues. RNA integrity was verified by 1.2% agarose gel electrophoresis and quantified on a Nanodrop 2000C (Thermo). First-strand cDNA was synthesized from 2 µg DNase-treated RNA with the PrimeScript RT Reagent kit (Takara, Japan). Gene-specific primers (Supplementary Table S1) were designed with Primer-BLAST (NCBI) to span exon-exon junctions, and primer specificity was further confirmed by BLAST analysis and PCR amplification to ensure unique target amplification; the kenaf PP2A gene served as the endogenous control (Niu et al., 2017). qRT-PCR was performed in triplicate on an ABI 7500 Fast System (Applied Biosystems, Waltham, MA, USA) using SYBR Premix Ex Taq (Takara) in 20 µL reactions including 2 × SYBR Premix Ex Taq 10 µL, 10 μM forward primer 0.5 µL, 10 μM reverse primer 0.5 µL, cDNA template 1 µL and ddH2O 8 µL. PCR amplification was set at 95 °C for 30 s, followed by 40 cycles of 95 °C for 5 s and 60 °C for 20 s. Melting-curve analysis confirmed amplicon specificity. Relative expression was calculated by the 2−ΔΔCt method and normalized to PP2A. Statistical significance was assessed by one-way ANOVA followed by Tukey’s HSD test (p < 0.05).
3 Results
3.1 Identification and physicochemical properties of kenaf COMT genes
A stringent pipeline combining HMM profile and BLAST-based searches was used to mine the kenaf genome for COMT genes in kenaf. An initial HMM scan with the methyltransf-2 domain (PF00891) yielded 93 putative HcCOMT proteins, after removal of truncated and artefactual sequences by CDD and SMART validation, 81 high-confidence loci were retained. These HcCOMT genes were designated HcCOMT01 - HcCOMT81 according to their positions on the chromosome (Table 1, Supplementary Figure S1). The deduced proteins range from 100 (HcCOMT78) to 1069 amino acids (HcCOMT13), with corresponding molecular weights of 11.21 kDa - 122.39 kDa and theoretical isoelectric points (pI) spanning from 4.65 to 9.58. Fourteen proteins are predicted to be unstable (Instability Index > 40), whereas 71.6% are hydrophilic with GRAVY < 0. Subcellular prediction with CELLO and WoLF PSORT suggests predominant cytoplasmic localization (72.8%), followed by cytoskeletal association (11.1%). Six proteins (HcCOMT13, HcCOMT30, HcCOMT54, HcCOMT61, HcCOMT64, and HcCOMT80) are predicted to enter the nucleus; five (HcCOMT10, HcCOMT36, HcCOMT60, HcCOMT70, and HcCOMT76) are plastid; and single representatives are targeted to mitochondria (HcCOMT2) or the endoplasmic reticulum (HcCOMT23) (Table 1).
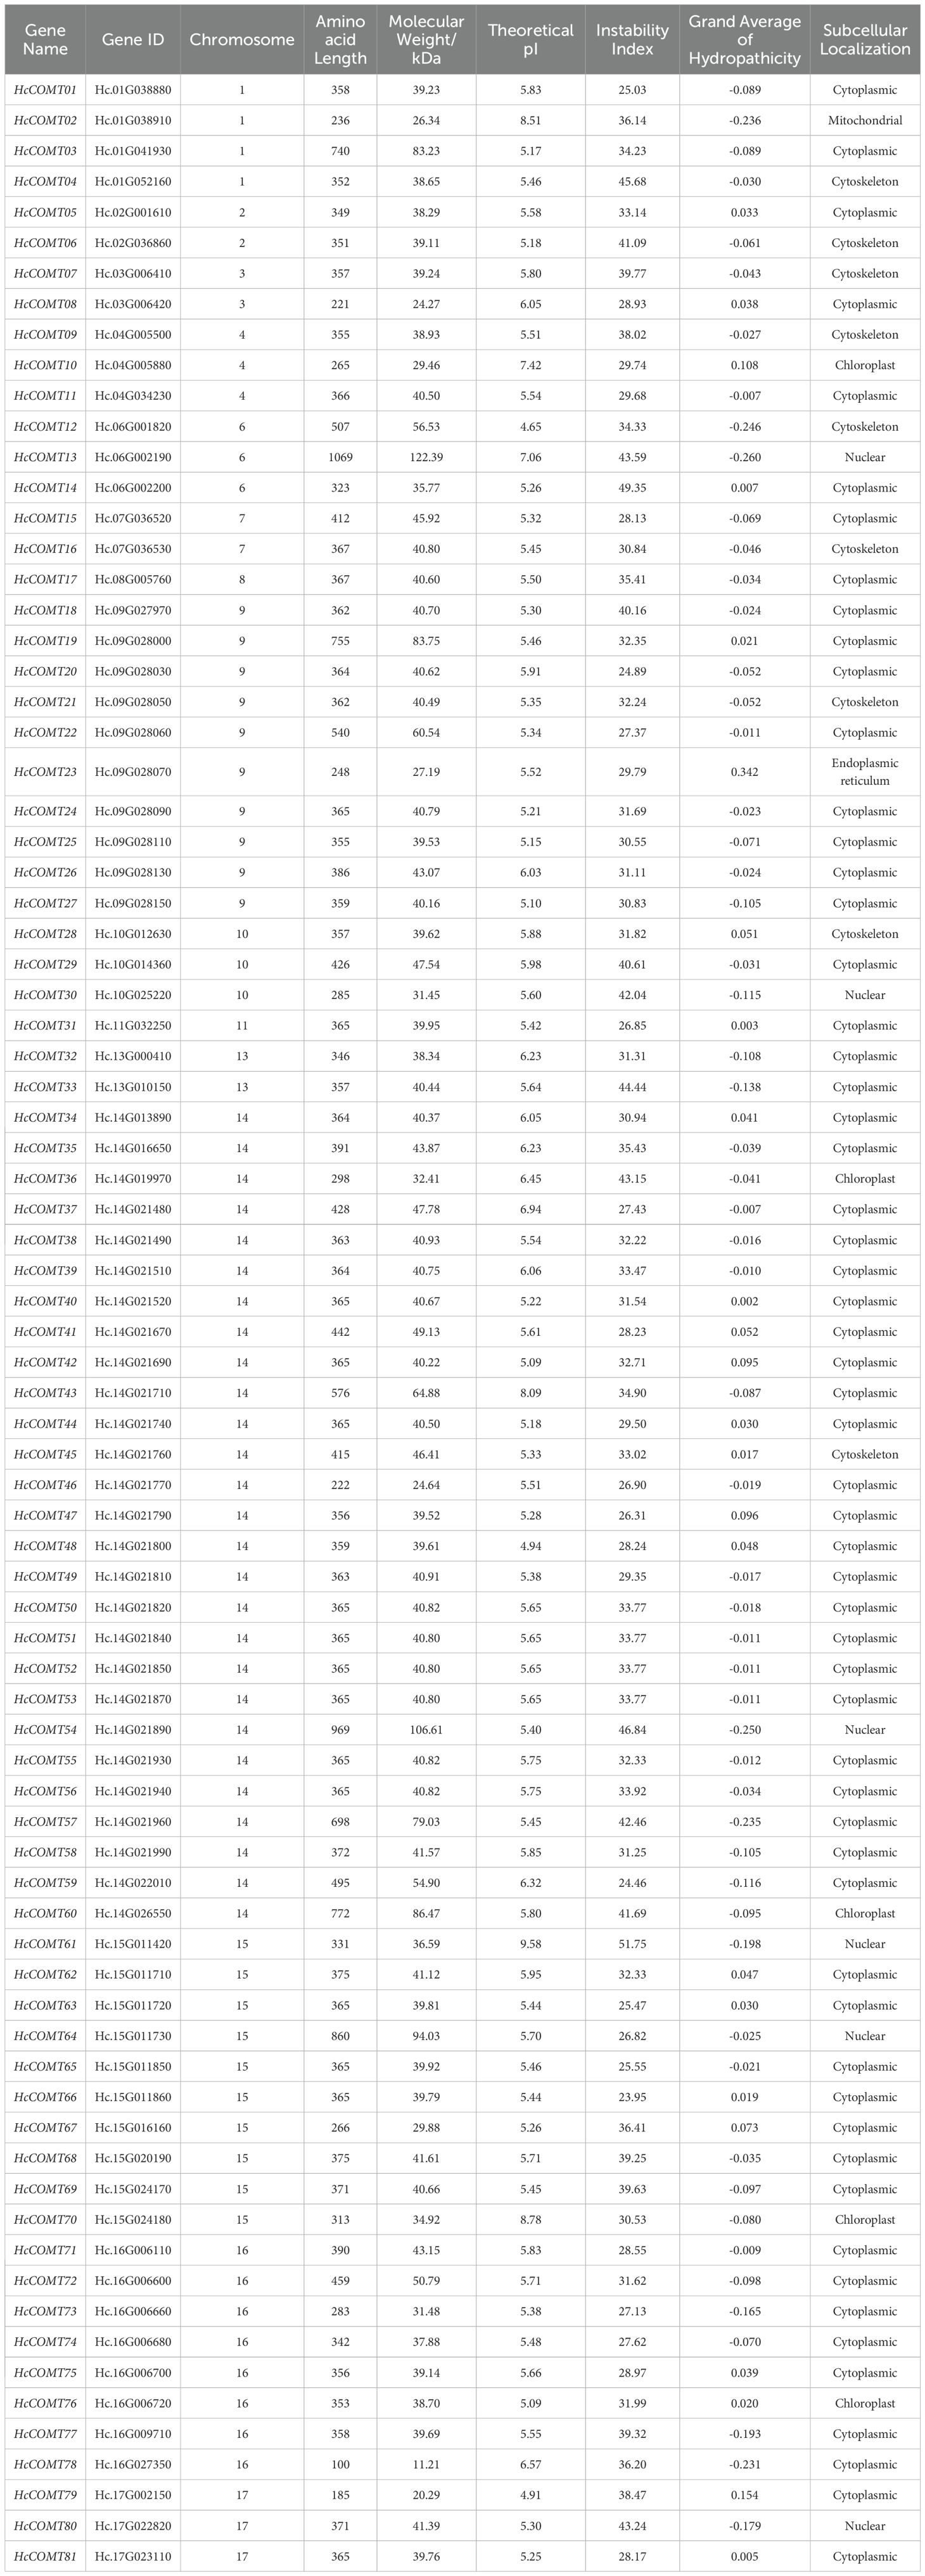
Table 1. The COMT gene family members and their physicochemical property charateristics in kenaf.
3.2 Phylogeny and molecular evolution of HcCOMT genes
To resolve the evolutionary relationships among COMT genes, we assembled a data set of 123 full-length COMT proteins from Hibiscus cannabinus (81), Gossypium hirsutum (26) and Arabidopsis thaliana (16). A Maximum Likelihood (ML) phylogeny robustly partitioned the family into ten clades (I-X) supported by ≥ 70% bootstrap values (Figure 1, Supplementary Table S2). Clades V and X are the largest groups with more than 20 COMT members, whereas clades I, III, and VII contained less than 10 members. Notably, kenaf contributes 34 members to the species-specific COMT clade X, whereas Arabidopsis members are restricted to clade I, and cotton members dominate clade III. These topologies suggest lineage-specific expansion and functional divergence following the divergence of the Malvaceae and Brassicaceae.
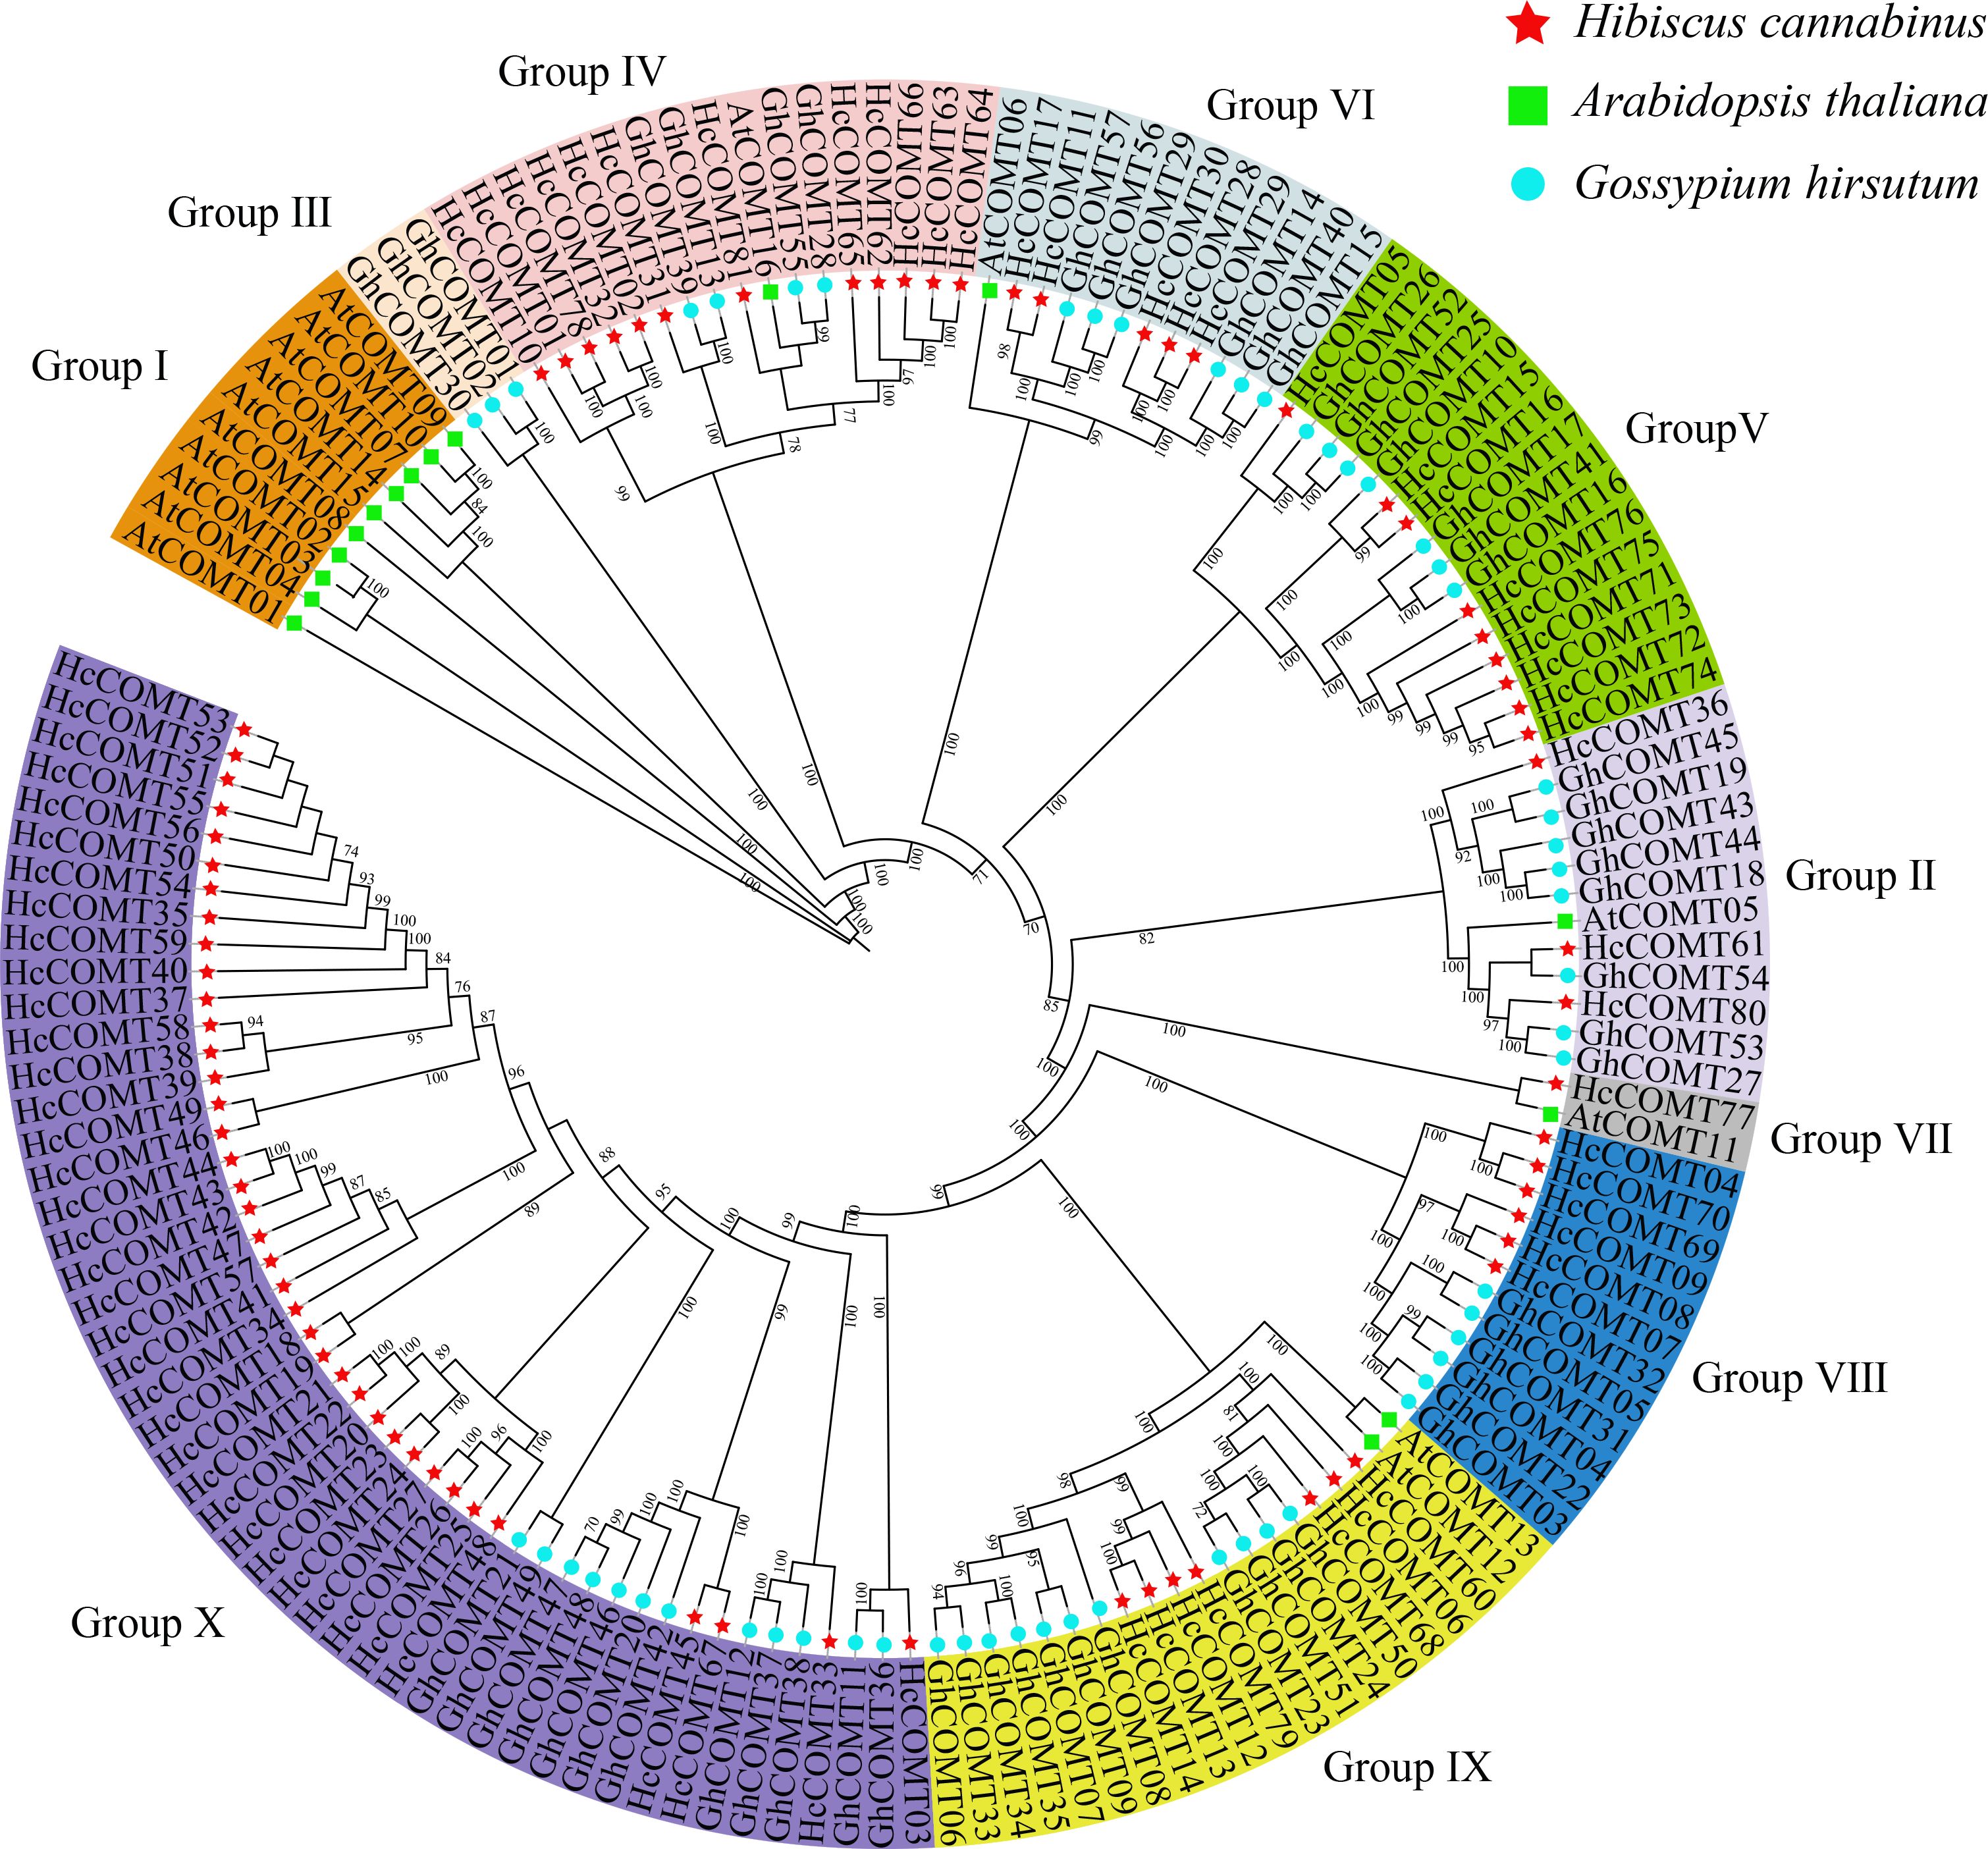
Figure 1. Phylogenetic tree for COMT gene family in three species. This unrooted tree was built using the COMT sequences of Hibiscus cannabinus (red stars), Arabidopsis thaliana (green ssquares) and Gossypium hirsutum (blue dots) by Maximum Likelihood (ML) method. COMT genes were divided into 10 groups (Group I-X) according to the clades and bootstrap values.
3.3 Motif composition and gene structure of the kenaf COMT genes
To gain a better understanding of the structural characteristics of HcCOMT proteins, the compositions of conserved motifs were analyzed using MEME. Ten conserved motifs, labeled as motifs 1–10, were identified. With the exception of a few outliers, all proteins in clades I-IV harbor the complete motif complement (motifs 1–10). Progressive motif loss is evident in more derived clades: HcCOMT46 (clade II) lacks motif 5, 7, 8, and 9; HcCOMT26 (clade III) lacks motif 9; HcCOMT67 (clade V) missed motif 7, 8, and 4; HcCOMT23 and HcCOMT43 (clade V) missed the motif 5, 7, 8, 9, 1, 10 and 3; and HcCOMT79 (clade VI) missed the motif 5, 6, 7, 8, and 9. The other members (HcCOMT06, HcCOMT68, HcCOMT60, HcCOMT12, HcCOMT14, and HcCOMT13) in the clade VI lacks the motif 9 and 7. While members in the clade VII miss motifs 7; clade VIII branch 9 and 8; and Clade X member HcCOMT78 retains only motifs 1 and 3. The presence of duplicated motif blocks in HcCOMT64 suggests a recent internal duplication event (Figures 2A, B). The type of conserved motifs in each subfamily were basically the same, indicating that the same subfamily was composed of similar conserved structural domains and may have similar biological functions. Intron-exon organization pattern mirrors the phylogenetic architecture. Most members of clades I-IV (such as HcCOMT51, HcCOMT40, HcCOMT27, and HcCOMT34) possess a single intron, whereas clades V-X (such as HcCOMT33, HcCOMT79, HcCOMT69, HcCOMT10, and HcCOMT01) display three to five introns, and HcCOMT64 contained 10 introns and HcCOMT78 has no intron. Exceptionally, HcCOMT19 contains 8 exons separated by two unusually long introns, a feature consistent with its isolated phylogenetic position (Figure 2C).
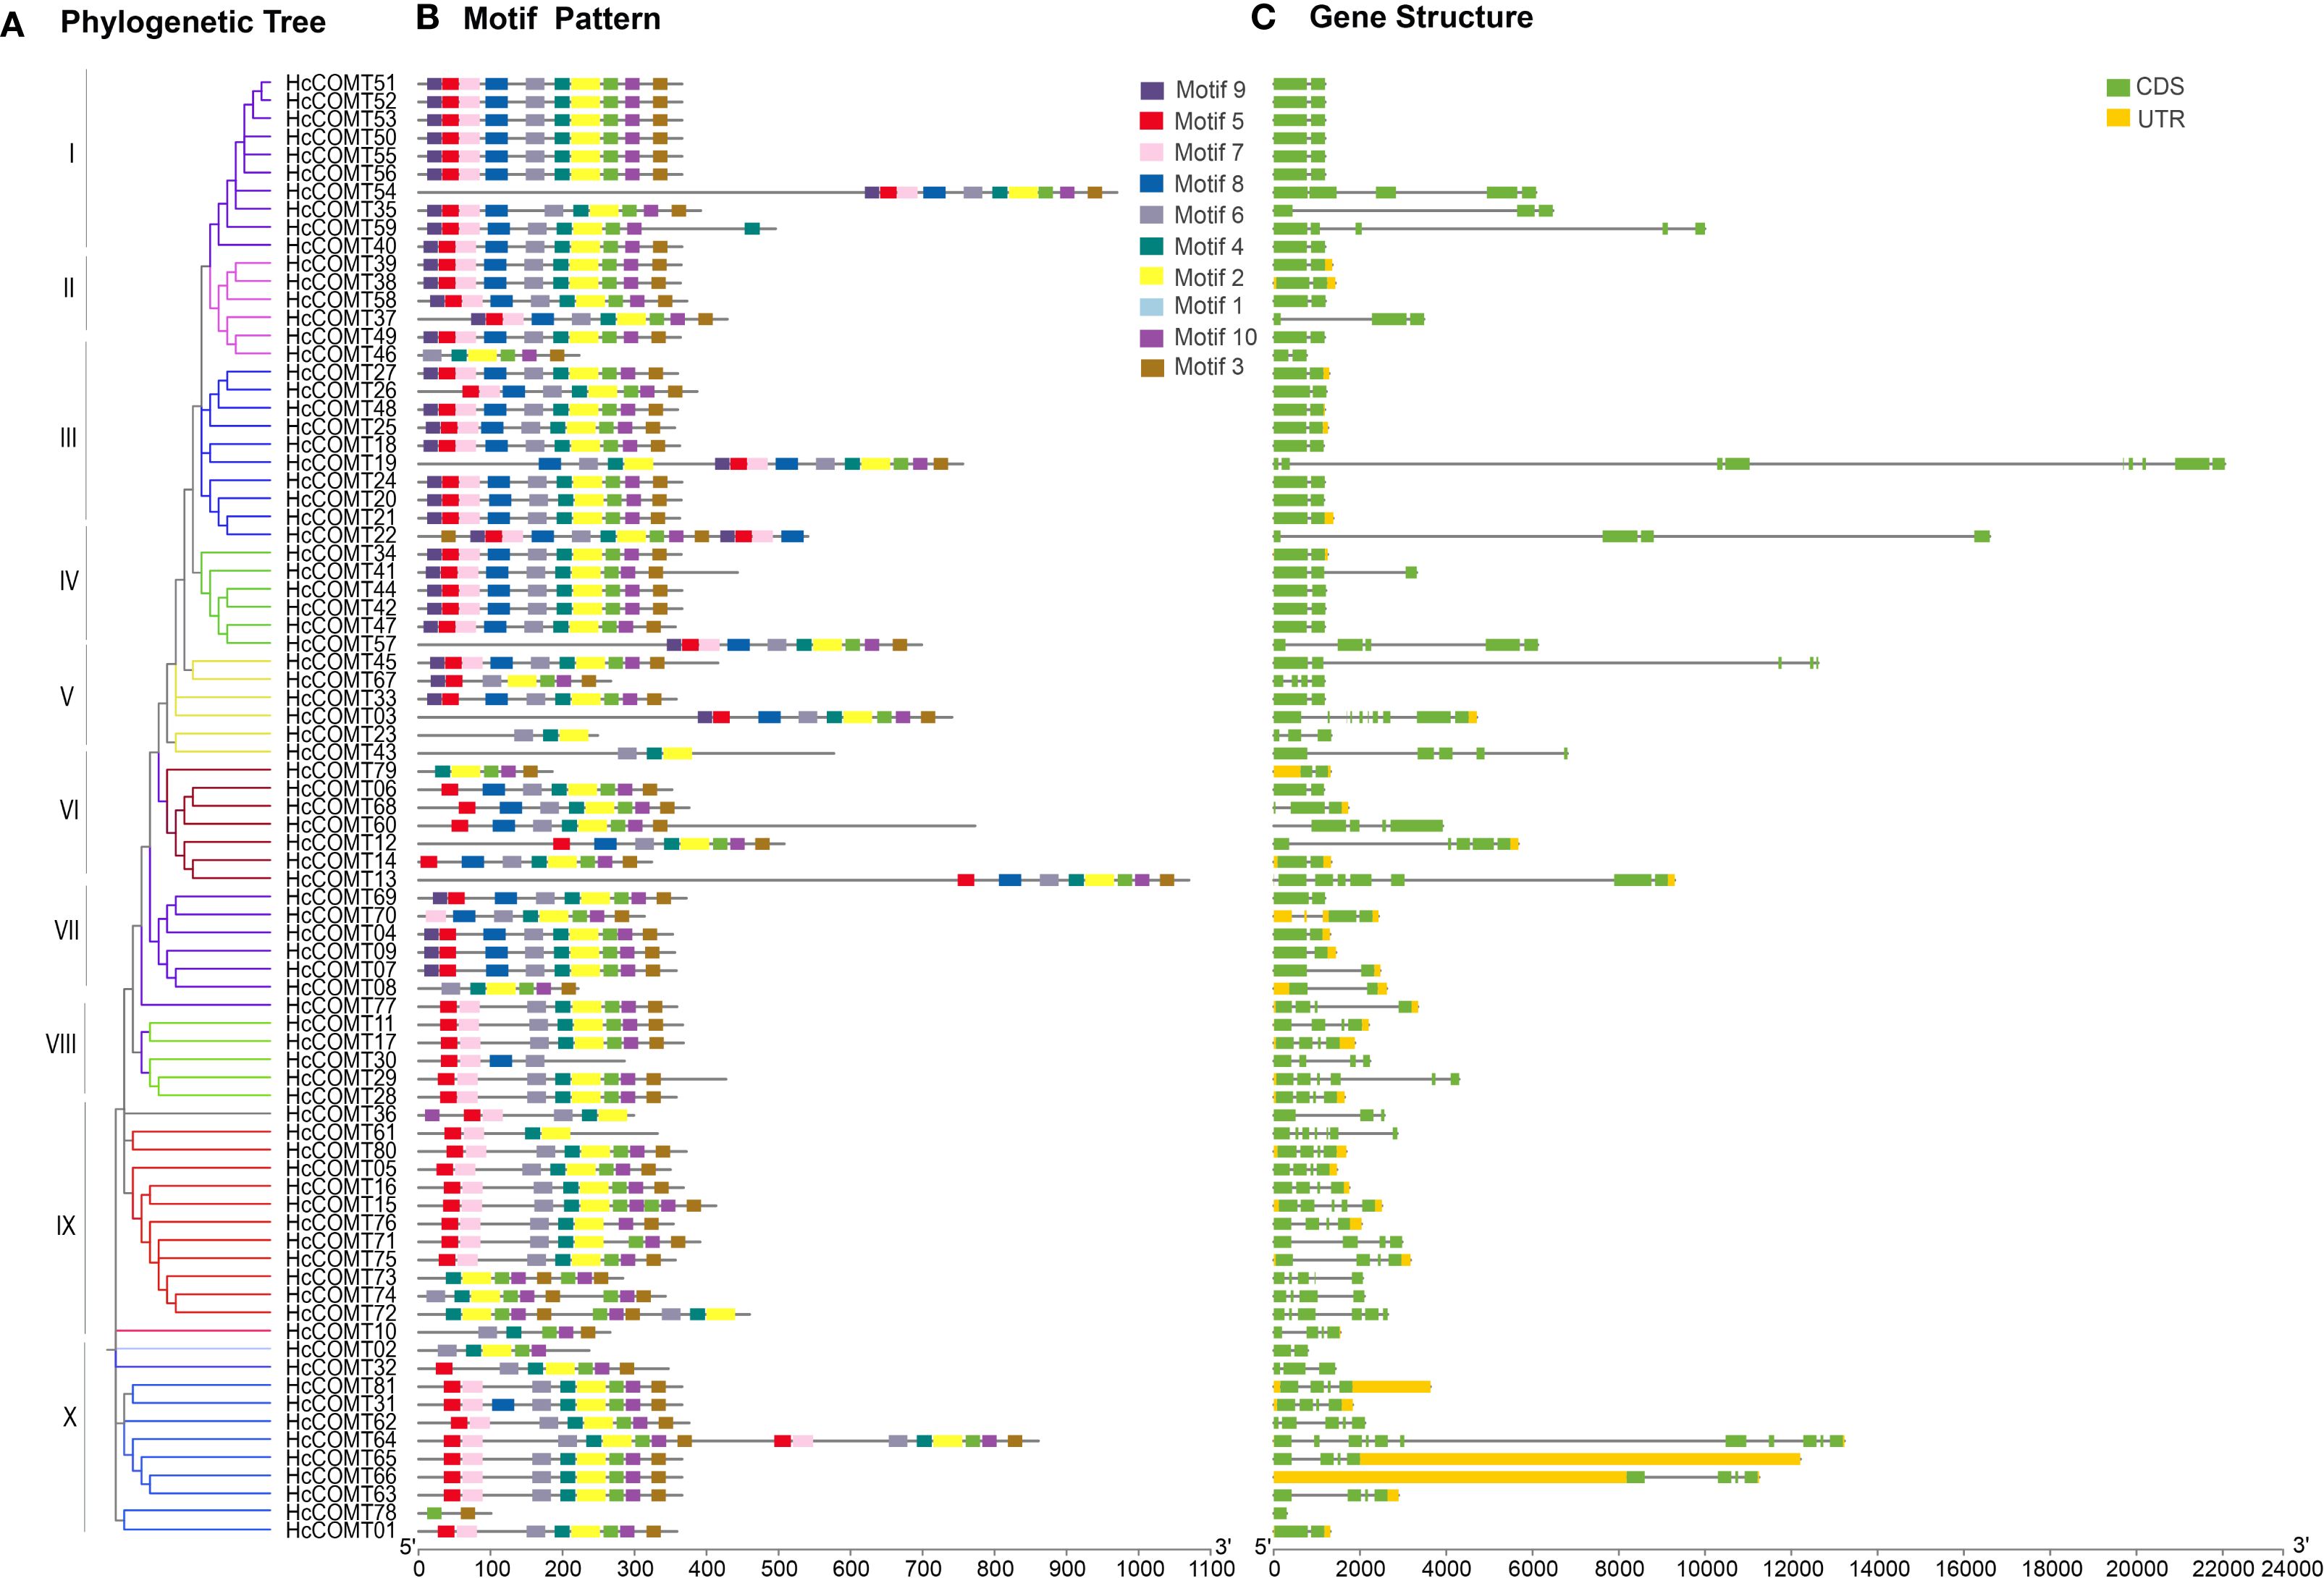
Figure 2. Gene structure characteristics analysis of HcCOMT genes. (A) The NJ tree on the left comprised of 81 COMT genes from kenaf. (B) The conserved motifs were indicated by the different colors boxes. (C) Gene structures of HcCOMT genes, the green color indicates the CDS regions, the yellow color indicates the 5’ and 3’-UTR regions, and the gray lines indicate the introns.
3.4 Chromosomal distribution and collinearity analysis of HcCOMT genes
To illustrate the evolutionary events of HcCOMT genes, the gene location on the chromosome of kenaf was investigated based on their genome sequences. The result revealed that 81 HcCOMT members were randomly distributed across eighteen chromosomes. Among them, Chr2, Chr3, Chr7, and Chr13 contained two HcCOMT genes; Chr4, Chr6, Chr10, and Chr17 had three genes; Chr8 and Chr11 each had one gene. Chromosome 14 is the major reservoir (27 HcCOMT genes), whereas chromosomes 5, 12, and 18 lack COMT loci entirely (Table 1, Supplementary Figure S1).
To elucidate the evolutionary relationships among HcCOMT genes, we analyzed the synchrony within the HcCOMT gene family. The results showed that segment replication accounts for 14 paralogous pair (HcCOMT31/HcCOMT62, HcCOMT31/HcCOMT65, HcCOMT31/HcCOMT81, HcCOMT31/HcCOMT80, HcCOMT29/HcCOMT17, HcCOMT23/HcCOMT38, HcCOMT16/HcCOMT75, HcCOMT12/HcCOMT79, HcCOMT07/HcCOMT09, HcCOMT04/HcCOMT69, HcCOMT80/HcCOMT62, HcCOMT80/HcCOMT65, HcCOMT81/HcCOMT62, and HcCOMT81/HcCOMT65), and three tandem arrays (HcCOMT62/HcCOMT65, HcCOMT80/HcCOMT81, and HcCOMT12/HcCOMT13) were identified (Figure 3A). All paralogous pairs exhibit Ka/Ks ratios less than 1, indicating strong purifying selection during the evolution of HcCOMT genes (Supplementary Table S3).
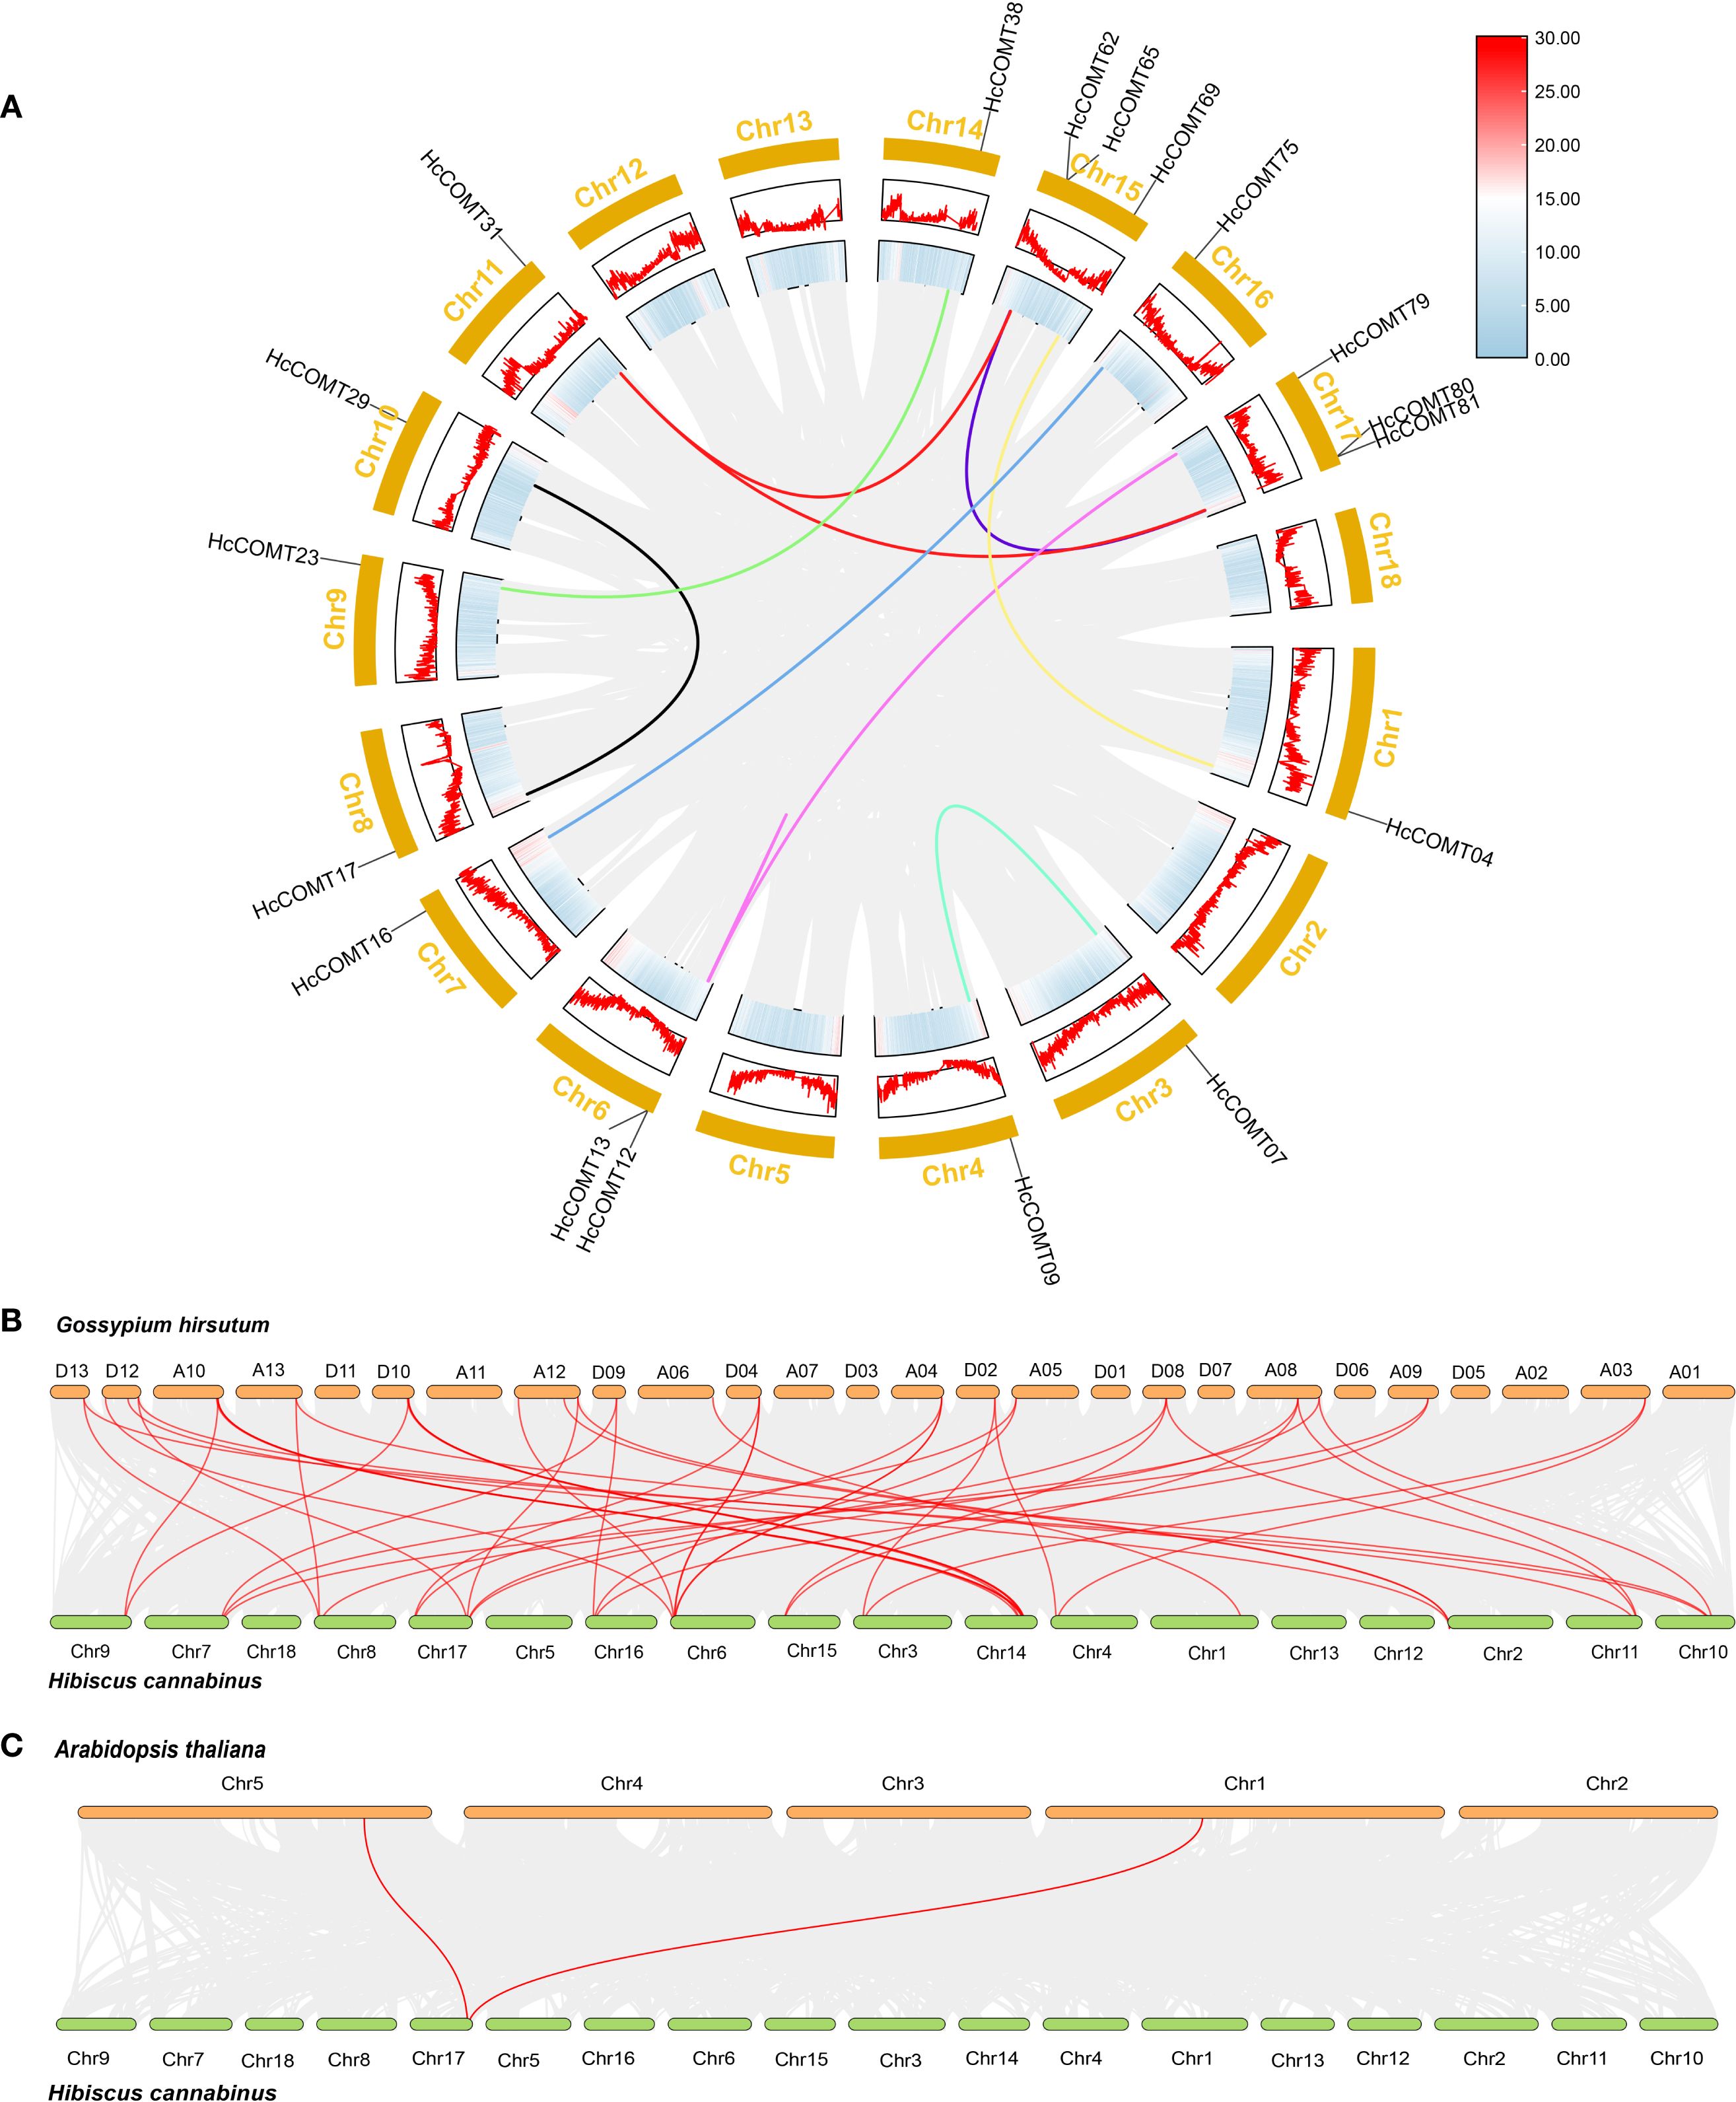
Figure 3. Synteny analysis of HcCOMT genes in intra- and inter- species. (A) Gene duplication of COMT genes in kenaf. The gray background lines represent all the syntenic blocks in kenaf genome, and the color lines represent the segmental or tandem duplication blocks among HcCOMT genes. (B–C) Multiple collinearity analysis of COMT genes among Arabidopsis, kenaf, and cotton genome. The red lines show the kenaf COMT genes orthologous in Arabidopsis and cotton, the gray lines show the collinear blocks background among these species genomes.
To gain further insight into the evolutionary relationships of HcCOMTs, we constructed interspecies comparative syntenic maps involving kenaf, Arabidopsis, and cotton. The results revealed that 2 orthologous pairs exhibited syntenic relationships between kenaf and Arabidopsis (HcCOMT81/AtCOMT15 and HcCOMT80/AtCOMT5) (Figure 3C, Supplementary Table S3). While 49 orthologous pairs (HcCOMT17/GhCOMT56, HcCOMT29/GhCOMT56, HcCOMT05/GhCOMT52, HcCOMT12/GhCOMT50, HcCOMT31/GhCOMT53, HcCOMT80/GhCOMT53, HcCOMT18/GhCOMT21, HcCOMT55/GhCOMT20, HcCOMT58/GhCOMT21, HcCOMT37/GhCOMT20, HcCOMT40/GhCOMT21, HcCOMT36/GhCOMT18, HcCOMT17/GhCOMT29, HcCOMT29/GhCOMT29, HcCOMT24/GhCOMT47, HcCOMT55/GhCOMT46, HcCOMT56/GhCOMT47, HcCOMT37/GhCOMT46, HcCOMT40/GhCOMT49, HcCOMT36/GhCOMT43, HcCOMT05/GhCOMT25, HcCOMT05/GhCOMT27, HcCOMT12/GhCOMT23, HcCOMT80/GhCOMT27, HcCOMT15/GhCOMT41, HcCOMT75/GhCOMT41, HcCOMT03/GhCOMT11, HcCOMT13/GhCOMT33, HcCOMT12/GhCOMT33, HcCOMT79/GhCOMT33, HcCOMT13/GhCOMT06, HcCOMT12/GhCOMT06, HcCOMT79/GhCOMT06, HcCOMT07/GhCOMT31, HcCOMT09/GhCOMT31, HcCOMT15/GhCOMT10, HcCOMT75/GhCOMT10, HcCOMT31/GhCOMT39, HcCOMT62/GhCOMT39, HcCOMT81/GhCOMT39, HcCOMT17/GhCOMT14, HcCOMT29/GhCOMT14, HcCOMT31/GhCOMT13, HcCOMT62/GhCOMT13, HcCOMT81/GhCOMT13, HcCOMT15/GhCOMT16, HcCOMT75/GhCOMT16, HcCOMT07/GhCOMT03, and HcCOMT09/GhCOMT03) between kenaf and cotton (Figure 3B, Supplementary Table S4). The extensive micro-synteny with G. hirsutum confirms the close evolutionary relationship within the Malvaceae and underscores the role of shared WGD events in shaping the COMT repertoire.
3.5 Cis-regulatory elements prediction of the kenaf COMT genes
To explore the transcriptional regulation of the HcCOMT members, the 2-kb region upstream of each translation start codon was scanned with PlantCARE. In total, 81 promoters harbored various enriched elements that could be assigned to four functional categories: (i) plant growth and development elements, (ii) light response elements, (iii) abiotic and biotic stress response elements, and (iv) plant hormone response elements (Figure 4).
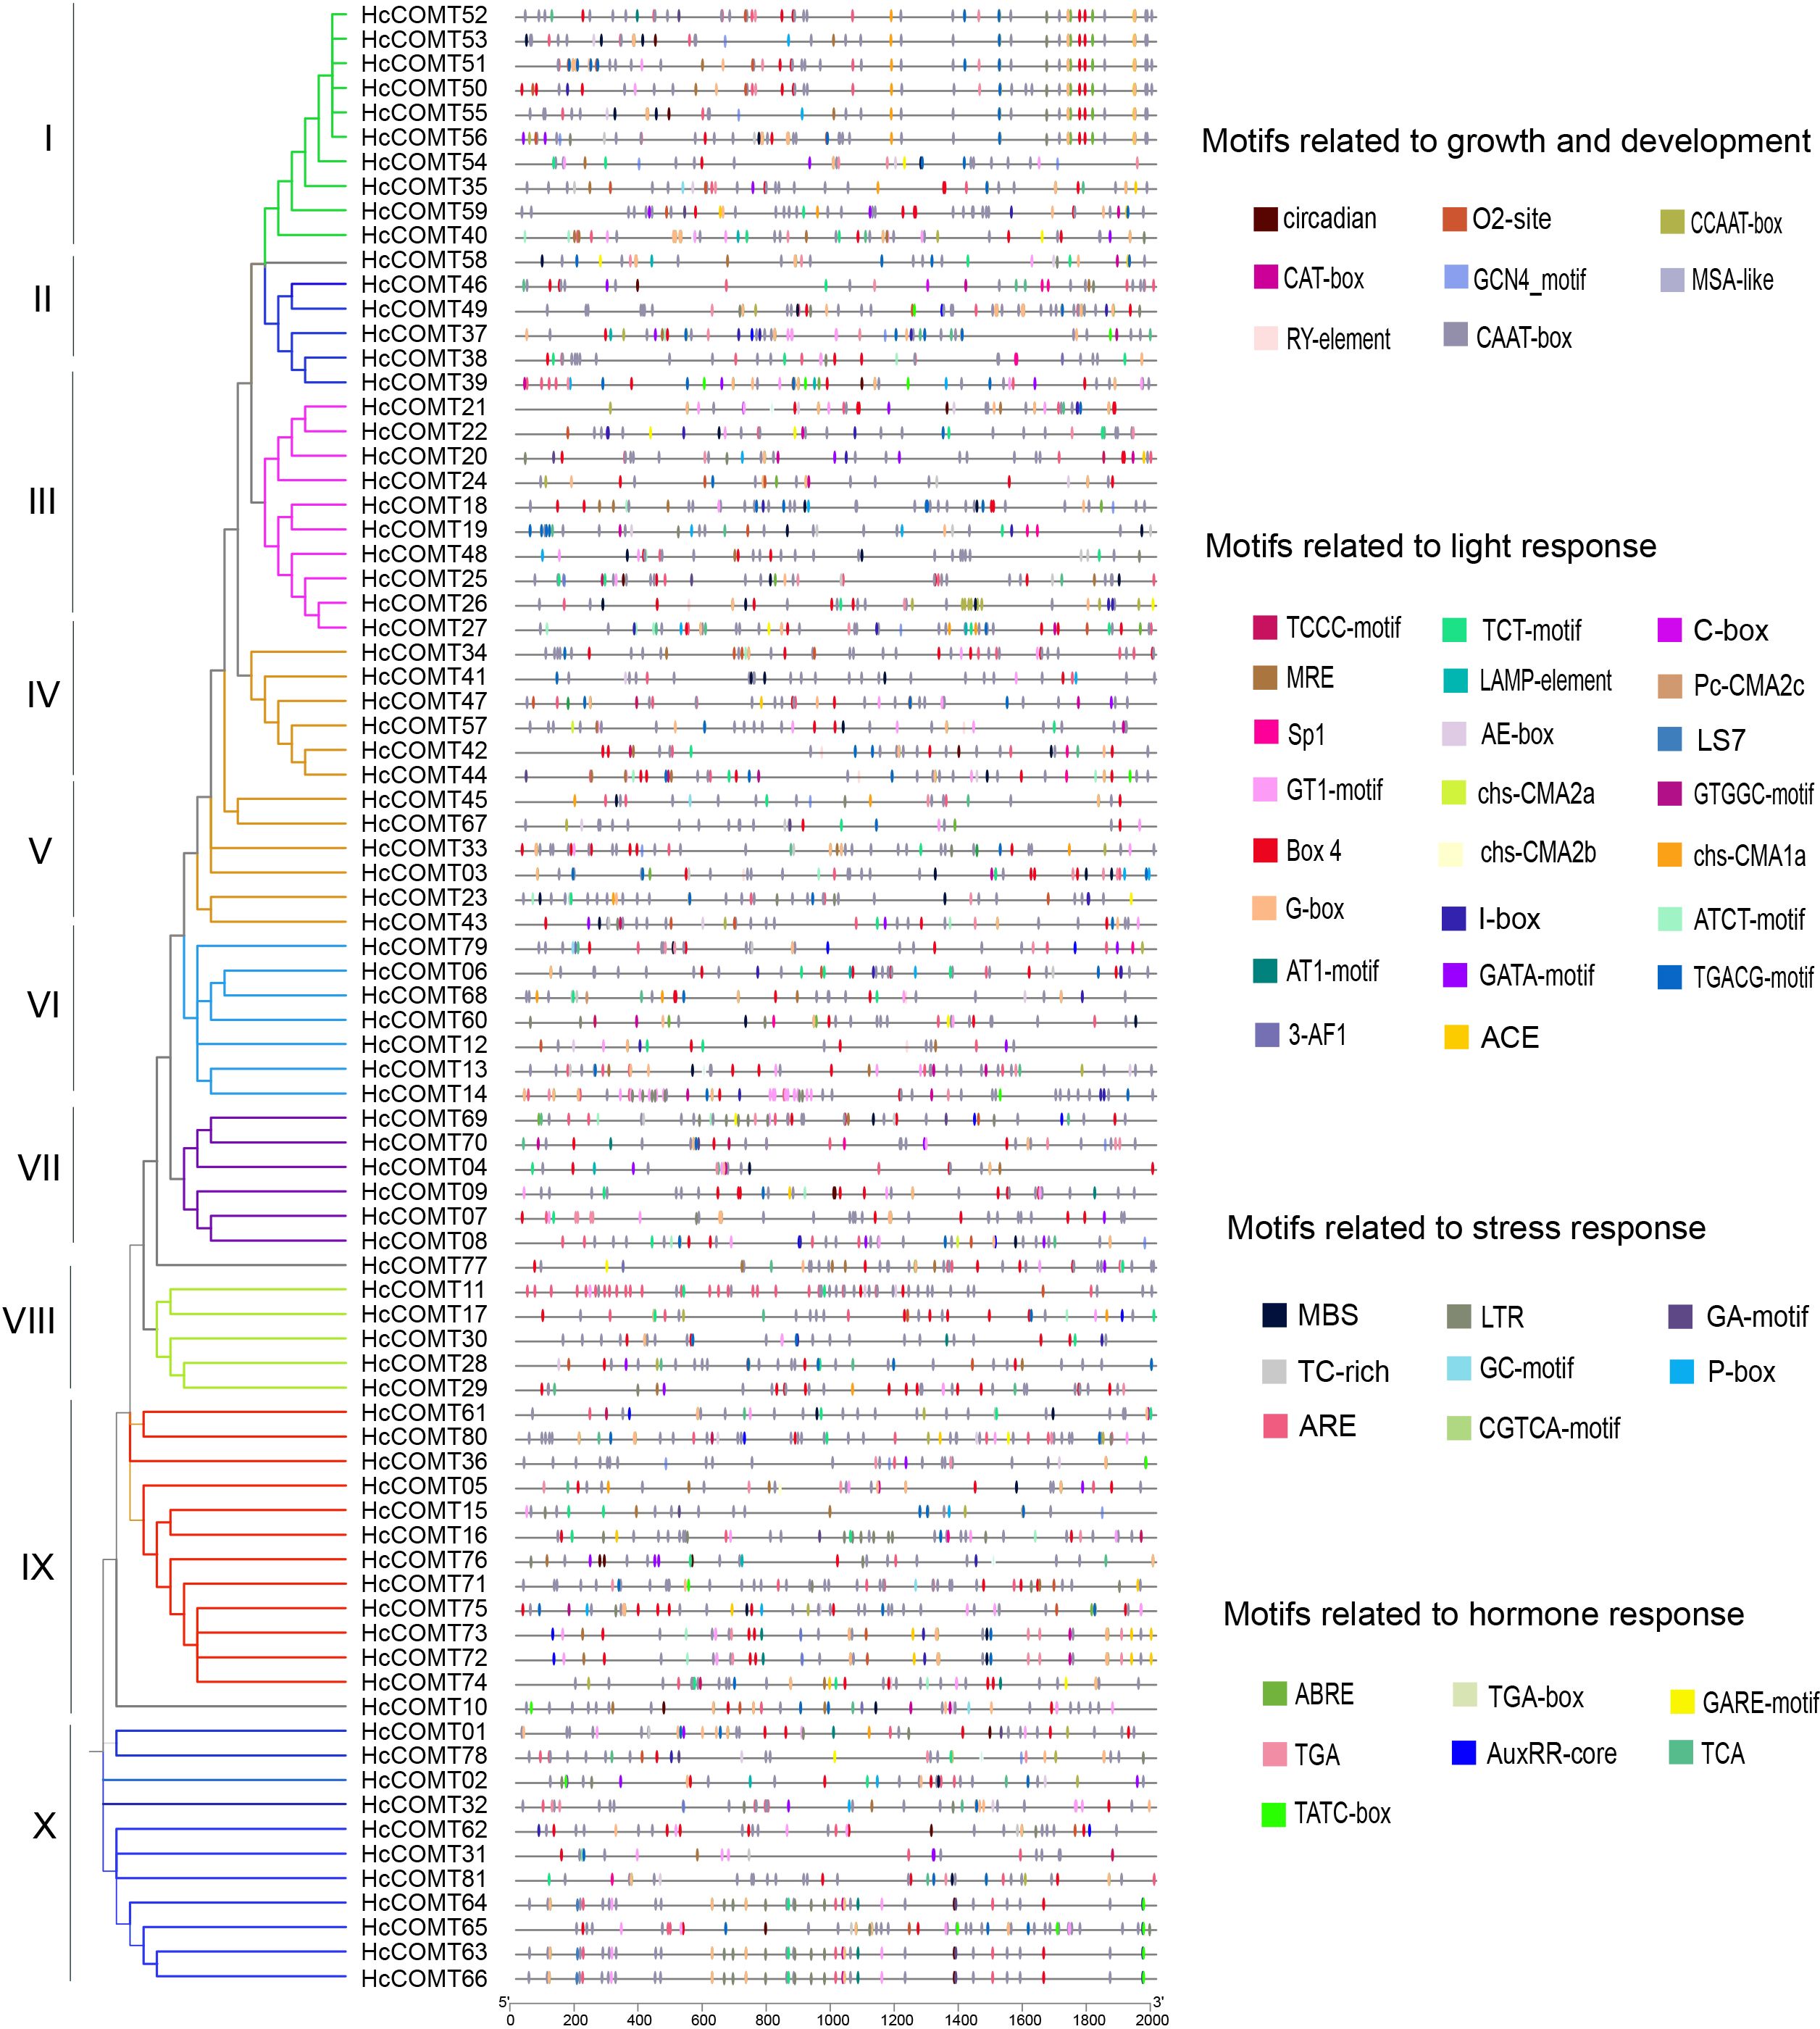
Figure 4. Cis-elements in promoters for HcCOMT genes. A total of 4 classes cis-elements related growth and development, light response, stress response and hormone response were found in the 2000 bp upstream promoters of HcCOMT genes. The different colors indicate different cis-acting elements.
Light-responsive elements including Box4, G-box, GT1-motif, MRE and ACE, were the most abundant class, present in every HcCOMT gene promoter and suggesting ubiquitous light regulation. Hormone-responsive elements were also widespread: ABRE (abscisic acid), AuxRE (auxin), GARE (gibberellin) and TCA/SA-responsive elements (salicylic acid) were identified in HcCOMT78, HcCOMT65, HcCOMT59 and HcCOMT71 promoters, respectively. Notably, HcCOMT03 contained six ABRE elements, whereas HcCOMT05 carried seven TCA elements, implying their potential roles in ABA- and SA-mediated stress responses. Stress-related elements such as MBS (MYB-binding site, drought-inducible), LTR (low-temperature responsive) and TC-rich repeats (defence and stress) were enriched in 61 promoters. Development-associated elements (CAAT-box, CAT-box, CCAAT-box, O2-site and GCN4-motif) were particularly prominent in HcCOMT19, which harbored five distinct growth-related elements (Figure 4). Collectively, the diversity and multiplicity of these cis-elements indicate that HcCOMT genes are subject to combinatorial control by light, hormonal and environmental cues.
3.6 GO functional enrichment analysis of the HcCOMT genes
To further elucidate the biological functions of the HcCOMT gene family, we conducted Gene Ontology (GO) enrichment analysis of the 81 HcCOMT genes. As shown in Figure 5, the members of the COMT family of kenaf are mainly enriched in the biosynthetic process, cellular process, and transferase activity processes. Within the “biological processes” ontology, “lignin biosynthetic process” (GO:0009808), “flavanol biosynthetic process” (GO:0051555) and “methylation process” (GO:0032259) were the most enriched terms. Cellular component analysis placed the majority of proteins in the cytoplasm (GO:000537) and cytosol activity (GO:0005829). Under “molecular function”, caffeate O-methyltransferase activity (GO:0047761), O-methyltransferase activity (GO:0008171), protein dimerization activity (GO:0046983), and general methyltransferase activity (GO:0008168) were significantly enriched, consistent with the catalytic and oligomeric properties of COMT enzymes.
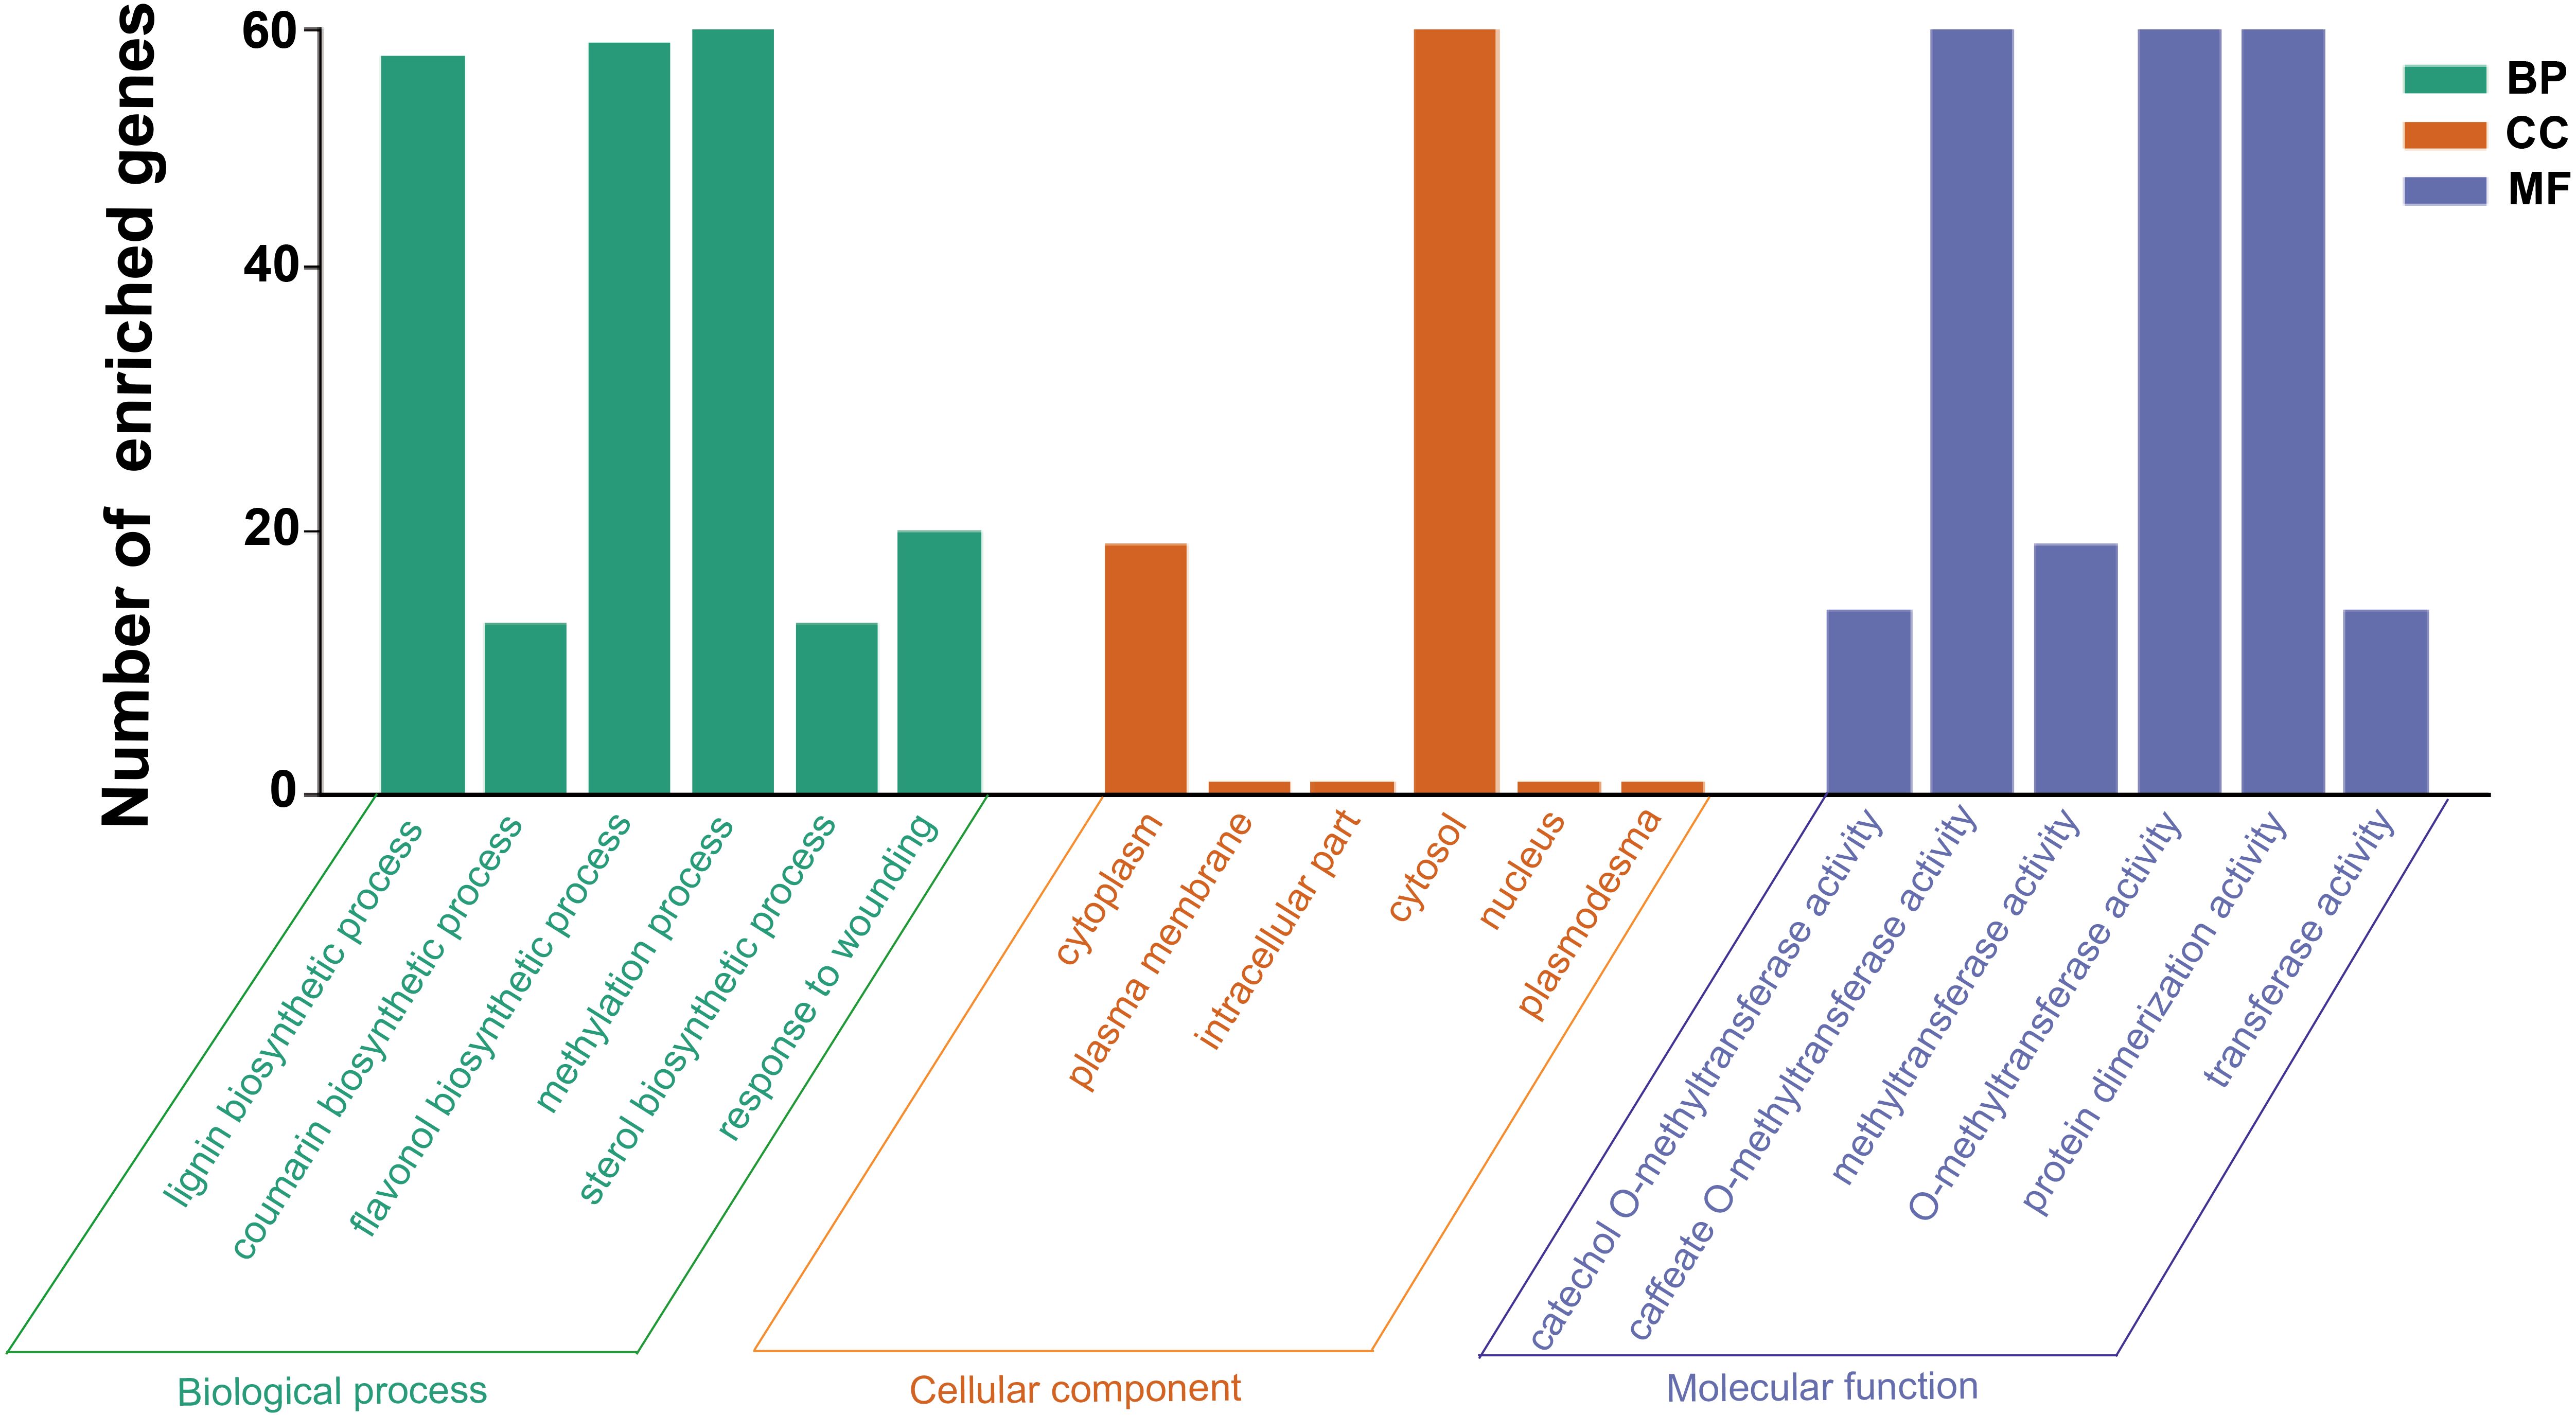
Figure 5. The potential function enrichment analysis of HcCOMT genes in kenaf.
3.7 Structural divergence of salt-responsive HcCOMT proteins
Six HcCOMT genes (HcCOMT11, HcCOMT12, HcCOMT13, HcCOMT17, HcCOMT28 and HcCOMT29) that exhibited significant transcriptional modulation under salinity stress were selected for structural modeling. High-quality 3-D models (GMQE ≥ 0.75; QMEAN ≥ -1.5) were generated with SWISS-MODEL platform. Spatial superposition revealed marked conformational divergence among the proteins (Figure 6A). HcCOMT12, HcCOMT13, HcCOMT28, and HcCOMT29 proteins adopted distinct folds, whereas HcCOMT11 and HcCOMT17 proteins displayed nearly identical architectures, suggesting that the latter pair may represent functionally redundant isoforms (Figure 6A).
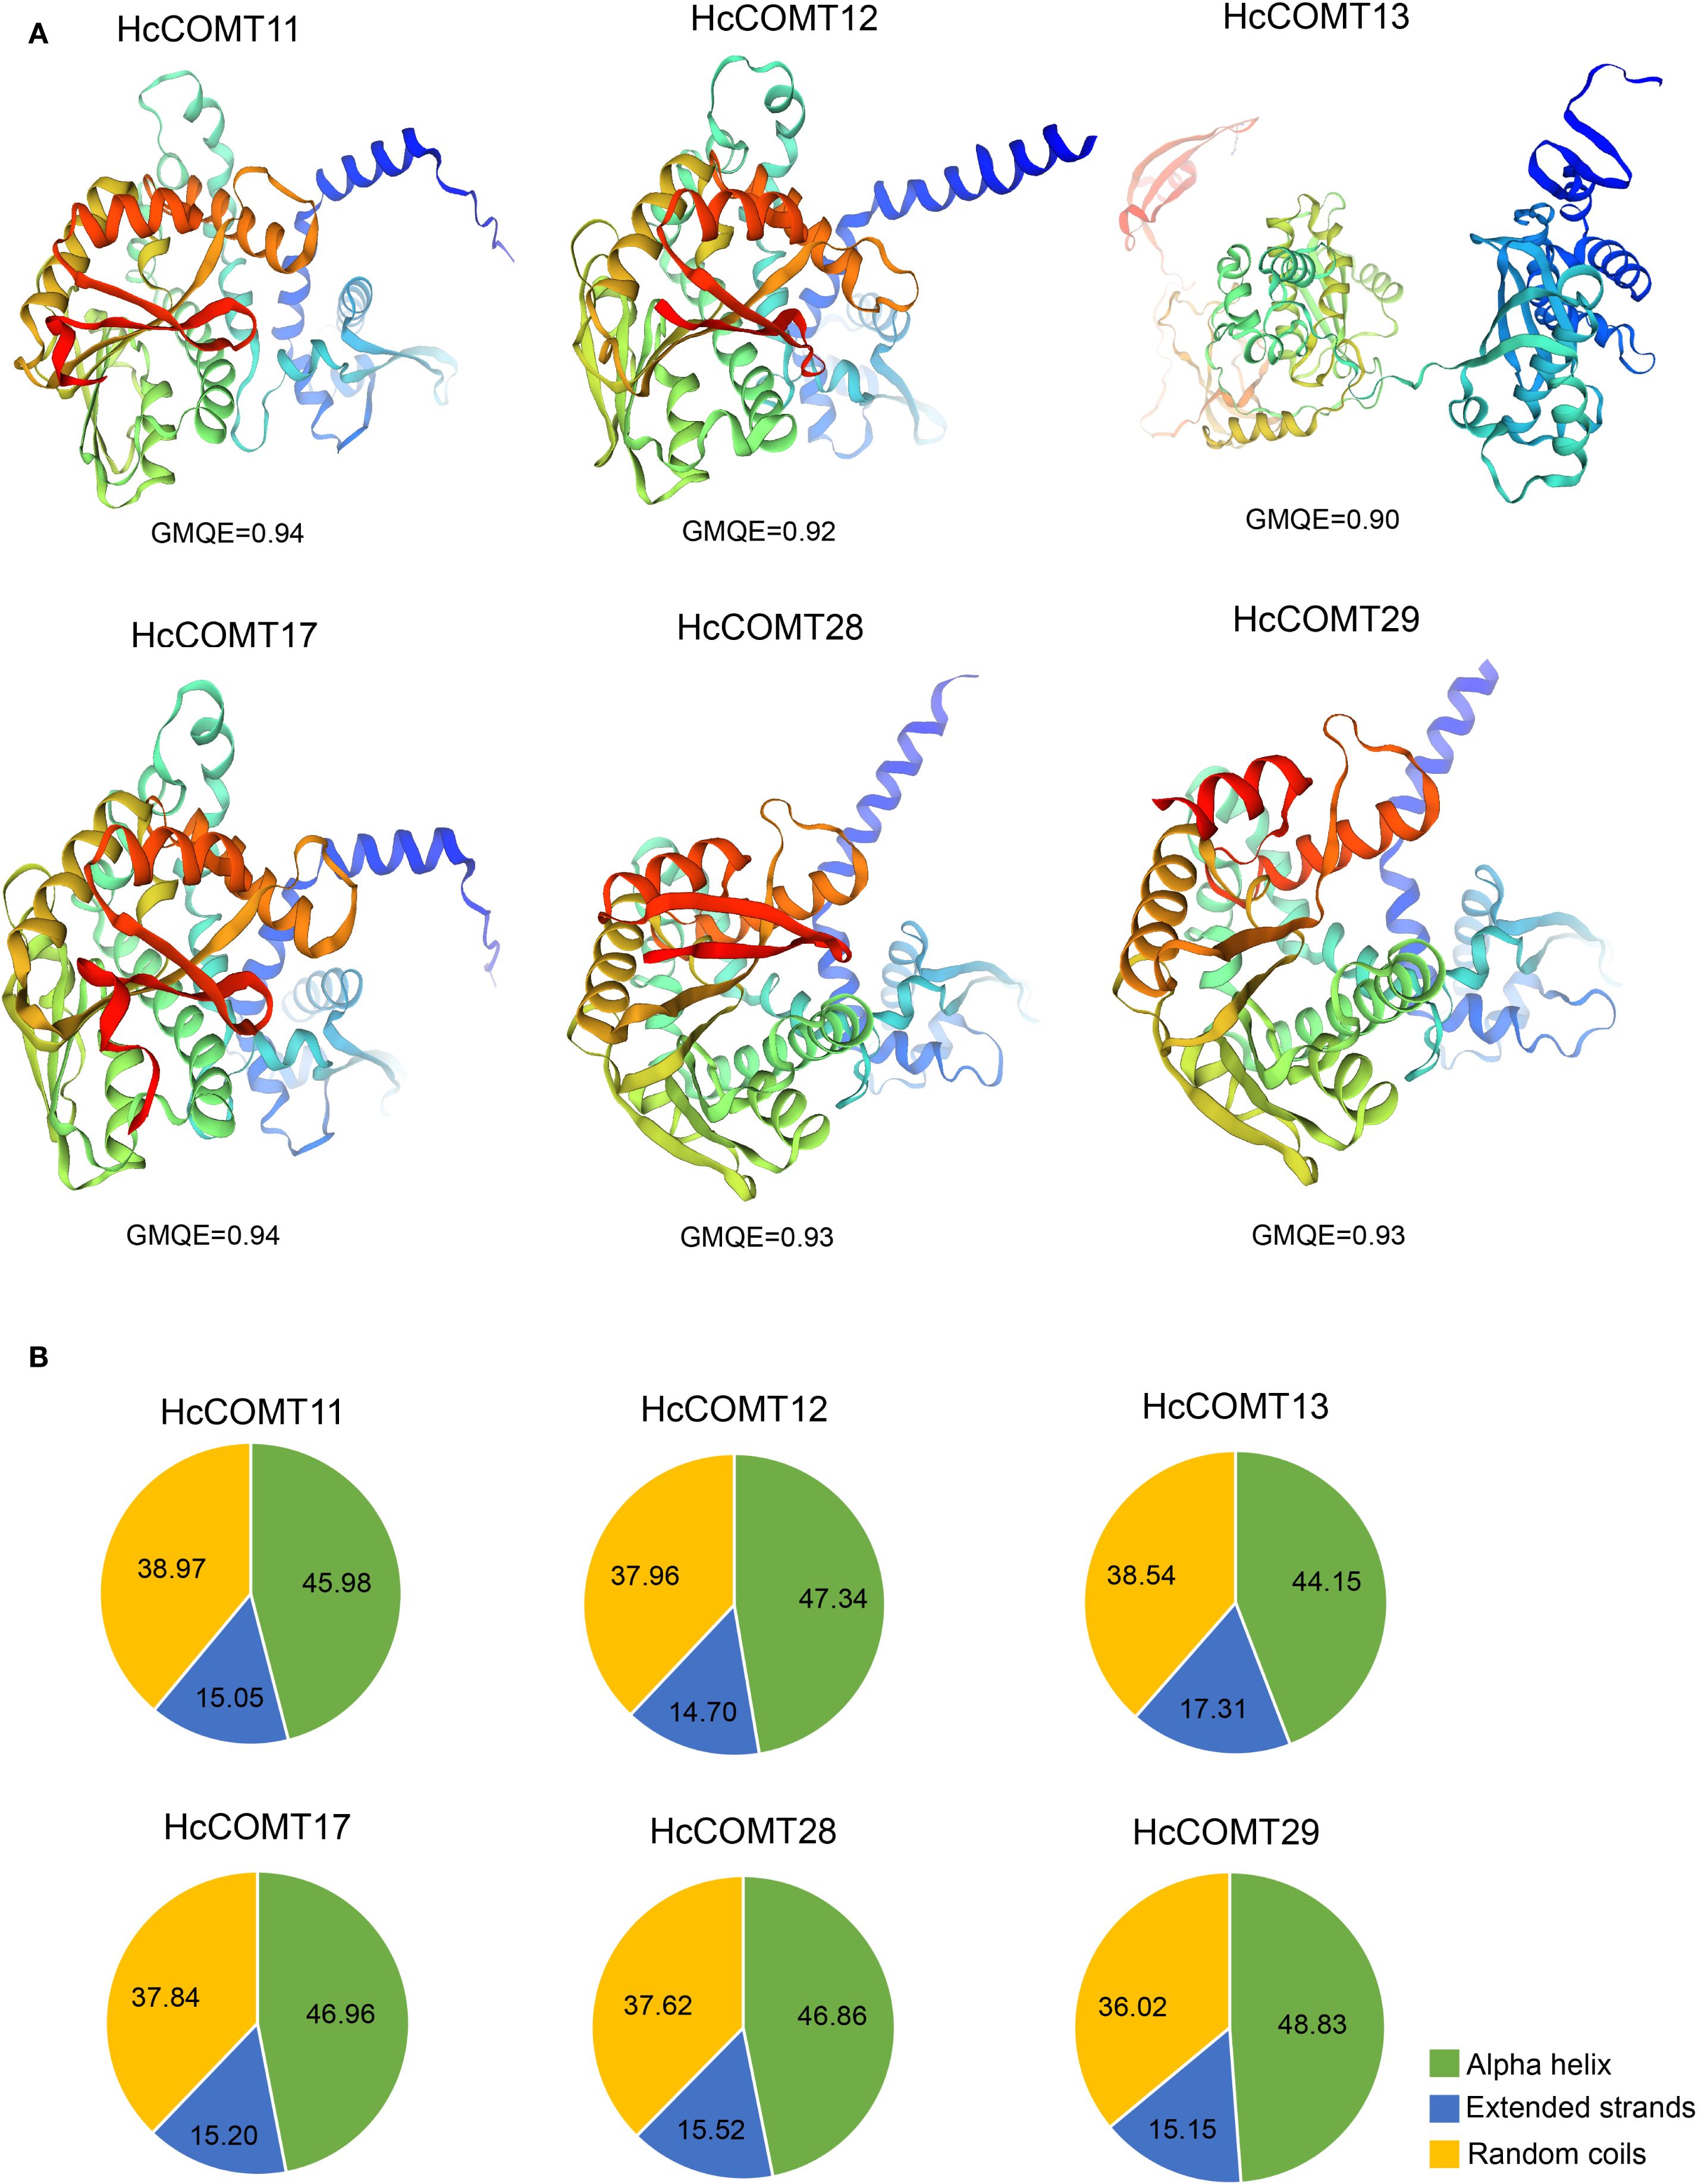
Figure 6. Secondary structure prediction of HcCOMT proteins. (A) 3-D modelling of the secondary structure in each group of six HcCOMT proteins. (B) Average ratios of alpha helix, extended strand, and random coil structures of six HcCOMT proteins in each cluster.
The 3D structural diversity is mainly relied on their secondary structure composition. To explore their structural diversity, we conducted a secondary structure prediction analysis for these proteins. The results revealed that six HcCOMT proteins are dominated by alpha helices (44.15% - 48.83%), followed by random coils (36.02% - 38.97%), and extended strands (14.70% - 17.31%) (Figure 6B). On average, alpha helices constitute 46.69% of the residues, whereas extended strands contribute only 15.49% (Figure 6B). The high alpha helical content corresponds to the N-terminal dimerization domain, whereas the catalytic methyltransf-2 domain is embedded within mixed α/β regions, consistent with the canonical fold of plant O-methyltransferases. The observed structural variability may underpin differential substrate specificity or interaction networks under salt stress.
3.8 Protein-protein interaction landscape of salt-responsive HcCOMT proteins
To contextualize the functional roles of the six salt-responsive HcCOMT proteins, we interrogated their orthologous in Gossypium hirsutum using the STRING protein interaction Database. A confidence score threshold of 0.9 was applied to ensure reliable protein-protein interaction predictions. The resulting network resolved into two densely connected modules that converge on lignin biosynthesis and oxidative stress mitigation (Figure 7A, Supplementary Table S5). Module 1 is associated with lignin polymerization hub. For example, HcCOMT17 and HcCOMT29 (their orthologous in cotton) directly interact with five class III peroxidase 10 (LOC107945128), 24 (LOC107896146), 27 (LOC107915919), 29 (LOC107958290), and 31 (LOC107921888), which is involved in the final oxidative coupling of monolignols, and with four UDP-glycosyltransferase of the 72E clade (LOC107909375, LOC107942297, LOC107920494, and LOC107942298), which convert cinnamoyl-CoA esters to cinnamaldehydes. Together, these enzymes constitute a contiguous metabolic channel that links O-methylation to cell-wall lignification. Module 2 is involved into the phenylpropanoid branch-point and antioxidant coupling. HcCOMT29 forms reciprocal interactions with caffeic acid 3-O-methyltransferase (LOC107915880 and LOC107895907) and anthocyanidin 3-O-glucosyltransferase 5 (UFGT5) (LOC107927767, LOC107945668, LOC107944089, and LOC107926612). The former regulates the methylation of lignin precursors, whereas the latter diverts phenylpropanoid flux towards anthocyanin biosynthesis, thereby modulating both lignin quantity and antioxidant capacity. Importantly, the peroxidase cluster also interfaces with hydrogen peroxide detoxification pathways, providing direct crosstalk between lignin synthesis and oxidative stress signaling.
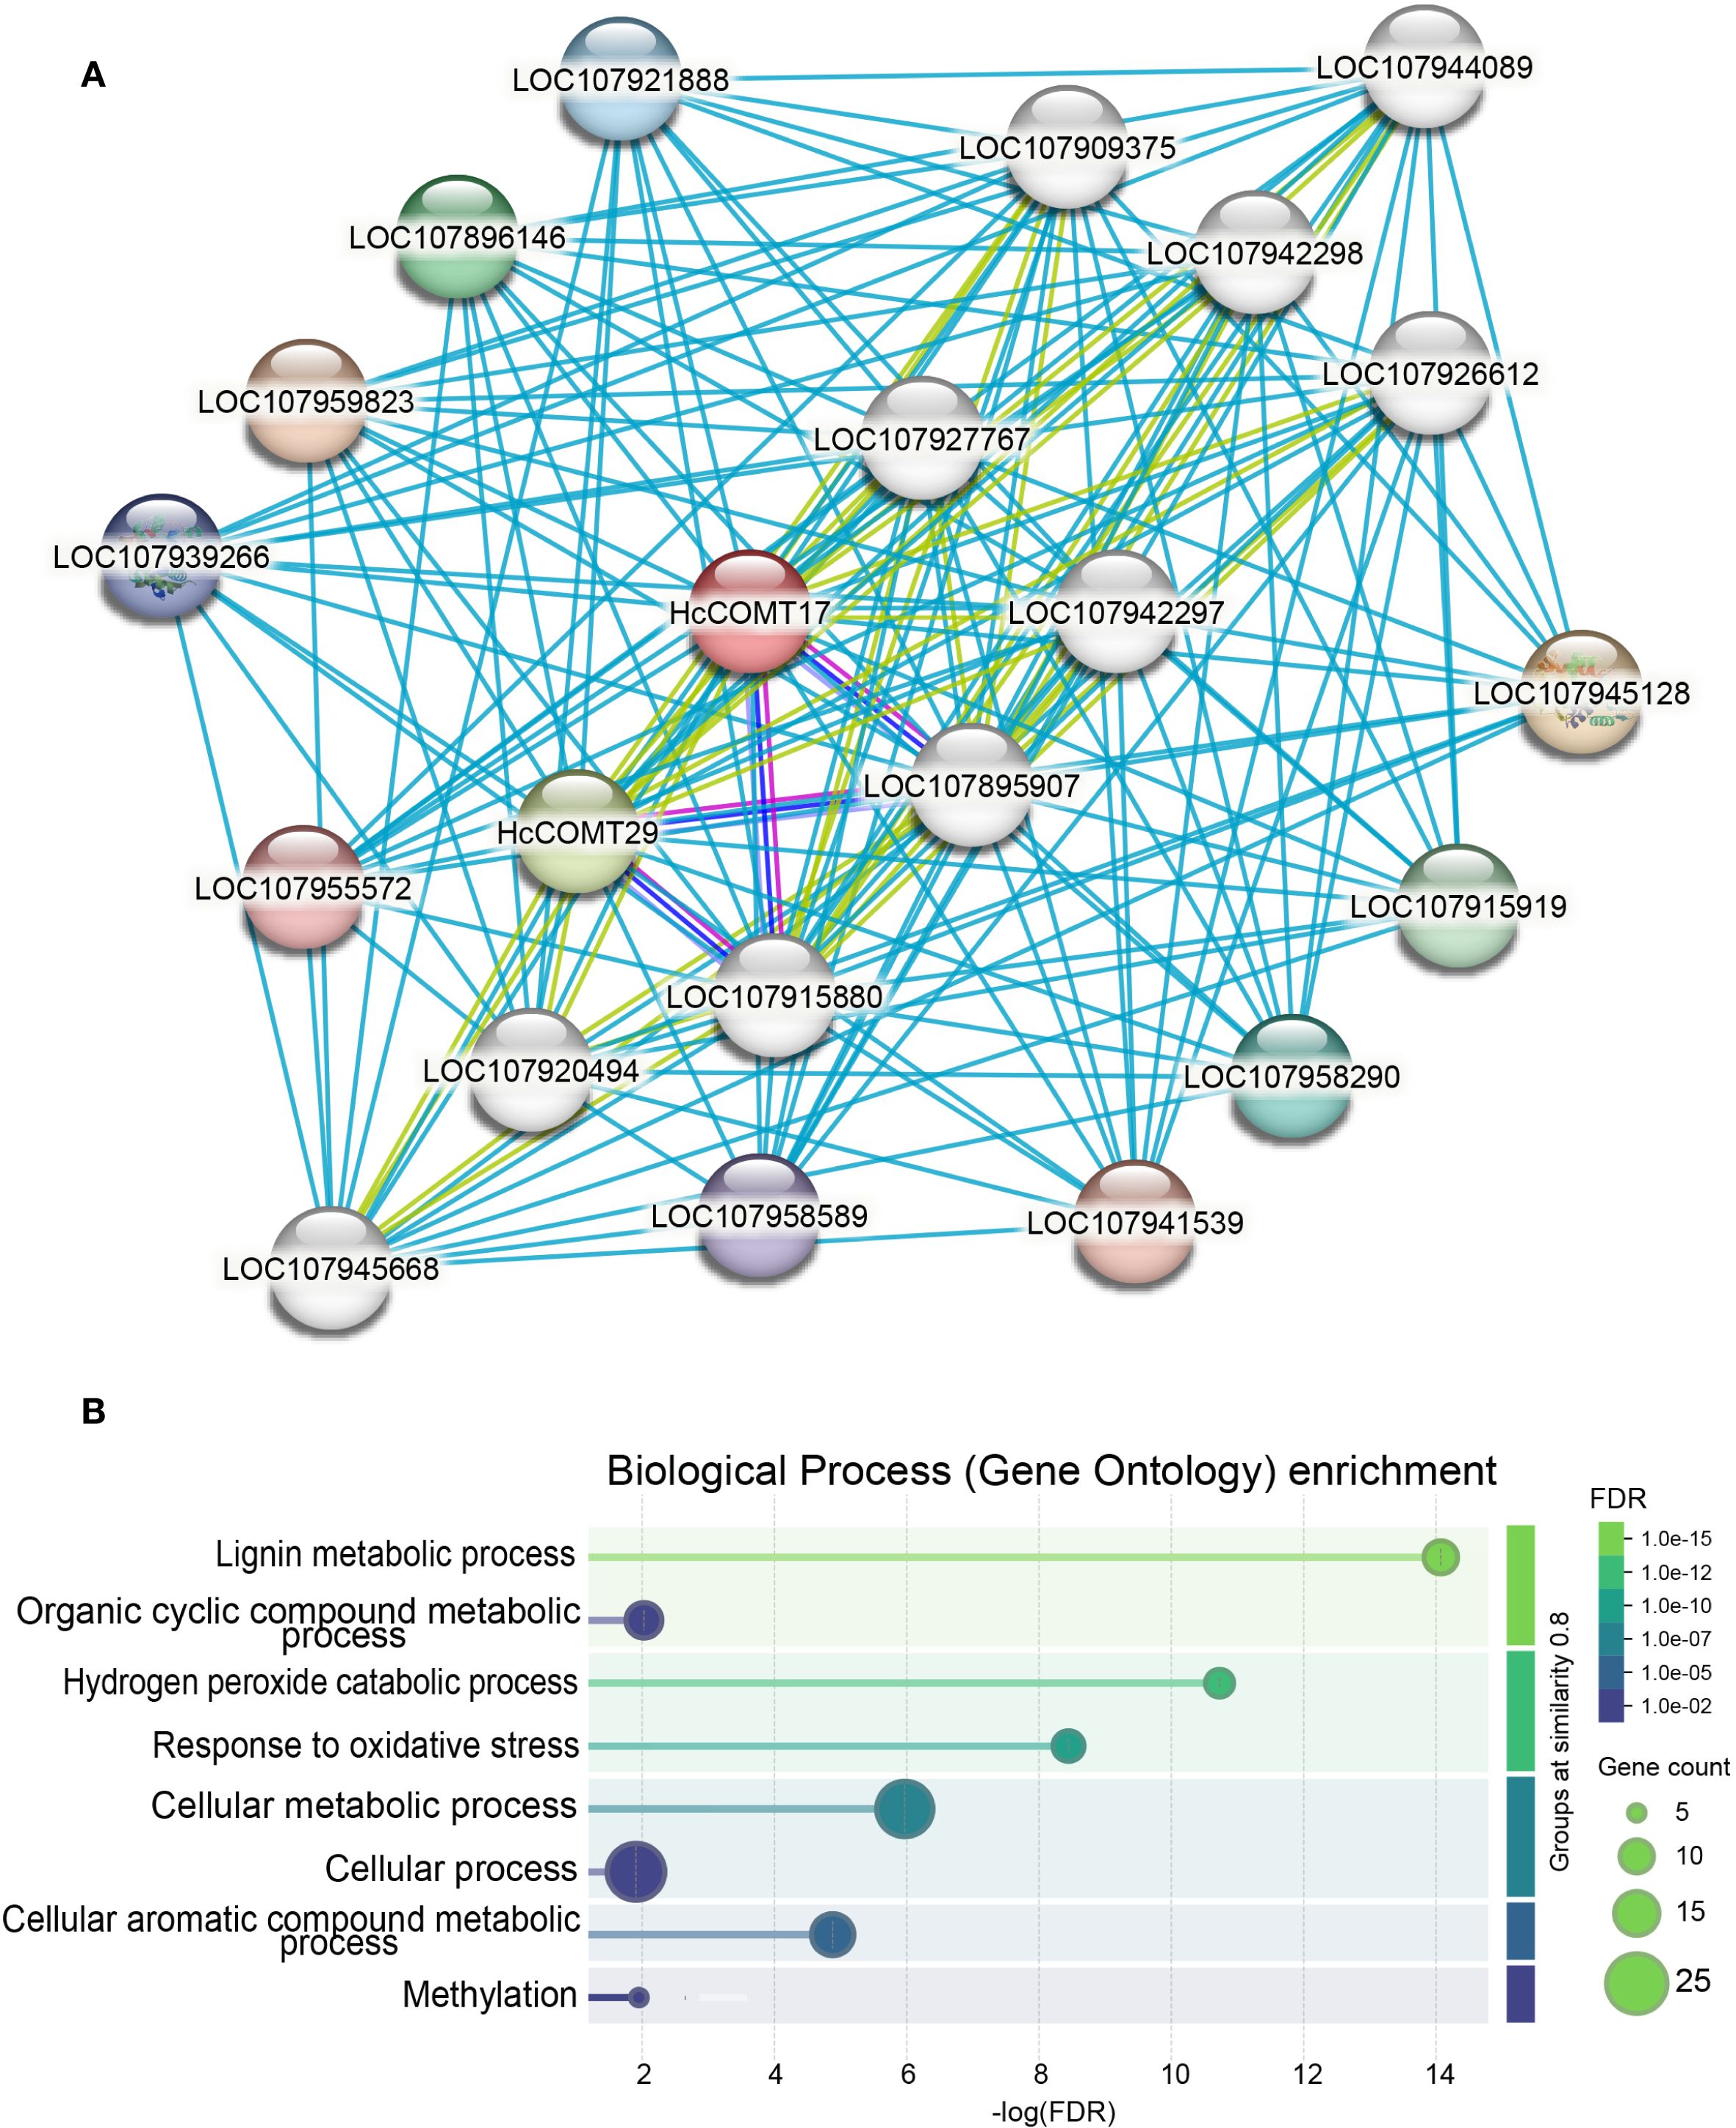
Figure 7. Co-expression and functional prediction analysis of six HcCOMT proteins. (A) Co-expression network of HcCOMTs. The correlation coefficients are shown with different colours in node genes. Light gray lines indicate the interaction links between node HcCOMTs and other genes. (B) GO enrichment analysis of co-expressed HcCOMT genes.
To further elucidate the biological process of those interaction proteins, we conducted GO enrichment analysis of these interacting proteins. As shown in Figure 7B, GO enrichment confirmed that the network is significantly enriched for “lignin metabolic process”, “hydrogen peroxide catabolic process”, and “response to oxidative stress processes” (Figure 7B). Collectively, these data position the HcCOMT17 and HcCOMT29 proteins at a metabolic nexus that integrates lignin deposition with redox homeostasis under salt stress.
3.9 Spatial and temporal expression pattern of HcCOMT genes under salt stress
Firstly, transcript abundance of six candidate HcCOMT genes was surveyed in root, stem and leaf tissues of the salt-tolerant cultivar Fuhong18 and the salt-sensitive cultivar Zanyin1 under control conditions. As depicted in Figure 8, the transcription abundance of these HcCOMT genes varied across the different tissue samples. HcCOMT11 and HcCOMT12 were predominantly expressed in roots (Figures 8A, B), whereas HcCOMT13 and HcCOMT17 accumulated to the highest levels in both roots and stems (Figure 8C, D). In contrast, HcCOMT28 and HcCOMT29 exhibited leaf-restricted expression (Figures 8E, F). Notably, HcCOMT11 and HcCOMT12 displayed nearly identical organ-specific patterns, which may suggest possible redundancy or co-regulation.
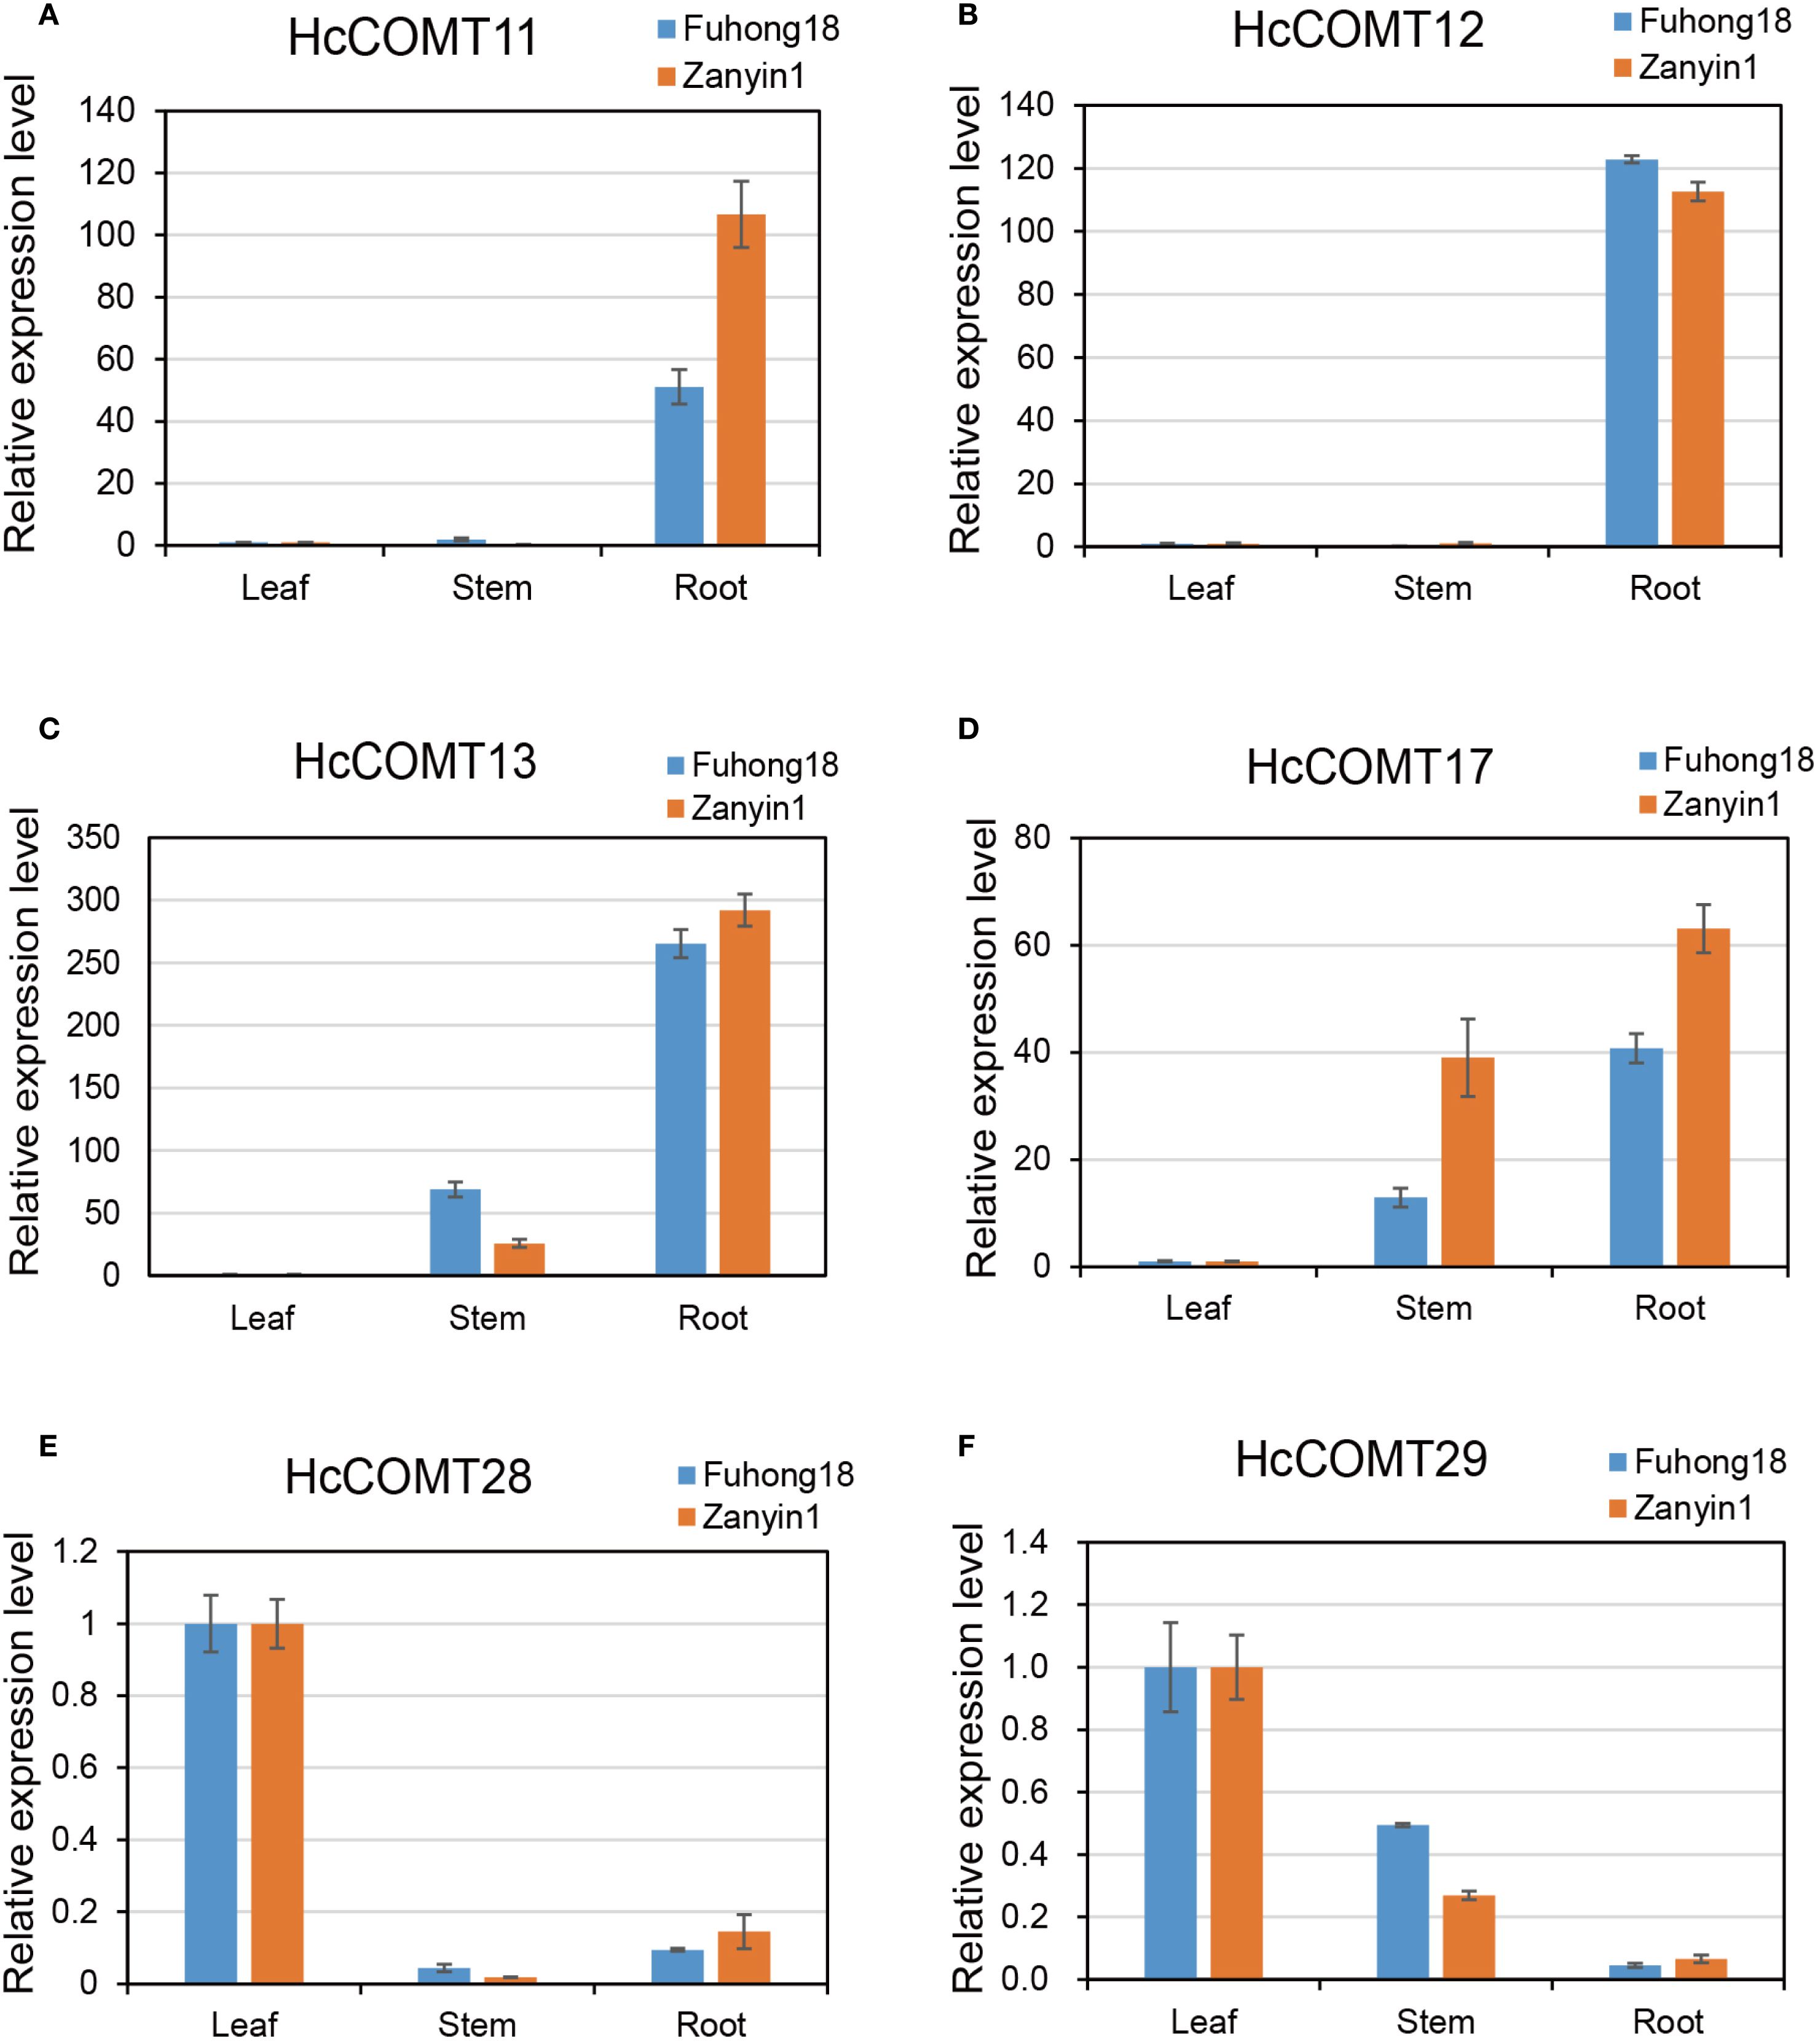
Figure 8. Expression profiles for HcCOMT genes in different tissues. The expression profiles of six represented HcCOMT genes across root stem and leaf in kenaf: HcCOMT11 (A), HcCOMT12 (B), HcCOMT13 (C), HcCOMT17 (D), HcCOMT28 (E) and HcCOMT29 (F) based on the qRT-PCR analysis.
Then, quantitative RT-PCR was used to monitor the temporal response of the six HcCOMT genes to 200 mM NaCl over 21 days. Data are presented as fold change relative to the 0-day control for each tissue and cultivar (Figure 9). For HcCOMT11 gene in salt-sensitive cultivar Zanyin1, maximal induction in stems at 14 d (48-fold), moderate accumulation in leaves, and negligible expression in roots (Figure 9A); while in salt-tolerant cultivar Fuhong18, HcCOMT11 was upregulated strongly in the leaves (32-fold at 14 d), with transcripts almost undetectable in roots and stems. For HcCOMT12 gene in cultivar Fuhong18, sustained high expression across all organs, and in cultivar Zanyin1, HcCOMT12 gene was transient root-specific peak at 14 d (12-fold), followed by smaller increased in leaves and stems at 7 d (Figure 7B). For HcCOMT13 gene, both cultivars exhibited highest transcript levels in leaves at 7 d and 14 d. In Fuhong18, the expression further increased in stems and roots at 21 d, indicating a coordinated systemic response where absent in Zanyin1 (Figure 9C). HcCOMT17 displayed significantly down-regulation relative to controls in the leaves of both cultivars (p < 0.01). Zanyin1 showed transient stem induction at 7 d and a root-specific peak at 14 d, whereas Fuhong18 exhibited delayed root activation at 21 d (Figure 9D). HcCOMT28 showed a progressive up-regulation in stems of both cultivars, and peaking at 14 d (25-fold in stem of Fuhong18, 32-fold in Zanyin1). Fuhong18 additionally displayed leaf induction at 14 d (6-fold) and root repression after 7 days treatments (Figure 9E). HcCOMT29 exhibited continuous down-regulation in the leaves and stems of both cultivars. In Zanyin1, a transient increase was observed in stems and roots at 7 d (3.8-fold and 4.2-fold, respectively), whereas Fuhong18 maintained low and stable levels (Figure 9F).
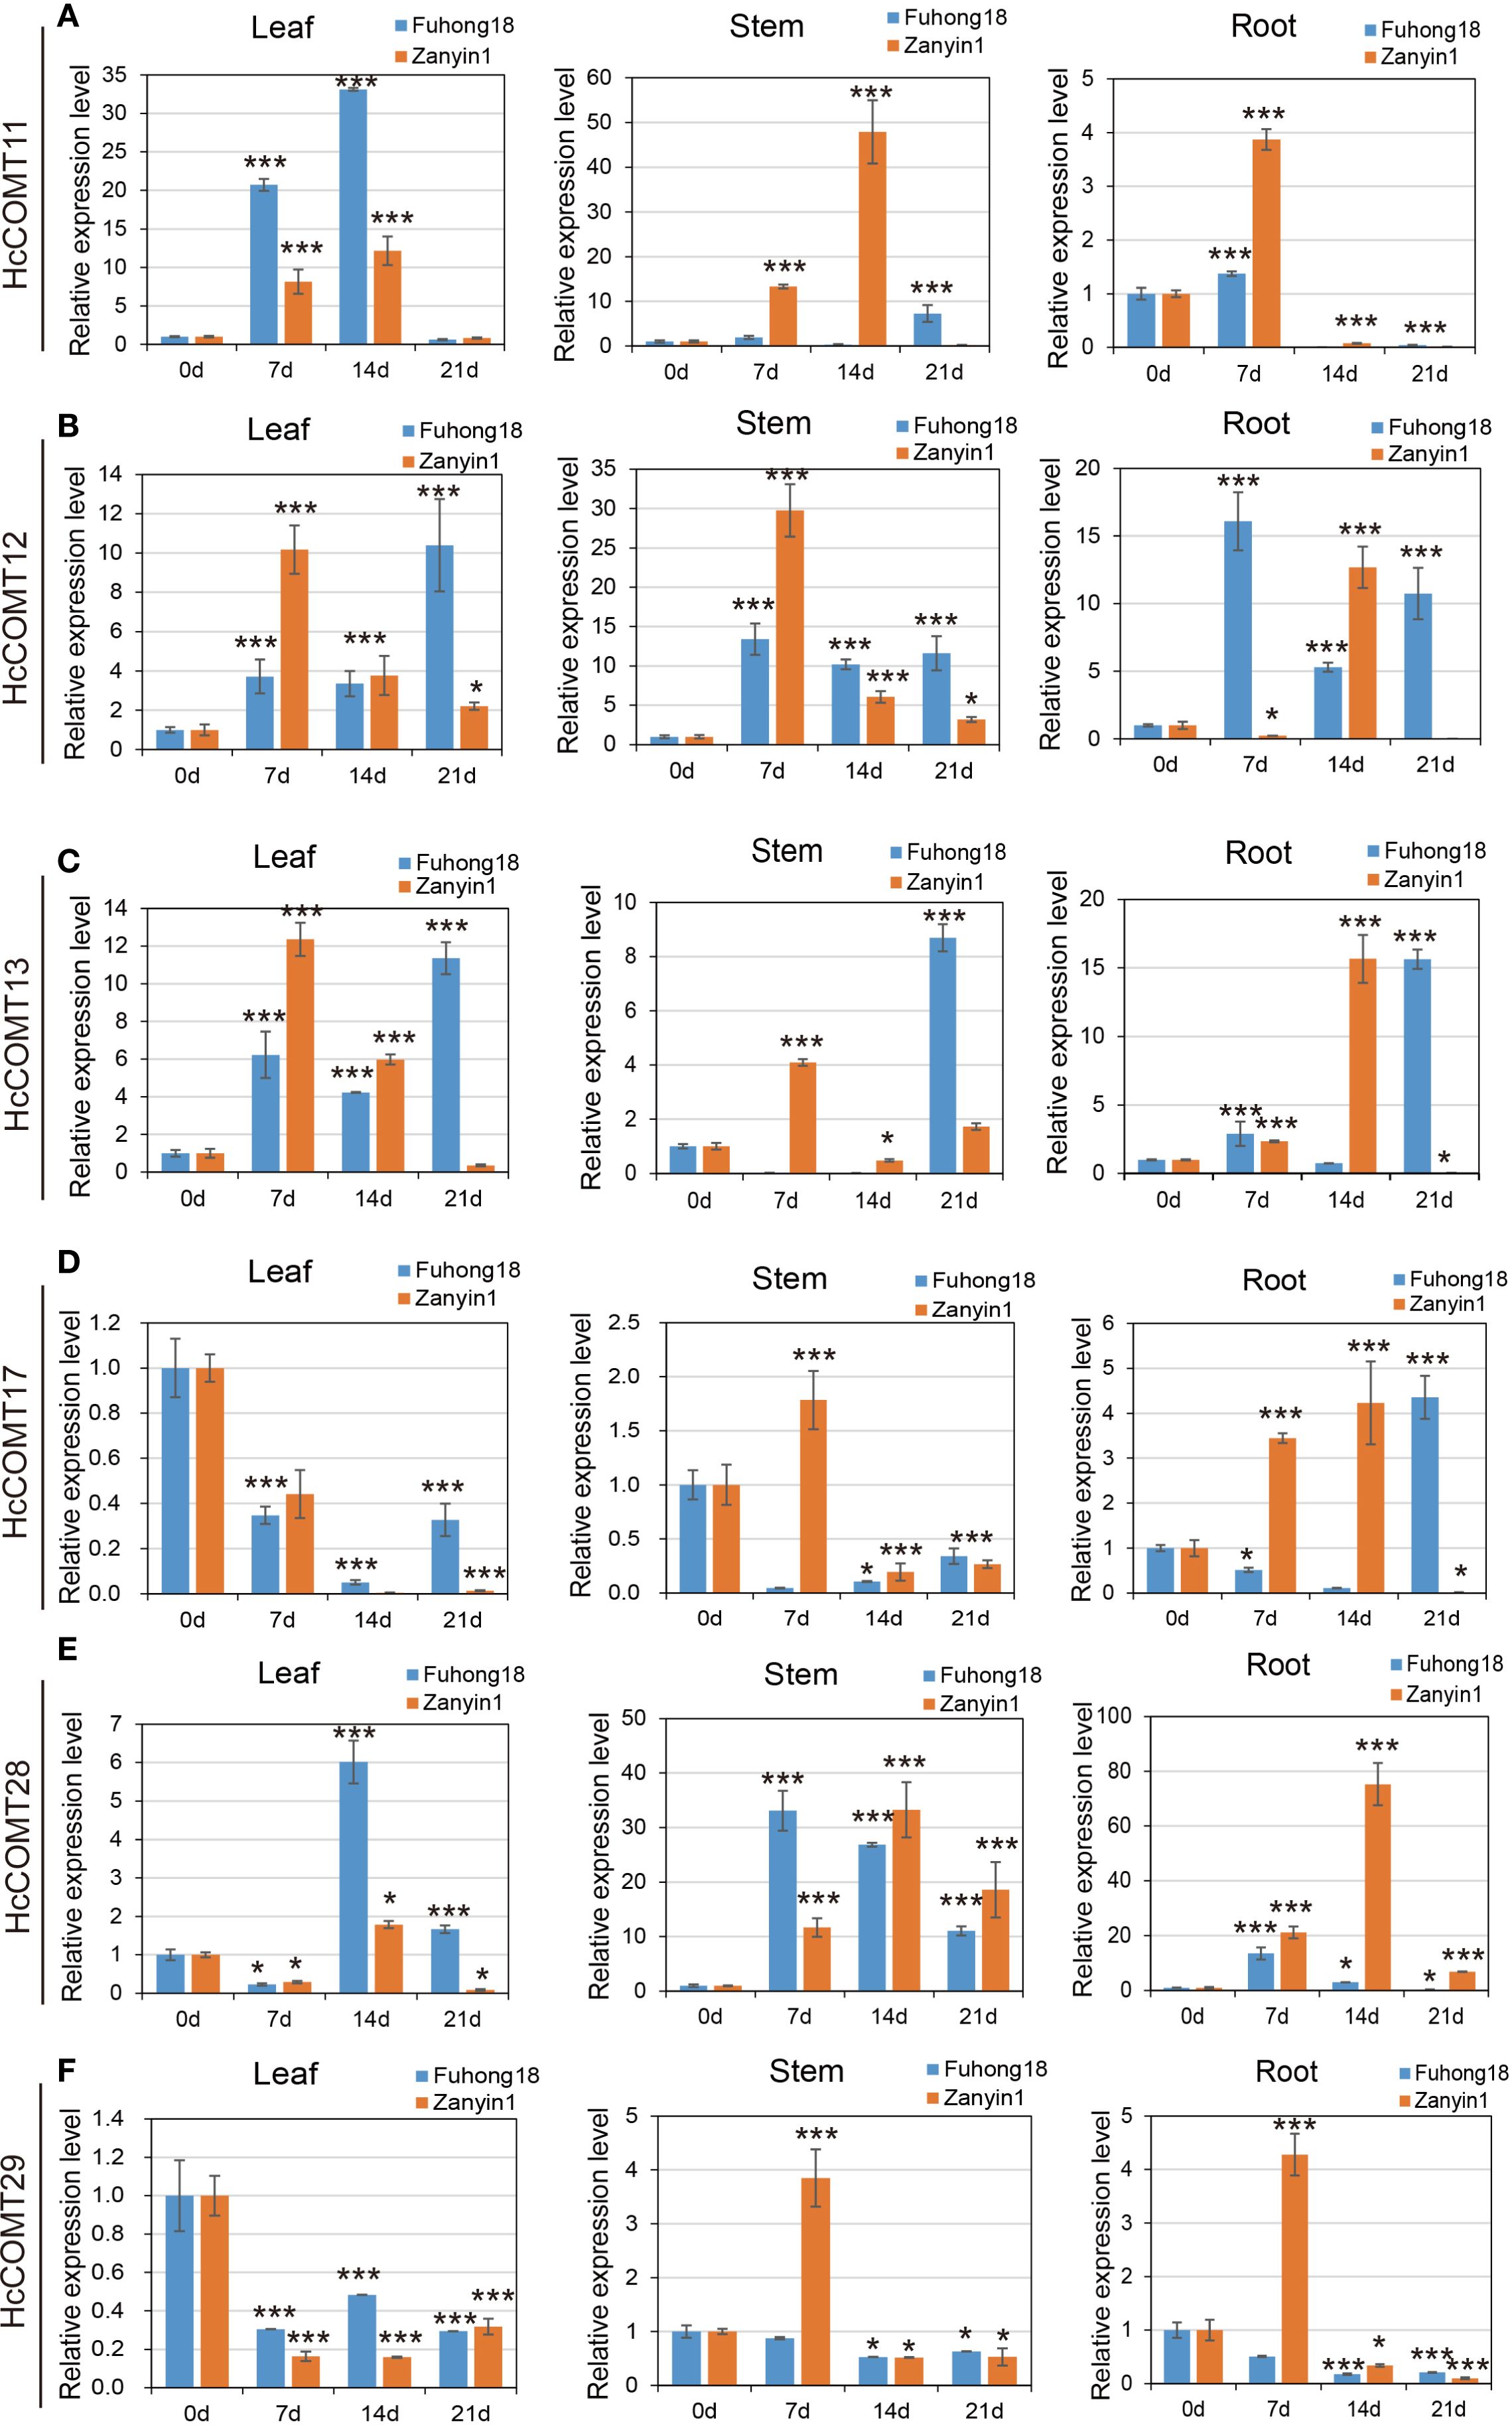
Figure 9. Relative expression level of HcCOMT genes, HcCOMT11 (A), HcCOMT12 (B), HcCOMT13 (C), HcCOMT17 (D), HcCOMT28 (E), and HcCOMT29 (F), in different tissues of kenaf under salinity stress conditions. Plants with regular water were assigned as control group. The relative gene expression levels were normalized against the internal reference gene (PP2A). Data represent the mean ± standard error of three independent biological replicates, each with three technical replicates. Statistical significance was determined using one-way ANOVA followed by Tukey’s HSD test. * and *** above the bars indicate differences between treatments at p ≤ 0.05 and p ≤ 0.01, respectively.
Collectively, the six HcCOMT genes exhibit cultivar-and tissues-specific transcriptional programmers that align with their predicted physiological roles: root/stem isoforms (HcCOMT11, HcCOMT12, HcCOMT13, and HcCOMT17) are preferentially induced in the tolerant cultivar, whereas leaf-specific members (HcCOMT28 and HcCOMT29) are repressed, reflecting a lignin deposition strategy that may contribute to the superior salt tolerance of Fuhong18.
4 Discussion
The secondary cell wall acts as a front-line barrier against both biotic and abiotic stresses, and lignin is one of its most critical hydrophobic constituents. By stiffening the wall and limiting apoplastic water movement, COMT regulates the syringyl-to-guaiacyl (S/G) ratio in lignin, a determinant of both cell wall rigidity and adaptability under abiotic stress (Vanholme et al., 2010; Lv et al., 2011; Oraby and Ramadan, 2014; Tuskan et al., 2019). This dual role makes COMT an attractive breeding target for enhancing salt tolerance and improving fiber quality simultaneously. In saline environments, higher S-lignin deposition can strengthen secondary walls, restrict Na+ influx, and stabilize cell structure under osmotic stress, thereby improving resilience. At the same time, fine-tuning lignin composition can optimize fiber flexibility, strength, and industrial processing traits. Similar strategies have already been demonstrated in other fiber and forage crops, highlighting the translational potential of our findings for kenaf. In Populus, manipulation of lignin biosynthetic genes including COMT altered the S/G ratio and enhanced salt tolerance by reducing ion penetration through reinforced secondary cell walls (Janz et al., 2012; He et al., 2013). In forage legumes such as Medicago sativa, transcriptomic and functional studies revealed that COMT and other monolignol pathway genes contribute not only to lignin deposition under salt and drought stress but also to forage digestibility and fiber strength (Rahman et al., 2022).
Here, we provide the first genome-wide catalogue of the kenaf (Hibiscus cannabinus L.) caffeoyl acid 3-O-methyltransferase (COMT) gene family, the key methyltransferase that channels precursors toward syringyl (S) lignin units, and demonstrate that specific members are transcriptionally reprogrammed during salt stress. A total of 81 HcCOMT genes were resolved, which can be grouped into ten clades (Group I-X) that largely mirror the phylogenetic structure of Arabidopsis COMTs. Notably, HcCOMT81, the kenaf orthologue of Arabidopsis At5G54160 (COMT01), shares 98% amino acid identity with AtCOMT01. Previous work has shown that loss of AtCOMT01 abolishes S-lignin units and causes accumulation of the atypical monomer caffeic alcohol, whereas over-expression enhances melatonin synthesis and salt tolerance (Lee et al., 2014; Eudes et al., 2017; Yang et al., 2019). The tight ortholog therefore predicts a conserved role for HcCOMT81 in both lignification and stress-responsive melatonin metabolism (Eudes et al., 2017).
Duplication events can explain the amplification and loss of genes during the evolution of species, and gene duplication may also contribute to the evolution of species and help plants to adapt to their surrounding growth environment (Bhardwaj et al., 2005; Wang et al., 2024). Intraspecific and interspecific synteny analyses indicate that the kenaf COMT gene family has expanded mainly through segmental duplication; only 14 fragmentally duplicated pairs and 3 tandem clusters were detected among the 81 loci. All retained duplicates exhibited Ka/Ks less than 1, signifying strong purifying selection. The scarcity of COMT collinear blocks between kenaf and Arabidopsis (only 2 pairs) further underscores the ancient and conserved nature of this family, consistent with patterns reported in rice (Liang et al., 2022), blueberry (Liu et al., 2021), and cotton (Wu et al., 2021).
Interaction networks generated via STRING place kenaf HcCOMT11 and HcCOMT12 at the core of the lignin polymerization machinery. Their orthologous interact physically with cinnamoyl-CoA reductase (IRX4), which is involved in the later stages of lignin biosynthesis, converting cinnamoyl coenzyme A to the corresponding cinnamaldehyde (Abdelaziz et al., 2016; Wu et al., 2021). HcCOMT10, HcCOMT16, HcCOMT27, and HcCOMT28 belong to the homologous proteins with OMT1 and are related to CYP84A1, which belongs to the ferulic acid 5-hydroxylase and encodes ferulic acid 5-hydroxylase (F5H), involving in lignin biosynthesis and multiple peroxidases, forming a metabolic channel that converts phenylpropanoid acids into lignin monomers while simultaneously regulating H2O2 homeostasis (Meyer et al., 1998; Vanholme et al., 2019). These data corroborate the dual role of COMT enzymes in cell-wall fortification and redox balance. The phylogenetic tree showed that HcCOMT81 and OMT1 belonged to the same branch, and it was hypothesized that there might be a similar gene function between the two, in which OMT1 catalyzes the methylation of lignin precursors, which participates in melatonin biosynthesis (Do et al., 2007), and is involved in the growth and development of the plant, the biotic and abiotic stress responses, and regulates plant response to environmental stresses such as drought and salt damage (Moura et al., 2010; Liu et al., 2018; Yang et al., 2019).
Given that roots are the earliest site to perceive salt stress. Tissue-specific expression profiling showed that HcCOMT11, HcCOMT12, HcCOMT13, and HcCOMT17 are predominantly expressed in roots and stems, the organs that initially perceive and transduce saline signals. Exposure to 200 mM NaCl elicited cultivar-dependent induction kinetics: transcript levels of these four genes rose earlier and accumulated to higher abundance in the salt-tolerant cultivar Fuhong18, mirroring the enhanced lignin deposition observed in its stems. In contrast, the leaf-specific isoforms HcCOMT28 and HcCOMT29 were largely repressed, implying a resource reallocation from photosynthetic tissues to the vasculature under stress. The coordinated up-regulation of root/stem COMTs coupled with the down-regulation of leaf COMTs provides a mechanistic explanation for the superior lodging resistance and Na+ exclusion capacity of Fuhong18. To obtain a comprehensive understanding of kenaf salinity responses, future work should encompass a broader NaCl concentration gradient and employ functional assays (such as overexpression or CRISPR/Cas9-mediated knockout in kenaf or heterologous systems) to directly establish the contribution of these HcCOMTs to lignin modification and salt stress adaptation.
5 Conclusion
A total of 81 HcCOMT genes (HcCOMT01-HcCOMT81) were identified in this study, distributed on 15 chromosomes. Phylogenetic reconstruction delineated ten well-supported clades I-X, with kenaf orthologous clustering in clades III, VIII and X. qPCR analyses revealed that six stress-responsive members, particularly HcCOMT11, HcCOMT12, HcCOMT13 and HcCOMT17, are specifically upregulated in stems under salt stress and correlate positively with lignin accumulation. These findings provide a robust genomic resource and a functional framework for dissecting the molecular basis of lignin-mediated salt tolerance in kenaf, and lay the groundwork for marker-assisted selection or genome editing of COMT loci to enhance fiber quality and abiotic stress resilience.
Data availability statement
The original contributions presented in the study are included in the article/Supplementary Material. Further inquiries can be directed to the corresponding authors.
Author contributions
JX: Data curation, Formal Analysis, Funding acquisition, Software, Writing – original draft. TL: Formal Analysis, Investigation, Methodology, Validation, Writing – original draft. HL: Data curation, Formal Analysis, Methodology, Software, Writing – original draft. RH: Data curation, Formal Analysis, Methodology, Writing – original draft. MC: Conceptualization, Funding acquisition, Investigation, Project administration, Resources, Writing – original draft. PF: Conceptualization, Funding acquisition, Project administration, Resources, Writing – review & editing. XN: Conceptualization, Funding acquisition, Project administration, Supervision, Visualization, Writing – review & editing.
Funding
The author(s) declare financial support was received for the research and/or publication of this article. This study was supported by the Natural Science Foundation of Fujian (2023J01458; 2022J01584), the earmarked fund for CARS-16 (CARS-16), the Institute of Chinese White Tea Open Subjects (BCY2022K02), and the project of Ningde Normal University (2022ZX411), and the Weng Hongwu Academic Innovation Research Fund of Peking University.
Conflict of interest
The authors declare that the research was conducted in the absence of any commercial or financial relationships that could be construed as a potential conflict of interest.
Generative AI statement
The author(s) declare that no Generative AI was used in the creation of this manuscript.
Any alternative text (alt text) provided alongside figures in this article has been generated by Frontiers with the support of artificial intelligence and reasonable efforts have been made to ensure accuracy, including review by the authors wherever possible. If you identify any issues, please contact us.
Publisher’s note
All claims expressed in this article are solely those of the authors and do not necessarily represent those of their affiliated organizations, or those of the publisher, the editors and the reviewers. Any product that may be evaluated in this article, or claim that may be made by its manufacturer, is not guaranteed or endorsed by the publisher.
Supplementary material
The Supplementary Material for this article can be found online at: https://www.frontiersin.org/articles/10.3389/fpls.2025.1678383/full#supplementary-material
References
Abdelaziz, O. Y., Brink, D. P., Prothmann, J., Ravi, K., Sun, M., Garcia-Hidalgo, J., et al. (2016). Biological valorization of low molecular weight lignin. Biotechnol. Adv. 34, 1318–1346. doi: 10.1016/j.biotechadv.2016.10.001
Ayadi, R., Hamrouni, L., Hanana, M., Bouzid, S., Trifi, M., and Khouja, M. L. (2011). In vitro propagation and regeneration of an industrial plant kenaf (Hibiscus cannabinus L.). Ind. Crop Prod 33, 474–480. doi: 10.1016/j.indcrop.2010.10.025
Bhardwaj, H. L., Webber, C. L., and Sakamoto, G. S. (2005). Cultivation of kenaf and sunn hemp in the mid-Atlantic United States. Ind. Crop Prod 22, 151–155. doi: 10.1016/j.indcrop.2004.08.002
Biasini, M., Bienert, S., Waterhouse, A., Arnold, K., Studer, G., Schmidt, T., et al. (2014). SWISS-MODEL: modelling protein tertiary and quaternary structure using evolutionary information. Nucleic Acids Res. 42, W252–W258. doi: 10.1093/nar/gku340
Bugos, R. C., Chiang, V. L., and Campbell, W. H. (1991). cDNA cloning, sequence analysis and seasonal expression of lignin-bispecific caffeic acid/5-hydroxyferulic acid O-methyltransferase of aspen. Plant Mol. Biol. 17, 1203–1215. doi: 10.1007/BF00028736
Cai, Y., Zhang, K., Kim, H., Hou, G., Zhang, X., Yang, H., et al. (2016). Enhancing digestibility and ethanol yield of Populus wood via expression of an engineered monolignol 4-O-methyltransferase. Nat. Commun. 7, 11989. doi: 10.1038/ncomms11989
Carocha, V., Soler, M., Hefer, C., Cassan-Wang, H., Fevereiro, P., Myburg, A. A., et al. (2015). Genome-wide analysis of the lignin toolbox of Eucalyptus grandis. New Phytol. 206, 1297–1313. doi: 10.1111/nph.13313
Chen, C., Chen, H., Zhang, Y., Thomas, H. R., Frank, M. H., He, Y., et al. (2020a). TBtools: an integrative toolkit developed for interactive analyses of big biological data. Mol. Plant 13, 1194–1202. doi: 10.1016/j.molp.2020.06.009
Chen, S., Zhao, Y., Zhao, X., and Chen, S. (2020b). Identification of putative lignin biosynthesis genes in Betula pendula. Trees 34, 1255–1265. doi: 10.1007/s00468-020-01995-8
Do, C. T., Pollet, B., Thévenin, J., Sibout, R., Denoue, D., Barrière, Y., et al. (2007). Both caffeoyl Coenzyme A 3-O-methyltransferase 1 and caffeic acid O-methyltransferase 1 are involved in redundant functions for lignin, flavonoids and sinapoyl malate biosynthesis in Arabidopsis. Planta 226, 1117–1129. doi: 10.1007/s00425-007-0558-3
Eudes, A., Dutta, T., Deng, K., Jacquet, N., Sinha, A., Benites, V. T., et al. (2017). SbCOMT (Bmr12) is involved in the biosynthesis of tricin-lignin in sorghum. PLoS One 12, e0178160. doi: 10.1371/journal.pone.0178160
Guo, R., Xu, X., Carole, B., Li, X., Gao, M., Zheng, Y., et al. (2013). Genome-wide identification, evolutionary and expression analysis of the aspartic protease gene superfamily in grape. BMC Genomics 14, 554. doi: 10.1186/1471-2164-14-554
He, J., Li, H., Luo, J., Ma, C., Li, S., Qu, L., et al. (2013). A transcriptomic network underlies microstructural and physiological responses to cadmium in Populus x canescens. Plant Physiol. 162, 424–439. doi: 10.1104/pp.113.215681
Huang, S., Ding, J., Deng, D., Tang, W., Sun, H., Liu, D., et al. (2013). Draft genome of the kiwifruit Actinidia chinensis. Nat. Commun. 4, 2640. doi: 10.1038/ncomms3640
Huang, E., Tang, J., Song, S., Yan, H., Yu, X., Luo, C., et al. (2024). Caffeic acid O-methyltransferase from Ligusticum chuanxiong alleviates drought stress, and improves lignin and melatonin biosynthesis. Front. Plant Sci. 15, 1458296. doi: 10.3389/fpls.2024.1458296
Janz, D., Lautner, S., Wildhagen, H., Behnke, K., Schnitzler, J. P., Rennenberg, H., et al. (2012). Salt stress induces the formation of a novel type of ‘pressure wood’ in two Populus species. New Phytol. 194, 129–141. doi: 10.1111/j.1469-8137.2011.03975.x
Katoh, K. and Standley, D. M. (2013). MAFFT multiple sequence alignment software version 7: improvements in performance and usability. Mol. Biol. Evol. 30, 772–780. doi: 10.1093/molbev/mst010
Koch, M., Al-Shehbaz, I. A., and Mummenhoff, K. (2003). Molecular systematics, evolution, and population biology in the mustard family (Brassicaceae). Ann. Mo Bot. Gard 90, 151–171. doi: 10.2307/3298580
Lee, H. Y., Byeon, Y., Lee, K., Lee, H. J., and Back, K. (2014). Cloning of Arabidopsis serotonin N-acetyltransferase and its role with caffeic acid O-methyltransferase in the biosynthesis of melatonin in vitro despite their different subcellular localizations. J. Pineal Res. 57, 418–426. doi: 10.1111/jpi.12181
Lescot, M., Dehais, P., Thijs, G., Marchal, K., Moreau, Y., Van De Peer, Y., et al. (2002). PlantCARE, a database of plant cis-acting regulatory elements and a portal to tools for in silico analysis of promoter sequences. Nucleic Acids Res. 30, 325–327. doi: 10.1093/nar/30.1.325
Liang, S., Xu, S., Qu, D., Yang, L., Wang, J., Liu, H., et al. (2022). Identification and functional analysis of the caffeic acid O-methyltransferase (COMT) gene family in rice (Oryza sativa L.). Int. J. Mol. Sci. 23, 8491. doi: 10.3390/ijms23158491
Liu, Q., Luo, L., and Zheng, L. (2018). Lignins: biosynthesis and biological functions in plants. Int. J. Mol. Sci. 19, 335. doi: 10.3390/ijms19020335
Liu, Y., Wang, Y., Pei, J., Li, Y., and Sun, H. (2021). Genome-wide identification and characterization of COMT gene family during the development of blueberry fruit. BMC Plant Biol. 21, 5. doi: 10.1186/s12870-020-02767-9
Lu, N., Ma, W., Han, D., Liu, Y., Wang, Z., Wang, N., et al. (2019). Genome-wide analysis of the Catalpa bungei caffeic acid O-methyltransferase (COMT) gene family: identification and expression profiles in normal, tension, and opposite wood. PeerJ 7, e6520. doi: 10.7717/peerj.6520
Lv, G., Tang, D., Chen, F., Sun, Y., Fang, W., Guan, Z., et al. (2011). The anatomy and physiology of spray cut chrysanthemum pedicels, and expression of a caffeic acid 3-O-methyltransferase homologue. Postharvest Biol. Tech 60, 244–250. doi: 10.1016/j.postharvbio.2011.01.004
Meyer, K., Shirley, A. M., Cusumano, J. C., Bell-Lelong, D. A., and Chapple, C. (1998). Lignin monomer composition is determined by the expression of a cytochrome P450-dependent monooxygenase in Arabidopsis. Proc. Natl. Acad. Sci. U.S.A. 95, 6619–6623. doi: 10.1073/pnas.95.12.6619
Moura, J. C., Bonine, C. A., De Oliveira Fernandes Viana, J., Dornelas, M. C., and Mazzafera, P. (2010). Abiotic and biotic stresses and changes in the lignin content and composition in plants. J. Integr. Plant Biol. 52, 360–376. doi: 10.1111/j.1744-7909.2010.00892.x
Niu, X., Chen, M., Huang, X., Chen, H., Tao, A., Xu, J., et al. (2017). Reference Gene Selection for qRT-PCR Normalization Analysis in kenaf (Hibiscus cannabinus L.) under Abiotic Stress and Hormonal Stimuli. Front. Plant Sci. 8, 771. doi: 10.3389/fpls.2017.00771
Oraby, H. F. and Ramadan, M. F. (2014). Impact of suppressing the caffeic acid O-methyltransferase (COMT) gene on lignin, fiber, and seed oil composition in Brassica napus transgenic plants. Eur. Food Res. Technol. 240, 931–938. doi: 10.1007/s00217-014-2397-3
Rahman, M. A., Woo, J. H., Lee, S. H., Park, H. S., Kabir, A. H., Raza, A., et al. (2022). Regulation of Na+/H+ exchangers, Na+/K+ transporters, and lignin biosynthesis genes, along with lignin accumulation, sodium extrusion, and antioxidant defense, confers salt tolerance in alfalfa. Front. Plant Sci. 13, 1041764. doi: 10.3389/fpls.2022.1041764
Shi, R., Sun, Y. H., Li, Q., Heber, S., Sederoff, R., and Chiang, V. L. (2010). Towards a systems approach for lignin biosynthesis in Populus trichocarpa: transcript abundance and specificity of the monolignol biosynthetic genes. Plant Cell Physiol. 51, 144–163. doi: 10.1093/pcp/pcp175
Tu, Y., Rochfort, S., Liu, Z., Ran, Y., Griffith, M., Badenhorst, P., et al. (2010). Functional analyses of caffeic acid O-Methyltransferase and Cinnamoyl-CoA-reductase genes from perennial ryegrass (Lolium perenne). Plant Cell 22, 3357–3373. doi: 10.1105/tpc.109.072827
Tuskan, G. A., Muchero, W., Tschaplinski, T. J., and Ragauskas, A. J. (2019). Population-level approaches reveal novel aspects of lignin biosynthesis, content, composition and structure. Curr. Opin. Biotechnol. 56, 250–257. doi: 10.1016/j.copbio.2019.02.017
Vanholme, R., Demedts, B., Morreel, K., Ralph, J., and Boerjan, W. (2010). Lignin biosynthesis and structure. Plant Physiol. 153, 895–905. doi: 10.1104/pp.110.155119
Vanholme, R., De Meester, B., Ralph, J., and Boerjan, W. (2019). Lignin biosynthesis and its integration into metabolism. Curr. Opin. Biotechnol. 56, 230–239. doi: 10.1016/j.copbio.2019.02.018
Villar, J. C., Revilla, E., Gómez, N., Carbajo, J. M., and Simón, J. L. (2009). Improving the use of kenaf for kraft pulping by using mixtures of bast and core fibers. Ind. Crop Prod 29, 301–307. doi: 10.1016/j.indcrop.2008.06.002
Voorrips, R. E. (2002). MapChart: software for the graphical presentation of linkage maps and QTLs. J. Hered 93, 77–78. doi: 10.1093/jhered/93.1.77
Wang, Y., Tang, H., Debarry, J. D., Tan, X., Li, J., Wang, X., et al. (2012). MCScanX: a toolkit for detection and evolutionary analysis of gene synteny and collinearity. Nucleic Acids Res. 40, e49. doi: 10.1093/nar/gkr1293
Wang, Y., Tang, H., Wang, X., Sun, Y., Joseph, P. V., and Paterson, A. H. (2024). Detection of colinear blocks and synteny and evolutionary analyses based on utilization of MCScanX. Nat. Protoc. 19, 2206–2229. doi: 10.1038/s41596-024-00968-2
Wu, C., Zuo, D., Xiao, S., Wang, Q., Cheng, H., Lv, L., et al. (2021). Genome-wide identification and characterization of GhCOMT gene family during fiber development and Verticillium wilt resistance in cotton. Plants (Basel) 10, 2756. doi: 10.3390/plants10122756
Yang, W. J., Du, Y. T., Zhou, Y. B., Chen, J., Xu, Z. S., Ma, Y. Z., et al. (2019). Overexpression of taCOMT improves melatonin production and enhances drought tolerance in transgenic Arabidopsis. Int. J. Mol. Sci. 20, 652. doi: 10.3390/ijms20030652
Keywords: kenaf, COMT, lignin synthesis, salt stress, expression pattern
Citation: Xu J, Liu T, Lin H, Huang R, Chen M, Fang P and Niu X (2025) Comprehensive analysis of the Caffeic acid O-methyltransferase gene family in kenaf (Hibiscus cannabinus L.) and their expression characteristics in response to salinity stress. Front. Plant Sci. 16:1678383. doi: 10.3389/fpls.2025.1678383
Received: 02 August 2025; Accepted: 22 September 2025;
Published: 07 October 2025.
Edited by:
Bello Hassan Jakada, Northeast Forestry University, ChinaReviewed by:
Sauban Musa Jibril, Yunnan Agricultural University, ChinaBuhari Lawan Muhammad, Sangmyung University, Republic of Korea
Copyright © 2025 Xu, Liu, Lin, Huang, Chen, Fang and Niu. This is an open-access article distributed under the terms of the Creative Commons Attribution License (CC BY). The use, distribution or reproduction in other forums is permitted, provided the original author(s) and the copyright owner(s) are credited and that the original publication in this journal is cited, in accordance with accepted academic practice. No use, distribution or reproduction is permitted which does not comply with these terms.
*Correspondence: Xiaoping Niu, eHBuaXUwNjEzQDEyNi5jb20=; Pingping Fang, ZjNAZmFmdS5lZHUuY24=
†These authors have contributed equally to this work