 Xinxin Geng1,2,3
 Fengling Yang1,2,3
 Wenhua Tang1,2,3
 Ying Wang1,2,3
 Shan Fu1,2,3
 Zichen Yu1,2,3
 Wanli Cheng1,2,3
 Liang Chen1,2,3*
 Xiaomeng Xue1,2,3*
- 1Hubei Key Laboratory of Edible Wild Plants Conservation & Utilization, Hubei Normal University, Huangshi, China
- 2College of Life Sciences, Hubei Normal University, Huangshi, China
- 3Hubei Engineering Research Center of Special Wild Vegetables Breeding and Comprehensive Utilization Technology, Hubei Normal University, Huangshi, China
Brassica napus, a globally significant oilseed crop of the Brassicaceae family, serves as a major source of vegetable oil and biofuel. Seed size/weight is a crucial agronomic trait that directly determines crop yield. However, the genetic mechanisms underlying seed weight in B. napus has not been fully understood. In this study, R140 with extremely low thousand-seed weight (2.6g) was crossed with Zhongshuang 11 (4.9g) to construct an F2 population. Five major genomic regions on chromosomes A06 (43.88-44.63Mb), A08 (27.63-27.68Mb), A09 (55.32-55.46Mb, 57.33-57.58Mb), and C07 (29.40-29.60Mb) were identified as candidate loci of seed weight via BSA-seq approach. A total of 204 genes were annotated within the candidate regions, including 103 non-synonymous mutant genes and 26 frameshift mutant genes identified between parental lines. Among them, 21 DEGs were screened through RNA-seq analysis of the developing seeds in both parents. However, only 8 genes exhibited mutations in their coding or upstream sequences, which were characterized as the candidate genes associated with the small seed phenotype of R140. An auxin response factor18 coding gene (BnARF18) exhibited significantly differential expression between parents. Analysis of the promoter element variations revealed that the MYC-motif, implicated in gene expression regulation, and the WUN-motif, associated with cell differentiation and proliferation control, likely serve as key regulatory motifs responsible for the differential expression levels of BnARF18 between the two parental lines. It was therefore considered to be the most likely candidate gene. In conclusion, this study provides clues for elucidating the molecular mechanism of seed weight regulation in Brassica napus.
1 Introduction
Brassica napus, a significant oil crop belonging to the Brassicaceae family, represents one of the three primary cultivation types of rapeseeds (Ford et al., 2012). As the second largest source of vegetable oil in the world, it has strategic importance in ensuring food and oil security, promoting sustainable agriculture, and advancing bioenergy development (Rana et al., 2004; Lu et al., 2011). As a heterozygous tetraploid plant, its genome research also provides an important model for plant genetics. Therefore, elucidating the genetic mechanisms underlying important agronomic traits, such as seed weight, is essential for developing high-yield varieties that can meet the increasing global demand for vegetable oil while addressing challenges of sustainable agriculture.
Seed weight is one of the three major factors that contribute to the yield per plant (effective number of siliques per plant, number of seeds per silique, and seed weight), and an important breeding objective in Brassica napus. The determination of seed weight primarily relies on two essential morphological characteristics: seed size and plumpness. Notably, the size of seeds is influenced by the synergistic development of three critical components: embryo, endosperm, and seed coat (Zhang et al., 2018). In addition, large seeds could provide more nutrients during seedling germination, enhance adaptability to the environment (Ding et al., 2012), own a high germination rate (Geritz et al., 1999; Adamski et al., 2009), be resistant to mechanized harvesting (Qing et al., 2021) and increase oil content (Zhang et al., 2022).
Seed weight, a classic quantitative trait governed by multiple genes with large additive and non-additive effects (Grant and Beversdorf, 1985; Ishaq et al., 2017; Karikari et al., 2019; Contreras et al., 2008), has been extensively studied. Numerous QTLs and genes influencing seed weight have been characterized in a wide range of crops, notably rice (Li et al., 2024a; Wang et al., 2023; Kumar et al., 2020), soybean (Xu et al., 2023; Goettel et al., 2022; Gao et al., 2024), peanut (Yang et al., 2023; Li et al., 2021; Fang et al., 2023), maize (Liu et al., 2020; Wang et al., 2020a), wheat (Wang et al., 2022; Zeng et al., 2023) and etc. In Brassica napus, a set of 119 QTLs distributed on all 19 chromosomes were identified for seed weight (Dong et al., 2023; Meng et al., 2025). Yang et al. (2012) discovered 9 QTLs for seed weight on Chromosomes A01, A06, A07, A09 and C09 with 1.3%-28.2% PVE (phenotypic variation explained). Dong et al. (2018) detected 20 significant seed weight-associated SNPs on chromosomes A01, A04, A09, C02, and C06 by GWAS (genome-wide association analysis). A major QTL mapping to chromosome A09 (25.40-25.98Mb) was identified for seed weight by BSA-seq analysis (Geng et al., 2016). Recently, 15 QTLs were detected for seed weight, among which the major QTL qSW-A03 was delineated to a 59kb genomic region through fine-mapping (Meng et al., 2025). Although many QTLs for seed weight have been reported, only two genes, BnaA9.CYP78A9 and BnaA9.ARF18, have been cloned through QTL mapping approaches.
Numerous genes have been identified to influence seed weight through coordinated regulation of cell proliferation and expansion-related signaling pathways, including Brassinoid metabolic pathway, auxin signaling pathways, ubiquitin proteasome metabolic pathways, G-protein signaling pathways, (HAIKU) IKU pathway, MAPK signaling pathway and transcriptional regulatory factors (Zhang et al., 2023; Li et al., 2019). In Brassica napus, auxin responsive factor BnARF18 negatively regulated seed weight by affecting the growth of silique in the auxin signaling pathways (Liu et al., 2015). BnDA1 negatively regulated oilseed weight by regulating the proliferation of seed coat cells in the ubiquitin proteasome metabolic pathways (Wang et al., 2017). SHB1 and HAIKU2 increased final seed weight by regulating endosperm proliferation in the IKU pathway (Xiao et al., 2016). However, most of the reported genes were obtained by homologous cloning. Therefore, comprehending the genetic mechanism and discovering new loci/gene governing the seed weight in rapeseed is crucial for developing new high-quality, high-yield rapeseed varieties.
Bulked Segregant Analysis combined with next-generation sequencing (BSA-seq) is an efficient genetic mapping method used to identify genomic regions associated with target traits. Individuals with extreme phenotypes from a segregating population are selected to form two contrasting DNA pools. These pools are deeply sequenced, and genomic regions linked to the trait are detected by analyzing significant differences in allele frequencies, such as SNPs and Indels, between the pools. BSA-seq streamlines gene localization, enabling rapid focus on candidate regions (Ye et al., 2022a, b). Transcriptome refers to the collection of all gene transcription products in a specific cell, tissue, or organism at a certain developmental stage or physiological condition. Through transcriptome sequencing technology, the sequence and expression level of these RNAs can be measured at high throughput, thus comprehensively analyzing the expression of genes and discovering genes that play key roles and differentially expressed genes in specific states (Wang et al., 2019; Wu et al., 2021). The combined analysis of BSA-seq and RNA-seq has significant value in rapidly identifying regulatory genes for known traits and analyzing the genetic mechanisms of complex traits (Wang et al., 2023, 2024a; Yu et al., 2024; Lei et al., 2024). Ye et al. (2022a) screened a total of 59 DEGs in the candidate regions, and 4 DEGs were identified as the most likely candidates responsible for the albino phenotype through BSA-seq and RNA-seq in Brassica napus. Yang et al. (2024) revealed through comprehensive analysis of BSA-seq and RNA-seq data that 9 genes on chromosome A10 and one gene on chromosome A05 are potential candidate genes for controlling mustard seed weight in Brassica juncea. Ye et al. (2022b) obtained seven candidate DEGs associated with plant Architecture in Brassica napus by combined BSA-seq based mapping and RNA-seq profiling. Wang et al. (2024b) identification of five candidate yellow seed color genes using BSA-seq and RNA-seq in Brassica juncea L.
In this study, a small seed natural mutant R140 was discovered and hybridized with a large seed weight variety Zhongshuang 11 (ZS11) to obtain a hybrid offspring population. BSA-seq was performed on the small seed pool, large seed pool and their parents in the F2 population to determine the genomic intervals associated with seed weight. By combining RNA-seq, seed weight related genes were further screened, providing a theoretical basis for improving the seed weight regulation network of Brassica napus and enhancing the breeding process of ornamental rapeseed.
2 Materials and methods
2.1 Plant materials and growth conditions
In this study, ZS11 (♀) and a mutant line R140 (♂) were used as the parental materials, where ZS11 exhibited a normal thousand-seed weight (TSW) phenotype. R140 is a spontaneous mutant, exhibiting a low TSW phenotype. ZS11 (P1) and R140 (P2) were crossed to produce F1 progeny, and then the F1 progeny was used to generate an F2 segregating population by self-crossing. The F1, F2 generations were planted in the experimental field at Hubei Normal University with row spacing of 40 cm and plant spacing of 25 cm under standard conditions during 2023-2024, Huangshi, China. While the two parental lines were planted at the same field during 2022-2024. To avoid the effects of different pollination methods on seed weight, all plants for phenotyping were self-pollinated by bagging.
2.2 Trait evaluation
The weight of 1000 seeds were measured as thousand-seed weight (TSW) for each sample. Prior to measurement, all seed samples were air-dried at room temperature until a constant weight was achieved to ensure standardized moisture content across all samples. The fully dried seeds of two parents, F1 and F2 individuals were used to measure seed weight trait after harvesting. In order to further understand the impact of five other yield related traits, including plant height, number of siliques per plant, silique length, number of seeds per silique, and seed yield per plant, five representative plants of ZS11 and R140 lines were used for trait evaluation as mentioned earlier (Ding et al., 2012).
2.3 Paraffin section analysis
Mature seeds of R140 and ZS11 were quickly placed in FAA fixative for fixation. Different gradients of ethanol were selected for dehydration treatment for 30 minutes each time. Different ratios of xylene, ethanol, and xylene were used for transparency treatment. Then, different ratios of xylene, paraffin wax mixture, and paraffin pure liquid were selected for wax immersion treatment. Finally, the seeds were embedded in the wax solution and cooled. Subsequently, slicing, unfolding, baking, and dewaxing were carried out, and staining was performed using safranin and solid green dye solutions. Finally, the films were dehydrated, cleared, sealed, and labeled after microscopic examination.
2.4 Bulked segregant analysis sequencing
According to the distribution of seed weight in the F2 population, 30 small-seed plants and 30 large-seed plants were collected. The CTAB method was used to extract genomic DNA from the parents ZS11, R140, and 60 selected rapeseed leaf samples. The DNA concentration and quality were estimated using a NanoDrop 2000 spectrophotometer (Thermo Scientific, Massachusetts, USA) and 1.5% agarose gel electrophoresis. DNA from 30 large-seed F2 plants was pooled to create a large-seed library (large-seed pool), while DNA from 30 small-seed F2 plants formed a small-seed library (small-seed pool). The prepared two pools, and two parents were sent to Biomarker Technologies Co. (Beijing, China) for library construction. Sequencing was performed on the Illumina HiSeq X Ten platform (Illumina, California, USA), and the raw data was firstly filtered through Fastp software to remove low-quality readings and adapter sequences. Raw sequences were transformed into clean reads after data processing and the clean readings were mapped to the reference genome http://cbi.hzau.edu.cn/bnapus/. Single nucleotide polymorphisms (SNPs) and insertion/deletion mutations (Indels) were analyzed using the HaplotypeCaller module in Genome Analysis Kit (GATK) software (v3.8). The average distribution of SNPs on 19 chromosomes of Brassica napus was calculated using sliding window analysis method, with a window size of 1Mb and an increment of 100kb.
Calculating SNP-index is an association analysis method to find the significant differences of genotype frequency between the pools, indicated by Δ(SNP/Indel-index). In the preset project, P and M stand for male and female parents, while aa and ab mean small-seed pool and large-seed pool, respectively. The Δ(SNP/Indel-index) was calculated as follows: SNP/Indel-index(aa)=Maa/(Paa+Maa), SNP/Indel-index(ab)=Mab/(Pab+Mab),Δ(SNP/Indel-index)=SNP/Indel-index(aa)-SNP/Indel-index(ab), in which Maa was the depth of aa population derived from Maa and Paa was the depth of aa population derived from P; Mab indicates the depth of ab population derived from Mab and Pab indicates the depth of ab population derived from P. The method of local weighted regression was adopted to obtain the correlation threshold, and only the intervals whose fitted the Δ(SNP-index) and Δ(Indel-index) values both exceeded their corresponding thresholds were defined as trait related candidate regions.
Gene function of candidate association region was annotated based on the following databases with BLAST software: Nr (NCBI non-redundant protein sequences); Pfam (Protein family); KOG/COG (Clusters of Orthologous Groups of proteins); Swiss-Prot (A manually annotated and reviewed protein sequence database); KO (KEGG Ortholog database) and GO (Gene Ontology).
2.5 RNA sequencing analysis
Total RNA was extracted from seeds of ZS11 and R140 strains at 7, 14, 21, 28, and 35 days after flowering using Trizol assay kit, respectively. The concentration and purity of these RNA samples were measured using a NanoDrop 2000 spectrophotometer (Thermo Scientific, Massachusetts, USA) and 1.5% agarose gel electrophoresis. For each parent line, equal amounts of RNA from these five developmental stages were pooled to form a single composite sample for library construction and subsequent RNA-seq analysis. Each sample has 3 biological replicates. A cDNA sample preparation kit was used to construct 6 cDNA libraries, and the concentration and mass of each cDNA library were measured using the Illumina HiSeq2000 platform, Agilent 2100 Bioanayzer, and ABI Step one Plus Real Time PCR System, respectively. The raw RNA-seq data was processed to remove low-quality data, adapter data, and high content of unknown bases. The high-quality and clean data of each sample is aligned to the reference genome sequence http://cbi.hzau.edu.cn/bnapus/, and only uniquely aligned reads are considered for gene expression analysis. Use RESM program to calculate differential gene expression and transcription abundance (expressed as FPKM values). Genes with FPKM<1 in all samples were excluded from subsequent analysis. Differentially expressed genes (DEGs) were identified using DESeq2 based on two criteria: false discovery rate (FDR)<0.01 and | log2fold change (FC) |>1.
Gene Ontology (GO) and Kyoto Encyclopedia of Genes and Genomes (KEGG) functional annotations for DEGs were retrieved using blast2go3 and blastx/blastp searches against the GO database4 and KEGG database,5 respectively. GO terms with p values ≤ 0.0001 and KEGG pathways with Q-values ≤ 0.05 were considered to be significantly significant.
2.6 Quantitative real-time PCR analysis
Total RNA extracted for RNA-seq was used for conducting qRT-PCR. Seven genes were randomly selected to validate RNA sequencing data by qRT-PCR. The primer pairs were designed using Primer 5.0 (Thermo Fisher, MA, United States). Details of the primers used are listed in Supplementary Table 1. The EasyScript® All-in-One First-Strand cDNA Synthesis SuperMix for qPCR (One-Step gDNA Removal) kit (TIANGEN, China) was used for reverse transcription. qRT-PCR was performed on an ABI StepOne™ Real-time PCR System (Applied Biosystems, CA, United States). All qRT-PCR experiments included three technical replicates and three biological replicates. The Bnactin gene was used as an internal control.
3 Results
3.1 Phenotypic analysis of seed weight in parents, F1 and F2 population
The average TSW of R140 is 2.6g, which is significantly lower than that of ZS11(4.9g) (Figures 1A, B). In general, seed size and weight are determined by cell division or cell expansion in plants (Garcia et al., 2005). To investigate the cause of the decreased seed weight observed in R140, we compared the cell numbers and cell area in seed of R140 and ZS11 plants. Upon observing the cross-sections of the seeds, we found that the difference in the size of R140 and ZS11 seeds originated from the cotyledons. After further observing and statistically analyzing the cotyledon cells of two parents, it was showed that the cell area of R140 was significantly smaller than that of ZS11 (Figures 2A-F). It demonstrated the reduction in seed size/seed weight of mutant R140 was due to the small cell of cotyledons at the cellular level.
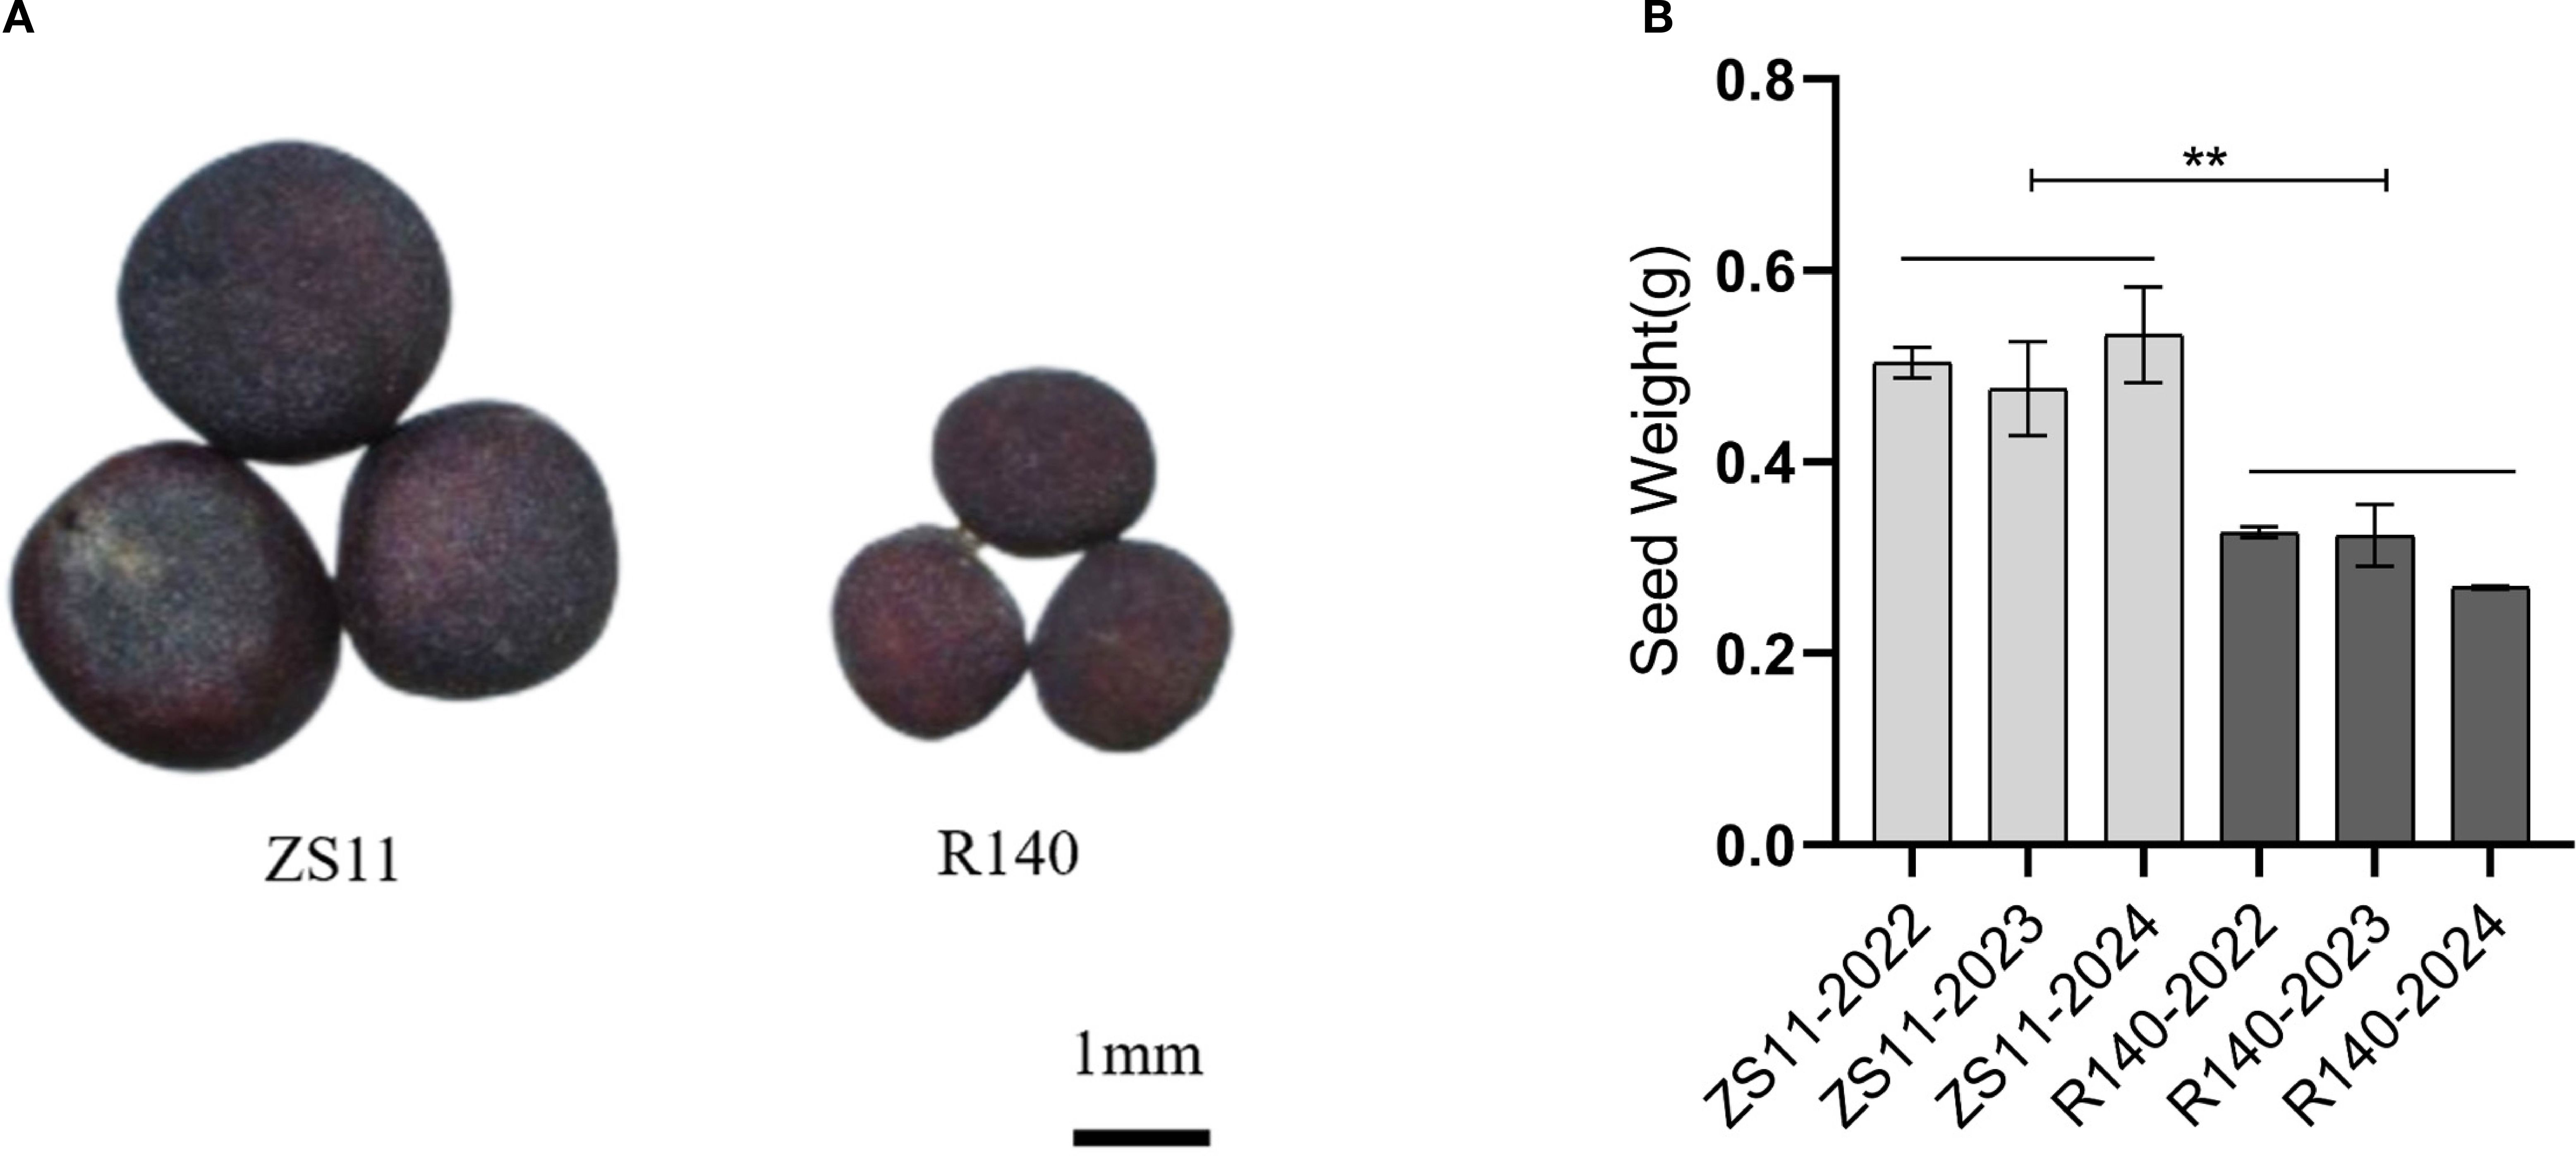
Figure 1. Phenotypic characterization of B. napus lines Zhongshuang 11 (ZS11) and R140. (A) Comparisons in seed size in matured seeds of ZS11 and R140. (B) Comparison in TSW of matured seeds between ZS11 and R140. The data are the means ± SE (n = 10). p-value denotes a significant difference between two lines in TSW.
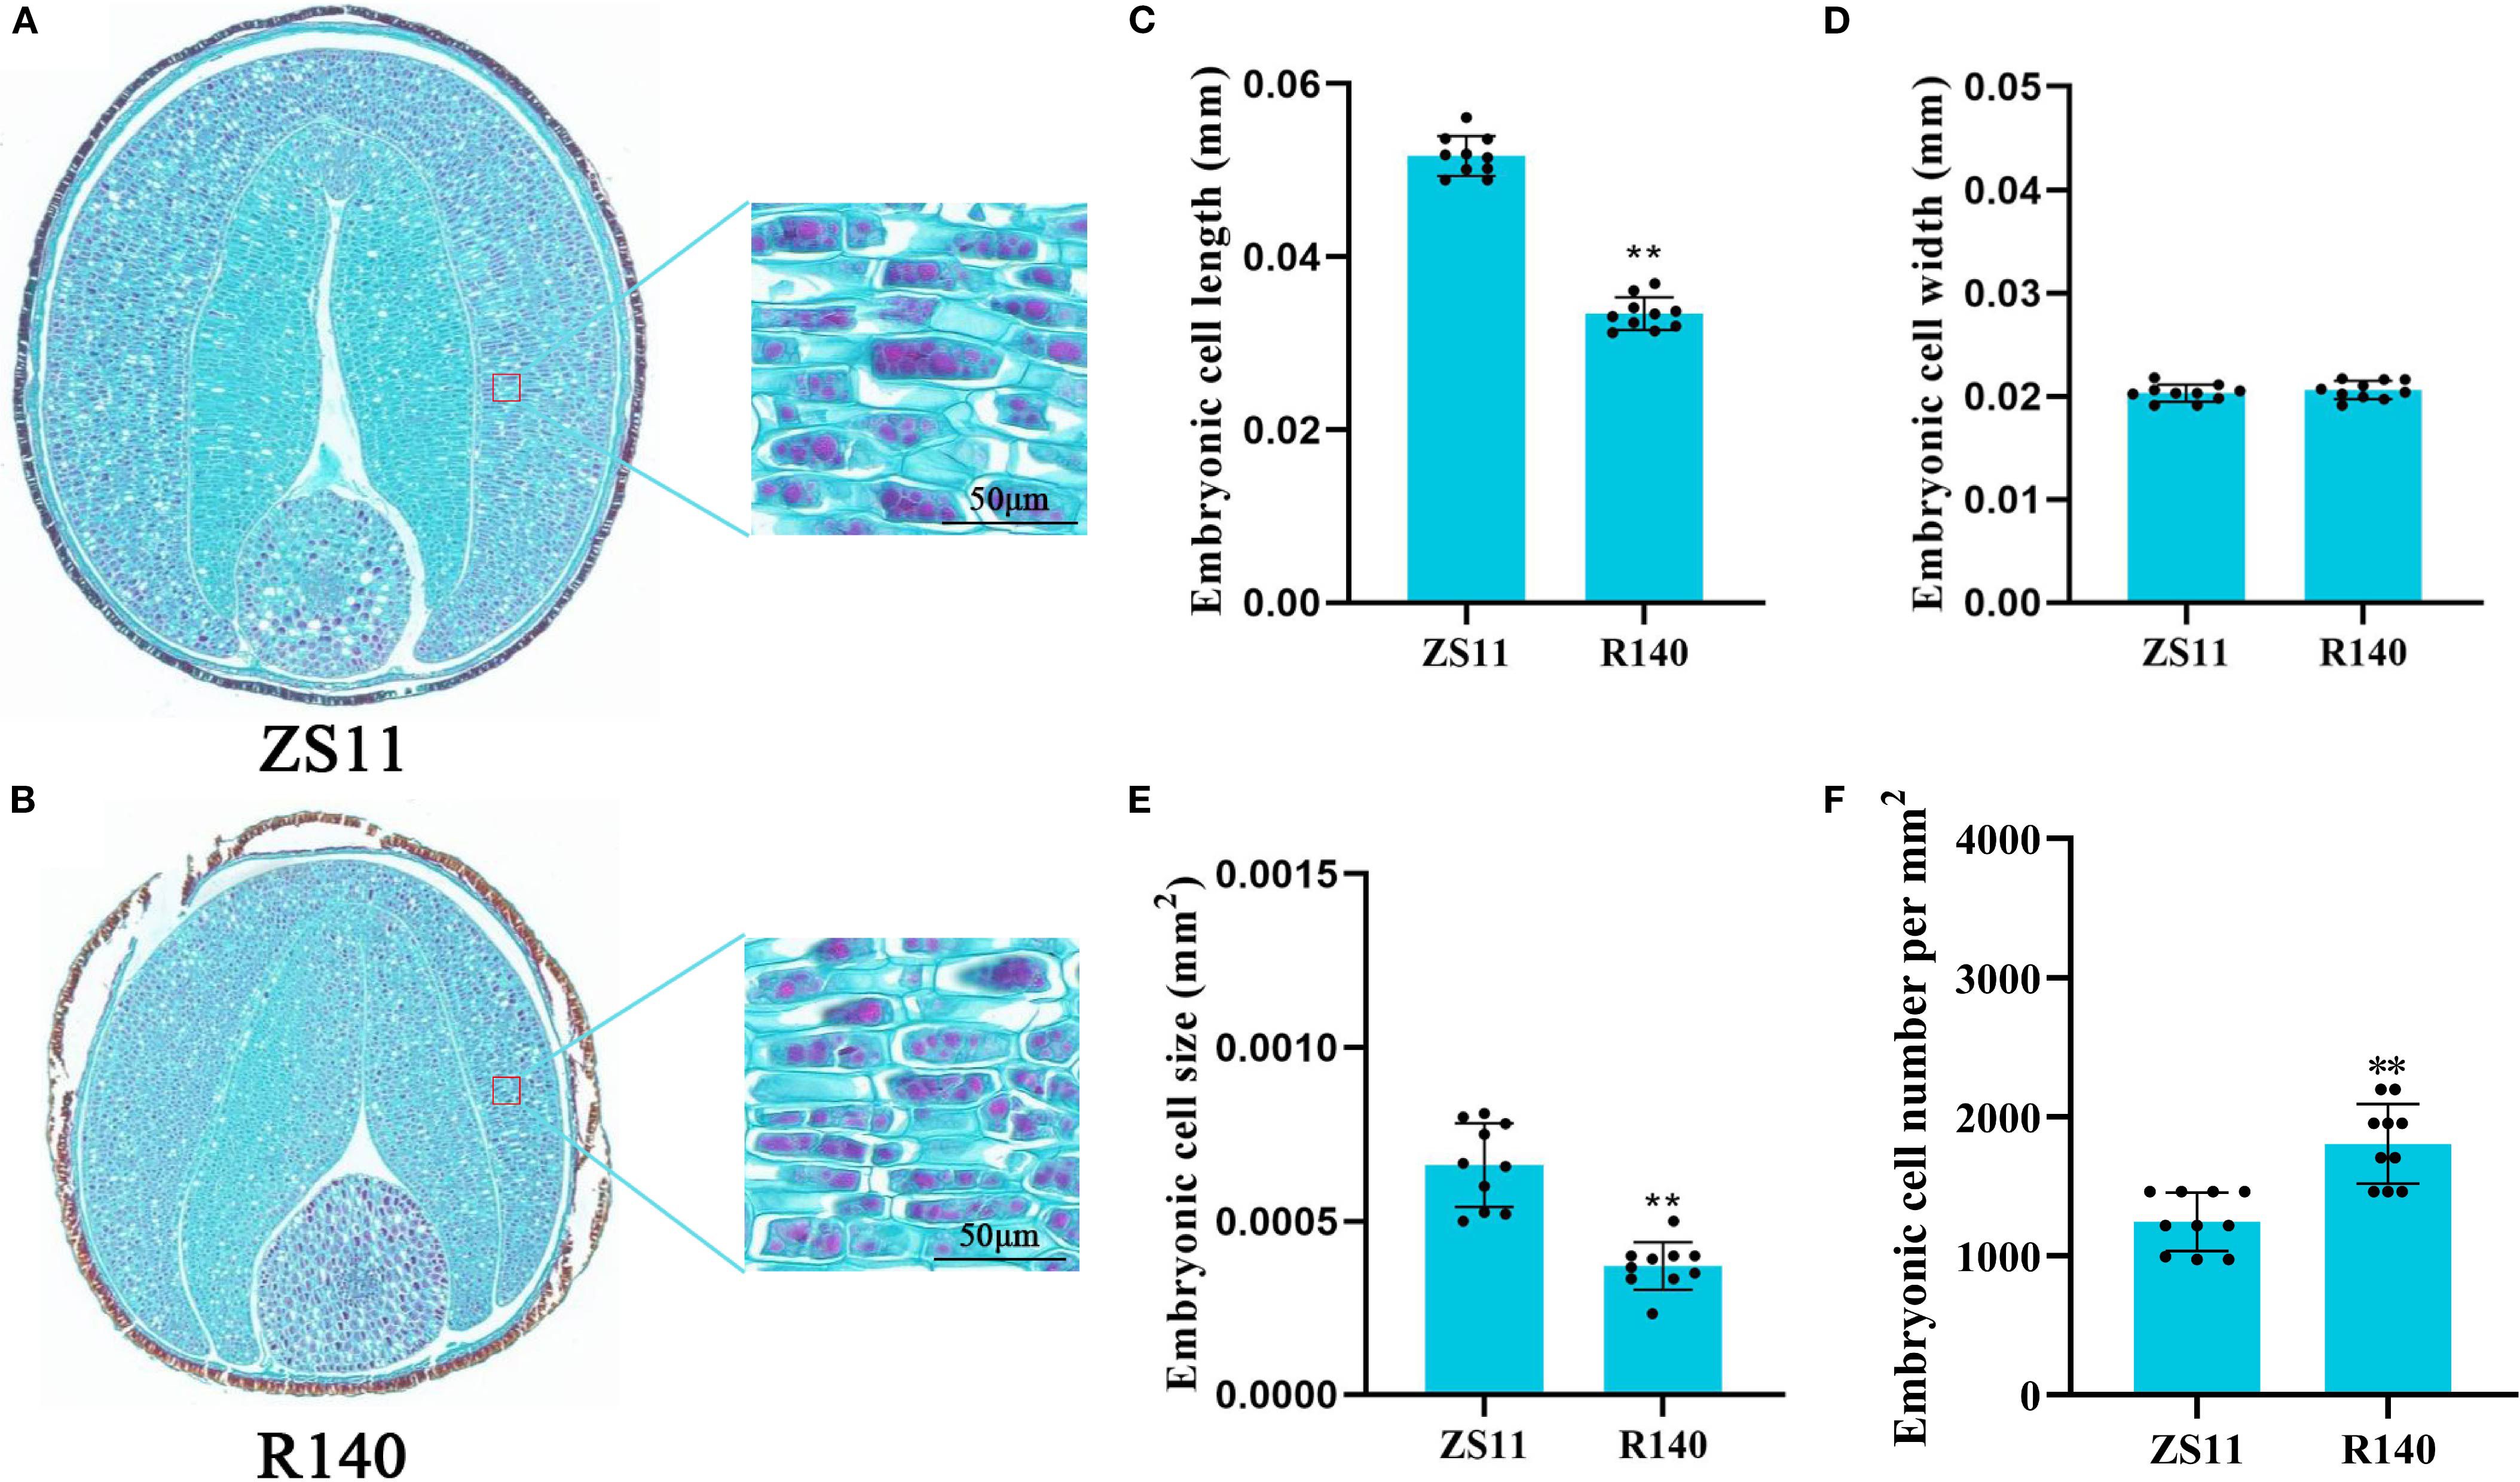
Figure 2. Comparison of cotyledon cell size in matured seeds of Zhongshuang 11(ZS11) and R140 through paraffin sections. (A) The phenotype of cotyledon cells in matured seeds of ZS11. Scale bar = 50 μm. (B) The phenotype of cotyledon cells in matured seeds of R140. Scale bar = 50 μm. (C) Cotyledon cell length in matured seeds of ZS11 and R140. Error bars represent the standard deviation (SD) of ten biological replicates. Asterisks indicate statistically significant differences (** means p < 0.01; Student’s t-test). (D) Cotyledon cell width in matured seeds of ZS11 and R140. Error bars represent the standard deviation (SD) of ten biological replicates. Asterisks indicate statistically significant differences (** means p < 0.01; Student’s t-test). (E) Cotyledon cell size in matured seeds of ZS11 and R140. Error bars represent the standard deviation (SD) of ten biological replicates. Asterisks indicate statistically significant differences (** means p < 0.01; Student’s t-test). (F) Cotyledon cell number in matured seeds of ZS11 and R140. Error bars represent the standard deviation (SD) of ten biological replicates. Asterisks indicate statistically significant differences (** means p < 0.01; Student’s t-test).
Simultaneously, we also investigated several yield related traits of two parents, ZS11 and R140. Compared with ZS11, R140 showed a significant reduction in plant height and seed yield per plant (Supplementary Figures 1A, E) and a very significant reduction in silique length (Supplementary Figure 1C). However, there was no significant difference in silique number per plant and seed number per silique (Supplementary Figures 1B, D), indicating that the mutant R140 showed a decrease in seed weight accompanied by a decrease in silique length and plant height. The decrease in seed yield per plant was mainly caused by seed weight, rather than the other two factors, silique number per plant and seed number per silique.
To further clarify the genetic pattern of the small seed mutant phenotype, we used the small seed mutant R140 (P1) and ZS11 (P2) as parents to cross and obtain F1 progeny, and then F1 produced F2 population by self-crossing. The seed size of F1 plants is intermediate between the two parents (Figure 3A), and the TSW of F2 population plants was analyzed and exhibited continuous distributions with transgressive segregation, following a normal distribution (Figure 3B). These results indicated that the TSW phenotype may be controlled by multiple genes.
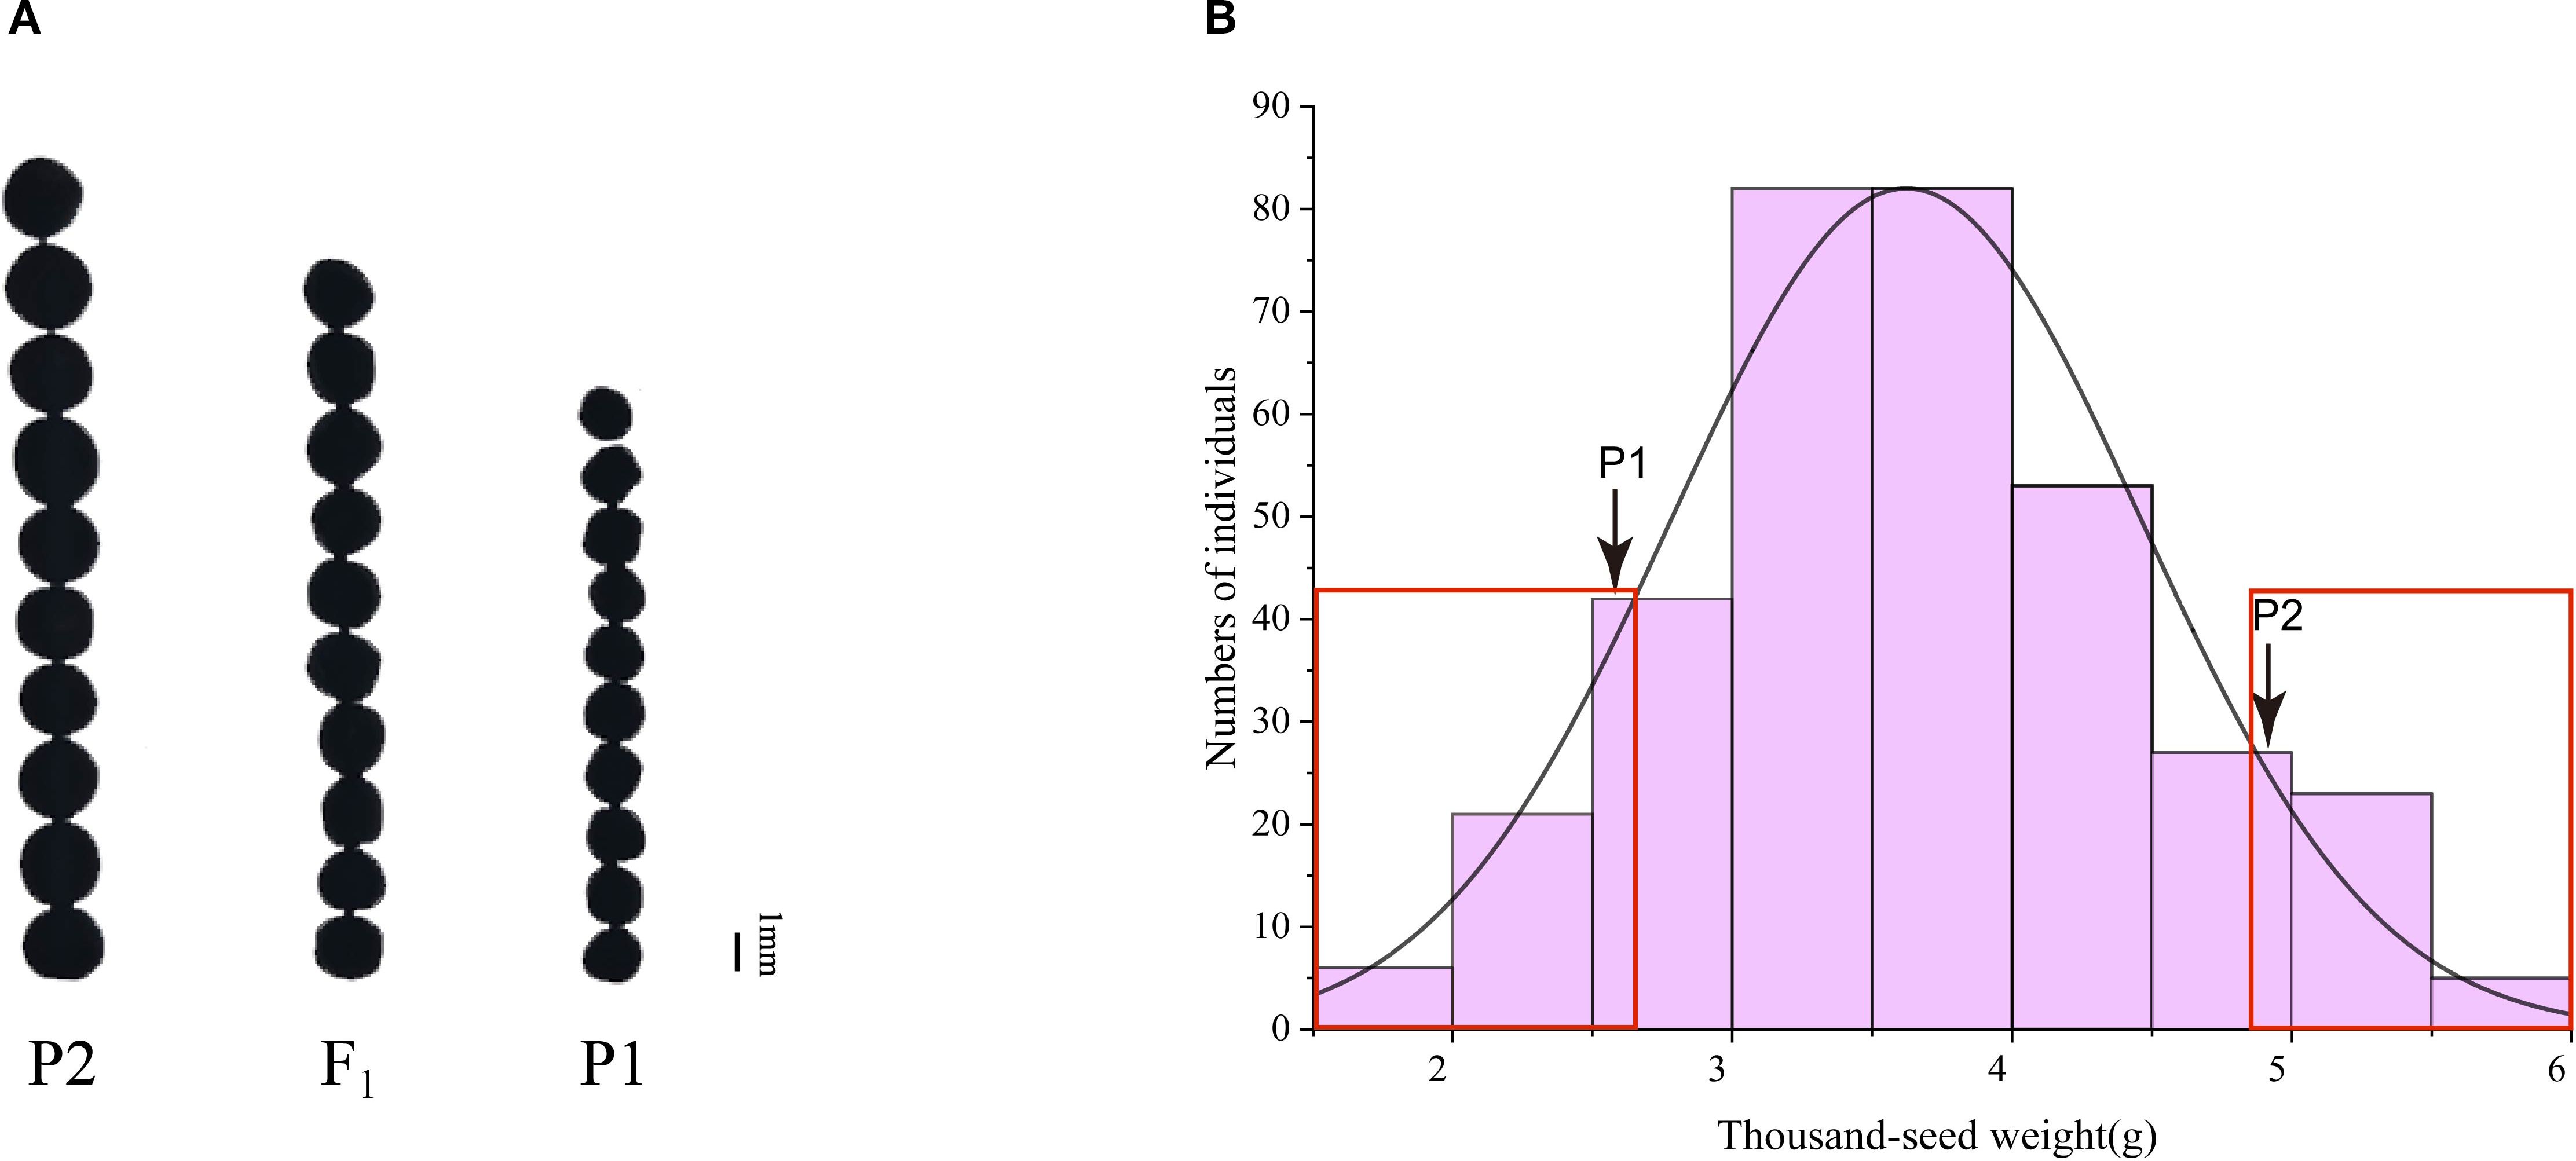
Figure 3. Phenotype of the TSW of two parents, F1 plant and F2 population. (A) Comparisons in seed size in matured seeds of two parents and F1 plant. (B) Frequency distribution of TSW of 341 individuals in F2 population. P1: R140; P2: Zhongshuang 11(ZS11).
3.2 BSA-seq analysis for TSW
To identify genomic intervals associated with seed weight phenotype, BSA-seq was performed using 30 extremely large-seed plants and 30 extremely small-seed plants from F2 population (Figure 3B). After filtering, we obtained 114.15 Gb of clean data, which included 30.06 Gb, 29.76 Gb, 24.35 Gb and 29.98 Gb corresponding to the large seed pool, small seed pool, R140, and ZS11, respectively, yielding average depth of approximately 29×, 28×, 23× and 28×. The sequencing data exhibited excellent quality metrics, with an average Q30 score of 99.16%, an average GC content of 37.19%, and approximately 92.59% of clean reads being properly mapped across all pools (Supplementary Table 2). These high-quality datasets provide a reliable foundation for subsequent genetic analyses.
Total of 2,460,870 SNPs and 826,980 Indels were finally obtained by comparison, filtering, and screening of sequencing data among samples. According to Δ (SNP-index), a total of 7 candidate intervals were identified on 6 chromosomes, including A06, A07, A08, A09, C07 and C08 (Figure 4A). According to Δ (Indel-index), a total of 4 candidate intervals were identified on 4 chromosomes, including A06, A08, A09 and C07 (Figure 4B). By taking the intersection of SNP and Indel associated regions, a total of 5 candidate regions with a physical distance of 1.46Mb were obtained and distributed on Chromosomes A06 (43.88-44.63Mb), A08 (27.63-27.68Mb), A09 (55.32-55.46Mb; 57.33-57.58Mb) and C07 (29.40-29.60Mb). A total of 204 genes were annotated within the candidate regions, including 103 non-synonymous mutant genes and 26 frameshift mutant genes annotated between parents. The annotation results are shown in Supplementary Table 3.
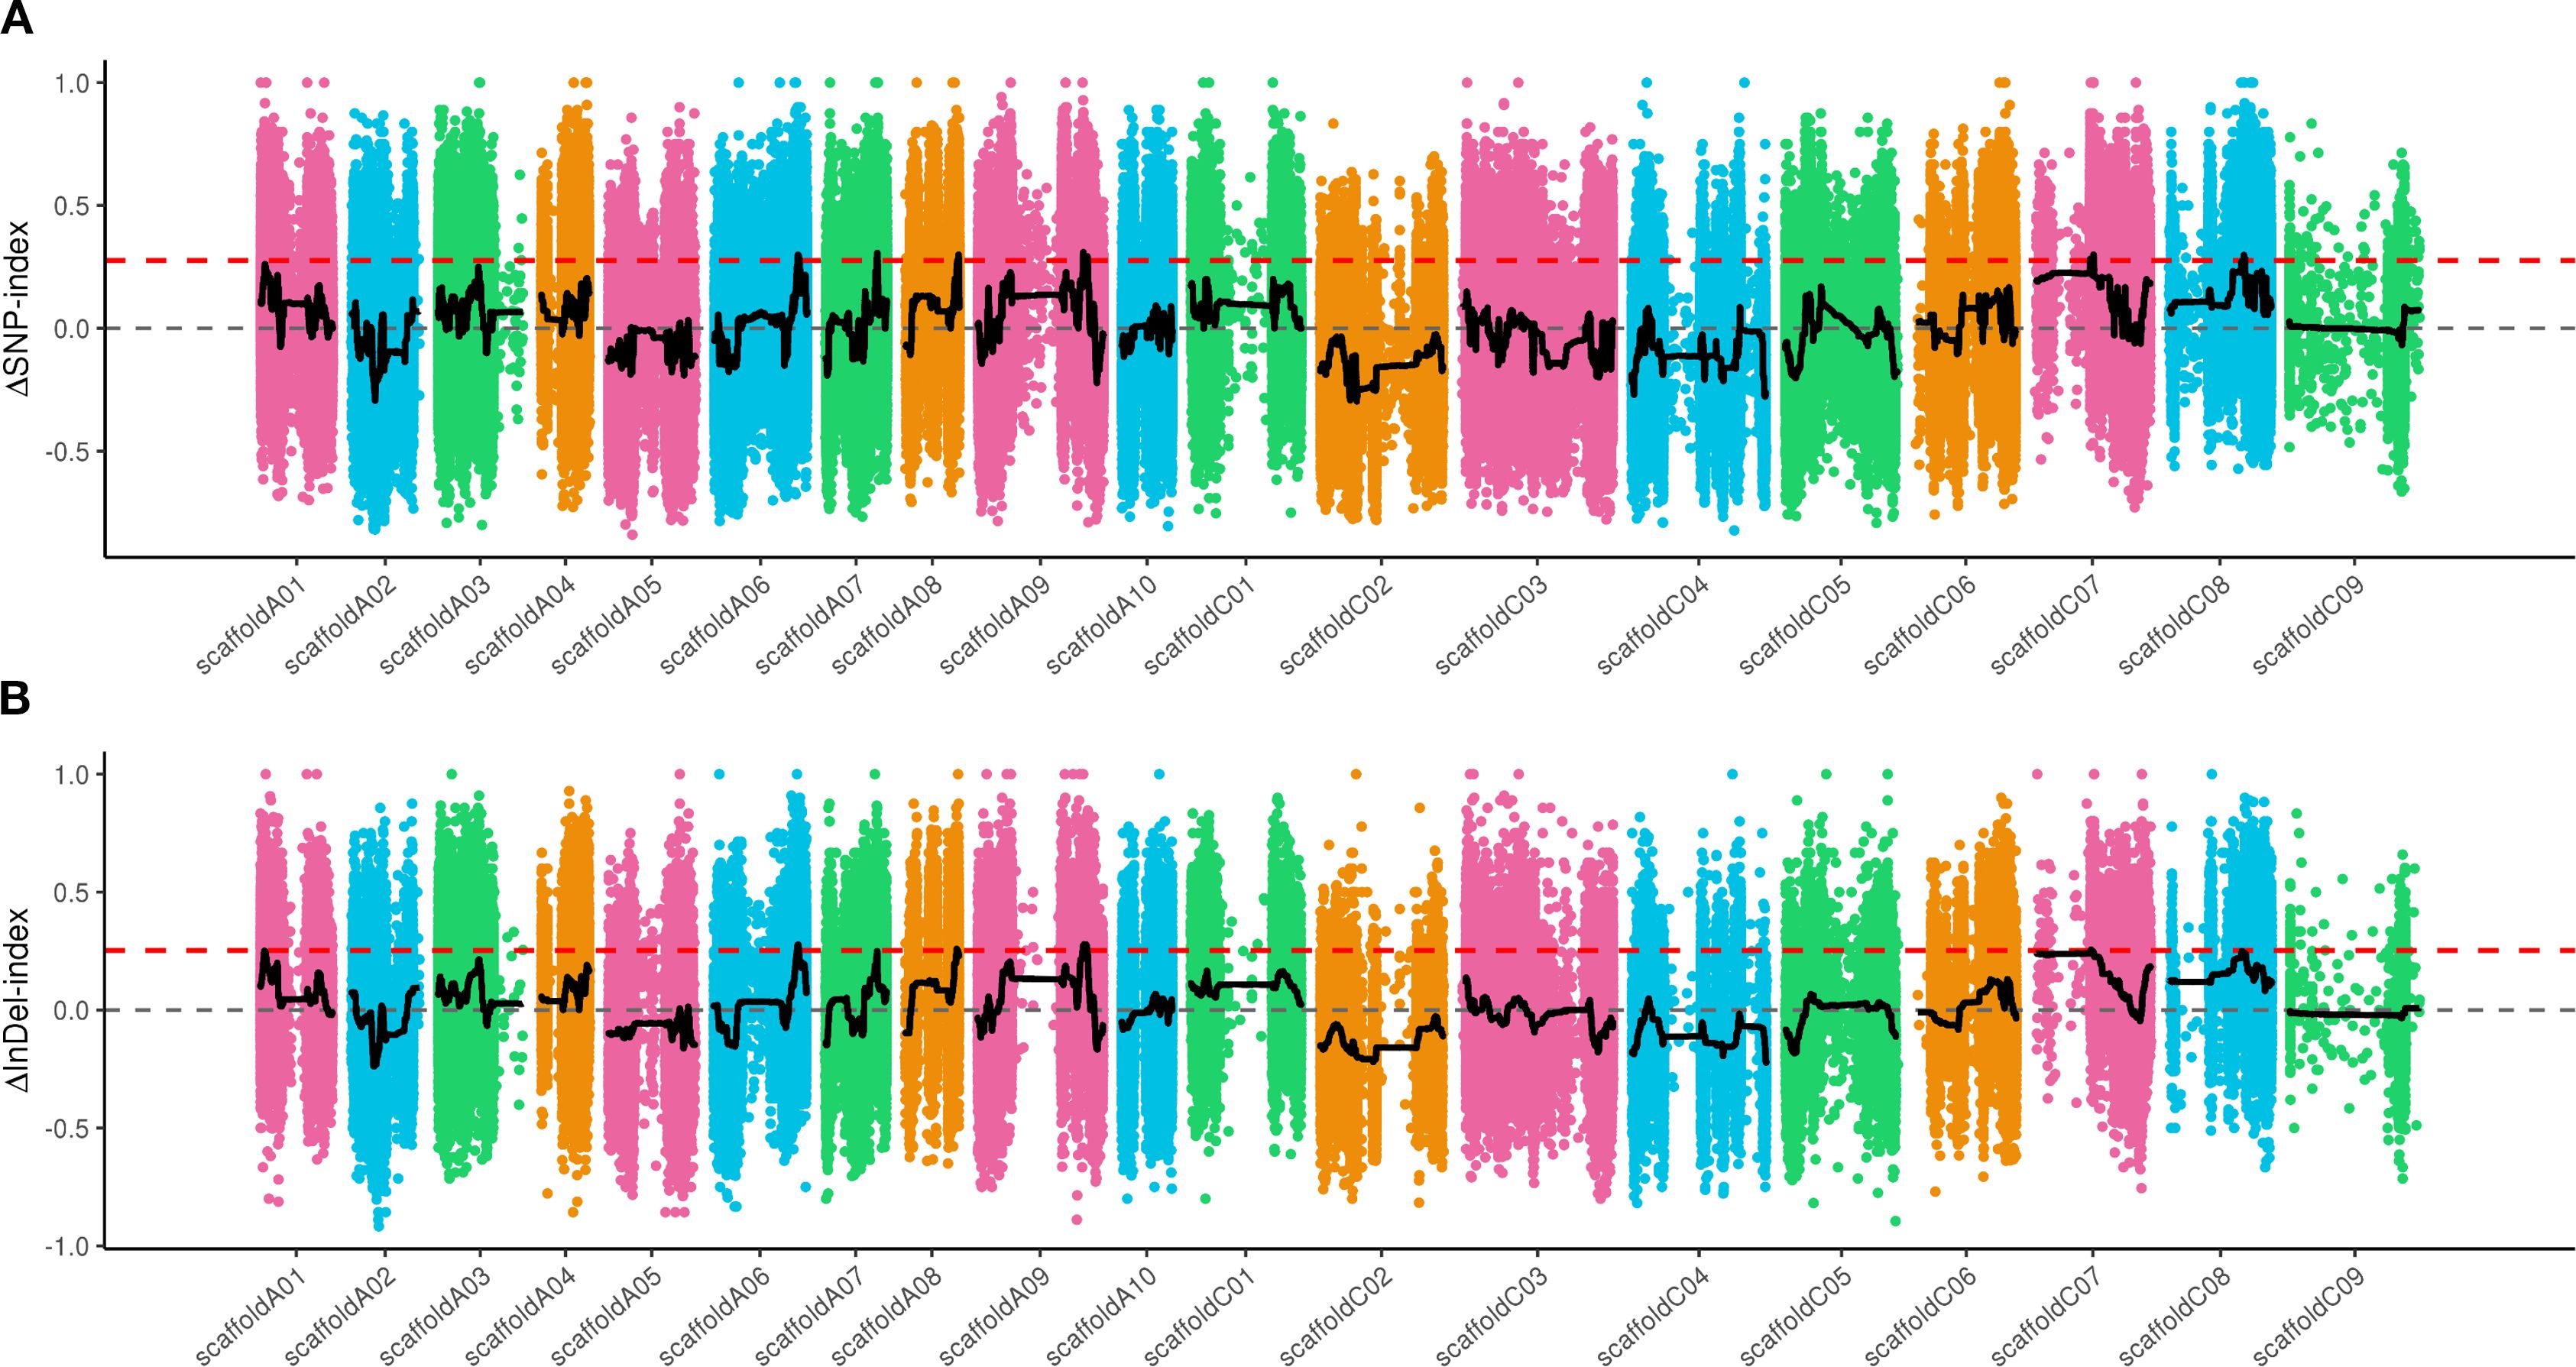
Figure 4. Distribution of SNP and Indel association values on chromosomes. (A) the distribution of SNPs. (B) the distribution of Indels. The red line represents the 99% CI threshold.
3.3 RNA-seq data analysis
To elucidate the molecular mechanisms underlying the phenotypic differences between large and small seeds in Brassica napus. Six cDNA libraries with three biological replicates were sequenced. After filtering out all low-quality sequences and adapters, 5.373Gb, 5.383Gb, 5.382Gb, 5.371Gb, 5.431Gb and 5.423Gb clean data was obtained, respectively. Q30 ratio was above 96.30% (Supplementary Table 4). More than 84.49% of clean reads were successfully mapped to the reference genome for further analysis (Supplementary Table 5).
There were totally 70,399 expressed genes were identified separately in the developing seeds between ZS11 and R140. A total of 7,565 DEGs were identified between the small-seed and large-seed plants, of which 3,078 were up-regulated and 4,487 down-regulated (Figures 5A, B). qRT-PCR analysis was conducted on 7 randomly selected DEGs, and the expression differences could be confirmed for most of these genes (Supplementary Figure 2), indicating that the RNA-seq data was accurate and reliable.
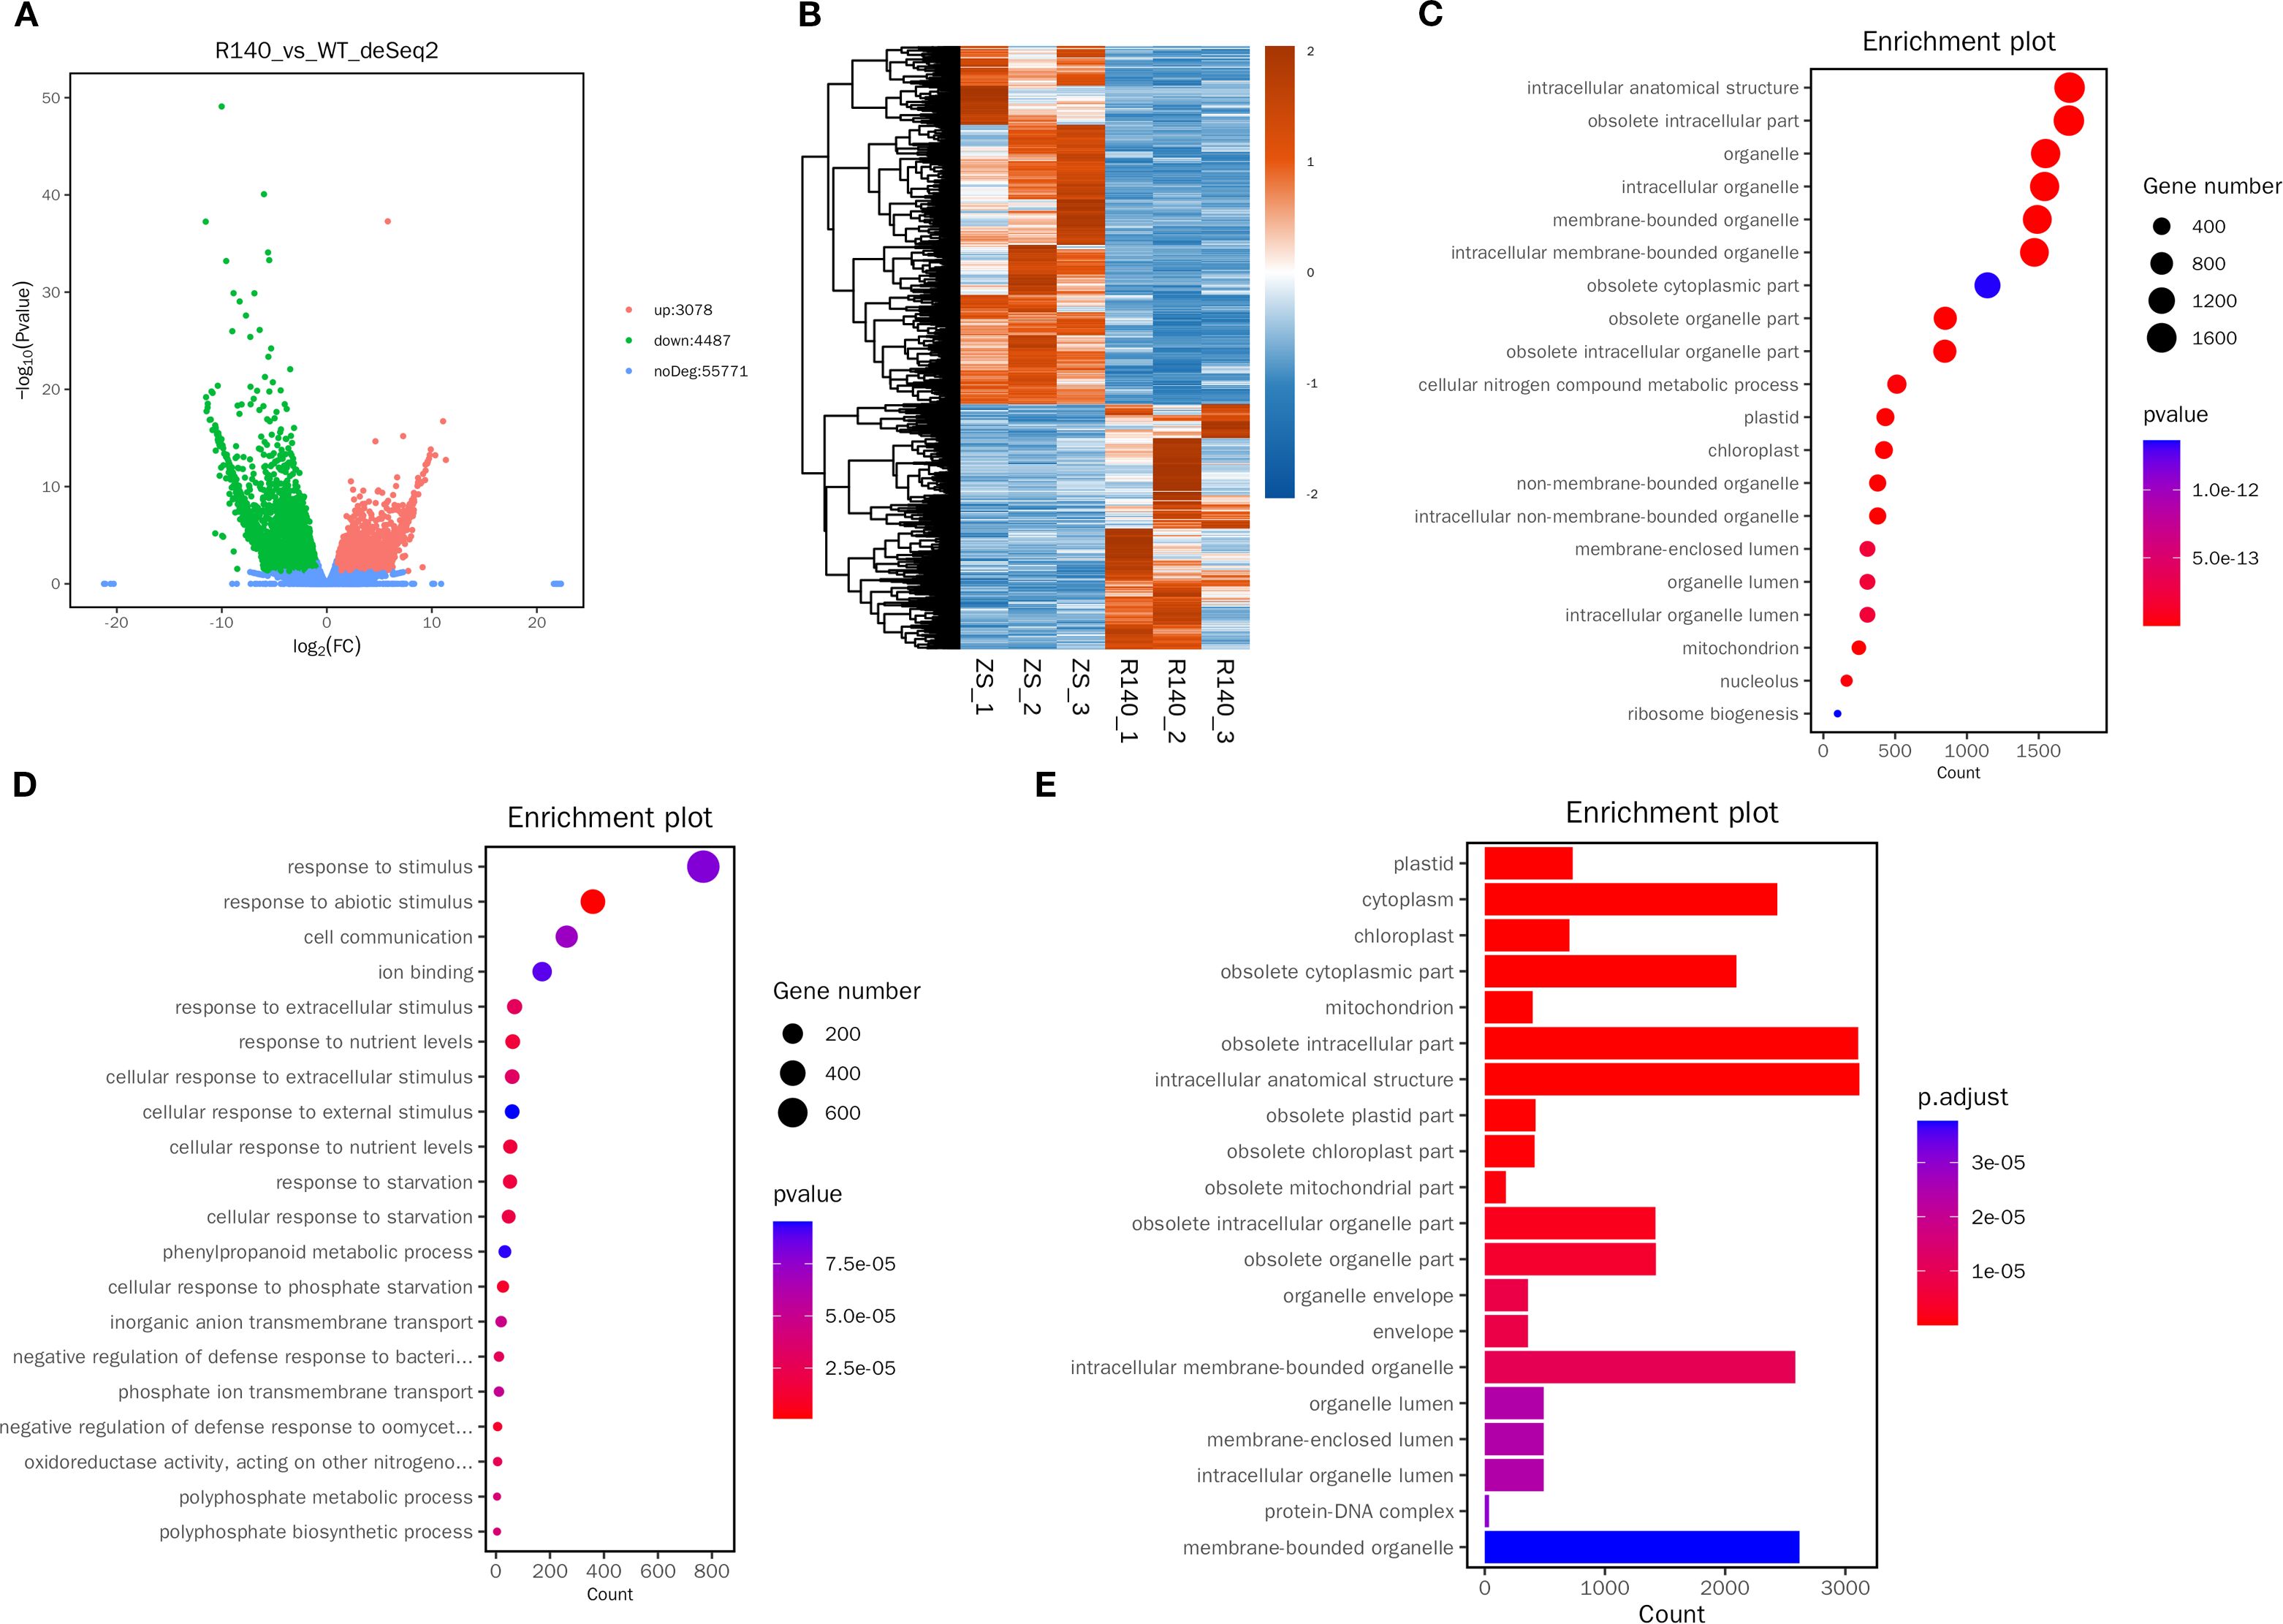
Figure 5. Analysis of DEGs identified among R140 and Zhongshuang 11(ZS11) seeds. (A) Volcano diagram showing the number of no differentially expressed genes and DEGs between two parents. (B) Heatmap showing the DEGs between two parents. (C) Top 20 GO functional enrichment of the up-regulated DEGs. (D) Top 20 GO functional enrichment of the down-regulated DEGs. (E) KEGG pathway enrichment analysis of DEGs.
GO enrichment analysis showed that up-regulated DEGs were mainly enriched in the main pathways of intracellular anatomical structure and obsolete intracellular (Figure 5C), and down-regulated DEGs are mainly enriched in the pathway of response to stimulus (Figure 5D).
Meanwhile, KEGG pathway enrichment analysis showed that 7,565 DEGs participated in 126 pathways (Supplementary Table 6). Of these, 11 pathways were significantly enriched including glutathione metabolism, arginine and proline metabolism, pyrimidine metabolism, ribosome biogenesis in eukaryotes, purine metabolism, pyruvate metabolism, ribosome, sulfur relay system, glycerolipid metabolism, photosynthesis and monoterpenoid biosynthesis (Figure 5E).
3.4 Association analysis between BSA-seq and RNA-seq data
To rapidly identify candidate genes associated with the R140 seed weight phenotype, we conducted a comprehensive association analysis that integrated BSA-seq and RNA-seq results. Based on RNA-seq data, a total of 21 DEGs were identified from 5 candidate intervals related to seed weight (Figure 6, Table 1). By aligning BSA-seq reads from R140 and ZS11 to the B. napus reference genome, we further characterized these DEGs, identifying 3 genes (BnaA06G0376100ZS, BnaA09G0520900ZS and BnaA09G0521300ZS) with frameshift mutations, 4 genes (BnaA06G0371700ZS, BnaA06G0374700ZS, BnaA06G0378900ZS and BnaA09G0522100ZS) with nonsynonymous mutations, and 1 gene (BnaA09G0559300ZS) exhibiting an upstream mutation. Therefore, by combining the results of BSA-seq with RNA-seq, these 8 genes may be the candidate genes within the targeted region. To verify the expression of the candidate genes in R140 and ZS11 samples, we performed qRT-PCR on these 8 genes. The expression profiles in qRT-PCR were consistent with those in RNA-seq, except for BnaA09G0522100ZS. It was worth noting that BnaA09G0559300ZS, which encodes an auxin response factor 18-like (BnARF18), was found that there was a very significant difference in expression levels between two parents. Using ZS11 as a control, the expression level of BnARF18 in R140 was significantly increased, indicating negative regulation of seed weight (Figure 7). This result was consistent with the findings reported by Liu et al. (2015). Four genes have similar expression trends with BnARF18, including BnaA06G0371700ZS, BnaA06G0378900ZS, BnaA09G0520900ZS and BnaA09G0521300ZS. Based on the annotation information, BnaA06G0371700ZS encodes hypothetical protein BRARA, BnaA06G0378900ZS encodes bidirectional sugar transporter SWEET4, BnaA09G0520900ZS encodes ribosomal lysine N-methyltransferase 3, and BnaA09G0521300ZS encodes WAT1 related protein, all of which were not found to be enriched in pathways related to seed size or seed weight.
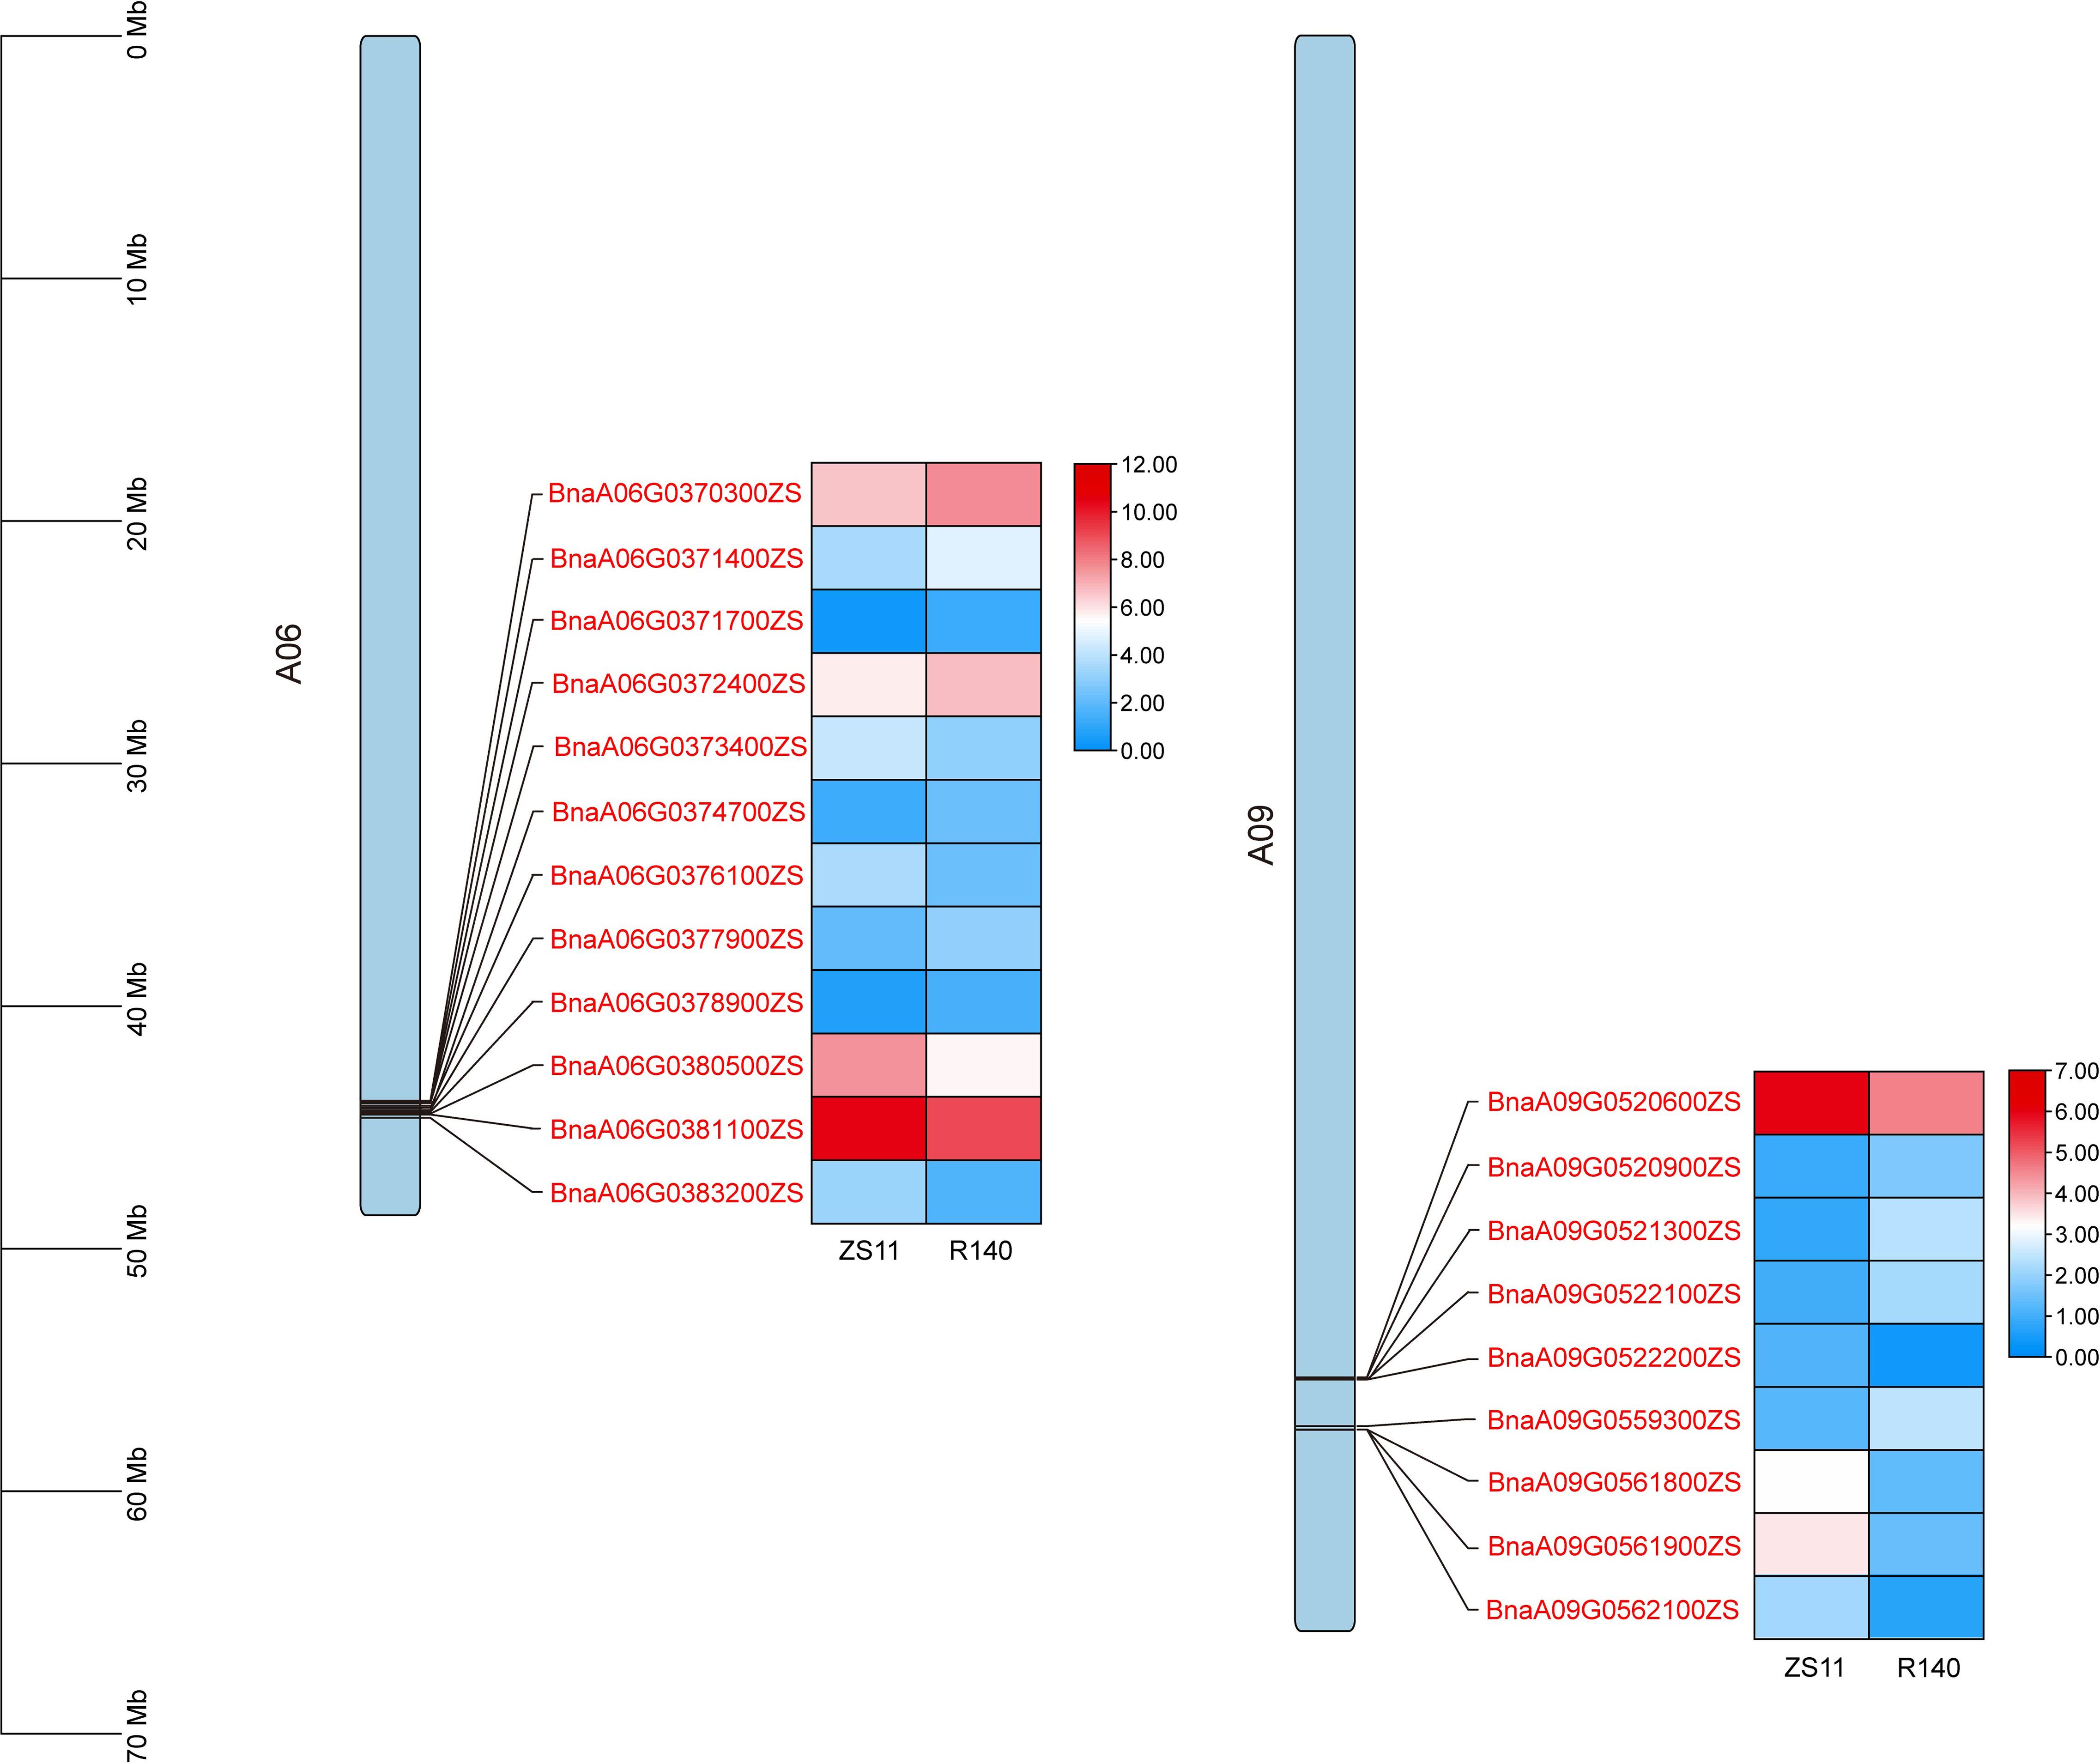
Figure 6. The expression patterns of the 21 candidate genes screened from 5 candidate intervals related to seed weight phenotype based on RNA-seq. The position distribution map of genes on chromosomes and the heat map of expression were drawn using TBtools (Chen et al., 2023).
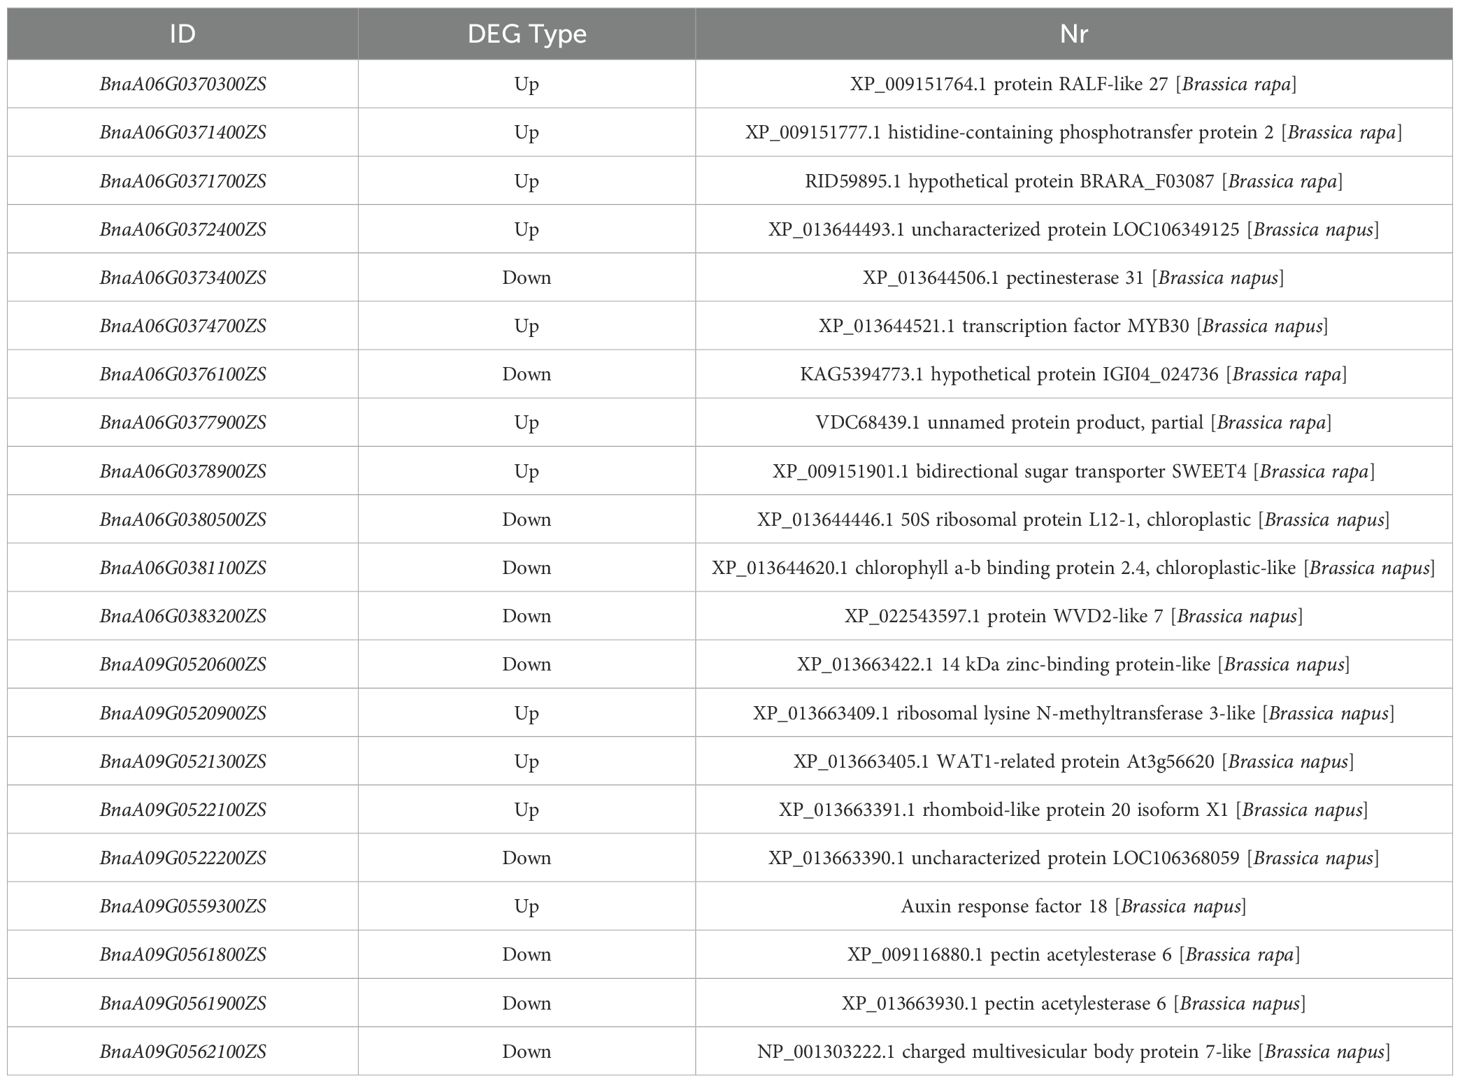
Table 1. Annotation information of 20 DEGs screened from 3 BSA-seq candidate intervals.
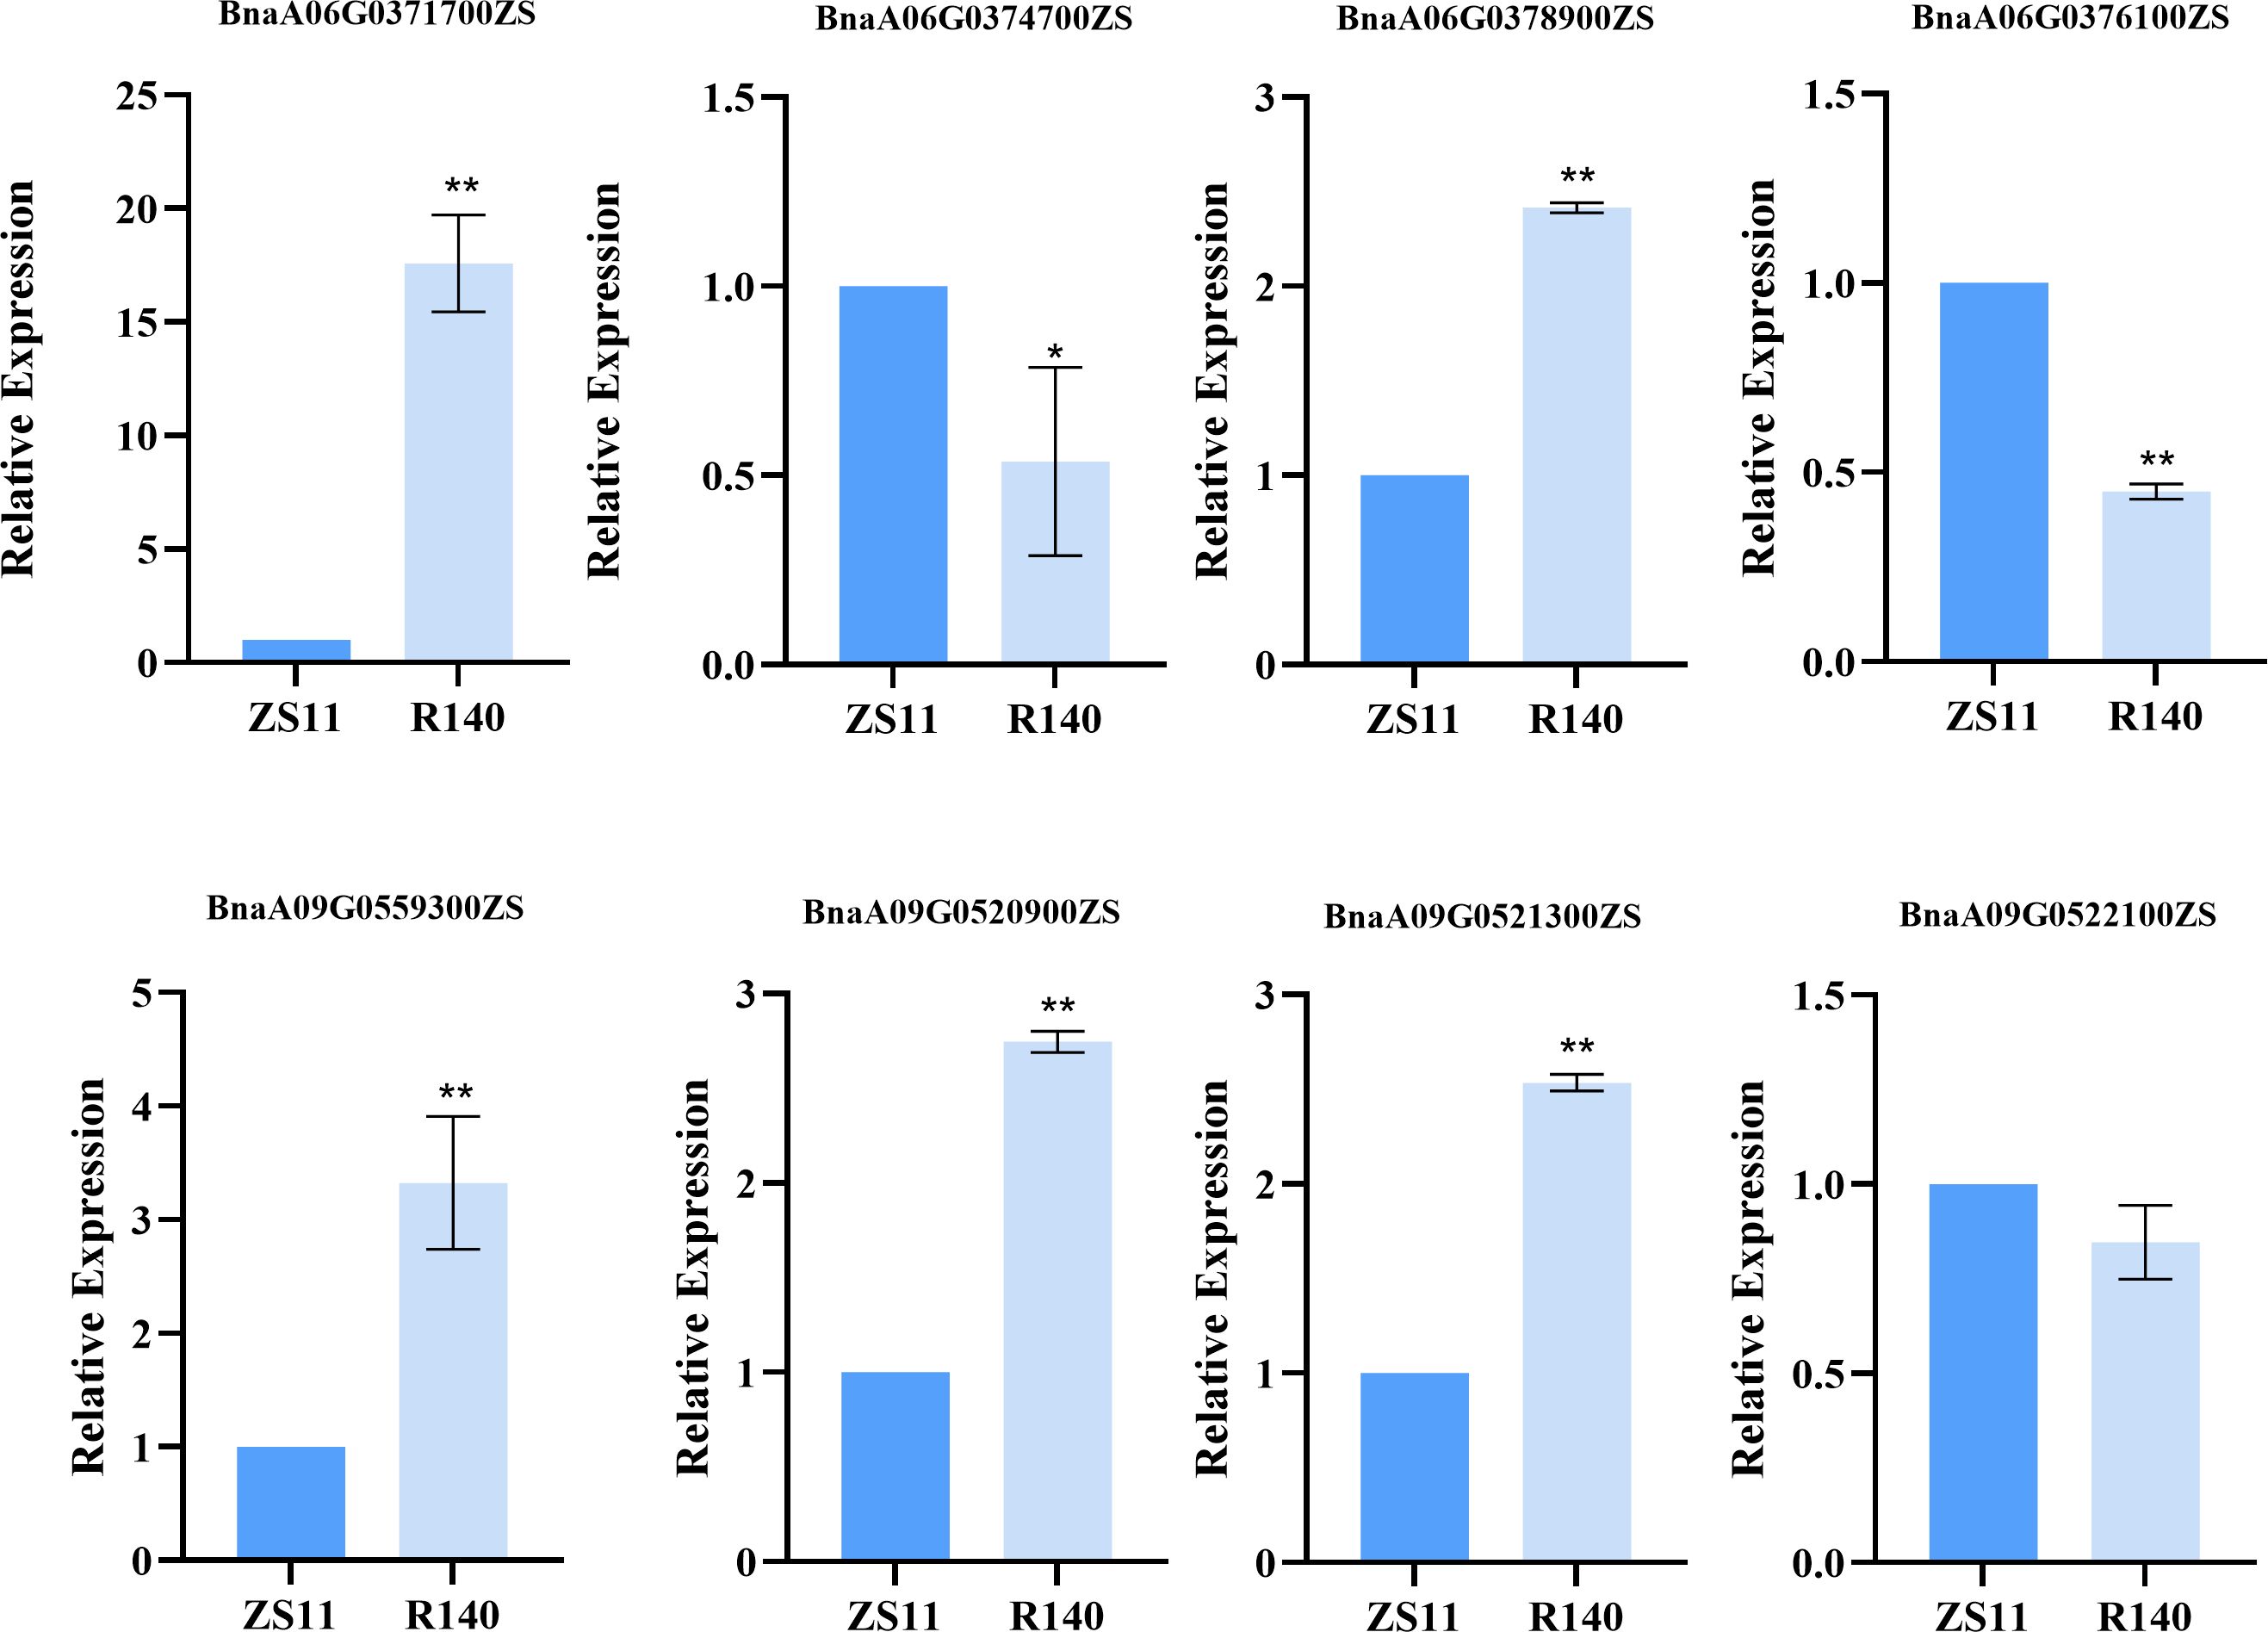
Figure 7. Relative expression of candidate genes in the R140 and Zhongshuang 11 (ZS11) as detected by qRT-PCR.
3.5 Natural variation of BnARF18 promoter sequence led to differences in expression levels
To further verify the reasons for the differential expression levels of BnARF18 gene between parents, the promoter sequence, full-length sequence, and protein sequence of the BnARF18 gene from two parents were cloned. Comparison of the parental BnARF18 promoters, proteins and full-length gene sequence showed that there were in total 21 SNPs and Indels in ARF18 promoter between ZS11 and R140 (Figure 8A), however, there was no difference in protein sequence and full-length sequence. It indicated that the differential expression level of the BnARF18 gene was caused by variations in the promoter sequence between two parents. By analyzing the functions of the promoter elements with variations, it was found that the MYC-motif, which was involved in the regulation of gene expression, and the WUN-motif, which regulated cell differentiation and proliferation, might be the key motifs that affected the difference in expression levels of BnARF18 between two parents (Figure 8B).
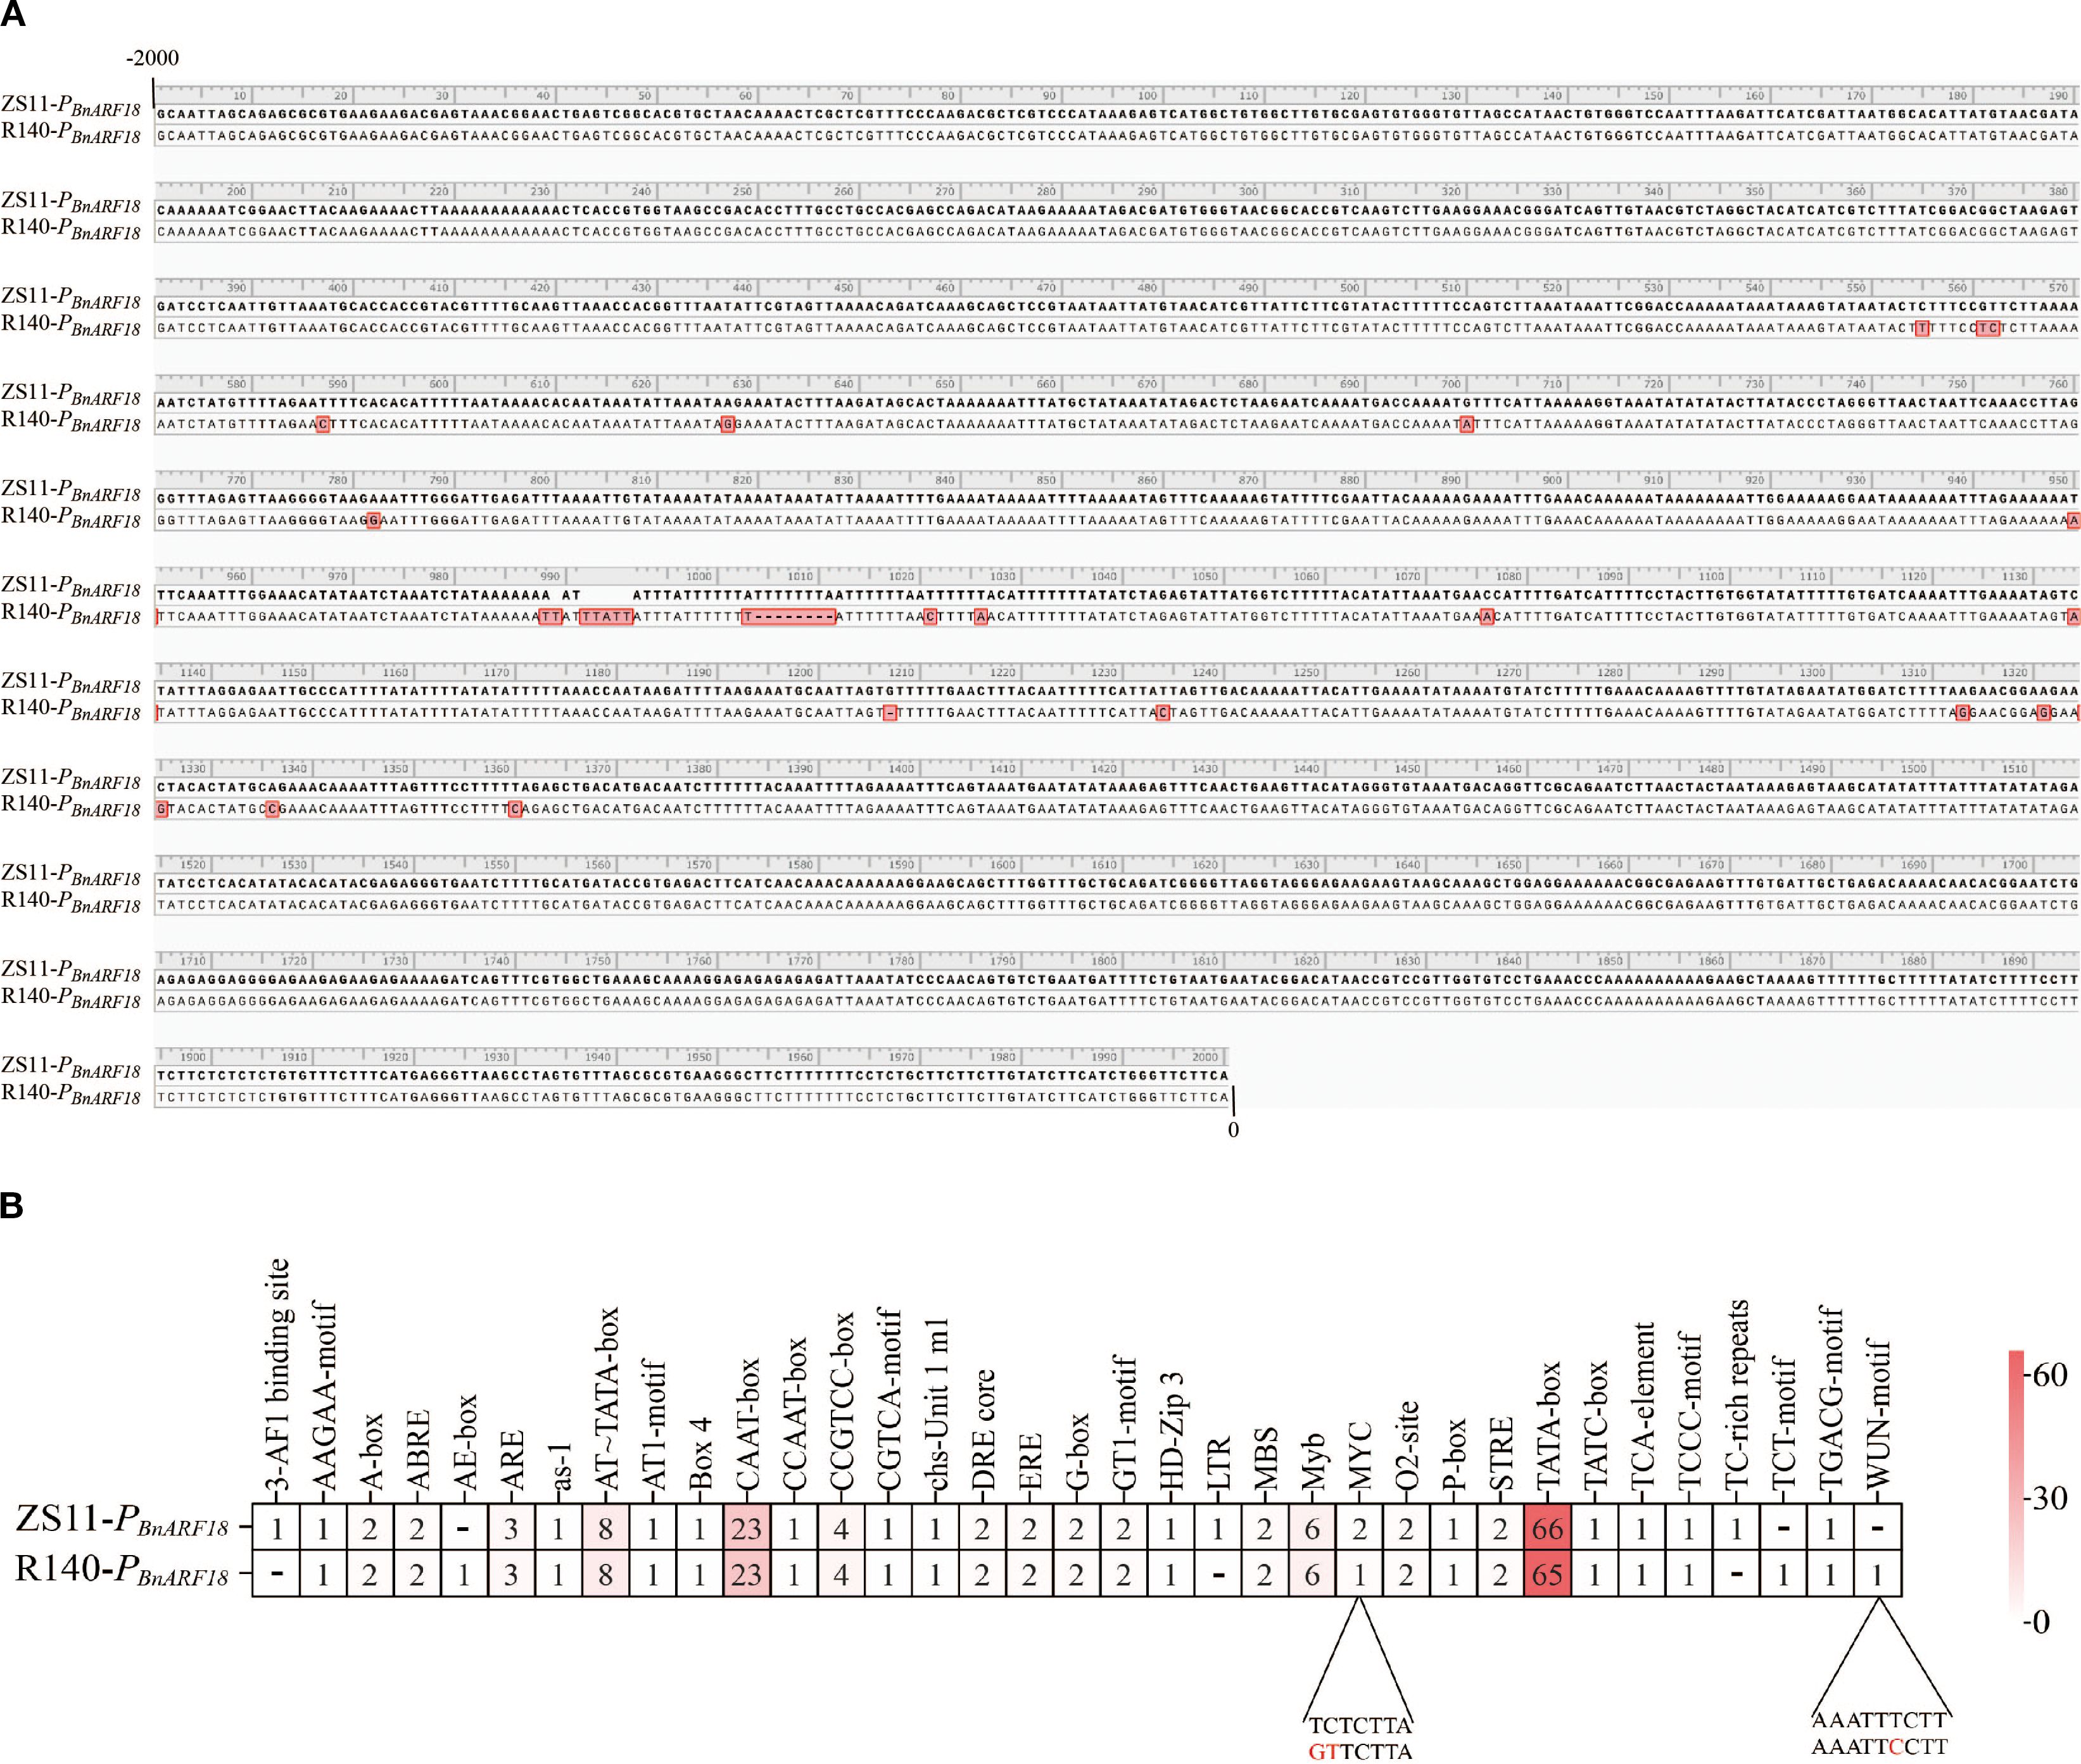
Figure 8. Comparison of promoter sequences and promoter elements of BnARF18 gene between R140 and Zhongshuang 11 (ZS11). (A) promoter sequence. (B) promoter elements with variations.
4 Discussion
Seed weight is one of the three major factors that contribute to the yield per plant (silique number per plant, seed number per silique and seed weight) in Brassica napus, and an important breeding objective. So far, although many QTLs related to seed weight have been obtained in Brassica napus, the cloning and functional research of seed weight related genes have not made breakthrough progress due to the complexity of the Brassica napus genome (AACC, allotetraploid) (Fan et al., 2010; Cai et al., 2014). To date, only a few genes, including ARF18 and BnaA9.CYP78A9, have been identified via map-based cloning (Liu et al., 2015; Shi et al., 2019). Several others, such as BnDA1, BnaC3.UPL3, BnRRF, BnEOD1, BnaWRKY10, BnUBP15, and BnaARF2, have been characterized through homology-based cloning (Wang et al., 2017; Miller et al., 2019; Hu et al., 2022; Gu et al., 2023a, b; Tian et al., 2023). Consequently, most genetic studies on seed weight in B. napus remain at the QTL level, with multiple mapping populations, including DH, F2, and RILs, consistently revealing loci for thousand-seed weight (TSW) (Fan et al., 2010; Zhang et al., 2011; Yang et al., 2012; Wang et al., 2020b; Meng et al., 2025). Genome-wide association studies (GWAS) have further identified numerous significant SNPs associated with TSW across various chromosomes (Cai et al., 2014; Li et al., 2014; Dong et al., 2018), underscoring the polygenic nature and extensive genetic variation underlying this trait. To our knowledge, some mutants that affect seed weight have been found in B. napus, such as zy72360 and R1 (Liu et al., 2015), G-42 and 7-9 (Geng et al., 2018), etc. However, in this study, R140 not only exhibited smaller seed mutations compared to ZS11, but also showed lower plant height, shorter silique and lower yield per plants. Besides, the decrease in yield per plant was mainly due to the reduction in seed weight, rather than the number of siliques per plant or the number of seeds per silique. Therefore, R140 is an excellent resource for understanding the molecular mechanism of seed weight and studying how to affect the yield of Brassica napus by regulating seed weight.
In this study, an integrated approach combining Bulked Segregant Analysis sequencing (BSA-seq) and RNA sequencing (RNA-seq) was applied to efficiently identify candidate genes regulating seed weight. In total, we screened 5 candidate genomic regions including 204 gene associated with seed weight and integrated transcriptomic data to pinpoint 21 differentially expressed genes (DEGs) within these regions. These DEGs represent high-confidence candidates for further functional validation and highlight the power of multi-omics integration in advancing the genetic dissection of complex traits in polyploid crops. The discovery of 5 seed weight related intervals provides useful molecular markers for subsequent seed weight molecular assisted breeding in Brassica napus.
Seed weight is a critical factor affecting the yield of Brassica napus. Mapping the genes related to seed weight on chromosomes can contribute to uncovering the genetic mechanism of yield and provide an important theoretical basis for high-yield Brassica napus breeding. Many studies have focused on this area, and different research findings show diverse results in the chromosomal intervals of related QTL mapping. In this study, the candidate regions for seed weight screened by BSA-seq are located on chromosomes A06, A08, A09, and C07. Among them, chromosome A09 has always been considered the chromosome where the major genes for seed weight are mainly distributed. Comparing with the results of previous studies, the first successfully cloned gene related to seed weight is ARF18 in Brassica napus, which was located on chromosome A09. The location of this gene coincided with the location of the major candidate loci of A09 in this study, and ARF18 gene was also found in the candidate region of chromosome A09 in this study (Liu et al., 2015), which was different from the regions for the thousand-seed weight trait mapped on chromosome A09 in other studies (Yang et al., 2012; Geng et al., 2016; Dong et al., 2018; Song et al., 2020). The candidate region of chromosome A07 in this study was inconsistent with the previously reported candidate region for seed weight on chromosome A07 (Raboanatahiry et al., 2018). Compared with previous research results, candidate regions on A06 and A08 in this study were two new candidate loci for seed weight. These discoveries not only expand the distribution map of Brassica napus seed weight genes on chromosomes, but also provide important theoretical bases and gene resources for in-depth analysis of the genetic mechanism of seed weight and the implementation of molecular marker-assisted breeding.
Through analysis of differentially expressed genes in the transcriptomic data and functional annotation information of genes within candidate regions, it was found that a gene belonging to the RALFs (Rapid alkalinization factors) family was identified. This multifunctional plant cytokine can rapidly induce extracellular pH elevation in plant cells, is recognized by the receptor-like kinase FER (FERONIA), and participates in various biological processes including plant growth and development, cell elongation, stress responses, and immune reactions (He et al., 2023). A reported seed weight gene ARF18 was also screened in the candidate regions by BSA-seq and RNA-seq in this study. qRT-PCR data indicated the expression level of BnARF18 in R140 was significantly increased, indicating negative regulation of seed weight, which was consistent with the previous findings by Liu et al. (2015). We compared the sequences of BnARF18 promoter, proteins and full-length gene sequence and the results showed that there were 21 SNPs and Indels in promoter, and no difference in protein sequence and full-length sequence between ZS11 and R140 (Figure 8). It indicated that the differential expression of BnARF18 was likely due to variations in the promoter, which was different from the previously reported by Liu et al. (2015) and also has not been reported in other studies before. The ARF18 gene (a seed weight gene previously validated) in small seed mutant line R1 was observed to harbor a 165-bp core fragment in its exon, which played a crucial role in homodimers formation for silique elongation in Brassica napus (Liu et al., 2015). Above all, it implied that R140 and R1 might be different variation types of the same gene associated with seed weight in Brassica napus.
Functional analysis of the polymorphic promoter elements suggested that the MYC-motif, involved in gene expression regulation, and the WUN-motif, associated with cell differentiation and proliferation (Li et al., 2024b; Siebertz et al., 1989), might be the key motifs responsible for the expression divergence between the two parents in this study. However, further study will focus on and explore which element is the functional element by truncating the BnARF18 promoter, analyzing promoter activity, and verifying the proteins that interact with its promoter and help clarify the molecular mechanisms and regulatory pathways affects seed weight by BnARF18 in the future.
Data availability statement
The datasets of BSA-seq and RNA-seq data generated during the current study are available in NCBI, Accession number: PRJNA1299313 and PRJNA1295376.
Author contributions
XG: Writing – original draft, Writing – review & editing, Conceptualization, Funding acquisition, Investigation, Methodology, Project administration, Visualization. FY: Methodology, Writing – review & editing. WT: Software, Validation, Writing – review & editing. YW: Validation, Writing – review & editing. SF: Formal Analysis, Writing – review & editing. ZY: Formal Analysis, Writing – review & editing. WC: Investigation, Writing – review & editing. LC: Conceptualization, Supervision, Writing – review & editing. XX: Data curation, Resources, Writing – review & editing.
Funding
The author(s) declare financial support was received for the research and/or publication of this article. This work was funded by the National Natural Science Foundation of China (32372033), the Natural Science Foundation of Hubei Province (2025AFB818), and the Project of Industry-Education Cooperation for Collaborative Talent Cultivation by the Ministry of Education (CXHZ24008).
Conflict of interest
The authors declare that the research was conducted in the absence of any commercial or financial relationships that could be construed as a potential conflict of interest.
Generative AI statement
The author(s) declare that no Generative AI was used in the creation of this manuscript.
Any alternative text (alt text) provided alongside figures in this article has been generated by Frontiers with the support of artificial intelligence and reasonable efforts have been made to ensure accuracy, including review by the authors wherever possible. If you identify any issues, please contact us.
Publisher’s note
All claims expressed in this article are solely those of the authors and do not necessarily represent those of their affiliated organizations, or those of the publisher, the editors and the reviewers. Any product that may be evaluated in this article, or claim that may be made by its manufacturer, is not guaranteed or endorsed by the publisher.
Supplementary material
The Supplementary Material for this article can be found online at: https://www.frontiersin.org/articles/10.3389/fpls.2025.1678464/full#supplementary-material
References
Adamski, N. M., Anastasiou, E., Eriksson, S., O’Neill, C. M., and Lenhard, M. (2009). Local maternal control of seed size by KLUH/CYP78A5-dependent growth signaling. Proc. Natl. Acad. Sci. U.S.A. 106, 20115–20120. doi: 10.1073/pnas.0907024106
Cai, D., Xiao, Y., Yang, W., Ye, W., Wang, B., Younas, M., et al. (2014). Association mapping of six yield-related traits in rapeseed (Brassica napus L.). Theor. Appl. Genet. 127, 85–96. doi: 10.1007/s00122-013-2203-9
Chen, C., Wu, Y., Li, J., Wang, X., Zeng, Z., Xu, J., et al. (2023). TBtools-II: A “one for all, all for one” bioinformatics platform for biological big-data mining. Mol Plant 16, 1733–1742. doi: 10.1016/j.molp.2023.09.010
Contreras, S., Bennett, M. A., Metzger, J. D., and Tay, D. (2008). Maternal light environment during seed development affects lettuce seed weight, germinability, and storability. HortScience 43, 845–852. doi: 10.1007/s10658-007-9256-z
Ding, G., Zhao, Z., Liao, Y., Hu, Y., Shi, L., Long, Y., et al. (2012). Quantitative trait loci for seed yield and yield-related traits, and their responses to reduced phosphorus supply in Brassica napus. Ann. Bot. 109, 747–759. doi: 10.1093/aob/mcr323
Dong, H., Tan, C., Li, Y., He, Y., Wei, S., Cui, Y., et al. (2018). Genome-wide association study reveals both overlapping and independent genetic loci to control seed weight and silique length in Brassica napus. Front. Plant Sci. 9. doi: 10.3389/fpls.2018.00921
Dong, H., Yang, L., Liu, Y., Tian, G., Tang, H., Xin, S., et al. (2023). Detection of new candidate genes controlling seed weight by integrating gene coexpression analysis and QTL mapping in Brassica napus L. Crop J. 11, 842–851. doi: 10.1016/j.cj.2022.09.009
Fan, C., Cai, G., Qin, J., Li, Q., Yang, M., Wu, J., et al. (2010). Mapping of quantitative trait loci and development of allele-specific markers for seed weight in Brassica napus. Theor. Appl. Genet. 121, 1289–1301. doi: 10.1007/s00122-010-1388-4
Fang, Y., Liu, H., Qin, L., Qi, F., Sun, Z., Wu, J., et al. (2023). Identification of QTL for kernel weight and size and analysis of the pentatricopeptide repeat (PPR) gene family in cultivated peanut (Arachis hypogaea L.). BMC Genomics 24, 495. doi: 10.1186/s12864-023-09568-y
Ford, B. A., Ernest, J. R., and Gendall, A. R. (2012). Identification and characterization of orthologs of AtNHX5 and AtNHX6 in Brassica napus. Front. Plant Sci. 3. doi: 10.3389/fpls.2012.00208
Gao, W., Ma, R., Li, X., Liu, J., Jiang, A., Tan, P., et al. (2024). Construction of genetic map and QTL mapping for seed size and quality traits in soybean (Glycine max L.). Int. J. Mol. Sci. 25, 2857. doi: 10.3390/ijms25052857
Garcia, D., Fitz Gerald, J. N., and Berger, F. (2005). Maternal control of integument cell elongation and zygotic control of endosperm growth are coordinated to determine seed size in Arabidopsis. Plant Cell 17, 52–60. doi: 10.1105/tpc.104.027136
Geng, X., Dong, N., Wang, Y., Li, G., Wang, L., Guo, X., et al. (2018). RNA-seq transcriptome analysis of the immature seeds of two Brassica napus lines with extremely different thousand-seed weight to identify the candidate genes related to seed weight. PloS One 13, e0191297. doi: 10.1371/journal.pone.0191297
Geng, X., Jiang, C., Yang, J., Wang, L., Wu, X., and Wei, W. (2016). Rapid identification of candidate genes for seed weight using the SLAF-seq method in Brassica napus. PloS One 11, e0147580. doi: 10.1371/journal.pone.0147580
Geritz, S. A., van der Meijden, E., and Metz, J. A. (1999). Evolutionary dynamics of seed size and seedling competitive ability. Theor. Popul Biol. 55, 324–343. doi: 10.1006/tpbi.1998.1409
Goettel, W., Zhang, H., Li, Y., Qiao, Z., Jiang, H., Hou, D., et al. (2022). POWR1 is a domestication gene pleiotropically regulating seed quality and yield in soybean. Nat. Commun. 13, 3051. doi: 10.1038/s41467-022-30314-7
Grant, I. and Beversdorf, W. D. (1985). Heterosis and combining ability estimates in spring-planted oilseed rape (Brassica napus L.). Genome 27, 472–478. doi: 10.1139/g85-069
Gu, J., Chen, J., Xia, J., and Hong, D. (2023a). BnaUBP15s positively regulates seed size and seed weight in Brassica napus. Oil Crop Sci. 8, 149–155. doi: 10.1016/j.ocsci.2023.07.002
Gu, J., Chen, J., Zhao, C., and Hong, D. (2023b). Mutating BnEOD1s via CRISPR-Cas9 increases the seed size and weight in Brassica napus. Mol. Breed 43, 79. doi: 10.1007/s11032-023-01430-z
He, Y. H., Chen, S. Y., Chen, X. Y., Xu, Y. P., Liang, Y., and Cai, X. Z. (2023). RALF22 promotes plant immunity and amplifies the Pep3 immune signal. J. Integr. Plant Biol. 65, 2519–2534. doi: 10.1111/jipb.13566
Hu, J., Chen, B., Zhao, J., Zhang, F., Xie, T., Xu, K., et al. (2022). Genomic selection and genetic architecture of agronomic traits during modern rapeseed breeding. Nat. Genet. 54, 694–704. doi: 10.1038/s41588-022-01055-6
Ishaq, M., Khan, S. A., and Razi, R. (2017). Unraveling the inheritance pattern of yield and associated traits in rapeseed (Brassica napus L.). Acta Physiologiae Plantarum 39, 47. doi: 10.1007/s11738-016-2328-y
Karikari, B., Chen, S., Xiao, Y., Chang, F., Zhou, Y., Kong, J., et al. (2019). Utilization of interspecific high-density genetic map of RIL population for the QTL detection and candidate gene mining for 100-seed weight in soybean. Front. Plant Sci. 10. doi: 10.3389/fpls.2019.01001
Kumar, A., Daware, A., Kumar, A., Kumar, V., Gopala, K. S., Mondal, S., et al. (2020). Genome-wide analysis of polymorphisms identified domestication-associated long low-diversity region carrying important rice grain size/weight quantitative trait loci. Plant J. 103, 1525–1547. doi: 10.1111/tpj.14845
Lei, S., Chen, L., Liang, F., Zhang, Y., Zhang, C., Xiao, H., et al. (2024). Identification of a major QTL and candidate genes analysis for branch angle in rapeseed (Brassica napus L.) using QTL-seq and RNA-seq. Front. Plant Sci. 15. doi: 10.3389/fpls.2024.1340892
Li, N., Shi, J., Wang, X., Liu, G., and Wang, H. (2014). A combined linkage and regional association mapping validation and fine mapping of two major pleiotropic QTLs for seed weight and silique length in rapeseed (Brassica napus L.). BMC Plant Biol. 14, 114. doi: 10.1186/1471-2229-14-114
Li, Z., Huang, Y., Shen, Z., Wu, M., Huang, M., Hong, S. B., et al. (2024b). Advances in functional studies of plant MYC transcription factors. Theor. Appl. Genet. 137, 195. doi: 10.1007/s00122-024-04697-8
Li, H., Wang, Y., Qiao, W., Zhu, Z., Wang, Z., Tian, Y., et al. (2024a). Identification of a novel locus qgw12/ospub23 regulating grain shape and weight in rice (Oryza satival.). Theor. Appl. Genet. 137, 12. doi: 10.1007/s00122-024-04776-w
Li, N., Xu, R., and Li, Y. (2019). Molecular networks of seed size control in plants. Annu. Rev. Plant Biol. 70, 435–463. doi: 10.1146/annurev-arplant-050718-095851
Li, Z., Zhang, X., Zhao, K., Zhao, K., Qu, C., Gao, G., et al. (2021). Comprehensive transcriptome analyses reveal candidate genes for variation in seed size/weight during peanut (Arachis hypogaea L.) domestication. Front. Plant Sci. 12. doi: 10.3389/fpls.2021.666483
Liu, J., Hua, W., Hu, Z., Yang, H., Zhang, L., Li, R., et al. (2015). Natural variation in ARF18 gene simultaneously affects seed weight and silique length in polyploid rapeseed. Proc. Natl. Acad. Sci. U.S.A. 112, E5123–E5132. doi: 10.1073/pnas.1502160112
Liu, M., Tan, X., Yang, Y., Liu, P., Zhang, X., Zhang, Y., et al. (2020). Analysis of the genetic architecture of maize kernel size traits by combined linkage and association mapping. Plant Biotechnol. J. 18, 207–221. doi: 10.1111/pbi.13188
Lu, C., Napier, J. A., Clemente, T. E., and Cahoon, E. B. (2011). New frontiers in oilseed biotechnology: Meeting the global demand for vegetable oils for food, feed, biofuel, and industrial applications. Curr. Opin. Biotechnol. 22, 252–259. doi: 10.1016/j.copbio.2010.11.006
Meng, J., Hu, D., Wang, B., Zhu, Y., Lu, C., Deng, Y., et al. (2025). Fine mapping and candidate gene analysis of the major QTL qSW-A03 for seed weight in Brassica napus. Theor. Appl. Genet. 138, 76. doi: 10.1007/s00122-025-04866-3
Miller, C., Wells, R., McKenzie, N., Trick, M., Ball, J., Fatihi, A., et al. (2019). Variation in expression of the HECT E3 ligase UPL3 modulates LEC2 levels, seed size, and crop yields in brassica napus. Plant Cell 31, 2370–2385. doi: 10.1105/tpc.18.00577
Qing, Y., Li, Y., Xu, L., and Ma, Z. (2021). Screen oilseed rape (Brassica napus) suitable for low-loss mechanized harvesting. Agriculture 11, 504. doi: 10.3390/agriculture11060504
Raboanatahiry, N., Chao, H., Dalin, H., Pu, S., Yan, W., Yu, L., et al. (2018). QTL alignment for seed yield and yield related traits in Brassica napus. Front. Plant Sci. 9. doi: 10.3389/fpls.2018.01127
Rana, D., van den Boogaart, T., O’Neill, C. M., Hynes, L., Bent, E., Macpherson, L., et al. (2004). Conservation of the microstructure of genome segments in Brassica napus and its diploid relatives. Plant J. 40, 725–733. doi: 10.1111/j.1365-313X.2004.02244.x
Shi, L., Song, J., Guo, C., Wang, B., Guan, Z., Yang, P., et al. (2019). A CACTA-like transposable element in the upstream region of BnaA9.CYP78A9 acts as an enhancer to increase silique length and seed weight in rapeseed. Plant J. 98, 524–539. doi: 10.1111/tpj.14236
Siebertz, B., Logemann, J., Willmitzer, L., and Schell, J. (1989). cis-analysis of the wound-inducible promoter wun1 in transgenic tobacco plants and histochemical localization of its expression. Plant Cell 1, 961–968. doi: 10.1105/tpc.1.10.961
Song, J. M., Guan, Z., Hu, J., Guo, C., Yang, Z., Wang, S., et al. (2020). Eight high-quality genomes reveal pan-genome architecture and ecotype differentiation of Brassica napus. Nat. Plants 6, 34–45. doi: 10.1038/s41477-019-0577-7
Tian, X., Yu, X., Wang, Z., Guo, L., Tu, J., Shen, J., et al. (2023). BnaMPK3s promote organ size by interacting with BnaARF2s in Brassica napus. Plant Biotechnol. J. 21, 899–901. doi: 10.1111/pbi.14013
Wang, Z., Dhakal, S., Cerit, M., Wang, S., Rauf, Y., Yu, S., et al. (2022). QTL mapping of yield components and kernel traits in wheat cultivars TAM 112 and Duster. Front. Plant Sci. 13. doi: 10.3389/fpls.2022.1057701
Wang, L., Jiang, X., Wang, L., Wang, W., Fu, C., Yan, X., et al. (2019). A survey of transcriptome complexity using PacBio single-molecule real-time analysis combined with Illumina RNA sequencing for a better understanding of ricinoleic acid biosynthesis in Ricinus communis. BMC Genomics 20, 456. doi: 10.1186/s12864-019-5832-9
Wang, Y., Lu, H., Liu, X., Liu, L., Zhang, W., Huang, Z., et al. (2024b). Identification of yellow seed color genes using bulked segregant RNA sequencing in Brassica juncea L. Int. J. Mol. Sci. 25, 1573. doi: 10.3390/ijms25031573
Wang, J. L., Tang, M. Q., Chen, S., Zheng, X. F., Mo, H. X., Li, S. J., et al. (2017). Down-regulation of BnDA1, whose gene locus is associated with the seeds weight, improves the seeds weight and organ size in Brassica napus. Plant Biotechnol. J. 15, 1024–1033. doi: 10.1111/pbi.12696
Wang, X., Yan, W., Real, N., Jia, Y., Fu, Y., Zhang, X., et al. (2024a). Metabolic, transcriptomic, and genetic analyses of candidate genes for seed size in watermelon. Front. Plant Sci. 15. doi: 10.3389/fpls.2024.1394724
Wang, H., Yan, M., Xiong, M., Wang, P., Liu, Y., Xin, Q., et al. (2020b). Genetic dissection of thousand-seed weight and fine mapping of cqSW.A03-2 via linkage and association analysis in rapeseed (Brassica napus L.). Theor. Appl. Genet. 133, 1321–1335. doi: 10.1007/s00122-020-03553-9
Wang, Y., Yang, Z., Xing, M., Huang, J., Ding, Y., Zhang, L., et al. (2023). A novel QTL GL12 from wild rice increases grain length and weight in cultivated rice. Plant Biotechnol. J. 21, 1513–1515. doi: 10.1111/pbi.14014
Wang, G., Zhao, Y., Mao, W., Ma, X., and Su, C. (2020a). QTL analysis and fine mapping of a major QTL conferring kernel size in maize (Zea mays). Front. Genet. 11. doi: 10.3389/fgene.2020.603920
Wu, Z. T., Xu, F., Yu, L. L., Ouyang, Y., and Geng, X. X. (2021). Transcriptome analysis of developing castor bean seeds and identification of ricinoleic acid biosynthesis genes. Biol. Plant 65, 273–282. doi: 10.32615/bp.2021.033
Xiao, Y., Sun, Q., Kang, X., Chen, C., and Ni, M. (2016). SHORT HYPOCOTYL UNDER BLUE1 or HAIKU2 mixepression alters canola and Arabidopsis seed development. New Phytol. 209, 636–649. doi: 10.1111/nph.13632
Xu, M., Kong, K., Miao, L., He, J., Liu, T., Zhang, K., et al. (2023). Identification of major quantitative trait loci and candidate genes for seed weight in soybean. Theor. Appl. Genet. 136, 22. doi: 10.1007/s00122-023-04299-w
Yang, H., Luo, L., Li, Y., Li, H., Zhang, X., Zhang, K., et al. (2023). Fine mapping of qAHPS07 and functional studies of AhRUVBL2 controlling pod size in peanut (Arachis hypogaea L.). Plant Biotechnol. J. 21, 1785–1798. doi: 10.1111/pbi.14076
Yang, P., Shu, C., Chen, L., Xu, J., Wu, J., and Liu, K. (2012). Identification of a major QTL for silique length and seed weight in oilseed rape (Brassica napus L.). Theor. Appl. Genet. 125, 285–296. doi: 10.1007/s00122-012-1833-7
Yang, B., Yang, L., Kang, L., You, L., Chen, H., Xiao, H., et al. (2024). Integrated analysis of BSA-seq and RNA-seq identified the candidate genes for seed weight in Brassica juncea. Front. Plant Sci. 15. doi: 10.3389/fpls.2024.1458294
Ye, S., Yan, L., Ma, X., Chen, Y., Wu, L., Ma, T., et al. (2022a). Combined BSA-seq based mapping and RNA-seq profiling reveal candidate genes associated with plant architecture in brassica napus. Int. J. Mol. Sci. 23, 2472. doi: 10.3390/ijms23052472
Ye, S., Yang, J., Huang, Y., Liu, J., Ma, X., Zhao, L., et al. (2022b). Bulk segregant analysis-sequencing and RNA-Seq analyses reveal candidate genes associated with albino phenotype in Brassica napus. Front. Plant Sci. 13. doi: 10.3389/fpls.2022.994616
Yu, Z., Fredua-Agyeman, R., Strelkov, S. E., and Hwang, S.-F. (2024). RNA-Seq Bulked Segregant Analysis of an Exotic B. napus ssp. napobrassica (Rutabaga) F2 Population Reveals Novel QTLs for Breeding Clubroot-Resistant Canola. Int. J. Mol. Sci. 25, 4596. doi: 10.3390/ijms25094596
Zeng, Z., Zhao, D., Wang, C., Yan, X., Song, J., Chen, P., et al. (2023). QTL cluster analysis and marker development for kernel traits based on DArT markers in spring bread wheat (Triticum aestivum L.). Front. Plant Sci. 14. doi: 10.3389/fpls.2023.1072233
Zhang, J., Wu, Z., Hu, F., Liu, L., Huang, X., Zhao, J., et al. (2018). Aberrant seed development in Litchi chinensis is associated with the impaired expression of cell wall invertase genes. Hortic. Res. 5, 39. doi: 10.1038/s41438-018-0042-1
Zhang, L., Yang, G., Liu, P., Hong, D., Li, S., and He, Q. (2011). Genetic and correlation analysis of silique-traits in Brassica napus L. by quantitative trait locus mapping. Theor. Appl. Genet. 122, 21–31. doi: 10.1007/s00122-010-1419-1
Zhang, J., Zhang, X., Liu, X., Pai, Q., Wang, Y., and Wu, X. (2023). Molecular network for regulation of seed size in plants. Int. J. Mol. Sci. 24, 10666. doi: 10.3390/ijms241310666
Keywords: seed weight, Brassica napus, BSA-seq, RNA-seq, candidate genes
Citation: Geng X, Yang F, Tang W, Wang Y, Fu S, Yu Z, Cheng W, Chen L and Xue X (2025) Combined BSA-seq and RNA-seq approaches reveal candidate genes associated with seed weight in Brassica napus. Front. Plant Sci. 16:1678464. doi: 10.3389/fpls.2025.1678464
Received: 02 August 2025; Accepted: 01 September 2025;
Published: 16 September 2025.
Edited by:
Guoxiang Jiang, Chinese Academy of Sciences (CAS), ChinaReviewed by:
Haixu Chen, Nanjing Agricultural University, ChinaYanling Li, Sichuan Academy of Agricultural Sciences, China
Copyright © 2025 Geng, Yang, Tang, Wang, Fu, Yu, Cheng, Chen and Xue. This is an open-access article distributed under the terms of the Creative Commons Attribution License (CC BY). The use, distribution or reproduction in other forums is permitted, provided the original author(s) and the copyright owner(s) are credited and that the original publication in this journal is cited, in accordance with accepted academic practice. No use, distribution or reproduction is permitted which does not comply with these terms.
*Correspondence: Liang Chen, Y2hsaWFuZzY2NkBhbGl5dW4uY29t; Xiaomeng Xue, eHhtMTk5MUBoYm51LmVkdS5jbg==