 Zicong Liang1
 Nianhua Qi1Ruoning Li1Ruijia Gao1Ruichao Guo1Jiayi Li1Yutong Han1Nan Xie2Wei Zhao1
 Xingdong Yao1*Futi Xie1*
- 1College of Agriculture, Shenyang Agricultural University, Shenyang, China
- 2College of Agriculture, Agriculture School of Liaodong University, Dandong, China
Soybean (Glycine max [L.] Merr.) is a crop characterized by rich content of oil and protein in seeds, enhancing both yield and quality is considered a pressing challenge in current soybean research and production. Soybean yield is determined by individual traits, including seed number per plant, seed weight per plant, pod number per plant, pod weight per plant and 100−seed weight. Here, 338 resequenced soybean varieties (or lines) were evaluated under two planting densities for five pod−related traits. Substantial variation was detected among the 338 accessions under both densities, and all phenotypic traits followed a normal distribution. A total of 47 and 56 significant SNPs were identified respectively under high and low planting densities through genome−wide association studies (GWAS). Among them, eight SNPs were repeatedly detected across at least two planting densities or environments, and were significantly associated with the seed number per plant (SNPP), seed weight per plant (SWPP) and 100−seed weight (HSW). Based on linkage disequilibrium (LD) analysis, haplotype analysis, gene functional annotation, and qRT−PCR validation, Glyma.20G116200 and Glyma.13G162800 were identified as key genes associated with HSW and SNPP, respectively. Based on this, a KASP marker, S20_35808042 (G/C), was developed and successfully validated in 97 soybean accessions. In summary, these findings hold substantial value for soybean improvement, providing new insights into the genetic architecture of pod−related traits and establishing a conceptual foundation for marker−based selection in breeding programs.
1 Introduction
Soybean (Glycine max [L.] Merr.) is regarded as one of the most important economic and oilseed crops and is widely cultivated worldwide due to its rich seed content of oil and protein (Hina et al., 2022) (https://soystats.com, accessed on 1 July 2025), Statistics show that the global average yield increase of soybean is slowing down and remains much lower than maize and wheat (Bhat et al., 2025). Therefore, improving soybean yield and quality remains a critical challenge in current crop production and breeding efforts. Seed yield and its component traits in soybean represent complex quantitative characteristics governed by multiple genes and strongly affected by environmental factor (Qi et al., 2014). Soybean yield is determined by several individual traits, including seed number per plant, seed weight per plant, pod number per plant, pod weight per plant and 100−seed weight (Wang et al., 2024). Soybean breeders aim to maximize the use and improvement of these traits to enhance overall yield. Planting density is also recognized as a critical agronomic variable that significantly affects dry matter accumulation and yield in field crops (Friedman et al., 2024). Increasing planting density can improve the efficiency of canopy light interception; however, excessive density intensifies inter−plant competition, leading to lodging and reduced per−plant yield, ultimately limiting total productivity. Therefore, identifying an optimal balance between planting density and pod−related traits in soybean is essential for enhancing productivity and remains a pressing issue in current agricultural studies (Zhang et al., 2015).
A considerable number of investigations involving the construction of genetic linkage maps have dissected the genetic architecture of pod−related traits, aiming to identify quantitative trait loci (QTLs) associated with these traits using both bi−parental and multi−parental populations in soybean (Su et al., 2019; Luo et al., 2022; Han et al., 2012). Previous studies have demonstrated that, under varying planting densities, the number of pods and seeds per plant, seed size, and seed weight are significantly associated with soybean yield (Bianchi et al., 2020; Kitabatake et al., 2020). The coordinated regulation of these traits is regarded as a key physiological basis for yield determination. To date, SoyBase has recorded over 500 quantitative trait loci (QTLs) that are linked to pod-relates traits in soybean, and they are distributed across all 20 soybean chromosomes. In a previous study, a population of 207 F2:3 progenies developed from a cross between Brazilian cultivar CS3035P−TA276−1−5−2 and UFVS2012 was used for QTL mapping of yield−related traits (Rodrigues et al., 2016). A total of 30 QTLs significantly associated with pod-related traits were identified using composite interval mapping, and 4 QTLs displaying additive effects were subsequently utilized in marker−assisted selection (MAS) programs. Another study reported that a recombinant inbred line (RIL) population developed from the hybridization of PI595843 (PI) and WH was utilized, leading to the identification of 38 QTLs significantly linked to 100-seed weight, including four major−effect QTLs (Xu et al., 2023). Golestan Hashemi et al. (2018) employed a RIL population comprising 147 lines derived from the hybridization of the U.S. cultivar Charleston and the Chinese cultivar Dongnong 594, was employed to detect two QTLs with significant correlations to seed weight per plant. In addition, four candidate genes were identified on chromosome 1. However, these genes responsible for these QTLs, as well as the biological pathways through which they influence yield-related characteristics, are still not well understood. With the advancement of genomic analysis technologies, genome−wide association studies enable precise localization of causal genes by leveraging extensive natural variation and high−density SNP markers. Zhang et al. conducted a GWAS using a soybean panel of 1,714 accessions and identified 35 stable association signals significantly related to 100−seed weight (HSW). In addition, a stable QTL hotspot, qSW17.1, was detected on chromosome 17 (Zhang et al., 2024). In another previous study, researchers identified four novel QTLs significantly associated with four yield−related traits, based on an association panel comprising 211 soybean varieties. In addition, several haplotype alleles were revealed to contribute to the phenotypic variation of these traits (Bhat et al., 2022).
In soybean, multiple pivotal genes associated with pod-related traits, such as GmKIX8−1, PP2C−1, and SW16.1, have been successfully cloned (Nguyen et al., 2021; Lu et al., 2017; Chen et al., 2023). Nguyen et al. (2021) identified GmKIX8−1 as a major−effect gene underlying a key QTL for HSW, using a forward genetics approach combined with CRISPR/Cas9 gene editing technology. Up to now, genome-wide association analyses have facilitated the discovery and functional validation of multiple genes involved in soybean yield-related traits, including GmSWEET10a, GmST05, and GmGA30ox (Li et al., 2024; Duan et al., 2022; Hu et al., 2022). For instance, GmST05 enhances seed size and contributes to yield improvement by influencing the expression level of GmSWEET10a, which in turn alters the oil and protein composition of seeds (Duan et al., 2022). These genes participate in multiple signaling pathways, such as plant hormone signaling and transcriptional regulation, which help elucidate the molecular mechanisms underlying yield formation. However, the genetic mechanisms of the interactions among pod−related traits remain poorly understood.
Therefore, this research was conducted to clarify the genetic architecture underlying pod−related traits in soybean, to explore the genetic variation among these traits, and to identify genes and molecular markers that facilitate genetic enhancement of yield-related characteristics in soybean. A natural population of 338 soybean accessions originating from similar latitudes were used to minimize the environmental effects caused by latitude−related variation in growth and development. The population was planted at a single location with consistent latitude under two planting density conditions (150,000 and 300,000 plants/ha) to simulate ecological environments under current high−density cultivation trends. were performed for five pod-related traits within this population. We integrated genome-wide association mapping with haplotype analysis and qRT–PCR analysis to identify candidate loci and genes, and developed KASP molecular markers accordingly. These results provide important implications for advancing molecular breeding strategies and evolutionary research of high−yield soybean cultivars. They facilitate the discovery of molecular markers linked to pods−related traits and promote practical application of breeding strategies for yield improvement in soybean.
2 Materials and methods
2.1 Plant material and phenotypic analysis
To minimize the potential impacts of cross−latitude germplasm introduction on soybean growth, development, and lodging resistance, a natural population consisting of 338 soybean germplasm resources was established (Supplementary Table S4). This population primarily included varieties (lines) bred in different eras in Liaoning Province, supplemented with partial varieties introduced from Japan and the United States at similar latitudes. Two planting densities were set: low and high (150,000 and 300,000 plants/ha), which were used in the materials and methods section of the research. In 2022 and 2023, all soybean accessions were cultivated at three experimental sites affiliated with Shenyang Agricultural University, located in Liaoning Province, Shenyang (E1_HD/LD: SH 2022; E2_HD/LD: SH 2023, N41°82’,E 123°57’), Hunnan District (E3_HD/LD: 2023HN, N 41°75’,E 123°69’), and Pulandian District, Dalian (E4_HD/LD:2023DL,N 39°54’,E 122°20’). Manual thinning was performed at the V2 growth stage to ensure appropriate plant density. The soil type at all three locations was loam. All field trials were managed according to standard agronomic practices, with consistent soil types and nutrient management strategies implemented across the three experimental sites.
At the maturity stage (R8), four individual soybean plants were selected randomly from each plot. Five pod−related traits were measured: PNPP (pod number per plant): The number of valid pods per plant was determined by manual counting. SNPP (seed number per plant): The number of well-developed seeds per plant was determined by manual counting after threshing. HSW (100−seed weight): A random sample of 100 seeds from the bulk harvest of each genotype was weighed. PWPP (pod weight per plant) and SWPP (seed weight per plant): Pod dry weight per plant (before threshing) and seed dry weight per plant (after threshing).Each soybean accession was evaluated using four biological replicates in the experimental setup.
2.2 Whole−genome re−sequencing and SNP calling
In 2022, young leaves from 338 soybean genotypes were flash-frozen with liquid nitrogen and pulverized to break cell structures, after which genomic DNA was isolated from the resulting homogenate employing the CTAB extraction technique (Carey et al., 2023). DNA libraries were prepared with the MGIEasy Universal DNA Library Prep Kit V1.0 (Product No.: 1000005250; MGI, Shenzhen, China) and sequenced on the BGISEQ–T7 platform (Liu et al., 2020; Zhou et al., 2019)). Raw reads were filtered to remove those containing >10% ambiguous bases (N) or a Phred quality score <10. High−quality reads were mapped to the Glycine max Wm82.a2.v1 reference genome using BWA (v0.7.17) (Li and Durbin, 2010). Variant calling was performed using BCFtools (v1.12), SNPs with a missing data rate below 15% and a minor allele frequency (MAF) greater than 0.05 were retained, and genotype imputation was subsequently performed using Beagle (v5.1), yielding a final dataset of 4,432,394 SNPs for downstream analyses.
2.3 Genome−wide association study
The 4,432,394 high-quality SNPs were analyzed against the Best Linear Unbiased Predictors (BLUPs) computed from the multi-environment phenotypic data using the Efficient Mixed-Model Association eXpedited (EMMAX) software (version: 20120205) to detect significant marker-trait associations. BLUPs were estimated using a mixed model with genotype as a random effect, while accounting for the fixed effects of environment and replication block. GWAS were performed using a mixed linear model (MLM) incorporating the population structure matrix (Q) and kinship matrix (K), with all other parameters set to default values. “Principal component analysis (PCA) was performed using PLINK (v1.9) to calculate the first 20 principal components for the experimental population. Significance testing for each principal component was conducted using the twtable algorithm implemented in EIGENSOFT(v7.2.1). The top two principal components showing significant population stratification (P < 0.05) were selected as covariates for downstream analyses. A kinship matrix was generated using EMMAX (v20120205) based on genome-wide SNP data, with genetic relatedness between samples estimated using the Balding-Nichols model. The mean values of the four single plants for each trait in soybean accession were used for the association mapping for this experiment. A significance threshold of −log10(P) = 5.0 was set, and the results were graphically represented using Manhattan and Q–Q plots.
2.4 Screening and prediction of candidate genes and haplotype analysis
Haplotype identification was performed through an integrated approach combining linkage disequilibrium (LD) decay analysis with sliding−window scanning. Fixed physical−distance sliding windows were implemented with 100−kb window size and 50−kb step length. The selected window size was informed by the average linkage disequilibrium (LD) decay distance of 50 kb estimated among the 338 soybean genotypes (Liang et al., 2025). Single nucleotide polymorphisms (SNPs) showing significant associations within a 100 kb chromosomal span were clustered into a single physical region for further analysis. The single nucleotide polymorphism (SNP) exhibiting the maximum −log10(P) value was designed as the peak locus, and a 100 kb window (50 kb upstream and 50 kb downstream) around this peak was defined as the confidence interval. Haplotype block partitioning was performed using LDBlockShow software (v1.4), analyzing all SNPs within ± 50 kb regions centered on peak SNP positions. All SNPs located between the 5’ and 3’ untranslated regions (UTRs) of genes within the candidate intervals are retrieved from the resequencing dataset. For haplotype analysis, SNPs within the coding sequence (CDS) region of the target gene are extracted using Excel software, based on the same VCF file employed in the GWAS analysis.
2.5 qRT−PCR analysis
Two soybean cultivars were selected as experimental materials: Liaodou 11 (LD 11), which has a relatively large 100−seed weight (average HSW of 22.02 g over two years), and Shennong 12 (SN 12), which has a relatively small 100−seed weight (average HSW of 15.80 g over two years). Fresh seeds were collected at the R6 stage. Total RNA was extracted employing the RNAprep Pure Plant Plus Kit (Tiangen Biotech, Beijing, China), followed by reverse transcription and quantitative PCR (qRT-PCR) analysis. All primer sequences (Supplementary Table S5) were designed using NCBI’s Primer-BLAST tool (https://www.ncbi.nlm.nih.gov/tools/primer-blast/). The internal reference gene Actin was utilized as the internal control, and relative expression levels were calculated using the 2−ΔΔCt method. Each biological sample was analyzed in triplicate with three independent replicates.
2.6 Development of KASP marker
Three allele−specific primers (F1, F2, and R) were designed for the KASP marker site S20_35808042. The KASP−PCR primers were designed using Primer3 software, with melting temperatures (Tm) ranging from 55°C to 65°C (Supplementary Table S6). Marker validation and sample detection were carried out using the HCSCI (HanchenGuangyi) system. PCR amplification was performed in a Matrix Cycler high−throughput thermocycler, and fluorescence signals were detected with the Matrix Scanner. SNP genotyping was conducted on the HCSCI Master platform based on the criteria of clear genotype clustering and the absence of specific amplification in the no−template control (NTC).
2.7 Data analysis
Statistical analyses were conducted using IBM SPSS Statistics 26.0 (SPSS, Inc., Chi-cago, IL, USA) and R software. For each agronomic characteristic, the mean, standard deviation (SD), and coefficient of variation (CV) were calculated using Microsoft Excel (Microsoft Corporation, Redmond, WA, USA). Best linear unbiased predictions (BLUPs) for each trait were estimated using the lme4 package (v1.1−35) in R (Bates et al., 2015). For multi−environment data, observed phenotypic values were used directly, with location, year, and individual sample treated as random effects in the model. Correlation analysis, Manhattan plots, and Q–Q plots were visualized using the R packages GGally v2.2.1 and CMplot v3.8.1, respectively. Expression profiles of soybean genes across different tissues were retrieved from the Phytozome database, and heatmaps of candidate genes in target regions were generated using GraphPad Prism (v10.0.1). Phenotypic variation across haplotypes was analyzed by one−way ANOVA in IBM SPSS Statistics 27, with results visualized using box plots in GraphPad Prism (v10.0.1).
3 Results
3.1 Phenotypic variation of soybean pods−related traits under different planting densities
Pod−related phenotypes of 338 soybean accessions were evaluated across 3 environments over 2 years. Descriptive statistics and frequency distributions are presented in Supplementary Table S1. Based on BLUP values, under high planting density (300,000 plants/ha), the ranges of PNPP, SNPP, PWPP, SWPP, and HSW were found to be 37.25–51.63, 73.42–116.08, 26.17–31.39 g, 17.52–23.58 g, and 12.39–28.90 g, respectively.CV value for these phenotypes ranged from 4.11 to 12.62%. Under low planting density (150,000 plants/ha), the ranges of PNPP, SNPP, PWPP, SWPP, and HSW were observed to range sequentially from 54.01–78.06, 101.42–185.35, 38.88–49.36 g, 25.68–35.48 g, and 11.84–29.75 g, respectively. CV value ranged from 4.20 to 13.36% (Table 1). In comparison with high density, the ranges of phenotypic variation were larger under low density. The observed broad-sense heritability (H²) for the five traits was moderate to high (33.0–88.9%), confirming that their variation was significantly controlled by genotypic as well as environmental factors. These traits exhibited normal or skewed distributions under different densities (Supplementary Table S1; Figure 1). These results demonstrated that pod−related traits in soybean displayed extensive phenotypic variation.
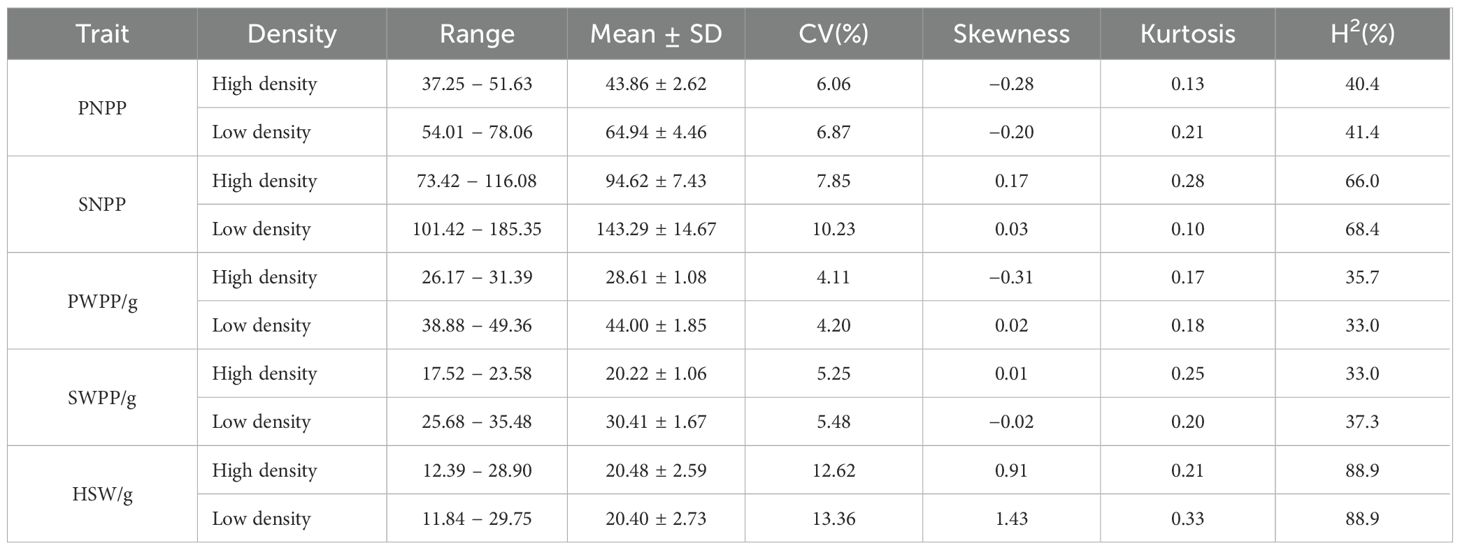
Table 1. Statistical and differential analysis of multi-environment BLUPs for pod-related traits in soybean.
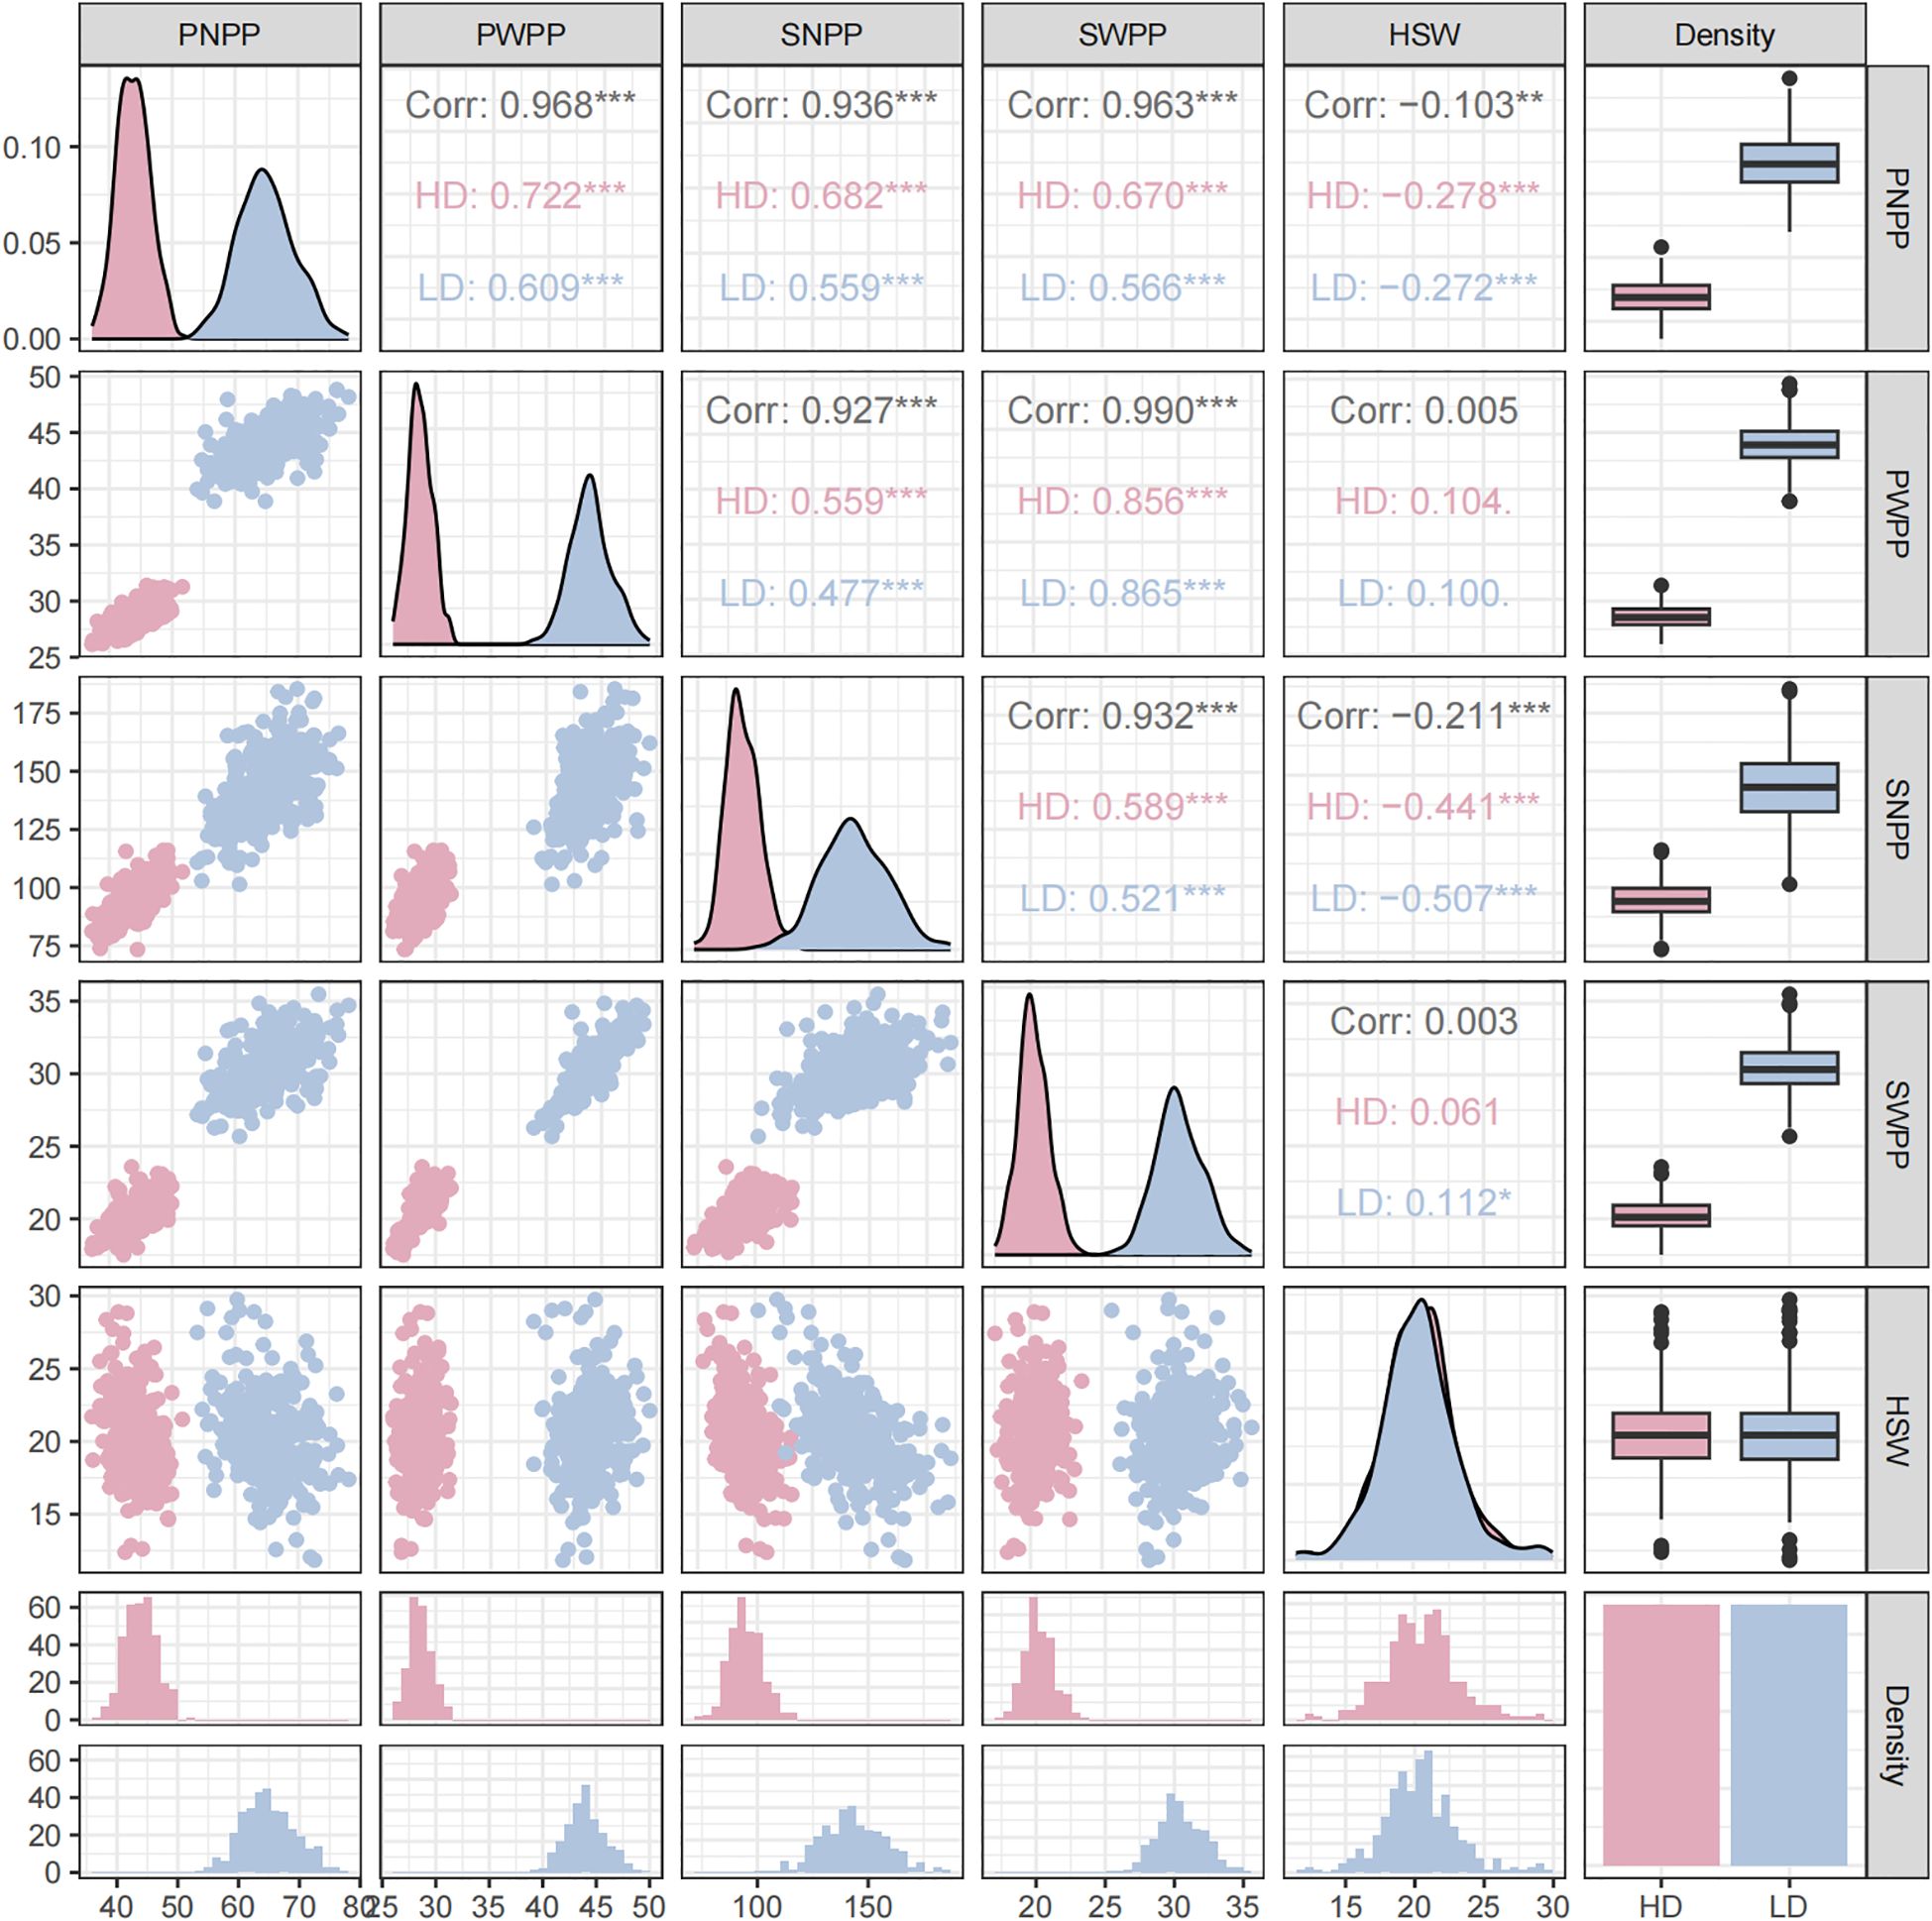
Figure 1. Correlation analyses, frequency distribution plots, and overall boxplots of pod−related traits under two planting densities based on BLUP values. (Blue: 300,000 plants/ha; Pink: 150,000 plants/ha). PNPP (pod number per plant), SNPP (seed number per plant), PWPP (pod weight per plant), SWPP (seed weight per plant), HSW (100−seed weight). **indicates a significant correlation (p < 0.01), *** indicates a significant correlation (p < 0.001).
Pearson correlation analyses of the five pod−related traits revealed that highly significant positive correlations were observed among PNPP, SNPP, PWPP, and SWPP under both planting densities, with correlation coefficients spanning from 0.477 to 0.856. In contrast, HSW exhibited highly significant negative correlations only with PNPP and SNPP, with correlation coefficients ranging from –0.272 to –0.507. Notably, HSW showed a significant positive correlation with SWPP only under low density (Figure 1). These results demonstrated that planting density could significantly affect the variation trends of yield traits and indicated their potential utility in GWAS analyses.
3.2 Results of genome−wide association studies
Based on BLUP values, GWAS analyses for soybean pod−related traits under two planting densities were performed using the MLM model, with correction for (K) and PCA results. Under high planting density, 46 SNPs distributed across 17 chromosomes were found to be associated with yield traits, individually explaining 5.64-8.25% of the phenotypic variance. Among these findings, 21 SNPs were associated with HSW, 9 with SNPP, 7 with SWPP, 5 with PNPP, and 4 with PWPP. Under low planting density, 52 SNP loci linked to pod-related characteristics were identified across 18 chromosomes, with each locus explaining 5.69-8.14% of the phenotypic variation. Among these,19 with HSW, 9 with SNPP, 10 with SWPP, 5 with PNPP, and 9 with PWPP (Supplementary Table S2). In this study, SNPs that were detected across different planting densities or environments, either replicated or closely linked, were identified as important pod−related SNPs. SNPs detected under a single condition were excluded from candidate gene analyses. These findings indicated that 8 significant SNP loci were consistently identified in at least two planting densities or environmental conditions. Among these, one locus stably and significantly associated with HSW was detected on each of chromosomes 5, 14, 15, 17, and 20 (Table 2; Figure 2); one locus significantly associated with SNPP was detected on chromosome 13; and one locus each on chromosomes 7 and 19 was detected to be significantly associated with SWPP.
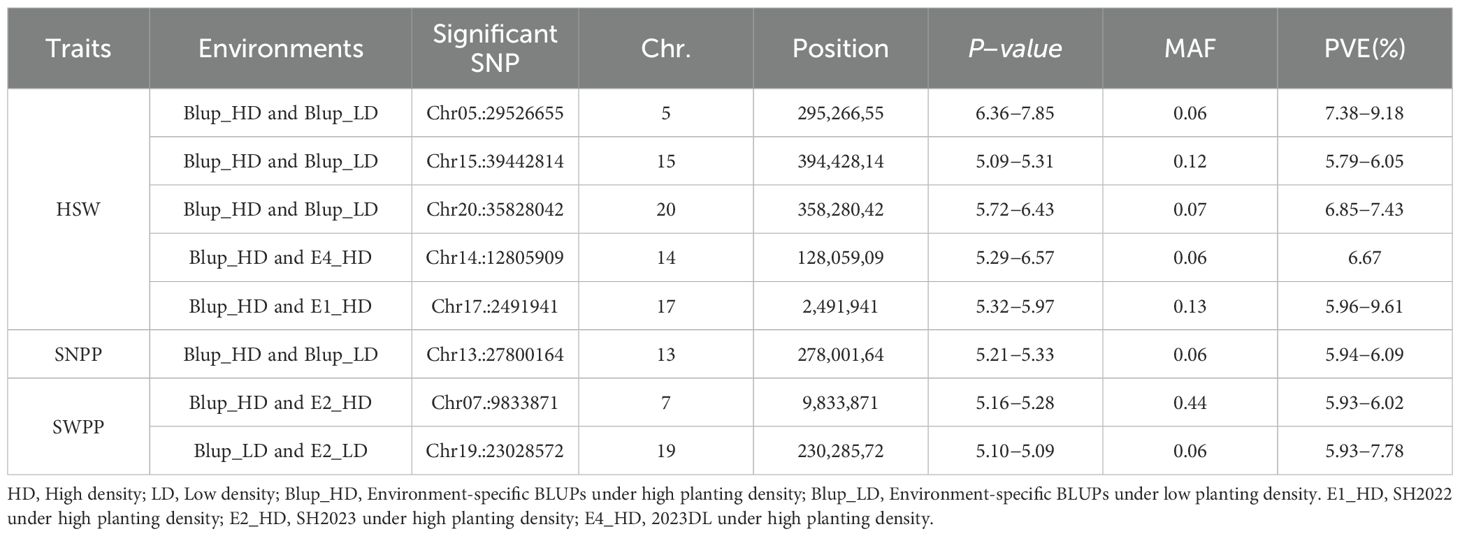
Table 2. Highly significant SNP markers associated with pods−related traits consistently detected under both planting densities.
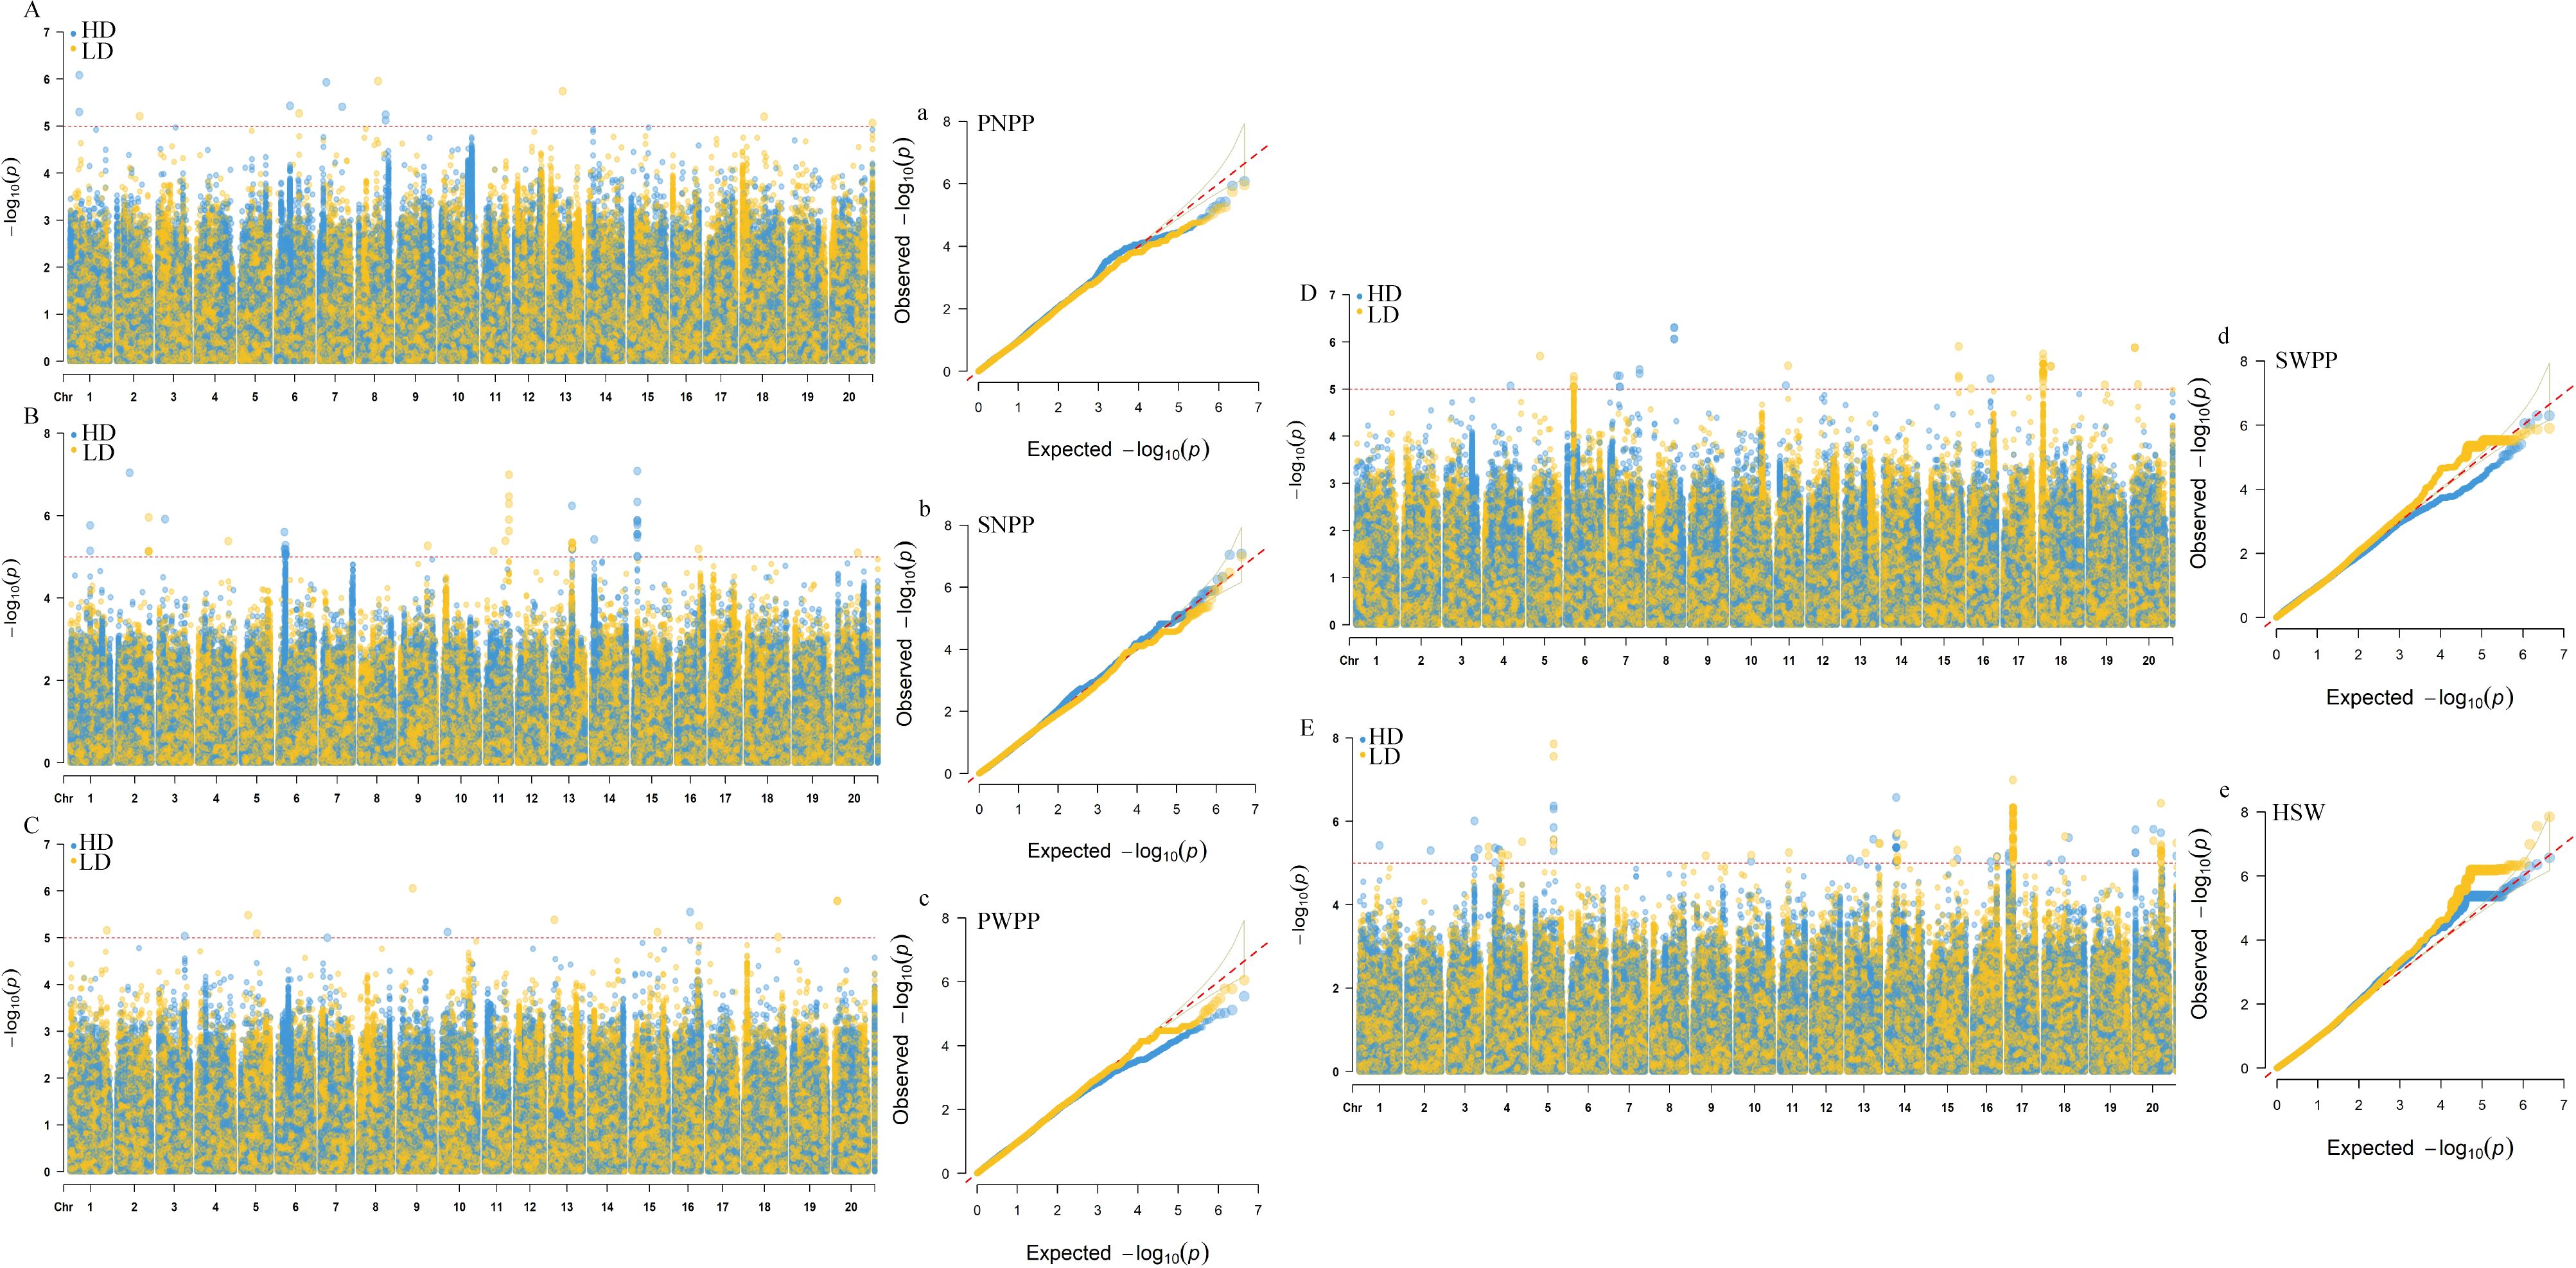
Figure 2. GWAS results for pod−related traits under two planting densities based on BLUP values. (A−E) Manhattan plots for PNPP (pod number per plant), SNPP (seed number per plant), PWPP (pod weight per plant), SWPP (seed weight per plant) and HSW (100−seed weight). (a−e) Q−Q plots for PNPP, SNPP, PWPP, SWPP, and HSW. HD, 300,000 plants/ha; LD, 150,000 plants/ha.
Haplotype analysis was performed on the significantly identified loci to determine allelic combinations of multiple co−inherited loci, and subsequently to analyze their association with soybean pods−related traits. Figure 3 illustrates the phenotypic distributions corresponding to the major alleles of these highly consistent and important SNPs. Pods−related phenotypes exhibited the same trend and showed significant differences among different alleles across various planting densities or environments. Among the 5 SNP loci associated with HSW, one important SNP locus was identified on each of chromosomes 5, 15, 17, and 20; germplasm carrying the minor alleles at these loci exhibited smaller HSW. In contrast, germplasms carrying the major allele of the SNP on chromosome 14 displayed smaller HSW (Figures 3A−E). For SWPP, the minor alleles at SNP07_9833871 (Chr. 7) and SNP19_25028572 (Chr. 19) were associated with higher seed weight per plant (Figures 3F−G). For SNPP, germplasms carrying the major allele of SNP13_2780016 (Chr. 13) exhibited the higher SNPP, with average counts of 132.21 and 97.09 under high and low densities, respectively (Figure 3H).
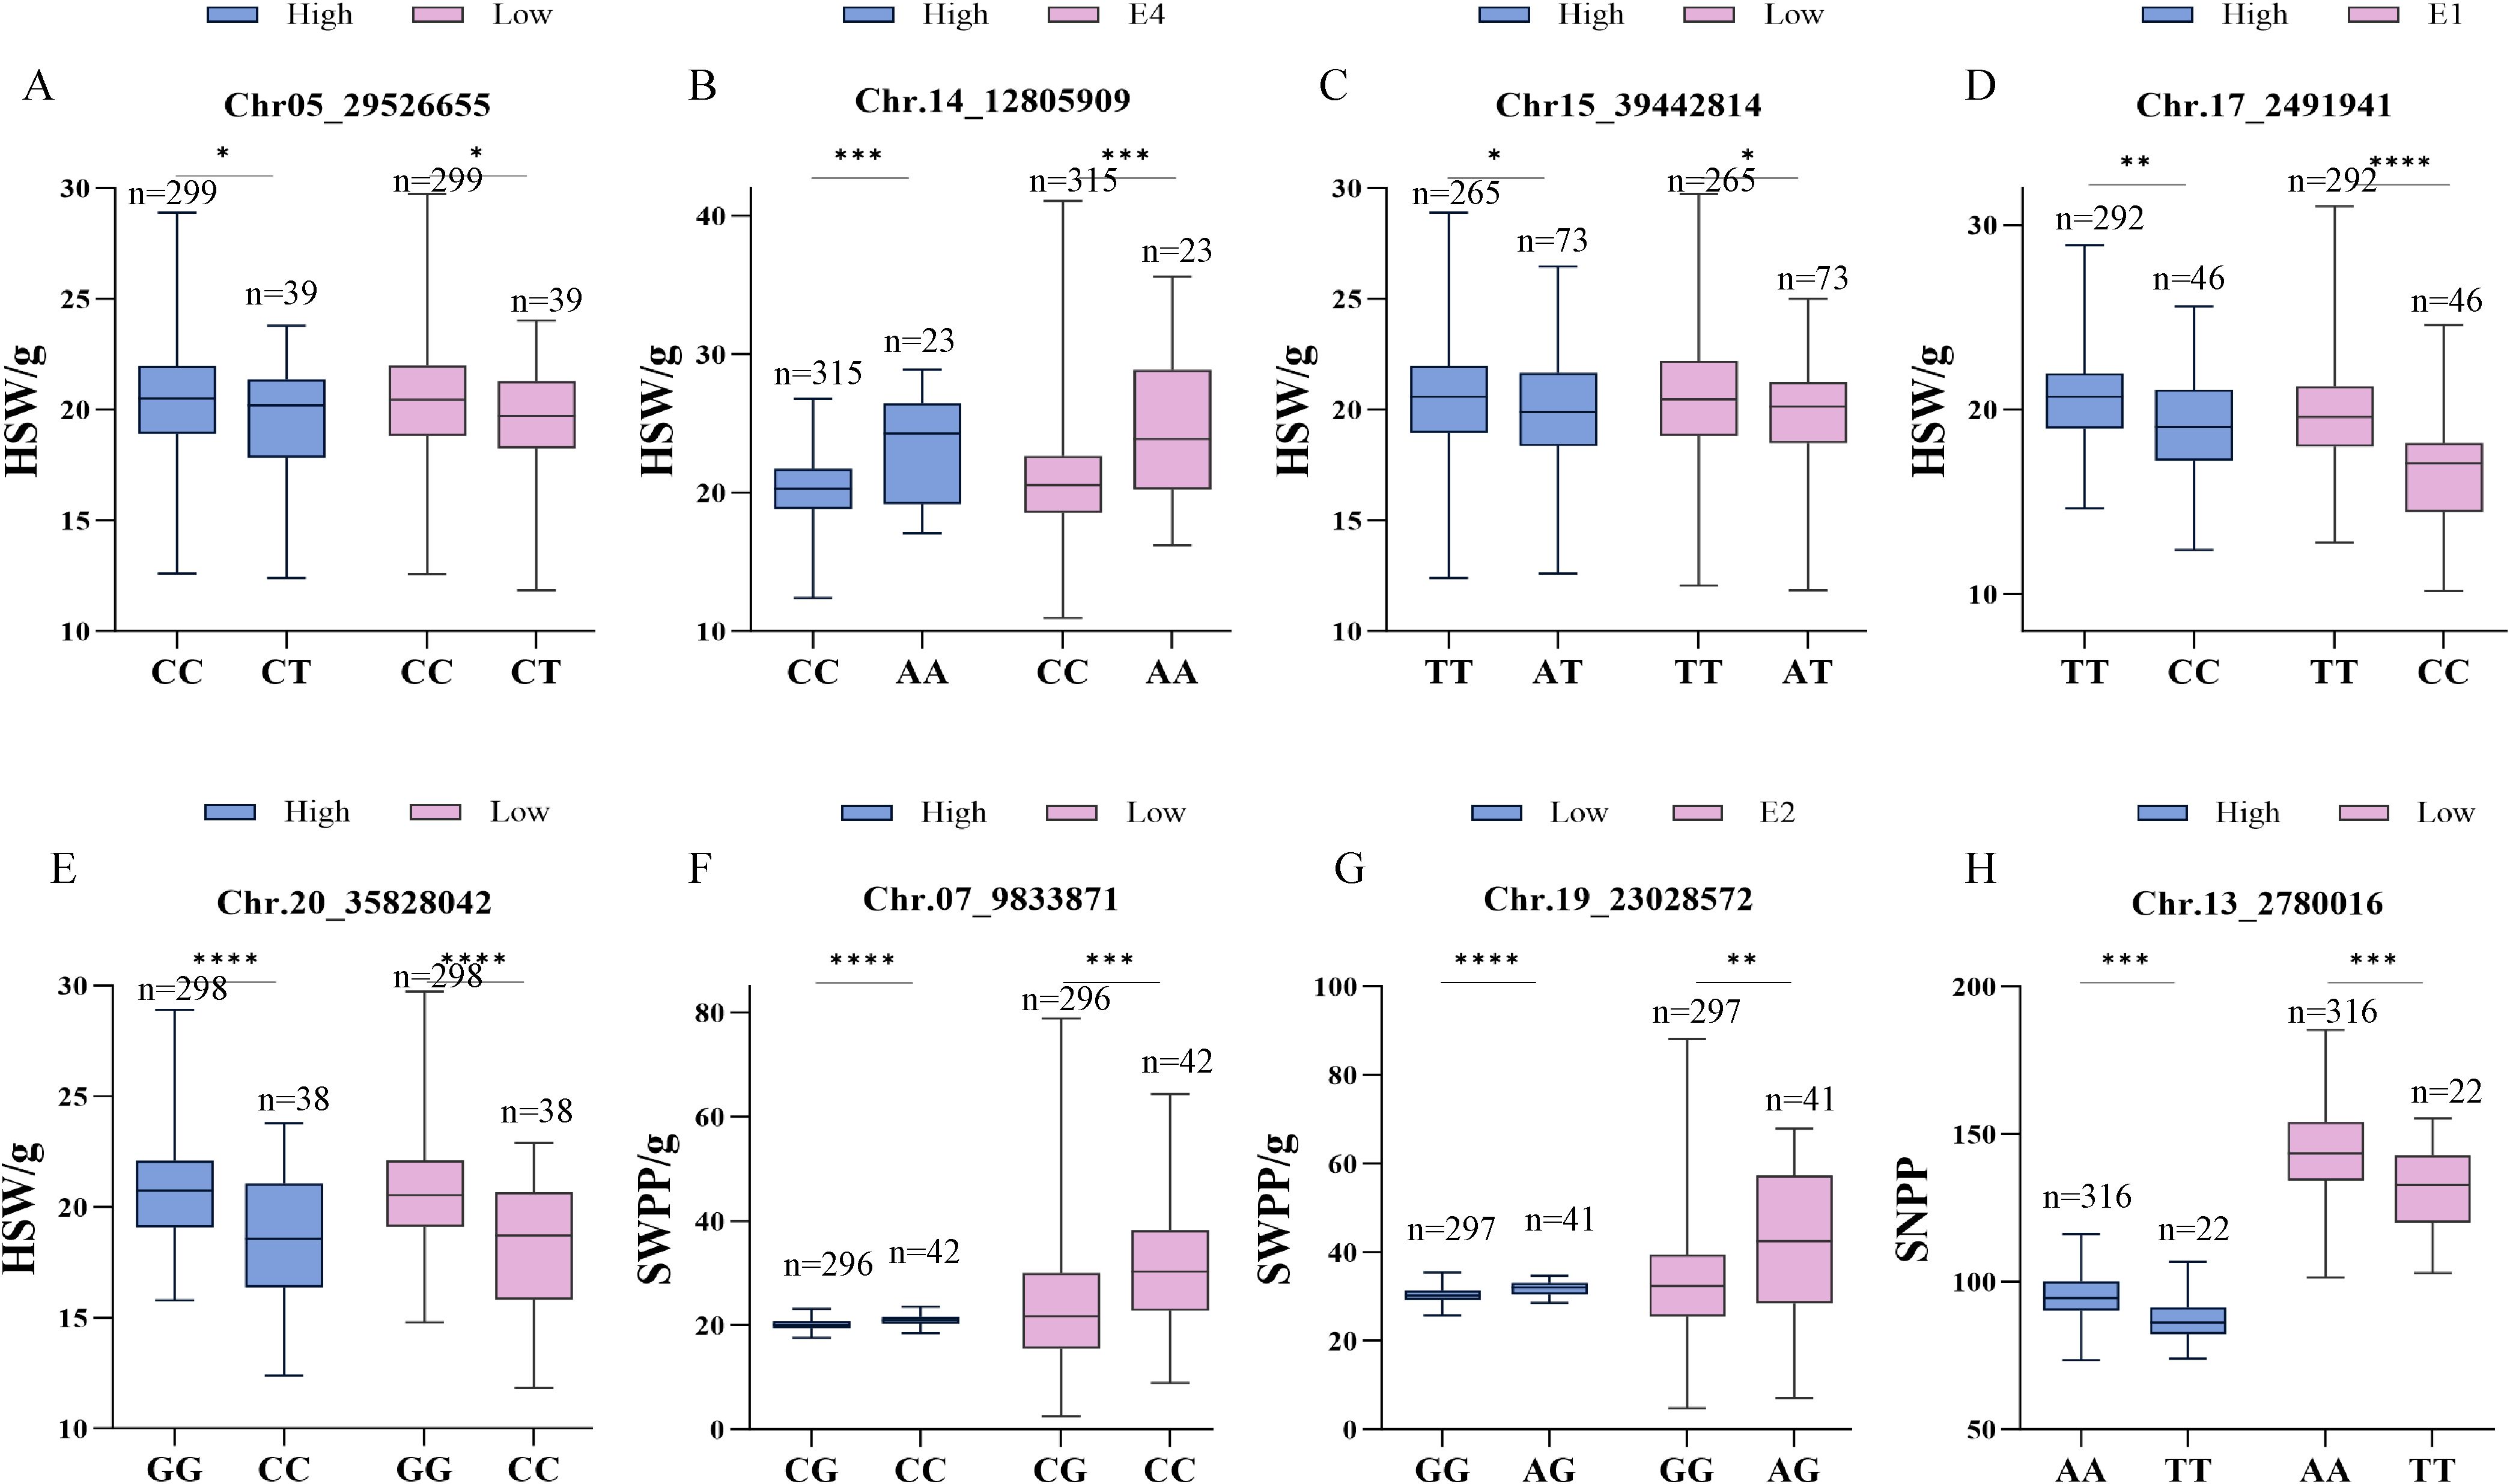
Figure 3. Phenotypic distributions of soybean germplasm resources across alleles of highly significant single nucleotide polymorphism (SNP) markers. (A−H) SNP05_29526655, SNP14_12805909, SNP15_40561307, SNP17_2491941, SNP20_35828042, SNP07_9833871, SNP19_23028572, SNP13_2780016. (*,**,*** and **** statistically significant phenotypic differences among haplotypes as determined by one-way ANOVA, respectively (P < 0.05,P < 0.01, P < 0.001,P < 0.0001).
3.3 Identification of candidate genes
To identify the causal genes underlying variations associated with soybean yield, we predicted genes located within a 100 kb genomic region surrounding significant SNPs, based on linkage disequilibrium patterns derived from the above results. Functional annotation of soybean genes was performed using orthologous genes in Arabidopsis to determine the pathways involved in the determination of these traits. Potential genes were identified by integrating soybean gene IDs and protein annotation information retrieved from SoyBase to predict the biological functions performed by the genes. Among the 5 SNPs significantly associated with HSW, Glyma.14G111800, Glyma.14G112000, Glyma.15G219900, and Glyma.20G116200 were identified as candidate genes. Their functions mainly include encoding aspartate aminotransferase, C2H2 and C2HC zinc finger superfamily proteins, etc. (Supplementary Table S3). Among the 2 SNPs significantly associated with SWPP, Glyma.07G102600 and Glyma.07G102700 were recognized as possible candidate genes. Their functions mainly include being core components of the C/D box snoRNP (small nucleolar ribonucleoprotein) complex, involved in rRNA processing and ribosome biogenesis, and encoding N−myristoyltransferase genes. Among the 1 SNP significantly associated with SNPP, Glyma.13G162800 and Glyma.13G163000 were identified as candidate genes, which mainly include S−adenosyl−L−methionine−dependent methyltrans-ferases superfamily protein and Monogalactosyldiacylglycerol Synthase 2 (a member of the glycolipid synthase family).
3.4 Haplotype analysis of candidate genes
Based on the above findings, whether candidate genes exhibited polymorphism was determined by identifying phenotypic differences among haplotypes within the soy-bean population. Therefore, the distribution of significant non−synonymous SNPs in the candidate genes from the database was investigated. For the HSW trait, the Glyma.20G116200 gene, located in the LD block of SNP Chr20:35828042, encodes a C2H2 and C2HC zinc finger superfamily protein. A total of 338 soybean accessions were divided into 3 haplotypes (HAP1 = 203, HAP2 = 94, HAP3 = 41) by two SNPs with variations, with a C/G non−synonymous mutation occurring at 35,828,042 bp in the coding region. Statistical tests revealed that significant differences in HSW among the three haplotypes were ob-served under both planting densities, with HAP3 (AC) exhibiting a smaller HSW. The average HSW of HAP3 under high and low planting densities was 18.32 g and 18.12 g, respectively (p = 10.2 × 10⁻⁴, p = 6.1 × 10⁻⁵, p = 4.2 × 10⁻⁸, p = 3.8 × 10⁻⁵, p = 8.1 × 10⁻⁵, p = 1.2 × 10⁻⁸) (Figure 4). For the seed number per plant (SNPP) trait significantly associated with SNP Chr13:27800164, the Glyma.13G162800 gene in the LD block encodes an S−adenosyl−L−methionine−dependent methyltransferase superfamily protein. A total of 338 soybean accessions were divided into 2 haplotypes (HAP1 = 193, HAP2 = 145) by one SNP with variation, with a C/A non−synonymous mutation occurring at 278,182,04bp. Statistical tests revealed that highly significant differences in SNPP between the two haplotypes were observed under both planting densities, with HAP2 (A) exhibiting more seeds per plant (Figure 5). The average SNPP of HAP2 under high and low planting densities were 90.35 and 139.25, respectively, which increased by 1.03% and 0.4% compared to HAP1 (p = 0.002, p = 0.005). In recent years, breeders have preferred to develop density−tolerant soybean varieties, characterized by smaller HSW and more seeds per plant; thus, HAP3 of Glyma.20G116200 and HAP2 of Glyma.13G162800 were identified as elite haplotypes. Drawing from the findings above, Glyma.20G116200 and Glyma.13G162800 were recognized as pod-related candidate genes in soybean.
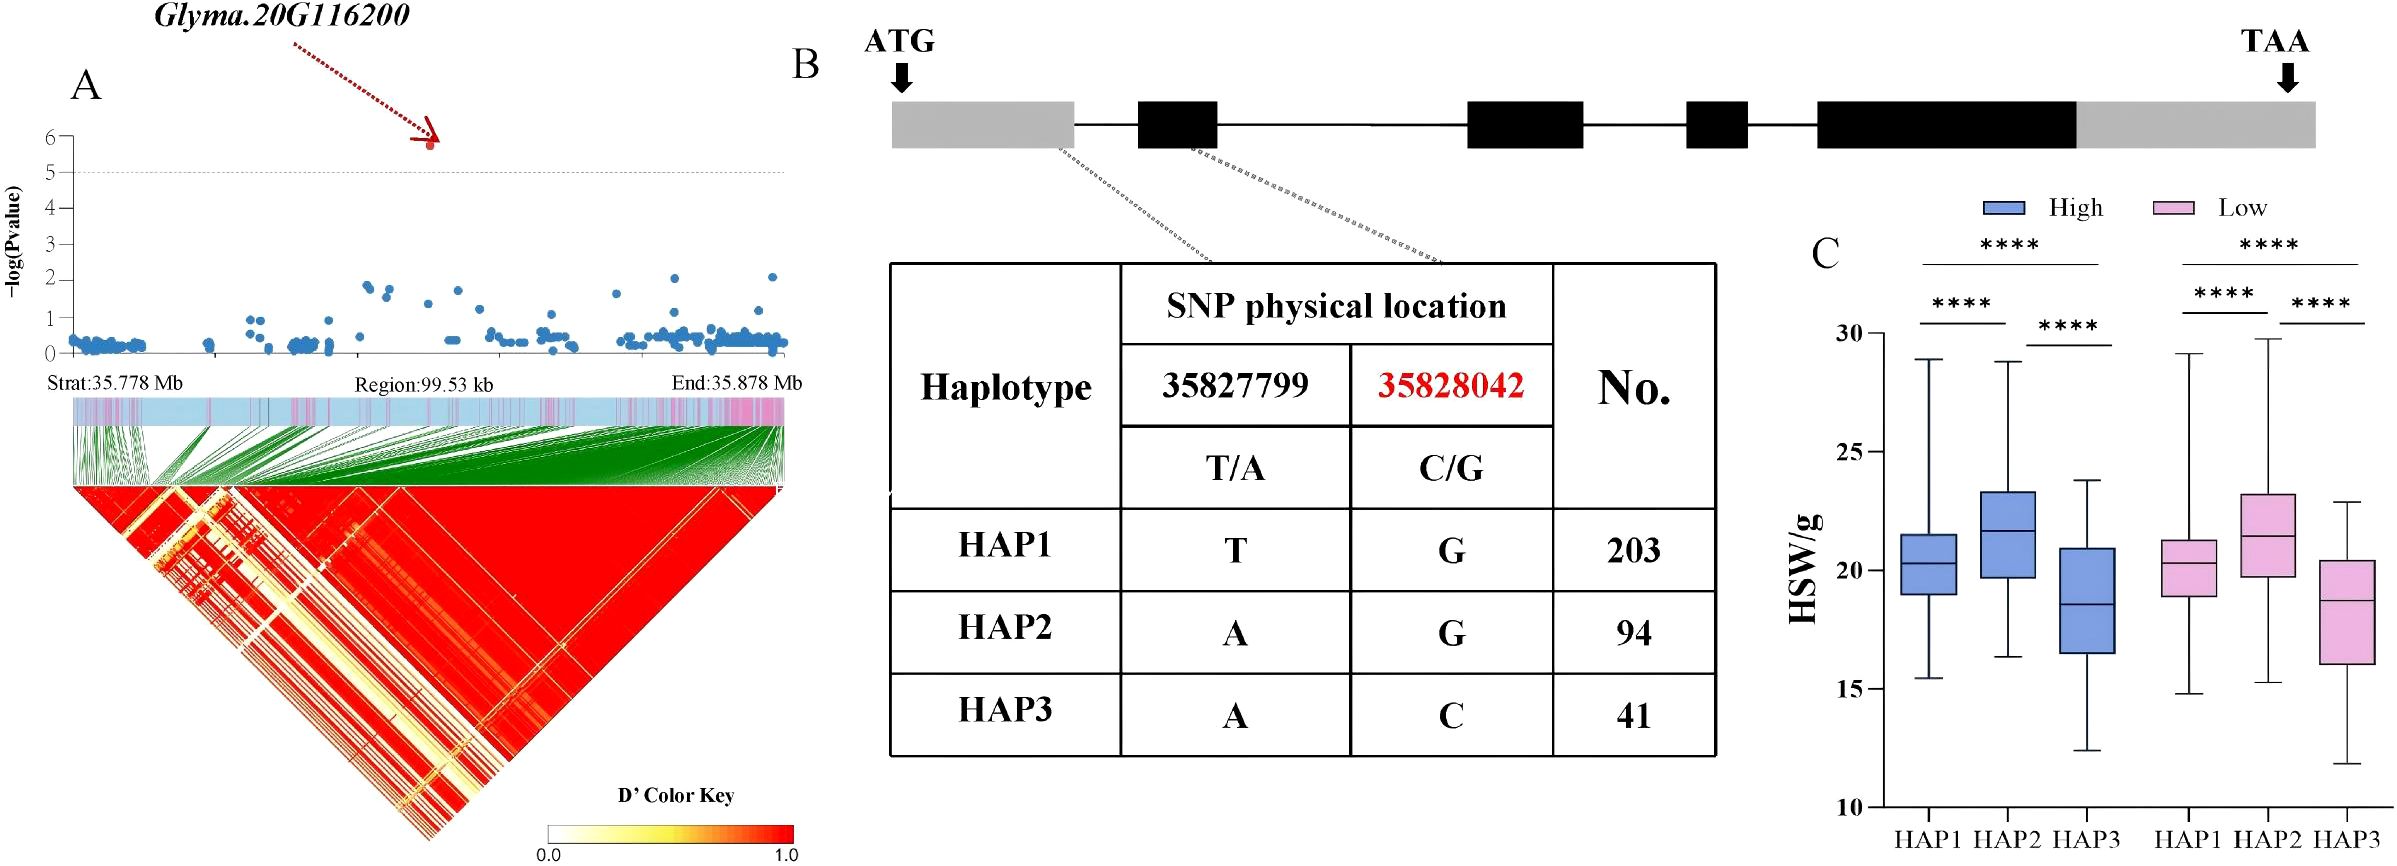
Figure 4. Analysis of the association region and haplotype of Glyma.20G116200. (A) Regional Manhattan Plot and Linkage Disequilibrium (LD) Heat Map of the Region of Glyma.20G116200. (B) Gene Structure and Variation of Glyma.20G116200. (C) Phenotypic Differences of Different Haplo-types of Glyma.20G116200 for HSW. (**** respectively indicate significant phenotypic differences between different haplotypes, p<0.0001).
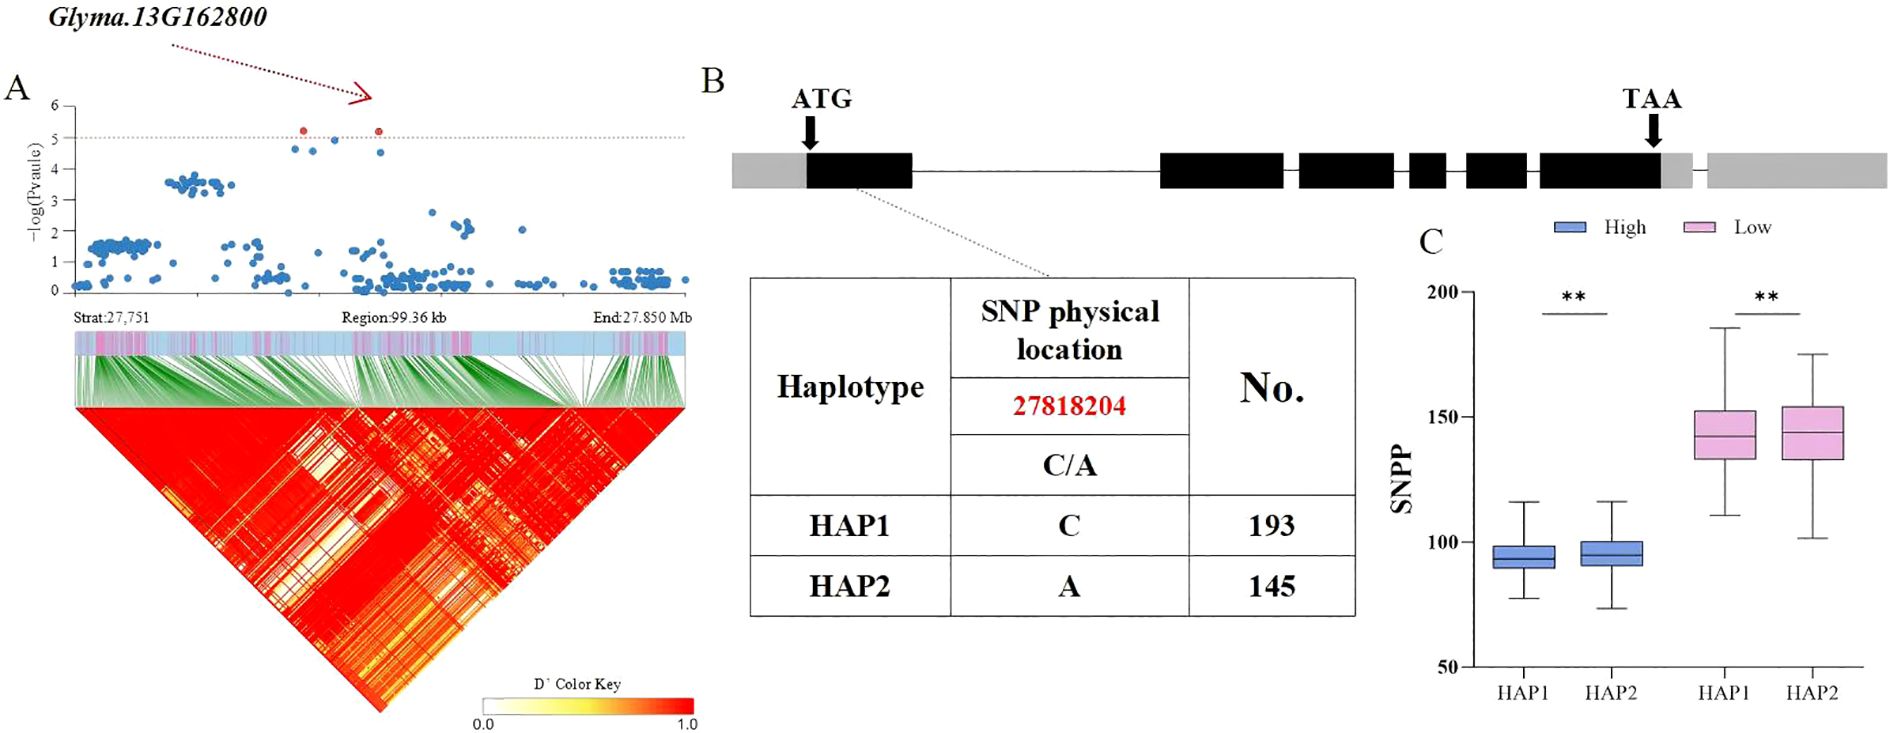
Figure 5. Analysis of the Association Region and Haplotype of Glyma.13G162800. (A) Regional Manhattan Plot and Linkage Disequilibrium (LD) Heat Map of the Region of Glyma.13G162800. (B) Gene Structure and Variation of Glyma.13G162800. (C) Phenotypic Differences of Different Haplo-types of Glyma.13G162800 for SNPP. (** respectively indicate significant phenotypic differences between different haplotypes, p<0.001).
3.5 qRT−PCR validation of candidate genes
Using publicly accessible expression datasets from Phytozome (https://phytozome-next.jgi.doe.gov/), the transcriptional patterns of these candidate genes in different soybean tissues were obtained. Glyma.13G1628000 showed elevated and tissue–specific expression during the soybean reproductive growth stage, particularly in seeds. In contrast, Glyma.20G116200 exhibited high expression exclusively in seeds (Figure 6A). These findings suggested specific roles of Glyma.13G1628000 and Glyma.20G116200 in soybean seed development and yield formation. To confirm the reliability of the selected candidate genes, quantitative real–time (qRT–PCR) was utilized to examine alterations in the expression levels of Glyma.13G1628000 and Glyma.20G116200 in grains at R6 stage across different varieties. In Liaodou 11 (LD 11, a variety with larger HSW but fewer seeds per plant) and Shennong 12 (SN 12, a variety with smaller HSW but more seeds per plant), Glyma.20G116200 and Glyma.13G1628000 exhibited notable differential expression patterns among genotypes with distinct alleles (Figures 6B, C). Therefore, they were considered as potential genes regulating pod−related traits; however, the functions of candidate genes require further validation to confirm their roles.
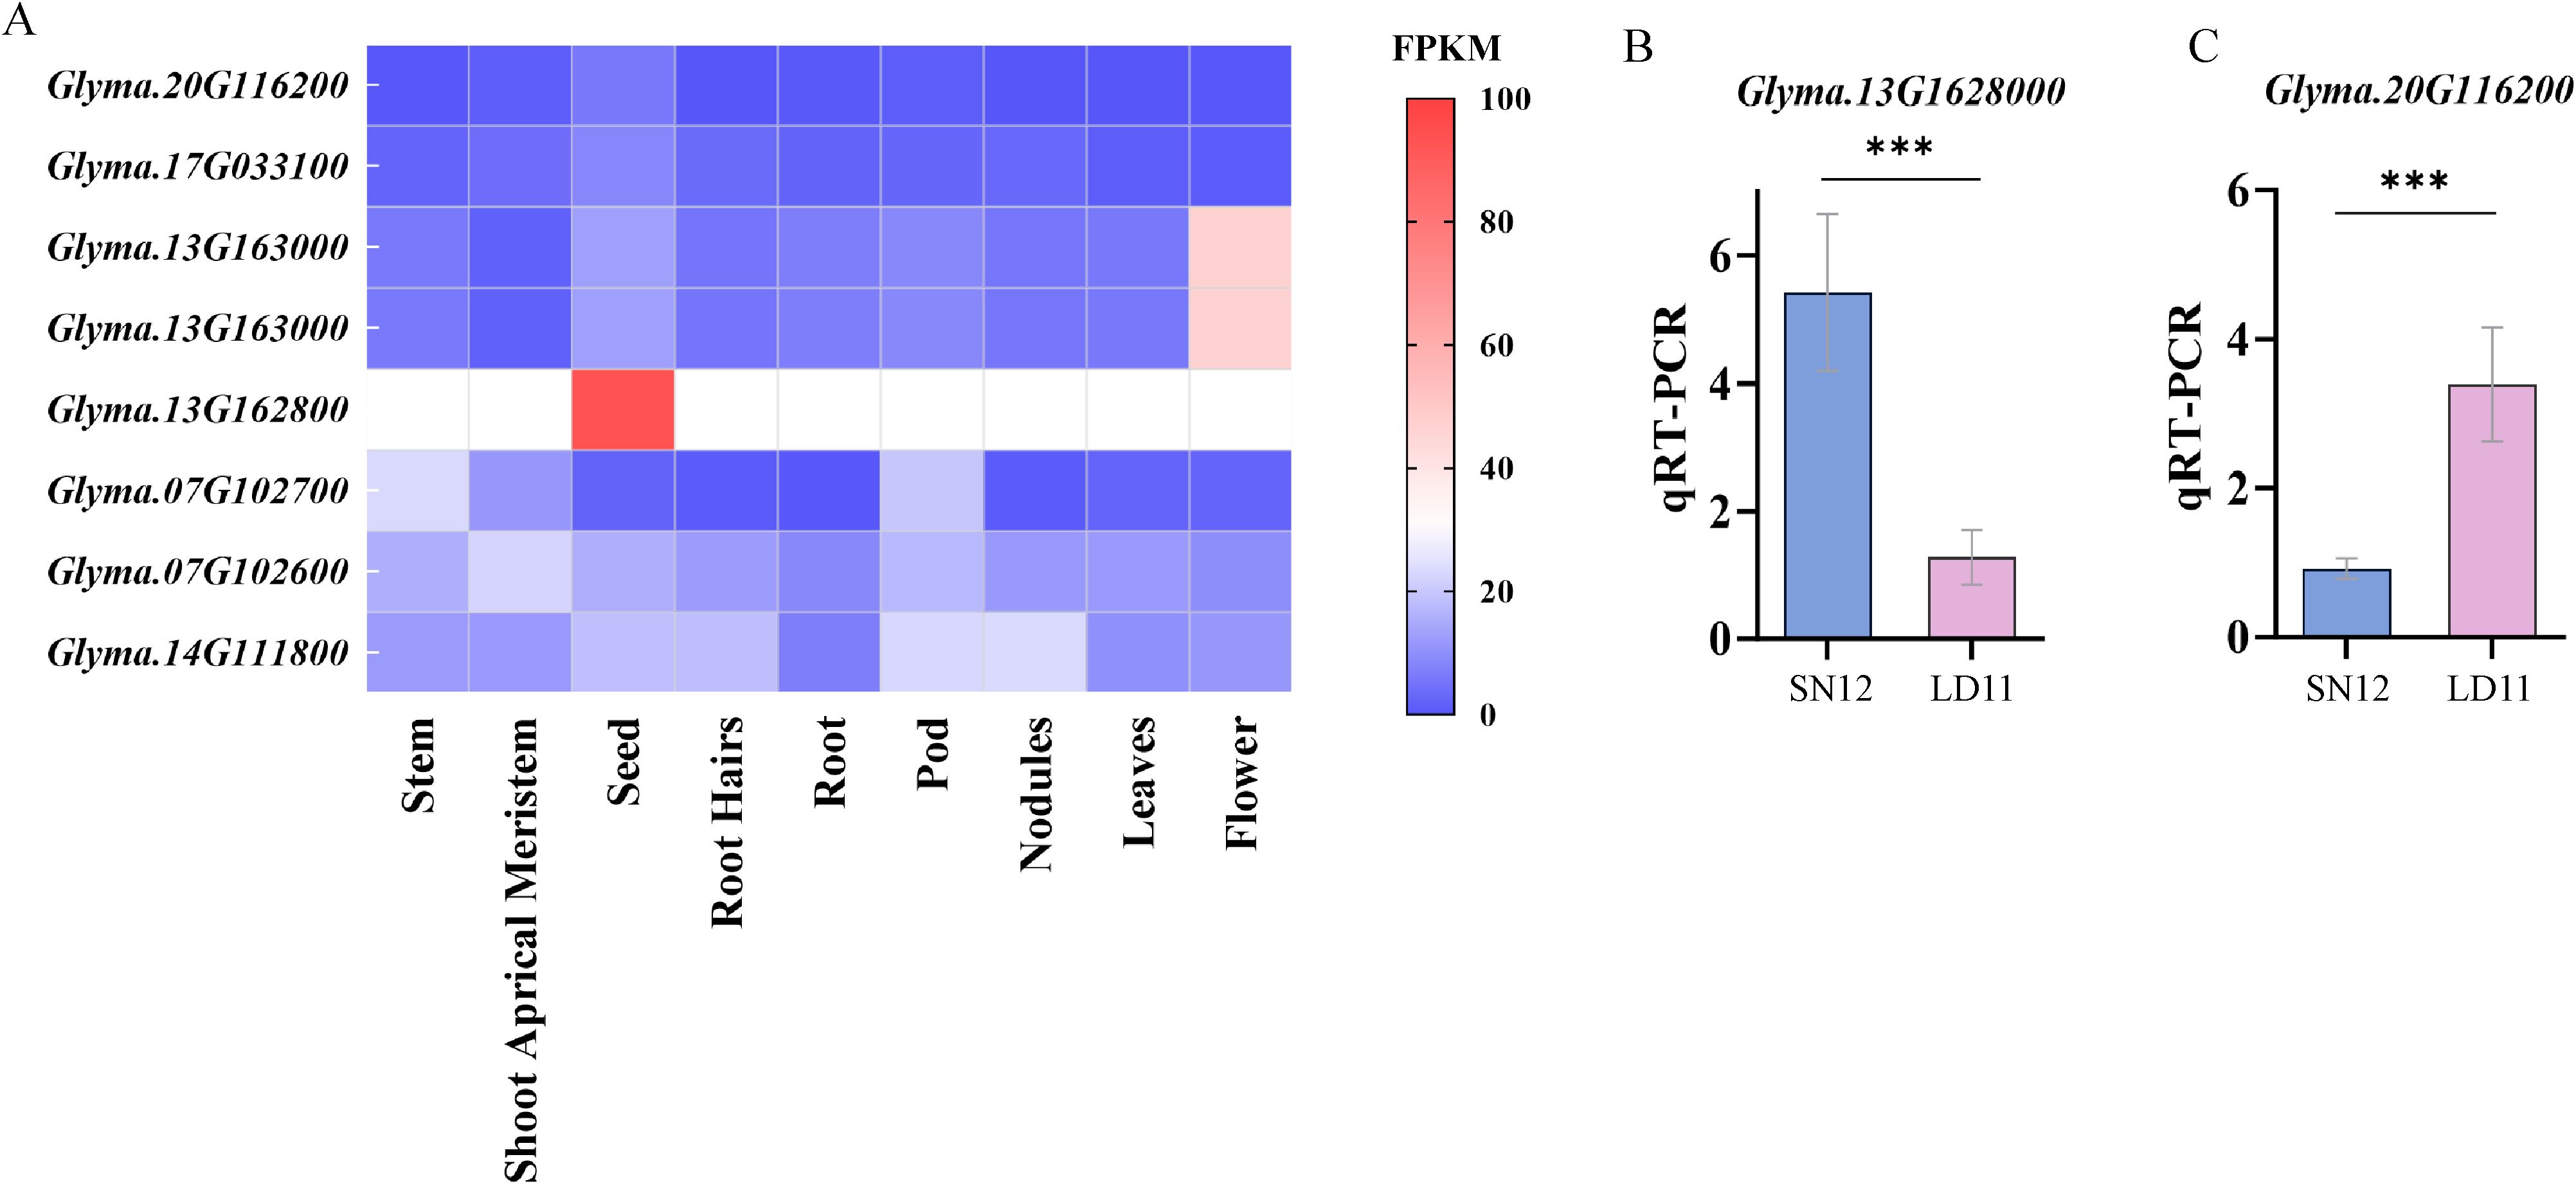
Figure 6. (A) Heatmap of candidate gene expression levels in different soybean tissues. (B, C) The qRT−PCR analysis of the Glyma.13G1628000 and Glyma.20G116200. ***(p < 0.001)
3.6 Development of KASP markers for SNPs
Based on above findings, a KASP marker for S20_35808042 (G/C) was developed. This locus, which is significantly associated with HSW, is located in the coding region of the Glyma.20G116200 gene and harbors a non−synonymous mutation, allowing clear differentiation of the two genotypes at this locus. In Figure 7, blue dots represent soybean germplasm carrying the G allele at the mutation locus, indicating a higher HSW. In contrast, red dots represent soybean germplasm carrying the C allele at the mutation locus, exhibiting a trend toward lower HSW. Overall soybean accessions carrying the CC genotype tended to show lower HSW than those possessing the GG genotype. This finding aligned with the outcomes obtained from the haplotype analysis of the Glyma.20G116200 locus. The clear genotype clustering pattern illustrated in the figure indicated that the designed KASP marker enabled precise SNP−based genotyping, thereby offering important insights for downstream genetic research and crop improvement programs.
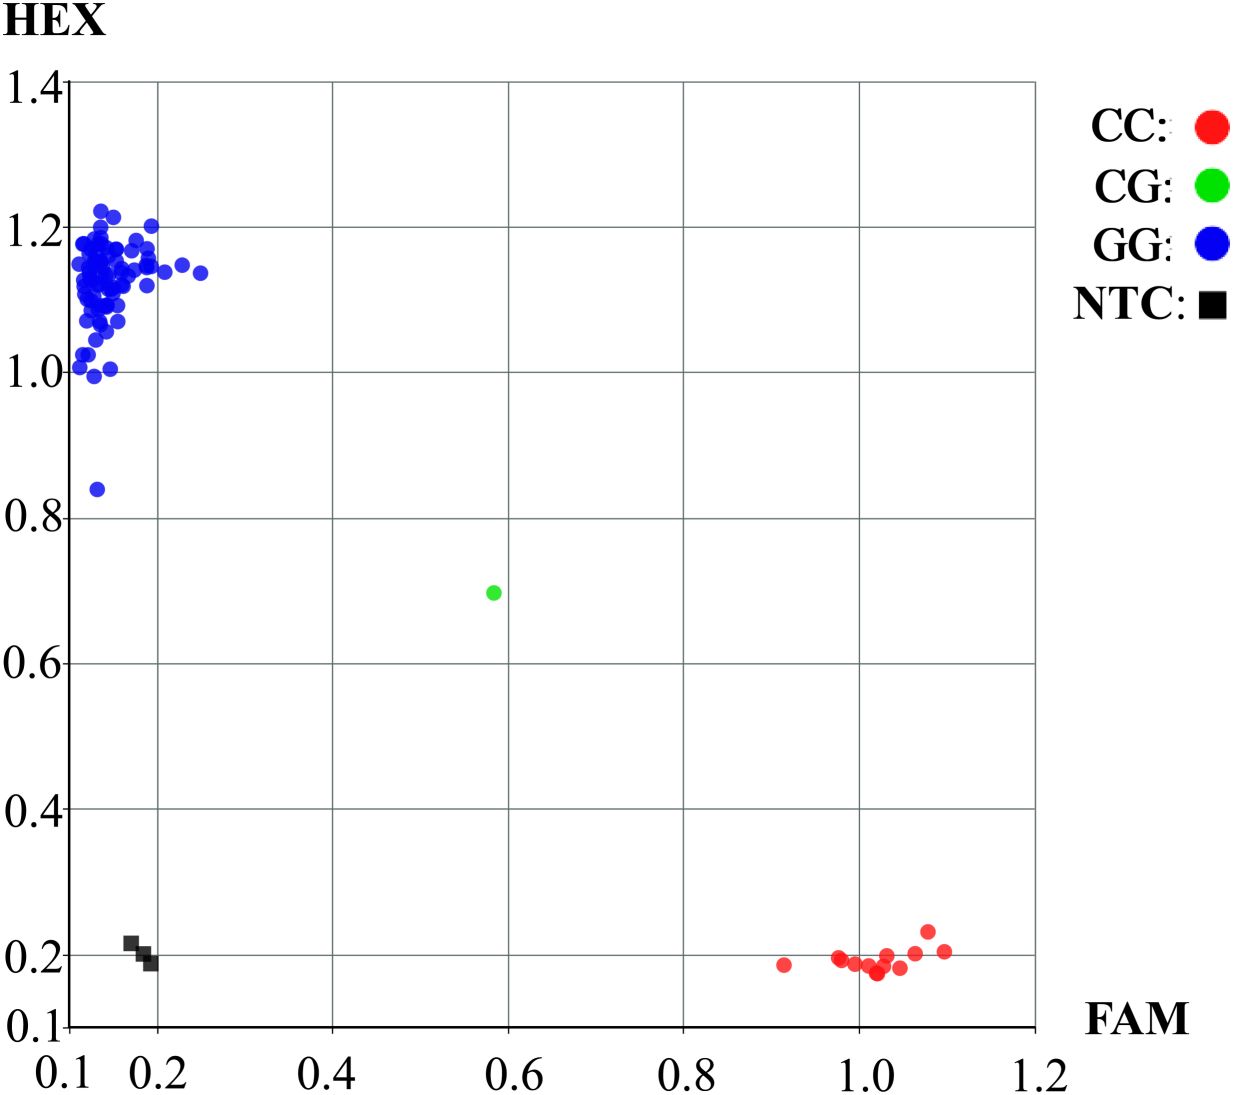
Figure 7. Genotyping of the KASP marker S20_35808042. NTC, negative control.
4 Discussion
4.1 Phenotypic variation of soybean pods−related traits under different planting densities
This study focused on uncovering the genetic architecture underlying pod-associated traits in soybean. These characteristics are typical quantitative traits, governed by numerous genetic components and strongly modulated by environmental influences (Cao et al., 2022). The current investigation applied two planting densities (300,000 and 150,000 plants/ha) to evaluate phenotypic variation in five pod−related traits among 338 soybean accessions. Significant differences and abundant variation in these traits were observed within the population, and similar phenotypic trends were detected under both planting densities at the same location (Table 1). All traits exhibited continuous variation and approximately normal distributions. Correlation analysis revealed strong and highly significant positive relationships among PNPP, SNPP, PWPP and SWPP under both planting densities across all environments. Conversely, a significant negative correlation was observed between HSW and both PNPP and SNPP (Figure 1), aligning with results reported in multiple earlier investigations conducted in various countries (Quijano and Morandi, 2023; Wang et al., 2020).
4.2 GWAS of pod−related traits in soybean
The development of high-throughput sequencing technologies and dense genotyping arrays has made it feasible to routinely apply GWAS for the identification of potential candidate genes (Alqudah et al., 2022). Association mapping has been widely employed by various researchers to investigate the genetic architecture of numerous traits, including HSW, SNPP, SWPP, PNPP and PWPP (Rodrigues et al., 2016; Zhang et al., 2024; Priyanatha et al., 2022). Most genetic analyses of soybean agronomic traits have been conducted under conventional planting densities (150,000 plants/ha). The results generated under conditions of high planting density in this research may enhance our understanding of the genetic basis controlling pod-associated characteristics in soybean. After comparing the results of GWAS with previous reports, a total of 43 significant SNPs associated with 100−seed weight (HSW) were identified under both planting densities, among which 29 SNPs were located within previously reported quantitative trait loci (QTL) regions (Luo et al., 2022; Zhang et al., 2024; Cao et al., 2022; Hacisalihoglu et al., 2018; Wu et al., 2020). For example, previous researchers identified a QTL significantly associated with HSW using a RIL population derived from a high−protein and high−yielding soybean cultivar, which overlapped with the Chr14:12805909 locus detected in the present study (Whiting et al., 2020). For SNPP, 3 out of 19 significant SNPs were located within previously reported QTL regions (Qi et al., 2014; Hao et al., 2012). Among them, the SNP Chr13:27800164 identified under both high and low−density planting conditions overlapped with the previously defined Seed weight 13 region (Wang et al., 2016), suggesting that this locus may exhibit pleiotropic effects. For seed weight per plant (SWPP), 5 out of 17 significant SNPs were located within previously reported QTL regions (Kuroda et al., 2013). In addition, 2 out of 10 SNPs associated with PNPP and 1 out of 13 SNPs associated with PWPP were also found within known QTL intervals (Hacisalihoglu et al., 2018; Zhang et al., 2010; Palomeque et al., 2009) (Supplementary Table S2). It is noteworthy that the loci identified in our study accounted for only about one−third of the previously reported quantitative trait loci (QTLs), further confirming the complexity and polygenic nature of soybean yield−related traits. These discrepancies may have resulted from differences in genetic backgrounds, population sizes, marker densities, environmental effects, and the GWAS models employed.
4.3 Candidate gene analysis for pod−related traits
Among the soybean pods−related traits, only eight significant SNPs were consistently identified for HSW, SWPP, and SNPP across at least two different planting densities or environmental scenarios (Table 2). Based on gene annotation analysis, five candidate genes associated with HSW were detected, including Glyma.14G111800, Glyma.14G112000, Glyma.15G219900, and Glyma.20G116200. Glyma.14G111800 encodes aspartate aminotrans ferase 5, which is involved in the C4 photosynthetic carbon assimilation cycle and subsequently affects amino acid metabolism in plants, thereby influencing seed development (Tian et al., 2022). Glyma.14G112000 is located within a previously reported QTL region (Whiting et al., 2020). In Arabidopsis thaliana, its homolog, aberrant lateral root formation 4 (ALF4), suppresses lateral root development by interacting with RBX1 and inhibiting the activity of the SCFTIR1 complex. Mutations in alf4 exhibit phenotypes indicative of defects in the auxin (Aux/IAA) signaling response (Bagchi et al., 2018). Glyma.15G219900 is located within the Seed weight 15−g1 region, near the marker Sat_136 (Wu et al., 2020). This gene encodes villin 4 (VLN4), is highly preferentially expressed in pollen. VLN4 serves as a key regulator of F−actin filament stability and may influence seed development by modulating pollen tube growth (Yang et al., 2025). In the analysis of seed weight per plant (SWPP), Glyma.07G102600 and Glyma.07G102700 are identified as potential candidate genes. Glyma.07G102600 encodes a core component of the C/D box small nucleolar ribonucleoprotein (snoRNP) complex, which is involved in rRNA processing and ribosome biogenesis. In soybean, it functions upstream of the pre−ribosome biogenesis process through the nucleolar protein NOP56 in root apices, contributing to protein synthesis (Yin and Komatsu, 2016). Glyma.07G102700 encodes N−myristoyltransferase (NMT), an enzyme responsible for protein N−myristoylation. In Arabidopsis thaliana, the homologous gene NMT1 plays a critical role during post−embryonic development. Deficiency in NMT1 results in abnormal cellular polarity, hindered floral development, disturbed fruit ripening, and weakened innate immune responses (Renna et al., 2013). Among the candidate genes significantly associated with seed number per plant (SNPP), Glyma.13G163000 (GUS3) encodes β−glucuronidase. In Arabidopsis thaliana, this gene exhibits tissue-specific expression, primarily localized in zones of vigorous cell division, suggesting a potential role in modulating the cell cycle (Woo et al., 2007).
4.4 Haplotype analysis of candidate genes associated with HSW and SNPP
A haplotype denotes a group of linked genetic markers inherited together on the same chromosome, and it has been extensively utilized in crop studies involving species like rice, soybean, and maize (Singh et al., 2024). Based on haplotype and sequence variation analyses, Glyma.20G116200, which shows a significant association with 100−seed weight (HSW), is identified as a candidate gene. It encodes a key transcriptional regulator belonging to the C2H2−type zinc finger protein family, which plays an essential role in gene expression regulation. The JAG gene modulates organ morphology, including leaf and petal development, by enhancing marginal expansion and stimulating cellular proliferation (Jeong et al., 2012). In soybean, the genetic locus controlling leaflet shape is closely linked to the locus governing the SNPP. Jeong et al. (2011) demonstrated through linkage analysis that the JAG gene induces the proliferation of lateral organ tissues, thereby influencing leaflet morphology and seed number in soybean. In Brassica napus, the JAGGED (JAG) gene as a key regulator within the seed shattering control network. CRISPR/Cas9−induced knockout mutants exhibit altered pod morphology, characterized by enlarged cells, uneven surface texture, and reduced fruit length (Zaman et al., 2019). We hypothesize that natural variation in the JAG gene may contribute to phenotypic variation in HSW in soybean. The significant locus Chr20_35828042 resides within the exon of the candidate gene and harbors a nonsynonymous variant. Haplotype analysis identified Hap3, which is associated with a lower 100−seed weight (HSW) phenotype (Figure 4). In recent years, breeders have increasingly favored the development of density−tolerant soybean cultivars, which are characterized by smaller 100−seed weight (HSW). Therefore, Hap3 may represent an elite haplotype of Glyma.20G116200. Moreover, the qRT−PCR results reveal differential expression of this gene among accessions with contrasting 100−seed weight (HSW). Glyma.13G163000 (AVP1) encodes a vacuolar H+− pyrophosphatase in Arabidopsis thaliana, which has been shown to enhance abiotic stress tolerance. In cotton, transgenic plants overexpressing AVP1 exhibited enhanced tolerance to cold and salt stress, accompanied with increased field yield (Pasapula et al., 2011). The only SNP identified in Glyma.13G163000 results in a nonsynonymous mutation, and the Hap2 haplotype is associated with a higher SNPP, indicating that Hap2 is a favorable haplotype. This finding was further supported by qRT−PCR analysis. Single nucleotide polymorphisms (SNPs), as functional genetic variants, serve as a valuable basis for developing molecular markers used in marker−based selection aimed at improving pod-related traits in soybean. The application of superior haplotypes identified through such variants further facilitates the breeding of high−yield soybean cultivars.
4.5 KASP markers for HSW
In this study, a KASP marker was developed based on SNPs associated with soybean pod traits identified through GWAS. This marker has been successfully applied for genotyping (Figure 7), and SNP S20_35808042 is significantly associated with HSW. This marker serves as an effective tool for enhancing yield−oriented soybean breeding and facilitates greater efficiency and precision in marker-assisted selection. Nevertheless, KASP markers targeting additional pod−related traits remain undeveloped, highlighting the necessity for continued exploration and validation to identify robust markers for these traits.
5 Conclusions
A GWAS conducted under high and low planting densities on 338 soybean accessions identified 103 significant SNP loci for pod-related traits. A total of eight significant SNPs were repeatedly detected, which were significantly associated with SNPP, SWPP, and HSW. Meanwhile, two genes, Glyma.20G116200 and Glyma.13G162800, were identified as being significantly associated with HSW and SNPP, respectively. In addition, a KASP marker, S20_35808042 (G/C), was developed and validated. These findings offer a theoretical framework for deciphering the genetic underpinnings of pod−related traits in soybean and establish a basis for advancing molecular breeding and the development of high−yielding cultivars.
Data availability statement
The variation data reported in this paper have been deposited in the Genome Variation Map (GVM) in National Genomics Data Center, Beijing Institute of Genomics, Chinese Academy of Sciences and China National Center for Bioinformation, under accession number GVM001210 (https://bigd.big.ac.cn/gvm/getProjectDetail?Project=GVM001210).
Author contributions
ZL: Data curation, Formal analysis, Investigation, Methodology, Software, Writing – original draft. NQ: Investigation, Writing – original draft. RL: Investigation, Writing – original draft. RGa: Investigation, Writing – original draft. RGu: Investigation, Writing – original draft. JL: Investigation, Writing – original draft. YH: Investigation, Writing – original draft. NX: Writing – original draft. WZ: Writing – original draft, Investigation. XY: Writing – review & editing. FX: Funding acquisition, Writing – review & editing.
Funding
The author(s) declare financial support was received for the research and/or publication of this article. This research was funded by (2021YFD1201102) was from the National Key Research and Development Plan of Ministry of Science and Technology.
Conflict of interest
The authors declared that this work was conducted in the absence of any commercial or financial relationships that could be construed as a potential conflict of interest.
Generative AI statement
The author(s) declare that no Generative AI was used in the creation of this manuscript.
Any alternative text (alt text) provided alongside figures in this article has been generated by Frontiers with the support of artificial intelligence and reasonable efforts have been made to ensure accuracy, including review by the authors wherever possible. If you identify any issues, please contact us.
Publisher’s note
All claims expressed in this article are solely those of the authors and do not necessarily represent those of their affiliated organizations, or those of the publisher, the editors and the reviewers. Any product that may be evaluated in this article, or claim that may be made by its manufacturer, is not guaranteed or endorsed by the publisher.
Supplementary material
The Supplementary Material for this article can be found online at: https://www.frontiersin.org/articles/10.3389/fpls.2025.1680918/full#supplementary-material
References
Alqudah, A. M., Sallam, A., Stephen Baenziger, P., and Borner., A. (2022). A GWAS: Fast–forwarding gene identification and characterization in temperate Cereals: lessons from Barley – A review. J. Adv. Res. 22, 119–135. doi: 10.1016/j.jare.2019.10.013
Bagchi, R., Melnyk, C. W., Christ, G., Winkler, M., Kirchsteiner, K., Salehin, M., et al. (2018). The Arabidopsis ALF4 protein is a regulator of SCF E3 ligases. EMBO J. 37, 255–268. doi: 10.15252/embj.201797159
Bates, D., Mächler, M., Bolker, B., and Walker, S. (2015). Fitting linear mixed–effects models using lme4. J. Stat. Software 67, 1–48. doi: 10.18637/jss.v067.i01
Bhat, J. A., Adeboye, K. A., Ganie, S. A., Barmukh, R., Hu, D., Varshney, R. K., et al. (2022). Genome–wide association study, haplotype analysis, and genomic prediction reveal the genetic basis of yield–related traits in soybean (Glycine max L.). Front. Genet. 13. doi: 10.3389/fgene.2022.953833
Bhat, J. A., Yu, H., Weng, L., Yuan, Y., Zhang, P., Leng, J., et al. (2025). GWAS analysis re-vealed genomic loci and candidate genes associated with the 100–seed weight in high–latitude–adapted soybean germplasm. Theor. Appl. Genet. 138, 29. doi: 10.1007/s00122–024–04815–6
Bianchi, J. S., Quijano, A., Gosparini, C. O., and Morandi, E. N. (2020). Changes in leaflet shape and seeds per pod modify crop growth parameters, canopy light environment, and yield components in soybean. Crop J. 8, 351–364. doi: 10.1016/j.cj.2019.09.011
Cao, Y., Jia, S., Chen, L., Zeng, S., Zhao, T., and Karikari, B. (2022). Identification of major genomic regions for soybean seed weight by genome–wide association study. Mol. Breed. 42, 38. doi: 10.1007/s11032–022–01310–y
Carey, S. J., Becklund, L. E., Fabre, P. P., and Schenk, J. J. (2023). Optimizing the lysis step in CTAB DNA extractions of silica-dried and herbarium leaf tissues. Appl. Plant Sci. 11, e11522. doi: 10.1002/aps3.11522
Chen, X., Liu, C., Guo, P., Hao, X., Pan, Y., Zhang, K., et al. (2023). Differential SW16.1 allelic effects and genetic backgrounds contributed to increased seed weight after soybean domestication. J. Integr. Plant Biol. 65, 1734–1752. doi: 10.1111/jipb.13480
Duan, Z., Zhang, M., Zhang, Z., Liang, S., Fan, L., Yang, X., et al. (2022). Natural allelic variation of GmST05 controlling seed size and quality in soybean. Plant Biotechnol. J. 20, 1807–1818. doi: 10.1111/pbi.13865
Friedman, S. P. (2024). Relationships between combined and individual field crops’ biomass and planting density. Field Crops Res. 305, 109188. doi: 10.1016/j.fcr.2023.109188
Golestan Hashemi, F. S., Ismail, M. R., Rafii, M. Y., Aslani, F., Miah, G., and Muharam, F. M. (2018). Critical multifunctional role of thebetaine aldehyde dehydrogenasegene in plants. Biotechnol. Biotechnol. Equipment. 32, 815–829. doi: 10.1080/13102818.2018.1478748
Hacisalihoglu, G., Burton, A. L., Gustin, J. L., Eker, S., Asikli, S., Heybet, E. H., et al. (2018). Quantitative trait loci associated with soybean seed weight and composition under different phosphorus levels. J. Integr. Plant Biol. 60, 232–241. doi: 10.1111/jipb.12612
Han, Y., Li, D., Zhu, D., Li, H., Li, X., Teng, W., et al. (2012). QTL analysis of soybean seed weight across multi–genetic backgrounds and environments. Theor. Appl. Genet. 125, 671–683. doi: 10.1007/s00122–012–1859–x
Hao, D., Cheng, H., Yin, Z., Cui, S., Zhang, D., and Wang, H. (2012). Identification of single nucleotide polymorphisms and haplotypes associated with yield and yield components in soybean (Glycine max) landraces across multiple environments. Theor. Appl. Genet. 124, 447–458. doi: 10.1007/s00122–011–1719–0
Hina, A., Cao, Y., Song, S., Li, S., Sharmin, R. A., Elattar, M. A., et al. (2020). High–resolution mapping in two RIL populations refines major "QTL hotspot" Regions for seed size and shape in soybean (Glycine max L.). Int. J. Mol. Sci. 21 (3), 1040. doi: 10.3390/ijms21031040
Hu, D., Li, X., Yang, Z., Liu, S., Hao, D., Chao, M., et al. (2022). Downregulation of a gibberellin 3beta–hydroxylase enhances photosynthesis and increases seed yield in soybean. New Phytol. 235, 502–517. doi: 10.1111/nph.18153
Jeong, N., Moon, J. K., Kim, H. S., Kim, C. G., and Jeong, S. C. (2011). Fine genetic mapping of the genomic region controlling leaflet shape and number of seeds per pod in the soybean. Theor. Appl. Genet. 122, 865–874. doi: 10.1007/s00122–010–1492–5
Jeong, N., Suh, S. J., Kim, M. H., Lee, S., Moon, J. K., Kim, H. S., et al. (2012). Ln is a key regulator of leaflet shape and number of seeds per pod in soybean. Plant Cell. 24, 4807–4818. doi: 10.1105/tpc.112.104968
Kitabatake, T., Yoshihira, T., Suzuki, H., and Yamaguchi, N. (2020). Yield and related traits for a soybean breeding line ‘Tokei 1122’ with QTLs for long terminal racemes under high planting density conditions. Plant Production Science. 23, 234–246. doi: 10.1080/1343943x.2020.1742582
Kuroda, Y., Kaga, A., Tomooka, N., Yano, H., Takada, Y., Kato, S., et al. (2013). QTL affecting fitness of hybrids be-tween wild and cultivated soybeans in experimental fields. Ecol. Evol. 3, 2150–2168. doi: 10.1002/ece3.606
Li, H. and Durbin, R. (2010). Fast and accurate long–read alignment with Burrows–Wheeler transform. Bioinformatics. 26, 589–595. doi: 10.1093/bioinformatics/btp698
Li, X., Chen, Z., Li, H., Yue, L., Tan, C., Liu, H., et al. (2024). Dt1 inhibits SWEET–mediated sucrose transport to regulate photoperiod–dependent seed weight in soybean. Mol. Plant 17, 496–508. doi: 10.1016/j.molp.2024.02.007
Liang, Z., Qi, N., Li, R., Gao, R., Huang, J., Zhao, W., et al. (2025). Genome–wide association study to identify soybean lodging resistance loci and candidate genes. Int. J. Mol. Sci. 26 (9), 4446. doi: 10.3390/ijms26094446
Liu, Y., Du, H., Li, P., Shen, Y., Peng, H., Liu, S., et al. (2020). Pan–genome of wild and cultivated soybeans. Cell. 182, 162–176.e113. doi: 10.1016/j.cell.2020.05.023
Lu, X., Xiong, Q., Cheng, T., Li, Q. T., Liu, X. L., Bi, Y. D., et al. (2017). A PP2C–1 allele underlying a quantitative trait locus enhances soybean 100–seed weight. Mol. Plant 10, 670–684. doi: 10.1016/j.molp.2017.03.006
Luo, S., Jia, J., Liu, R., Wei, R., Guo, Z., Cai, Z., et al. (2022). Identification of major QTLs for soybean seed size and seed weight traits using a RIL population in different environments. Front. Plant Sci. 13. doi: 10.3389/fpls.2022.1094112
Nguyen, C. X., Paddock, K. J., Zhang, Z., and Stacey, M. G. (2021). GmKIX8–1 regulates organ size in soybean and is the causative gene for the major seed weight QTL qSw17–1. New Phytol. 229, 920–934. doi: 10.1111/nph.16928
Palomeque, L., Li–Jun, L., Li, W., Hedges, B., Cober, E. R., and Rajcan, I. (2009). QTL in mega–environments: II. Agronomic trait QTL co–localized with seed yield QTL detected in a population derived from a cross of high–yielding adapted x high–yielding exotic soybean lines. Theor. Appl. Genet. 119, 429–436. doi: 10.1007/s00122–009–1048–8
Pasapula, V., Shen, G., Kuppu, S., Paez Valencia, J., Mendoza, M., Hou, P., et al. (2011). Expression of an Arabidopsis vacuolar H+–pyrophosphatase gene (AVP1) in cotton improves drought– and salt tolerance and increases fibre yield in the field conditions. Plant Biotechnol. J. 9, 88–99. doi: 10.1111/j.1467–7652.2010.00535.x
Priyanatha, C., Torkamaneh, D., and Rajcan, I. (2022). Genome–wide association study of soybean germplasm derived from canadian x chinese crosses to mine for novel alleles to improve seed yield and seed quality traits. Front. Plant Sci. 13. doi: 10.3389/fpls.2022.866300
Qi, X., Li, M. W., Xie, M., Liu, X., Ni, M., Shao, G., et al. (2014). Identification of a novel salt tolerance gene in wild soybean by whole–genome sequencing. Nat. Commun. 5, 4340. doi: 10.1038/ncomms5340
Quijano, A. and Morandi, E. N. (2023). Leaf area reduction during the pod set period changes the photomorphogenic light balance and increases the pod number and yield in soybean canopies. Field Crops Res. 303, 109148. doi: 10.1016/j.fcr.2023.109148
Renna, L., Stefano, G., Majeran, W., Micalella, C., Meinnel, T., Giglione, C., et al. (2013). Golgitraffic and integrity depend on N–myristoyl transferase–1 in Arabidopsis. Plant Cell. 25, 1756–1773. doi: 10.1105/tpc.113.111393
Rodrigues, J., Miranda, F., Piovesan, N. D., Ferreira, A., Ferreira, M., Cruz, C. D., et al. (2016). QTL mapping for yield components and agronomic traits in a Brazilian soybean population. Crop Breed. Appl. Biotechnol. 16, 265–273. doi: 10.1590/1984–70332016v16n4a41
Singh, P., Sundaram, K. T., Vinukonda, V. P., Venkateshwarlu, C., Paul, P. J., Pahi, B., et al. (2024). Superior haplotypes of key drought–responsive genes reveal opportunities for the development of climate–resilient rice varieties. Commun. Biol. 7, 89. doi: 10.1038/s42003–024–05769–7
Su, D., Jiang, S., Wang, J., Yang, C., Li, W., Li, W., et al. (2019). Identification of major QTLs associated with agronomical traits and candidate gene mining in soybean. Biotechnol. Biotechnol. Equipment. 33, 1481–1493. doi: 10.1080/13102818.2019.1674691
Tian, L., Ma, Z., Qiu, H., Liu, X., Wu, T., Ge, F., et al. (2022). Chitosan Increases Lysine Con-tent through Amino Acid Transporters in Flammulina filiformis. Foods. 11 (14), 2163. doi: 10.3390/foods11142163
Wang, J., Chu, S., Zhang, H., Zhu, Y., Cheng, H., and Yu, D. (2016). Development and application of a novel genome–wide SNP array reveals domestication history in soybean. Sci. Rep. 6, 20728. doi: 10.1038/srep20728
Wang, M., Ding, X., Zeng, Y., Xie, G., Yu, J., Jin, M., et al. (2024). Identification of multiple genetic loci and candidate genes determining seed size and weight in soybean. Agronomy. 14 (9), 1957. doi: 10.3390/agronomy14091957
Wang, X., Wu, X., Ding, G., Yang, F., Yong, T., Wang., X., et al. (2020). Analysis of grain yield differences among soy-bean cultivars under maize–soybean intercropping. Agronomy. 2020, 10. doi: 10.3390/agronomy10010110
Whiting, R. M., Torabi, S., Lukens, L., and Eskandari, M. (2020). Genomic regions associated with important seed quality traits in food–grade soybeans. BMC Plant Biol. 20, 485. doi: 10.1186/s12870–020–02681–0
Woo, H. H., Jeong, B. R., Hirsch, A. M., and Hawes, M. C. (2007). Characterization of Arabidopsis AtUGT85A and AtGUS gene families and their expression in rapidly dividing tissues. Genomics 90, 143–153. doi: 10.1016/j.ygeno.2007.03.014
Wu, D., Li, C., Jing, Y., Wang, J., Zhao, X., and Han, Y. (2020). Identification of quantitative trait loci underlying soybean (Glycine max) 100-seed weight under different levels of phosphorus fertilizer application. Plant Breeding. 139, 959–968. doi: 10.1111/pbr.12850
Xu, M., Kong, K., Miao, L., He, J., Liu, T., Zhang, K., et al. (2023). Identification of major quantitative trait loci and candidate genes for seed weight in soybean. Theor. Appl. Genet. 136, 22. doi: 10.1007/s00122–023–04299–w
Yang, H., Wei, X., Wang, L., Zheng, P., Li, J., Zou, Y., et al. (2025). Functional characterization of peVLN4 involved in regulating pollen tube growth from passion fruit. Int. J. Mol. Sci. 26 (5), 2348. doi: 10.3390/ijms26052348
Yin, X. and Komatsu, S. (2016). Nuclear proteomics reveals the role of protein synthesis and chromatin structure in root tip of soybean during the initial stage of flooding stress. J. Proteome Res. 15, 2283–2298. doi: 10.1021/acs.jproteome.6b00330
Zaman, Q. U., Chu, W., Hao, M., Shi, Y., Sun, M., Sang, S. F., et al. (2019). CRISPR/cas9–mediated multiplex genome editing of JAGGED gene in brassica napus L. Biomolecules. 9 (11), 725. doi: 10.3390/biom9110725
Zhang, D., Cheng, H., Wang, H., Zhang, H., Liu, C., and Yu, D. (2010). Identification of genomic regions determining flower and pod numbers development in soybean (Glycine max L.). J. Genet. Genomics 37, 545–556. doi: 10.1016/S1673–8527(09)60074–6
Zhang, Y., He, J., Wang, Y., Xing, G., Zhao, J., Li, Y., et al. (2015). Establishment of a 100–seed weight quantitative trait locus–allele matrix of the germplasm population for optimal recombination design in soybean breeding programmes. J. Exp. Bo. 66, 6311–6325. doi: 10.1093/jxb/erv342
Zhang, H., Yang, L., Guo, S., Tian, Y., Yang, C., Zhao, C., et al. (2024). A natural al-lelic variant of GmSW17.1 confers high 100–seed weight in soybean. Crop J. 12, 1709–1717. doi: 10.1016/j.cj.2024.10.004
Keywords: soybean, GWAS, yield, KASP marker, pod-related traits
Citation: Liang Z, Qi N, Li R, Gao R, Guo R, Li J, Han Y, Xie N, Zhao W, Yao X and Xie F (2025) Identification of candidate genes and development of KASP markers for soybean pod-related traits using GWAS. Front. Plant Sci. 16:1680918. doi: 10.3389/fpls.2025.1680918
Received: 06 August 2025; Accepted: 31 October 2025;
Published: 26 November 2025.
Edited by:
Francis Chuks Ogbonnaya, Grains Research and Development Corporation, AustraliaReviewed by:
Panagiotis Madesis, University of Thessaly, GreeceHector Lopez-Moreno, University of Wisconsin-Madison, United States
Copyright © 2025 Liang, Qi, Li, Gao, Guo, Li, Han, Xie, Zhao, Yao and Xie. This is an open-access article distributed under the terms of the Creative Commons Attribution License (CC BY). The use, distribution or reproduction in other forums is permitted, provided the original author(s) and the copyright owner(s) are credited and that the original publication in this journal is cited, in accordance with accepted academic practice. No use, distribution or reproduction is permitted which does not comply with these terms.
*Correspondence: Xingdong Yao, eGluZ2Rvbmd5YW9Ac3lhdS5lZHUuY24=; Futi Xie, eGZ0Mjk5QHN5YXUuZWR1LmNu