 William Underwood
 Roshan Sharma Poudel
- 1Edward T. Schafer Agricultural Research Center, Sunflower Improvement Research Unit, USDA Agricultural Research Service, Fargo, ND, United States
- 2Department of Plant Pathology, North Dakota State University, Fargo, ND, United States
Introduction: The necrotrophic fungus Sclerotinia sclerotiorum is a destructive plant pathogen that can infect a broad range of host plants, including many agriculturally important crop species. Resistance to S. sclerotiorum is partial and quantitative, controlled by many genes. The identities of genes influencing resistance and the molecular mechanisms governing defense against this pathogen are poorly understood. To improve understanding of resistance, we performed genome-wide association studies of Arabidopsis thaliana response to inoculation with two isolates of the pathogen differing in aggressiveness and sought to validate our results by identifying the causal gene at a single mapped locus.
Methods: A total of 325 A. thaliana ecotypes were evaluated for resistance at two timepoints after inoculation with S. sclerotiorum isolate 1980 or BN325. Genome-wide association studies were carried out using two different models to identify loci associated with resistance. A. thaliana mutant lines were then evaluated for candidate genes at a single locus to identify the most likely candidate gene influencing resistance, and sequencing of the candidate gene and promoter region was performed to identify putative causal variants.
Results and discussion: Genome-wide association studies mapped 30 loci associated with resistance to S. sclerotiorum. Surprisingly, correlations for response to the two isolates among A. thaliana ecotypes were relatively weak and no overlapping loci were mapped for resistance to both isolates. A. thaliana med20a mutants impaired in a subunit of the transcriptional Mediator complex were more susceptible to S. sclerotiorum and a single variant upstream of the MED20a gene was associated with resistance. These results improve our mechanistic understanding of resistance to this important plant pathogen.
Introduction
The necrotrophic fungal pathogen Sclerotinia sclerotiorum causes disease on a broad range of primarily dicot plant species, significantly impacting global agricultural production. This fungus infects numerous crop plants such as soybeans, canola, sunflowers, lettuce, and dry edible beans. S. sclerotiorum can also infect model plant species such as Arabidopsis thaliana and Nicotiana benthamiana, allowing for the use of research tools developed for these model species to study genes and molecular mechanisms underlying resistance to this pathogen. Complete resistance to S. sclerotiorum has not been identified in host plant species. Instead, resistance is partial and quantitative, conditioned by many genes exerting relatively small effects on the overall level of partial resistance (Bolton et al., 2006; Wang et al., 2019; Derbyshire et al., 2022). The quantitative nature of resistance to this pathogen has made breeding for crop varieties with high levels of resistance challenging and has hindered efforts to identify genes underlying resistance.
As noted above, the model plant species A. thaliana is susceptible to S. sclerotiorum and has been used extensively to study resistance to this necrotrophic pathogen. The use of A. thaliana as a model to elucidate mechanisms of resistance to S. sclerotiorum initially focused on studies of known mutants defining specific defense signaling pathways. These studies established important roles for jasmonic acid (JA) and ethylene (ET) signaling in resistance to S. sclerotiorum and identified A. thaliana coi1 mutants defective in the JA receptor as highly susceptible to this pathogen (Guo and Stotz, 2007). Further mutant studies have subsequently identified a number of additional genes and pathways contributing to S. sclerotiorum resistance in A. thaliana. These include nitric oxide and reactive oxygen species signaling, auxin signaling components, the ABCG40 transporter, the AN (ANGUSTIFOLIA) gene modulating JA biosynthesis, the GDSL1 lipase, and camalexin and aliphatic glucosinolate metabolites (Perchepied et al., 2010; Stotz et al., 2011a, Stotz et al., 2011b; Ding et al., 2020; Sucher et al., 2020; Gao et al., 2021). Additionally, a proteinaceous elicitor called SCFE1 (SCLEROTINIA CULTURE FILTRATE ELICITOR) was identified that induces responses similar to microbe-associated molecular patterns (MAMPs) from other pathogens (Zhang et al., 2013a). Several A. thaliana ecotypes exhibited insensitivity to this elicitor, allowing for mapping of the RLP30 gene encoding a receptor-like protein required for perception of SCFE1. Knockout mutants for RLP30 as well as the BAK1 (BRASSINOSTEROID-INSENSITIVE1-ASSOCIATED RECEPTOR KINASE1) and SOBIR1 (SUPPRESSOR OF BIR1-1) components involved in MAMP signaling exhibited increased susceptibility to S. sclerotiorum (Zhang et al., 2013a).
In addition to the genes and pathways described above, the MED16 subunit of the A. thaliana transcriptional Mediator complex has also been implicated in resistance to S. sclerotiorum (Wang et al., 2015). Mediator is a large, multi-subunit protein complex conserved among eukaryotes that serves as a transcriptional cofactor to RNA polymerase II and integrates regulatory information through interactions with gene-specific as well as general transcription factors (Kidd et al., 2011; An and Mou, 2013; Chen et al., 2022). Numerous Mediator complex subunits have been implicated in A. thaliana defense responses against a variety of pathogens with different infection strategies. Loss-of-function med16 mutants were highly susceptible to S. sclerotiorum and more susceptible than the JA signaling defective coi1 mutant, indicating a specific role for this subunit in response to S. sclerotiorum (Wang et al., 2015). The A. thaliana MED15 and MED16 Mediator subunits were found to play a role in SA signaling and activation of systemic acquired resistance (SAR) and med16 mutants also exhibited increased susceptibility to the necrotrophic pathogens Alternaria brassicicola and Botrytis cinerea (Wathagula et al., 2012; Zhang et al., 2012). Similarly, med21 and med25 mutants also exhibited increased susceptibility to A. brassicicola and B. cinerea and med8 mutants are also hypersusceptible to B. cinerea (Dhawan et al., 2009; Kidd et al., 2009; Li et al., 2018). The MED14 Mediator subunit was also found to be required for activation of SAR, and mutants exhibited increased susceptibility to virulent and avirulent strains of the bacterial pathogen Pseudomonas syringae pv. tomato DC3000 (Zhang et al., 2013b). In contrast to responses observed for necrotrophic pathogens, A. thaliana med8, med18, med20a, and med25 mutants exhibit increased resistance to the hemibiotrophic fungus Fusarium oxysporum (Kidd et al., 2009; Fallath et al., 2017). Collectively, these results highlight the central role of the Mediator complex in integrating transcriptional signals relating to pathogen defense activation and indicate that specific subunits may play distinct roles in response to pathogens with different infection strategies.
Studies of mutants have been important in establishing roles for specific signaling pathways in resistance to S. sclerotiorum; however, whether relevant natural variation in these genes contributes to differences in response among A. thaliana accessions has not been established. Although biotechnological approaches for altering crop traits have proliferated and will be further advanced using CRISPR gene editing technology, breeding of most crop species still relies primarily or exclusively on naturally existing genetic variation. Thus, it is of considerable value to understand the natural variation driving intraspecific differences in resistance to this fungus. More recent research has utilized genome-wide association studies (GWAS) involving naturally occurring A. thaliana ecotypes to map loci contributing to S. sclerotiorum resistance. GWAS carried out using 84 A. thaliana ecotypes inoculated with S. sclerotiorum isolate 1980 identified two significant associations for resistance, and a prolyl-oligopeptidase was found to underly an association with resistance on chromosome 1 (Badet et al., 2017). In a follow-up study involving 100 A. thaliana ecotypes, expression variation associated with polymorphisms in the promoter region of the ARPC4 gene encoding an actin-related protein contributing to cytoskeletal dynamics was associated with resistance to S. sclerotiorum (Badet et al., 2019). Additionally, automated phenotyping of disease development on six A. thaliana ecotypes inoculated with seven different S. sclerotiorum isolates identified the LAZ5 disease resistance gene encoding a canonical nucleotide-binding leucine-rich repeat (NB-LRR) resistance protein as a likely susceptibility factor, with mutants in this gene exhibiting enhanced resistance to S. sclerotiorum (Barbacci et al., 2020).
Accumulating evidence indicates that different plant genotypes within host species do not necessarily respond similarly to distinct S. sclerotiorum isolates. Significant plant genotype × pathogen isolate interactions have been reported for soybean, canola, and sunflower diseases caused by S. sclerotiorum (Garg et al., 2010; Davar et al., 2011; Ge et al., 2012; Willbur et al., 2017; Musa-Khalifani et al., 2021; Buchwaldt et al., 2022; Angidi et al., 2025). Consistent with these studies in crop hosts, significant genotype × isolate interactions were also observed in a study of 17 A. thaliana ecotypes inoculated with 8 diverse S. sclerotiorum isolates (Ge and Barbetti, 2019). Although it is increasingly clear that genetic diversity among S. sclerotiorum isolates plays an important role in determining the outcome of interactions with distinct host genotypes, most studies delineating genes and molecular mechanisms involved in resistance to S. sclerotiorum have involved single isolates of the pathogen.
Given the need for additional information on natural variation underlying differences in resistance to S. sclerotiorum and the emerging need to incorporate S. sclerotiorum isolate diversity into such genetic studies, the present study utilized GWAS of A. thaliana responses to S. sclerotiorum using a larger number of plant genotypes, two timepoints after inoculation, and two pathogen isolates differing in aggressiveness. We identified a total of 30 loci significantly associated with resistance to at least one isolate at one of the timepoints evaluated. Strikingly, responses of the 315 A. thaliana ecotypes evaluated for resistance to both S. sclerotiorum isolates were relatively weakly correlated, and no overlapping loci were mapped for resistance to the two isolates. Follow-up studies focused on a single mapped locus with multiple potential candidate genes identified a contribution of the Mediator complex subunit MED20a to S. sclerotiorum resistance, and variation in MED20a expression patterns was observed in susceptible compared with partially resistant ecotypes. These results expand knowledge of mechanisms underlying quantitative resistance to S. sclerotiorum and will inform future efforts aimed at genetic dissection of resistance to this destructive pathogen.
Materials and methods
Plant materials and growth conditions
Transferred DNA (T-DNA) insertional mutant lines of Arabidopsis thaliana (L.) Heynh. with insertions in genes At2g28210 (SALK_080341C), At2g28220 (SALK_026063C), and At2g28225 (SALK_012867C), along with a set of 359 natural accessions (stock # CS76309; Li et al., 2010), were acquired from the Arabidopsis Biological Resource Center (Ohio State University, Columbus, OH). The med20a (At2g28230) mutant was kindly provided by Dr. Yun Ju Kim (Kim et al., 2011). A. thaliana plants were grown in growth chambers at 21 °C with a 16-h photoperiod and a light intensity of 120 µM m−2 s−1.
S. sclerotiorum isolates, growth conditions, and inoculum preparation
S. sclerotiorum isolates 1980, BN325, BN500, JS558, SunA320, and NE-Canola-07 were collected from Phaseolus vulgaris, Lactuca sativa, Brassica napus, P. vulgaris, Helianthus annuus, and B. napus, respectively, and have been described previously (Amselem et al., 2011; Otto-Hanson et al., 2011; Aldrich-Wolfe et al., 2015; Poudel et al., 2023). Isolates were initially grown by plating a single sclerotium on potato dextrose agar (PDA) and incubating at 22°C for 4 days. Ground mycelial inoculum was prepared by excising three 5-mm plugs from the edge of the growing colony using a cork borer and transferring to a 50-ml conical tube containing 25 ml of potato dextrose broth (PDB). The PDB liquid culture was incubated on a platform shaker at 22°C with shaking at 90 rpm for 3 days. The mycelial culture was then homogenized using a Polytron homogenizer (Kinematica) with speed setting three for 25 s. The homogenized mycelial inoculum was subsequently evaluated using a spectrophotometer (BioPhotometer, Eppendorf) and adjusted to an optical density of 0.5 at 700-nm wavelength.
Plant inoculations and disease evaluations
Prior to inoculation with S. sclerotiorum, A. thaliana plants were grown for 3 weeks in a growth chamber as described above. Three-week old plants were inoculated by spotting 10 µl of ground mycelial inoculum onto two leaves per plant near the leaf tip, avoiding the mid-vein. Inoculated plants were then covered with a humidity dome, and the growth chamber temperature was reduced to 18°C to compensate for the increased temperature beneath the humidity dome. Plants were visually evaluated for disease at 4 and 7 days post inoculation (dpi) using the disease rating scale shown in Table 1. For initial evaluations of S. sclerotiorum isolate aggressiveness, six S. sclerotiorum isolates were inoculated on A. thaliana ecotype Col-0. A total of six plants were inoculated with each S. sclerotiorum isolate, and the experiment was arranged in a randomized complete block design. Disease ratings at 4 and 7 dpi were analyzed using a generalized linear mixed model (GLMM) implemented in SAS version 9.4 (PROC GLIMMIX) with block considered as a random effect. For analysis of ordinal rating data, the GLMM was fit with a multinomial distribution and cumulative logit link function. Means were separated using Tukey’s post-hoc test at α = 0.05 (Tukey, 1949). The experiment was repeated with similar results. To facilitate genome-wide association studies, 325 A. thaliana ecotypes were evaluated for response to the weakly aggressive S. sclerotiorum isolate BN325 and the highly aggressive isolate 1980. Disease evaluations of 325 A. thaliana ecotypes were carried out in α-lattice designs in which each of the two isolates was inoculated onto nine plants of each A. thaliana ecotype. Disease ratings at 4 and 7 dpi from α-lattice experiments were analyzed using a GLMM fit with a multinomial distribution and cumulative logit link function with replicate and block (within replicate) considered as random effects. Means were separated using Tukey’s post-hoc test at α = 0.05. For evaluation of A. thaliana mutant lines, 15 plants of each mutant line, along with the parent line Col-0, were inoculated with S. sclerotiorum isolates BN325 or 1980 in each experimental run and three independent experimental runs were conducted. Disease rating data for the three experimental runs was evaluated for homogeneity of variance across experiments using the Fligner-Killeen test via the fligner.test function of R v. 4.3.2 (Fligner and Killeen, 1976). The data from three experimental runs were combined for further analysis upon confirmation of homogeneity of variance. Disease rating data were then evaluated using a GLMM as described above considering experimental run and replicate (within experimental run) as random effects. Means were compared with the Col-0 parent line using Dunnett’s test at α = 0.05 (Dunnett, 1955).
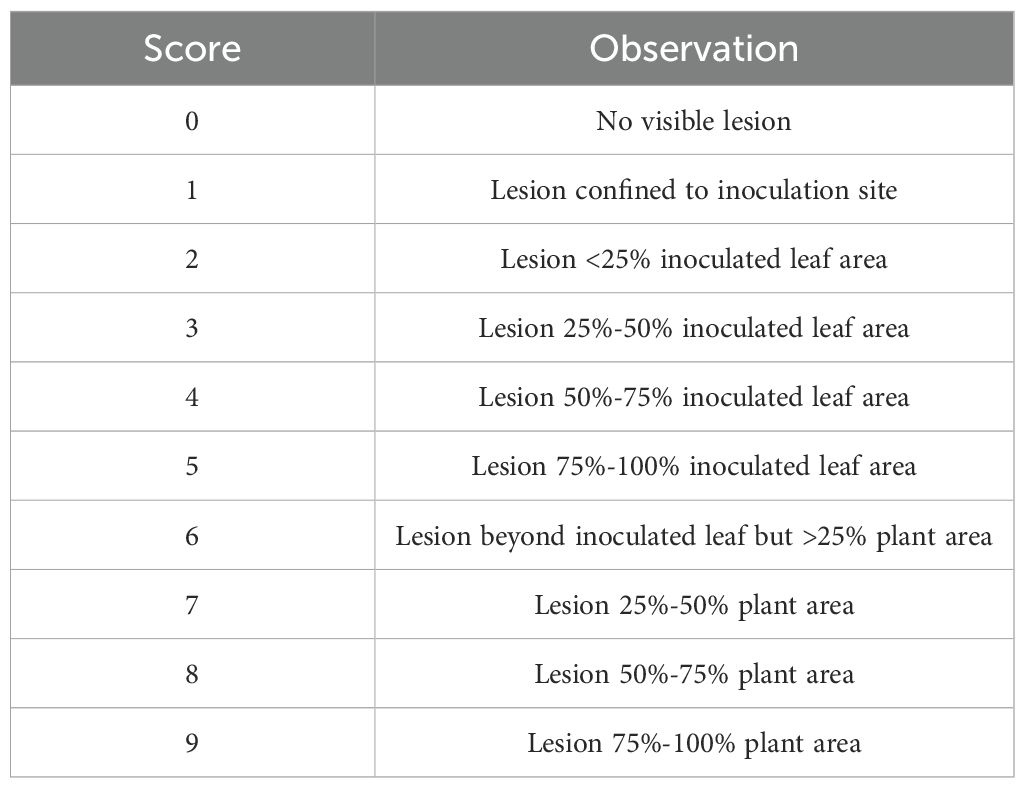
Table 1. Rating scale used to score S. sclerotiorum disease severity on A. thaliana ecotypes at 4- and 7-days post inoculation by spotting of leaves with ground mycelia.
Genome-wide association studies
Publicly available imputed single-nucleotide polymorphism (SNP) data for 2029 A. thaliana accessions were obtained (Arouisse et al., 2020; https://figshare.com/articles/dataset/arabidopsis_2029_Maf001_filter95/11346875/1). These SNP data were filtered to retain only the 325 ecotypes used in this study and to remove markers with minor allele frequency <3% and missing data >10%. The filtered SNP dataset was used with disease rating data for 4 and 7 dpi with S. sclerotiorum isolates BN325 and 1980 to carry out genome-wide association studies (GWAS) using the FarmCPU (fixed and random model circulating probability unity) algorithm in the R package GAPIT v. 3 where population structure correction was based on three principal components (Wang and Zhang, 2021). GWAS was also carried out using GEMMA (genome-wide efficient mixed model association; Zhou and Stephens, 2012). Genome-wide significance thresholds for associated markers were determined using the Bonferroni correction as well as the SimpleM method (Gao et al., 2008). Model fits were examined using quantile–quantile (QQ) plots (Supplementary Figures S2, S3). Linkage disequilibrium (LD) blocks surrounding associated SNP markers passing the SimpleM significance threshold were determined using PLINK v. 1.9 with an R2 value of 0.6 to define LD (Purcell et al., 2007). Annotations for genes within LD blocks surrounding significant associations were obtained from TAIR (The Arabidopsis Information Resource; www.arabidopsis.org).
MED20a sequencing
Sequencing of the MED20a (At2g28230) genomic region including 1,500 bp upstream of the start codon and spanning the 3′ untranslated region was carried out using primers listed in Supplementary Table S2. DNA was isolated from A. thaliana ecotypes Col-0, Bg-2, Lm-2, Shahdara, TOU-I-17, Ag-0, Dra-2, UKSE06-414, and Zdr-6 using a GeneJET Plant Genomic DNA purification kit (Thermo Fisher Scientific) according to the manufacturer’s protocol. DNA concentrations were assessed using a Qubit 3.0 fluorometer. Polymerase chain reaction (PCR) fragments were generated using primer pairs MED20a Fwd-1/MED20a Rev-1 through MED20a Fwd-6/MED20a Rev-6. PCR was carried out in 25-µl reaction volumes containing 50 ng genomic DNA, 10 µM of each primer, 2.5 U of Taq DNA polymerase (Accuris Life Science Reagents), 1× Taq reaction buffer, and 100 mM dNTPs. PCR reactions were subjected to thermal cycling with an initial denaturation of 94°C for 3 min; 35 cycles of 94°C for 30 s, annealing for 30 s at 50°C to 54°C depending on primer pair; and 72°C for 1 min, with a final extension at 72°C for 10 min. Aliquots of 5 µl were electrophoresed on 1% agarose gels to verify amplification, and PCR products were cleaned up using ExoSAP-IT reagent (Thermo Fisher Scientific). PCR products were sequenced using Sanger technology by Eurofins Genomics with sequencing from both ends of each PCR product in separate reactions. Multiple sequence alignments were performed using Clustal Omega (Sievers et al., 2011).
Real-time quantitative PCR
Total RNA was isolated from leaf tissues of A. thaliana ecotypes Ag-0, Dra-2, UKSE06-414, Zdr-6, Bg-2, Lm-2, Shahdara, and TOU-I-17 collected at 0, 8, 24, and 48 h post inoculation (hpi) with S. sclerotiorum isolate BN325 using a GeneJET Plant RNA isolation kit (Thermo Fisher Scientific). A total of 500 ng of RNA for each sample was treated with DNase I and used in a reverse transcription reaction with iScript Reverse Transcription Supermix (Bio-Rad) according to the manufacturer’s instructions. RT-qPCR was performed using 1 µl cDNA, SsoAdvanced Universal SYBR Green Supermix (Bio-Rad), and primers to amplify a region of the MED20a transcript (fwd: GTTGCCGGGTAAGTTTGTGA; rev: CAGCTGTGTGTTGTGGAGTG) or to amplify a region of the UBQ10 transcript as an internal standard (fwd: GGCCTTGTATAATCCCTGATGAATAAG; rev: AAAGAGATAACAGGAACGGAAACATAGT). A Bio-Rad CFX Connect instrument (Bio-Rad) was used to perform cycling with a program of 50°C for 2 min; 95°C for 2 min; and 40 cycles of 95°C for 15 s, 58°C for 15 s, and 72°C for 1 min, with data collection at the end of each cycle. Data were analyzed using the ΔΔCT method (Schmittgen and Livak, 2008) with CFX Manager software (Bio-Rad). UBQ10 was used as the internal control to normalize all samples, and the 0-hpi timepoint was used as the reference sample for each ecotype.
Results
Responses of 325 A. thaliana ecotypes to inoculation with two S. sclerotiorum isolates differing in aggressiveness
A collection of 325 geographically and genetically diverse A. thaliana ecotypes was evaluated for response to the aggressive and fully sequenced reference S. sclerotiorum isolate 1980. Disease progression was scored at both 4 and 7 dpi as the 4-dpi timepoint generally reflected the timing at which the expanding lesion formed by isolate 1980 on A. thaliana ecotype Col-0 encompassed the entire inoculated leaf and began to move into the petiole (Table 1). We reasoned that different defense mechanisms may operate in resistance to lesion expansion within the original inoculated leaf compared with those potentially involved in restricting lesion expansion into the petiole and systemically throughout the rest of plant. Significant differences (P < 0.001) in levels of resistance to S. sclerotiorum isolate 1980 were observed between A. thaliana ecotypes at both the 4- and 7-dpi timepoints. At 4 dpi, mean disease scores ranged from 2.98 for ecotype Fja1–1 to 7.95 for ecotype Wa-1, reflecting a very broad range of responses to inoculation in which the most resistant ecotype exhibited small lesions that encompassed <50% of the inoculated leaf area whereas the most susceptible ecotype exhibited lesions that covered over 50% of the entire plant area (Table 1; Figure 1A; Supplementary Table S1). At 7 dpi, mean disease scores ranged from 5.01 for ecotype Tad01 to the highest possible disease score of 9, observed for 28 ecotypes and reflecting expansion of the disease lesion to cover the entire plant area resulting in plant death (Figure 1A; Supplementary Table S1). At 7 dpi with isolate 1980, the majority of A. thaliana ecotypes exhibited severe disease with lesions covering over 75% of the plant area (Figure 1A).
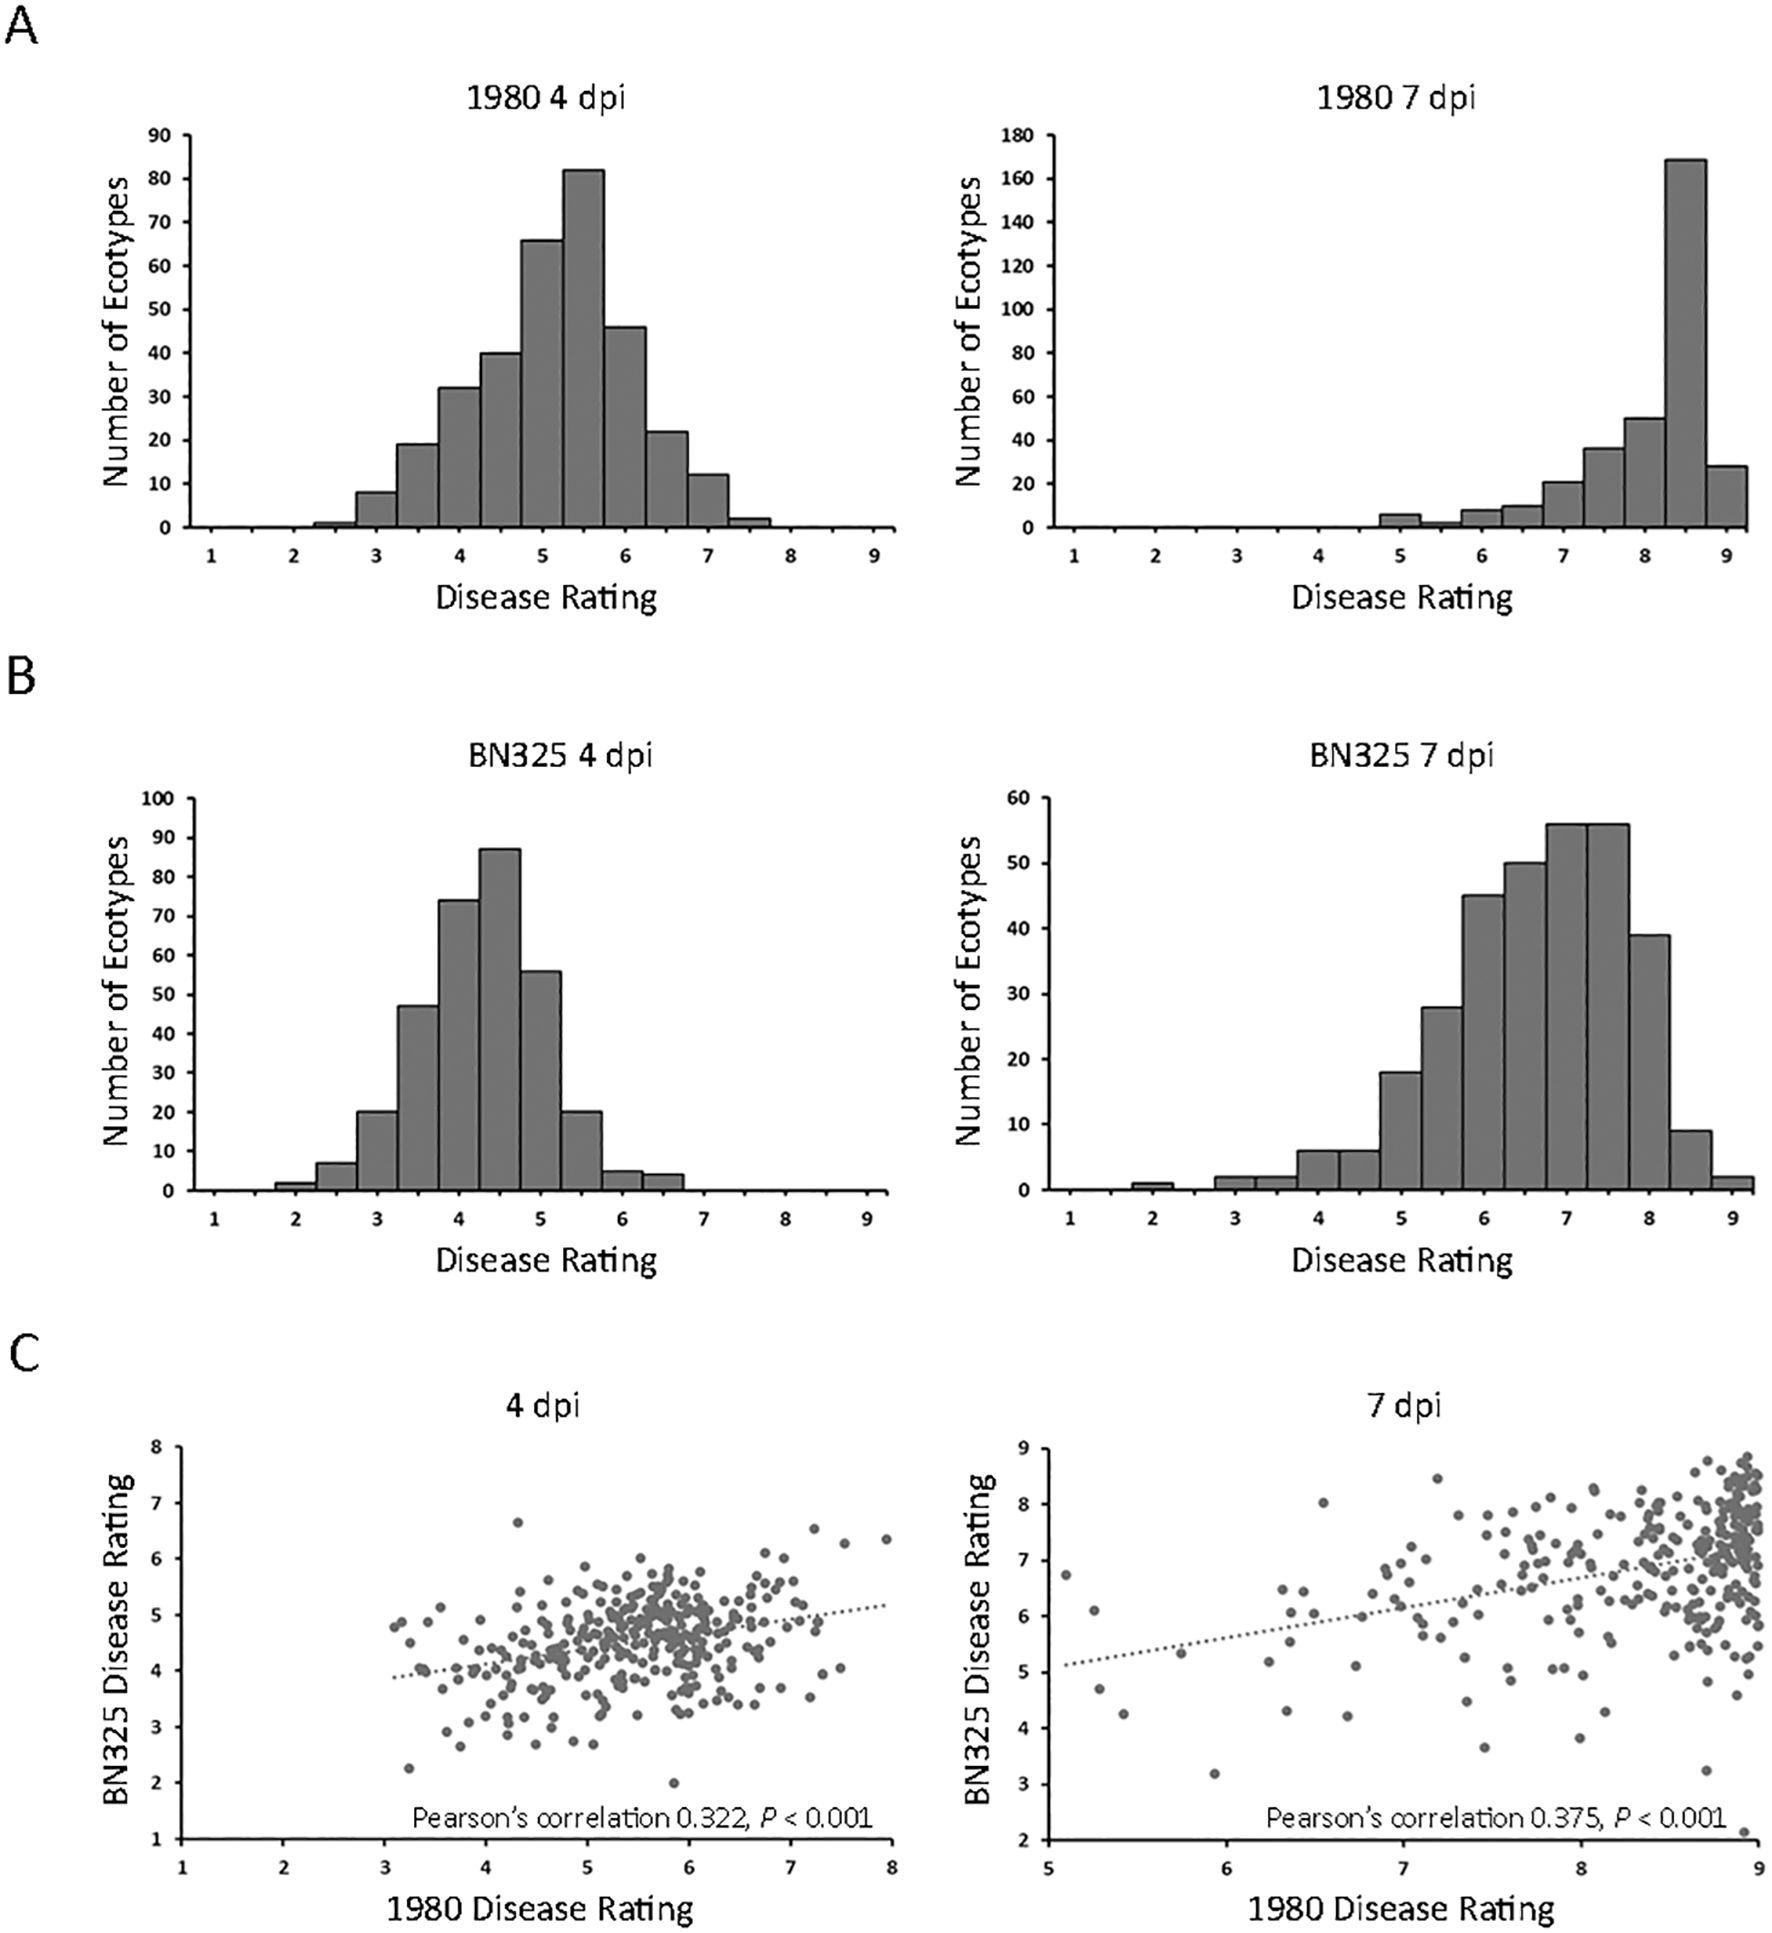
Figure 1. Disease responses of 325 A. thaliana ecotypes inoculated with two S. sclerotiorum isolates. (A) Distributions of mean disease rating scores for 325 A. thaliana ecotypes at 4 days post inoculation (dpi; left panel) and 7 dpi (right panel) with S. sclerotiorum isolate 1980. (B) Distributions of mean disease rating scores for 315 A. thaliana ecotypes at 4 dpi (left panel) and 7 dpi (right panel) with S. sclerotiorum isolate BN325. (C) Scatterplots of disease ratings of 315 A. thaliana ecotypes at 4 dpi (left panel) and 7 dpi (right panel) with S. sclerotiorum isolates 1980 (x-axis) and BN 325 (y-axis) and Pearson’s correlation coefficients.
To determine if A. thaliana ecotypes responded similarly to different S. sclerotiorum isolates, we first sought to identify an isolate exhibiting a significantly different level of aggressiveness on A. thaliana compared with isolate 1980. A total of six S. sclerotiorum isolates, including isolate 1980, collected from different host plants were inoculated onto A. thaliana ecotype Col-0, and disease was evaluated at 4 and 7 dpi. Isolate JS558 collected from P. vulgaris in Minnesota was significantly more aggressive than isolate 1980 on Col-0 at both timepoints whereas isolate BN325, collected from L. sativa in Arizona, was significantly less aggressive than 1980 at both timepoints (Supplementary Figure S1). Given that isolate 1980 caused severe disease on most tested A. thaliana ecotypes at 7 dpi, we selected the weakly aggressive isolate BN325 for additional phenotyping of the A. thaliana ecotype collection. A total of 315 of the 325 A. thaliana ecotypes were evaluated for response to S. sclerotiorum isolate BN325 whereas 10 ecotypes were omitted due to limited seed availability. Significant differences (P < 0.001) in response to isolate BN325 were observed between ecotypes at both 4 and 7 dpi. At 4 dpi with BN325, mean disease scores ranged from 2.01 for ecotype Dra-2 to 6.65 for ecotype Ler-1 (Figure 1B; Supplementary Table S1). At 7 dpi, mean disease scores ranged from 2.75 for ecotype Sei-0 to the highest possible disease score of 9 for ecotypes Pro-0 and Bg-2 (Figure 1B; Supplementary Table S1). Consistent with initial observations on ecotype Col-0, isolate BN325 was generally less aggressive than isolate 1980 on A. thaliana, with lower disease scores at both 4 and 7 dpi and only two ecotypes exhibiting complete plant death at 7 dpi with BN325 compared with 28 ecotypes at 7 dpi with isolate 1980 (Figure 1). Correlations among responses for the 315 ecotypes inoculated with both isolates were evaluated for both timepoints. At 4 dpi, a significant correlation (P < 0.001) was observed for ecotype responses to the two isolates with Pearson’s correlation coefficient of 0.322, whereas at 7 dpi, a similarly significant correlation (P < 0.001) was observed with Pearson’s correlation coefficient of 0.375 (Figure 1C).
Genome-wide association mapping of A. thaliana loci contributing to S. sclerotiorum resistance
Disease rating data at 4 and 7 dpi for the A. thaliana ecotype collection inoculated with S. sclerotiorum isolates 1980 or BN325 were used along with SNP genotyping data from a publicly available dataset to carry out genome-wide association studies (GWAS) of resistance to the two isolates. Two different models, GEMMA and FarmCPU, were used to carry out GWAS, and results from both models are reported. Associations were named Qrss for quantitative trait locus (QTL) for resistance to S. sclerotiorum, followed by the A. thaliana chromosome number and the number of the QTL on that chromosome. For resistance to isolate 1980 at the 4-dpi timepoint, only a single significant association was identified on chromosome 4 by both the GEMMA and FarmCPU models (Figure 2; Table 2; Supplementary Figure S2). A total of four significant associations were identified for resistance to isolate 1980 at the 7-dpi timepoint by the GEMMA model, whereas six significant associations were identified by the FarmCPU model and three associations were identified by both models (Figure 2; Table 2; Supplementary Figure S2). SNP markers significantly associated with resistance to isolate 1980 at the 7-dpi timepoint were found on A. thaliana chromosomes 1, 3, 4, and 5 (Figure 2; Table 2). A single association for resistance to isolate BN325 at the 4-dpi timepoint was identified on chromosome 3 by the GEMMA model (Figure 3; Table 2; Supplementary Figure S3). Three significant associations were identified for resistance to isolate BN325 at the 7-dpi timepoint by the GEMMA model, whereas nine significant associations were identified by the FarmCPU model and one association was identified by both models (Figure 3; Table 2; Supplementary Figure S3). Additionally, a single significant association was identified by FarmCPU for resistance to BN325 at both timepoints and two associations were identified by both GWAS models for resistance to BN325 at both timepoints (Table 2). SNP markers associated with resistance to isolate BN325 were identified on all five A. thaliana chromosomes. Linkage disequilibrium (LD) blocks surrounding each associated SNP marker were defined based on the A. thaliana Col-0 reference genome using an R2 value of 0.6 as a cutoff. LD blocks varied considerably in their size and the number of genes they encompassed, ranging from a predicted 291-bp LD block lacking any predicted gene models for association Qrss5.4 on chromosome 5 to an ~145-kb LD block encompassing 44 predicted gene models for association Qrss3.3 on chromosome 3 (Tables 2; 3). No common associations nor associations with overlapping LD blocks were identified for resistance to both S. sclerotiorum isolates at either timepoint. Annotations for predicted gene models within LD blocks were examined to identify genes with known or predicted functions in defense against pathogens, and annotations for the gene nearest to the associated SNP marker are also presented (Table 3). Five associated loci exhibited one or more predicted canonical disease resistance (R) genes with nucleotide binding and leucine-rich repeat domains (NB-LRRs) within the predicted LD blocks, whereas three loci exhibited predicted LRR kinase genes within LD blocks and two loci encompassed WRKY transcription factors (Table 3). Of the 30 total associations identified by GWAS, 14 loci did not feature genes with known or predicted defense-related functions within LD of the associated marker (Table 3).
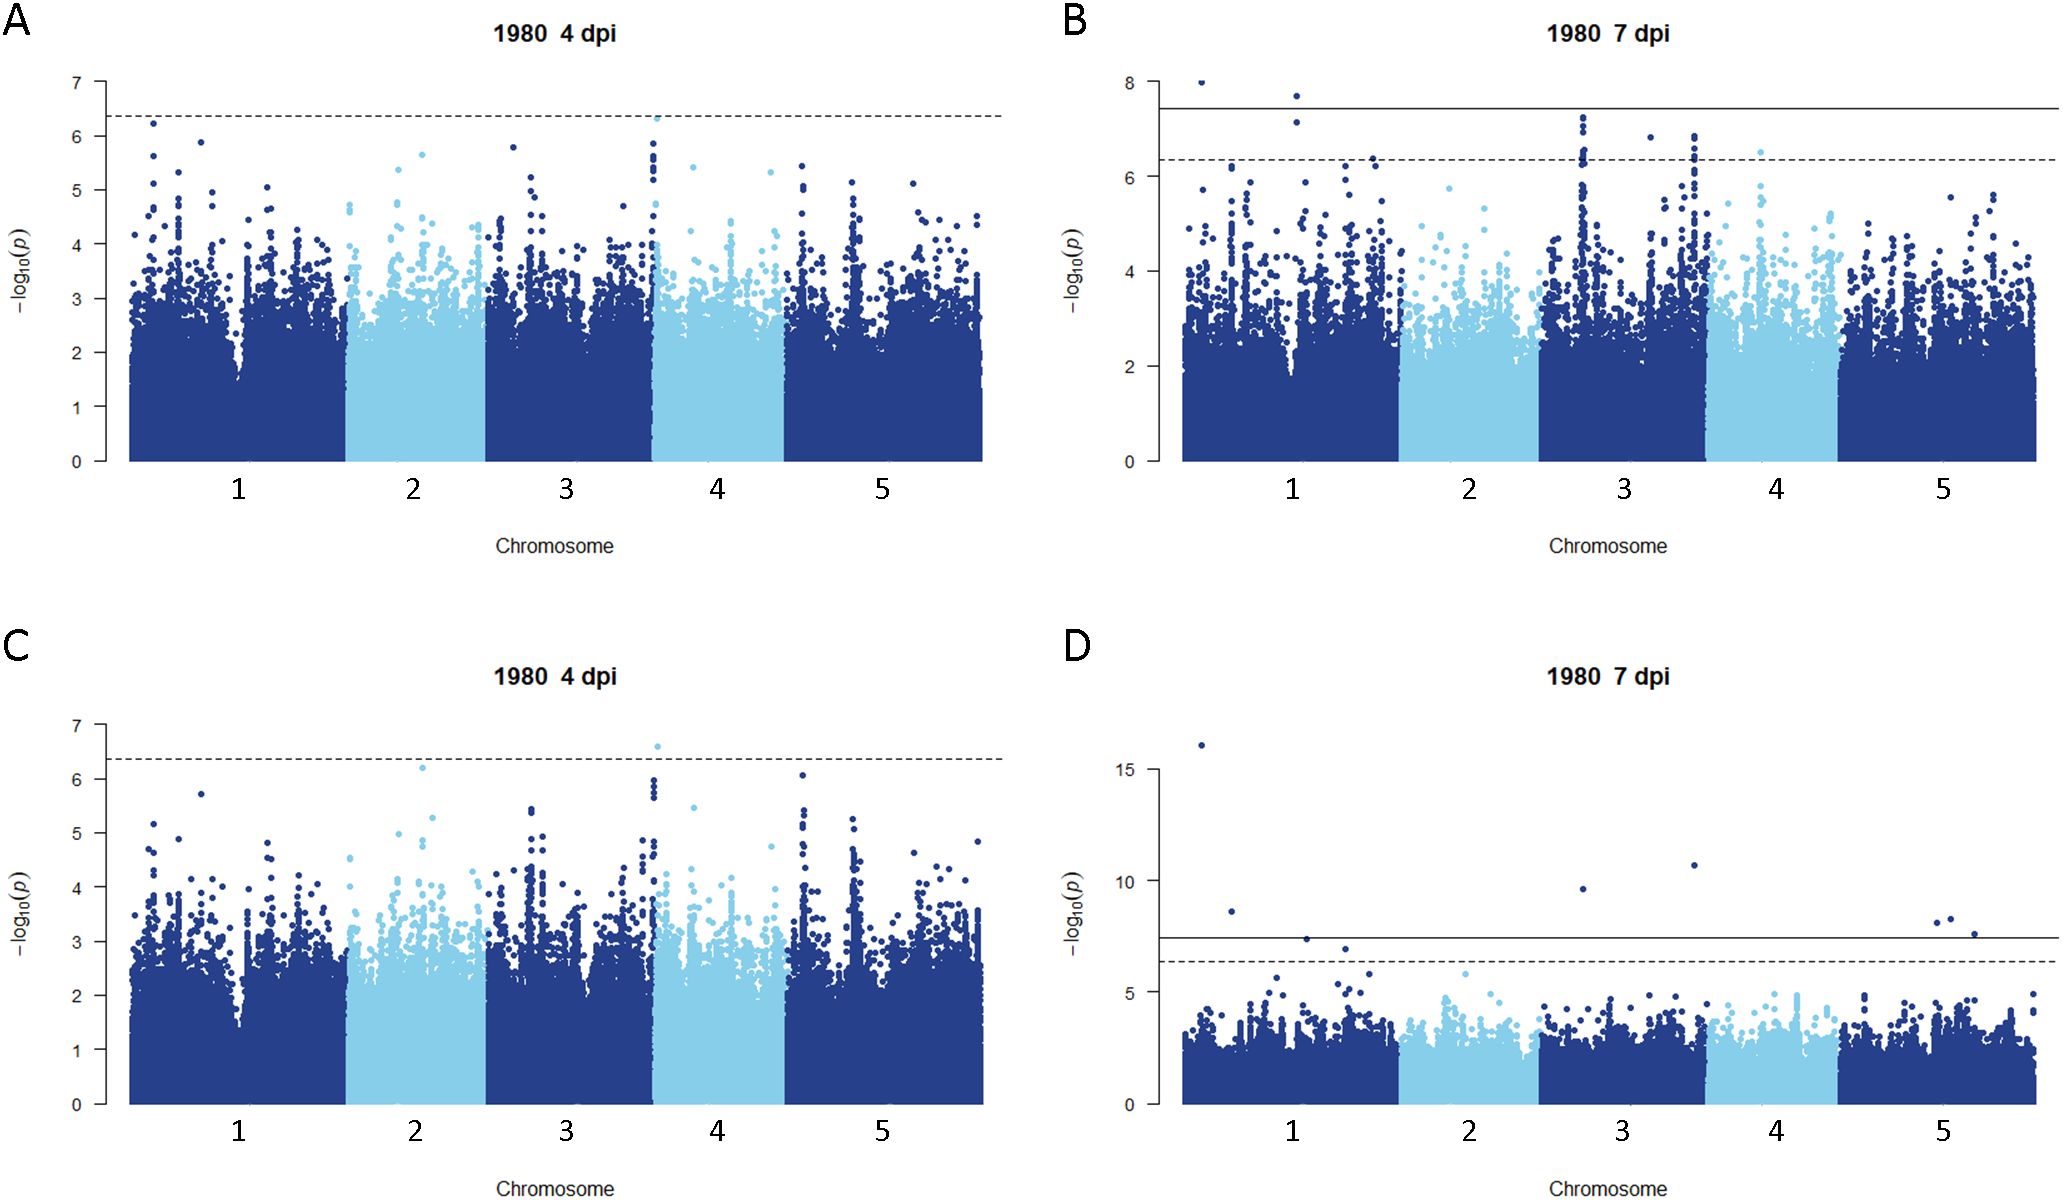
Figure 2. Genome-wide association for A. thaliana resistance to S. sclerotiorum isolate 1980. (A, B) Manhattan plots of genome-wide association for A. thaliana resistance to S. sclerotiorum isolate 1980 at 4 and 7 dpi determined using GEMMA. (C, D) Manhattan plots of genome-wide association for A. thaliana resistance to S. sclerotiorum isolate 1980 at 4 and 7 dpi determined using FarmCPU. In all panels, solid lines indicate genome-wide significance thresholds determined using the Bonferroni multiple comparison correction, and dashed lines indicate significance thresholds determined using the SimpleM method.
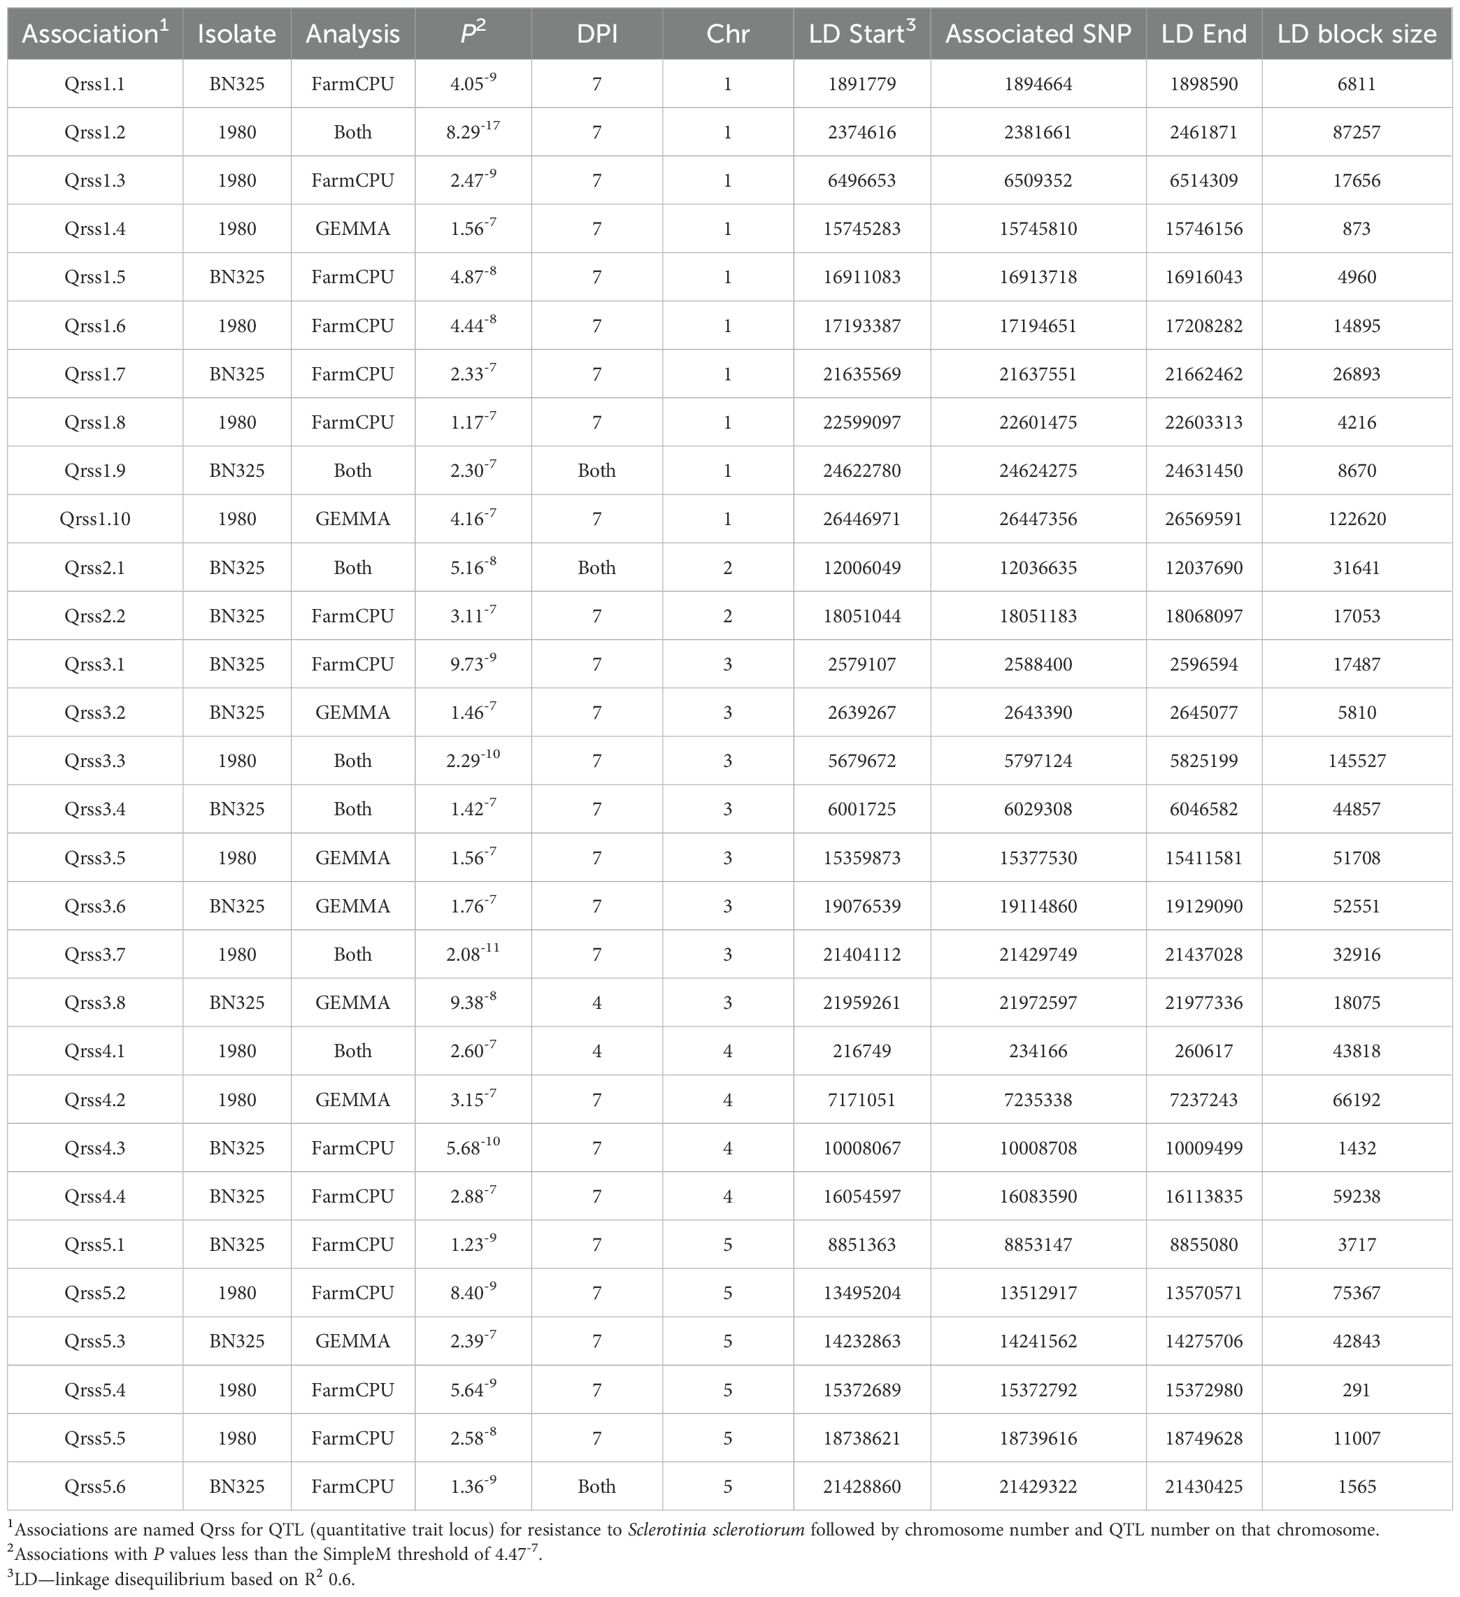
Table 2. Details for single-nucleotide polymorphism markers associated with resistance to S. sclerotiorum isolates 1980 and BN325 discovered by genome-wide association studies.
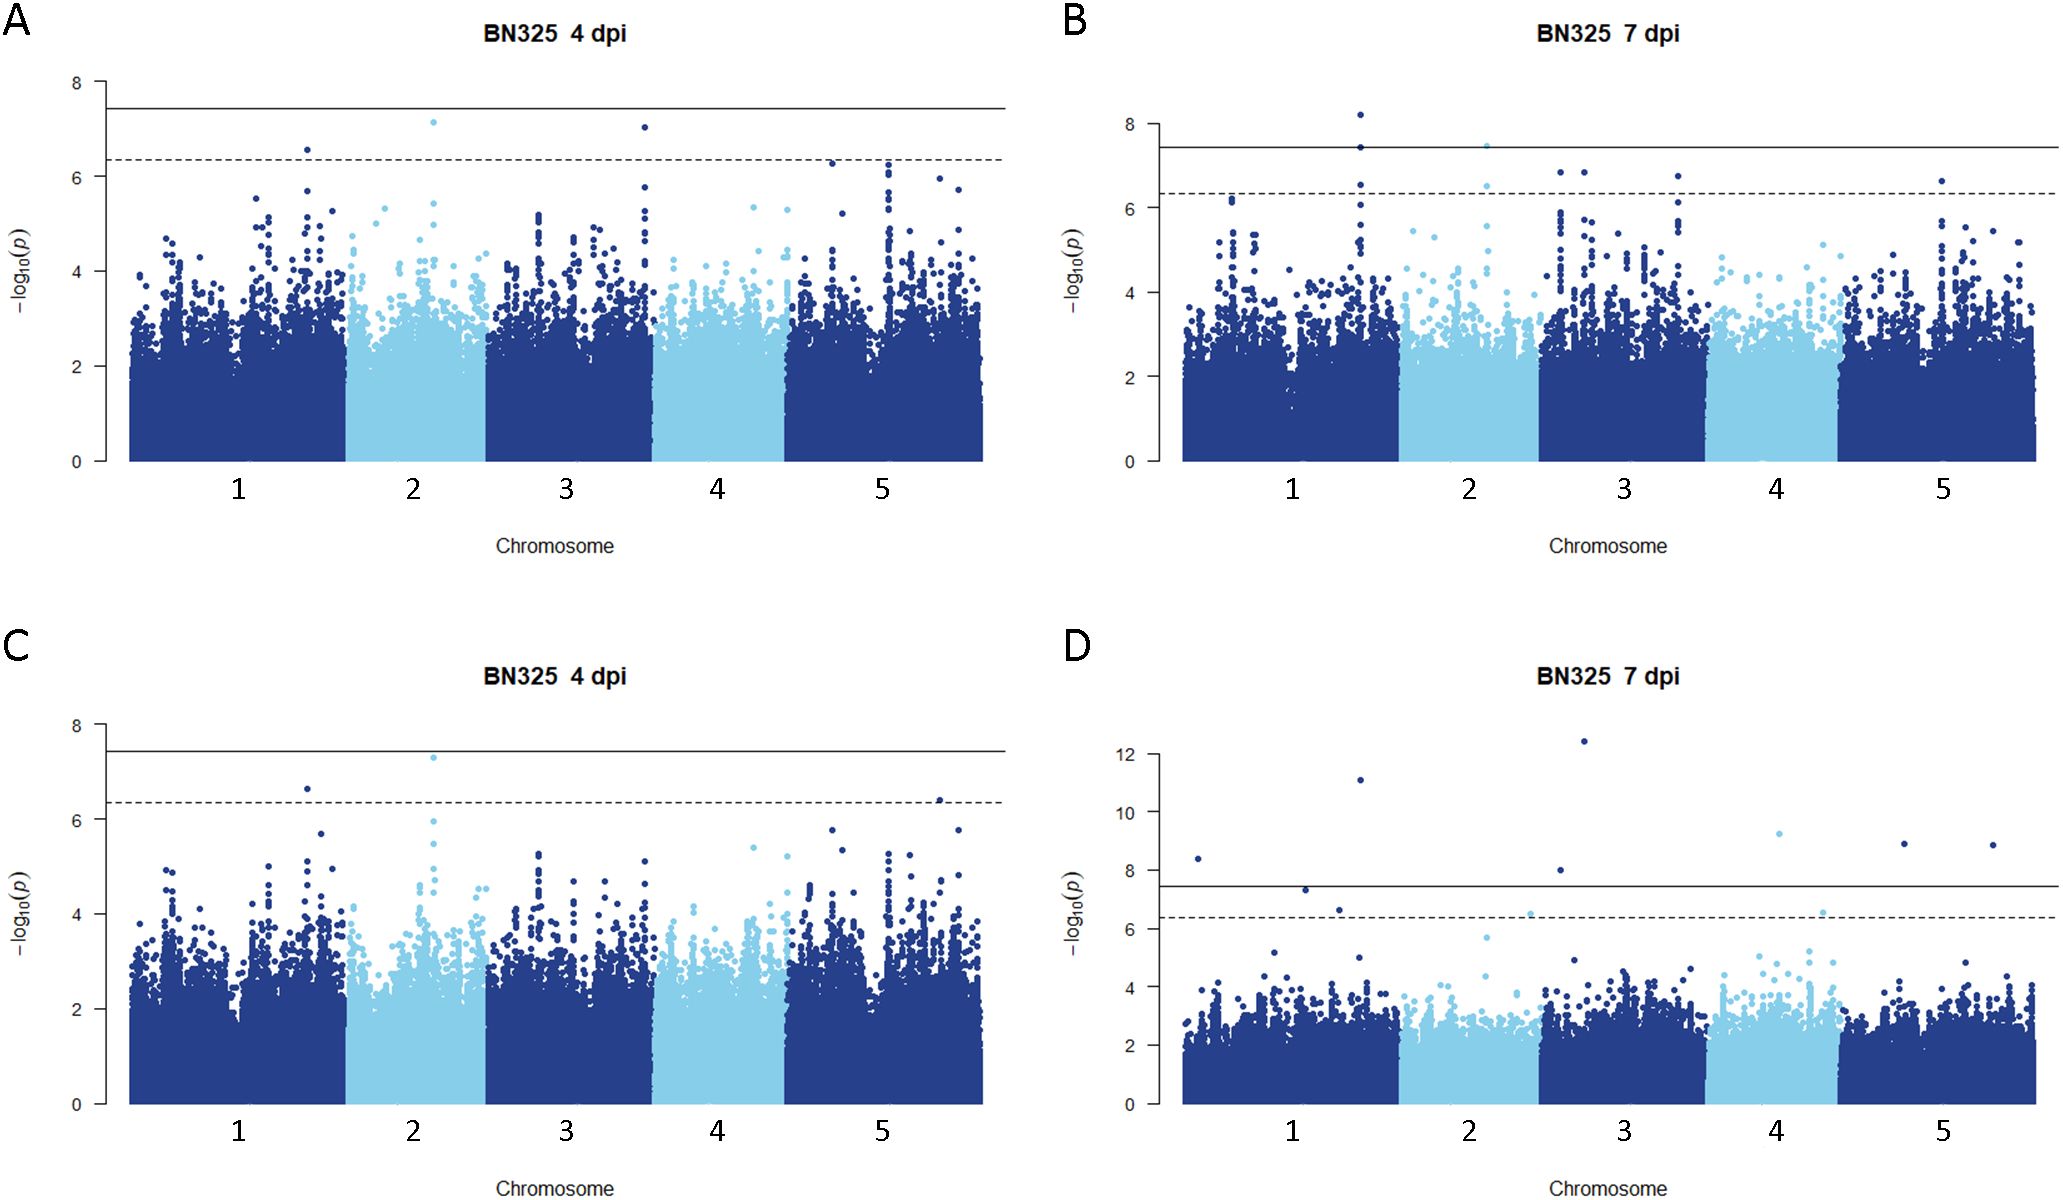
Figure 3. Genome-wide association for A. thaliana resistance to S. sclerotiorum isolate BN325. (A, B) Manhattan plots of genome-wide association for A. thaliana resistance to S. sclerotiorum isolate BN325 at 4 and 7 dpi determined using GEMMA (C, D) Manhattan plots of genome-wide association for A. thaliana resistance to S. sclerotiorum isolate BN325 at 4 and 7 dpi determined using FarmCPU. In all panels, solid lines indicate genome-wide significance thresholds determined using the Bonferroni multiple comparison correction, and dashed lines indicate significance thresholds determined using the SimpleM method.
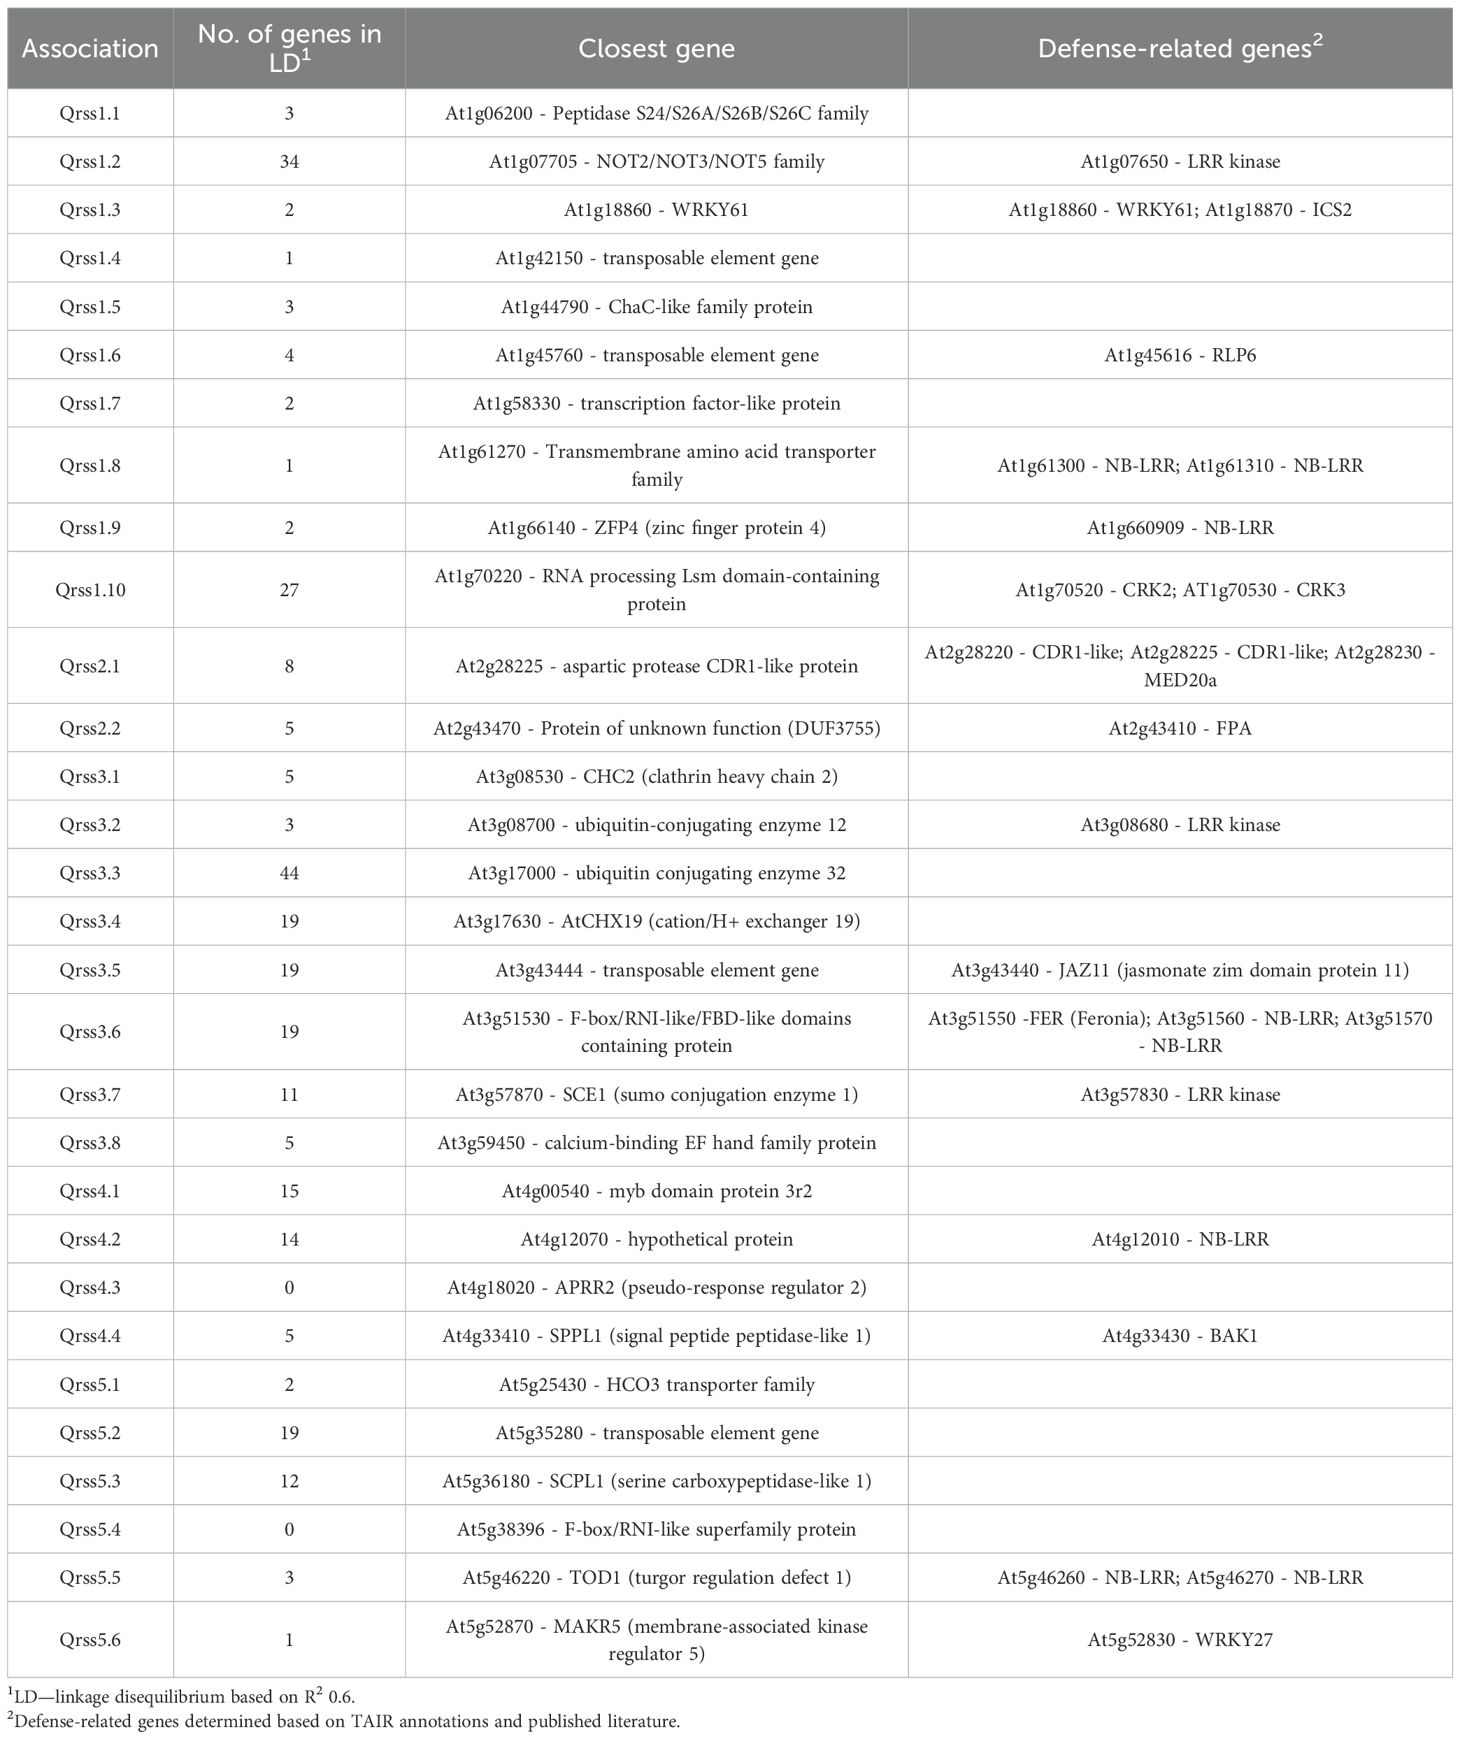
Table 3. Candidate genes at loci associated with resistance to S. sclerotiorum.
A. thaliana mediator complex subunit MED20a contributes to resistance against S. sclerotiorum
Association Qrss2.1 on A. thaliana chromosome 2 was identified by both GWAS models at both timepoints for resistance to S. sclerotiorum isolate BN325 (Table 2). This associated locus encompasses an LD block of ~32 kb containing eight predicted gene models (Tables 2, 3). Two predicted genes with similarity to the CONSTITUTIVE DISEASE RESISTANCE1 (CDR1) gene encoding an aspartic protease involved in disease resistance lie near the associated marker (Xia et al., 2004). Additionally, the MED20a gene encoding a subunit of the transcriptional Mediator complex also lies within the Qrss2.1 LD block near the associated marker. Given that there are several potential candidate genes at this locus and that another A. thaliana Mediator complex subunit, MED16, has previously been implicated in resistance to S. sclerotiorum, we selected Qrss2.1 for further study to determine if the gene underlying resistance could be identified (Wang et al., 2015). Four predicted candidate genes near the associated marker at Qrss2.1 were prioritized to determine if one or more of these genes is required for full resistance to S. sclerotiorum. As noted above, candidate genes At2g28220 and At2g28225 exhibit similarity to the defense-related gene CDR1. T-DNA (transferred DNA) insertional mutants SALK_026063C, carrying an insertion in the single predicted exon of At2g28220, and SALK_012867C, carrying an insertion in the single predicted exon of At2g28225, were obtained to evaluate the potential role of these candidate genes in S. sclerotiorum resistance. Candidate gene At2g28210 encodes the αCA2 alpha carbonic anhydrase, and a T-DNA insertional mutant, SALK_080341C, carrying an insertion in the second exon of this gene was acquired to evaluate its potential role in resistance to S. sclerotiorum. Finally, At2g28230 encodes the MED20a subunit of the transcriptional Mediator complex and a med20a mutant carrying a single base substitution in the second exon resulting in a premature stop codon was obtained (Kim et al., 2011). The disease responses of SALK_080341C, SALK_026062C, and SALK_12867C were not significantly different than the Col-0 parent line at 4 or 7 dpi with S. sclerotiorum isolate BN325 (Figures 4A, B). In contrast, med20a mutants were significantly more susceptible to S. sclerotiorum isolate BN325 at both 4 and 7 dpi compared with Col-0 (Figures 4A–C). At 4 dpi, the disease lesions caused by isolate BN325 had typically encompassed only the inoculated leaf on Col-0, whereas the lesions had spread throughout med20a mutant plants (Figure 4C). At 7 dpi, lesions had spread to encompass ~50%-75% of the plant area for Col-0 whereas med20a plants were completely consumed by the disease lesion and died (Figure 4C). To determine if increased susceptibility of med20a to S. sclerotiorum is specific to isolate BN325, disease response of med20a was compared with the Col-0 parent line at 4 and 7 dpi with isolate 1980. Similar to results with isolate BN325, the med20a mutants were significantly more susceptible to isolate 1980 at both timepoints, indicating that MED20a contributes to resistance against both isolates BN325 and 1980 (Supplementary Figure S4). These results suggest that MED20a is likely to be the gene underlying the significant association with S. sclerotiorum resistance at Qrss2.1.
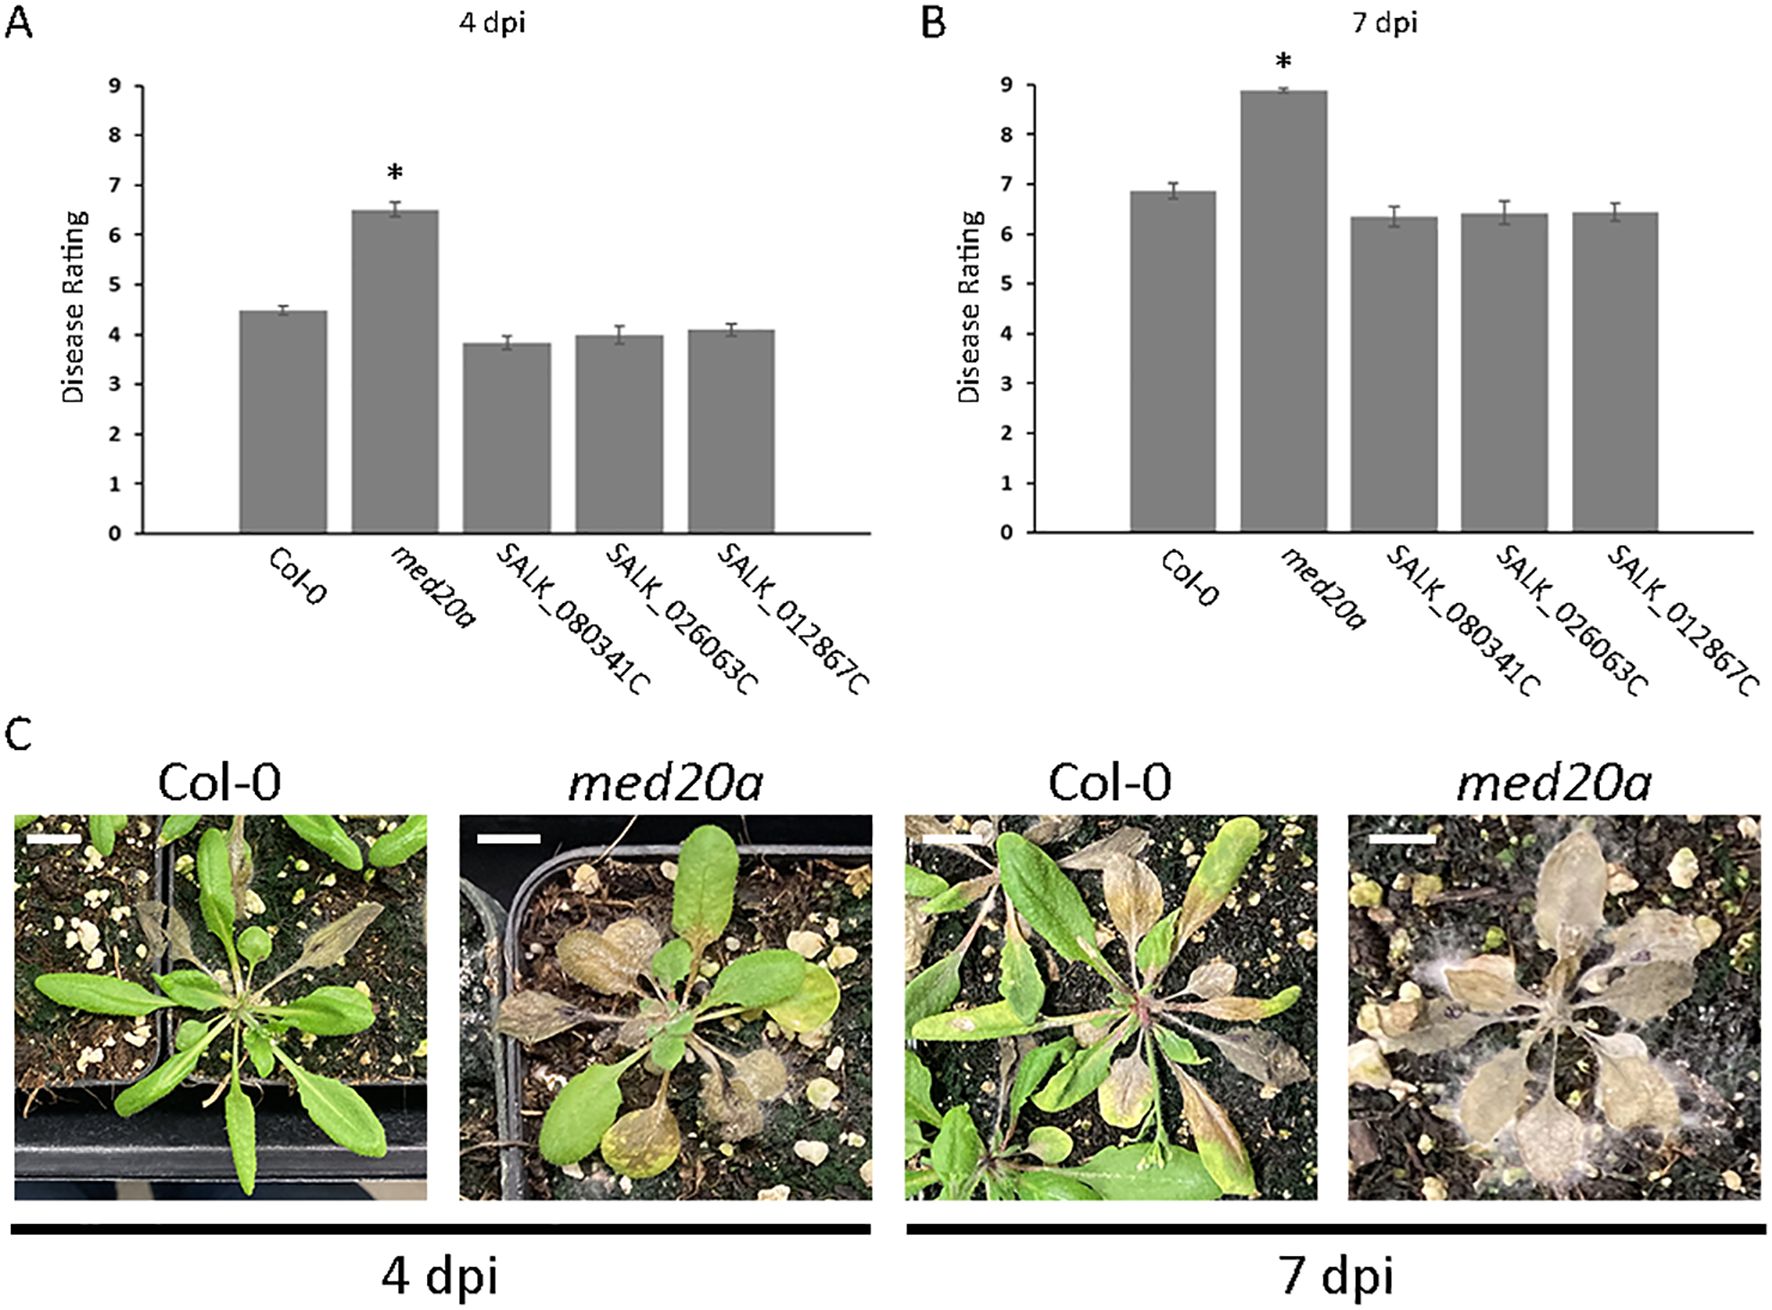
Figure 4. Hypersusceptibility of the A. thaliana med20a mutant to S. sclerotiorum. (A, B) Plots of mean disease ratings for the parent ecotype Col-0, the med20a (At2g28230) mutant, and T-DNA insertion lines SALK_080341C (At2g28210), SALK_026063C (At2g28220), and SALK_012867C (At2g28225) at 4 and 7 dpi with S. sclerotiorum isolate BN325. Error bars indicate SEM (n = 45). Asterisks indicate statistically significant differences compared with Col-0 (generalized linear mixed model and Dunnett’s test, P < 0.01). (C) Representative images illustrating disease progression on A. thaliana ecotype Col-0 and the med20a mutant at 4 and 7 dpi with S. sclerotiorum isolate BN325. Scale bars: 10 mm.
If MED20a is the causal gene affecting S. sclerotiorum resistance at Qrss2.1, it would be expected that this gene should possess one or more polymorphisms that co-segregate with the associated marker. To identify such polymorphisms, we sequenced the MED20a gene along with ~1,500 bp upstream of the gene start codon in four partially resistant ecotypes that carry the associated marker allele, Ag-0, Dra-2, UKSE06-414, and Zdr-6, and compared the sequences with those from Col-0 and four susceptible ecotypes that do not carry the associated allele: Bg-2, Lm-2, Shahdara, and TOU-I-17. These specific partially resistant ecotypes were chosen because they are among the most resistant ecotypes that carry the associated marker allele at Qrss2.1. Similarly, the susceptible ecotypes were selected because they are among the most susceptible ecotypes observed in the study and they do not carry the associated marker allele at Qrss2.1 Although considerable variation was observed within the coding regions of the gene among the evaluated ecotypes, no polymorphisms in coding regions were found that strictly correlated with the associated marker allele (Supplementary Figure S5). When the promoter and regions upstream of the MED20a gene were analyzed, an SNP (C/A variant) at 1,214 bp upstream of the MED20a start codon was identified that strictly correlates with the associated variant (Figure 5). To determine if expression differences are observed in partially resistant ecotypes that carry the resistance-associated allele at Qrss2.1 compared with ecotypes that carry the susceptibility-associated allele, the expression of MED20a was evaluated in the above eight ecotypes at 0, 8, 24, and 48 hpi with S. sclerotiorum isolate BN325. To compare expression changes after inoculation, expression levels were normalized to the 0-hpi (pre-inoculation) timepoint for each ecotype. At 8 hpi, only three ecotypes exhibited significant differences in expression compared with the 0-hpi timepoint, with partially resistant ecotype Zdr-6 and susceptible ecotype Shahdara exhibiting significantly increased MED20a expression and susceptible ecotype Bg-2 exhibiting significantly reduced expression (Figure 6). At 24 hpi, clear differences in MED20a expression between partially resistant and susceptible ecotypes were observed, with MED20a expression remaining elevated in Zdr-6 and unchanged in other partially resistant ecotypes in contrast to significantly reduced MED20a expression in all four susceptible ecotypes (Figure 6). At 48 hpi, MED20a expression levels decreased further in all four susceptible lines whereas expression was not significantly different from 0 hpi for partially resistant ecotypes Dra-2 and UKSE06–414 and was slightly but significantly reduced for ecotypes Ag-0 and Zdr-6 (Figure 6).
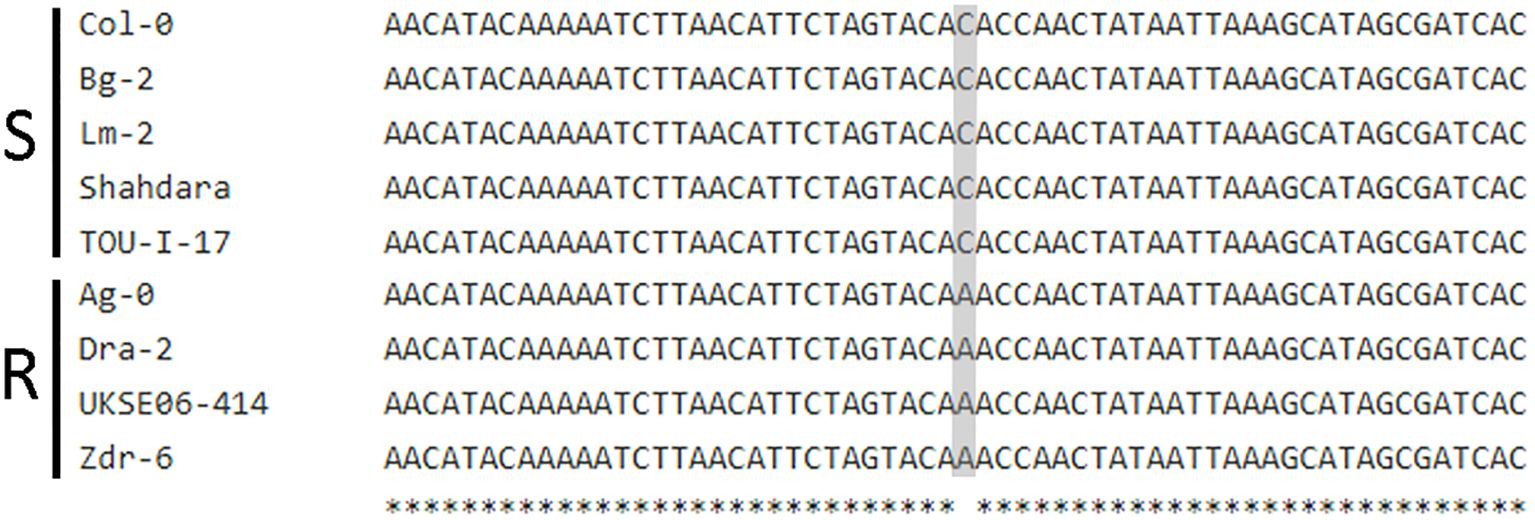
Figure 5. A polymorphism in the MED20a promoter region differentiates resistant and susceptible A. thaliana ecotypes. Multiple-sequence alignment of sequences for five susceptible (S) and four partially resistant (R) A. thaliana ecotypes spanning the region from 1,244 to 1,184 bp upstream of the Med20a start codon. Gray shading indicates a C/A polymorphism 1,214 bp upstream of the Med20a start codon correlated with the associated marker and resistant or susceptible response.
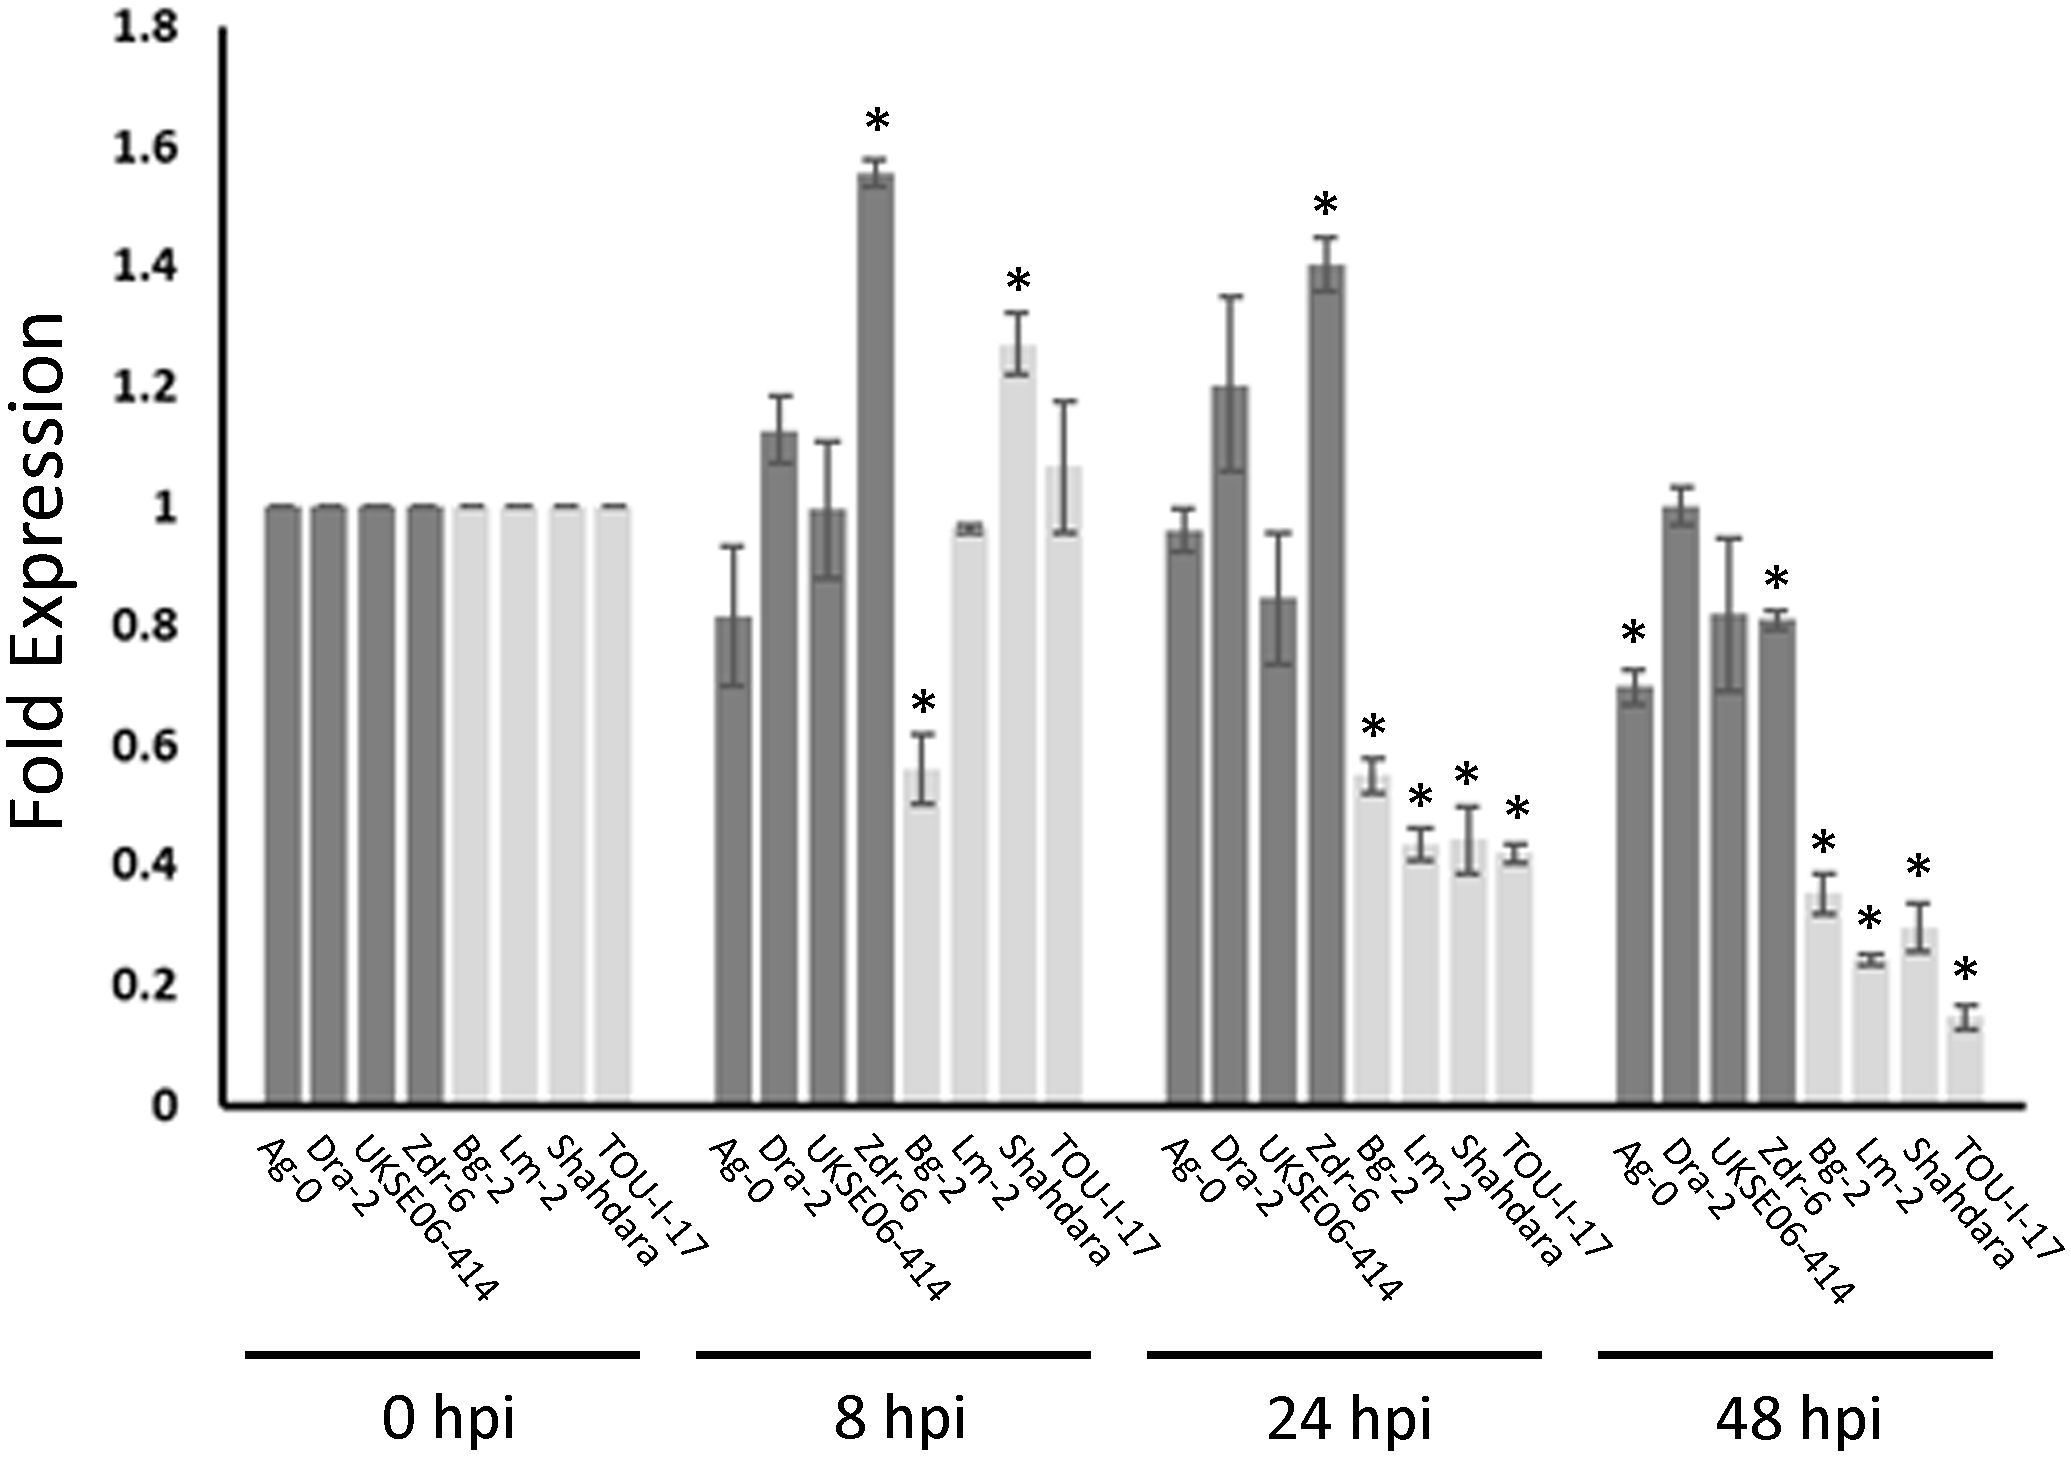
Figure 6. Med20a expression in resistant and susceptible ecotypes after S. sclerotiorum inoculation. Expression changes at 8, 24, and 48 h post inoculation (hpi) with S. sclerotiorum isolate BN325 are depicted as fold expression values relative to expression at 0 hpi for each ecotype. Bars for resistant ecotypes are shaded dark gray, and bars for susceptible ecotypes are shaded light gray. Error bars indicate SEM (n =3), and asterisks indicate significant differences compared with expression at 0 hpi (Student’s T-test, P < 0.05).
Discussion
S. sclerotiorum can infect many agriculturally important crop species and, consequently, this pathogen causes considerable damage to global agricultural production. Unlike resistance to biotrophic pathogens that typically can be conferred by single genes, resistance to necrotrophic S. sclerotiorum is complex, involving many genes, and no complete resistance has been identified in host species. While studies of defined mutants in the model plant species A. thaliana have provided valuable knowledge of specific genes, molecular machinery, and biochemical pathways contributing to S. sclerotiorum resistance, information on natural variation underlying intraspecific differences in levels of quantitative resistance to this pathogen is much more limited. Thus, a major goal of this study was to provide a foundation for identifying and defining genes and mechanisms underlying natural variation in resistance to S. sclerotiorum. A second major goal was to determine the degree to which S. sclerotiorum isolate diversity impacts response to infection among A. thaliana ecotypes and influences mapping of loci associated with resistance to the pathogen. We evaluated resistance of over 300 A. thaliana ecotypes against two S. sclerotiorum isolates that differed significantly in their aggressiveness in causing disease on this host. Somewhat unexpectedly, we observed only weak correlations for resistance among A. thaliana ecotypes to the two isolates at both the 4- and 7-dpi timepoints evaluated in the study. These results are consistent with those of a prior study in which responses of some A. thaliana ecotypes to infection varied depending on the S. sclerotiorum isolate used for inoculation (Ge and Barbetti, 2019). Additionally, significant genotype × isolate interactions have also been observed for S. sclerotiorum infection of crop hosts such as soybean, canola, and sunflower (Garg et al., 2010; Davar et al., 2011; Ge et al., 2012; Willbur et al., 2017; Musa-Khalifani et al., 2021; Buchwaldt et al., 2022; Angidi et al., 2025). In contrast to these reports and the results of this study, Barbacci and colleagues reported that differences in responses of A. thaliana ecotypes to S. sclerotiorum isolates were driven primarily by differences in the latency period between application of inoculum and appearance of an expanding necrotic lesion (Barbacci et al., 2020). Using an automated phenotyping platform, these authors found that lesion expansion after the latency period was primarily determined by A. thaliana genotype and only minimally influenced by the S. sclerotiorum isolate (Barbacci et al., 2020). If differences in disease response to distinct S. sclerotiorum isolates were due primarily to lengths of latency period, we would have expected to see a shift in disease severity but high correlations between responses to different isolates in our study. While we did indeed observe a shift in disease severity in comparing the weakly aggressive isolate BN325 to the more aggressive isolate 1980, we observed only weak correlations among ecotype responses to the two isolates, suggesting that the latency period could not explain the differential responses. The reasons for this discrepancy are not entirely clear, although several explanations are possible. The study from Barbacci and colleagues focused on automated imaging of lesion expansion on detached A. thaliana leaves at relatively early timepoints, up to 3 dpi. Thus, this study did not encompass movement of the pathogen beyond the inoculated leaf. Additionally, this study involved only six A. thaliana ecotypes and utilized a somewhat different inoculation method. In general, our results provide further support for the observation that responses of host plant genotypes, including A. thaliana natural ecotypes, can vary significantly depending on S. sclerotiorum isolate.
GWAS were carried out to identify loci contributing to resistance against the two distinct S. sclerotiorum isolates at two timepoints after inoculation. The 4- and 7-dpi timepoints were chosen based on observations of disease progression, as the 4-dpi timepoint generally reflects the timing at which S. sclerotiorum isolate 1980 begins to move beyond the inoculated leaf on most A. thaliana ecotypes, whereas at 7 dpi severe disease is observed in response to this isolate for most ecotypes, with some ecotypes completely consumed by the fungus at this timepoint. Similar total numbers of associated loci were mapped for the two isolates, with 14 associations identified for isolate 1980 across the two timepoints and 16 associations identified for isolate BN325. Strikingly, however, no overlapping loci were mapped for resistance to the two isolates. Although this outcome is consistent with the low correlation between responses to the two isolates among the A. thaliana ecotypes evaluated, this was still an unexpected result.
We selected a single associated locus on A. thaliana chromosome 2, referred to as Qrss2.1, for validation of the GWAS results and attempted identification of the specific gene underlying variation in resistance. Several potential candidate genes were identified at this locus, including two genes with similarity to the defense-related gene CDR1 as well as MED20a encoding a subunit of the Mediator complex. Evaluation of mutants revealed a role for MED20a in resistance to S. sclerotiorum, and sequencing identified an SNP in the MED20a promoter region that correlated with the associated marker at Qrss2.1 and was associated with differential expression of this gene in partially resistant compared with susceptible ecotypes. Expression polymorphism influencing resistance to S. sclerotiorum has also been reported for the actin-related ARPC4 locus (Badet et al., 2019). These results suggest that the promoter variant upstream of MED20a may be the causal polymorphism affecting resistance at Qrss2.1. However, additional research such as modifying this nucleotide in susceptible ecotypes via gene editing approaches will be needed to confirm the effect of this specific variant on resistance to S. sclerotiorum. Mutation of A. thaliana MED20a has previously been shown to increase resistance to the hemibiotrophic fungus Fusarium oxysporum (Fallath et al., 2017). Additionally, Mediator complex subunit MED16 has been implicated in resistance to S. sclerotiorum (Zhang et al., 2012). This study reported results for inoculation of a med20a mutant with S. sclerotiorum, finding no significant impact on resistance. However, the T-DNA insertional mutant used by Zhang and colleagues, GABI_507F08, possesses a T-DNA insertion in the gene At3g28230 rather than in At2g28230 encoding MED20a. Thus, a true knockout mutant for MED20a had not been previously evaluated for response to S. sclerotiorum, explaining this discrepancy. To our knowledge, no previous studies have identified natural variation in genes encoding A. thaliana Mediator complex subunits in resistance to S. sclerotiorum, as these studies have involved artificially induced mutations. However, GWAS for canola resistance to Sclerotinia stem rot identified an associated polymorphism within the putative canola homolog of A. thaliana MED15a, suggesting that natural variation in a Mediator complex subunit may influence resistance to S. sclerotiorum in this related species (Newman et al., 2023). The MED20a locus was mapped for resistance to S. sclerotiorum isolate BN325 at both timepoints in our study. However, med20a knockout mutants exhibited hypersusceptibility to both isolate BN325 and isolate 1980, indicating that the contribution of MED20a to S. sclerotiorum resistance is not specific to isolate BN325. One hypothesis to explain the lack of overlap for mapped loci associated with resistance to the two isolates is that loci involved in resistance may play more or less prominent roles in response to some S. sclerotiorum isolates depending on the infection dynamics controlled by isolate genetics. It is also important to note that the med20a mutant used in this study is likely a null mutant, whereas the effect of the natural variant in the MED20a promoter is almost certainly much less pronounced and this more subtle effect may only be apparent in response to the less aggressive S. sclerotiorum isolate. Further research on genes associated with resistance to determine whether or not they contribute to resistance in an isolate-specific manner should help to clarify these observations.
Including MED20a, genes with known or predicted functions in pathogen defense were identified at 16 of the 30 total loci mapped across our GWAS. These included five associated loci with one or more predicted NB-LRR disease resistance genes within the LD blocks. The A. thaliana LAZ5 NB-LRR has previously been identified as a putative susceptibility factor, with mutation in this gene conferring increased resistance to S. sclerotiorum (Barbacci et al., 2020). Given the necrotrophic lifestyle of this pathogen, it is reasonable to hypothesize that S. sclerotiorum may activate NB-LRR-mediated defenses associated with programmed cell death to promote infection. Whether the NB-LRRs located within mapped loci in our study also act as susceptibility factors exploited by S. sclerotiorum to promote disease will be interesting to determine in future studies. Additionally, the A. thaliana FPA gene was found within the LD block at Qrss2.2. FPA encodes an RNA-binding protein that influences flowering time but has also recently been shown to control the expression of many A. thaliana NB-LRR genes through premature cleavage and polyadenylation of their transcripts (Parker et al., 2021). Thus, it is tempting to speculate that FPA may be the gene underlying S. sclerotiorum resistance or susceptibility at this locus and may influence resistance through modulating the expression of NB-LRRs exploited by the pathogen to promote disease. Finally, BAK1 (BRASSINOSTEROID INSENSITIVE1-ASSOCIATED RECEPTOR KINASE1), encoding a receptor-like kinase involved in pattern-triggered immunity signaling, was present in the LD block at Qrss4.4. BAK1 has previously been shown to play a role in resistance to S. sclerotiorum, potentially by mediating perception of the SCFE1 elicitor by RLP30 (Zhang et al., 2013a).
The availability of high-quality reference genomes for agriculturally important crop hosts along with improvements in genetic mapping promoted by high-throughput sequencing have combined to accelerate identification of loci contributing to S. sclerotiorum resistance in crop plants. The degree to which resistance to S. sclerotiorum is controlled by similar genes and/or molecular mechanisms across plant lineages representing the broad range of hosts for this pathogen remains an interesting question driving future research. Follow-up studies to identify genes underlying loci associated with resistance in this study will provide new information to help address this question. In summary, the results of this study indicated that disease evaluations with S. sclerotiorum isolates differing in aggressiveness identified distinct loci associated with resistance. The study additionally identified a subunit of the Mediator complex contributing to S. sclerotiorum resistance in A. thaliana and identified a large number of additional resistance-associated loci that should provide important information about resistance to this destructive pathogen in future studies.
Data availability statement
A. thaliana imputed SNP genotyping data (Arouisse et al., 2020) used in this study are publicly available at https://figshare.com/articles/dataset/arabidopsis_2029_Maf001_filter95/11346875/1).
Author contributions
WU: Conceptualization, Formal Analysis, Funding acquisition, Investigation, Methodology, Project administration, Supervision, Writing – original draft, Writing – review & editing. RS: Formal Analysis, Investigation, Methodology, Writing – review & editing.
Funding
The author(s) declare that financial support was received for the research and/or publication of this article. This work was supported by the United States Department of Agriculture-Agricultural Research Service National Sclerotinia Initiative, Current Research Information System project 3060-21220-034-00D, project title “Mechanisms of resistance to Sclerotinia sclerotiorum and consequences for seed yield in Arabidopsis.” The mention of trade names or commercial products in this report is solely for the purpose of providing specific information and does not imply recommendation or endorsement by the US Department of Agriculture. The USDA is an equal opportunity provider and employer.
Acknowledgments
The authors are grateful to Jennifer Arnold and Reid Lakin for technical assistance and to Dr. Yun Ju Kim for kindly providing seeds for the A. thaliana med20a mutant.
Conflict of interest
RS is employed by the company Syngenta Seeds LLC.
The remaining author declare that the research was conducted in the absence of any commercial or financial relationships that could be construed as a potential conflict of interest.
The author(s) declared that they were an editorial board member of Frontiers, at the time of submission. This had no impact on the peer review process and the final decision.
Generative AI statement
The author(s) declare that no Generative AI was used in the creation of this manuscript.
Any alternative text (alt text) provided alongside figures in this article has been generated by Frontiers with the support of artificial intelligence and reasonable efforts have been made to ensure accuracy, including review by the authors wherever possible. If you identify any issues, please contact us.
Publisher’s note
All claims expressed in this article are solely those of the authors and do not necessarily represent those of their affiliated organizations, or those of the publisher, the editors and the reviewers. Any product that may be evaluated in this article, or claim that may be made by its manufacturer, is not guaranteed or endorsed by the publisher.
Supplementary material
The Supplementary Material for this article can be found online at: https://www.frontiersin.org/articles/10.3389/fpls.2025.1706963/full#supplementary-material
Supplementary Figure 1 | Plots of mean disease ratings for six S. sclerotiorum isolates at 4-dpi (A) and 7-dpi (B) on A. thaliana ecotype Col-0. Error bars indicate SEM (n = 18) and letters above bars indicate statistical groupings (generalized linear mixed model and Tukey’s post-hoc test, P < 0.05).
Supplementary Figure 2 | Quantile-quantile plots of genome-wide association for A. thaliana resistance to S. sclerotiorum isolate 1980 at 4-dpi and 7-dpi determined using GEMMA (A, B) or FarmCPU (C, D).
Supplementary Figure 3 | Quantile-quantile plots of genome-wide association for A. thaliana resistance to S. sclerotiorum isolate BN325 at 4-dpi and 7-dpi determined using GEMMA (A, B) or FarmCPU (C, D).
Supplementary Figure 4 | Plots of mean disease ratings for the parent A. thaliana ecotype Col-0 and the med20a (At2g28230) mutant at 4-dpi (A) and 7-dpi (B) with S. sclerotiorum isolate 1980. Error bars indicate SEM (n = 45). Asterisks indicate statistically significant differences (generalized linear mixed model and Dunnett’s test, P < 0.01).
Supplementary Figure 5 | Multiple sequence alignment of the MED20a promoter and coding regions for five susceptible A. thaliana ecotypes Col-0, Bg-2, Lm-2, Shahdara, and TOU-I-17, and four partially resistant ecotypes Ag-0, Dra-2, UKSE06-414, and Zdr-6, constructed using Clustal Omega.
Supplementary Table 2 | Primers for Sanger sequencing of MED20a from nine A. thaliana ecotypes.
References
Aldrich-Wolfe, L., Travers, S., and Nelson, J. B. D. (2015). Genetic variation of Sclerotinia sclerotiorum from multiple crops in the North Central United States. PloS One 10, e0139188. doi: 10.1371/journal.pone.0139188
Amselem, J., Cuomo, C. A., van Kan, J. A. L., Viaud, M., Benito, E. P., Couloux, A., et al. (2011). Genomic analysis of the necrotrophic fungal pathogens Sclerotinia sclerotiorum and Botrytis cinerea. PloS Genet. 7, e1002230. doi: 10.1371/journal.pgen.1002230
An, C. and Mou, Z. (2013). The function of the Mediator complex in plant immunity. Plant Signal. Behav. 8, e23182. doi: 10.4161/psb.23182
Angidi, S., Pahl, J., Pasche, J. S., and Underwood, W. (2025). Identification and characterization of cultivated sunflower lines with basal stalk rot resistance against diverse Sclerotinia sclerotiorum isolates. Phytopathol. doi: 10.1094/PHYTO-05-25-0193-R
Arouisse, B., Korte, A., van Eeuwijk, F., and Kruijer, W. (2020). Imputation of 3 million SNPs in the Arabidopsis regional mapping population. Plant J. 102, 872–882. doi: 10.1111/tpj.14659
Badet, T., Léger, O., Barascud, M., Voisin, D., Sadon, P., Vincent, R., et al. (2019). Expression polymorphism at the ARPC4 locus links the actin cytoskeleton with quantitative disease resistance to Sclerotinia sclerotiorum in Arabidopsis thaliana. New Phytol. 222, 480–496. doi: 10.1111/nph.15580
Badet, T., Voisin, D., Mbengue, M., Barascud, M., Sucher, J., Sadon, P., et al. (2017). Parallel evolution of the POQR prolyl oligo peptidase gene conferring plant quantitative disease resistance. PloS Genet. 13, e1007143. doi: 10.1371/journal.pgen.1007143
Barbacci, A., Navaud, O., Mbengue, M., Barascud, M., Godiard, L., Khafif, M., et al. (2020). Rapid identification of an Arabidopsis NLR gene as a candidate conferring susceptibility to Sclerotinia sclerotiorum using time-resolved automated phenotyping. Plant J. 103, 903–917. doi: 10.1111/tpj.14747
Bolton, M. D., Thomma, B. P. H. J., and Nelson, B. D. (2006). Sclerotinia sclerotiorum (Lib.) de Bary: biology and molecular traits of a cosmopolitan pathogen. Mol. Plant Pathol. 7, 1–16. doi: 10.1111/j.1364-3703.2005.00316.x
Buchwaldt, L., Garg, H., Puri, K. D., Durkin, J., Adam, J., Harrington, M., et al. (2022). Sources of genomic diversity in the self-fertile plant pathogen, Sclerotinia sclerotiorum, and consequences for resistance breeding. PloS One 17, e0262891. doi: 10.1371/journal.pone.0262891
Chen, J., Yang, S., Fan, B., Zhu, C., and Chen, Z. (2022). The Mediator complex: a central coordinator of plant adaptive responses to environmental stresses. Int. J. Mol. Sci. 23, 6170. doi: 10.3390/ijms23116170
Davar, R., Darvishzadeh, R., and Majd, A. (2011). Genotype-isolate interactions for resistance to Sclerotinia sclerotiorum in sunflower. Phytopathol. Mediterr. 50, 442–449. doi: 10.14601/Phytopathol_Mediterr-9505
Derbyshire, M. C., Newman, T. E., Khentry, Y., and Owolabi Taiwo, A. (2022). The evolutionary and molecular features of the broad-host-range plant pathogen Sclerotinia sclerotiorum. Mol. Plant Pathol. 23, 1075–1090. doi: 10.1111/mpp.13221
Dhawan, R., Luo, H., Foerster, A. M., AbuQamar, S., Du, H.-N., Briggs, S. D., et al. (2009). HISTONE MONOUBIQUITINATION1 interacts with a subunit of the Mediator complex and regulates defense against necrotrophic fungal pathogens in. Arabidopsis. Plant Cell 21, 1000–1019. doi: 10.1105/tpc.108.062364
Ding, L.-N., Li, M., Guo, X.-J., Tang, M.-Q., Cao, J., Wang, Z., et al. (2020). Arabidopsis GDSL1 overexpression enhances rapeseed Sclerotinia sclerotiorum resistance and the functional identification of its homolog in Brassica napus. Plant Biotechnol. J. 18, 1255–1270. doi: 10.1111/pbi.13289
Dunnett, C. W. (1955). A multiple comparison procedure for comparing several treatments with a control. J. Am. Stat. Assoc. 50, 1096–1121. doi: 10.1080/01621459.1955.10501294
Fallath, T., Kidd, B. N., Stiller, J., Davoine, C., Björklund, S., Manners, J. M., et al. (2017). MEDIATOR18 and MEDIATOR20 confer susceptibility to Fusarium oxysporum in Arabidopsis thaliana. . PloS One 12, e0176022. doi: 10.1371/journal.pone.0176022
Fligner, M. A. and Killeen, T. J. (1976). Distribution-free two-sample tests for scale. J. Am. Stat. Assoc. 71, 210–213. doi: 10.1080/01621459.1976.10481517
Gao, X., Dang, X., Yan, F., Li, Y., Xu, J., Tian, S., et al. (2021). ANGUSTIFOLIA negatively regulates resistance to Sclerotinia sclerotiorum via modulation of PTI and JA signaling pathways in Arabidopsis thaliana. Mol. Plant Pathol. 23, 1091–1106. doi: 10.1111/mpp.13222
Gao, X., Starmer, J., and Martin, E. R. (2008). A multiple testing correction method for genetic association studies using correlated single nucleotide polymorphisms. Genet. Epidemiol. 32, 361–369. doi: 10.1002/gepi.20310
Garg, H., Kohn, L. M., Andrew, M., Li, H., Sivasithamparam, K., and Barbetti, M. J. (2010). Pathogenicity of morphologically different isolates of Sclerotinia sclerotiorum with Brassica napus and B. juncea genotypes. Eur. J. Plant Pathol. 126, 305–315. doi: 10.1007/s10658-009-9547-7
Ge, X. T. and Barbetti, M. (2019). Host response of Arabidopsis thaliana ecotypes is determined by Sclerotinia sclerotiorum isolate type. Eur. J. Plant Pathol. 153, 583–597. doi: 10.1007/s10658-018-1584-7
Ge, X. T., Li, Y. P., Wan, Z. J., You, M. P., Finnegan, P. M., Banga, S. S., et al. (2012). Delineation of Sclerotinia sclerotiorum pathotypes using differential resistance responses on Brassica napus and B. juncea genotypes enables identification of resistance to prevailing pathotypes. Field Crops Res. 127, 248–258. doi: 10.1016/j.fcr.2011.11.022
Guo, X. and Stotz, H. (2007). Defense against Sclerotinia sclerotiorum in Arabidopsis is dependent on jasmonic acid, salicylic acid, and ethylene signaling. Mol. Plant Microbe Interact. 20, 1384–1395. doi: 10.1094/MPMI-20-11-1384
Kidd, B. N., Cahill, D. M., Manners, J. M., Schenk, P. M., and Kazan, K. (2011). Diverse roles of the Mediator complex in plants. Semin. Cell Dev. Biol. 22, 741–748. doi: 10.1016/j.semcdb.2011.07.012
Kidd, B. N., Edgar, C. I., Kumar, K. K., Aitken, E. A., Schenk, P. M., Manners, J. M., et al. (2009). The Mediator complex subunit PFT1 is a key regulator of jasmonate-dependent defense in. Arabidopsis. Plant Cell 21, 2237–2252. doi: 10.1105/tpc.109.066910
Kim, Y. J., Zheng, B., Yu, Y., Won, S. Y., Mo, B., and Chen, X. (2011). The role of Mediator in small and long noncoding RNA production in Arabidopsis thaliana. EMBO J. 30, 814–822. doi: 10.1038/emboj.2011.3
Li, Y., Huang, Y., Bergelson, J., and Borevitz, J. O. (2010). Association mapping of local climate-sensitive quantitative trait loci in Arabidopsis thaliana. Proc. Natl. Acad. Sci. U.S.A. 107, 21199–21204. doi: 10.1073/pnas.1007431107
Li, X., Yang, R., and Chen, H. (2018). The Arabidopsis thaliana Mediator subunit MED8 regulates plant immunity to Botrytis cinerea through interacting with the basic helix-loop-helix (bHLH) transcription factor FAMA. PloS One 13, e0193458. doi: 10.1371/journal.pone.0193458
Musa-Khalifani, K., Darvishzadeh, R., and Abrinbana, M. (2021). Resistance against Sclerotinia basal stem rot pathogens in sunflower. Trop. Plant Pathol. 46, 651–663. doi: 10.1007/s40858-021-00463-z
Newman, T. E., Khentry, Y., Leo, A., Lindbeck, K. D., Kamphuis, L. G., and Derbyshire, M. C. (2023). Association mapping combined with whole genome sequencing data reveals candidate causal variants for Sclerotinia stem rot resistance in Brassica napus. Phytopathol. 113, 800–811. doi: 10.1094/PHTO-06-22-0217-FI
Otto-Hanson, L., Steadman, J. R., Higgins, R., and Eskridge, K. M. (2011). Variation in Sclerotinia sclerotiorum from multisite resistance screening locations. Plant Dis. 95, 1370–1377. doi: 10.1094/PDIS-11-10-0865
Parker, M. T., Knob, K., Zacharaki, V., Sherwood, A. V., Tomé, D., Yu, Z., et al. (2021). Widespread premature transcription termination of Arabidopsis thaliana NLR genes by the spen protein FPA. eLife 10, e65537. doi: 10.7554/eLife.65537
Perchepied, L., Balagué, C., Riou, C., Claudel-Renard, C., Rivière, N., Grezes-Besset, B., et al. (2010). Nitric oxide participates in the complex interplay of defense-related signaling pathways controlling disease resistance to Sclerotinia sclerotiorum in Arabidopsis thaliana. Mol. Plant Microbe Interact. 23, 846–860. doi: 10.1094/MPMI-23-7-0846
Poudel, R. S., Belay, K., Nelson, B., Jr., Brueggeman, R., and Underwood, W. (2023). Population and genome-wide association studies of Sclerotinia sclerotiorum isolates collected from diverse host plants throughout the United States. Front. Microbiol. 14. doi: 10.3389/fmicb.2023.1251003
Purcell, S., Neale, B., Todd-Brown, K., Thomas, L., Ferreira, M. A. R., Bender, D., et al. (2007). PLINK: A tool set for whole-genome association and population-based linkage analyses. Am. J. Hum. Genet. 81, 559–575. doi: 10.1086/519795
Schmittgen, T. D. and Livak, K. J. (2008). Analyzing real-time PCR data by the comparative C(T) method. Nat. Protoc. 3, 1101–1108. doi: 10.1038/nprot.2008.73
Sievers, F., Wilm, W., Dineen, D., Gibson, T. J., Karplus, K., Li, W., et al. (2011). Fast, scalable generation of high-quality protein multiple sequence alignments using Clustal Omega. Mol. Syst. Biol. 7, 539. doi: 10.1038/msb.2011.75
Stotz, H. U., Jikumaru, Y., Shimada, Y., Sasaki, E., Stingl, N., Mueller, M. J., et al. (2011a). Jasmonate-dependent and COI1-independent defense responses against Sclerotinia sclerotiorum in Arabidopsis thaliana: auxin is part of COI1-independent defense signaling. Plant Cell Physiol. 52, 1941–1956. doi: 10-1093/pcp/pcr127
Stotz, H. U., Sawada, Y., Shimada, Y., Hirai, M., Sasaki, E., Krischke, M., et al. (2011b). Role of camalexin, indole glucosinolates, and side chain modification of glucosinolate-derived isothiocyanates in defense of Arabidopsis against Sclerotinia sclerotiorum. Plant J. 67, 81–93. doi: 10.1111/j.1365-313X.2011.04578.x
Sucher, J., Mbengue, M., Dresen, A., Barascud, M., Didelon, M., Barbacci, A., et al. (2020). Phylotranscriptomics of the pentapetalae reveals frequent regulatory variation in plant local responses to the fungal pathogen Sclerotinia sclerotiorum. Plant Cell 32, 1820–1844. doi: 10.1105/tpc.19.00806
Tukey, J. (1949). Comparing individual means in the analysis of variance. Biometrics 5, 99–114. doi: 10.2307/3001913
Wang, Z., Ma, L.-Y., Cao, J., Li, Y.-L., Ding, L.-N., Zhu, K.-M., et al. (2019). Recent advances in mechanisms of plant defense to Sclerotinia sclerotiorum. Front. Plant Sci. 10. doi: 10.3389/fpls.2019.01314
Wang, C., Yao, J., Du, X., Zhang, Y., Sun, Y., Rollins, J. A., et al. (2015). The Arabidopsis mediator complex subunit16 is a key component of basal resistance against the necrotrophic fungal pathogen Sclerotinia sclerotiorum. Plant Physiol. 169, 856–872. doi: 10.1104/pp.15.00351
Wang, J. and Zhang, Z. (2021). GAPIT Version 3: Boosting power and accuracy for genomic association and prediction. Genom. Proteom. Bioinform. 19, 629–640. doi: 10.1016/j.gpb.2021.08.005
Wathagula, D. L., Hemsley, P. A., Moffat, C. S., Cremelie, P., Knight, M. R., and Knight, H. (2012). The Mediator subunit SFR6/MED16 controls defence gene expression mediated by salicylic acid and jasmonate responsive pathways. New Phytol. 195, 217–230. doi: 10.1111/j.1469-8137.2012.04138.x
Willbur, J. F., Ding, S., Marks, M. E., Lucas, H., Grau, C. R., Groves, C. L., et al. (2017). Comprehensive Sclerotinia stem rot screening of soybean germplasm requires multiple isolates of Sclerotinia sclerotiorum. Plant Dis. 101, 344–353. doi: 10.1094/PDIS-07-16-1055-RE
Xia, Y., Suzuki, H., Borevitz, J., Blount, J., Guo, Z., Patel, K., et al. (2004). An extracellular aspartic protease functions in Arabidopsis disease resistance signaling. EMBO J. 23, 980–988. doi: 10.1038/sj.emboj.7600086
Zhang, W., Fraiture, M., Kolb, D., Löffelhardt, B., Desaki, Y., Boutrot, F. F. G., et al. (2013a). Arabidopsis RECEPTOR-LIKE PROTEIN30 and receptor-like kinase SUPPRESSOR OF BIR1-1/EVERSHED mediate innate immunity to necrotrophic fungi. Plant Cell 25, 4227–4241. doi: 10.1105/tpc.113.117010
Zhang, X., Wang, C., Zhang, Y., Sun, Y., and Mou, Z. (2012). The Arabidopsis Mediator complex Subunit16 positively regulates salicylate-mediated systemic acquired resistance and jasmonate/ethylene-induced defense pathways. Plant Cell 24, 4294–4309. doi: 10.1105/tpc.112.103317
Zhang, X., Yao, J., Zhang, Y., Sun, Y., and Mou, Z. (2013b). The Arabidopsis Mediator complex subunits MED14/SWP and MED16/SFR6/IEN1 differentially regulate defense gene expression in plant immune responses. Plant J. 75, 484–497. doi: 10.1111/tpj.12216
Keywords: white mold, transcriptional mediator, quantitative disease resistance, genome-wide association, resistance mechanisms
Citation: Underwood W and Sharma Poudel R (2025) Natural expression variation for the Arabidopsis MED20a mediator complex subunit influences quantitative resistance to Sclerotinia sclerotiorum. Front. Plant Sci. 16:1706963. doi: 10.3389/fpls.2025.1706963
Received: 16 September 2025; Accepted: 30 October 2025;
Published: 17 November 2025.
Edited by:
Wei Zhang, Nanjing Normal University, ChinaReviewed by:
Muhammad Uzair Qasim, Huazhong Agricultural University, ChinaJie Liu, Chinese Academy of Agricultural Sciences, China
Copyright © 2025 Underwood and Sharma Poudel. This is an open-access article distributed under the terms of the Creative Commons Attribution License (CC BY). The use, distribution or reproduction in other forums is permitted, provided the original author(s) and the copyright owner(s) are credited and that the original publication in this journal is cited, in accordance with accepted academic practice. No use, distribution or reproduction is permitted which does not comply with these terms.
*Correspondence: William Underwood, d2lsbGlhbS51bmRlcndvb2RAdXNkYS5nb3Y=
†Present address: Syngenta Seeds, LLC, Durham, NC, United States