 Hui Huang1,2†
 Qian Wang2†
 Ruimin Zhang2
 Fang Liu2,3Yue Niu2
 Yayong Luo2Junqian Wang2,3Shuang Li2
 Zhengchun Tang2,3Xueying Cao2
 Xiaolong Wang2Jian Yang2Sha Luo2Weizhu Deng2
 Weiguang Zhang2Ying Zheng2Yong Wang2
 Li Zhang2
 Guangyan Cai2
 Xiangmei Chen1,2,3*
 Zheyi Dong2*
- 1School of Clinical Medicine, Chengdu University of Traditional Chinese Medicine, Chengdu, China
- 2Department of Nephrology, First Medical Center of Chinese PLA General Hospital, State Key Laboratory of Kidney Diseases, National Clinical Research Center for Kidney Diseases, Beijing Key Laboratory of Medical Devices and Integrated Traditional Chinese and Western Drug Development for Severe Kidney Diseases, Beijing Key Laboratory of Digital Intelligent TCM for the Prevention and Treatment of Pan-vascular Disease, Key Disciplines of National Administration of Traditional Chinese Medicine (zyyzdxk-2023310), Beijing, China
- 3School of Clinical Medicine, Guangdong Pharmaceutical University, Guangzhou, China
This study explored the associations between triglyceride glucose (TyG), TyG with body mass index (TyG-BMI), triglyceride-to-high-density lipoprotein cholesterol (TG/HDL-C) ratio, and metabolic score for insulin resistance (METS-IR) and the effects of dietary acid-base load in patients with chronic kidney disease (CKD).
Methods: A total of 288 patients with CKD were included in this study. Four non-insulin-based insulin resistance (IR) markers were used to assess IR levels in patients with CKD; dietary intake – 24-h dietary recall; and diet-based acidity – potential renal acid load (PRAL), net endogenous acid production (NEAP), and dietary acid load (DAL). Multiple linear regression analysis correlated dietary acid-base load and non-insulin-based IR markers.
Results: Spearman’s correlation indicated DAL was significantly associated with TyG-BMI (r = 0.251, P < 0.001) and METS-IR (r = 0.274, P < 0.001), but weakly correlated with the TG/HDL-C ratio (r = 0.14, P = 0.018). After adjusting for sex, age, energy, hypertension (HTN), diabetes, and estimated glomerular filtration rate, multiple linear regression analysis showed that DAL was associated with TyG-BMI (β = 0.336; P = 0.008) and METS-IR (β = 0.091; P = 0.007).
Conclusions: Patients with the highest DAL scores had the highest TyG-BMI, TyG, TG/HDL-C ratio, and METS-IR. After adjusting for confounders, there was a significant positive association between DAL and TyG-BMI and METS-IR.
1 Introduction
The worldwide prevalence of chronic kidney disease (CKD) is around 9.5%, or approximately 850 million cases (1), while that in China is 8.2% (2). The high prevalence and long course of CKD have caused a huge economic burden to patients and society, as well as presented a great challenge to the medical profession. Moreover, many patients do not undergo renal replacement therapy. Prompt diagnosis and treatment are critical for patient outcomes in CKD, and can even delay disease progression and reduce complications. Studies have reported that CKD patients have many risk elements, including type 2 diabetes mellitus (T2DM), metabolic syndrome, obesity, hypertension (HTN), and dyslipidemia (2–4). These conditions are intricately linked to insulin resistance (IR), which exerts detrimental effects on the kidney by inducing inflammation, oxidative stress, and endothelial dysfunction (5–7). Therefore, the early recognition and effective management of IR can prevent or delay the development of CKD and its associated complications. The hyper insulinemic-euglycemic clamp technique is the benchmark for evaluating IR. It does this by infusing insulin to reach specific plasma levels and glucose to keep blood sugar at fasting or post-meal concentrations (8). However, it is impractical for clinical use because it requires insulin measurements and invasive methods. Therefore, four non-insulin-based IR markers – triglyceride and glucose index (TyG), triglyceride and glucose index with body mass index (TyG-BMI), triglyceride-to-high-density lipoprotein cholesterol (TG/HDL-C) ratio, and metabolic score for insulin resistance (METS-IR) – were utilized to assess the IR levels in patients with CKD, as in previous studies (9, 10).
Healthy dietary habits such as the HTN control and Mediterranean diets protect against the development of CKD and albuminuria (11). Additionally, a healthy acid-base balance is essential for maintaining metabolic health. Potential renal acid load (PRAL) (12), net endogenous acid production (NEAP) (13), and dietary acid load (DAL) (14) are commonly used measures to assess the potential acid load produced by the diet. Both the PRAL and NEAP scores are based on the intake of protein and micronutrients, and the DAL score is calculated using the PRAL score and body surface area. There is evidence that a high dietary acid load is linked to a high prevalence of CKD and impaired renal function (15–17).Researches have shown that a diet characterized by a high acid load correlates with metabolic abnormalities, predisposing individuals to IR (18), T2DM (19, 20), HTN (21), and metabolic syndrome (22).
The purpose of this study was to investigate the relationship between dietary acid and base load and four non-insulin-based IR markers in patients with CKD.
2 Materials and methods
2.1 Study population
Data were collected from patients with CKD who were hospitalized at the Chinese People’s Liberation Army general Hospital (PLAGH) from March 2022 to July 2023. Inclusion criteria: (1) age ≥ 18 years, and (2) diagnosis of CKD according to the 2024 Kidney Disease Improving Global Outcomes Clinical Practice Guidelines (23). Exclusion criteria: (1) history of severe infection, (2) acute and severe diseases, (3) pregnancy or lactation, (4) malignant tumors, (5) missing data of medical history or clinical examination results, and (6) incomplete dietary intake data and/or extreme energy intake reporting (> 4000 kcal or < 600 kcal). Ultimately, 288 non-dialysis patients with CKD were included.
2.2 Clinical data
The patients’ demographic and clinical characteristics (sex, height, weight, and age) and medical history (present illness, nephropathy, HTN, and diabetes) were recorded. Laboratory parameters evaluated including: white blood cell count (WBC), hemoglobin, total protein, albumin, haptoglobin, prealbumin, blood urea nitrogen (BUN), serum creatinine, estimated glomerular filtration rate (eGFR) (calculated using the CKD Epidemiology Collaboration formula), serum cystatin C, 24-h urinary protein, serum uric acid, total cholesterol, triglycerides, fasting blood glucose (FBG), serum calcium, potassium, phosphorus, high-density lipoprotein cholesterol(HDL-C), and low-density lipoprotein cholesterol (LDL-C).
2.3 Non-insulin-based IR indices
The non-insulin-based IR measures utilized were the TyG, TyG-BMI, TG/HDL-C, and METS-IR, calculated using the following formulas (10):
2.4 Dietary assessment
During the 24-h dietary review, the researchers directly asked the patients about their food consumption on the preceding day, evaluating the variety and quantities of food using tools such as food pictures or models. Nutrient intake was calculated according to the Chinese Dietary Guidelines (2022 edition) (24) and Chinese Dietary Reference Intakes (2013 edition) (25). Food and nutrient intake were then adjusted using the residual energy method (26).
Common indicators of dietary acid-base load include the NEAP, PRAL, calculated based on the dietary intake of proteins and minerals, and DAL, calculated using dietary protein, phosphorus, potassium, calcium, magnesium, height, and weight, as follows:
PRAL (mmol/d) (12) = 0.49 × protein (g/day) + 0.037 × phosphorus (mg/day) - 0.021 × potassium (mg/day) − 0.026 × magnesium (mg/day) - 0.013 × calcium (mg/day);
NEAP (mEq/d) (13) = 54.5 × [protein(g/day) / potassium intake (mEq/day)] - 10.2;
and DAL (mmol/d) (14) = PRAL + (body surface area [m2] × 41[mEq/d] / 1.73 m²), with body surface area (27, 28) = 0.007184 × height (cm) ^ 0.725 × weight (kg) ^ 0.425.
2.5 Statistical analysis
SPSS 26.0 statistical software was used for data analysis (SPSS Inc., Chicago, IL, USA). Normally distributed data were expressed as mean ± standard, while non-normally distributed data were expressed as medians with interquartile ranges. Differences between DAL tertiles were compared, and measurement data with a normal distribution and homogeneity of variance were compared between the groups using one-way analysis of variance. A non-parametric test was used to compare groups if the homogeneity of variance was not satisfied. Count variables were expressed as frequencies and percentages, and were analyzed using chi-squared or Fisher’s exact tests. Spearman’s correlation analysis was used to analyze the correlation between dietary acid and base load (including PRAL, NEAP, and DAL) and the non-insulin-based IR predictor indices, and multiple linear regression was used to assess the adjusted effects of variables affecting the non-insulin-based IR predictor indices. All P (or P-trends) were two-tailed, and statistical significance was set at P (or p-trend) < 0.05.
3 Results
Initially, 306 patients with CKD were eligible for inclusion. After excluding 7 patients due to incomplete dietary information and 11 patients with extreme energy intake (< 600 or > 4000 kcal/day), a sum of 288 patients were qualified for participation. Figure 1 shows the participant inclusion flowchart.
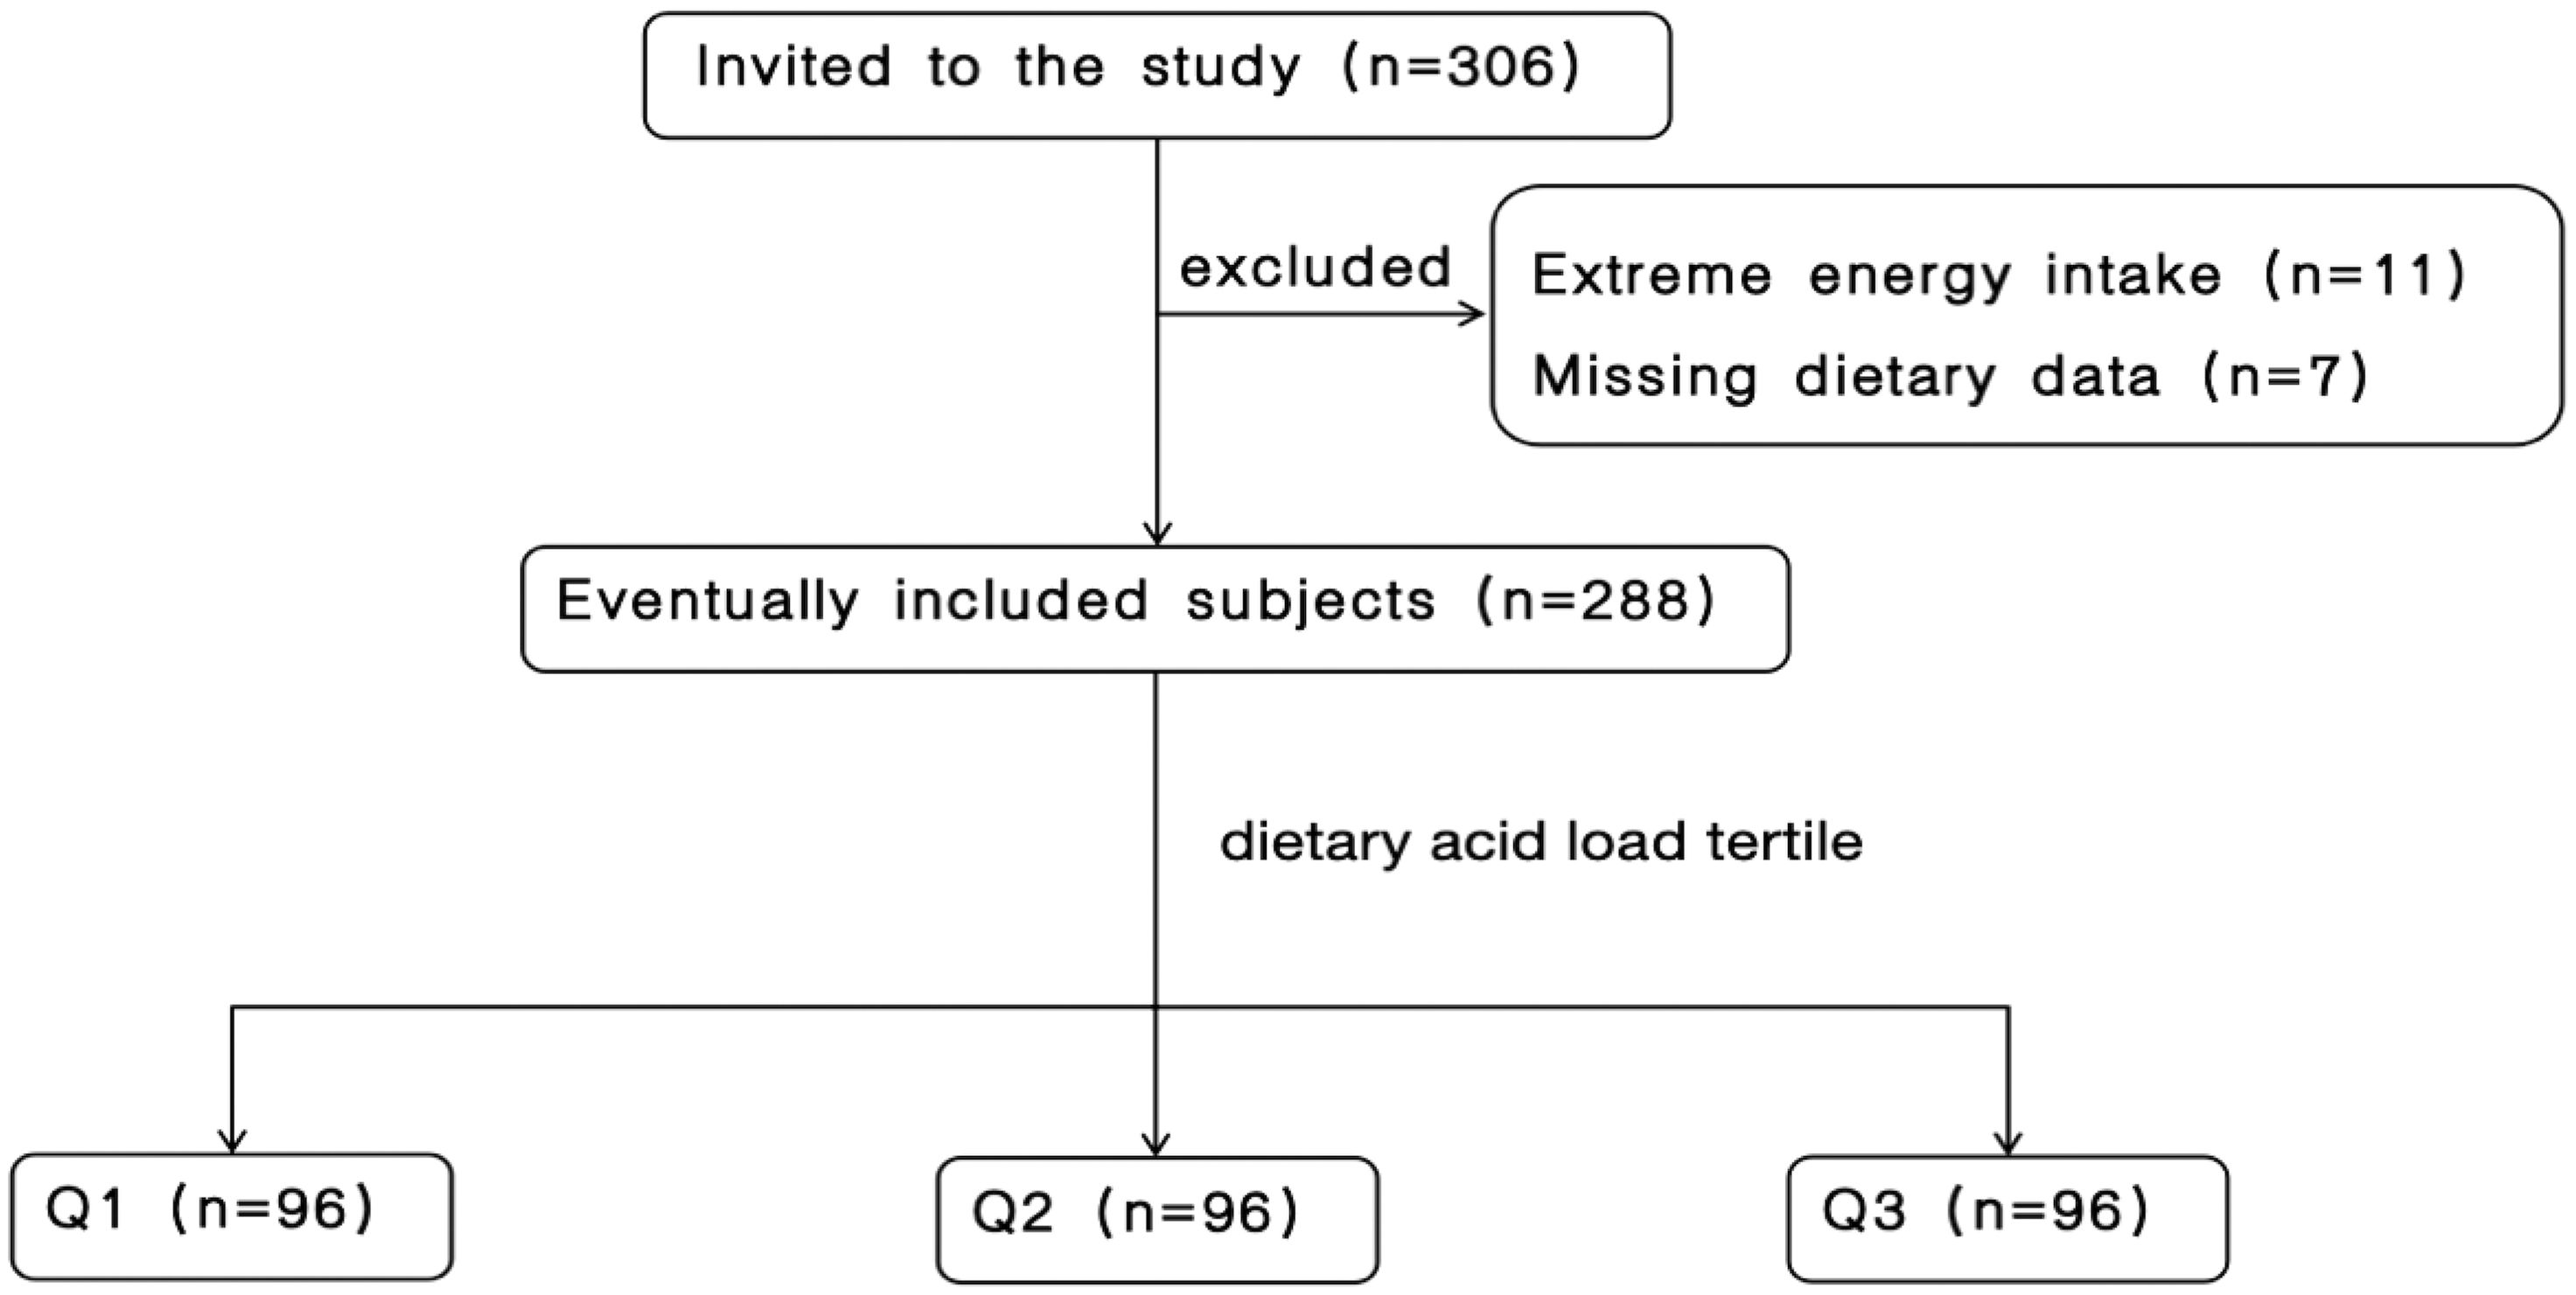
Figure 1. Flow chart of participant screening.
Among the DAL tertiles, PRAL, NEAP, DAL, TyG-BMI, TyG, TG/HDL-C, METS-IR, and BMI showed upward trends, and the differences were statistically significant (P < 0.001). Among the study participants, 141 (49%) had T2DM, and the difference across the tertiles was statistically significant (P = 0.008). The distributions of age, CKD course, and HTN among the DAL tertiles were not statistically significant (P or P-trend > 0.05). Table 1 presents the characteristics of the patients.
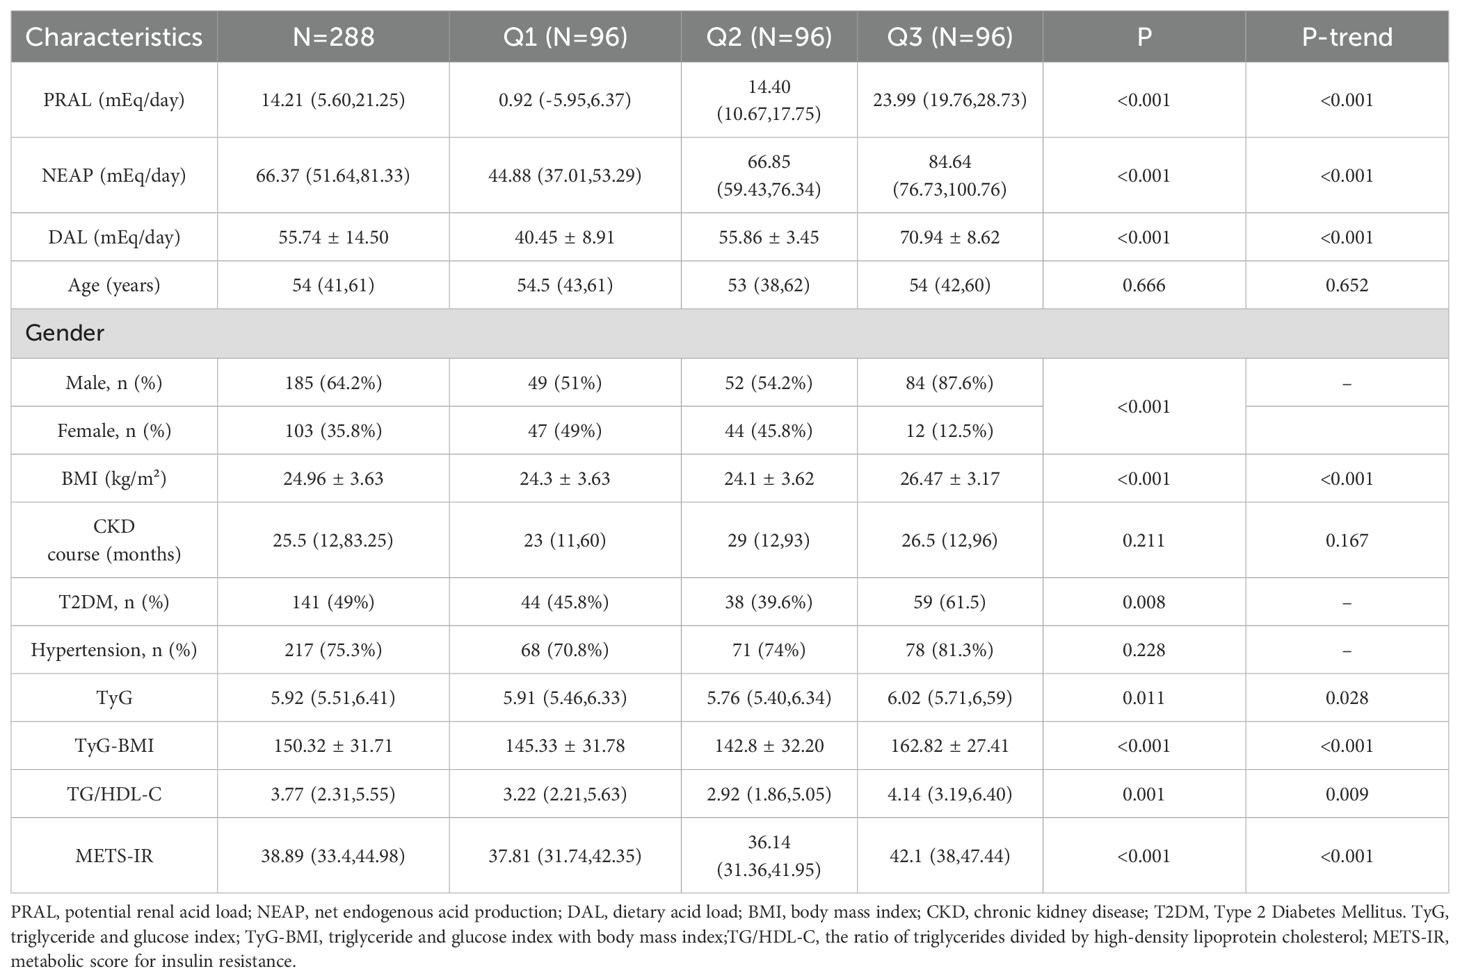
Table 1. Baseline characteristics of study participants by categories of DAL.
Among the DAL tertiles, patients with the highest DAL scores had significantly higher BUN, serum creatinine, serum cystatin C, uric acid, and FBG levels, all showing significant upward trends (P-trend < 0.05), while those assigned to the highest DAL category had significantly lower HDL-C levels (P = 0.006). However, there were no significant correlations between the DAL tertiles and WBC count, hemoglobin, total protein, haptoglobin, prealbumin, eGFR, 24-h urinary protein, total cholesterol, triglyceride, serum calcium, serum potassium, serum phosphorus, or LDL-C (P > 0.05). The clinical features are shown in Table 2.
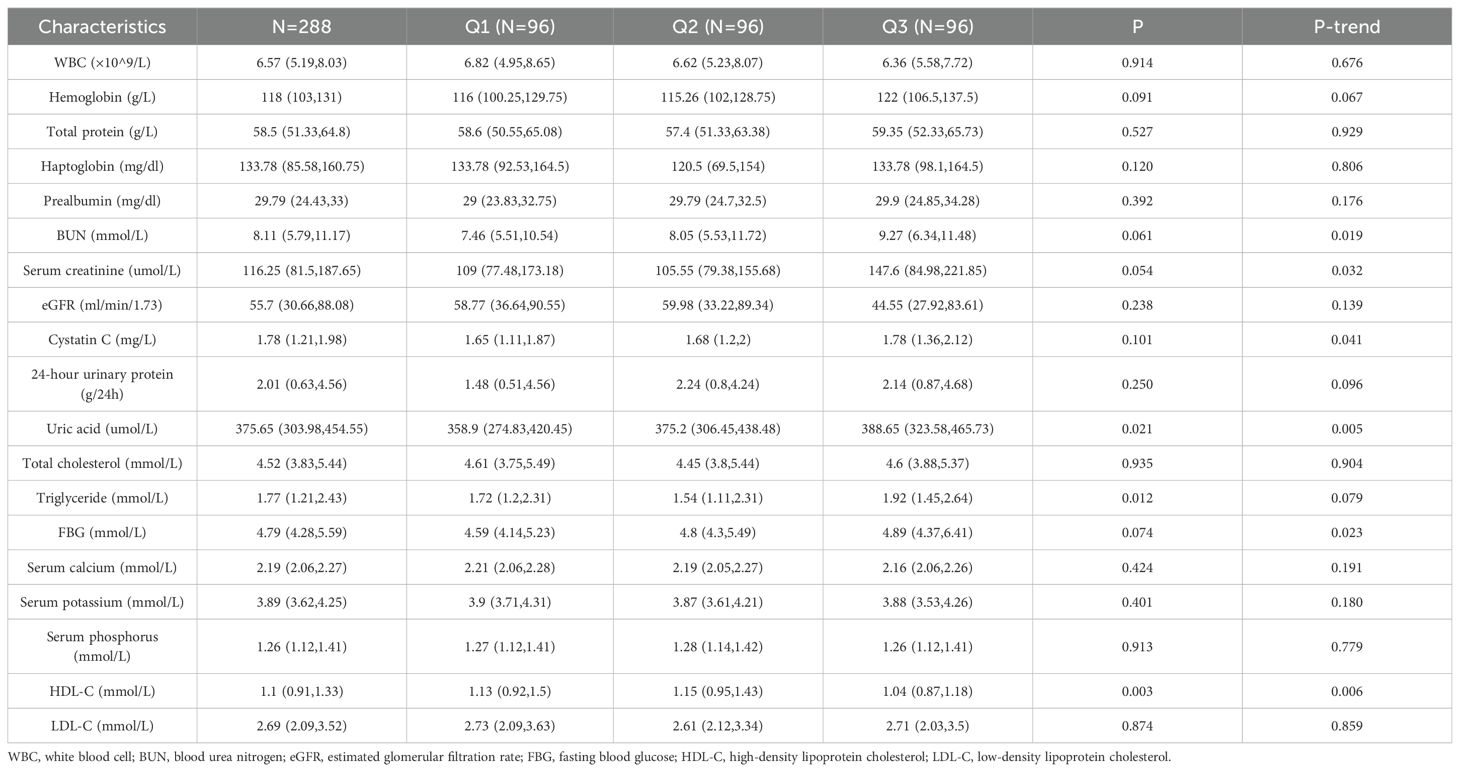
Table 2. Comparison of clinical characteristics of study participants by categories of DAL.
Among the food groups, the DAL tertile was significantly positively correlated with meat and eggs (P < 0.05), while displaying a negative correlation with fruits and vegetables (P < 0.001). No significant statistical relationship was found between the consumption of grain or dairy product and the DAL tertile (P > 0.05). In terms of energy and macronutrient consumption, the DAL tertile was positively associated with protein, animal protein, monounsaturated fatty acids (MUFAs), saturated fatty acids, and fat intake (P < 0.05). Conversely, there was an inverse relationship with the intake of carbohydrate, plant protein, and fiber (P < 0.05). No significant association was found for polyunsaturated fatty acid (PUFA) or energy intakes across the DAL tertiles. Regarding dietary micronutrient intake, the DAL tertile was positively associated with phosphorus intake (P-trend < 0.05), but negatively associated with potassium, calcium, magnesium, and copper intake (P-trend <0.05). There was no significant correlation between the DAL tertile and sodium, iron, or zinc levels (P > 0.05). Table 3 presents the nutritional intake data for the participants.
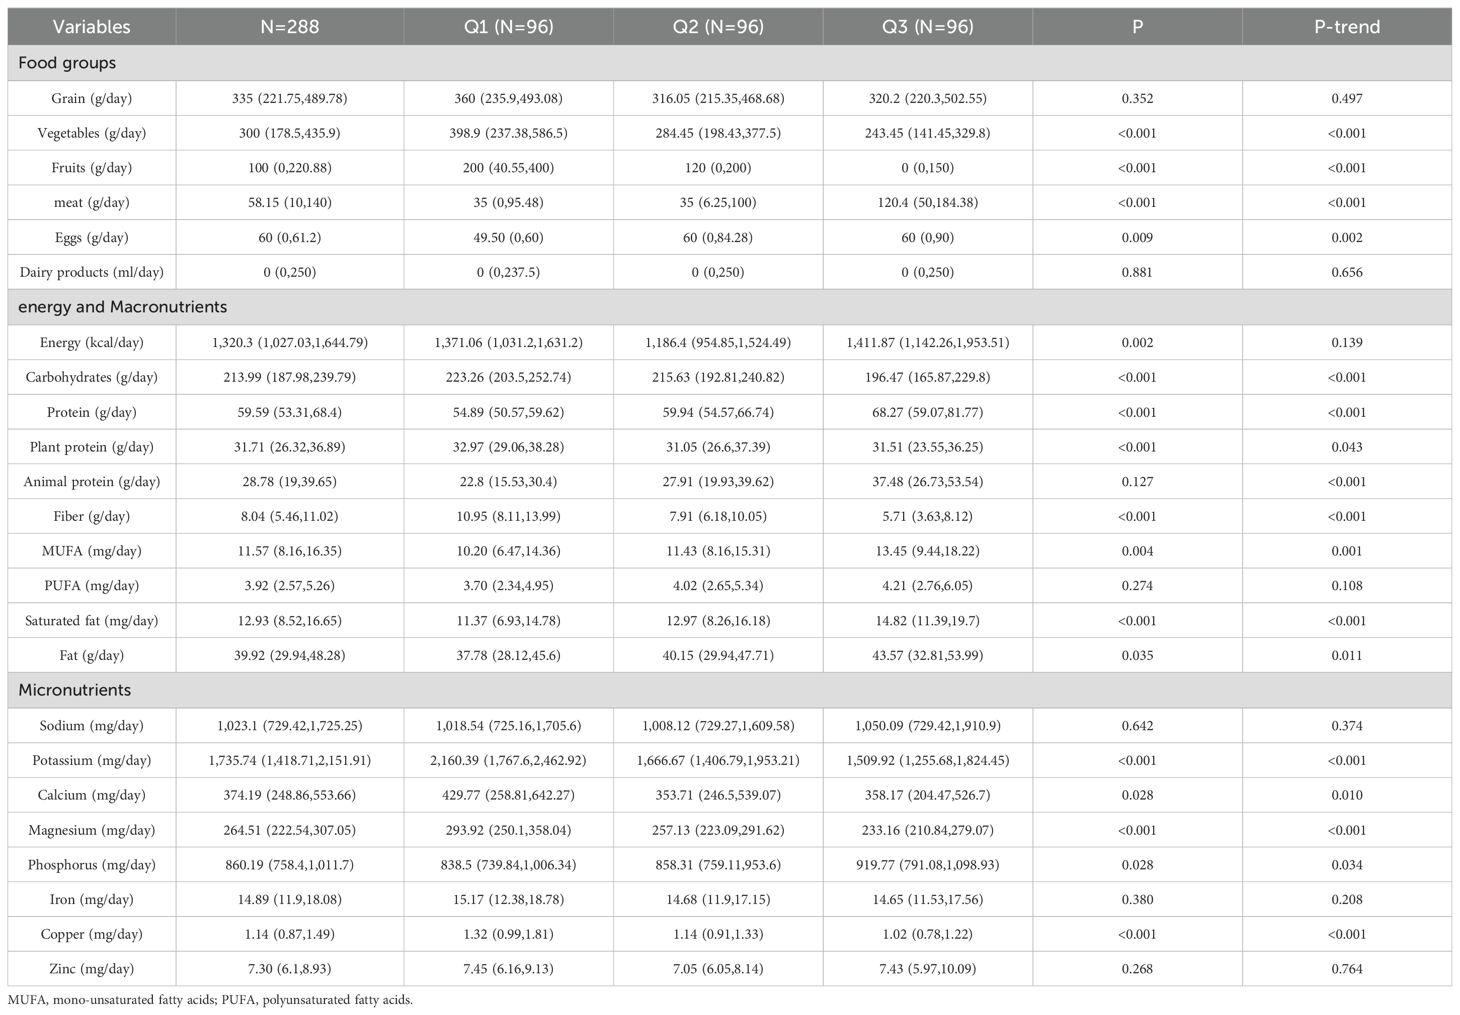
Table 3. Distribution of dietary intake in the study population.
There were no significant correlations between PRAL, NEAP, and the four non-insulin-based IR indices (P > 0.05). The DAL score was significantly associated with TyG-BMI (r = 0.251, P < 0.001) and METS-IR (r = 0.274, P < 0.001), but only weakly correlated with the TG/HDL-C ratio (r = 0.14, P = 0.018). Table 4 presents the correlations between dietary acid-base load scores and the four non-insulin-based IR indices.
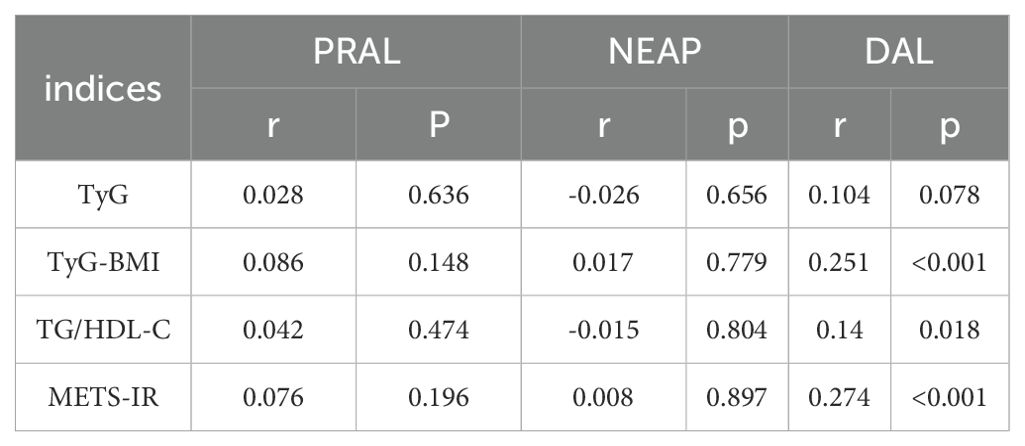
Table 4. Correlation analysis between dietary acid-base load scores and four types of non-insulin resistance.
Table 5 presents the association between the DAL score and four types of non-insulin resistance in CKD patients. In the rough model, model 1, and model 2, the DAL score was associated with both TyG -BMI (β = 0.549, P < 0.001; β = 0.437, P = 0.001; β = 0.336, P = 0.008, respectively) and METS-IR (β = 0.161, P < 0.001; β = 0.118, P = 0.001; β = 0.091, P = 0.007, respectively). There was no significant correlation, however, between the DAL score and the TyG or TG/HDL-C (P > 0.05).
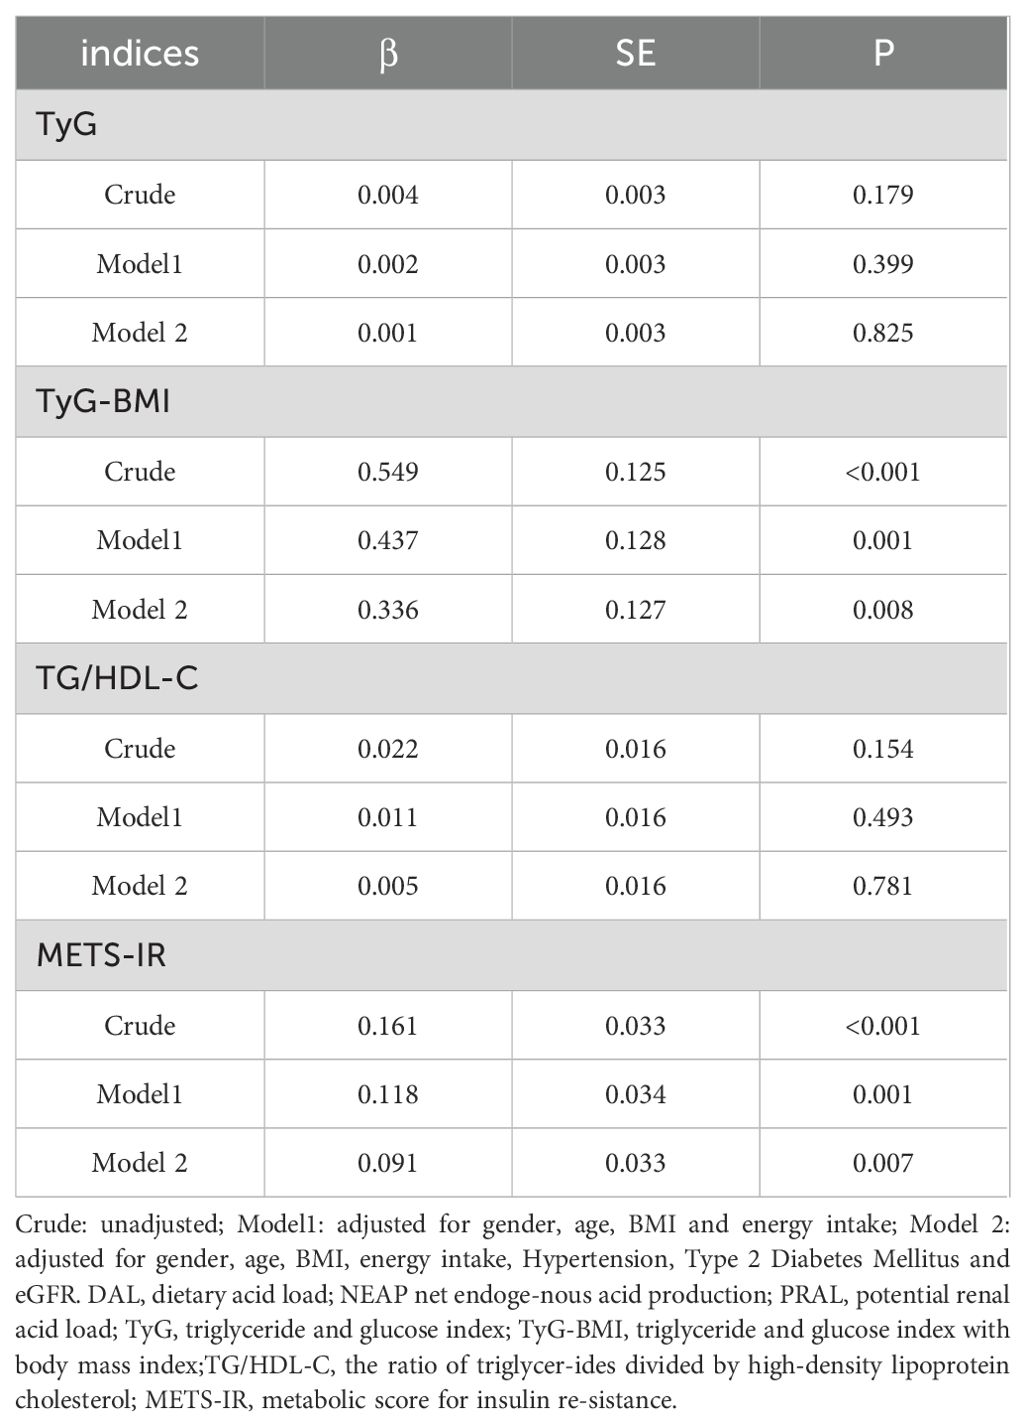
Table 5. Association between DAL score and four types of non-insulin resistance in CKD patients.
4 Discussion
In terms of energy and macronutrients, the study found that patients who were in the highest tertile of DAL had a higher intake of protein, animal protein, MUFAs, saturated fat, fat, and phosphorus, but a lower intake of carbohydrates, plant protein, dietary fiber, potassium, calcium, magnesium, and copper. The sources and types of dietary protein are essential for preventing disease. Some studies have shown that the total protein and animal protein can increase the risk of T2DM, whereas plant protein can reduce it (29, 30). Several prospective studies indicate that total MUFA intake is negatively related to the probability of T2DM (31, 32). Another study showed that a higher seafood source of omega 3 PUFAs is correlated with a lower risk of developing CKD (33). Whether fatty acids are a risk or protective factor for T2DM remains controversial, possibly because of differences in food sources and carbon chain lengths (34, 35).
In this study, DAL scores were significantly connected with TyG-BMI and METS-IR scores, but were only mildly correlated with TG/HDL-C. The four non-insulin-based IR markers, calculated from human biochemical indicators, are economical, simple and convenient. Of these four measures, TyG combined FPG and lipid levels, while the TG/HDL-C ratio is a key component of hyperlipidemia. TyG-BMI and METS-IR included not only blood lipids and FBG, but also BMI, which is important because obesity induces chronic inflammation leading to IR and metabolic disorders (36). Researches indicates that being overweight heightens the likelihood of CKD pathogenesis, deterioration of kidney function, and progression to end-stage kidney disease (37, 38). Mechanistically, IR leads to renal hemodynamic changes, tubular dysfunction, chronic inflammation and fibrosis (39, 40).
After adjusting for sex, age, energy, HTN, diabetes, and eGFR, multiple linear regression analysis showed that DAL score was associated with TyG-BMI (β = 0.336, P = 0.008) and METS-IR (β = 0.091, P = 0.007). Our research aligns with previous studies, suggests that TyG-BMI and METS-IR serve as more effective and dependable measures for evaluating IR and forecasting cardiovascular outcomes (9, 41, 42). Results from a Korean cohort study indicated that participants in the highest PRAL quartile had a 1.30 times higher risk of IR compared with the lowest quartile; Similar risk estimates have been observed for NEAP scores (18). Studies in Japan have shown that a higher dietary acid-base load (PRAL and NEAP scores) is connected with IR (43).Studies conducted in Denmark have shown that higher PRAL scores are associated with IR (44). Similarly, in this study, the DAL score was significantly positively correlated with TyG-BMI and METS-IR. A prospective study of 70–71 years old men in Swedish showed that the PRAL and NEAP scores were not associated with insulin sensitivity or β-cell function, in contrast to our results. This discrepancy may be due to the inconsistent age and sex of the study population, as we included both male and female participants over 18 years of age. Multiple mechanisms have been proposed to explain the associations between DAL and IR. Metabolic acidosis not only increases the secretion of cortisol and glucocorticoids (45), but also inhibits the level of adipokine (46), thereby increasing IR. In addition, the acidic environment may reduce insulin sensitivity by affecting insulin-like growth factor I (IGF-I) (47, 48). Reduced interstitial pH impairs insulin-receptor binding, leading to IR (49, 50).The study showed that metabolic acidosis from diet altered insulin secretion and signaling (51).
IR is associated with the occurrence and progression of CKD, which is a serious threat to public health because of its high prevalence, poor prognosis, and high mortality. The intake of acidic and alkaline foods affects the body’s acid-base balance, which significantly affects the risk of CKD progression (52). We assessed the connection the between dietary acid-base load and non-insulin-based IR markers in patients with CKD.
Both PRAL and NEAP scores were derived from protein and micronutrients. For micronutrients, the PRAL score includes phosphorus, potassium, magnesium and calcium (12); the NEAP score is determined by potassium intake (13); and the DAL score is calculated based on the PRAL score and body surface area (14). For these metrics, a higher score indicates that the food has a higher acidogenic potential. As each measure has a different formula, limitations, and strengths, the use of all three dietary acid-base load measures may provide more reliable results than any measure alone. The food group associated with the highest DAL tertile in this study was distinguished by increased intake of meat and eggs, but decreased consumption of vegetables and fruits. With respect to the body acid load, plant-based dietary patterns are thought to reduce, while animal-based dietary patterns are thought to increase. Vegetables and fruits contain excellent antioxidants, which can eliminate free radicals, prevent oxidative stress, and protect cells and structures from oxidative damage (53). A rise in the amount of the consumption of fruits and vegetables has long been linked to benefits against cancers, diabetes, neurodegenerative diseases, and cardiovascular diseases (54). However, meat consumption, and synthetic meat in particular, is positively connected with the production of proinflammatory substances (55).
To our knowledge, this study is the first to examine the relationship between dietary acid load and the four non-insulin-based IR indices in patients with CKD. Previous studies did not consider diet as a confounding factor, and adjustments were made for energy in the model used in this study. Nevertheless, this study has some certain limitations. First, this study was cross-sectional and unable to assess causality, a prospective cohort study is recommended for further validation studies. The diversity and representativeness of the sample may be limited. Subsequent studies are recommended to validate the findings in groups of different regions and ethnicities. Second, the 24-h dietary recall is potentially susceptible to recall bias. Future studies may employ 3-day dietary records or food frequency questionnaires to more accurately assess dietary intake. Third, dietary supplements were not considered. Other confounding factors that were not adjusted for may have influenced our study results, such as physical activity and medication use including statins and fibrates. According to our results, the DAL score was significantly positively associated with TyG-BMI and METS-IR after adjusting for possible confounders. This indicates that reducing dietary acid load is a healthy dietary habit that may help prevent IR-related diseases with CKD.
5 Conclusions
According to our current study, the patients with the highest DAL scores had the highest TyG, TyG-BMI, TG/HDL-C ratio, and METS-IR. After adjusting for possible confounding factors, the DAL score exhibited a significant positive correlation with both TyG-BMI and METS-IR. Reducing dietary acid load by consuming more fruits and vegetables and limiting excessive intake of meat is beneficial for some diseases caused by IR.
Data availability statement
The original contributions presented in the study are included in the article/Supplementary Material. Further inquiries can be directed to the corresponding authors.
Ethics statement
The studies involving humans were approved by the Ethics Committee of the Chinese People’s Liberation Army General Hospital (approval number: S2022-324-01). The studies were conducted in accordance with the local legislation and institutional requirements. The participants provided their written informed consent to participate in this study. Written informed consent was obtained from the individual(s) for the publication of any potentially identifiable images or data included in this article.
Author contributions
HH: Investigation, Validation, Writing – original draft. QW: Writing – original draft. RZ: Writing – original draft. FL: Writing – original draft. YN: Formal Analysis, Software, Writing – original draft. YL: Investigation, Writing – original draft. JW: Writing – original draft. SLi: Conceptualization, Writing – original draft. ZT: Writing – original draft. XYC: Supervision, Writing – review & editing. XW: Writing – review & editing. JY: Writing – review & editing. SLuo: Investigation, Writing – review & editing. WD: Methodology, Writing – original draft. WZ: Writing – review & editing. YZ: Supervision, Writing – review & editing. YW: Writing – review & editing. LZ: Writing – review & editing. GC: Writing – review & editing. XMC: Funding acquisition, Project administration, Resources, Writing – review & editing. ZD: Formal Analysis, Funding acquisition, Project administration, Resources, Supervision, Visualization, Writing – review & editing.
Funding
The author(s) declare that financial support was received for the research and/or publication of this article. This research was supported by Science & Technology Project of Beijing, China (No. Z221100007422121), Capital’s Funds for Health Improvement and Research (No. CFH 2024-1-5021), Beijing Natural Science Foundation (No. 7252018, No. L222133, L232122), and National Natural Science Foundation of China (No. 62450131).
Acknowledgments
We would like to thank the 301 Nephrology Department for their support and the subjects for supplying the data.
Conflict of interest
The authors declare that the research was conducted in the absence of any commercial or financial relationships that could be construed as a potential conflict of interest.
Generative AI statement
The author(s) declare that no Generative AI was used in the creation of this manuscript.
Publisher’s note
All claims expressed in this article are solely those of the authors and do not necessarily represent those of their affiliated organizations, or those of the publisher, the editors and the reviewers. Any product that may be evaluated in this article, or claim that may be made by its manufacturer, is not guaranteed or endorsed by the publisher.
Abbreviations
CKD, Chronic Kidney Disease; T2DM, Type 2 Diabetes Mellitus; HTN, Hypertension; IR, Insulin resistance; TyG, Triglyceride and glucose index; TyG‐BMI, Triglyceride and glucose index with body mass index; TG/HDL‐C, The ratio of triglycerides divided by high‐density lipoprotein cholesterol; METS‐IR, Metabolic score for insulin resistance; PRAL, Potential Renal Acid Load; NEAP, Net Endogenous Acid Production; DAL, Dietary Acid Load; eGFR, estimated glomerular filtration rate; WBC, White Blood Cell; BUN, Blood Urea Nitrogen; FBG, Fasting Blood Glucose; HDL-C, High-Density Lipoprotein Cholesterol; LDL-C, Low-Density Lipoprotein Cholesterol; MUFA, monounsaturated fatty acids; PUFA, Polyunsaturated Fatty Acid.
References
1. Bello AK, Okpechi IG, Levin A, Ye F, Damster S, Arruebo S, et al. An update on the global disparities in kidney disease burden and care across world countries and regions. Lancet Glob Health. (2024) 12:e382–e95. doi: 10.1016/S2214-109X(23)00570-3
2. Wang L, Xu X, Zhang M, Hu C, Zhang X, Li C, et al. Prevalence of chronic kidney disease in China: results from the sixth China chronic disease and risk factor surveillance. JAMA Intern Med. (2023) 183:298–310. doi: 10.1001/jamainternmed.2022.6817
3. Yang S, Kwak S, Song YH, Han SS, Lee HS, Kang S, et al. Association of longitudinal trajectories of insulin resistance with adverse renal outcomes. Diabetes Care. (2022) 45:1268–75. doi: 10.2337/dc21-2521
4. Burnier M and Damianaki A. Hypertension as cardiovascular risk factor in chronic kidney disease. Circ Res. (2023) 132:1050–63. doi: 10.1161/CIRCRESAHA.122.321762
5. Amouzegar A, Honarvar M, Masoumi S, Tohidi M, Mehran L, and Azizi F. Sex-specific trajectories of insulin resistance markers and reduced renal function during 18 years of follow-up: TLGS. J Clin Endocrinol Metab. (2023) 108:e230–e9. doi: 10.1210/clinem/dgac735
6. Zhang L, Chen Z, Wang Y, Tweardy DJ, and Mitch WE. Stat3 activation induces insulin resistance via a muscle-specific E3 ubiquitin ligase Fbxo40. Am J Physiol Endocrinol Metab. (2020) 318:E625–e35. doi: 10.1152/ajpendo.00480.2019
7. Sun Y, Ji H, Sun W, An X, and Lian F. Triglyceride glucose (TyG) index: A promising biomarker for diagnosis and treatment of different diseases. Eur J Intern Med. (2025) 131:3–14. doi: 10.1016/j.ejim.2024.08.026
8. Apostolopoulou M, Lambadiari V, Roden M, and Dimitriadis GD. Insulin resistance in type 1 diabetes: pathophysiological, clinical, and therapeutic relevance. Endocr Rev. (2025) 46:317–48. doi: 10.1210/endrev/bnae032
9. Mestre Font M, Busquets-Cortés C, Ramírez-Manent JI, Tomás-Gil P, Paublini H, and López-González ÁA. Influence of sociodemographic variables and healthy habits on the values of insulin resistance indicators in 386,924 Spanish workers. Nutrients. (2023) 15:5122. doi: 10.3390/nu15245122
10. Seifi N, Nosrati M, Koochackpoor G, Aghasizadeh M, Bahari H, Namdar HB, et al. The association between hyperuricemia and insulin resistance surrogates, dietary- and lifestyle insulin resistance indices in an Iranian population: MASHAD cohort study. Nutr J. (2024) 23:5. doi: 10.1186/s12937-023-00904-2
11. Bach KE, Kelly JT, Palmer SC, Khalesi S, Strippoli GFM, and Campbell KL. Healthy dietary patterns and incidence of CKD: A meta-analysis of cohort studies. Clin J Am Soc Nephrol. (2019) 14:1441–9. doi: 10.2215/CJN.00530119
12. Remer T, Dimitriou T, and Manz F. Dietary potential renal acid load and renal net acid excretion in healthy, free-living children and adolescents. Am J Clin Nutr. (2003) 77:1255–60. doi: 10.1093/ajcn/77.5.1255
13. Frassetto LA, Todd KM, Morris RC Jr., and Sebastian A. Estimation of net endogenous noncarbonic acid production in humans from diet potassium and protein contents. Am J Clin Nutr. (1998) 68:576–83. doi: 10.1093/ajcn/68.3.576
14. Remer T and Manz F. Estimation of the renal net acid excretion by adults consuming diets containing variable amounts of protein. Am J Clin Nutr. (1994) 59:1356–61. doi: 10.1093/ajcn/59.6.1356
15. Mirmiran P, Yuzbashian E, Bahadoran Z, Asghari G, and Azizi F. Dietary acid-base load and risk of chronic kidney disease in adults: Tehran lipid and glucose study. Iran J Kidney Dis. (2016) 10:119–25.
16. Banerjee T, Crews DC, Wesson DE, Tilea AM, Saran R, Ríos-Burrows N, et al. High dietary acid load predicts ESRD among adults with CKD. J Am Soc Nephrol. (2015) 26:1693–700. doi: 10.1681/ASN.2014040332
17. MaChado AD, Marchioni DM, Lotufo PA, Benseñor IM, and Titan SM. Dietary acid load and the risk of events of mortality and kidney replacement therapy in people with chronic kidney disease: the Progredir Cohort Study. Eur J Clin Nutr. (2024) 78:128–34. doi: 10.1038/s41430-023-01361-0
18. Lee KW and Shin D. Positive association between dietary acid load and future insulin resistance risk: findings from the Korean Genome and Epidemiology Study. Nutr J. (2020) 19:137. doi: 10.1186/s12937-020-00653-6
19. Hatami E, Abbasi K, Salehi-Sahlabadi A, Beigrezaei S, Bahrami A, Ghiasvand R, et al. Dietary acid load and risk of type 2 diabetes mellitus: A case-control study. Clin Nutr ESPEN. (2022) 48:308–12. doi: 10.1016/j.clnesp.2022.01.029
20. Abbastabar M, Mohammadi-Pirouz Z, Omidvar S, Bakhtiari A, Crowe FL, and Sepidarkish M. Dietary acid load and human health: A systematic review and meta-analysis of observational studies. Nutr Rev. (2025). doi: 10.1093/nutrit/nuae222
21. Lin F, Zhang M, Wang R, Sun M, Zhang Z, Qiao Y, et al. Association between dietary acid load and hypertension in Chinese adults: analysis of the China health and nutrition survey (2009). Nutrients. (2023) 15:4664. doi: 10.3390/nu15214664
22. Seifi N, Rahimi H, Koochakpoor G, Zarei A, Assaran Darban R, Ferns GA, et al. Higher dietary acid load is associated with an increased risk of metabolic syndrome. Sci Rep. (2023) 13:22154. doi: 10.1038/s41598-023-48429-2
23. Kidney Disease: Improving Global Outcomes (KDIGO) CKD Work Group: Stevens PE, Ahmed SB, Carrero JJ, Foster B, Francis A, et al. KDIGO 2024 clinical practice guideline for the evaluation and management of chronic kidney disease. Kidney Int. (2024) 105:S117–s314. doi: 10.1016/j.kint.2023.10.018
24. Society CN. Dietary Guidelines for Chinese Residents (2022). Beijing,China: People’s Medical Publishing House (2022).
25. Society CN. Dietary Reference Intakes for Chinese. 2013 ed. Beijing,China: Beijing: Sciences Press (2014). 660 p.
26. Willett WC, Howe GR, and Kushi LH. Adjustment for total energy intake in epidemiologic studies. Am J Clin Nutr. (1997) 65:1220S–8S; discussion 9S-31S. doi: 10.1093/ajcn/65.4.1220S
27. Du Bois D and Du Bois EF. A formula to estimate the approximate surface area if height and weight be known. 1916. Nutrition. (1989) 5:303–11; discussion 12-3.
28. Verbraecken J, Van de Heyning P, De Backer W, and Van Gaal L. Body surface area in normal-weight, overweight, and obese adults. A comparison study. Metabolism. (2006) 55:515–24. doi: 10.1016/j.metabol.2005.11.004
29. Tian S, Xu Q, Jiang R, Han T, Sun C, and Na L. Dietary protein consumption and the risk of type 2 diabetes: A systematic review and meta-analysis of cohort studies. Nutrients. (2017) 9:982. doi: 10.3390/nu9090982
30. Schulze MB, Haardt J, Amini AM, Kalotai N, Lehmann A, Schmidt A, et al. Protein intake and type 2 diabetes mellitus: an umbrella review of systematic reviews for the evidence-based guideline for protein intake of the German Nutrition Society. Eur J Nutr. (2024) 63:33–50. doi: 10.1007/s00394-023-03234-5
31. Krishnan S, Steffen LM, Paton CM, and Cooper JA. Impact of dietary fat composition on prediabetes: a 12-year follow-up study. Public Health Nutr. (2017) 20:1617–26. doi: 10.1017/S1368980016003669
32. Mirmiran P, Esfandyari S, Moghadam SK, Bahadoran Z, and Azizi F. Fatty acid quality and quantity of diet and risk of type 2 diabetes in adults: Tehran Lipid and Glucose Study. J Diabetes Complicat. (2018) 32:655–9. doi: 10.1016/j.jdiacomp.2018.05.003
33. Ong KL, Marklund M, Huang L, Rye KA, Hui N, Pan XF, et al. Association of omega 3 polyunsaturated fatty acids with incident chronic kidney disease: pooled analysis of 19 cohorts. Bmj. (2023) 380:e072909. doi: 10.1136/bmj-2022-072909
34. Ericson U, Hellstrand S, Brunkwall L, Schulz CA, Sonestedt E, Wallström P, et al. Food sources of fat may clarify the inconsistent role of dietary fat intake for incidence of type 2 diabetes. Am J Clin Nutr. (2015) 101:1065–80. doi: 10.3945/ajcn.114.103010
35. Forouhi NG, Koulman A, Sharp SJ, Imamura F, Kröger J, Schulze MB, et al. Differences in the prospective association between individual plasma phospholipid saturated fatty acids and incident type 2 diabetes: the EPIC-InterAct case-cohort study. Lancet Diabetes Endocrinol. (2014) 2:810–8. doi: 10.1016/S2213-8587(14)70146-9
36. Sugimoto S, Mena HA, Sansbury BE, Kobayashi S, Tsuji T, Wang CH, et al. Brown adipose tissue-derived MaR2 contributes to cold-induced resolution of inflammation. Nat Metab. (2022) 4:775–90. doi: 10.1038/s42255-022-00590-0
37. Chang AR, Grams ME, Ballew SH, Bilo H, Correa A, Evans M, et al. Adiposity and risk of decline in glomerular filtration rate: meta-analysis of individual participant data in a global consortium. Bmj. (2019) 364:k5301. doi: 10.1136/bmj.k5301
38. Garofalo C, Borrelli S, Minutolo R, Chiodini P, De Nicola L, and Conte G. A systematic review and meta-analysis suggests obesity predicts onset of chronic kidney disease in the general population. Kidney Int. (2017) 91:1224–35. doi: 10.1016/j.kint.2016.12.013
39. Whaley-Connell A and Sowers JR. Insulin resistance in kidney disease: is there a distinct role separate from that of diabetes or obesity? Cardiorenal Med. (2017) 8:41–9. doi: 10.1159/000479801
40. Fritz J, Brozek W, Concin H, Nagel G, Kerschbaum J, Lhotta K, et al. The association of excess body weight with risk of ESKD is mediated through insulin resistance, hypertension, and hyperuricemia. J Am Soc Nephrol. (2022) 33:1377–89. doi: 10.1681/ASN.2021091263
41. Zhang Z, Zhao L, Lu Y, Meng X, and Zhou X. Association between non-insulin-based insulin resistance indices and cardiovascular events in patients undergoing percutaneous coronary intervention: a retrospective study. Cardiovasc Diabetol. (2023) 22:161. doi: 10.1186/s12933-023-01898-1
42. Wang Z, He H, Xie Y, Li J, Luo F, Sun Z, et al. Non-insulin-based insulin resistance indexes in predicting atrial fibrillation recurrence following ablation: a retrospective study. Cardiovasc Diabetol. (2024) 23:87. doi: 10.1186/s12933-024-02158-6
43. Akter S, Eguchi M, Kuwahara K, Kochi T, Ito R, Kurotani K, et al. High dietary acid load is associated with insulin resistance: The Furukawa Nutrition and Health Study. Clin Nutr. (2016) 35:453–9. doi: 10.1016/j.clnu.2015.03.008
44. Gæde J, Nielsen T, Madsen ML, Toft U, Jørgensen T, Overvad K, et al. Population-based studies of relationships between dietary acidity load, insulin resistance and incident diabetes in Danes. Nutr J. (2018) 17:91. doi: 10.1186/s12937-018-0395-1
45. Esche J, Shi L, Sánchez-Guijo A, Hartmann MF, Wudy SA, and Remer T. Higher diet-dependent renal acid load associates with higher glucocorticoid secretion and potentially bioactive free glucocorticoids in healthy children. Kidney Int. (2016) 90:325–33. doi: 10.1016/j.kint.2016.02.033
46. Disthabanchong S, Niticharoenpong K, Radinahamed P, Stitchantrakul W, Ongphiphadhanakul B, and Hongeng S. Metabolic acidosis lowers circulating adiponectin through inhibition of adiponectin gene transcription. Nephrol Dial Transpl. (2011) 26:592–8. doi: 10.1093/ndt/gfq410
47. Brown DD and Dauber A. Growth hormone and insulin-like growth factor dysregulation in pediatric chronic kidney disease. Horm Res Paediatr. (2021) 94:105–14. doi: 10.1159/000516558
48. Della Guardia L, Thomas MA, and Cena H. Insulin sensitivity and glucose homeostasis can be influenced by metabolic acid load. Nutrients. (2018) 10:618. doi: 10.3390/nu10050618
49. Marunaka Y. Molecular Mechanisms of Obesity-Induced Development of Insulin Resistance and Promotion of Amyloid-β Accumulation: Dietary Therapy Using Weak Organic Acids via Improvement of Lowered Interstitial Fluid pH. Biomolecules. (2023) 13:779. doi: 10.3390/biom13050779
50. Marunaka Y. Roles of interstitial fluid pH and weak organic acids in development and amelioration of insulin resistance. Biochem Soc Trans. (2021) 49:715–26. doi: 10.1042/BST20200667
51. Vieira-Neto A, Zimpel R, Lopes FR Jr., Scheffler TL, Block E, Thatcher WW, et al. Duration and degree of diet-induced metabolic acidosis prepartum alter tissue responses to insulin in dairy cows. J Dairy Sci. (2021) 104:1660–79. doi: 10.3168/jds.2020-18787
52. Wesson DE and Simoni J. Acid retention during kidney failure induces endothelin and aldosterone production which lead to progressive GFR decline, a situation ameliorated by alkali diet. Kidney Int. (2010) 78:1128–35. doi: 10.1038/ki.2010.348
53. Harasym J and Oledzki R. Effect of fruit and vegetable antioxidants on total antioxidant capacity of blood plasma. Nutrition. (2014) 30:511–7. doi: 10.1016/j.nut.2013.08.019
54. Wang DD, Li Y, Bhupathiraju SN, Rosner BA, Sun Q, Giovannucci EL, et al. Fruit and vegetable intake and mortality: results from 2 prospective cohort studies of US men and women and a meta-analysis of 26 cohort studies. Circulation. (2021) 143:1642–54. doi: 10.1161/CIRCULATIONAHA.120.048996
Keywords: chronic kidney disease, dietary acid-base load, triglyceride glucose-body mass index, metabolic score for insulin resistance, insulin resistance
Citation: Huang H, Wang Q, Zhang R, Liu F, Niu Y, Luo Y, Wang J, Li S, Tang Z, Cao X, Wang X, Yang J, Luo S, Deng W, Zhang W, Zheng Y, Wang Y, Zhang L, Cai G, Chen X and Dong Z (2025) Relationship between dietary acid-base load and non-insulin-based resistance measures in patients with chronic kidney disease. Front. Endocrinol. 16:1589528. doi: 10.3389/fendo.2025.1589528
Received: 07 March 2025; Accepted: 30 May 2025;
Published: 20 June 2025.
Edited by:
Carmine Izzo, University of Salerno, ItalyReviewed by:
Karem Salem, Fayoum University, EgyptXi Qiao, Second Hospital of Shanxi Medical University, China
Copyright © 2025 Huang, Wang, Zhang, Liu, Niu, Luo, Wang, Li, Tang, Cao, Wang, Yang, Luo, Deng, Zhang, Zheng, Wang, Zhang, Cai, Chen and Dong. This is an open-access article distributed under the terms of the Creative Commons Attribution License (CC BY). The use, distribution or reproduction in other forums is permitted, provided the original author(s) and the copyright owner(s) are credited and that the original publication in this journal is cited, in accordance with accepted academic practice. No use, distribution or reproduction is permitted which does not comply with these terms.
*Correspondence: Xiangmei Chen, eG1jaGVuMzAxQDEyNi5jb20=; Zheyi Dong, c2hlbmdkYWkyNkAxNjMuY29t
†These authors have contributed equally to this work