 Liqiang Liu
 Wanshi Duan1
- 1Tangdu Hospital, Fourth Military Medical University, Xi'an, China
- 2Air Force Medical University, Xi'an, China
Purpose: Bone metastasis (BM) is a common manifestation of distant spread in patients with esophageal cancer. This study aimed to develop a machine learning algorithm to predict the risk of bone metastasis in esophageal cancer patients, thereby supporting clinical decision-making support.
Methods: Clinical and pathological data of esophageal cancer patients were obtained from the SEER database of the U.S. National Institutes of Health from 2010 to 2020. Six machine learning models were constructed: Support Vector Machine, Logistic Regression, Extreme Gradient Boosting, Neural Network, Random Forest, and k-Nearest Neighbors. Models performance was evaluated using accuracy, precision, recall, F1-score, and the area under the receiver operating characteristic curve. The optimal model was further used to interpret the associations between clinicopathological features and bone metastasis.
Results: A total of 9,744 patients were included, with 532 (5.47%) had bone metastasis and 9,212 (94.53%) without. Multivariate logistic regression analysis identified age, T stage, N stage, and histological type as independent risk factors for bone metastasis. The XGBoost model demonstrated the best performance, achieving an accuracy of 0.80, a recall of 0.99, a precision of 0.72, an F1-score of 0.8300, and AUC of 0.92.
Conclusion: The XGBoost model showed excellent predictive performance for bone metastasis in esophageal cancer patients, providing valuable insights for guiding clinical treatment decisions.
1 Introduction
Esophageal carcinoma (EC) is the seventh most commonly diagnosed cancer worldwide, with an estimated 604,000 new cases reported in 2020. It ranks sixth among all cancers in terms of mortality, accounting for approximately 544,000 deaths globally in the same year (1).
The incidence and histological subtypes of EC vary significantly across different geographic regions (2). EC primarily comprises two major histological subtypes: esophageal squamous cell carcinoma (ESCC) and esophageal adenocarcinoma (EAC). These subtypes differ markedly in terms of epidemiological patterns and biological behavior, making it essential to understand their distinctions for accurate diagnosis and effective treatment strategies (3). In the United States, individuals of White, Native American, and Black ethnicity are at a higher risk of developing EC compared to those of Hispanic or Asian ethnicity. Black patients are more likely to develop ESCC, whereas white patients are more commonly affected by EAC (4). Globally, EC imposes a significant disease burden, particularly in East Asia, Africa, and South America. ESCC originates from the stratified squamous epithelium of the esophagus and is ofen associated with chronic inflammation and mucosal injury, commonly occurring in the thoracic segment. Tobacco use and alcohol consumption are well-established risk factors for the development of invasive ESCC (5). In China, EC is the sixth most commonly diagnosed malignancy and the fourth leading cause of cancer-related mortality. Notably, approximately 90% of EC cases in China are ESCC, making it the predominant histological subtype both in China and globally (6). In contrast, esophageal adenocarcinoma is characterized by the malignant proliferation of glandular epithelial cells in the esophagus. The main risk factors include gastroesophageal reflux disease (GERD), Barrett’s esophagus (BE), tobacco abuse, obesity, and diets low in fruits and vegetables (7), In the United States, the incidence of EAC has been increasing and now accounts for over 60% of all esophageal cancer cases (8). Patients with EAC often present with more advanced T and N stage at diagnosis compared to those with ESCC. Despite the distinct etiological and pathological features of ESCC and EAC, their treatment approaches remained largely similar until recent advancements (9).
The 5-year survival rate for patients with metastatic esophageal cancer is extremely low, with only approximately 5% surviving beyond five years (10). Among distant metastatic sites, the liver is the most frequently involved, followed by the lymph nodes, lungs, bones, and brain. Interestingly, squamous cell carcinoma (SCC) tumors exhibit a higher rate for lung metastasis compared to adenocarcinoma (AC) subtype, whereas the AC subtype has a higher propensity for metastasis to the liver, bones, and brain (11). Developing predictive models to assess the risk and prognosis of bone metastasis in esophageal cancer is essential for guiding clinical management and improving patient outcomes.
Recent applications of machine learning in oncology have shown great promise in various domains, including medical image analysis, treatment planning, patient survival prognosis, and the synthesis of drugs at the point of care (12). However, limited research has focused on predictive models specifically targeting bone metastasis in esophageal cancer. This study aims to develop a machine learning algorithm for predicting the risk of bone metastasis in patients with esophageal cancer. We anticipate that such a predictive model will provide valuable insights to support clinical decision-making and ultimately improve patient outcomes.
2 Methods
2.1 Research design
The software tools utilized in this study include Python version 3.8.01 and SEER*Stat version.2 Patient data were extracted from the SEER database using SEER*Stat software. We included patients diagnosed with esophageal cancer (SCC and AC) between 2010 and 2020. The exclusion criteria were as follows: (1) patients with unknown brain, liver, or lung metastatic status; (2) patients with missing data on race race or histology grade; (3) patients with unknown primary tumor site; and (4) patients with incomplete T, N, or M stage information. A flowchart illustrating the case selection process is shown in Figure 1.
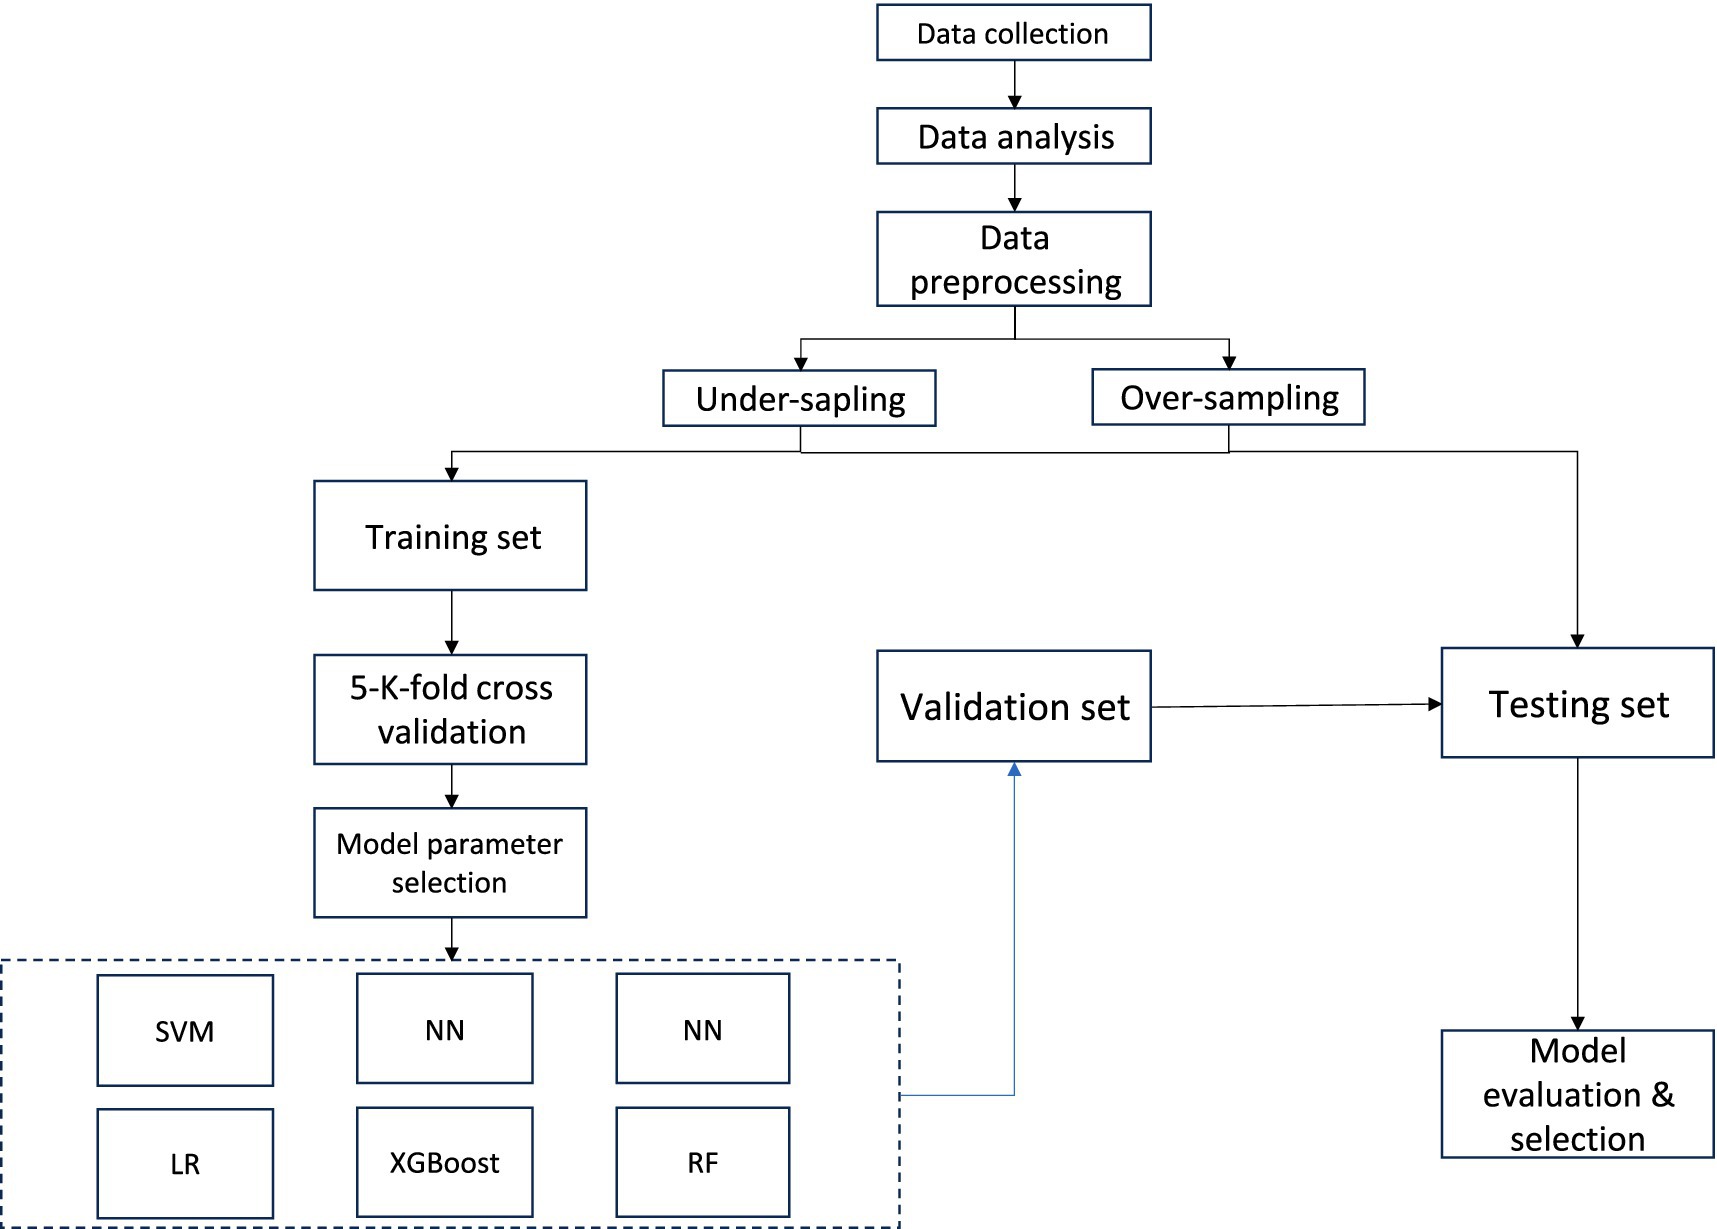
Figure 1. Research flowchart.
2.2 Data collection and clean
In this study, 8 variables related to patients demographics and clinicopathological features were selected for analysis. The demographic variables included patient ID, age, sex, race, Clinicopathological variables included primary tumor site (site recode [ICD-O-3/WHO 2008], behavior code [ICD-O-3], tumor grade [grade thru 2017], grade pathological [2018+], tumor histology [ICD-O-3 Hist/behave], primary site-labeled, T stage, N stage, bone metastasis, all esophageal cancer patients were staged according the AJCC 7th and 8th edition guidelines and SEER staging information) (Figure 2).
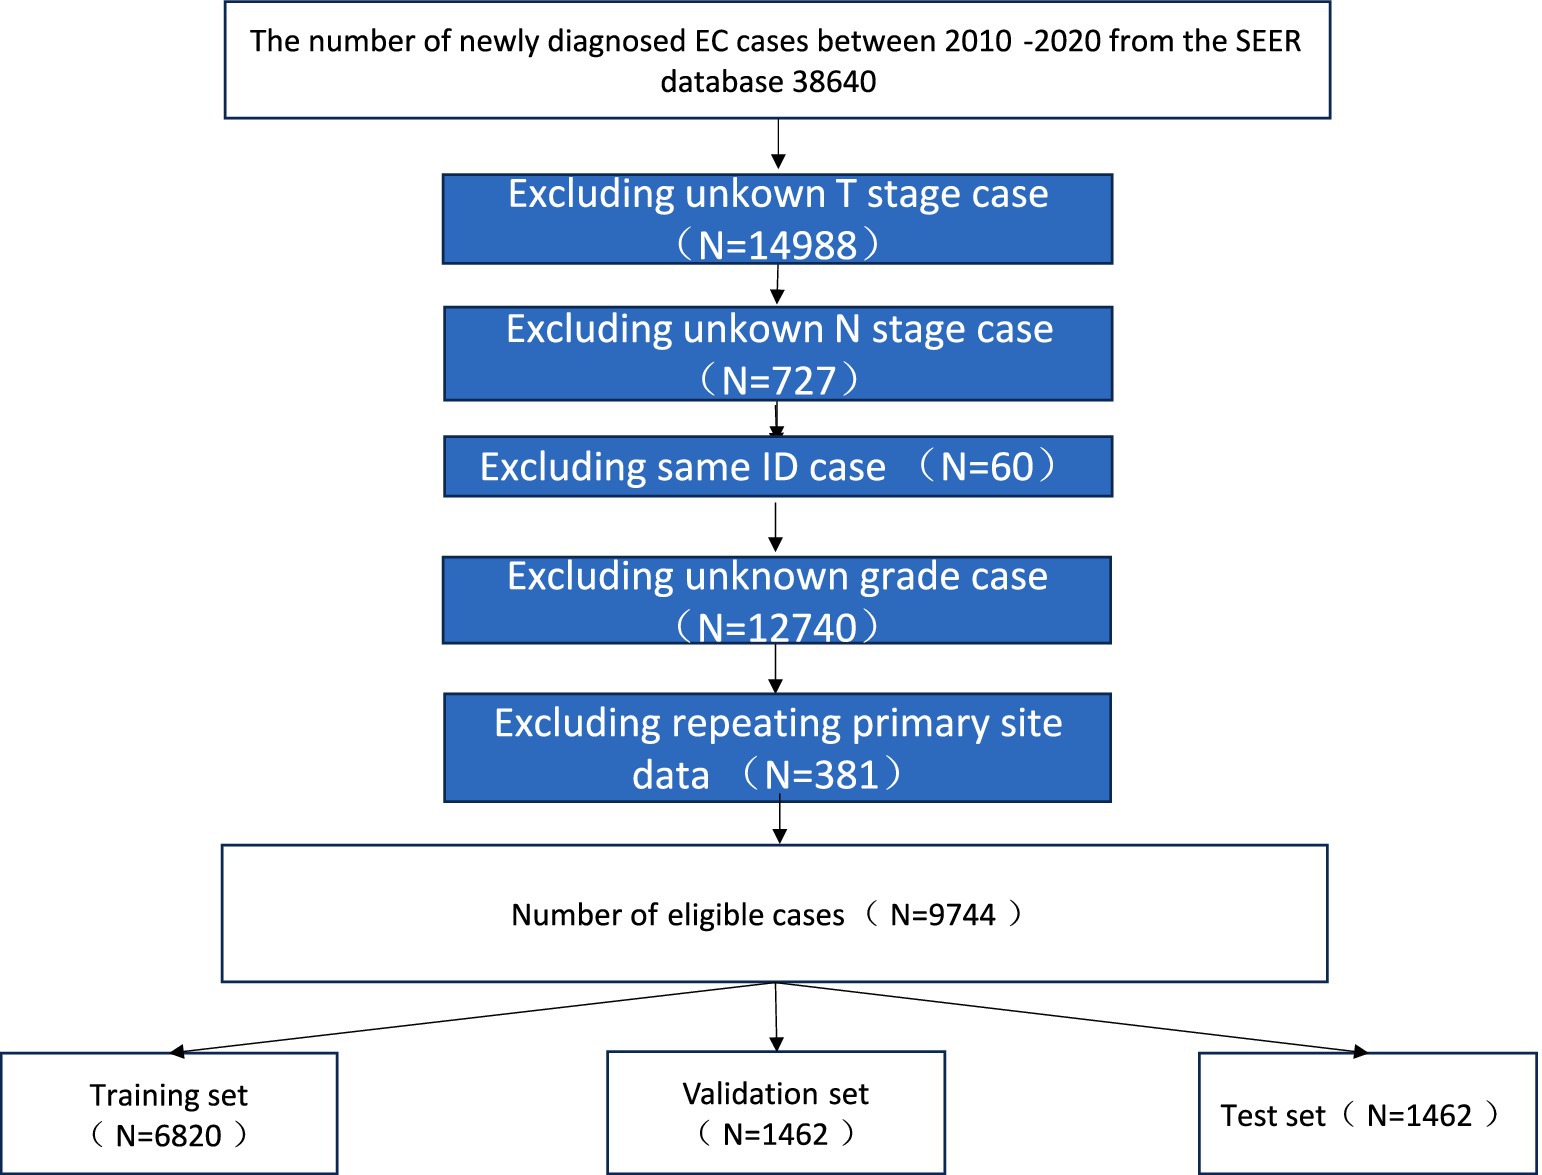
Figure 2. Data collection and clean.
2.3 Analysis of information
Significant variables among EC patients were initially identified through univariate logistic regression analysis (p < 0.05). Variables found to be statistically significant were subsequently included in a multivariate logistic regression analysis. Those that remained significant (p < 0.05) in the multivariate model were selected for further evaluation using machine learning models. Correlation analysis was performed to examine relationships among the selected features. Data preprocessing steps included label encoding to convert categorical text data into numerical format. Given the class imbalance due to the low incidence of bone metastasis (5.47%), the Synthetic Minority Over-sampling Technique (SMOTE) was applied to balance the dataset, resampling the minority class to achieve a 1:1 ratio (original distribution: 94.53% non-metastatic vs. 5.47% metastatic). The final balanced dataset was randomly partitioned into training (70%), validation (15%), and test (15%) subsets. The training set was used to fit the machine learning models, the validation set was employed for hyperparameter tuning and model selection, and the final test set was reserved for unbiased evaluation of predictive performance. To ensure the robustness of our results, model performance metrics such as AUC, precision, recall, and F1-score were calculated independently for each subset and are reported in the Results section.
2.4 The training set was used to develop six machine
Six machine learning models were employed in this study: Support Vector Machine (SVM), Logistic Regression (LR), Extreme Gradient Boosting (XGBoost), K-Nearest Neighbors (KNN), Random Forest (RF), and Neural Networks (NN). SVM is a binary classification algorithm that classifies data points by constructing an optimal hyperplane in a multidimensional space. LR evaluates the relationship between independent variables and the binary outcome variable, estimating the probability of an event based on a logistic function.
Following model implementation, performance was rigorously assessed using six metrics: accuracy, precision, recall, F1 score, AUC, and Brier score. The AUC, derived from the ROC curve, reflects the model’s diagnostic ability to distinguish between classes across various decision thresholds. The Brier score assesses the accuracy of probabilistic predictions and is particularly valuable in scenarios requiring probability-based classification. To further improve model performance, five-fold cross-validation and hyperparameter tuning were employed. GridSearchCV was utilized to systematically search for the optimal hyperparameter tunning, ensuring model optimization. Final model performance was determined by averaging the results across the cross-validation iterations.
2.5 Model interpretability
Interpreting machine learning models in an intuitive and clinical meaningful manner is essential for ensuring their practical applicability. To achieve this, a distribution plot of the target variable was generated to illustrate its original distribution concerning feature variables. Additionally, Partial Dependence Plots (PDPs) were constructed to visualize how individual feature variables influence the target variable and to analyze their impact on model predictions.
To further enhance model interpretability, SHapley Additive exPlanations (SHAP) values were calculated to quantify the contribution of each feature to the model’s predictions. A SHAP summary plot was generated to rank the feature importance and visualize their overall impact across all samples. SHAP dependence plots were used to examine the interaction between individual features and their corresponding SHAP values, providing deeper insights into how specific variables influence the model’s decision-making process.
The reliability of the model was evaluated by comparing the observed trends of the target variable with the predicted trends across different feature variables. This assessment integrated both PDPs and SHAP visualizations to ensure comprehensive and interpretable insights into model behavior.
3 Results
3.1 Analysis of information on EC patients
A total of 9,744 cases with EC were available, including 9,212 (94.53%) cases without bone metastasis and. 532 (5.47%) cases with bone metastasis, Age sex, histology, primary site, T stage, N stage, grade variables were significantly different between the two groups (all p < 0.05) Detailed information is summarized in Table 1.
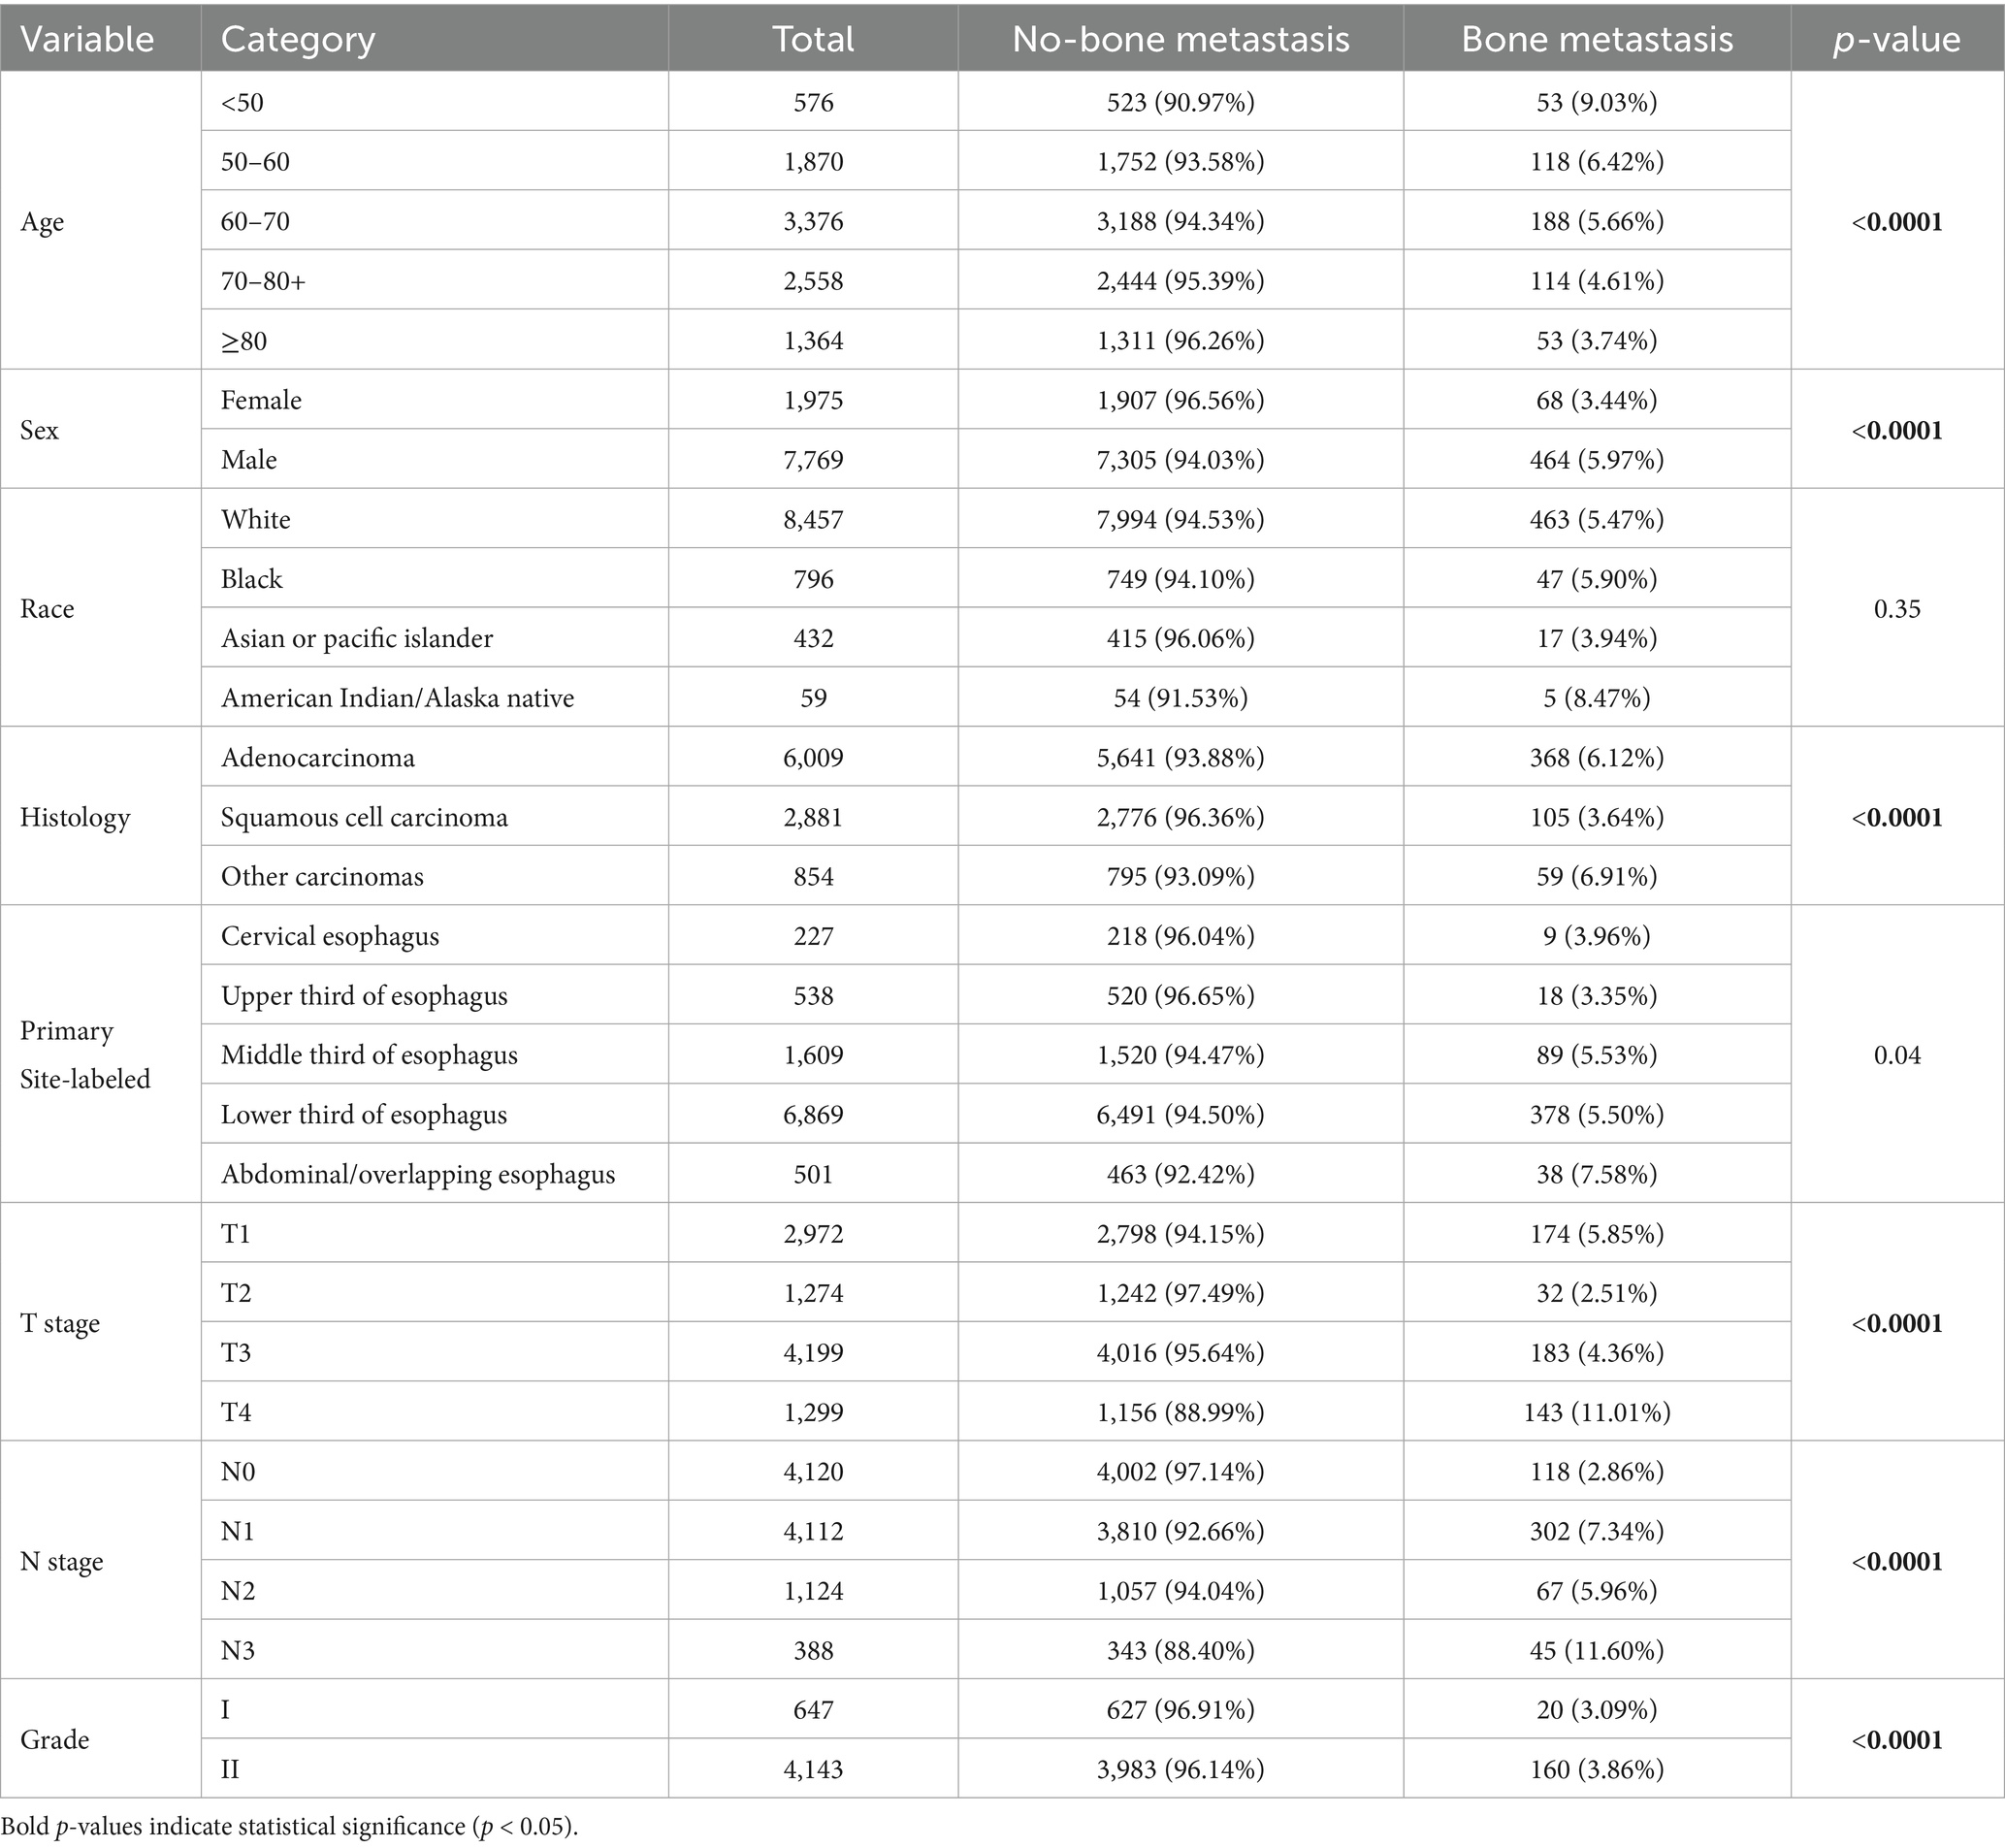
Table 1. The detailed demographic information and pathological characteristics of the patients with EC.
Univariate analysis (Table 2) showed significant differences in the risk of bone metastasis across multiple variables, including age, sex, race, primary tumor site, T stage, N stages, tumor grade, and histology type (p < 0.05). Subsequently, multivariate logistic regression (Table 3) confirmed age, sex, T stage, N stage, and histology as independent prognostic factors for bone metastasis.
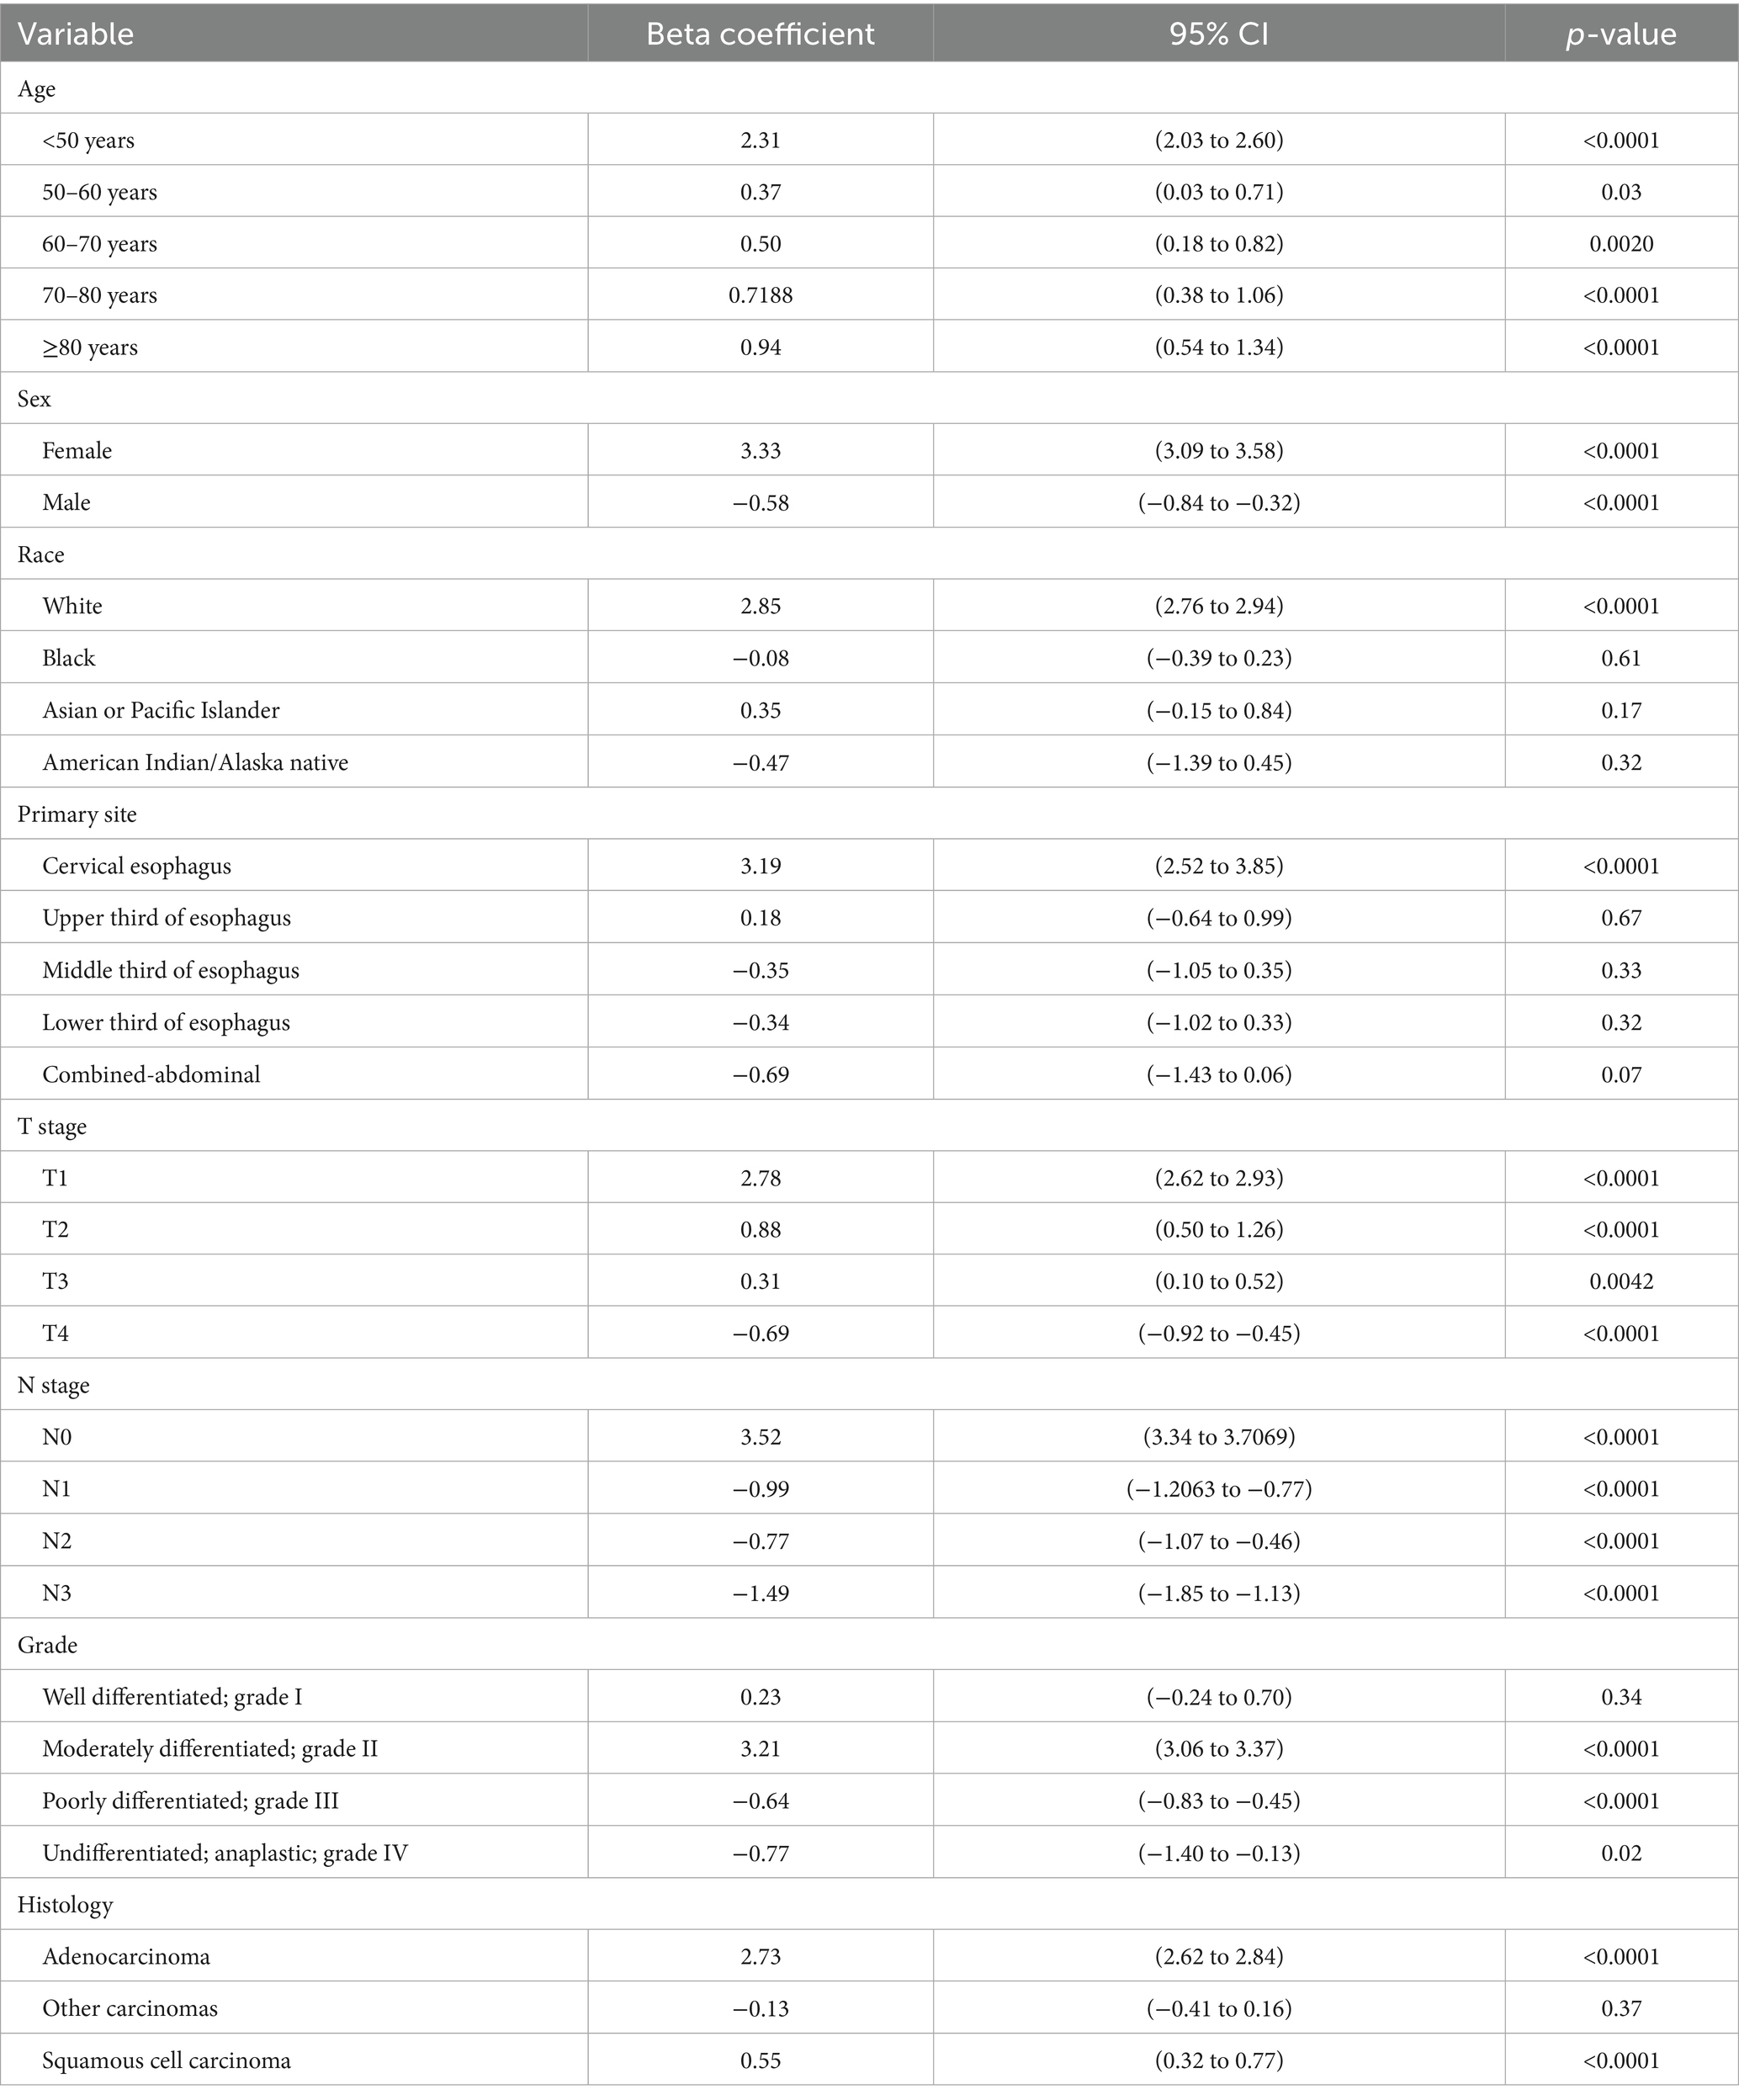
Table 2. Univariate analysis of variables related to bone metastasis.
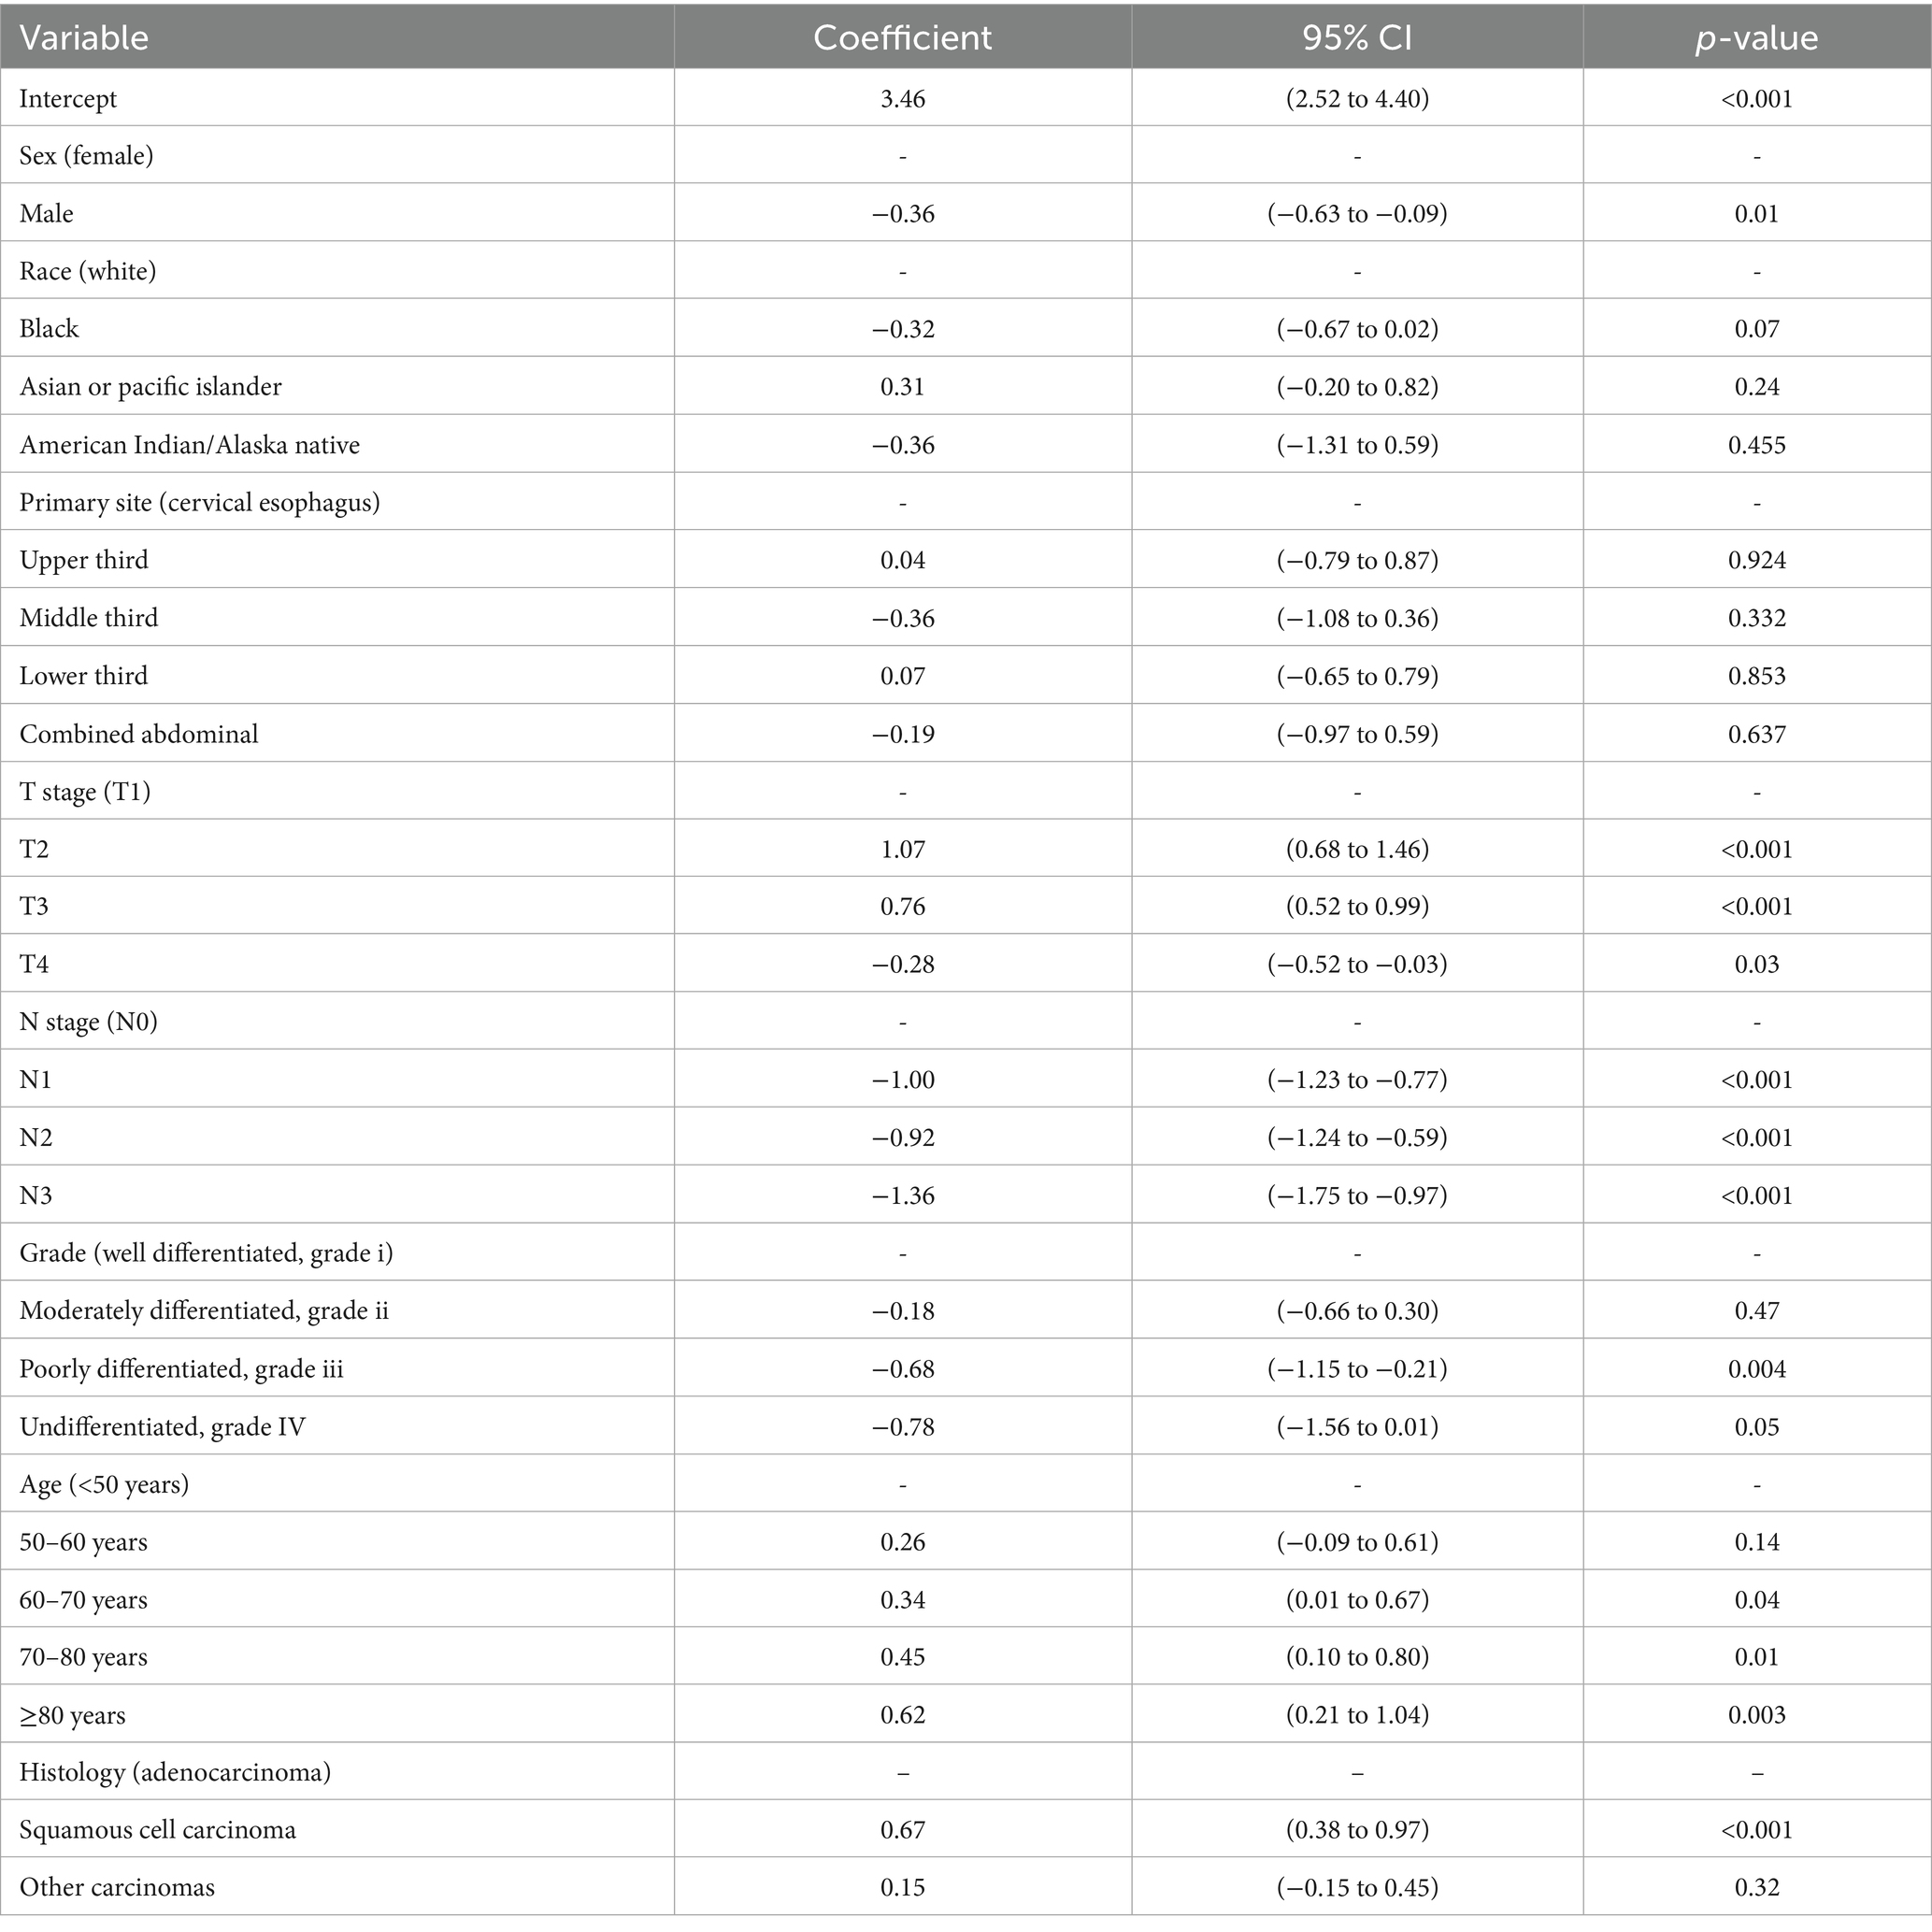
Table 3. Multivariate analysis of variables related to bone metastasis.
3.2 Spearman’s correlation and feature importance
To evaluate the strength of relationships among variables, correlation analysis was conducted. Specifically, Spearman’s rank correlation analysis was employed to evaluate the correlations among the selected features. As shown in Figure 3A, the resulting heatmap demonstrated a lack of strong correlations among the eight analyzed variables, indicating low multicollinearity. Figure 3B presents the feature importance extracted from each machine learning algorithm. Variables identified via univariate and multivariate logistic analyses all played significant roles in predicting the outcomes of the six models. Notably, T stage has consistently been the most influential feature in most prediction models, emphasizing its critical impact on bone metastasis in esophageal cancer. The eight features of the XGBoost model are ranked from high to low importance.
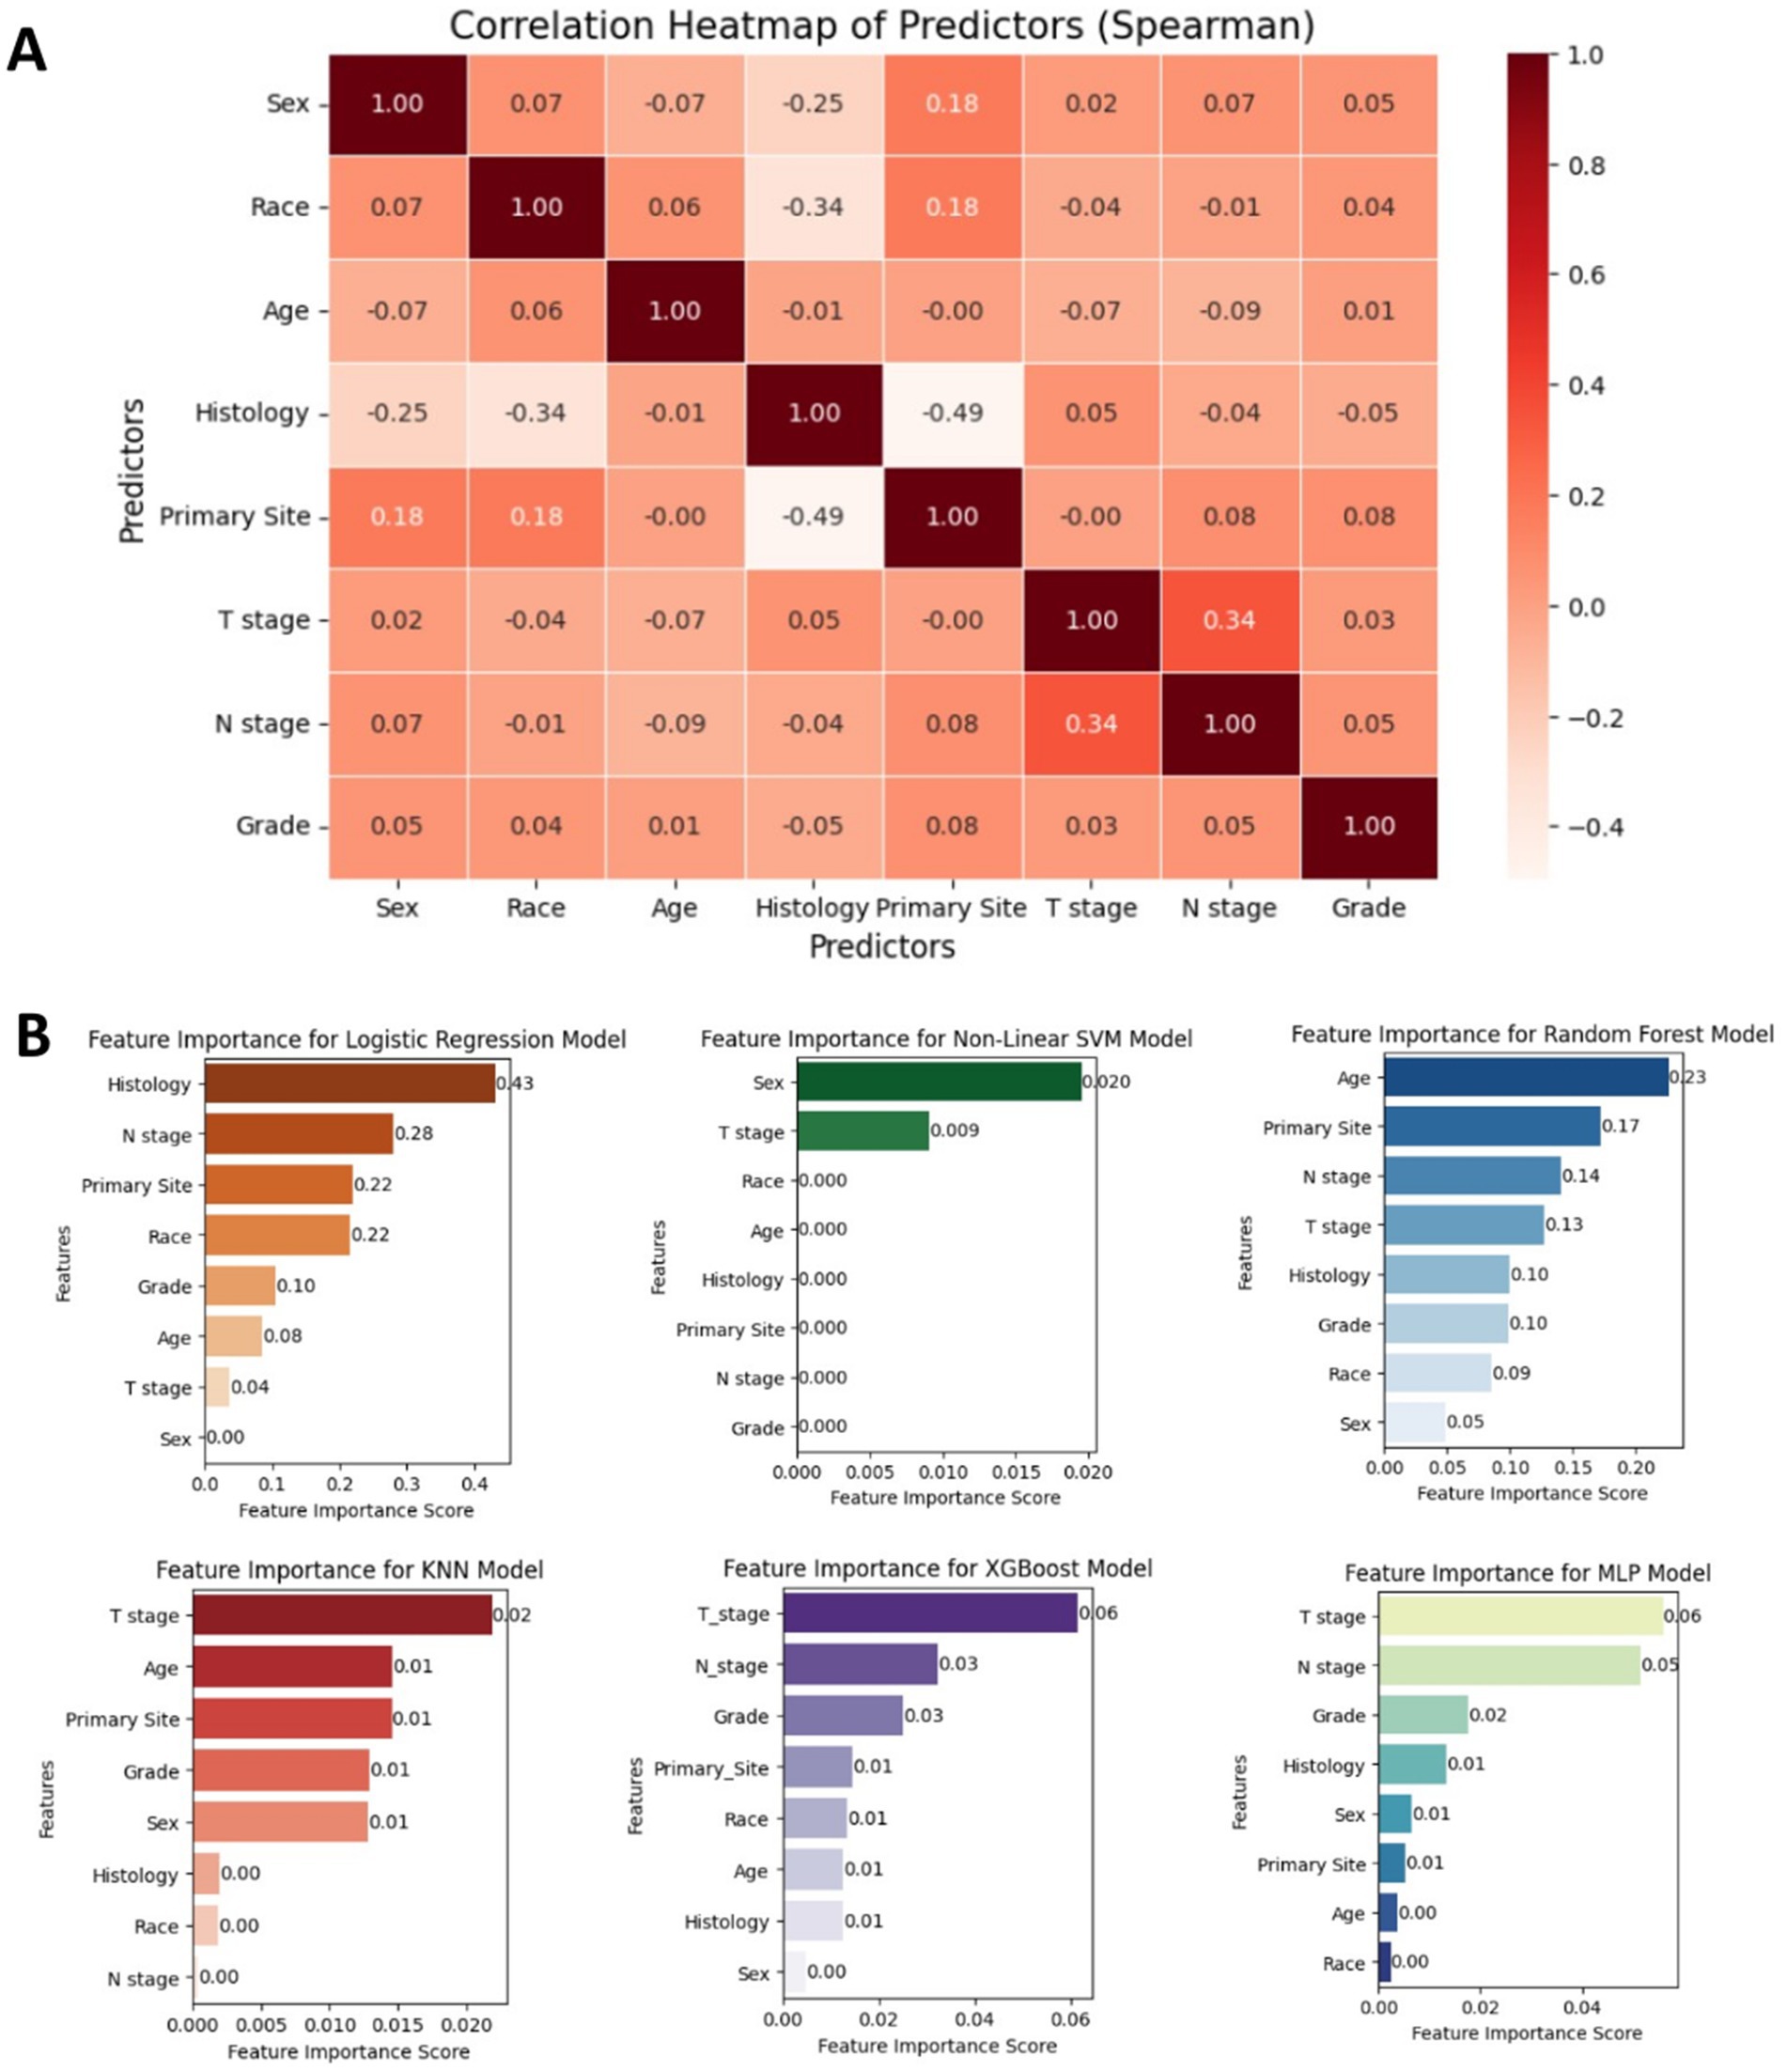
Figure 3. (A) Spearman correlation heatmap displaying the relationships among key clinicopathological variables used in the model, indicating minimal multicollinearity. (B) Bar plot showing the relative importance of each feature across the six machine learning models. T stage and N stage were consistently among the top contributors to model performance.
3.3 Interpretability of the model
Among all models, XGBoost demonstrates the best performance, achieving the highest AUC and sensitivity, along with relatively superior values in other evaluation matrics. Therefore, XGBoost was identified as the optimal predictive model for the current dataset (see Table 4).
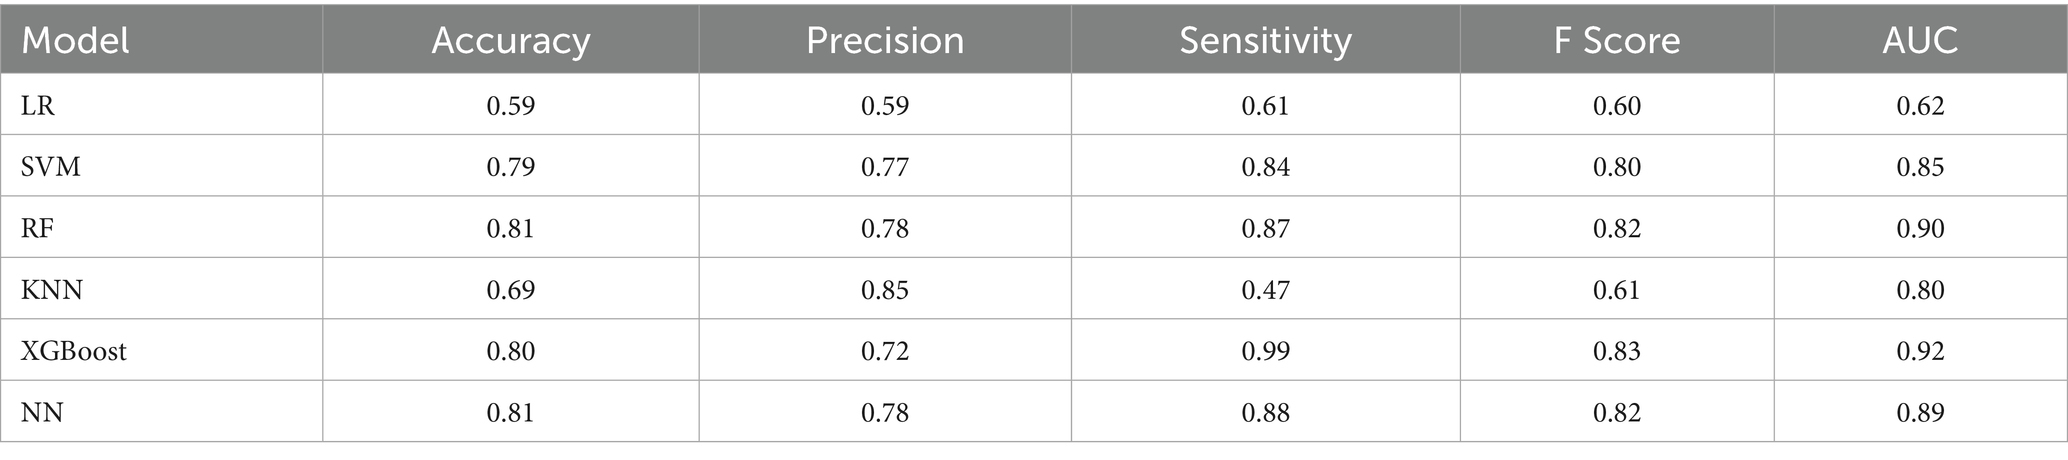
Table 4. Predictive performance of different models.
The performance of the six prediction models is shown in Figures 4A,B, and Table 3. The internal 5-fold cross-validation (Figure 4A) reveals that among models, XGBoost model demonstrates the best performance, with an average AUC of 0.90. The RF model ranks second (AUC = 0.90). The internal test validation results are presented in Table 3 and Figure 4B. Notably, the XGBoost model also achieves the highest AUC score in the internal test validation (AUC = 0.92), with recall and F1 scores of 0.99 and 0.83, respectively. The confusion matrices of the XGBoost model on the training and test sets (Figure 4C) further highlight its high recall. The probability density plot of predictions (Figure 4D) indicates that the AUC reaches its maximum value when the prediction score is set at 0.01.
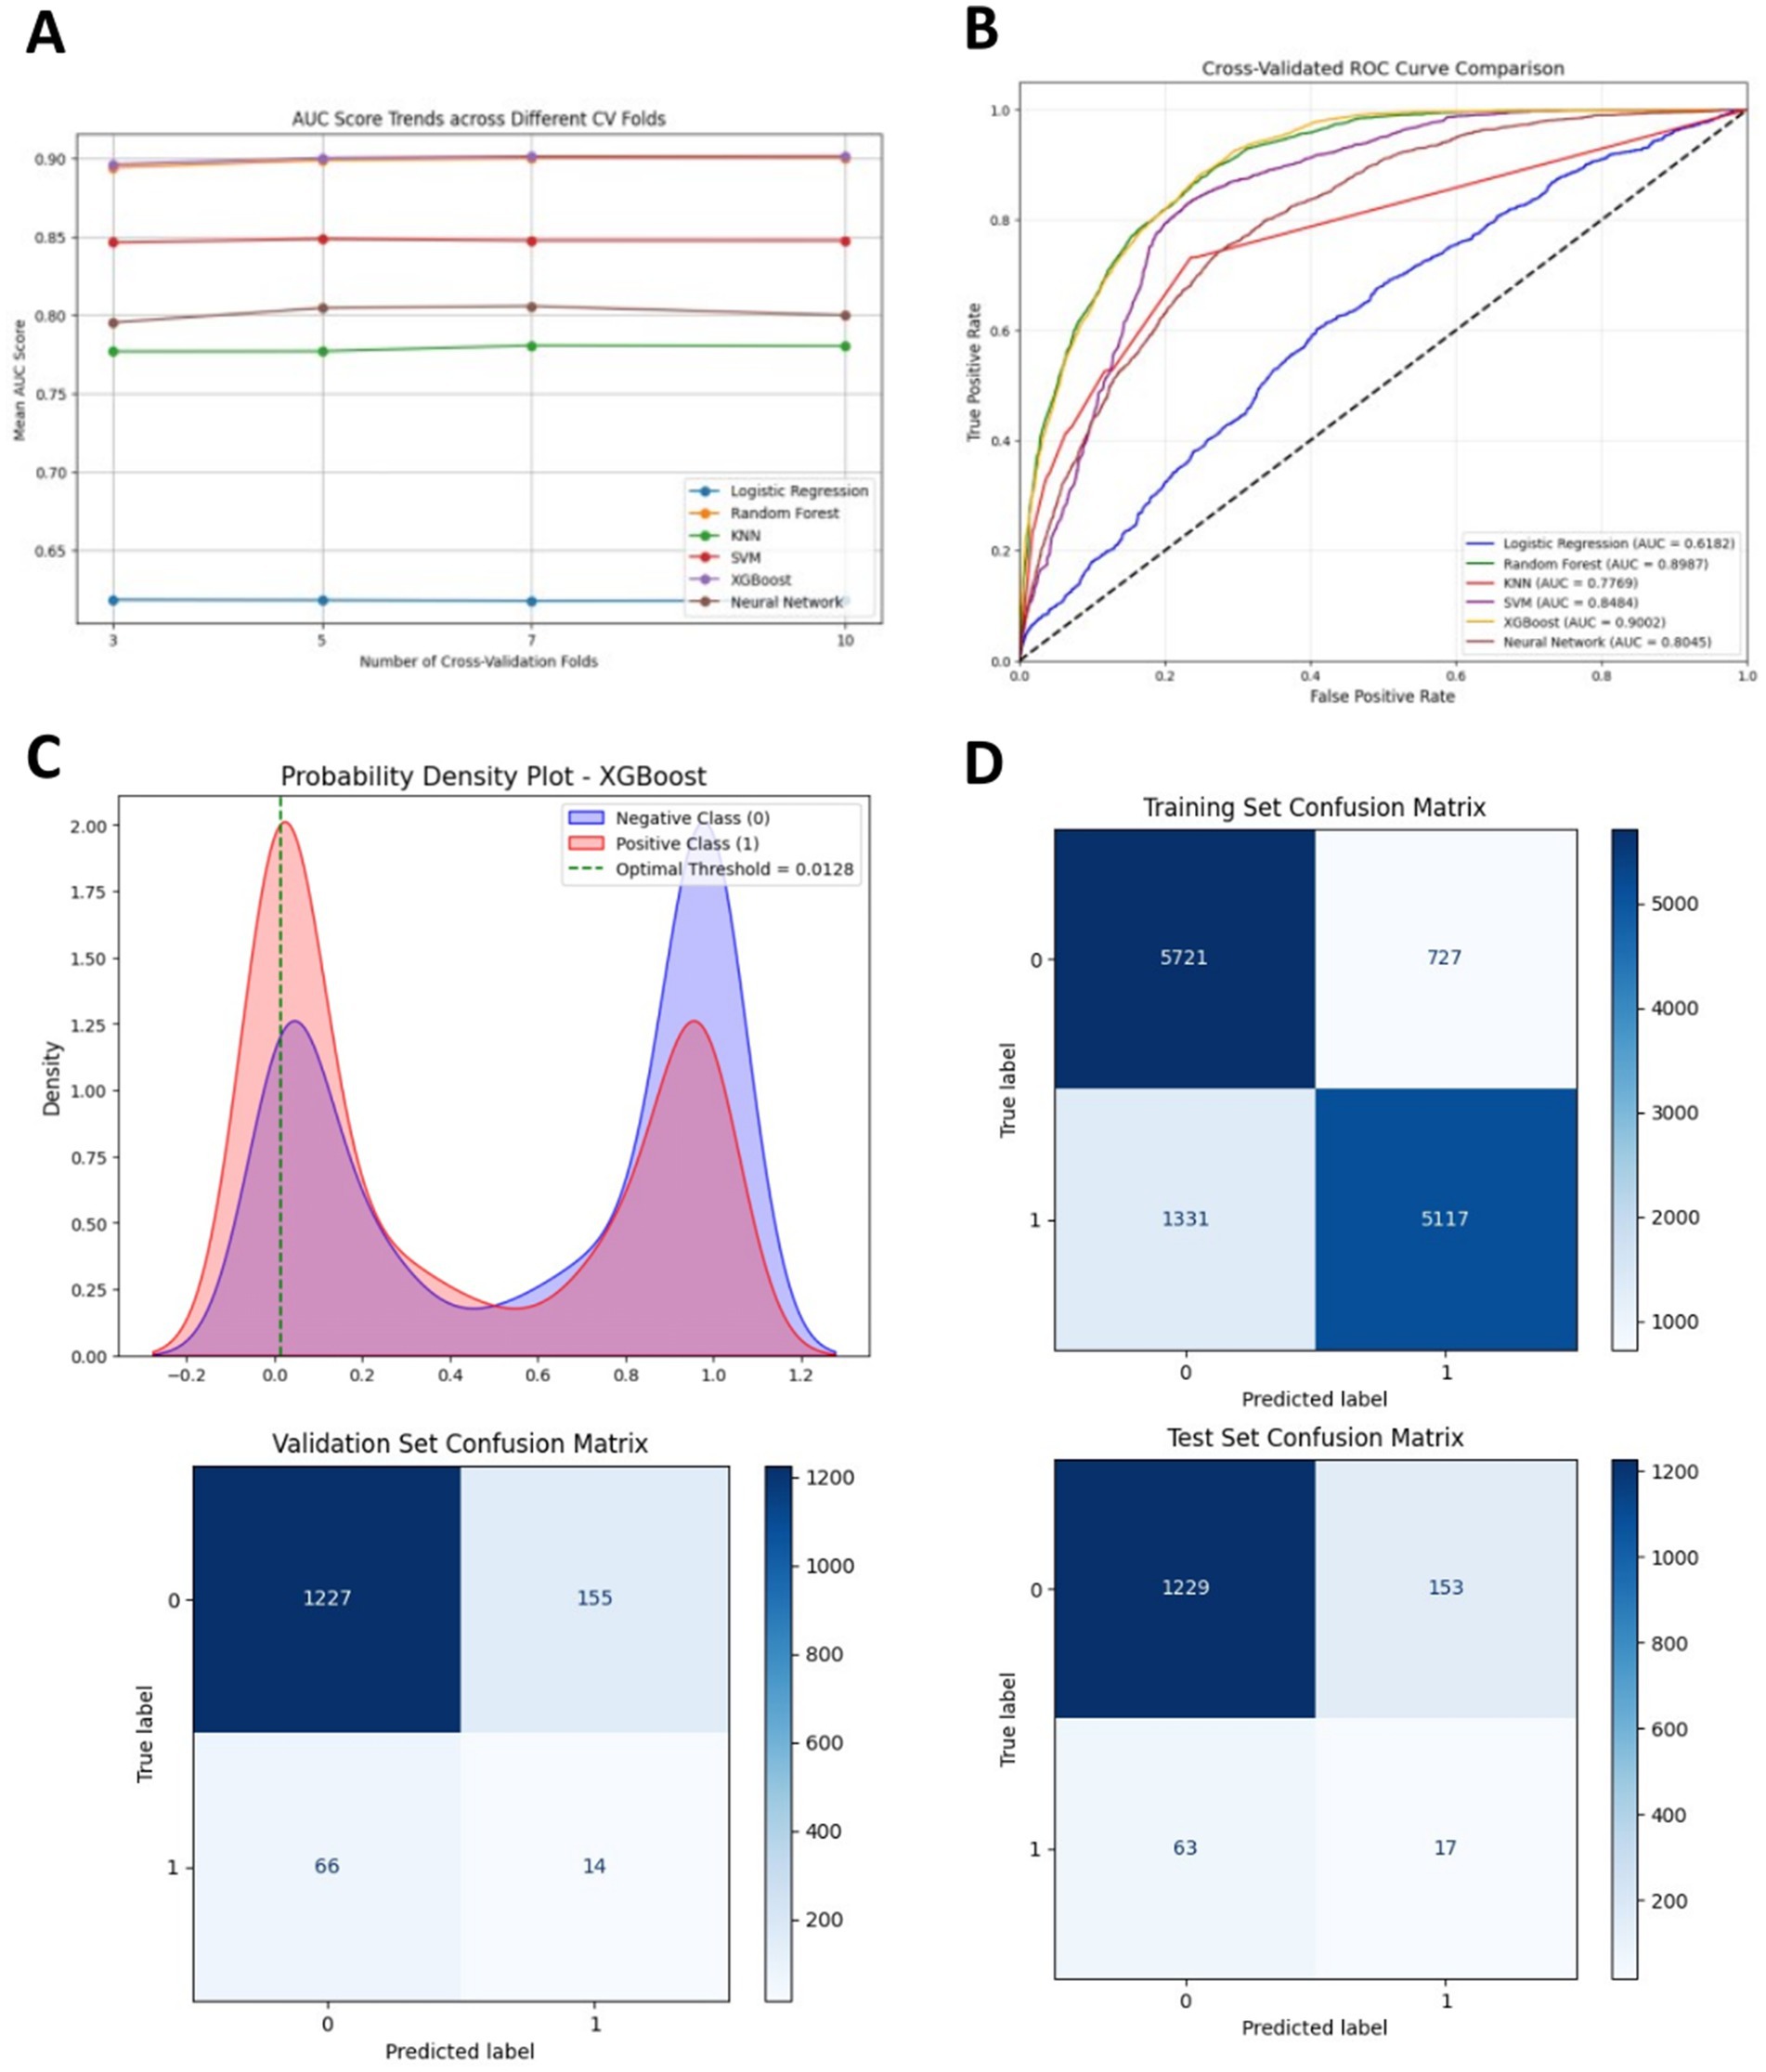
Figure 4. (A) Receiver Operating Characteristic (ROC) curves of different machine learning models in the internal test set. (B) Five-fold cross-validation results of different machine learning models. (C) Probability density plot of the XGBoost model. (D) Confusion matrices of the XGBoost model in the training set and the internal test set. TP represents true positive, TN represents true negative, FP represents false positive, and FN represents false negative.
The SHAP analysis results of the XGBoost model are presented as follows, Feature importance analysis (Figure 5A) showed that among the eight features, Histology (mean SHAP value = 0.61), N stage (0.53), and T stage (0.49) were the top three contributors in terms of mean absolute SHAP values. These findings indicated that Histology type, N stage, and T stage had the most substantial influence on model predictions, underscoring their critical roles in predicting bone metastasis in EC. Individual feature contribution analysis (Figure 5B) revealed distinct patterns: features like N stage and T stage demonstrated clear trends where higher feature values (represented by red dots) positively contributed to the prediction of bone metastasis. In contrast, Sex and Race had minimal impacts, as their SHAP values clustered near zero, indicating negligible contributions to the model’s output. Overall, the SHAP analysis not only quantified the relative importance of clinical features but also provided intuitive visualizations of how each feature affected model predictions, offering a theoretical foundation to support clinical decision-making in the context of bone metastasis in esophageal cancer.
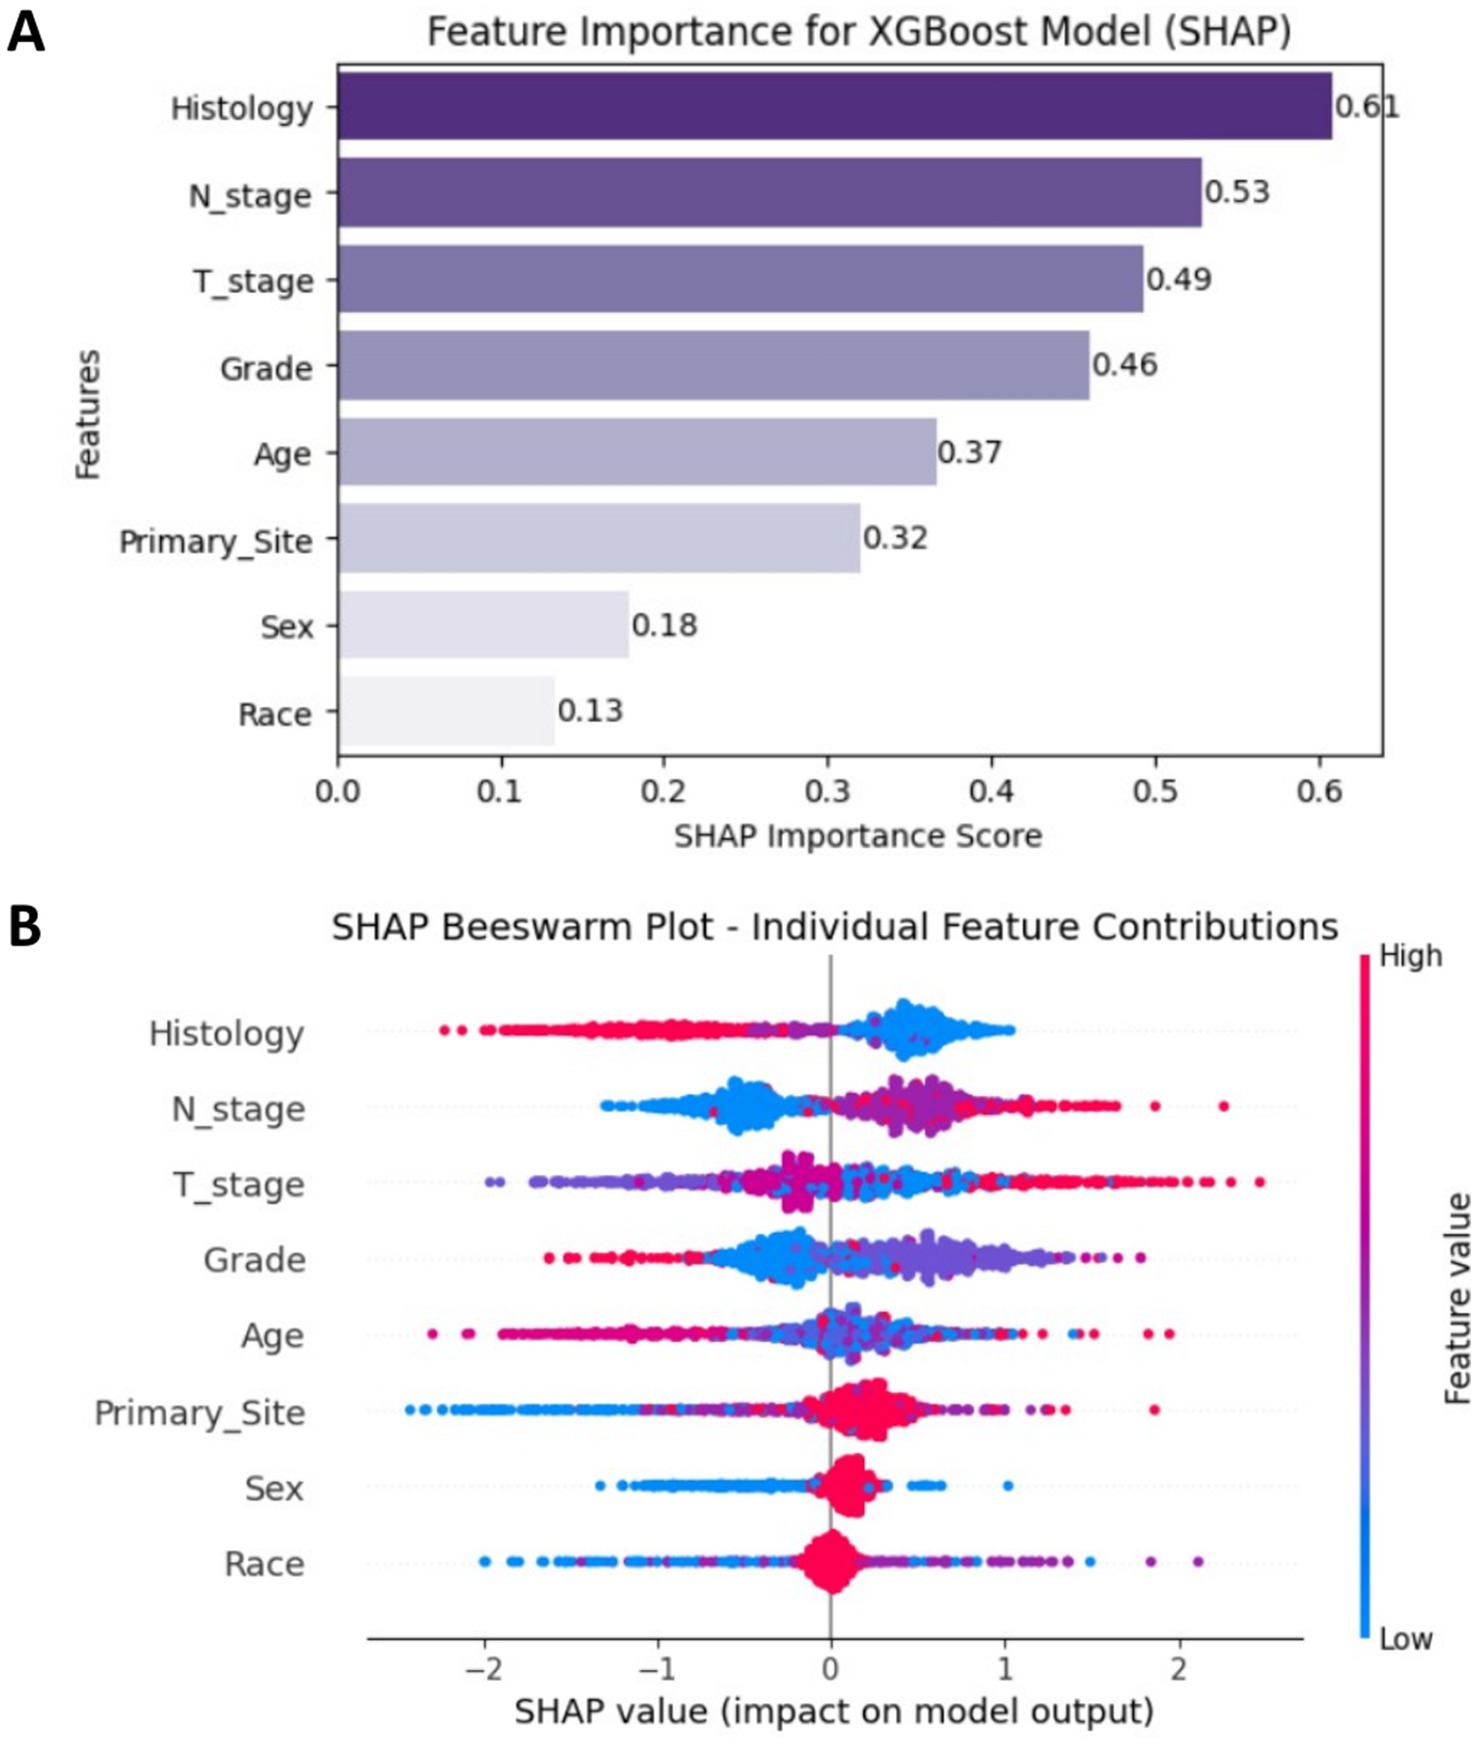
Figure 5. (A) SHAP feature importance plot ranked by mean absolute values. (B) SHAP beeswarm plot showing individual sample contributions.
4 Discussion
Distant metastasis remains the primary cause of treatment failure and mortality in EC (13). Bone metastasis (BM) is the third most common site of distant spread in EC and is associated with significantly worse survival outcomes. Patients with BM have been reported to experience the poorest prognosis among those with metastatic (11). In our study, the incidence of BM among EC patients was 5.4%, which is consistent with previous reports ranging from 5.2 and 7.7%. Given the overall poor prognosis of EC, early identification of high-risk factors and the development of reliable predictive models for BM based on clinical and pathological characteristics are crucial for guiding individualized treatment strategies and improving clinical decision-making.
In our study, 75% of EC patients were over the age of 60. Interestingly, older patients exhibited a lower probability of BM, a finding consistent with the study by Yuan et al. and Qin et al., which identified a higher BM risk in patients aged 51–60 compared to those aged 71–80 (14). This phenomenon may be attributed to capillary sclerosis, which could reduce the likelihood of distant metastasis in older adults (15).
Our study aligns with the findings of Hayam et al. (16), showing that approximately 80% of EC patients are male. In our study, male patients demonstrated a significantly higher incidence of BM than females. This discrepancy may be attributed to behavioral and hormonal differences; men are more likely to smoke and consume alcohol, both of which are established EC risk factors (17). Additionally, male sex hormones have been implicated in promoting EC cell proliferation and metastasis (18), Differences in musculoskeletal health and sex hormone levels may also contribute to these variations (19). Our findings also suggest that metastatic male EC (MEC) patients have a higher incidence of bone-only metastasis compared to metastatic female EC (FEC) patients (17).
Consistent with previous studies, adenocarcinoma (AC) was the predominant histological subtype in our cohort. AC demonstrated a higher tendency for metastasis to the liver, bones, and brain compared to squamous cell carcinoma (SCC) (20). These findings reinforce the notion that EC subtypes exhibit distinct metastatic patterns due to differences in tumor origin, pathogenesis, and anatomical distribution (21). However, in contrast to earlier studies, we did not observe significant differences in lymph node and BM rates between SCC and AC. This discrepancy may be explained by the fact that previous studies primarily included stage IV patients, which could limit the observation of bone metastases (11). While it is widely recognized that advanced T and N stages are associated with an increased risk of bone metastasis, our multivariate analysis unexpectedly revealed that patients with N3-stage disease had a lower risk of developing BM. This paradoxical finding may be explained by the shorter survival time of N3 patients, which may prevent the progression to bone metastasis before death.
With the rapid advancements of artificial intelligence, machine learning (ML) has shown great promise in biomedical applications, including EC diagnosis and prognosis prediction (22–24). Previous studies have primarily focused on predicting liver and lung metastases in EC. To our knowledge, this study is the first to construct an ML-based predictive model for BM in EC using the SEER database, Yuan et al. (14) developed a predictive nomogram for BM in EC patients, reporting AUC values of 0.77 and 0.75 in the training and validation cohorts, respectively. In contrast, our ML model specifically designed for BM prediction and utilized a larger sample size (n = 9,744), thereby improving statistical power and model robustness. The XGBoost algorithm, which has demonstrated high accuracy and ease of use in various studies (25, 26) exhibited superior performance in our study. Our XGBoost model achieved outstanding predictive accuracy (AUC = 0.92, recall = 0.98), surpassing traditional models, same as recent ML-based liver metastasis prediction models (AUC = 0.92) (27). The high recall rate (98%) suggests that our model effectively identifies high-risk BM patients, minimizing the likelihood of missed diagnoses.
Additionally, ML models provide valuable insights into the complex relationships among independent prognostic factors-an aspect often overlooked in conventional statistical analyses. While multivariate logistic regression and Cox regression identified certain risk factors, but some of these variables had negligible SHAP values in feature importance rankings. This discrepancy highlights the advantage of ML, as it eliminates irrelevant features and reduces the risk of overfitting, unlike traditional regression models. Furthermore, ML continuously improves operational efficiency and predictive accuracy through self-learning mechanisms.
Despite the robustness of our findings, several limitations should be acknowledged. Given the ethnic and regional differences in EC incidence-particularly the high prevalence in East Asia-future studies should include large-scale external validation using datasets from Chinese or other East Asian patient populations to enhance the generalizability and applicability of the predictive model.
Despite the relatively low incidence of bone metastasis in esophageal cancer, its profound prognostic implications and association with significant morbidity justify the need for risk stratification tools. We emphasize that the primary goal of our model is not to replace clinical judgment but to provide an adjunctive decision-support mechanism. By identifying high-risk individuals early-especially in cases with atypical or silent presentations-the model has the potential to inform more personalized surveillance strategies, improve resource allocation, and ultimately contribute to better clinical outcomes.
5 Conclusion
In summary, this study presents the first ML-based predictive model for BM in EC using the SEER database, providing a valuable tool for precision oncology. Future research should focus on cross-ethnic validation, multi-modal data integration, and explore translational applications to establish a clinically actionable predictive-to-preventive continuum.
Data availability statement
The original contributions presented in the study are included in the article/supplementary material, further inquiries can be directed to the corresponding author.
Author contributions
LL: Conceptualization, Writing – original draft. WD: Resources, Writing – review & editing. TS: Methodology, Writing – review & editing. SM: Formal analysis, Investigation, Writing – review & editing. HW: Formal analysis, Investigation, Writing – review & editing. JC: Supervision, Writing – review & editing.
Funding
The author(s) declare that no financial support was received for the research and/or publication of this article.
Conflict of interest
The authors declare that the research was conducted in the absence of any commercial or financial relationships that could be construed as a potential conflict of interest.
Generative AI statement
The author(s) declare that no Gen AI was used in the creation of this manuscript.
Publisher’s note
All claims expressed in this article are solely those of the authors and do not necessarily represent those of their affiliated organizations, or those of the publisher, the editors and the reviewers. Any product that may be evaluated in this article, or claim that may be made by its manufacturer, is not guaranteed or endorsed by the publisher.
Footnotes
References
1. Sung, H, Ferlay, J, Siegel, RL, Laversanne, M, Soerjomataram, I, Jemal, A, et al. Global cancer statistics 2020: GLOBOCAN estimates of incidence and mortality worldwide for 36 cancers in 185 countries. CA Cancer J Clin. (2021) 71:209–49. doi: 10.3322/caac.21660
2. Thein, HH, Jembere, N, Thavorn, K, Chan, KKW, Coyte, PC, de Oliveira, C, et al. Estimates and predictors of health care costs of esophageal adenocarcinoma: a population-based cohort study. BMC Cancer. (2018) 18:694. doi: 10.1186/s12885-018-4620-2
3. Smyth, EC, Lagergren, J, Fitzgerald, RC, Lordick, F, Shah, MA, Lagergren, P, et al. Oesophageal cancer. Nat Rev Dis Primers. (2017) 3:17048. doi: 10.1038/nrdp.2017.48
4. Eisner, DC. Esophageal cancer: treatment advances and need for screening. JAAPA. (2024) 37:19–24. doi: 10.1097/01.JAA.0001007328.84376.da
5. Batra, R, Malhotra, GK, Singh, S, and Are, C. Managing squamous cell esophageal Cancer. Surg Clin North Am. (2019) 99:529–41. doi: 10.1016/j.suc.2019.02.006
6. Zhao, YX, Zhao, HP, Zhao, MY, Yu, Y, Qi, X, Wang, JH, et al. Latest insights into the global epidemiological features, screening, early diagnosis and prognosis prediction of esophageal squamous cell carcinoma. World J Gastroenterol. (2024) 30:2638–56. doi: 10.3748/wjg.v30.i20.2638
7. Falk, GW. Risk factors for esophageal cancer development. Surg Oncol Clin N Am. (2009) 18:469–85. doi: 10.1016/j.soc.2009.03.005
8. Lander, S, Lander, E, and Gibson, MK. Esophageal Cancer: overview, risk factors, and reasons for the rise. Curr Gastroenterol Rep. (2023) 25:275–9. doi: 10.1007/s11894-023-00899-0
9. Tougeron, D, Richer, JP, and Silvain, C. Management of esophageal adenocarcinoma. J Vasc Surg. (2011) 148:e161–70. doi: 10.1016/j.jviscsurg.2011.05.008
10. Wu, SG, Xie, WH, Zhang, ZQ, Sun, JY, Li, FY, Lin, HX, et al. Surgery combined with radiotherapy improved survival in metastatic esophageal Cancer in a surveillance epidemiology and end results population-based study. Sci Rep. (2016) 6:28280. doi: 10.1038/srep28280
11. Wu, SG, Zhang, WW, Sun, JY, Li, FY, Lin, Q, and He, ZY. Patterns of distant metastasis between histological types in esophageal Cancer. Front Oncol. (2018) 8:302. doi: 10.3389/fonc.2018.00302
12. Varlamova, EV, Butakova, MA, Semyonova, VV, Soldatov, SA, Poltavskiy, AV, Kit, OI, et al. Machine learning meets cancer. Cancers (Basel). (2024) 16:1100. doi: 10.3390/cancers16061100
13. Tustumi, F, Takeda, FR, Kimura, CM, Sallum, RA, Ribeiro, U, and Cecconello, I. Esophageal carcinoma: is squamous cell carcinoma different disease compared to adenocarcinoma? A transversal study in a quaternary high volume hospital in Brazil. Arq Gastroenterol. (2016) 53:44–8. doi: 10.1590/S0004-28032016000100009
14. Yuan, B, Lu, H, Hu, D, Xu, K, and Xiao, S. Predictive models for the risk and prognosis of bone metastasis in patients with newly-diagnosed esophageal cancer: a retrospective cohort study. Front Surg. (2022) 9:1014781. doi: 10.3389/fsurg.2022.1014781
15. De Vita, F, Di Martino, N, Orditura, M, Cosenza, A, Galizia, G, Del Genio, A, et al. Preoperative chemoradiotherapy for squamous cell carcinoma and adenocarcinoma of the esophagus: a phase II study. Chest. (2002) 122:1302–8. doi: 10.1378/chest.122.4.1302
16. Ghazy, HF, El-Hadaad, HA, Wahba, HA, Abbas, R, and Abbas, OA. Metastatic esophageal carcinoma: prognostic factors and survival. J Gastrointest Cancer. (2022) 53:446–50. doi: 10.1007/s12029-021-00610-4
17. Zhang, J, Ma, W, Wu, H, Wang, J, Lin, Y, Wang, X, et al. Analysis of homogeneous and heterogeneous factors for bone metastasis in esophageal Cancer. Med Sci Monit. (2019) 25:9416–25. doi: 10.12659/MSM.920483
18. Busby, J, Karasneh, R, Murchie, P, McMenamin, Ú, Gadalla, SM, Camargo, MC, et al. The role of 5α-reductase inhibitors in gastro-oesophageal cancer risk: a nested case-control study. Pharmacoepidemiol Drug Saf. (2020) 29:48–56. doi: 10.1002/pds.4909
19. Wiren, KM, Zhang, XW, Olson, DA, Turner, RT, and Iwaniec, UT. Androgen prevents hypogonadal bone loss via inhibition of resorption mediated by mature osteoblasts/osteocytes. Bone. (2012) 51:835–46. doi: 10.1016/j.bone.2012.08.111
20. Ai, D, Zhu, H, Ren, W, Chen, Y, Liu, Q, Deng, J, et al. Patterns of distant organ metastases in esophageal cancer: a population-based study. J Thorac Dis. (2017) 9:3023–30. doi: 10.21037/jtd.2017.08.72
21. Arnold, M, Soerjomataram, I, Ferlay, J, and Forman, D. Global incidence of oesophageal cancer by histological subtype in 2012. Gut. (2015) 64:381–7. doi: 10.1136/gutjnl-2014-308124
22. Hosseini, F, Asadi, F, Emami, H, and Harari, RE. Machine learning applications for early detection of esophageal cancer: a systematic review. BMC Med Inform Decis Mak. (2023) 23:124. doi: 10.1186/s12911-023-02235-y
23. Goecks, J, Jalili, V, Heiser, LM, and Gray, JW. How machine learning will transform biomedicine. Cell. (2020) 181:92–101. doi: 10.1016/j.cell.2020.03.022
24. Hofer, IS, Burns, M, Kendale, S, and Wanderer, JP. Realistically integrating machine learning into clinical practice: a road map of opportunities, challenges, and a potential future. Anesth Analg. (2020) 130:1115–8. doi: 10.1213/ANE.0000000000004575
25. Bolourani, S, Brenner, M, Wang, P, McGinn, T, Hirsch, JS, Barnaby, D, et al. A machine learning prediction model of respiratory failure within 48 hours of patient admission for COVID-19: model development and validation. J Med Internet Res. (2021) 23:e24246. doi: 10.2196/24246
26. Guan, X, Zhang, B, Fu, M, Li, M, Yuan, X, Zhu, Y, et al. Clinical and inflammatory features based machine learning model for fatal risk prediction of hospitalized COVID-19 patients: results from a retrospective cohort study. Ann Med. (2021) 53:257–66. doi: 10.1080/07853890.2020.1868564
Keywords: esophageal cancer, bone metastasis, machine learning, XGBoost, prediction model
Citation: Liu L, Duan W, She T, Ma S, Wang H and Chen J (2025) Machine learning-enabled prediction of bone metastasis in esophageal cancer. Front. Med. 12:1620687. doi: 10.3389/fmed.2025.1620687
Edited by:
Udhaya Kumar, Baylor College of Medicine, United StatesReviewed by:
Kangping Yang, Second Affiliated Hospital of Nanchang University, ChinaOrlando Téllez Almenares, Saturnino Lora Hospital, Cuba
Chandra Sekar Ponnusamy, Rathinam College of Arts and Science, India
Copyright © 2025 Liu, Duan, She, Ma, Wang and Chen. This is an open-access article distributed under the terms of the Creative Commons Attribution License (CC BY). The use, distribution or reproduction in other forums is permitted, provided the original author(s) and the copyright owner(s) are credited and that the original publication in this journal is cited, in accordance with accepted academic practice. No use, distribution or reproduction is permitted which does not comply with these terms.
*Correspondence: Jiakuan Chen, Y2hlbmprY2hlc3RAMTYzLmNvbQ==