

 Alfred Schmiedl1
- 1 Division of Biochemistry, Department Biology, Friedrich-Alexander-Universität Erlangen-Nuremberg, Erlangen, Germany
- 2 Biochemistry and Plant Physiology (Botany), Department Biology I, Ludwig-Maximilians-Universität München, Planegg-Martinsried, Germany
Metabolic profiles and fingerprints of Arabidopsis thaliana plants with various defects in plastidic sugar metabolism or photosynthesis were analyzed to elucidate if the genetic mutations can be traced by comparing their metabolic status. Using a platform of chromatographic and spectrometric tools data from untargeted full MS scans as well as from selected metabolites including major carbohydrates, phosphorylated intermediates, carboxylates, free amino acids, major antioxidants, and plastidic pigments were evaluated. Our key observations are that by multivariate statistical analysis each mutant can be separated by a unique metabolic signature. Closely related mutants come close. Thus metabolic profiles of sugar mutants are different but more similar than those of photosynthesis mutants. All mutants show pleiotropic responses mirrored in their metabolic status. These pleiotropic responses are typical and can be used for separating and grouping of the mutants. Our findings show that metabolite fingerprints can be taken to classify mutants and hence may be used to sort genes into functional groups.
Introduction
Approximately 30% of the genes of the model organism Arabidopsis thaliana have unknown functions and only 22% are experimentally characterized according to the October 2011 TAIR statistics (Brown et al., 2005; Clare et al., 2006; Swarbreck et al., 2008). Even in the best-studied organism E. coli it is unclear what 40% of the genes are doing (Tohsato et al., 2010). Such deficiencies along with the perspective of the rapidly increasing number of sequenced genomes underline the need to assign functions to unknown genes. Strategies for their exploration range from structural biology providing crystal structures vital to explain how, e.g., the ubiquitin ligase (Pickart, 2001) works, to the field of functional bioinformatics exploiting accumulated database knowledge such as sequence motifs, similarities of genes, expression data, predicted secondary structures, or structural classifications of proteins (King et al., 2004). A major part however is studied by screening forward and reverse genetic mutants. In recent years metabolomics came into focus contributing information about small biochemical molecules to solve the puzzle of functional genomics. Driven by advances in mass spectrometry and computational biology in particular metabolite profiling and fingerprinting became powerful tools complementing insights derived from genome, transcriptome, and proteome with data of metabolite content (Fiehn, 2002; Hall et al., 2002; Bino et al., 2004). Applications are exemplified in a number of ground-breaking publications focused on aspects of method development and to a growing extend on assessing functional genomics (Fiehn et al., 2000; Roessner et al., 2001, 2006; Bolling and Fiehn, 2005; Sekiguchi et al., 2005; Bijlsma et al., 2006; Messerli et al., 2007; Winder et al., 2008; Tohge and Fernie, 2010). The forward strategy of profiling genetic mutants in the context of biochemical pathways however harbors the risk that pleiotropic effects mask primary events. Using conditional mutants may circumvent these effects. However their construction is mostly tricky and may require time-consuming measurements. We therefore asked with this work if primary events from metabolic profiles can be defined revealing a metabolic signature in spite of secondary changes. This should be possible if these changes are recognized as such. A primary effect might be visible as an accumulation or drop of metabolites generated directly by a defective enzyme and in tight relation to its position in a pathway. Secondary effects instead involve changes of multiple phenotypic traits, e.g., as growth or stress response (Williams, 1957). Here one has to consider that mutations outside metabolic pathways might generate pleiotropic effects when analyzed on the basis of changes in metabolism.
As a model system we selected available Arabidopsis mutants with various plastidic defects known to effect sugar metabolism or photosynthesis (Figure 1). We generated metabolite profiles and fingerprints from leaf material applying the methodology recently developed in our laboratory (Kogel et al., 2010). Here extractions and measurements, e.g., by LC-diode array detection or with soft ionization by IC-ESI/MS/MS are adapted to individual metabolite groups to ensure optimal recovery and detection rates. We show that with statistical analysis similar metabolic patterns can be detected sorting the candidates into several functional groups. With the targeted analysis of 74 metabolites we found that their content reflected the phenotypes and could be related to the affected pathway. Accordingly mutations with minor effects on plant growth displayed less distinct metabolic changes.
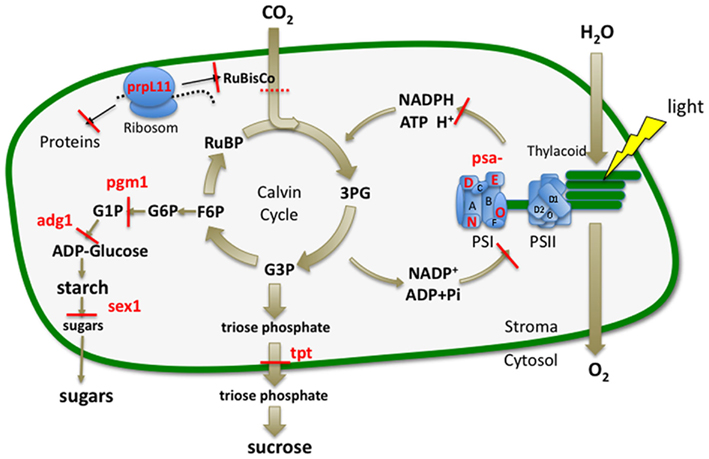
Figure 1. Plastidic sugar and photosynthetic pathways. Blocked plastidic pathways and genes of Arabidopsis mutants for relevant sugar and photosynthetic reactions are given by a red line or labeled in red. The indirect block generated by the prpL11 mutation is indicated by a punctured red line. Photosystems (PSI, PSII). Phosphoglucomutase (pgm1); ADP-glucose pyrophosphorylase (adg1); starch-related alpha-glucan/water dikinase (sex1); plastidic triosephosphate/phosphate translocator (tpt1); defective in photosynthesis complex I (psa) subunits D1-E: psaD1, psaO, psaN, psaE2; defective in plastidic ribosomal protein L 11 (prpL11).
For mutants strongly retarded in growth dramatic secondary effects such as the accumulation of stress indicative metabolites or changes of leaf pigment composition along with remarkable primary effects were detected. An alignment of all changes revealed similarities and differences between the candidates and enabled the recognition of metabolic signatures for the functional groups.
These results suggest that our approach of metabolite profiling is suitable to detect similarities between different mutants that allows their grouping into functional categories.
Materials and Methods
Plant Lines
Mutants were established in the Arabidopsis (A. thaliana) ecotype Columbia (Col0) background whereas psaE2 was in ecotype Wassilewskija (Ws). Arabidopsis lines: controls Col0, Ws, mutant lines defective in starch synthesis: pgm1 (phosphoglucomutase1; Lin et al., 1988); adg1 (ADP-glucose pyrophosphorylase; Caspar et al., 1985); defective in starch utilization: sex1 (starch-related alpha-glucan/water dikinase; Yu et al., 2001), defective in triosephosphate export: tpt1 (plastidic triosephosphate/phosphate translocator; Schneider et al., 2002); defective in photosynthesis complex I (PSI): psaE2 (Ihnatowicz et al., 2007); PsaD1 (Ihnatowicz et al., 2004); psa0 (Leister, 2003); psaN (Leister, 2003); defective in plastidic ribosomal protein L 11: prpl11 (Pesaresi et al., 2001).
Cultivation and Harvest
Seeds of Arabidopsis mutants were obtained from the Nottingham Arabidopsis Stock Centre (NASC, Nottingham, UK), and all of the mutant plants were identified by polymerase chain reaction (PCR) and confirmed by reverse transcription (RT). Plants were cultivated in growth chambers under short day conditions with a diurnal cycle of 8 h light/16 h darkness at 22°C under 120 μmol m−2 s−1 of illumination. Leaves of four biological replicates were harvested 4 weeks after sawing and 4 h after onset of light and immediately frozen into liquid nitrogen.
Metabolome Profiling (Targeted Analysis) and Metabolite Fingerprinting (Untargeted)
Metabolome analysis was conducted from 50 to 100 mg samples of shock-frozen Arabidopsis leaf tissue for four biological replicates as described previously (Kogel et al., 2010).
In brief, for the targeted analysis of sugars and free amino acids samples were extracted in 80% ethanol. Enzymatic assays for sugars were performed using a microtiter plate reader (BioTek, Bad Friedrichshall, Germany). Amino acid contents were determined after derivatization using the fluorophore 6-aminoquinolyl-N-hydroxysuccinimidyl carbamate (AQC; Cohen and Michaud, 1993) and a reversed phase HPLC-separation Dionex Summit HPLC-system and fluorescence detector. Thiol-compounds (glutathione, γ-glutamylcysteine, and cysteine) were extracted with 0.1 M hydrochloric acid (HCl). To assay total thiol-compounds aliquots of the extract were reduced with 10 mM DTT and then derivatized with monobromobimane. For the measurement of oxidized compounds, the thiol-groups of the reduced forms were blocked with NEM prior to the above procedure. Derivatized thiol-compounds were subsequently separated with the HPLC-system described above. Tocopherols (δ, γ, and α) were extracted with 100% methanol and separated isocratically with the HPLC-system described above. Total and reduced ascorbate contents were determined spectrophotometrically by measuring 2,2′-dipyridyl/FeCl2-complexes generated after extraction of samples with 5% 5-sulfosalicylic acid and reduction of FeCl3 by ascorbate. For total ascorbate assays aliquots of the extracts were first reduced by dithiothreitol (DTT) and remaining sulfhydryl groups were then blocked with N-ethylmaleimide (NEM) prior to the above procedure. For the measurement of leaf pigments 50 mg frozen powder was extracted with 400 μl methanol. During the following steps, samples were shielded from light and kept on ice. After incubation for 5 min at 4°C, 400 μl 50 mM Tris/HCl pH 8.0/1 M NaCl were added, and the mixture was incubated for 5 min before addition of 800 μl chloroform for extraction of the carotenoids from the methanol phase. Samples were inverted for 5 min, incubated for 10 min, and then centrifuged at 13,000 rpm for 5 min to achieve phase separation. Extraction with chloroform was repeated with 400 μl chloroform, and the lower phases were pooled and vacuum dried in a speed-vac. For reverse-phase chromatography, extracts were dissolved in 200 μl eluent B, and 20 μl aliquots were resolved on a HPLC-System (Dionex, Idstein. GE) consisting of an Acclaim PA C16 column (id. 4.6 mm, length 150 mm, particle size 5 μm) on an Ultimate 3000 HPLC connected to an ICS 2600 photodiode array detector. A trimeric gradient using eluent A (water), eluent B (methanol:acetonitrile:isopropanol:water, 73:20:5:2), and eluent C (methanol:ethylacetate, 68:32) was applied. The profile was 0–13 min 96%B, 13–17 min 100%C, 17–30 min 100%C, 30–32 min 96%B, and 32–40 min 96%B over 40 min with a flow rate of 0.5 ml/min and temperatures of 4°C for the autosampler and 24°C for the column oven. Pigments were detected and quantified mainly based on their absorption at 450 nm, or on standard curves with pure substances (Sigma-Aldrich, Munich, GE, CaroteNature, Lupsingen, CH). Identification was achieved according to the retention time and to specific 3D spectra between 300 and 700 nm. Phosphorylated intermediates and carboxylates were extracted with perchloric acid and were determined as described by Horst et al. (2010) applying ion chromatography with an ICS3000 HPLC-system (Dionex) and ESI/MS/MS detection using a QTrap 3200 Triple-Quadrupole mass spectrometer with turboV ion source (Applied Biosystems) operated in multiple reaction monitoring mode. Untargeted metabolome profiling (fingerprinting) was conducted from the perchloric acid extracts and with the HPLC- and mass spec-system described for the targeted analysis. Negative Ions for the ESI/MS full scan were generated at −4.5 kV and a declustering potential of −20 V. The entrance potential (EP) was from −6 to −4 V, and gas pressures were 20 psi (curtain), 30 psi (nebulizer), and 20 psi (turbogas). A mass range of m/z 60–600 was recorded with 1 scan/s over 80 min. Five hundred peaks were aligned and evaluated after import into the program Marker View™ (Applied Biosystems) with a retention time tolerance of 0.75 min and a mass tolerance of 1.0 amu. Retention time corrections and normalization was done with the internal standard pipes. For PC analysis of fingerprinting data, quality control (QC) samples for PC analysis were generated as described (Bijlsma et al., 2006) by pooling equal-volume amounts from all analyzed samples. Artifact peaks where removed before the analysis was conducted with Marker View™.
Results
Phenotypic Characterization
The phenotypes obtained for the mutants in growth chambers (Figure 2) 4 weeks after sawing confirmed earlier findings (Caspar et al., 1985; Lin et al., 1988; Pesaresi et al., 2001; Yu et al., 2001; Schneider et al., 2002; Leister, 2003; Ihnatowicz et al., 2007). Most retarded in growth were the starch synthesis and mobilization mutants pgm1, adg1, and sex1. The impact of insufficient starch supply generating a general shortage of carbon is consistent with the growth retardation observed. A similar phenotype developed the PSI mutant psaD1. In addition, we confirmed the observation of a light green phenotype for psaD1, which is consistent with a reduction of chlorophylls and carotenes (Ihnatowicz et al., 2004). Two other KO-mutants of the PSI proteins psaO, psaN, and a mutant of the large subunit of the platidic ribosome prpL11 showed a milder phenotype still being clearly smaller then the control but larger than psaD1. The triosephosphate/phosphate translocator mutant tpt1 and a fourth PSI mutant psaE2 propagated in ecotype Ws displayed phenotypes looking hardly different from their wildtypes Col0 and Wassilewskija, respectively. This again is in agreement with earlier findings (Varotto et al., 2000).
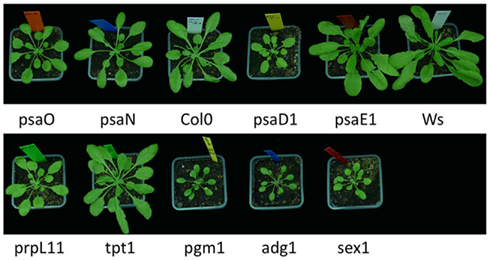
Figure 2. Phenotypes of tested Arabidopsis thaliana lines. Wildtypes: Columbia (Col0), Wassilewskija (Ws) mutants: phosphoglucomutase1 (pgm1); ADP-glucose pyrophosphorylase 1 (adg1); starch-related alpha-glucan/water dikinase (sex1); plastidic triosephosphate/phosphate translocator (tpt1); defective in photosynthesis complex I (psa) subunits D1-E: psaD1, psaO, psaN, psaE2; defective in plastidic ribosomal protein L 11 (prpL11). Photographs were taken 4 weeks after sawing. Plants were cultivated under short day conditions with 8 h light/12 h dark cycles. Mutants were established in Col0 whereas psaE2 was in Ws.
Metabolome Analysis of Arabidopsis Leaves
To rapidly obtain an unbiased overview of metabolite distributions of the Arabidopsis lines we performed IC/MS fingerprinting from four biological replicates of leaves extracted with perchloric acid. For this untargeted approach full MS scans from 60 to 600 amu were recorded and 431 masspeaks were finally evaluated statistically by principal component analysis. As depicted in Figure 3A the multivariate method sorted the three sugar mutants sex1, adg1, and pgm1 into a metabolic group being more similar to the triosephosphate transporter mutant tpt1, the ribosomal mutant prpL11 and surprisingly psaD1, one of the four mutants of PSI. The remaining three PSI mutants appeared to be more distant and comparable to the wildtypes Col0 or Ws. According to PC2 tpt1 and prpL11 and the three PSI mutants psaO, psaN, psaD1 but not psaE2 were more similar. Three pairs of lines namely adg1/pgm1, Ws/psaE2, and psaO/psaN clustered more closely.
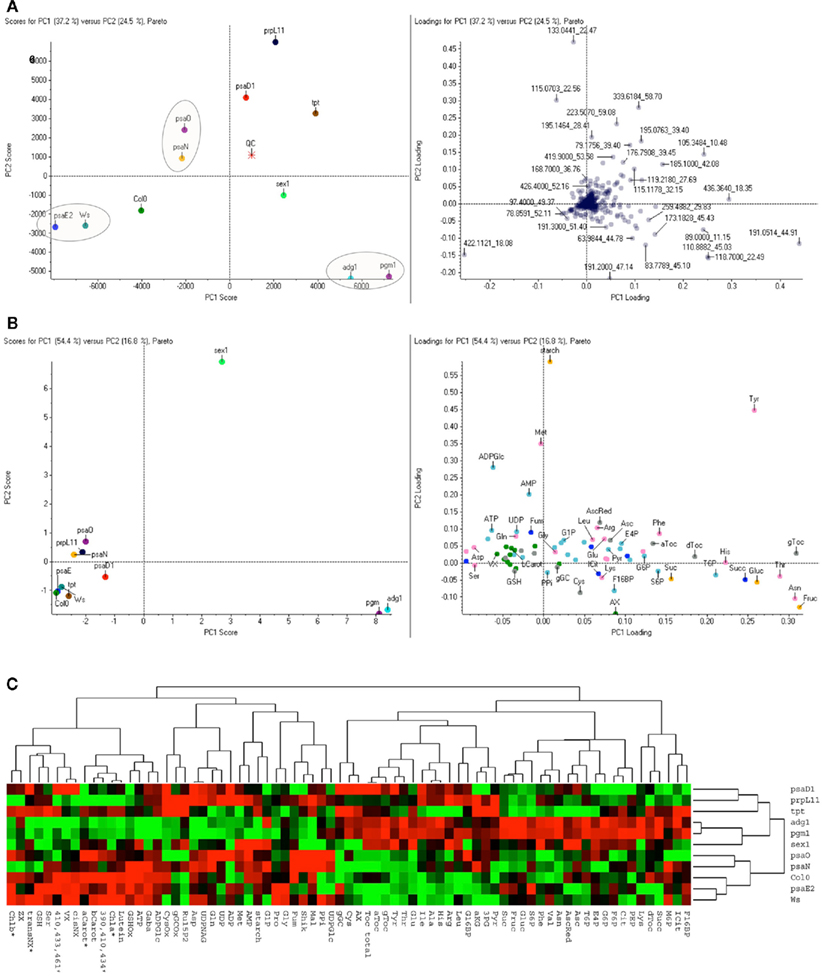
Figure 3. Multivariate statistical analysis of untargeted and targeted metabolite profiles obtained from Arabidopsis leaves. (A) The PCA was calculated for the 431 most significant mass signals obtained by metabolite fingerprinting and is based on mean values from four replicate samples (see Materials and Methods). Left: Scores plot of principal component 1 (PC1), covering 37.2% of the total variance versus principal component 2 (PC2, 24.5%). Circles are drawn around spots derived from the most similar metabolite profiles of genotypes as indicated below; QC, quality control sample; right: loadings plot for PC1 and PC2. Compounds are labeled according to the quantified MS-peaks with mass and retention time (complete dataset displayed in Table S2 in Supplementary Material). PCA was performed by using the MarkerViewTM software, vs 1.2 (Sangster et al., 2007; Applied Biosystems/MDS Sciex, Toronto, Canada) with Pareto scaling. (B) PCA was based on 74 metabolites that were analyzed in a targeted fashion (complete dataset displayed in Table S1 in Supplementary Material): For PCA, normalized mean values of four replicate samples per genotype were used and the resulting data points are labeled as in A. Metabolites are individually labeled. Colors indicate different metabolic groups namely sugars (yellow), aminoacids (pink), TCA-metabolites (darkblue), Calvincycle/Glycolysis (lightblue) antioxidants (gray), pigments (green). (C) Hierarchical cluster analysis (HCA) of the targeted profiling. Hierarchical clustering was performed with the same dataset used in (B). The Heatmap with red or green squares indicates increased or decreased levels of metabolites respectively. Dendogram correlations for best clustering pairs were 0.86 for adg1/pgm1 (node1); 0.6 for psaE2/Ws (node2); 0.43 for Col0/psaE2/Ws (node3); and 0.29 for psaO/psaN (node4). For HCA the CLUSTER and TREEVIEW software of the Eisenlab was applied (Eisen et al., 1998) set to complete linkage and uncentered Spearman Rank correlation. Columbia (Col0), Wassilewskija (Ws), phosphoglucomutase1 (pgm1); ADP-glucose pyrophosphorylase1 (adg1); starch-related alpha-glucan/water dikinase (sex1); plastidic triosephosphate/phosphate translocator (tpt1); defective in photosynthesis complex I (psa) subunits D1-E: psaD1, psaO, psaN, psaE2; defective in plastidic ribosomal protein L 11 (prpL11).
To verify this sorting and to identify responsible metabolites subsequently a targeted profiling approach was conducted. Here the content of 74 metabolites including major carbohydrates, phosphorylated intermediates, carboxylates, free aminoacids, major antioxidants such as tocopherol, ascorbate, and glutathione as well as plastidic pigments (for complete dataset see Table S1 in Supplementary Material) were measured. Evaluation of this biased approach with hierarchical cluster analysis confirmed the separation of the untargeted approach (Figure 3C). As for the untargeted analysis the same three clustering pairs of plant lines adg1/pgm1, Ws/psaE2, and psaO/psaN fell into three clusters with the highest correlations.
By the alternative evaluation of the targeted dataset with PCA now the main principal component with 54.4% of the total variance clearly separated the three sugar mutants sex1, and the closely clustering adg1 and pgm1 from all other lines tested (Figure 3B). Most important for this separation were the increased hexoses, γ-tocopherol, asparagine, threonine, and tyrosine while malate, aspartate, and most of the pigments were decreased (for complete dataset see of the loadings see Table S2 in Supplementary Material). A dominant difference of sex1 to all other lines was detected by PC2. Next to the outstanding starch elevation also high methionine and tyrosine levels and strong increases of ADP-glucose and AMP were most responsible for this distribution. A better resolution for the candidates clustering at the negative side of the scoring plot in Figure 3C was obtained by applying the algorithm Autoscaling instead of alternative Pareto Scaling. However the unequal footing of Pareto Scaling allows a better interpretation of the Loadings plot (Figure A1A in Appendix). Elimination of the three dominating mutants led to a clustering of the remaining lines that was most comparable to the untargeted approach (Figure A1B in Appendix).
Comparing Metabolic Signatures
To allow a more detailed interpretation of the observed global changes, metabolite contents of the targeted analysis were aligned and displayed relative to the wildtype Col0. As depicted in Figure 4, by comparison similarities detected statistically now became obvious and allowed to define distinct metabolic signatures for the plant lines. As expected adg1 and pgm1, both hampered in starch synthesis contained very little starch, while for sex1 a remarkable eightfold excess was measured. The soluble sugars for these lines accumulated up to ninefold in the starchless but only twofold in sex1. Most prominent but not surprising was the strong variance of the starch precursor ADP-glucose, which was almost absent in the starchless but twofold elevated in sex1. Here interestingly also AMP and methionine were elevated one- and fivefold, respectively. Outstanding for the amino acids of the starchless was the up to tenfold increase of the famine indicating asparagine (Usadel et al., 2008). Histidine and tyrosine levels were further major differences. Remarkable for the pigments of the starchless was the twofold-increased antheraxanthin (AX), a carotenoid of the xanthophyll cycle. In Sex1 instead AX was at wildtype level. Less dramatic different sugar levels were detected for the other mutants tested. PsaD1 however, a further PSI mutant, displayed a starch deficiency together with a hexose reduction. The metabolic pattern of psaD1 is peculiar for a fivefold elevation of AX. The pattern of amino acids and antioxidants resembled to sex1 or the adg1/pgm1 pair with respect to high tyrosine, threonine, asparagine, histidine, and the tocopherols α and γ but not δ. The pattern of phosphorylated intermediates and carboxylates was widely different from the other lines tested. Only here most of the metabolites were below the level of wildtype including the Calvin cycle metabolites 3PG, F16BP, F6P, E4P, and Ru15P2. The observed decrease of the hexoses is similar in prpL11 and tpt1 mutants. Tpt1 as psaD1 and the starchless pgm1 and adg1 lines showed a remarkable increase in AX while the remaining metabolic signatures were different. Furthermore in tpt1 the levels of almost half of the amino acids were reduced, while they were most often elevated for the other lines. Major differences were the elevated serine and the reduced glycine and methionine levels. A further variant metabolic signature displayed the mutant prpL11. Besides AX here all measured pigments were up to 50% below wildtype including chlorophyll and the carotenes. Delta-tocopherol was reduced as in all PSI mutants and in Ws. Methionine, asparagine, and tyrosine were increased by one- to twofold. AMP, ADP, UDP, Pyr, and PPi were up as well. The clustering psaO and psaN showed a further widely similar metabolic profile. Here sugars, antioxidants and pigments were close to wildtype while the latter were slightly reduced for psaN. The amino acids were increased almost as in prpL11. From the phosphorylated metabolites ADP-glucose was increased to 150% for both lines. PPi and G16BP was about 100% elevated. Shikimate was increased between 10 and 20%. In psaO F16P2 was reduced by 50% other than in psaN (+10%). The other metabolites of the Calvin cycle were increased. PsaE and its control Ws showed the third pair of similar signatures. Remarkably, here in both lines proline was increased twofold. Major differences are the almost twofold-increased PPi, which reminded to the psa0/psaN pair and a twofold increase of S6P, which is consistent with an increased sucrose level. S6P was elevated whenever sucrose was elevated with the exception of psaN. A decrease of S6P was found only in the three lines prpL11, tpt1, and psaD1. In these lines additionally hexoses were reduced while sucrose was like in wildtype.
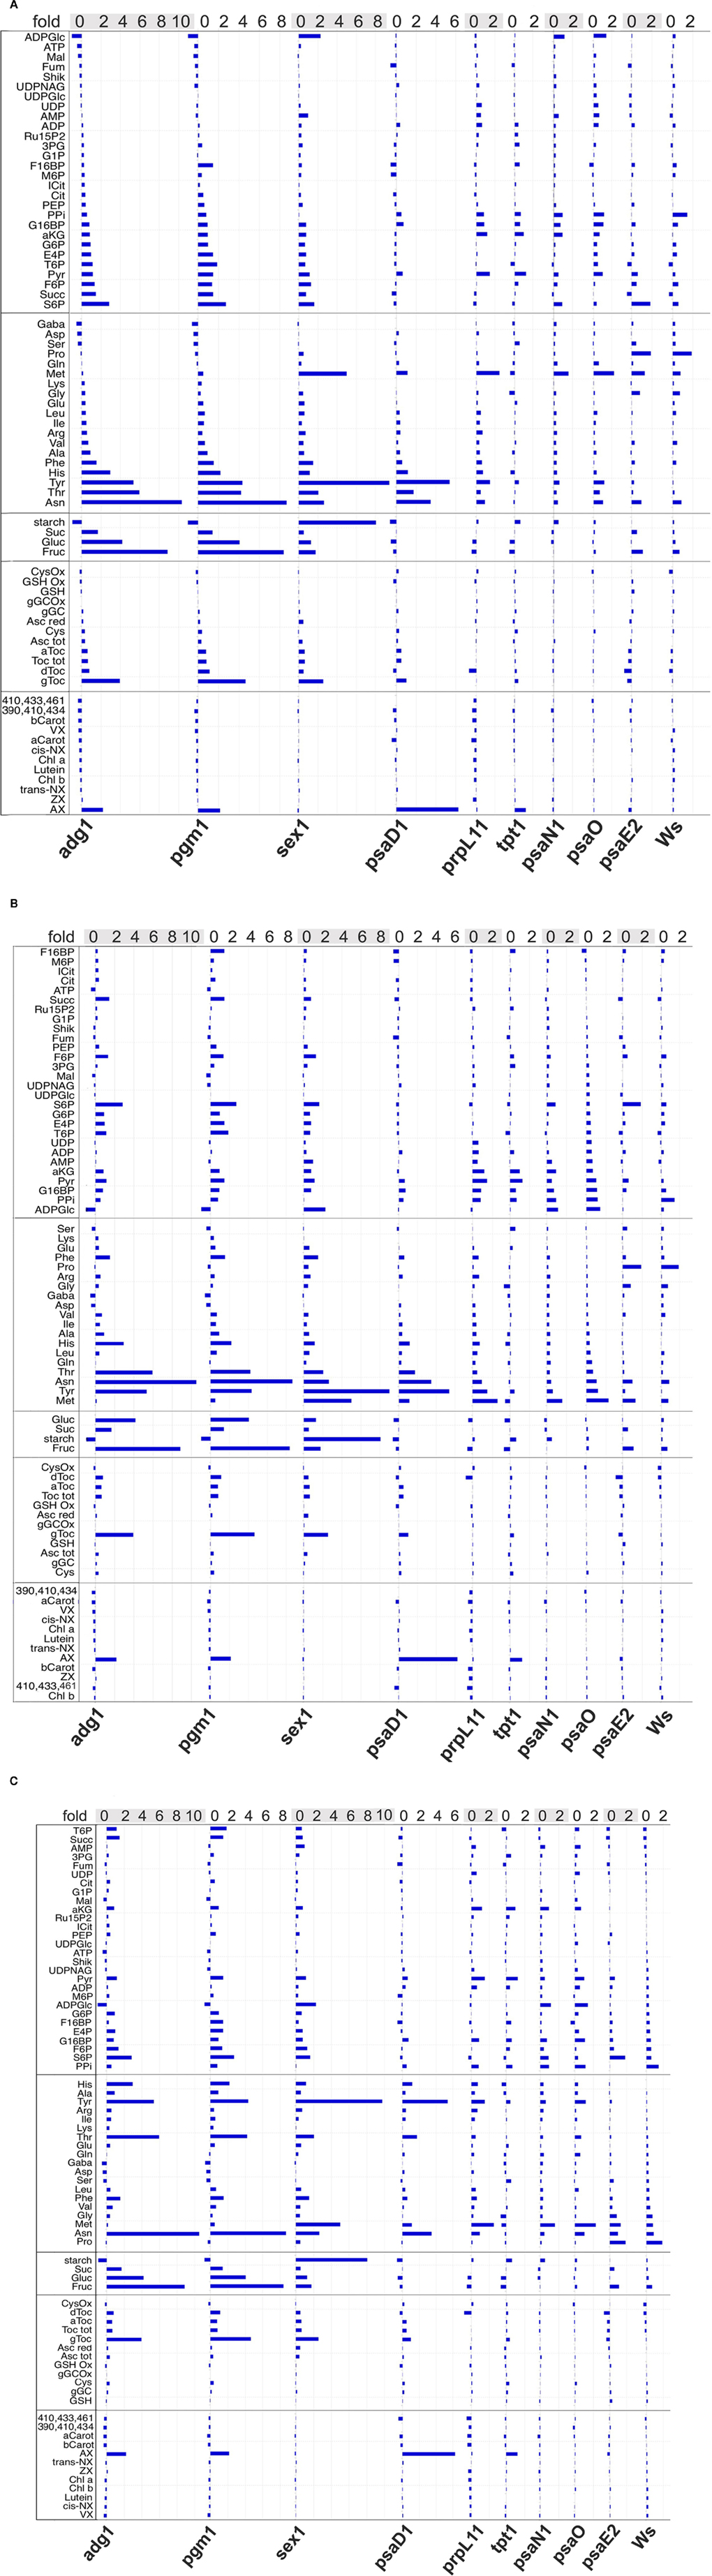
Figure 4. Alignment of metabolic profiles measured for Arabidopsis mutants. Contents of metabolites are displayed as n-fold increase or decrease (top line) relative to the control Col0. The plant lines are named at the bottom. The five metabolic groups boxed at the left side contain from top to bottom phosphorylated metabolites (Pmet) and carboxylates, aminoacids, sugars, antioxidants, and plant pigments. In A profiles are sorted from low to high amounts relative the mutant adg1 (adg1-signature), enhancing the visualization of similarities. In (B) the psaO- and in (C) the Ws-signature is displayed. The three most similar pairs of signatures detected were adg1/pgm1 in (A), psaO/psaN in (B), and Ws/psaE2 in (C). Columbia (Col0), Wassilewskija (Ws), phosphoglucomutase1 (pgm1); ADP-glucose pyrophosphorylase1 (adg1); starch-related alpha-glucan/water dikinase (sex1); plastidic triosephosphate/phosphate translocator (tpt1); defective in photosynthesis complex I (psa) subunits D1-E: psaD1, psaO, psaN, psaE2; defective in plastidic ribosomal protein L 11 (prpL11).
Interestingly 13 metabolites were found to be elevated always above the Col0 wildtype independently of the candidate. These were γ-GC for the antioxidants; Phe, Leu, Ile, Val, Tyr, Thr, and Glu for the aminoacids and G16P2, PPi, Pyr, ADP, and Ru15BP for the phosphorylated metabolites. Only one metabolite, an unidentified carotenoid (peak spectrum 390, 410, 434 nm) was found to be decreased below Col0 in all mutants.
Discussion
Genetic Defects are Reflected by Metabolic Profiles
The high similarity found for the metabolic profiles of the pathway neighboring starch biosynthesis mutants adg1 and pgm1 was not unexpected. Their signature confirmed earlier findings describing the accumulation of soluble sugars as more photoassimilates are exported from the chloroplast during the day (Caspar et al., 1985; Lin et al., 1988). The lack of starch means starvation for carbon and less investment into biomass resulting in serious growth retardation as observed. The deficiency is moreover responsible for mobilization of carbon from amino acids released by protein degradation (Usadel et al., 2008) and other carbon sources. Our findings of highly elevated asparagine and the general increase of most other amino acids are in agreement with this statement. It furthermore explains the measured accumulation of phosphorylated intermediates and carboxylates and the decrease of malate, which can be released from the depot of the vacuole (Gerhardt et al., 1987).
Unexpectedly, the carotenoid antheraxanthin (AX) was found to be in twofold excess, while besides zeaxanthin all other leaf pigments were decreased. Again this decrease might be a consequence from carbon mobilization. As processing and protection from light is essential and other pigments are missing, the deepoxidation reaction of the xanthophyll cycle toward AX, known as non-photochemical quenching (NPQ), might remain the only residual compensation of excess photosynthetic energy (Demmig-Adams and Adams III, 1996).
Starvation and light stress activates a protective antioxidant network (Golan et al., 2006). This could explain the observed increase of ascorbate, the tocopherols (Abbasi et al., 2007) and the stress indicative aromatic amino acids tyrosine (Schenke et al., 2011) and phenylalanine from which it is known, that they play an eminent role in abiotic stress and originate from plastids (Herrmann and Weaver, 1999; Ding et al., 2007; Rippert et al., 2009).
Sex1, the glucan/water dikinase mediates the phosphorylation of glucosyl residues at the surface of starch granules that is required for normal rates of starch breakdown. Therefore sex1 mutants accumulate very high levels of starch (Yu et al., 2001; Kotting et al., 2005). We found the metabolic profile sorted next to the starchless mutants. In spite of the similar growth retardation we confirmed that certain metabolite contents were dramatically different as the increase of starch and ADP-glucose. The increase of soluble sugars and most amino acids again pointed to a massive mobilization of carbon. Although it is known, that blocking the metabolism of starch breakdown in Arabidopsis leaves triggers chloroplast degradation (Stettler et al., 2009), we could only measure little decreased leaf pigment levels and no AX accumulation. Thus the photosynthetic light reaction was not severely effected. This might explain a modified stress response compared to the starchless mutant in which tyrosine was even more (10-fold) increased and proline (Szabados and Savoure, 2009) and a fivefold-elevated methionine (Vogt, 1995) might serve as alternative protectors.
The psaD1 protein is known to be essential for photosynthesis as it stabilizes the PSI complex and enables docking of ferredoxin (Jordan et al., 2001). The loss of PSI stops the photosynthetic electron flow and hence the energy supply of the whole plant. A second gene coding for the psaD2 homolog rescues psaD1 functions only partially generating 40% of the psaD protein. psaD1 mutants consequently show a decrease in growth rate and down-regulation of most genes involved in the light phase of photosynthesis. A reduced synthesis of chlorophylls and carotenoids combined with an increased photosensitivity was observed (Haldrup et al., 2003; Ihnatowicz et al., 2004; Jensen et al., 2007). Accordingly we confirmed the stunted phenotype that resembled the three sugar mutants. The metabolic signature however appeared to be highly divers. The blocked loading of the Calvin cycle with NADPH and ATP explains the decrease of both, starch and hexoses, a status not detected for other candidates.
As seen for the adg1/pgm1 pair, antheraxanthin again was elevated, while the chlorophylls and carotenoids were low. However here the elevation was the highest (fivefold) among all lines.
Similarly an increase of the xanthophyll cycle metabolites (VAZ) combined with decreased photosynthetic pigments in psaD1 was observed before (Ihnatowicz et al., 2004). The additional elevation of most of the analyzed antioxidants and again tyrosine indicated that psaD1 was stressed although the metabolic signature indicates a different less dramatic response.
For the remaining Arabidopsis lines, the metabolic differences found were less extreme. The two other PSI mutants, psaO and psaN showed further closely clustering metabolic profiles being more similar to psaE2, Col0, and Ws than to psaD1. This outcome correlates with the phenotypes, where psaO and psaN appeared a little smaller as the control but clearly larger than psaD1. The single copy gene psaO codes for a protein mainly involved in state transitions, forming a domain for LHCII binding and stabilization. It allows for responding to changes in illumination, balancing excitation pressure (Jensen et al., 2007). Therefore, under the light conditions applied it makes sense that this mutation was only of minor impact.
In psaN mutants the docking of the lumenal electron donor plastocyanin to PSI is inefficient (Jensen et al., 2007). It was shown, that the lower activity of PSI is partially compensated by an increase in PSI complexes lacking PsaN (Haldrup et al., 1999).
In agreement with earlier findings (Varotto et al., 2000) in our hands the psaE2 mutant in the Ws background displayed a wildtype-like growth and leaf coloration. Additionally we uncovered a wildtype-like metabolite profile indicating, that the loss of the E subunit of PSI under the applied growth conditions seems to be of minor importance for the plant. Accordingly earlier findings showed, that the E2 is not essential for PSI accumulation and thylakoid electron flow and although NADP+ photoreduction is impaired, mutants exhibit normal photoautotrophic growth (Zhao et al., 1993; Xu et al., 1994; Ihnatowicz et al., 2007). Most differences that we detected therefore must be regarded as ecotype specific, e.g., the remarkable fourfold elevation of proline versus Col0. The multifunctional proline is known to act as an osmolyte binding water conferring plants with a higher drought tolerance and tolerance for other abiotic stress (Verbruggen and Hermans, 2008; Szabados and Savoure, 2009). WS in particular is known to be more susceptible than other ecotypes to reactive oxygen species-induced damages (Kalbina and Strid, 2006; Li et al., 2006).
For the tpt1 mutant it is known that one arm of the carbon dioxide partitioning via the Calvin cycle is blocked. As this reduces the export of photoassimilates and favors the rate of starch synthesis a starch excess phenotype as a secondary effect develops. The export block is fully compensated by accelerated starch turnover and export of neutral sugars. Instead of triosephosphate G6P, generated from exported Glucose, is used for cytosolic sucrose biosynthesis (Schneider et al., 2002). Besides this, tpt1 is not the only abundant transporter of C3 molecules (Fischer et al., 1997). Accordingly the phenotype and metabolome data obtained confirmed that this knockout does not severely compromise Arabidopsis. Compared to the other starch mutants tested, the tpt1 signature appeared to be weak. We could confirm the findings of Schneider et al. (2002) by measuring a nearly 100% reduction of hexoses and increase of starch, respectively. Furthermore, as seen for other candidates above, an increase in AX again seems to be needed to outbalance excitation energy accumulated from reduced pigment levels.
Our prpL11 cultivars confirmed earlier findings in which the phenotype developed pale green leaves together with a drastically reduced growth. In this mutant a component of the large 50s subunit of the plastidic ribosome is missing. As a consequence of impaired ribosomal activity the translation of the large subunit of Rubisco (RbcL) and of other plastidic proteins is significantly reduced resulting in severe defects of chloroplast function and a reduction of photosynthetic activity. (Pesaresi et al., 2001; Morita-Yamamuro et al., 2004). In accordance with this harsh intervention besides AX, we found all pigments to be reduced in this mutant. These reductions were higher than in all other candidates. The overall metabolic profile of prpL11 is on one side more similar to the tpt1 mutant and to psaD1 as judged by HCA and untargeted PCA, but with respect to the amino acids it is like the psaO/psaN pair.
Certain Metabolites are Increased or Decreased in all Plastidic Mutants Tested
Considering that each of the mutations assayed must have at least some impact on the plants metabolic status, the metabolites found to be increased or decreased in all mutants might be indicative for a common feature shared by the tested set of lines. What all mutants have in common is the compromised plastidic integrity. For the photosynthesis mutants normal light conditions might already be an overdose for the plastidic light harvesting function. The blocks of the plastidic carbon assimilation, utilization or export functions of the other mutants likewise results in organelles with adapted metabolism generating a shortage or reallocation of carbon. Energy- or carbon-shortage both as a consequence are generating more or less stress depending on the impact of the mutation. A common stress response, e.g., in combination with the protective antioxidant network (Golan et al., 2006) for compromised plastids might explain, why some stress indicative metabolites as γ-glutamylcysteine, phenylalanine, tyrosine, isoleucine, or threonine are increased in all lines.
Outbalancing of the hampered organelles might additionally trigger adaptations of carbon mobilization or cause accumulation at certain metabolic crossings in the mutant leaves. An example would be an increased desamination of amino acids or a reduced  assimilation. Today there is little doubt that C-metabolites are important signal molecules acting at various regulatory steps of the
  assimilation pathway (Lam et al., 1996). The increased alpha-ketoglutarate (2 OG) together with the elevated glutamate might be indicative here. Pyruvate as well was found to be increased in all mutants. As a precursor for the likewise increased valine and leucine and for acetyl-CoA, this central metabolite might not be utilized to a normal level in plastidic mutants. Here again the carbon-shortage might generate a feedback on the precursor levels from unneeded lipid- and isoprenoid biosynthesis producing less cell membranes, chlorophyll, or carotenoides. Another adaption of the mutants might be indicated by the accumulated ribulose-1,5-bisphosphate (R15BP). Again the reduced plastidic functions of carbon flow or photosynthetic yield could generate a down-regulation of the Calvin cycle.
Our data show that we can detect similar metabolic patterns for mutants with related defects.
The pleiotropic responses allow identifying such homologous signatures out of a set of mutants. It is now challenging to continue in generating further metabolic profiles for mutants with defects in different and more distant pathways as well as, e.g., for different ecotypes. It should furthermore be tested, if certain parameter of cultivation, e.g., the time-point of harvest or the intensity of light influences the separation of the mutants. As certain metabolite levels dramatically change during the day and under different external parameters, it might be useful to find optimized conditions for profiling. The separation of mutants might as well be largely independent of such parameters, as long as all candidates are treated in the same way. This would probably simplify future experimental designs. An established spectrum of metabolic signatures should finally enable the classification of unknown plant mutants into functional groups.
Conflict of Interest Statement
The authors declare that the research was conducted in the absence of any commercial or financial relationships that could be construed as a potential conflict of interest.
Acknowledgments
The authors would like to thank Christine Hösl at the FAU Erlangen-Nuremberg for plant care and Urte Schlüter for useful discussions.
Supplementary Material
The Supplementary Material for this article can be found online at http://www.frontiersin.org/Plant_Physiology/10.3389/fpls.2011.00082/abstract
Table S1. Compilation of metabolite data of the targeted metabolite analysis content. Measured data from 74 metabolites analyzed in targeted assays are given as mean values of four independent replicates ± SD. Significantly different metabolite contents between genotypes and Col-0 with P < 0.05 according to a Welch-Satterthwaite test (Junker et al., 2006) are indicated by an asterisk. Columbia (Col-0), Wassilewskija (Ws), phosphoglucomutase 1 (pgm1); ADP glucose pyrophosphorylase 1 (adg1); starch-related alpha-glucan/water dikinase (sex1); plastidic triose phosphate/phosphate translocator (tpt1); defective in photosynthesis complex I (psa) subunits D1-E: psaD1, psaO, psaN, psaE2; defective in plastidic ribosomal protein L 11 (prpL11).
Table S2. Loadings of the targeted PCA. Values for metabolites loading on the PCA for the targeted analysis of 11 Arabidopsis lines (Figure 3B) are sorted from high to low and given for the principal components PC1 (column 5) and PC2 (column 10).
References
Abbasi, A. R., Hajirezaei, M., Hofius, D., Sonnewald, U., and Voll, L. M. (2007). Specific roles of alpha- and gamma-tocopherol in abiotic stress responses of transgenic tobacco. Plant Physiol. 143, 1720–1738.
Bijlsma, S., Bobeldijk, I., Verheij, E. R., Ramaker, R., Kochhar, S., Macdonald, I. A., Van Ommen, B., and Smilde, A. K. (2006). Large-scale human metabolomics studies: a strategy for data (pre-) processing and validation. Anal. Chem. 78, 567–574.
Bino, R. J., Hall, R. D., Fiehn, O., Kopka, J., Saito, K., Draper, J., Nikolau, B. J., Mendes, P., Roessner-Tunali, U., Beale, M. H., Trethewey, R. N., Lange, B. M., Wurtele, E. S., and Sumner, L. W. (2004). Potential of metabolomics as a functional genomics tool. Trends Plant Sci. 9, 418–425.
Bolling, C., and Fiehn, O. (2005). Metabolite profiling of Chlamydomonas reinhardtii under nutrient deprivation. Plant Physiol. 139, 1995–2005.
Brown, D. M., Zeef, L. A., Ellis, J., Goodacre, R., and Turner, S. R. (2005). Identification of novel genes in Arabidopsis involved in secondary cell wall formation using expression profiling and reverse genetics. Plant Cell 17, 2281–2295.
Caspar, T., Huber, S. C., and Somerville, C. (1985). Alterations in growth, photosynthesis, and respiration in a starchless mutant of Arabidopsis thaliana (L.) deficient in chloroplast phosphoglucomutase activity. Plant Physiol. 79, 11–17.
Clare, A., Karwath, A., Ougham, H., and King, R. D. (2006). Functional bioinformatics for Arabidopsis thaliana. Bioinformatics 22, 1130–1136.
Cohen, S. A., and Michaud, D. P. (1993). Synthesis of a fluorescent derivatizing reagent, 6-aminoquinolyl-N-hydroxysuccinimidyl carbamate, and its application for the analysis of hydrolysate amino acids via high-performance liquid chromatography. Anal. Biochem. 211, 279–287.
Demmig-Adams, B., and Adams III, W. W. (1996). The role of xanthophyll cycle carotenoids in the protection of photosynthesis. Trends Plant Sci. 1, 21–26.
Ding, L., Hofius, D., Hajirezaei, M. R., Fernie, A. R., Bornke, F., and Sonnewald, U. (2007). Functional analysis of the essential bifunctional tobacco enzyme 3-dehydroquinate dehydratase/shikimate dehydrogenase in transgenic tobacco plants. J. Exp. Bot. 58, 2053–2067.
Eisen, M. B., Spellman, P. T., Brown, P. O., and Botstein, D. (1998). Cluster analysis and display of genome-wide expression patterns. Proc. Natl. Acad. Sci. U.S.A. 95, 14863–14868.
Fiehn, O. (2002). Metabolomics – the link between genotypes and phenotypes. Plant Mol. Biol. 48, 155–171.
Fiehn, O., Kopka, J., Dormann, P., Altmann, T., Trethewey, R. N., and Willmitzer, L. (2000). Metabolite profiling for plant functional genomics. Nat. Biotechnol. 18, 1157–1161.
Fischer, K., Kammerer, B., Gutensohn, M., Arbinger, B., Weber, A., Hausler, R. E., and Flugge, U. I. (1997). A new class of plastidic phosphate translocators: a putative link between primary and secondary metabolism by the phosphoenolpyruvate/phosphate antiporter. Plant Cell 9, 453–462.
Gerhardt, R., Stitt, M., and Heldt, H. W. (1987). Subcellular metabolite levels in spinach leaves: regulation of sucrose synthesis during diurnal alterations in photosynthetic partitioning. Plant Physiol. 83, 399–407.
Golan, T., Muller-Moule, P., and Niyogi, K. K. (2006). Photoprotection mutants of Arabidopsis thaliana acclimate to high light by increasing photosynthesis and specific antioxidants. Plant Cell Environ. 29, 879–887.
Haldrup, A., Lunde, C., and Scheller, H. V. (2003). Arabidopsis thaliana plants lacking the PSI-D subunit of photosystem I suffer severe photoinhibition, have unstable photosystem I complexes, and altered redox homeostasis in the chloroplast stroma. J. Biol. Chem. 278, 33276–33283.
Haldrup, A., Naver, H., and Scheller, H. V. (1999). The interaction between plastocyanin and photosystem I is inefficient in transgenic Arabidopsis plants lacking the PSI-N subunit of photosystem I. Plant J. 17, 689–698.
Hall, R., Beale, M., Fiehn, O., Hardy, N., Sumner, L., and Bino, R. (2002). Plant metabolomics: the missing link in functional genomics strategies. Plant Cell 14, 1437–1440.
Herrmann, K. M., and Weaver, L. M. (1999). The shikimate pathway. Annu. Rev. Plant Physiol. Plant Mol. Biol. 50, 473–503.
Horst, R. J., Doehlemann, G., Wahl, R., Hofmann, J., Schmiedl, A., Kahmann, R., Kamper, J., Sonnewald, U., and Voll, L. M. (2010). Ustilago may disinfection strongly alters organic nitrogen allocation in maize and stimulates productivity of systemic source leaves. Plant Physiol. 152, 293–308.
Ihnatowicz, A., Pesaresi, P., and Leister, D. (2007). The E subunit of photosystem I is not essential for linear electron flow and photoautotrophic growth in Arabidopsis thaliana. Planta 226, 889–895.
Ihnatowicz, A., Pesaresi, P., Varotto, C., Richly, E., Schneider, A., Jahns, P., Salamini, F., and Leister, D. (2004). Mutants for photosystem I subunit D of Arabidopsis thaliana: effects on photosynthesis, photosystem I stability and expression of nuclear genes for chloroplast functions. Plant J. 37, 839–852.
Jensen, P. E., Bassi, R., Boekema, E. J., Dekker, J. P., Jansson, S., Leister, D., Robinson, C., and Scheller, H. V. (2007). Structure, function and regulation of plant photosystem I. Biochim. Biophys. Acta 1767, 335–352.
Jordan, P., Fromme, P., Witt, H. T., Klukas, O., Saenger, W., and Krauss, N. (2001). Three-dimensional structure of cyanobacterial photosystem I at 2.5 A resolution. Nature 411, 909–917.
Kalbina, I., and Strid, A. (2006). Supplementary ultraviolet-B irradiation reveals differences in stress responses between Arabidopsis thaliana ecotypes. Plant Cell Environ. 29, 754–763.
King, R. D., Wise, P. H., and Clare, A. (2004). Confirmation of data mining based predictions of protein function. Bioinformatics 20, 1110–1118.
Kogel, K. H., Voll, L. M., Schafer, P., Jansen, C., Wu, Y., Langen, G., Imani, J., Hofmann, J., Schmiedl, A., Sonnewald, S., Von Wettstein, D., Cook, R. J., and Sonnewald, U. (2010). Transcriptome and metabolome profiling of field-grown transgenic barley lack induced differences but show cultivar-specific variances. Proc. Natl. Acad. Sci. U.S.A. 107, 6198–6203.
Kotting, O., Pusch, K., Tiessen, A., Geigenberger, P., Steup, M., and Ritte, G. (2005). Identification of a novel enzyme required for starch metabolism in Arabidopsis leaves. The phosphoglucan, water dikinase. Plant Physiol. 137, 242–252.
Lam, H. M., Coschigano, K. T., Oliveira, I. C., Melo-Oliveira, R., and Coruzzi, G. M. (1996). The molecular-genetics of nitrogen assimilation into amino acids in higher plants. Annu. Rev. Plant Physiol. Plant Mol. Biol. 47, 569–593.
Li, P., Mane, S. P., Sioson, A. A., Robinet, C. V., Heath, L. S., Bohnert, H. J., and Grene, R. (2006). Effects of chronic ozone exposure on gene expression in Arabidopsis thaliana ecotypes and in Thellungiella halophila. Plant Cell Environ. 29, 854–868.
Lin, T. P., Caspar, T., Somerville, C., and Preiss, J. (1988). Isolation and characterization of a starchless mutant of Arabidopsis thaliana (L.) Heynh lacking ADPglucose pyrophosphorylase activity. Plant Physiol. 86, 1131–1135.
Messerli, G., Partovi Nia, V., Trevisan, M., Kolbe, A., Schauer, N., Geigenberger, P., Chen, J., Davison, A. C., Fernie, A. R., and Zeeman, S. C. (2007). Rapid classification of phenotypic mutants of Arabidopsis via metabolite fingerprinting. Plant Physiol. 143, 1484–1492.
Morita-Yamamuro, C., Tsutsui, T., Tanaka, A., and Yamaguchi, J. (2004). Knock-out of the plastid ribosomal protein S21 causes impaired photosynthesis and sugar-response during germination and seedling development in Arabidopsis thaliana. Plant Cell Physiol. 45, 781–788.
Pesaresi, P., Varotto, C., Meurer, J., Jahns, P., Salamini, F., and Leister, D. (2001). Knock-out of the plastid ribosomal protein L11 in Arabidopsis: effects on mRNA translation and photosynthesis. Plant J. 27, 179–189.
Rippert, P., Puyaubert, J., Grisollet, D., Derrier, L., and Matringe, M. (2009). Tyrosine and phenylalanine are synthesized within the plastids in Arabidopsis. Plant Physiol. 149, 1251–1260.
Roessner, U., Luedemann, A., Brust, D., Fiehn, O., Linke, T., Willmitzer, L., and Fernie, A. (2001). Metabolic profiling allows comprehensive phenotyping of genetically or environmentally modified plant systems. Plant Cell 13, 11–29.
Roessner, U., Patterson, J. H., Forbes, M. G., Fincher, G. B., Langridge, P., and Bacic, A. (2006). An investigation of boron toxicity in barley using metabolomics. Plant Physiol. 142, 1087–1101.
Sangster, T. P., Wingate, J. E., Burton, L., Teichert, F., and Wilson, I. D. (2007). Investigation of analytical variation in metabonomic analysis using liquid chromatography/mass spectrometry. Rapid Commun. Mass Spectrom. 21, 2965–2970.
Schenke, D., Bottcher, C., and Scheel, D. (2011). Crosstalk between abiotic ultraviolet-B stress and biotic (flg22) stress signalling in Arabidopsis prevents flavonol accumulation in favor of pathogen defence compound production. Plant Cell Environ. 34, 1849–1864.
Schneider, A., Hausler, R. E., Kolukisaoglu, U., Kunze, R., Van Der Graaff, E., Schwacke, R., Catoni, E., Desimone, M., and Flugge, U. I. (2002). An Arabidopsis thaliana knock-out mutant of the chloroplast triose phosphate/phosphate translocator is severely compromised only when starch synthesis, but not starch mobilisation is abolished. Plant J. 32, 685–699.
Sekiguchi, Y., Mitsuhashi, N., Kokaji, T., Miyakoda, H., and Mimura, T. (2005). Development of a comprehensive analytical method for phosphate metabolites in plants by ion chromatography coupled with tandem mass spectrometry. J. Chromatogr. A 1085, 131–136.
Stettler, M., Eicke, S., Mettler, T., Messerli, G., Hortensteiner, S., and Zeeman, S. C. (2009). Blocking the metabolism of starch breakdown products in Arabidopsis leaves triggers chloroplast degradation. Mol. Plant 2, 1233–1246.
Swarbreck, D., Wilks, C., Lamesch, P., Berardini, T. Z., Garcia-Hernandez, M., Foerster, H., Li, D., Meyer, T., Muller, R., Ploetz, L., Radenbaugh, A., Singh, S., Swing, V., Tissier, C., Zhang, P., and Huala, E. (2008). The Arabidopsis information resource (TAIR): gene structure and function annotation. Nucleic Acids Res. 36, D1009–D1014.
Szabados, L., and Savoure, A. (2009). Proline: a multifunctional amino acid. Trends Plant Sci. 15, 89–97.
Tohge, T., and Fernie, A. R. (2010). Combining genetic diversity, informatics and metabolomics to facilitate annotation of plant gene function. Nat. Protoc. 5, 1210–1227.
Tohsato, Y., Baba, T., Mazaki, Y., Ito, M., Wanner, B. L., and Mori, H. (2010). Environmental dependency of gene knockouts on phenotype microarray analysis in Escherichia coli. J. Bioinform. Comput. Biol. 8(Suppl. 1), 83–99.
Usadel, B., Blasing, O. E., Gibon, Y., Retzlaff, K., Hohne, M., Gunther, M., and Stitt, M. (2008). Global transcript levels respond to small changes of the carbon status during progressive exhaustion of carbohydrates in Arabidopsis rosettes. Plant Physiol. 146, 1834–1861.
Varotto, C., Pesaresi, P., Meurer, J., Oelmuller, R., Steiner-Lange, S., Salamini, F., and Leister, D. (2000). Disruption of the Arabidopsis photosystem I gene psaE1 affects photosynthesis and impairs growth. Plant J. 22, 115–124.
Verbruggen, N., and Hermans, C. (2008). Proline accumulation in plants: a review. Amino Acids 35, 753–759.
Vogt, W. (1995). Oxidation of methionyl residues in proteins: tools, targets, and reversal. Free Radic. Biol. Med. 18, 93–105.
Williams, G. C. (1957). Pleiotropy, natural selection, and the evolution of senescence. Evolution 11, 398–411.
Winder, C. L., Dunn, W. B., Schuler, S., Broadhurst, D., Jarvis, R., Stephens, G. M., and Goodacre, R. (2008). Global metabolic profiling of Escherichia coli cultures: an evaluation of methods for quenching and extraction of intracellular metabolites. Anal. Chem. 80, 2939–2948.
Xu, Q., Jung, Y. S., Chitnis, V. P., Guikema, J. A., Golbeck, J. H., and Chitnis, P. R. (1994). Mutational analysis of photosystem I polypeptides in Synechocystis sp. PCC 6803. Subunit requirements for reduction of NADP+ mediated by ferredoxin and flavodoxin. J. Biol. Chem. 269, 21512–21518.
Yu, T. S., Kofler, H., Hausler, R. E., Hille, D., Flugge, U. I., Zeeman, S. C., Smith, A. M., Kossmann, J., Lloyd, J., Ritte, G., Steup, M., Lue, W. L., Chen, J., and Weber, A. (2001). The Arabidopsis sex1 mutant is defective in the R1 protein, a general regulator of starch degradation in plants, and not in the chloroplast hexose transporter. Plant Cell 13, 1907–1918.
Zhao, J., Snyder, W. B., Muhlenhoff, U., Rhiel, E., Warren, P. V., Golbeck, J. H., and Bryant, D. A. (1993). Cloning and characterization of the psaE gene of the cyanobacterium Synechococcus sp. PCC 7002: characterization of a psaE mutant and overproduction of the protein in Escherichia coli. Mol. Microbiol. 9, 183–194.
Appendix
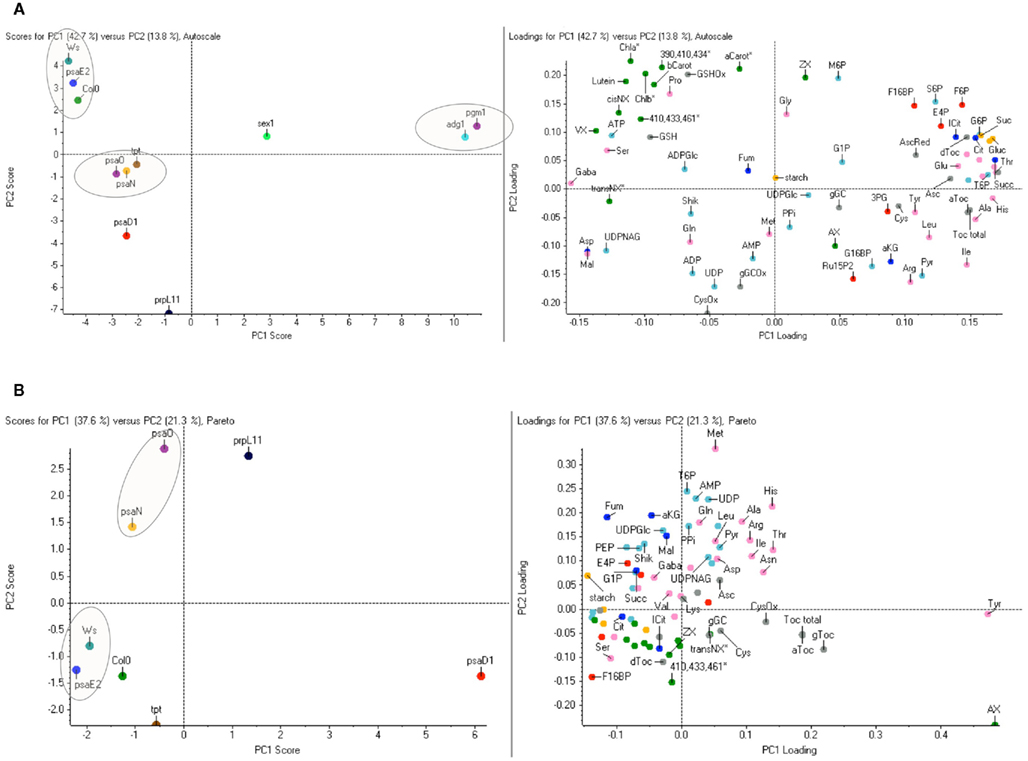
Figure A1. Alternative targeted principal component analysis. (A) The PCA dataset of Figure 3B based on 74 metabolites was calculated with Autoscaling instead of Pareto scaling. By Autoscaling for each peak, the average response for all samples and its SD are calculated. Each value is then subtracted by the average and divided by the SD. This allows variables of very different response to be compared on an equal footing however, the Loadings Plot can often be difficult to interpret since the most important variables do not necessarily stand out. In the similar Pareto scaling algorithm each value is subtracted by the average and divided by the square root of the standard deviation. This prevents intense peaks from completely dominating the PCA analysis, but also allows peaks with good signal/noise to have more importance. (B) Targeted principal component analysis for eight Arabidopsis lines. The PCA dataset of Figure 3B based on 74 metabolites was calculated with Pareto scaling without the dominating three sugar mutants adg1, pgm1, and sex1. Metabolites are individually labeled. Colors indicate different metabolic groups: Sugars (yellow), aminoacids (pink), TCA-metabolites (darkblue), Calvincycle/Glycolysis (lightblue) antioxidants (gray), pigments (green). Columbia (Col0), Wassilewskija (Ws), phosphoglucomutase1 (pgm1); ADP-glucose pyrophosphorylase1 (adg1); starch-related alpha-glucan/water dikinase (sex1); plastidic triosephosphate/phosphate translocator (tpt1); defective in photosynthesis complex I (psa) subunits D1-E: psaD1, psaO, psaN, psaE2; defective in plastidic ribosomal protein L 11 (prpL11).
Reference
Keywords: metabolic profiling, fingerprinting, functional genomics, Arabidopsis thaliana, pleiotropic response, chloroplast
Citation: Hofmann J, Börnke F, Schmiedl A, Kleine T and Sonnewald U (2011) Detecting functional groups of Arabidopsis mutants by metabolic profiling and evaluation of pleiotropic responses. Front. Plant Sci. 2:82. doi: 10.3389/fpls.2011.00082
Received: 20 October 2011; Accepted: 02 November 2011;
Published online: 23 November 2011.
Edited by:
Jose Manuel Estevez, University of Buenos Aires and CONICET, ArgentinaReviewed by:
Alisdair Fernie, Max Planck Institute for Plant Physiology, GermanyJoong-Hoon Ahn, Konkuk University, South Korea
Copyright: © 2011 Hofmann, Börnke, Schmiedl, Kleine and Sonnewald. This is an open-access article subject to a non-exclusive license between the authors and Frontiers Media SA, which permits use, distribution and reproduction in other forums, provided the original authors and source are credited and other Frontiers conditions are complied with.
*Correspondence: Jörg Hofmann, Friedrich-Alexander University Erlangen-Nürnberg, Lehrstuhl für Biochemie, Staudtstrasse 5, D-91058 Erlangen, Germany. e-mail:amhvZm1hbm5AYmlvbG9naWUudW5pLWVybGFuZ2VuLmRl