

 Ning Zhu2
- 1Proteomics, Interdisciplinary Center for Biotechnology Research, University of Florida, Gainesville, FL, USA
- 2Department of Biology, UF Genetics Institute, University of Florida, Gainesville, FL, USA
- 3USDA-Agricultural Research Service, Center for Medical, Agricultural and Veterinary Entomology, Gainesville, FL, USA
- 4Departments of Agronomy and Plant Pathology, University of Florida, Gainesville, FL, USA
Developing endosperm in maize seed is a major site for biosynthesis and storage of starch and proteins, and of immense economic importance for its role in food, feed and biofuel production. The basal part of endosperm performs a major role in solute, water and nutrition acquisition from mother plant to sustain these functions. The miniature1 (mn1) mutation is a loss-of-function mutation of the Mn1-encoded cell wall invertase that is entirely expressed in the basal endosperm and is essential for many of the metabolic and signaling functions associated with metabolically released hexose sugars in developing endosperm. Here we report a comparative proteomic study between Mn1 and mn1 basal endosperm to better understand basis of pleiotropic effects on many diverse traits in the mutant. Specifically, we used iTRAQ based quantitative proteomics combined with Gene Ontology (GO) and bioinformatics to understand functional basis of the proteomic information. A total of 2518 proteins were identified from soluble and cell wall associated protein (CWAP) fractions; of these 131 proteins were observed to be differentially expressed in the two genotypes. The main functional groups of proteins that were significantly different were those involved in the carbohydrate metabolic and catabolic process, and cell homeostasis. The study constitutes the first proteomic analysis of basal endosperm cell layers in relation to endosperm growth and development in maize.
Introduction
Proteomic analysis aims to measure the expression and modification of all proteins in an organism as a function of a number of variants, including environmental conditions, biotic or abiotic stresses, wild type and mutant genotypes, developmental stages etc. (Chen and Harmon, 2006; Lan et al., 2011; Neilson et al., 2011; Owiti et al., 2011). Advancement in mass spectrometry, genome sequencing and bioinformatics has been major impetuses to high-throughput analyses in proteome studies (Miernyk and Hajduch, 2011). Of many plant materials used for proteomic studies, developing seeds are of particular interest because of their economic significance; additionally, they undergo many distinctive phases where each stage is marked by unique cellular or metabolic activity. Among the most recent seed proteomic studies, Lee and Koh (2011) described rice grain profiles at three developmental stages against fully mature grains to show 52 categories out of a total of 4172 proteins. Koller et al. (2002) compared rice proteomes of leaf, root and seed showing 622 leaf-specific, 862 root-specific and 512 seed-specific proteins. The assignment of function based on BLAST searches showed that 360 proteins have no homology to known proteins; thus, these were labeled as rice-specific proteins. A similar study in maize endosperm (Méchin et al., 2007) at seven developmental stages showed a total of 632 proteins; of these 496 were assigned to functional identification. A relative increase in the levels of glycolytic enzymes as compared to TCA enzymes in this study confirmed the previously demonstrated anoxic conditions of the endosperm. It also pointed to a crucial role for pyruvate orthophosphate dikinase in maintaining starch-protein balance during endosperm development.
Although these data in maize are important, they do not take into account that an endosperm is a heterogeneous tissue comprised of at least four known cell types (Scanlon and Takacs, 2009). Of these four, one cell type, basal endosperm transfer layer (BETL), is unique to the basal 1/3rd part of the endosperm that is adjacent to the maternal pedicel (Figure 1), and is primarily engaged in acquisition of water, nutrients and solutes from the mother plant. In the context of basal endosperm, the miniature1 (mn1) seed mutant is of particular interest because it is a loss-of-function mutation of the Mn1 gene that encodes an endosperm-specific cell wall invertase (INCW2), which is entirely BETL-specific in its cellular localization (Cheng et al., 1996). Incoming sucrose to a sink tissue such as developing seed is irreversibly hydrolyzed by INCWs to glucose and fructose that is critical for numerous metabolic and signaling functions. In maize endosperm, the INCW2 is spatially and temporally the first enzyme to metabolize sucrose. Homozygous mn1 mutant is non-lethal due to a residual low level (<1% of the total activity) of INCW activity by the co-ortholog, Incw1 (Chourey et al., 2006). Not surprisingly, the mn1 mutant is associated with changes at both morphological (Miller and Chourey, 1992) and cellular (Vilhar et al., 2002) levels, which include retarded development of wall-in-growths (WIGs)—labyrinth-like growth in plasma membrane area believed to be essential to transport capacity of the BETL and the normal development of seed (Kang et al., 2009). The mutant is also associated with an altered IAA homeostasis (LeClere et al., 2008, 2010) and with greatly altered sugar metabolism, especially in the basal region that shows increased sucrose levels and greatly reduced hexose sugars due to its INCW2-deficiency (LeClere et al., 2010; Chourey et al., 2012). Reductions in both IAA and hexose sugars that are signaling molecules led to changes in the expression of several genes related to sucrose-starch and sucrose-energy metabolism in the mn1 mutant (Chourey et al., 2012). Xiong et al. (2011) reported 454 transcriptome sequencing of cDNAs to show 2473 unique sequences from Mn1 and mn1 BETLs. Functional annotation and categorization analyses of these cDNAs led them to conclude high abundance of transcripts related to mitochondrial activity, alkaloid biosynthesis, and various signaling processes of seed development. Transcriptomic studies however do not often provide a true representation of protein abundance due to the well-known phenomenon of poor concordance between RNA and the corresponding proteins as shown in seed filling in Arabidopsis (Hajduch et al., 2010).
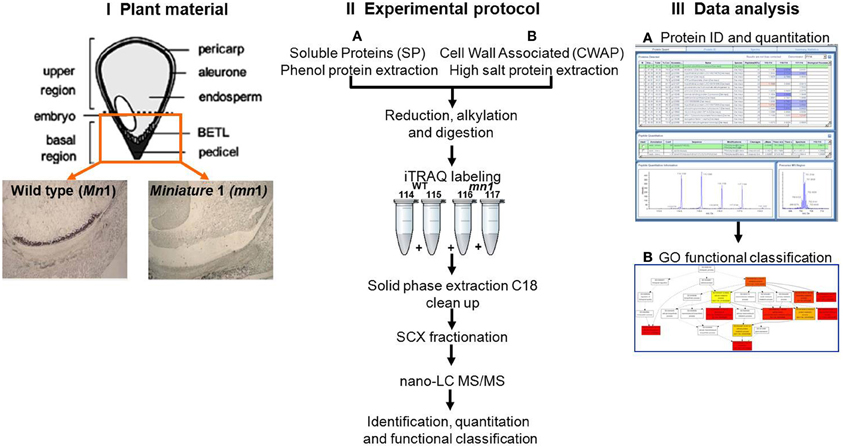
Figure 1. Schematic experimental work flow: (I) Plant materials of Mn1 (wild type) and mn1 mutant enriched BETL regions; (II) SPs and CWAPs sample preparation, iTRAQ two-dimensional LC-MS/MS; and (III) data analysis.
The objectives of this study are 2-fold: (1) to analyze global proteome changes in the basal region of 12 DAP endosperm (i.e., BETL enriched) of the mn1 mutant relative to the Mn1 to describe or catalog proteins that may be metabolically co-regulated in response to the invertase deficiency. Reduced hexose levels may also activate many genes associated with untranslated protein response (UPR) stress. (2) In addition to soluble proteins (SPs), we also examined ionically-bound proteins presumably enriched for cell wall associate proteins (CWAPs). Because of the many cellular level changes in the mn1 basal endosperm (Kang et al., 2009) (most notably the changes in the WIG, which is predominantly comprised of initial primary cell wall and secondary cell wall formation during BETL maturation), we hypothesize that there will be interesting changes in the profiles of proteins associated with cell wall metabolism.
Materials and Methods
Plant Materials and Chemicals
Immature maize (Zea mays L.) kernels of Mn1, and mn1 (Cheng and Chourey, 1999) in the W22 inbred line were harvested at 12 days after pollination (DAP). All plants were grown in the field and were self- or sib-pollinated. At the time of harvest kernels were individually excised from the ear with a paring knife, taking care to include undamaged base (pedicel) of each kernel. Excised kernels were flash frozen in liquid nitrogen and stored at −80°C until analysis. After removing embryos of each kernel, we used the basal 1/3 end of the endosperm because it is specifically enriched in the BETL cells, the sole site of the Mn1 expression and also a major zone for sucrose turn-over reactions, as discussed previously (LeClere et al., 2008). Chemicals were purchased from Fisher Scientific Inc., USA unless otherwise stated.
Soluble Protein Extraction
A total of four biological samples, two each of the Mn1 and mn1 genotypes, and each sample comprised of 5 g of fresh tissue of basal 1/3 endosperm was dissected-out for SP extractions according to a previous method reported by Hurkman and Tanaka (1986) with minor modifications. Care was taken to save aliquots of the same kernel samples for the RNA analyses described below. Each frozen sample was ground into a fine powder with a pre-chilled mortar and pestle. A total of 3 mL of extraction buffer (0.1 M Tris-HCl pH 8.8, 10 mM EDTA, 0.2 M DTT, 0.9 M sucrose) and 3 mL of saturated phenol were added to homogenize the sample; and to extract proteins for 2 h at room temperature in constant agitation. The mixture was then centrifuged at 5000× g for 10 min at 4°C. The top clear phenol phase was removed and collected in a fresh tube. The remaining pellet was re-extracted with 3 mL buffered phenol solution and centrifuged again to recover the top clear phenol phase and combined with the previous one. The supernatant was precipitated with 5 volumes of ice cold 0.1 M ammonium acetate in 100% methanol overnight and centrifuged at 20000× g for 20 min at 4°C. The supernatant was discarded and the pellet was washed twice with 0.1 M ammonium acetate in 100% methanol, then washed twice with cold 80% acetone and finally with 70% of ethanol. The pellet was solubilized in a buffer containing 7 M urea, 2 M thiourea, 4% (w/v) CHAPS and 40 mM DTT. The samples were treated with benzonase (Novagen, Gibbstown, NJ) for 30 min and then ultracentrifuged at 34000 rpm for 30 min at 15°C. Supernatant was collected and 50 μ L aliquots were kept at −80°C until use.
Cell Wall Associated Protein Extraction
In addition to the SP extraction, a high salt extraction was performed according to Cheng et al. (1996), to obtain cell wall associated proteins (CWAPs). Briefly, frozen kernels were homogenized in extraction buffer (50 mM Tris-maleate, pH 7.0 and 1 mM DTT) in a 1:10 (w/v) ratio by using a cooled mortar and pestle. The homogenate was centrifuged at 14000× g for 10 min. The supernatant was discarded and pellet was washed three times in the extraction buffer followed by a final resuspension in extraction buffer containing 1 M NaCl in a 1:2 (w/v) ratio. The salt suspension was vortexed for 30 min at 4°C and then centrifuged at 14000× g for 10 min. The supernatant was recovered and precipitated in a ratio 1:5 with 100% cold acetone overnight. Protein was recovered by centrifugation at 20000× g, 4°C for 30 min. The pellet was washed three times with cold acetone, followed by solubilization and storage as described for the SPs samples.
iTRAQ Labeling and LC-MS/MS
The SPs and CWAPs samples were quantified using an EZQ Protein Quantitation kit (Invitrogen; USA) (Zhu et al., 2010). A total of 100 μg of total protein from each sample was acetone precipitated. The samples were dissolved in 1% SDS, 100 mM triethylammonium bicarbonate, pH 8.5; then reduced, alkylated, trypsin (Promega, USA) digested and labeled according to manufacturer's instructions (ABsciex Inc. USA). The replicates of Mn1 samples were labeled with 114 and 115, whereas the replicates of mn1 samples were labeled with 116 and 117. Extra labels were quenched by adding 100 μ L of ultrapure water and left at room temperature for 30 min. After quenching, samples were mixed together and dried down in speedvac. The peptide mixtures were cleaned up with C18 spin columns according to manufacturer's instructions (ABsciex Inc. USA). The samples were then dissolved in strong cation exchange (SCX) solvent A (25% v/v ACN, 10 mM ammonium formate, pH 2.8) and injected to a Agilent HPLC 1100 system using a polysulfoethyl A column (2.1 × 100 mm, 5 μm, 300 Å, PolyLC, Columbia, USA). The peptides were eluted at a flow rate of 200 μ L/min with a linear gradient from 0 to 20% solvent B (25% v/v ACN, 500 mM ammonium formate) over 80 min, followed by a ramping up to 100% solvent B in 5 min and holding for 10 min. The peptides were detected at 214 nm absorbance and a total of 34 fractions were collected. Two independent iTRAQ experiments were conducted for the SPs and CWAPs samples.
Each SCX fraction was lyophilized in a speedvac and the resuspended in loading buffer (3% acetonitrile, 0.1% acetic acid, 0.01% TFA) and loaded onto a C18 capillary trap cartridge (LC Packings, USA) and then separated on a 15 cm nanoflow analytical C18 column (PepMap 75 μm id, 3 μm, 100 Å) at a flow rate of 200 nL/min on a Tempo nanoflow multidimensional LC system (ABsciex, USA). Solvent A composition was 3% ACN v/v, 0.1% acetic acid v/v; whereas solvent B was 97% ACN v/v, 0.1% acetic acid v/v. Peptides separation was performed with a linear gradient from 3 to 40% of solvent B for 2 h, followed by an increasing to 90% of solvent B in 10 min and hold for 10 min. Eluted peptides were introduced by ESI into a quadrupole time-of-flight mass spectrometer (QSTAR Elite MS/MS system, ABsciex Inc., USA). The source nebulizing gas and curtain gas were set at 12 and 20, respectively. Ion spray voltage was 2200V and the temperature was 80°C. The data were collected in the Information depended acquisition mode. A TOF-MS scan was done (m/z 300–1800, 0.25 s) automatically followed by the MS/MS scan (m/z 50–2000, 30–2000 ms) of the three abundant peptide ions per cycle. A 60 s exclusion was set for the former target ions. Automatic collision energy, automatic MS/MS accumulation and dynamic exclusion were selected in Analyst QS software.
Protein Identification, Quantification, and Functional Classification
The identification and quantification of proteins were performed using ProteinPilot™ Software 4.0. The database was UniProt for maize (March 29, 2011; 84916 entries). The searching parameters were set as iTRAQ peptide label, cysteine alkylation with methyl methanethiosulfonate, trypsin digestion, identification focus for biological modifications and BIAS correction. The unused score threshold was set to >1.3 (equivalent to 95% confidence or better) and p-value < 0.05 to ensure that quantitation was based on at least three unique peptides. The proteins were considered for validation if they were significant in both independent experiments.
For functional classification, the protein lists were analyzed according to the Gen Ontology (GO) using the Singular Enrichment Analysis (SEA) tool (http://bioinfo.cau.edu.cn/agriGO/) (Du et al., 2010) for biological, molecular and cellular function classification, considering a background database list of Zea mays and the Plant Slim algorism available in the agriGO. The results were exported directly to REVIGO (Supek et al., 2011) in order to visualize the clusters of the enriched GO terms. The KEGG encyclopedia was used for the identification of pathways (http://www.genome.jp/kegg) (Kanehisa et al., 2012).
RNA Extraction, cDNA Synthesis, and Quantitative Real-Time PCR (qRT-PCR)
All RNA studies were done on the same sample papers as those used in the above iTRAQ analyses. RNA extraction, cDNA synthesis, and qRT-PCR were done as described previously (Chourey et al., 2010; LeClere et al., 2010). Briefly, total RNA was extracted from each sample of 100 mg tissue (a total of four samples, two for each genotype) and treated with DNA-free DNase I (Ambion, TX, USA). Purified RNA samples were quantified using a Nanodrop ND-4000 Spectrophotometer (Thermo Scientific, DE, USA) and evaluated using an Agilent 2100 Bioanalyzer (Agilent Technologies, CA, USA). First-strand cDNA was synthesized with 5 μg of purified RNA using reverse transcriptase (RT) Superscript III (Invitrogen, CA, USA). qRT-PCR assays for each target were performed via MyiQ ver. 2.0 with iQ ver. 5.0 (Bio-Rad, CA, USA), using the primers (Table S1) and SYBER green dye method as previously described (Koh et al., 2010). Our previous studies have shown that absolute q-PCR method, as used here, is a reliable estimate of gene expression based on several genes and an excellent concordance between the low resolution Northern blot hybridization and absolute q-PCR values (Chourey et al., 2010; LeClere et al., 2010).
Results and Discussion
Identification of Soluble Proteins (SPs) and Cell Wall Associated Proteins (CWAPs) in BETL Enriched Regions
One of the main functions of the basal part of maize endosperm is to acquire and transfer of nutrients and water from maternal plant to developing seed through the BETL localized in the basal region. The lack of Mn1-encoded INCW2 protein in the mn1 BETL has led to many pleiotropic changes in the mutant relative to the Mn1 (Chourey et al., 2012). The 12 DAP stage used in this study is ideal as it marks the highest levels of INCW2 activity (Cheng et al., 1996), and a major point of developmental and metabolic switch from cell division, cell elongation phase to the initiation of storage phase which is expected to be associated with proteomic changes in the Mn1 and the mutant mn1 endosperm. Here we have used a multiplex iTRAQ approach in the systematic identification and quantification of the expression levels of both soluble and CWAPs in the two genotypes, Mn1 and mn1. The experimental strategy based on the use of LC-MS/MS and the GO functional classification is depicted in the Figure 1. We identified a total of 1168 SPs in two independent experiments with a 1.3 unused score threshold (95% confidence) (Table S2). A total of 437 proteins were identified in both experiments representing a 38% overlap, and there were 401 (34%) and 330 (28%) unique proteins for experiments 1 and 2, respectively (Figure 2A). For CWAPs, there were 1567 identifications in two independent experiments (Table S2). A total of 662 proteins were identified in both experiments, representing a 42% overlap, and there were 482 (31%) and 423 (27%) unique proteins identified in experiments 1 and 2, respectively (Figure 2B). When comparing SPs and CWAPs protein identifications, only 36% of the IDs were shared between the two sample types, suggesting the complementary nature of the different extractions (Tables S2, S3). Reproducibility of protein identification is known to be affected in replicates of iTRAQ experiments, and any given run may identify only a subset of relevant peptides in a complex mixture causing variation among analytical runs (Lee and Koh, 2011; Owiti et al., 2011). The overlap showed for SPs, CWAPs, and in between the two independent replicate experiments was comparable to previous reports (Chen et al., 2007) that show the range of 25–40% in similar iTRAQ analyses.
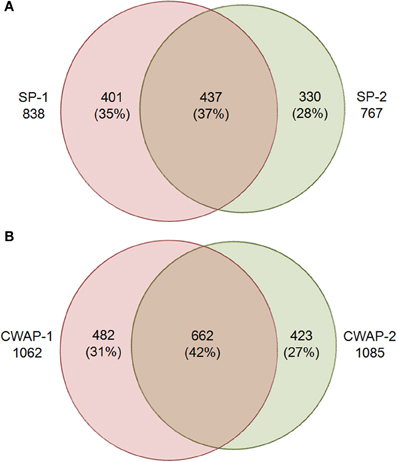
Figure 2. Venn diagram showing the overlap of protein identities in two biological replicates for (A) soluble proteins (SPs), SPs-1 and SPs-2 are biological replicates; and (B) cell wall associated proteins (CWAPs) in two biological replicates.
Functional Annotation of Identified Proteins
In order to understand the functions of the identified SPs and CWAPs and their related processes, a Gene Ontology (GO) classification was performed using the agriGO Single Enrichment Analysis (SEA) tool (http://bioinfo.cau.edu.cn/agriGO). A plant GO slim type was used for the SPs in which 984 (84%) of the 1168 proteins were annotated. The results showed 14 GO terms enriched for biological process, 5 GO terms for molecular function, and 17 GO terms for cellular component (Table S4). In general, the GO terms that were significantly enriched are related to cellular and metabolic processes. Specifically those belonging to primary and secondary metabolic process, catabolic process, carbohydrates metabolic process and cellular homeostasis (Figure 3A) that could be attributed to the INCW2-deficiency in the basal region of mn1 seeds. Following the same strategy as in the analysis of SPs, a total of 1034 (83%) entries of the 1567 CWAPs were annotated; i.e., 12 GO terms enriched for biological process, 5 GO terms for molecular function, and 18 GO terms for cellular component (Table S5). The terms for biosynthetic process and primary metabolic process were not found in the CWAPs (Figure 3B). Similar proteomic studies in developing grains of rice also show the predominant role of carbohydrate metabolic processes in seed development (Lee and Koh, 2011).
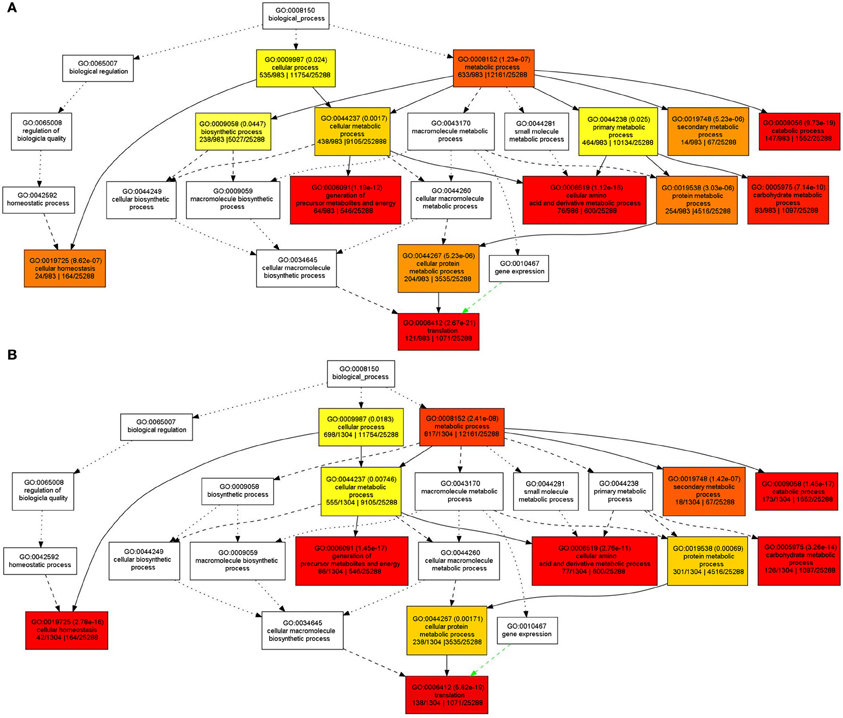
Figure 3. GO classification of enriched biological functions in (A) SPs and (B) CWAPs with agriGO tool kit.
GO classification results are usually displayed as a tree form, in which if one of the end point of the branch is enriched, the previous nodes to the branch will be enriched as well, leading to some redundancy. The REVIGO tool was used to analyze the GO enriched terms in order to reduce the redundancy and allow visualization of the most informative common ancestor nodes. Figure S1 shows the enriched biological functions in the SPs and CWAPs. Interestingly, both fractions are strikingly similar. With the exception of biological process and primary metabolic process in SPs, both analyses revealed the translation process as the main one affected by the mutation and directly related to the cellular homeostasis process (Figure S1A,B). These results suggest that multiple biological processes were affected in the mn1 mutant and the analysis of both fractions suggests a complementary nature of the two protein fractions in the basal endosperms.
Differentially Expressed Proteins in mn1 Maize Basal Endosperm
Differential expression of proteins in any two independent experiments by iTRAQ is considered statistically significant if (i) they show an average change of 20% or greater, (ii) a p-value less than 0.05, and (iii) obtained from measuring at least three unique peptides to ensure significant quantitative changes (Ali et al., 2010; Zhu et al., 2010). With these criteria, we retrieved a total of 100 SPs that were differentially expressed; among which 15 showed decreased and 85 showed increased levels in the mutant as compared to the Mn1 (Table 1). Among the CWAPs, a total of 91 proteins were differentially expressed, of which 33 showed decreased and 58 showed increased levels in the mutant as compared to the Mn1 (Table 2). Of the total 191 differentially expressed proteins in both SPs and CWAPs samples, only 15 proteins were common to both fractions (Table S6), suggesting that extraction protocol was rigorous in allowing most of the proteins to be fractionated. It should be noted that the salt extraction protocol was effective in releasing ionically bound CWAPs. All shared proteins exhibited similar expression ratios except for B4G0K5, which was decreased in the SPs and increase in the CWAPs. This protein has no known functions and no annotations could be found to assign or hypothesize its function. It is not surprising that certain CWAPs were also released into the soluble fraction during the homogenization in low salt concentration of buffer, as shown previously for the INCW2 (Carlson and Chourey, 1999).
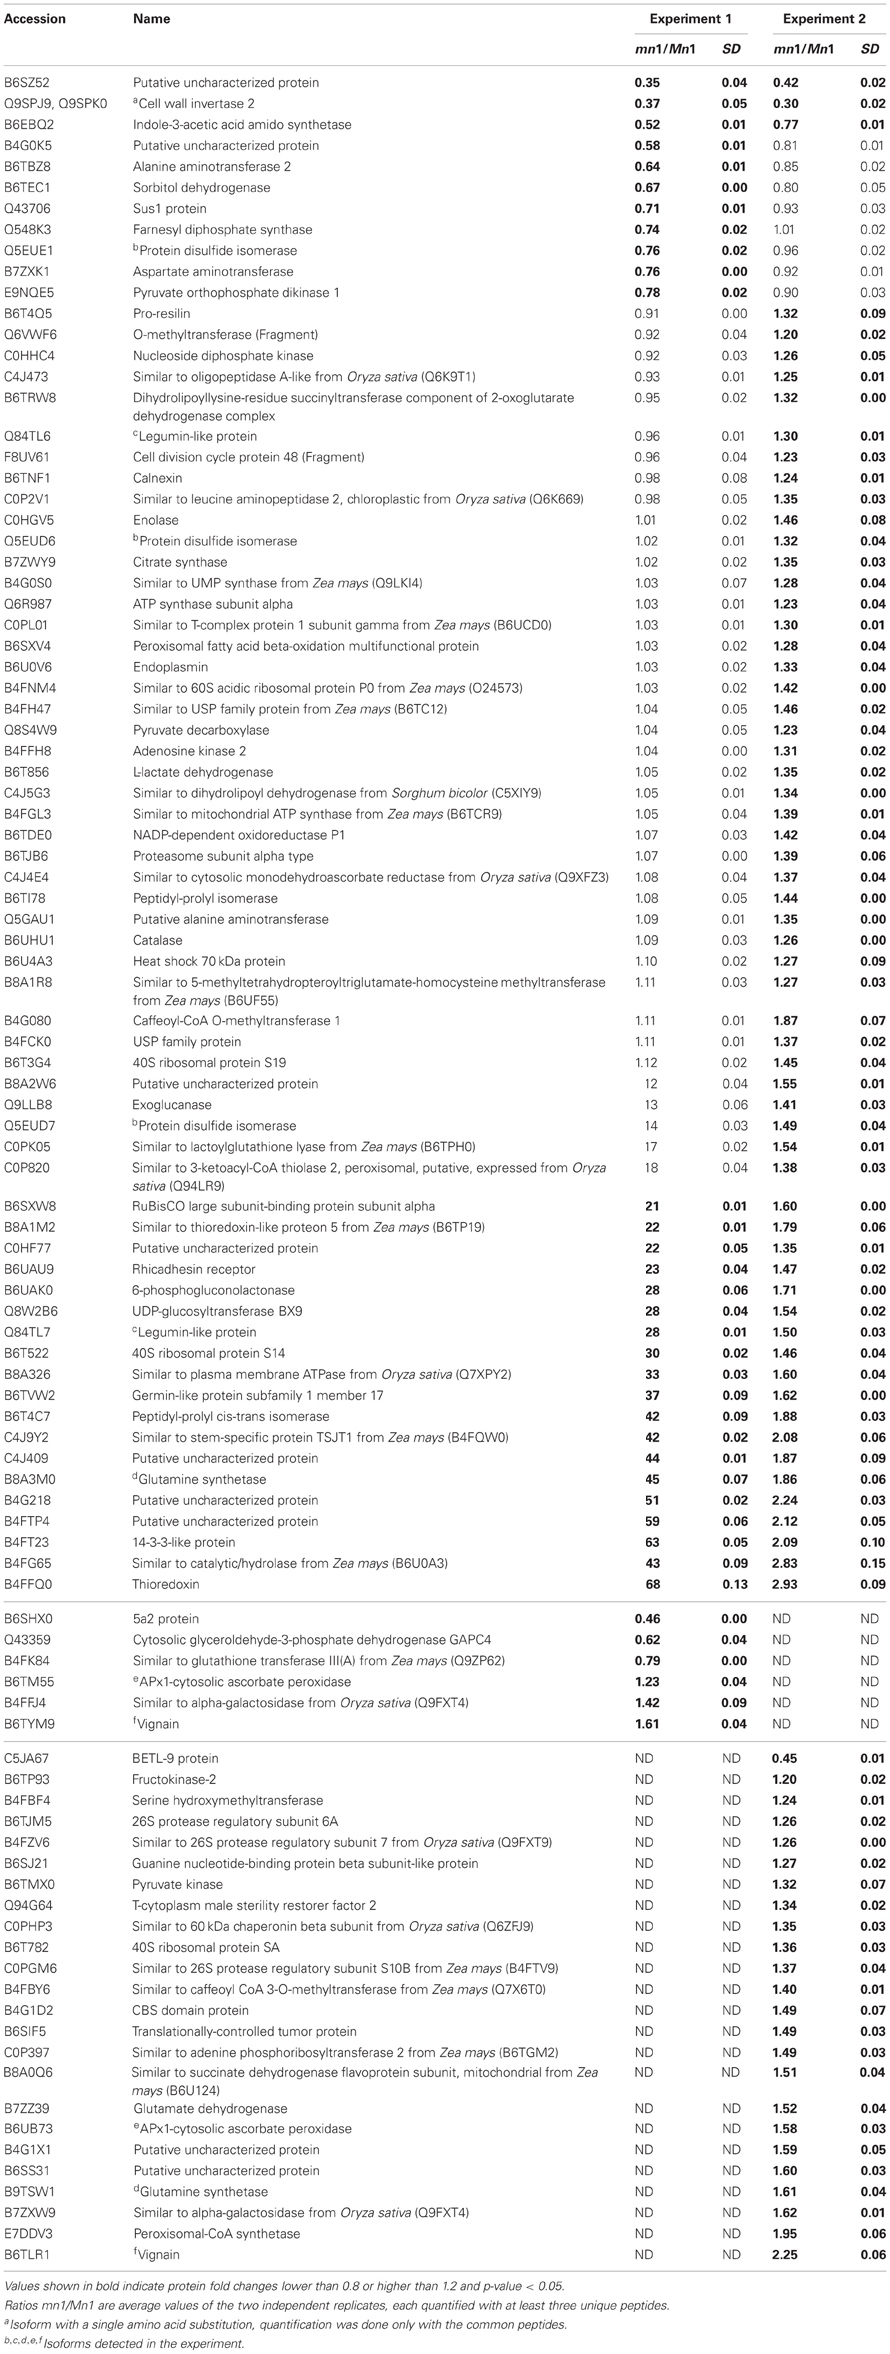
Table 1. Proteins identified as differentially expressed from iTRAQ LC-MS/MS of soluble proteins (SPs).
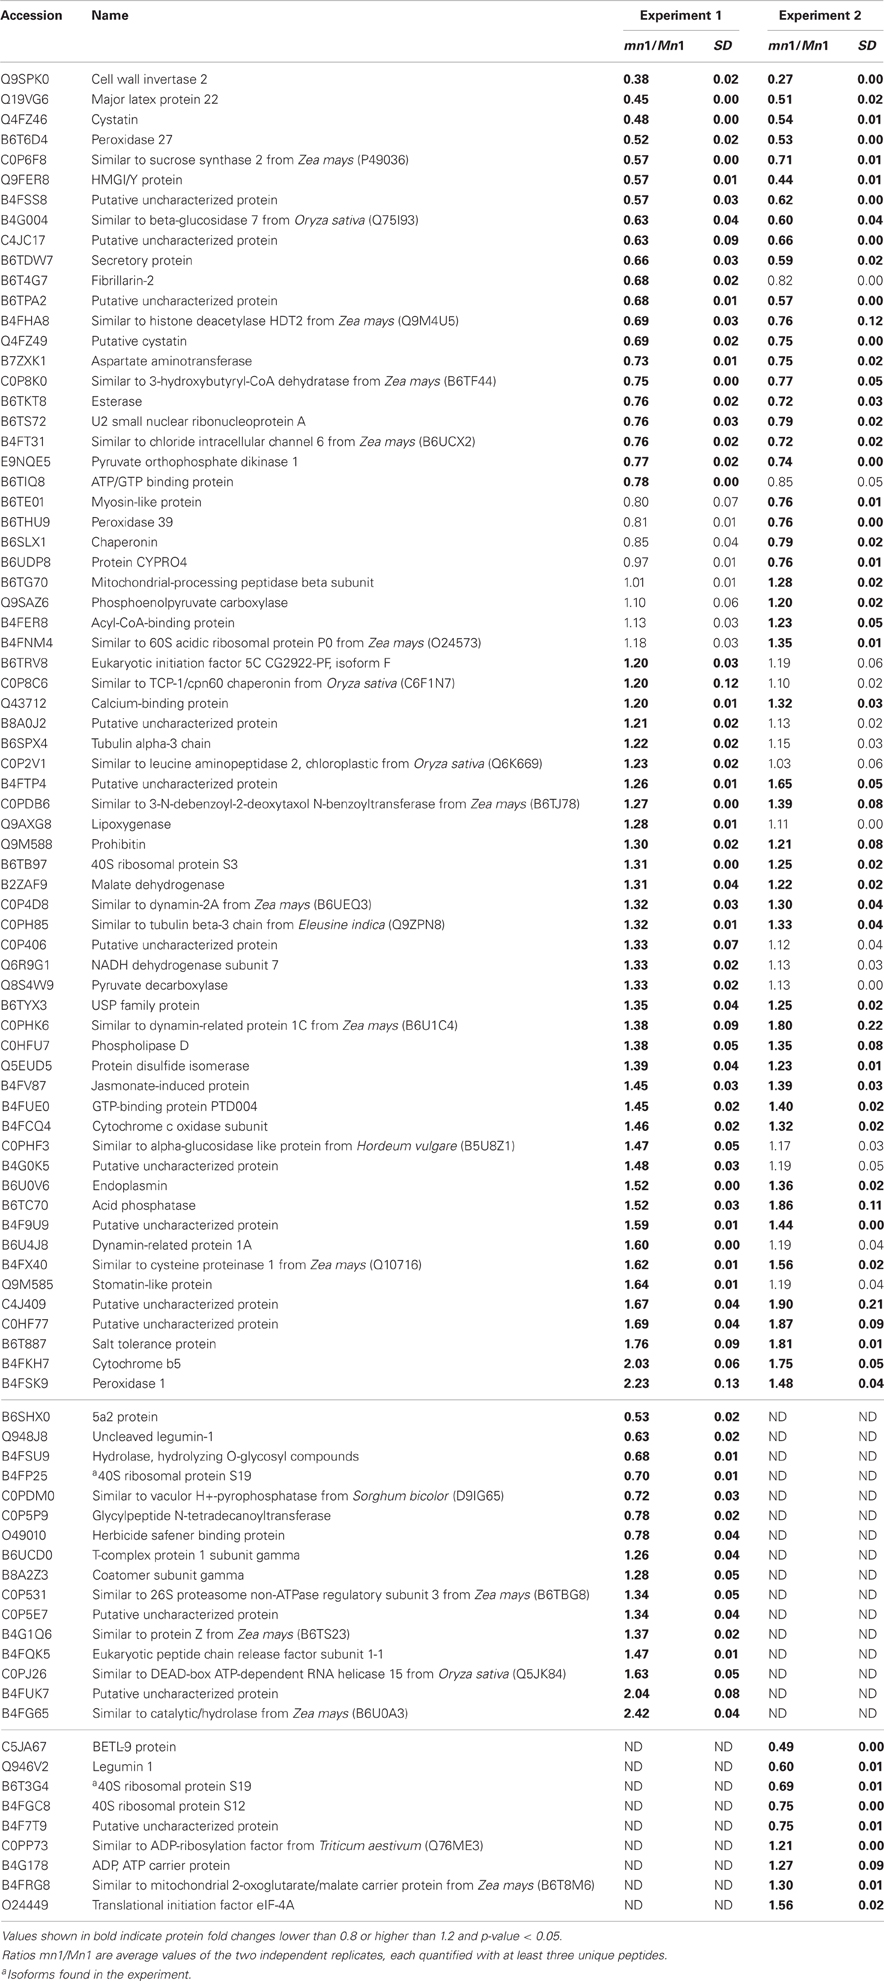
Table 2. Proteins identified as differentially expressed from iTRAQ LC-MS/MS of cell wall associated proteins (CWAPs).
Table 3 shows GO annotations for SPs that were differentially expressed in the two genotypes. It includes proteins in catabolic process, cellular homeostasis and carbohydrate metabolism as biological functions through SEA described in the Materials and Methods. The differentially expressed CWAPs did not show any significant enrichment for biological function (Table 3). In general, the main processes that are affected due to the lack of INCW2 are related to the compensation of the energy supply via the carbohydrate metabolic process and establishment of normal activity in the cell through the catabolic process. Similar proteomic study in developing rice grain shows that carbohydrate metabolic process, transport, and localization are the main cellular events (Lee and Koh, 2011).
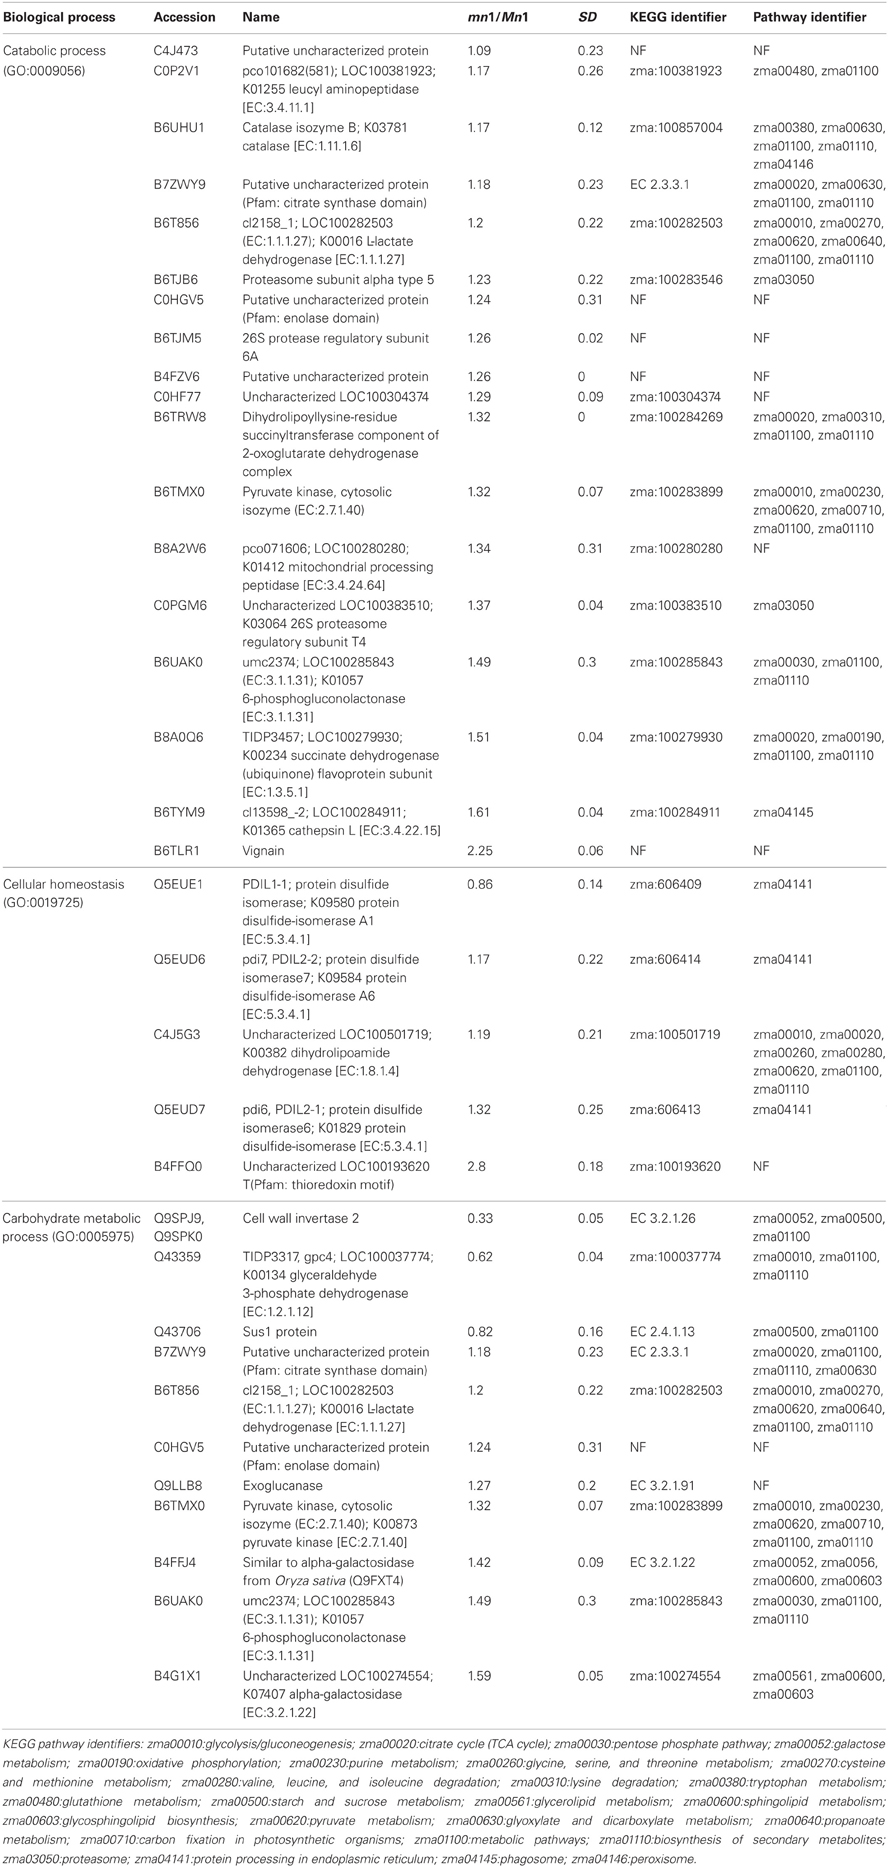
Table 3. Differentially expressed SPs with their predicted biological functions.
The KEGG mapper (http://www.genome.jp/kedd/mapper.html) was used to investigate the metabolic pathways of proteins grouped in catabolic process, cellular homeostasis and carbohydrate metabolic process. As shown in Table 3, the catabolic process involves mainly proteins that are related to the biosynthesis of secondary metabolites, cellular homeostasis including enzymes related to protein processing in ER and carbohydrate metabolic process; and glycolysis and gluconeogenesis processes. For the catabolic process, increased levels of proteins were related to proteasome, as well as proteases such as 26S protease regulatory subunit 6A, mitochondrial processing peptidase, and K01365 cathepsin L. Proteome and transcriptome studies in developing seeds of Medicago truncatula show transcriptional up-regulation for proteins that may play a role in protein degradation either during reserve accumulation or maturation phase (Gallardo et al., 2007). Similar proteome analyses by (Méchin et al., 2007) reported an important function of turnover of proteins that was associated with the switch from growth and differentiation to storage in maize. In mn1 seeds, the presence of proteases in an early stage of development suggests important protein turnover and processing taking place in the BETL region. Interestingly, a leucine aminopeptidase, known to participate in the glutathione metabolism, was increased in the mutant. These data indicate a role of potential redox regulation mediated by glutathione in the BETL enriched basal endosperm.
The cellular homeostasis group was mainly composed of protein disulfide isomerases (PDIs), which showed increased ratios in the mn1 when compared with the Mn1. Genome-wide search has shown 22 PDI-like sequences in maize (Houston et al., 2005), and the PDIs are known to act as molecular chaperons that contain thioredoxin domains critical in the formation of proper disulfide bonds during protein folding. Thus, the increased abundance of PDI protein in the mn1 mutant was consistent with its proposed role in ER stress resulting from reduced Golgi in the BETL of the mn1 than the Mn1 (Kang et al., 2009). Interestingly, an uncharacterized protein with a thioredoxin motif (B4FFQ0) (Table 3) showed a 2.8-fold increase in mn1, suggesting an up-regulation of the gene essential in the folding of new proteins as well as in response to the oxidation/reduction generated by metabolic stress in the mutant lacking INCW2 (Freedman et al., 1994; Houston et al., 2005). These two groups of proteins may have complementary functions in response to the lack of glucose/fructose in the mn1 basal endosperm, described previously (LeClere et al., 2010; Chourey et al., 2012).
Carbohydrate metabolism and glycolysis process are highly regulated in seeds. For examples, Gallardo et al. (2007) reported in M. truncatula seeds, the genes involved in glycolysis are differentially expressed in seed development, meanwhile those involved in starch synthesis are transiently expressed in seed filling. In the case of the carbohydrate metabolic process group, cell wall invertase 2 was reduced in the mn1, as expected. In addition, Sus1 protein was also decreased in the mn1. Although the conversion of sucrose to hexose via SUS uses half of the ATP in comparison to the invertase route, the SUS reaction is reversible and is sensitive to the hexose phosphate levels (Barratt et al., 2009), suggesting a possible connection between SUS and invertase in maize BETL region. Physiological roles of these two sucrolytical enzymes are well studied in the transfer cells of developing seeds in cotton (Ruan Y-L Llewellyn and Furbank, 2003; Pugh et al., 2010) and maize (Kang et al., 2009). The cytosolic glyceroldehyde-3-phosphate dehydrogenase GAPDH in the mn1 was reduced by one half, suggesting low flux into the glycolysis pathway due to the lack of glucose/fructose in the BETL region (LeClere et al., 2010; Chourey et al., 2012). Another level of regulation can be related to the thioredoxin-like protein. Reoxidation of glyceroldehyde-3-phosphate dehydrogenase through oxidized thioredoxin seems to be a conserved mechanism for protecting the cells from oxidative stress. GAPDH catalyzes the reversible oxidative phosphorylation of glyceraldehide-3-phospate to 1, 3-biphosphoglycerate. A reduction in its activity results in the accumulation of dihydroxyacetone phosphate, which triggers the repression of glycolysis-related enzymes and certain enzymes of the Pentose Phosphate pathway (PPP) are induced as well. PPP enzymes are critical in the maintenance of cytoplasmic NADPH necessary for the antioxidant systems such as glutathione and thioredoxin (Ralser et al., 2007; Neilson et al., 2011). In plants, the GAPDH enzyme is inactivated to stop consumption of ATP for starch synthesis, and starch hydrolysis takes place for producing fuel for the plants (Nelson and Cox, 2008). A 6-phosphogluconolactonase like protein [EC: 3.1.1.31] (B6UAK0) (Table 3), known to participate in the PPP according to the KEGG, result was increased, supporting the hypothesis of protection from oxidative stress in the mn1 kernel.
Secretory Proteins in the BETL
As indicated previously, one of the main functions of the basal part of maize endosperm is acquisition and transfer of nutrition and water from maternal plant to developing seed. As in all transfer cells, the main feature of the BETL is the labyrinth-like WIG that increases the plasma membrane area comprised of cellulosic molecules, and enhances transport capacity in these cells (Pugh et al., 2010). In maize, these cells are particularly rich in endoplasmic reticulum (ER), Golgi, mitochondria, and secretory functions. In fact, many of these functions are greatly altered in the mn1 mutant due to the loss of the INCW2 (Kang et al., 2009). Therefore, we focused here in the identification of some of the proteins that showed the highest probability of localization in the secretory pathway (Table 4). Not surprisingly, the Mn1-encoded INCW2 was found with the highest score as it has an N-terminal secretory signal peptide (Taliercio et al., 1999). The results of the immunogold labeling of the ER and the secretory organelles are consistent with the notion that INCW2 is synthesized by ER-bound ribosomes and delivered to the WIG via the Golgi and TGN compartments (Kang et al., 2009).
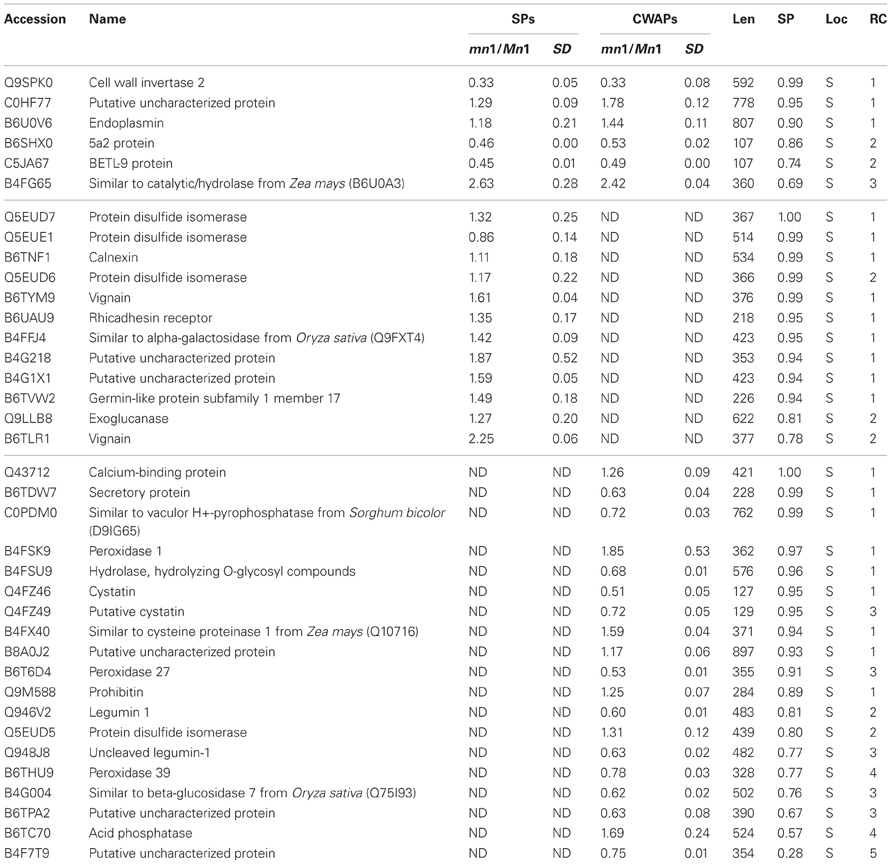
Table 4. Proteins predicted to have a signal peptide for the secretory pathway using TargetP.
Of the 37 secretory proteins listed in the Table 4, only the INCW2 and the BETL9 are previously reported to be associated with the BETL. Although the BETL9 is expressed abundantly at the RNA level (Gómez et al., 2009 and Table 5) and was greatly reduced in the mn1 at both RNA (Xiong et al., 2011) and protein levels, nothing is known about its function in seed development. Calnexin (B6TNF1), endoplasmin (B6U0V6), calreticulin (Q43712), PDIL1-1 (Q5EUE1), PDI7 (Q5EUD6), PDI8 (Q5EUD5), and a putative uncharacterized protein with a domain of HSP70 (B8A0J2) are actively involved in the protein processing of ER pathway. There were some proteins that participate in the protein recognition by the luminal chaperones, lectin related proteins and terminal misfolded targeting protein to the proteasome (Table S7). Prohibitin (Q9M588) was identified with high probability of localizing to the secretory pathway, with ratios of 1.28 and 1.32 in the two experiments. This protein is predicted to function in mitochondrial processes including protein processing, respiratory chain function and mitochondrial DNA organization (Van Aken et al., 2010). Cystatins (Q4FZ46) are proteins that inhibit cysteine proteases by binding of cystatins, and are believed to be involved in multiple functions, including biotic and abiotic stress tolerance, programed cell death, and the regulation of various metabolic processes through processing and degradation of various proteins (Massonneau et al., 2005). Recently, van der Linde et al. (2012) demonstrated that cystatin suppresses host immunity by inhibiting apoplastic cysteine proteases that play a pivotal role in defense signaling in maize. Clearly, detailed functional characterization of these novel secretory proteins in basal endosperms is an exciting future direction of research.
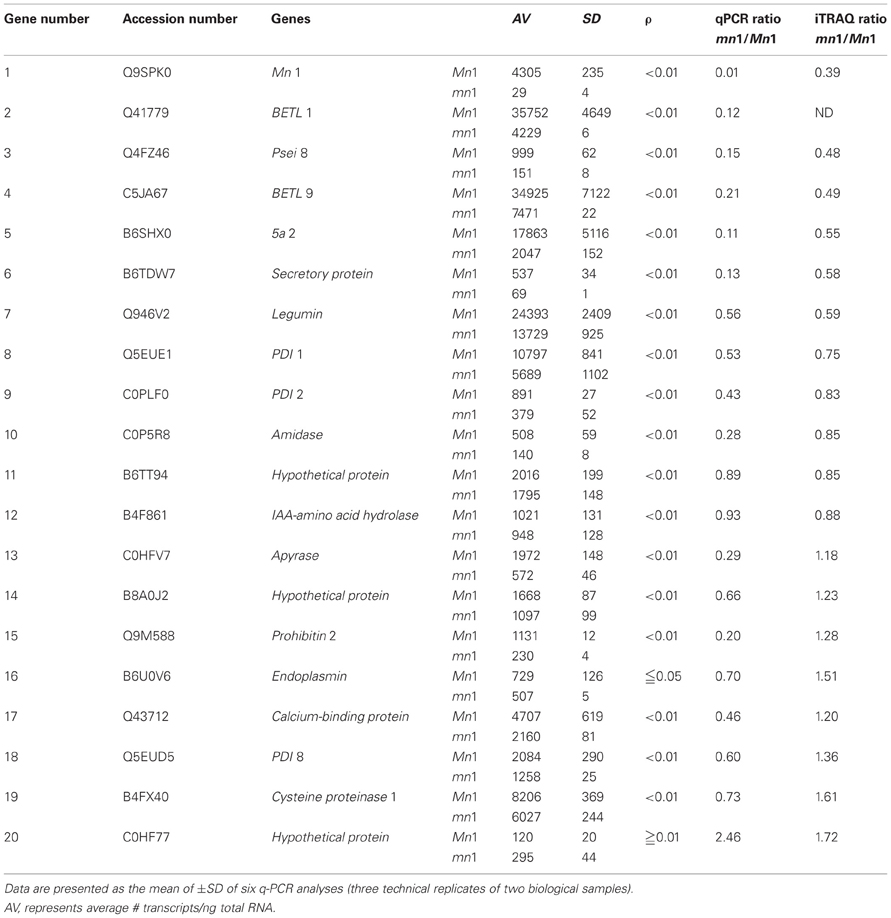
Table 5. A comparative profile of RNA and protein levels of select proteins in the Mn1 and mn1 basal endosperms.
RNA and Protein Abundance of Select Proteins in the Basal Endosperm
Our previous studies have established that the Mn1 encoded INCW2 as specific biomarker in the BETL, and its expression is greatly reduced in the mn1 mutant (Cheng et al., 1996; Chourey et al., 2006). Our proteomic data here (Tables 1, 2) are consistent with the previous results. Transcriptome analyses of the BETL led to a large catalog of genes that showed transcript abundance in the Mn1 basal endosperm (Xiong et al., 2011). Table 5 shows results from a comparative analysis of expression of a few select genes at RNA level by q-PCR and by iTRAQ (Table 1) in these two genotypes. There was a qualitative concordance between RNA and the cognate protein levels for the first 10 of the 20 genes that showed mn1 to Mn1 ratios of <1.0. The ratios between mn1:Mn1 at both levels of expression were similar, <1.0, but the quantitative values were divergent. In contrast, the expression levels of the other seven genes (13–19) were highly divergent. The qPCR values were <1.0, but the iTRAQ ratios were >1.0. Only one gene (#20) showed a higher ratio in qPCR results than in the iTRAQ results. Two genes, #11 and #12, showed similar ratios of transcript and protein levels in the two genotypes. Overall, our data showed a high level of non-concordance between RNA and protein level expression. Such discrepancy is also described previously; Hajduch et al. (2010) showed an overall concordance of only 56% between RNA and protein levels in developmental seeds of Arabidopsis. It is clear that changes in RNA abundance may not reflect protein level changes due to posttranscriptional and posttranslational regulatory processes in the cells (Gallardo et al., 2007; Lan et al., 2011).
Conclusions
Transfer cells are ubiquitous in plants, fungi, and animal cells, and are well recognized for their role in solute acquisition and transport functions. Emerging evidence suggests that BETL plays a critical role in seed development (Kang et al., 2009; Pugh et al., 2010; Costa et al., 2012). Transcriptomic analyses in maize BETL identified important genes related to mitochondrial and stress related functions (Xiong et al., 2011). As shown in this study, transcriptomic changes do not directly translate into the changes and functions of proteins, which determine phenotypes. Here we provide information at the proteome level on the proteins and processes in BETL enriched tissues that are targets of the Mn1 mutation.
Using iTRAQ LC-MS/MS, we have identified over 2500 proteins and more than 130 differential proteins in the BETL enriched basal endosperm of mn1. A large array of diverse functions, including energy and carbohydrate metabolism, secondary metabolism and defense related processes were revealed. Highly regulated protein folding/degradation and redox control may function to maintain the cellular homeostasis. Furthermore, the levels of many secretory proteins were greatly altered in the mn1. These results have not only improved our understanding of molecular mechanisms underlying the mn1 phenotype, but also laid a foundation for further studies on characterizing novel proteins. Future studies on many of these proteins will greatly enhance our knowledge on resource allocation and tolerance to biotic and abiotic stress in developing seeds.
Conflict of Interest Statement
The authors declare that the research was conducted in the absence of any commercial or financial relationships that could be construed as a potential conflict of interest.
Supplementary Materials
The Supplementary Material for this article can be found online at: http://www.frontiersin.org/Plant_Physiology/10.3389/fpls.2013.00211/abstract
Figure S1 | Interactive graph for the analysis of enriched biological functions in (A) SPs and (B) CWAPs with REVIGO tool kit.
Table S1 | Gene accession numbers and the primers for genes investigated in the present study.
Table S2 | Total protein ID of soluble proteins.
Table S3 | Total protein ID of cell wall associated proteins.
Table S4 | agriGO results for soluble proteins.
Table S5 | agriGO results for cell wall associated proteins.
Table S6 | Shared differentially expressed proteins in SPs and CWAPs.
Table S7 | KEGG identifiers for secretory proteins from TargetP.
References
Ali, N. A., McKay, M. J., and Molloy, M. P. (2010). Proteomics of Smad4 regulated transforming growth factor-beta signaling in colon cancer cells. Mol Biosyst. 6, 2332–2338. doi: 10.1039/c0mb00016g
Barratt, D. H., Derbyshire, P., Findlay, K., Pike, M., Wellner, N., Lunn, J., et al. (2009). Normal growth of Arabidopsis requires cytosolic invertase but not sucrose synthase. Proc. Natl. Acad. Sci. U.S.A. 106, 13124–13129. doi: 10.1073/pnas.0900689106
Carlson, S. C., and Chourey, P. S. (1999). A re-evaluation of the relative roles of two invertases, INCW2 and IVR1, in developing maize kernels and other tissues. Plant Physiol. 121, 1025–1035. doi: 10.1104/pp.121.3.1025
Chen, M., Ying, W., Song, Y., Liu, X., Yang, B., Wu, S., et al. (2007). Analysis of human liver proteome using replicate shotgun strategy. Proteomics 7, 2479–2488. doi: 10.1002/pmic.200600338
Chen, S., and Harmon, A. C. (2006). Advances in plant proteomics. Proteomics 6, 5504–5516. doi: 10.1002/pmic.200600143
Cheng, W. H., and Chourey, P. S. (1999). Genetic evidence that invertase-mediated release of hexoses is critical for appropriate carbon partitioning and normal seed development in maize. Theor. Appl. Genet. 98, 485–495. doi: 10.1007/s001220051096
Cheng, W. H., Taliercio, E. W., and Chourey, P. S. (1996). The Miniature1 seed locus of maize encodes a cell wall invertase required for normal development of endosperm and maternal cells in the pedicel. Plant Cell 8, 971–983. doi: 10.1105/tpc.8.6.971
Chourey, P. S., Jain, M., Li, Q. B., and Carlson, S. J. (2006). Genetic control of cell wall invertase in developing endosperm of maize. Planta 223, 159–167. doi: 10.1007/s00425-005-0039-5
Chourey, P. S., Li, Q. B., and Kumar, D. (2010). Sugar–hormone cross-talk in seed development: two redundant pathways of IAA biosynthesis are regulated differentially in the invertase-deficient miniature1 (mn1) seed mutant in maize. Mol. Plant 3, 1026–1036. doi: 10.1093/mp/ssq057
Chourey, P. S., Li, Q. B., and Cevallos-Cevallos, J. (2012). Pleiotropy and its dissection through a metabolic gene Miniature1 (Mn1) that encodes a cell wall invertase in developing seeds of maize. Plant Sci. 184, 45–53. doi: 10.1016/j.plantsci.2011.12.011
Costa, L. M., Yuan, J., Rouster, J., Paul, W., Dickinson, H., and Gutierrez-Marcos, J. F. (2012). Maternal control of nutrient allocation in plant seeds by genomic imprinting. Curr. Biol. 22, 160–165. doi: 10.1016/j.cub.2011.11.059
Du, Z., Zhou, X., Ling, Y., Zhang, Z., and Su, Z. (2010). agriGO: a GO analysis toolkit for the agricultural community. Nucleic Acids Res. 38, 64–70. doi: 10.1093/nar/gkq310
Freedman, R. B., Hirst, T. R., and Tuite, M. F. (1994). Protein disulphide isomerase: building bridges in protein folding. Trends Biochem. Sci. 19, 331–336. doi: 10.1016/0968-0004(94)90072-8
Gallardo, K., Firnhaber, C., Zuber, H., Héricher, D., Belghazi, M., Henry, C., et al. (2007). A combined proteome and transcriptome analysis of developing Medicago truncatula seeds: evidence for metabolic specialization of maternal and filial tissues. Mol. Cell Proteomics 6, 2165–2179. doi: 10.1074/mcp.M700171-MCP200
Gómez, E., Royo, J., Muñiz, L. M., Sellam, O., Paul, W., Gerentes, D., et al. (2009). The maize transcription factor myb-related protein-1 is a key regulator of the differentiation of transfer cells. Plant Cell 21, 2022–2035. doi: 10.1105/tpc.108.065409
Hajduch, M., Hearne, L. B., Miernyk, J. A., Casteel, J. E., Joshi, T., Agrawal, G. K., et al. (2010). Systems analysis of seed filling in Arabidopsis: using general linear modeling to assess concordance of transcript and protein expression. Plant Physiol. 152, 2078–2087. doi: 10.1104/pp.109.152413
Houston, N. L., Fan, C., Xiang, J. Q., Schulze, J. M., Jung, R., and Boston, R. S. (2005). Phylogenetic analyses identify 10 classes of the protein disulfide isomerase family in plants, including single-domain protein disulfide isomerase-related proteins. Plant Physiol. 137, 762–778. doi: 10.1104/pp.104.056507
Hurkman, W. J., and Tanaka, C. K. (1986). Solubilization of plant membrane proteins for analysis by two-dimensional gel electrophoresis. Plant Physiol. 81, 802–806. doi: 10.1104/pp.81.3.802
Kanehisa, M., Goto, S., Sato, Y., Furumichi, M., and Tanabe, M. (2012). KEGG for integration and interpretation of large-scale molecular data sets. Nucleic Acids Res 40(Database issue), D109–D114. doi: 10.1093/nar/gkr988
Kang, B. H., Xiong, Y., Williams, D. S., Pozueta-Romero, D., and Chourey, P. S. (2009). Miniature1-encoded cell wall invertase is essential for assembly and function of wall-in-growth in the maize endosperm transfer cell. Plant Physiol. 151, 1366–1376. doi: 10.1104/pp.109.142331
Koh, J., Soltis, P. S., and Soltis, D. E. (2010). Homolog loss and expression changes in natural populations of the recently and repeatedly formed allotetraploid Tragopogon mirus (Asteraceae). BMC Genomics 11:97. doi: 10.1186/1471-2164-11-97
Koller, A., Washburn, M. P., Lange, B. M., Andon, N. L., Deciu, C., Haynes, P. A., et al. (2002). Proteomic survey of metabolic pathways in rice. Proc. Natl. Acad. Sci. U.S.A. 99, 11969–11974. doi: 10.1073/pnas.172183199
Lan, P., Li, W., Wen, T. N., Shiau, J. Y., Wu, Y. C., Lin, W., et al. (2011). iTRAQ protein profile analysis of Arabidopsis roots reveals new aspects critical for iron homeostasis. Plant Physiol. 155, 821–834. doi: 10.1104/pp.110.169508
LeClere, S., Schmelz, E. A., and Chourey, P. S. (2008). Cell wall invertase-deficient miniature 1 kernels have altered phytohormone levels. Phytochemistry 69, 692–699. doi: 10.1016/j.phytochem.2007.09.011
LeClere, S., Schmelz, E. A., and Chourey, P. S. (2010). Sugar levels regulate tryptophan-dependent auxin biosynthesis in developing maize kernels. Plant Physiol. 153, 306–318. doi: 10.1104/pp.110.155226
Lee, J., and Koh, H. J. (2011). A label-free quantitative shotgun proteomics analysis of rice grain development. Proteome Sci. 9, 61. doi: 10.1186/1477-5956-9-61
Massonneau, A., Condamine, P., Wisniewski, J. P., Zivy, M., and Rogowsky, P. M. (2005). Maize cystatins respond to developmental cues, cold stress and drought. Biochim. Biophys. Acta 1729, 186–199. doi: 10.1016/j.bbaexp.2005.05.004
Méchin, V., Thévenot, C., Le Guilloux, M., Prioul, J. L., and Damerval, C. (2007). Developmental analysis of maize endosperm proteome suggests a pivotal role for pyruvate orthophosphate dikinase. Plant Physiol. 143, 1203–1219. doi: 10.1104/pp.106.092148
Miernyk, J. A., and Hajduch, M. (2011). Seed proteomics. J. Proteomics. 74, 389–400. doi: 10.1016/j.jprot.2010.12.004
Miller, M. E., and Chourey, P. S. (1992). The maize invertase-deficient miniature-1 seed mutation is associated with aberrant pedicel and endosperm development. Plant Cell 4, 297–305. doi: 10.1105/tpc.4.3.297
Neilson, K. A., Mariano, M., and Haynes, P. A. (2011). Quantitative proteomic analysis of cold-responsive proteins in rice. Proteomics 11, 1696–1706. doi: 10.1002/pmic.201000727
Nelson, D. L., and Cox, M. M. (2008). Lehninger Principles of Biochemistry, 5th edition. New York, NY: W. H. Freeman and Co.
Owiti, J., Grossmann, J., Gehrig, P., Dessimoz, C., Laloi, C., Hansen, M. B., et al. (2011). iTRAQ-based analysis of changes in the cassava root proteome reveals pathways associated with post-harvest physiological deterioration. Plant J. 67, 145–156. doi: 10.1111/j.1365-313X.2011.04582.x
Pugh, D. A., Offler, C. E., Talbot, M. J., and Ruan, Y.-L. (2010). Evidence for the role of transfer cells in the evolutionary increase in seed and fiber biomass yield in cotton. Mol. Plant 3, 1075–1086. doi: 10.1093/mp/ssq054
Ralser, M., Wamelink, M. M., Kowald, A., Gerisch, B., Heeren, G., Struys, E. A., et al. (2007). Dynamic rerouting of the carbohydrate flux is key to counteracting oxidative stress. J. Biol. 6, 10. doi: 10.1186/jbiol61
Ruan, Y-L, Llewellyn, D. J., and Furbank, R. T. (2003). Suppression of sucrose synthase gene expression represses cotton fiber cell initiation, elongation and seed development. Plant Cell 15, 952–964. doi: 10.1105/tpc.010108
Scanlon, M. J., and Takacs, E. M. (2009). “Kernel biology,” in Handbook of Maize, Its Biology, eds J. Bennetzen and S. Hake (New York, NY: Springer), 121–129.
Supek, F., Bošnjak, M., Škunca, N., and Šmuc, T. (2011). REVIGO summarizes and visualizes long lists of gene ontology terms. PLoS ONE 6:e21800. doi: 10.1371/journal.pone.0021800
Taliercio, E. W., Kim, J. Y., Mahe, A., Shanker, S., Choi, J., Cheng, W. S., et al. (1999). Isolation, characterization and expression analyses of two cell wall invertase genes in maize. J. Plant Physiol. 155, 197–204. doi: 10.1016/S0176-1617(99)80007-8
Van Aken, O., Whelan, J., and Van Breusegem, F. (2010). Prohibitins: mitochondrial partners in development and stress response. Trends Plant. Sci. 15, 275–282. doi: 10.1016/j.tplants.2010.02.002
van der Linde, K., Hemetsberger, C., Kastner, C., Kaschani, F., Van der Hoorn, R. A. L., Kumlehn, J., et al. (2012). A maize cystatin suppresses host immunity by inhibiting apoplastic cysteine proteases. Plant Cell 24, 1285–1300. doi: 10.1105/tpc.111.093732
Vilhar, B., Kladnik, A., Blejec, A., Chourey, P. S., and Dermastia, M. (2002). Cytometrical evidence that the loss of seed weight in the miniature1 seed mutant of maize is associated with reduced mitotic activity in the developing endosperm. Plant Physiol. 129, 23–30. doi: 10.1104/pp.001826
Xiong, Y., Li, Q. B., Kang, B. H., and Chourey, P. S. (2011). Discovery of genes expressed in basal endosperm transfer cells in maize using 454 transcriptome sequencing. Plant Mol. Biol. Rep. 29, 835–847. doi: 10.1007/s11105-011-0291-8
Keywords: proteomics, developing endosperm, iTRAQ, gene ontology, maize
Citation: Silva-Sanchez C, Chen S, Zhu N, Li Q-B and Chourey PS (2013) Proteomic comparison of basal endosperm in maize miniature1 mutant and its wild-type Mn1. Front. Plant Sci. 4:211. doi: 10.3389/fpls.2013.00211
Received: 15 April 2013; Accepted: 03 June 2013;
Published online: 25 June 2013.
Edited by:
Thomas L. Slewinski, Cornell Univeristy, USAReviewed by:
Jin Chen, Michigan State University, USAJohannes Thiel, Leibniz Institute of Plant Genetics and Crop Plant Research (IPK), Germany
Copyright © 2013 Silva-Sanchez, Chen, Zhu, Li and Chourey. This is an open-access article distributed under the terms of the Creative Commons Attribution License, which permits use, distribution and reproduction in other forums, provided the original authors and source are credited and subject to any copyright notices concerning any third-party graphics etc.
*Correspondence: Sixue Chen, Interdisciplinary Center for Biotechnology Research and Department of Biology, UF Genetics Institute, University of Florida, 2033 Mowry Rd., CGRC Rm. 438, Gainesville, FL 32610, USA e-mail:c2NoZW5AdWZsLmVkdQ==;
Prem S. Chourey, USDA-Agricultural Research Service, Center for Medical, Agricultural and Veterinary Entomology, 1600/1700 SW 23rd Drive, Gainesville, FL 32608, USA e-mail:cHJlbS5jaG91cmV5QGFycy51c2RhLmdvdg==