 Idoia Ariz1
 Cristina Cruz1
 Tomé Neves1
 Juan J. Irigoyen2
 Carmen Garcia-Olaverri3
 Salvador Nogués4
 Pedro M. Aparicio-Tejo5
 Iker Aranjuelo6,7*
- 1Faculdade de Ciências, Centro Ecologia Evolução e Alterações Ambientais, Universidade de Lisboa, Lisboa, Portugal
- 2Grupo de Fisiología del Estrés en Plantas, Departamento de Biología Ambiental, Unidad Asociada al CSIC, EEAD, Zaragoza e ICVV, Logroño, Spain
- 3Departamento de Estadística e Investigación Operativa, Universidad Pública de Navarra, Pamplona, Spain
- 4Departamento de Biología Vegetal, Facultat de Biologia, Universidad de Barcelona, Barcelona, Spain
- 5Departamento de Ciencias del Medio Natural, Universidad Pública de Navarra, Pamplona, Spain
- 6Plant Biology and Ecology Department, Science and Technology Faculty, University of the Basque Country, Leioa, Spain
- 7Instituto de Agrobiotecnología (IdAB), Universidad Pública de Navarra-CSIC-Gobierno de Navarra, Mutilva Baja, Spain
The natural 15N/14N isotope composition (δ15N) of a tissue is a consequence of its N source and N physiological mechanisms in response to the environment. It could potentially be used as a tracer of N metabolism in plants under changing environmental conditions, where primary N metabolism may be complex, and losses and gains of N fluctuate over time. In order to test the utility of δ15N as an indicator of plant N status in N2-fixing plants grown under various environmental conditions, alfalfa (Medicago sativa L.) plants were subjected to distinct conditions of [CO2] (400 vs. 700 μmol mol−1), temperature (ambient vs. ambient +4°C) and water availability (fully watered vs. water deficiency—WD). As expected, increased [CO2] and temperature stimulated photosynthetic rates and plant growth, whereas these parameters were negatively affected by WD. The determination of δ15N in leaves, stems, roots, and nodules showed that leaves were the most representative organs of the plant response to increased [CO2] and WD. Depletion of heavier N isotopes in plants grown under higher [CO2] and WD conditions reflected decreased transpiration rates, but could also be related to a higher N demand in leaves, as suggested by the decreased leaf N and total soluble protein (TSP) contents detected at 700 μmol mol−1 [CO2] and WD conditions. In summary, leaf δ15N provides relevant information integrating parameters which condition plant responsiveness (e.g., photosynthesis, TSP, N demand, and water transpiration) to environmental conditions.
Introduction
Considering the current rate of increase in CO2 emissions (1.5 μmol mol−1 year−1), it is expected that atmospheric CO2 concentrations ([CO2]) will reach 550 μmol mol−1 by 2050 and 700 μmol mol−1 by 2100 (Myhre et al., 2013). The associated warming is expected to be greatest in summer in south-western Europe.
Although atmospheric [CO2] is now limiting for C3 photosynthesis and growth, the predicted increase in [CO2] in coming decades could enhance photosynthetic rates and biomass production in C3 plants (Farquhar et al., 1980a; Bowes, 1993; Amthor, 2001; Long et al., 2004). Nevertheless, the interaction of CO2 with other limiting environmental factors, (e.g., higher temperature, lower water, and/or nitrogen availabilities) might decrease or eliminate the positive effect of elevated CO2 on plant production (Ainsworth et al., 2004; Rogers et al., 2009; Aranjuelo et al., 2011).
Most experiments analysing the effects of climate change on plant growth have considered the variability of individual environmental factors (CO2, temperature, water availability), keeping others at levels optimal for growth. However, analyses of the effect of CO2 and its interaction with other environmental conditions are of great relevance. In the field, multiple stresses, such as high temperature and drought periods in semi-arid or drought-stricken areas, often occur simultaneously. Studies of field crops and model plants have shown that the combination of heat and drought stresses has a stronger detrimental effect on plants growth and productivity than either stress alone. Furthermore, many reports indicate that it is not possible to extrapolate plant responses to combined stresses based on the responses to single stresses (Rampino et al., 2012).
In recent decades, stable isotope techniques (Isotope Ratio Mass Spectrometry, IRMS, mostly with 13C and 18O) have been used as tools that provide useful information on parameters conditioning plant growth, such as transpiration efficiency, the ratio of net photosynthesis to water transpired, etc., and that integrate the period during which CO2 is assimilated (Araus et al., 2002, 2003; Yousfi et al., 2010). Moreover, 13C isotope composition (δ13C) has been used as a breeding criterion for increasing yield in crops exposed to low water availability and salinity stresses (Yousfi et al., 2009, 2010; Araus et al., 2013). Variations in 15N isotopic composition (δ15N) have also been proposed as a useful trait for crop screening (Pritchard and Guy, 2005; Yousfi et al., 2012). Robinson et al. (2000) proposed that the natural abundance of both 13C and 15N might indicate responses to stresses such as drought and nitrogen starvation. Moreover, δ13C and δ15N have been used to characterize the response of crops to salinity (Yousfi et al., 2009) and are widely used in plant ecophysiology to assess the effects of changing climatic conditions as both are sensitive to environmental constraints (Peuke et al., 2006). Three main factors have been described (Evans, 2001; Pritchard and Guy, 2005; Coque et al., 2006; Tcherkez, 2011) as determining plant δ15N: (i) morphophysiological differences (particularly in root systems); (ii) activity of principal enzymes involved in N assimilation and (iii) plant N demand and assimilation capacity. However, it should be remembered that further 15N fractionation might take place as a result of N recycling, transport, exudation or volatilization (through stomata as ammonia and nitrous oxide) by the plants (Cernusak et al., 2009). Although δ15N has been previously determined in N2-fixing plants (Arnone, 1999; Wanek and Arndt, 2002), with very few exceptions (Shearer et al., 1982; Unkovich, 2013) this parameter has been mostly determined in plants grown with both N sources: N2 and NO−3. The natural 15N abundance method has been widely used to provide semi-quantitative estimates of the relative contribution of atmospheric N2 to N2-fixing plants growing in natural and agricultural settings (Shearer and Kohl, 1988), where N is available in several forms (i.e., NO−3, NH+4, N2, etc.). Thus, despite recent advances in the interpretation of plant δ15N, there is still a lack of knowledge of δ15N in plants where N2-fixation is the sole source of N.
Given that atmospheric N2 is an unlimited N source, and that N2-fixing legumes comprise the second most important group of agricultural crops worldwide (FAOSTAT, 20101), the use of δ15N as an integrative indicator of the responsiveness of N2-fixing plants to climate change conditions may be of great interest. The study of δ15N gradients along plant axes (from N source to sinks) and their reaction to environmental stresses may provide valuable information on the transport and metabolism of C-N compounds (Peuke et al., 2006). To achieve this, exclusively N2-fixing alfalfa (Medicago sativa L.) plants, which are frequently exposed to high temperature and/or drought in field conditions, were studied. They were subjected to distinct levels of [CO2] (400 vs. 700 μmol mol−1), temperature (ambient vs. ambient +4°C) and water availability (fully watered vs. partially watered). In addition to growth, we characterized the N isotopic composition (δ15N) of whole plants and separate organs (leaves, stems, roots and nodules), and δ15N relationship with C-N related parameters.
Materials and Methods
Plant Material and Experimental Design
Alfalfa (Medicago sativa L. cv Aragon) plants were grown in 13 L plastic pots (five plants per pot) filled with 1:2 (v/v) vermiculite-perlite. At 2–4 weeks after planting, they were inoculated with Sinorhizobium meliloti strain 102F78 (The Nitragin Co., Milwaukee, WI, USA). One-month-old plants were transferred to the corresponding temperature gradient greenhouses (TGG; Figure S1). The experimental design and the use of the greenhouses were similar to that described by Morales et al. (2014). Half of the plants were placed at 700 μmol mol−1 of [CO2] in a TGG, whereas the other half was grown in a different TGG under ambient [CO2] (400 μmol mol−1). Within each TGG, one for each CO2 concentration (400- and 700-μmol mol−1), plants were separated into 4 treatments corresponding to all combinations of, temperature (ambient—around 19°C—and ambient +4°C) and water availability (control –fully irrigated- or drought -partially irrigated-). After 1 month development, at the corresponding growth conditions, gas exchange measurements and harvest were carried out (60 days—old plants).
[CO2] Control within the TGGs
Ventilated [CO2] temperature and humidity sensors (M22W2HT4X transmitters, Rotronic Instrument Corp., Hauppauge, USA) and air probes connected to another CO2 infrared gas analyser were placed at the center of each module 60 cm above the plants.
The [CO2], concentration was monitored continuously at the outlet module by an infrared analyser (Guardian Plus gas monitor, Edinburgh Instruments Ltd, Livingston, UK) whose signal was fed into a proportional integrative differential controller that regulated the opening time (within a 10-s cycle) of a solenoid valve that injected CO2 into both inlet fans because otherwise lateral mixing of CO2 in the chambers was not complete. The data were continuously recorded by a computer through analog-digital converters (Microlink 751, Biodata Ltd, Manchester, UK) using Windmill software with the Test-Seq programming tool (Biodata Ltd). A subroutine of this software controlled solenoid valves that kept one of two sets of CO2 cylinders open or closed (provided by Air Liquide, Bilbao, Spain) thus supplying the gas to the elevated CO2 tunnel. When CO2 concentration decreased below a fixed level, signaling that one of the cylinder sets was exhausted, the corresponding valve was closed and that of the other set opened.
Temperature Control within the TGGs
The measured temperature difference was used to set the required fan speed by altering the current: the gradient decreased or increased as the fan was sped or slowed, respectively. Two inlet fans (each 90 W, 0.5 m3 s−1) mounted on the inlet module and an outlet fan (140 W, 0.54 m3 s−1) mounted in the roof of the outlet compartment continuously circulated air through the tunnel at the speed required to maintain a difference of 4°C between the two extreme modules. The fan at the tunnel outlet was in the roof, rather than in the end wall of the outlet compartment, so that any external wind would not disrupt the temperature gradient (Morales et al., 2014). Air flow was continuously varied by changing the fan speed to achieve the end-to-end temperature difference. Three small fan heaters (variable 250–500 W), placed above plant level in the outlet compartment and facing the tunnel interior, were used to help maintain the temperature difference at night and whenever solar radiation was insufficient to raise the temperature.
Water Treatment
When analysing the interaction between [CO2] and water availability, it should be remembered that plants grown at elevated [CO2] deplete soil water at a lower rate than those grown with ambient [CO2] (due to lower stomatal conductance and lower transpiration rates), so in many experiments, elevated [CO2] increased the time to reach a particular water stress (De Luis et al., 1999; Aranjuelo et al., 2009). To test this, we designed an experiment in which all treatments were subjected to the same soil water content. Well-watered (WW) plants were irrigated until they reached maximum soil volumetric water content (θv), whereas partially irrigated plants (WD) were watered at 50% θv of WW plants. These θv levels were maintained throughout the experiment by daily measurement of transpired water (calculated by weighing the pots) and replenishing the lost water. In order to reduce evaporation from the soil, pots were covered with a plastic sheet perforated with very small holes to allow stems to pass through. In order to supply all treatments with the same amount of nutrients, WW plants were alternately watered with Evans N-free nutrient solution and distilled water, while WD plants were always watered with Evans solution. Pots were rotated weekly in each module to avoid edge effects. In order to avoid differences due to chamber effects, the plants were moved from one greenhouse to another every month. All the determinations listed below were made at the end of the experiment, when the plants were 60 days old, in apical fully expanded leaves.
Plant Growth Determinations
Plant growth in the TGGs under the aforementioned [CO2], temperature and water availability conditions was determined by harvesting after 1 month of growth. Twenty plants were collected per treatment combination. The plants were divided into leaves, stems, roots and nodules, and the fresh weight of these components was recorded. After drying at 60°C for 48 h, their dry weight was determined. Leaf area was analyzed with an electronic planimeter (Li-3000 with LI-3050 conveyer accessory, LICOR, NE, USA). Total dry matter (DM) comprised leaf, stem, root and nodule DM.
Total Soluble Protein (TSP) Content
Proteins were extracted from frozen leaf subsamples and ground to a fine powder [in 50 mM Tricine buffer, pH 8.0, 1 mM EDTA, 5 mM 6-aminocaproic acid, 2 mM benzamidine, 8 mM β-mercaptoethanol, and 100 mM phenylmethylsulfonylfluoride (PMSF)]. This was kept on ice for 20 min and then centrifuged at 12,000 g and 4°C for 25 min. The total soluble protein content of the supernatant was determined according to the Bradford method (Bradford, 1976).
Gas Exchange Analyses
Fully expanded apical leaves from 50-day-old plants were individually enclosed in a leaf chamber (1010-M, Waltz, Effeltrich, Germany), and the gas exchange rate was measured with a portable photosynthesis system (HCM-1000, Waltz) under growth conditions. Net photosynthesis (A) and leaf conductance (g) were calculated as described by von Caemmerer and Farquhar (1981). The leaf internal CO2 concentration (Ci) was estimated from net photosynthesis and conductance measurements according to Farquhar and Sharkey (1982). Fully expanded leaves were enclosed in a GFS-3000 portable gas exchange system (Walz, Effeltreich, Germany). Gas exchange analyses were conducted in every plant grown at 400 and 700 μmol mol−1 [CO2] (A400 and A700 respectively), at the corresponding growth temperature and with a photosynthetic photon flux density of 1200 μmol m−2 s−1.
C and N Isotope and Content Analysis
A subsample of frozen leaf, stem, root and nodule from each plant was dried at 60°C for 48 h in small tin capsules and weighed. The nitrogen and carbon isotope composition of the samples was determined using a Flash 1112 Elemental Analyzer (Carbo Erba, Milan) coupled to an IRMS Delta C isotope ratio mass spectrometer through a Conflo III Interface (Thermo-Finnigan, Germany).
Nitrogen results were expressed in parts per thousand (‰) in the δ notation (δ15N) using international secondary standards of known 15N/14N ratios (IAEA N1 and IAEA N2 ammonium sulfate and IAEA NO3 potassium nitrate) relative to N2 in air:
where R is the 15N/14N ratio.
N and C contents were determined in three biological replicates of dried nodule, root and leaf samples, ground to powder, weighed (1.0 mg per sample) and stored in tin capsules. N and C content were determined at the Serveis Cientifico-Técnics of the University of Barcelona (Barcelona, Spain) using an elemental analyser (EA1108, Series 1; Carbo Erba Instrumentazione, Milan, Italy).
Statistical Analysis
Statistical analyses were performed with the programs SPSS for Windows, version 15.0 (Sections Statistical analysis of physiological and C-N-related parameters in N2-fixing alfalfa plants grown under various environmental conditions and Regression analyses of axial patterns of δ15N) and Statistica 10, data analysis software system, version 10 (StatSoft, Inc. 2011; Section Statistical analyses of leaves: relationships among C-N natural isotopic abundances and physiological parameters.).
Statistical analysis of physiological and C-N-related parameters in N2-fixing alfalfa plants grown under various environmental conditions
We examined results from eight treatments using analysis of variance (ANOVA) to test for effects and interactions of the various combinations of three environmental factors ([CO2], temperature and water availability), and whether these results varied according to the organ tested. Besides analysis of whole plants (exploratory analysis, data not shown), each organ (nodule, root, stem, and leaves) was analyzed separately. Homoscedasticity was determined using the Levene test (Levene, 1960), then One- and Two-Way ANOVA tests, including interaction terms, were conducted using data displayed in Figure 2, Tables 2, 3 and Tables S1–S3.
Regression analyses of axial patterns of δ15N
Linear regression models (Table 1) were performed using the model: Y = (a) + bX, where Y corresponds to δ15Nsink−organ and X corresponds to δ15Nsource−organ.
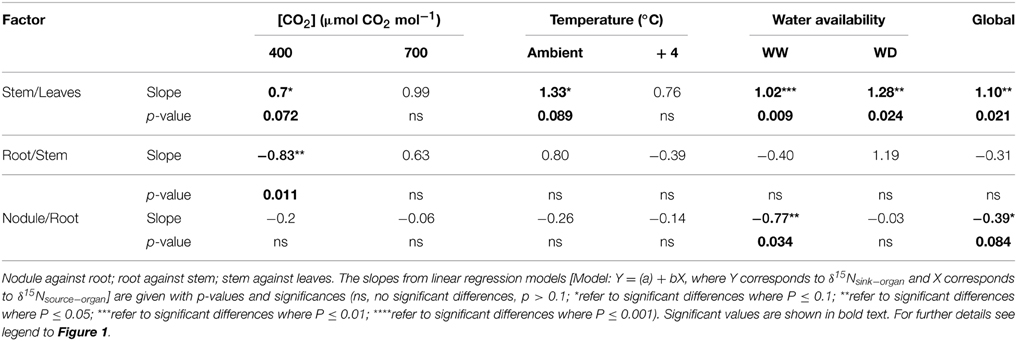
Table 1. Regression analysis between organ δ15N in 60-day-old nodulated alfalfa plants exposed to differing climate conditions.
Statistical analyses of leaves: relationships among C-N natural isotopic abundances and physiological parameters
Following an exploratory-inferential approach, data analysis revealed that leaves were the organs that were the most influenced by environmental factors, so several descriptive statistical analyses were conducted only on data from leaves. Simple regression models were estimated for δ15N and target parameters conditioning plant growth (e.g., plant biomass, plant level photosynthesis, TSP, leaf area, N content). Correlation and simple regression models for leaf parameters (Figures 3–5) were used to determine R2 and p-values for each analysis.
The results of this study were obtained for plants cultured in several independent series, at least one sample was analyzed for each of three independent series. Sample size varied depending on the analysis carried out, from 32 (for organ specific descriptive analysis) up to 192 (for exploratory-inferential analysis).
Results and Discussion
It is generally accepted that leaf δ15N reflects the 15N abundance of plant main N source(s): available soil N for non-N2-fixing plants and atmospheric N2 for N2-fixing plants (Shearer and Kohl, 1988). Since, by definition, the δ15N of atmospheric N2 is 0, that of N2-fixing plants growing without any other N source should also be around 0, but in fact it can be very distinct from zero (Unkovich, 2013). The precise value of the N2-fixing plants δ15N depends, among other factors, on: (1) the physiological partition of the N metabolism between shoot and root; (2) the N efflux; and (3) on the exudation of metabolites. The δ15N values of the distinct plant organs (nodules, roots, stems and leaves) show that leaf δ15N is the one more responsive to environmental factors (Figure 1; Table 1). The increase of ambient temperature by 4°C, did not significantly modify any leaf C-N related parameter (including leaf δ15N; Tables 1–3). The combined effect of increased [CO2] and WD caused the more significant changes in leaf δ15N (Figure 1, Table 1).
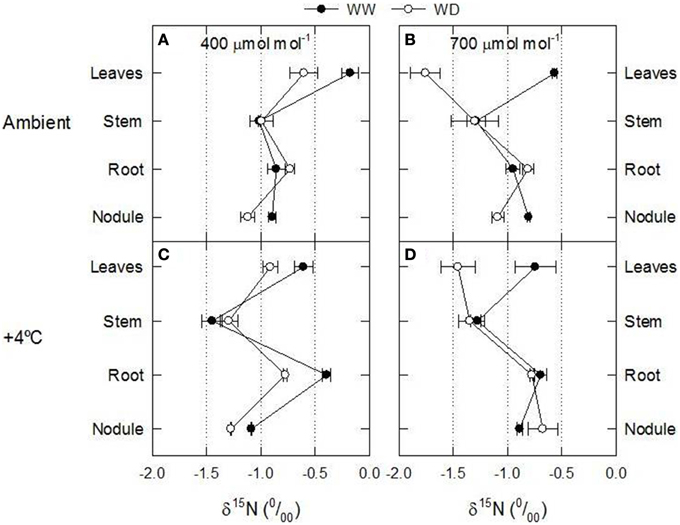
Figure 1. Axial patterns of δ15N in 60-day-old nodulated alfalfa plants grown under differing conditions of CO2 concentration [400 μmol CO2 mol−1, left panels (A,C), or 700 μmol CO2 mol−1, right panels (B,D)], temperature [ambient, upper panels (A,B), or +4°C, lower panels (C,D)] and water availability (well watered, WW, or water deficiency, WD). This figure summarizes data concerning δ15N values showed in Table 4 and Tables S1–S3. Data represent average values ± SE (n = 3).
δ15N as Affected by Stomatal Opening
Control plants (400 ppm CO2, WW, environmental temperature) did not show differences between the δ15N values of nodules, roots or stems (δ15N ≈ −1.0), while leaves presented δ15N values closer to zero (Figure 1A). Theoretically this relative enrichment of the leaves in 15N may be due to NH3 losses through stomata (Farquhar et al., 1980b), and may be associated with two main factors: (1) the leaf NH3 pool is predominantly originated through photorespiration and may have a δ15N as low as −40 (Handley et al., 1999; Peuke et al., 2006); and (2) the 14N is lost more readily through the stomata than 15N (O'Deen, 1989). In fact both environmental factors, [CO2] and water availability lead to reduced stomatal conductance (Figures S2E,F) and transpiration rates (Figures 2G,H; Figures S2C,D; Table 2). As a consequence, the δ15N of leaves from plants grown at increased [CO2] and/or WD tended to have lower leaf δ15N than those from plants grown at ambient [CO2] or from WW plants (i.e., higher stomatal opening Figures 1, 3). However, the ranges of 15N depletion in leaves caused by both factors, WD and [CO2], were not exactly the same (≈−0.5 for [CO2] and ≈−1 to −1.5 for WD; Figure 1).
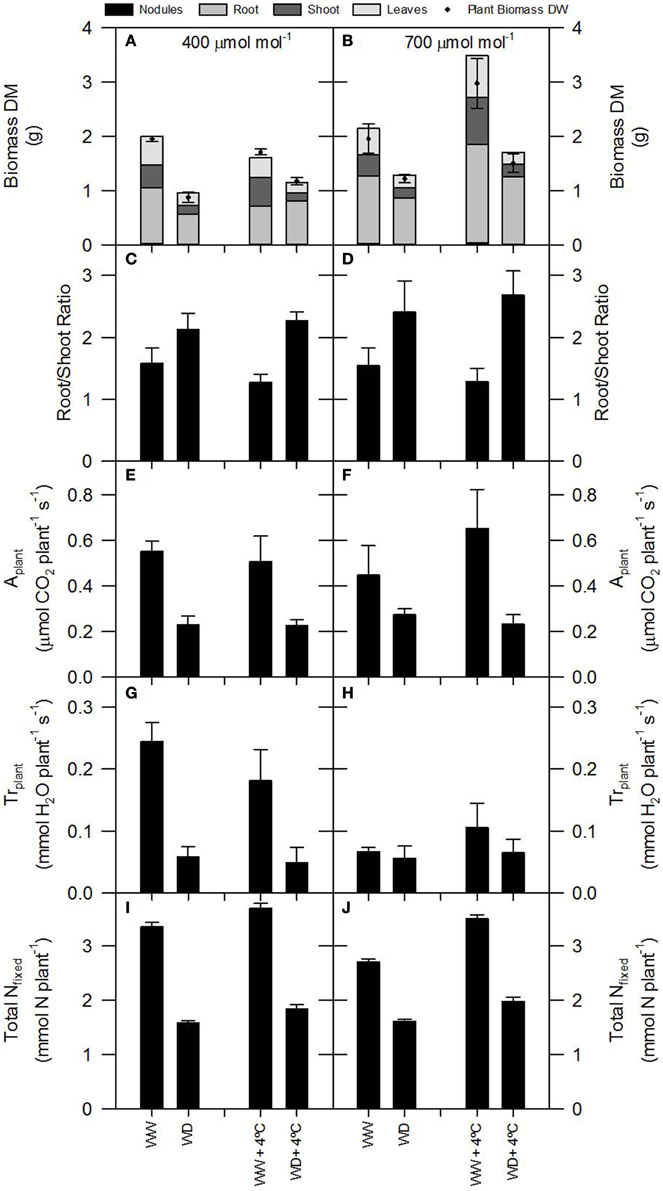
Figure 2. Plant growth (dry matter, DM, and root/shoot ration), total photosynthesis, total transpiration and total N fixed per plant of 60-day-old nodulated alfalfa plants exposed to differing environmental conditions: CO2 concentration (400 μmol CO2 mol−1, left panels, or 700 μmol CO2 mol−1, right panels); temperature (ambient or +4°C); and water availability (well watered, WW, or water deficient, WD). Legend: (A,B)—relative and total plant growth; the relative bar areas represent the individual organ percentage relative to the total plant growth (black line); (C,D)—root/shoot ratio; (E,F)—total photosynthesis, Aplant; (G,H)—total transpiration, Trplant; (I,J)—total N fixed. Data represent average values ± SE (n = 3–6).
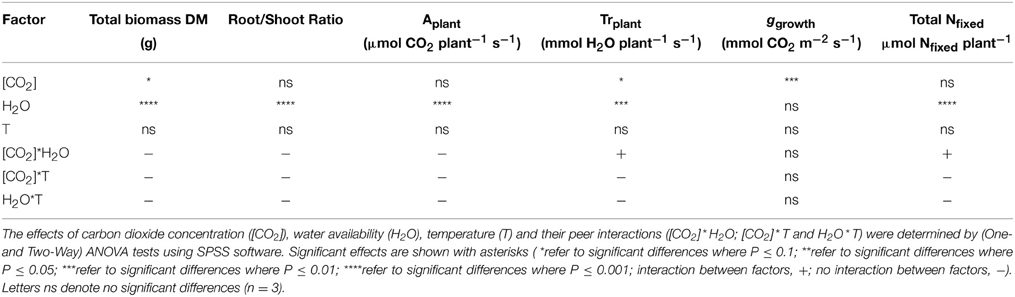
Table 2. Analysis of variance of the effect of [CO2], water availability and temperature on plant growth, gas exchange and N fixation parameters.
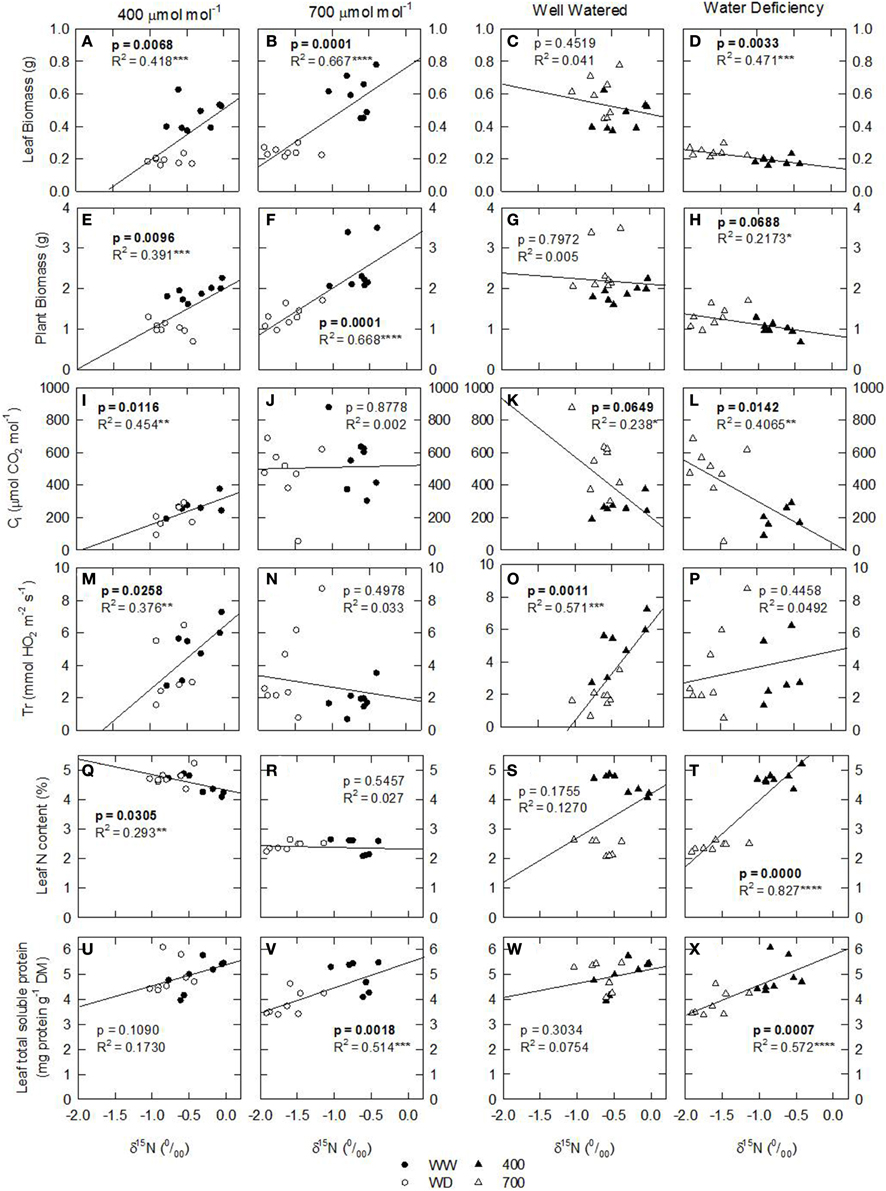
Figure 3. Leaf N isotopic composition (δ15N; ‰) of nodulated alfalfa plants exposed to differing environmental conditions correlated with: (A–H) leaf biomass (grams); (I–L) Ci (μmol CO2 mol−1); (M–P) transpiration rate (mmol H2O m−2 s−1); (Q–T) leaf N content (%, w/w); and (U–X) leaf total soluble protein (TSP; mg prot g−1 DM). Datasets were categorized in terms of environmental conditions: [CO2], 400 or 700 ppm, left panels; water availability, well watered—WW, or water deficient—WD, right panels. The dataset displayed represents individual observations, at least n = 3 for each environmental combination. Significant p-values are shown in bold text. Significance: p > 0.1; *P ≤ 0.1; **P ≤ 0.05; ***P ≤ 0.01; ****P ≤ 0.001.
Leaf δ15N as an Indicator of Plant N Demand and Organ N Partitioning
Considering that the variability of δ15N in leaves reflects changes in N metabolic and metabolite fluxes, and/or environment-driven effects, leaf δ15N has been proposed as a good candidate for tracing these effects in plants (Tcherkez, 2011). Plants showing healthy physiological features (i.e., higher leaf and plant biomass, leaf area, leaf N content, and leaf TSP) had leaf δ15N values closer to that of their N source (δ15Natmosphere = 0; Figures 1–3). In contrast, plants affected by [CO2] and water availability, with impaired growth (Figure 2, Table 2), had more negative leaf δ15N values (−2 to −0.5; Figure 1). These differences highlight the effect of environmental factors on transport and partitioning of N metabolism in N2-fixing plants (Peuke et al., 2006). Correlation-regression analyses confirmed that both environmental factors ([CO2] and water availability) influenced the correlations between leaf δ15N and biomass and several physiological parameters (leaf biomass, plant biomass, internal concentration of CO2, transpiration, foliar N content and foliar TSP) (Figure 3). However, some other relationships were mostly influenced by [CO2] (e.g., leaf area; Figure 4) or by water availability (e.g., stomatal conductance; Figure 5). The depletion of foliar δ15N under high [CO2] has also been observed in a wide range of plant species (27 field-grown plant species) and ecosystem types (Bassirirad et al., 2003). However, there is no direct evidence that water availability influences foliar N isotope composition (Peuke et al., 2006).
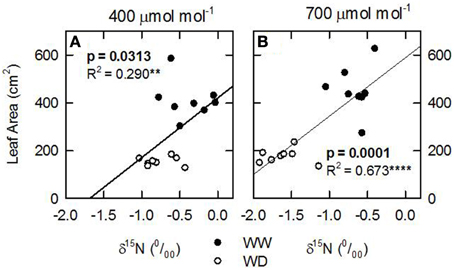
Figure 4. Leaf N isotopic composition (δ15N; ‰) of nodulated alfalfa plants exposed to differing environmental conditions correlated with (A,B) leaf area (cm2). The dataset was categorized by [CO2], 400, left panels or 700 ppm, right panels. Legend for water availability treatments: well watered, WW; or water deficient, WD. The dataset displayed represents individual observations, at least n = 3 for each environmental combination. Significant p-values are shown in bold text. Significance: p > 0.1; *refer to significant differences where P ≤ 0.1; **refer to significant differences where P ≤ 0.05; ***refer to significant differences where P ≤ 0.01; ****refer to significant differences where P ≤ 0.001.
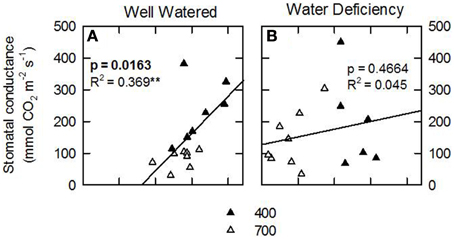
Figure 5. Leaf N isotopic composition (δ15N; ‰) of nodulated alfalfa plants exposed to differing environmental conditions correlated with stomatal conductance (mmol CO2 m−2 s−1). The dataset was categorized by water availability: well watered, WW, left panels; or water deficient, WD, right panels. Legend for [CO2] treatments, 400 or 700 ppm. The dataset displayed represents individual observations, at least n = 3 for each environmental combination. Significant p-values are shown in bold text. Significance: p > 0.1; *refer to significant differences where P ≤ 0.1; **refer to significant differences where P ≤ 0.05; ***refer to significant differences where P ≤ 0.01; ****refer to significant differences where P ≤ 0.001.
This differential response of leaf δ15N to the combination of [CO2] and water availability, together with the observed low correlations between leaf δ15N and plant transpiration associated with high [CO2] and water deficiency (Figures 3N,P), suggest that other metabolic processes (different from stomatal conductance, see above) could be involved in such an isotopic effect. Higher [CO2] and WD led to different C/N balances and N requirements (Figures 2I,J; Tables 3, 4), which may be related to the observed differences in leaf δ15N. Despite the potentially increased C availability at higher [CO2], and the higher plant growth demonstrated by these plants (Figure 2; Table 2), they did not increase their total fixed-N2 (Figure 2), leading to unbalanced foliar N contents (%; ≈ 2% at 700 vs. ≈ 4–5% at 400 μmol mol−1) and C/N ratios (Table 4). The lower foliar N content at higher [CO2] indicates a higher N demand, limiting plant growth under such conditions. This concept is supported by the similarity of the δ15N in leaves and nodules (WW plants, Figure 1), which suggests negligible losses of N and optimization of the N use efficiency (NUE) of the N2-fixing plants grown at high [CO2]. In other words, all fixed N is being used by the plants. In fact, plants containing increased leaf TSP contents had leaf δ15N values close to zero (δ15Natmosphere = 0; Figure 3), so the growth of N2-fixing plants exposed to higher [CO2] is determined by their N2 fixation capacity. Similar results were described by Bassirirad et al. (2003) with mycorrhizal plants exposed to elevated [CO2].
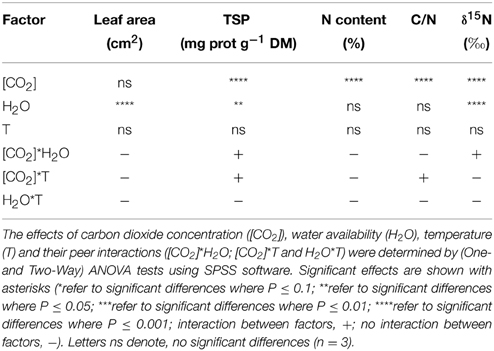
Table 3. Analysis of variance of the effect of [CO2], water availability and temperature on leaf C-N-related parameters.
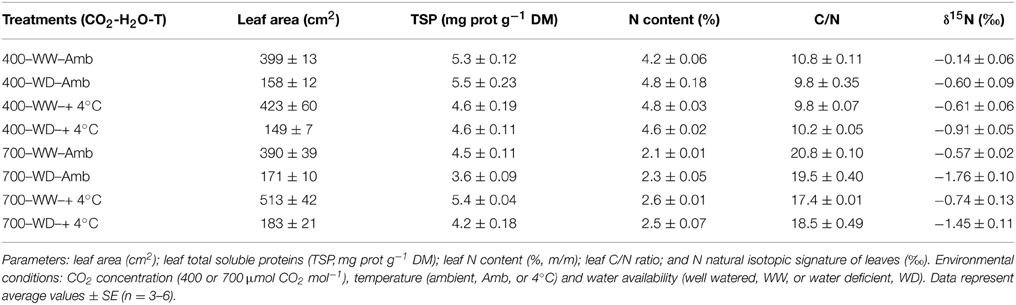
Table 4. Responsiveness of leaf C-N-related parameters of 60-day-old nodulated alfalfa plants exposed to different climate conditions.
Plant N demand has been described as a key factor conditioning δ15N (Tcherkez, 2011), so the higher N demand by alfalfa leaves exposed to higher [CO2] could lead to differential N partitioning between the plant's above- and below-ground parts. On the other hand, translocation of organic N compounds rather than inorganic N (i.e., ammonium) from bacteroids to the plant (nodules, roots, stems, and finally leaves, mainly in the form of Asn in alfalfa plants; Kaspar et al., 2008) could also lead to a more 14N-enriched signature of plant organs, because the assimilated N organic pool in plants is generally14N-enriched relative to the unassimilated N inorganic pool (Werner and Schmidt, 2002; Kalcsits and Guy, 2013).
Conclusion
Leaf δ15N was a sensitive integrator of such combined environmental stresses on N2-fixing alfalfa plants: plants affected by higher [CO2] and water deficiency, which displayed impaired growth features, had more negative leaf δ15N values than that of atmospheric N2. In contrast, physiologically healthy plants had leaf 15N signatures close to those of their N source (δ15Natmosphere = 0). This observation, together with further investigation of isotope fractionation during transport and metabolic processes, may provide useful information on the metabolism, transport and allocation of N in N2-fixing plants exposed to combined environmental stresses.
Conflict of Interest Statement
The authors declare that the research was conducted in the absence of any commercial or financial relationships that could be construed as a potential conflict of interest.
Acknowledgments
This work was supported by the Spanish Economy and Competiveness ministry (AGL-2012-37815-CO5-05, AGL2011-30386-C02-02 and Ramón y Cajal research grant) and by the Portuguese FCT (PTDC/BIA-ECS/122214/2010). IA was supported by a postdoctoral Fellowship from the Government of Navarra (Anabasid outgoing Programme) and by a postdoctoral Fellowship from the Portuguese FCT (SFRH/BPD/90436/2012).
Supplementary Material
The Supplementary Material for this article can be found online at: http://journal.frontiersin.org/article/10.3389/fpls.2015.00574
Footnotes
References
Ainsworth, E. A., Rogers, A., Nelson, R., and Long, S. P. (2004). Testing the “source-sink” hypothesis of down-regulation of photosynthesis in elevated [CO2] in the field with single gene substitutions in Glycine max. Agric. For. Meterol. 122, 85–94. doi: 10.1016/j.agrformet.2003.09.002
Amthor, J. S. (2001). Effects of atmospheric CO2 concentration on wheat yield: review of results from experiments using various approaches to control CO2concentration. Field Crops Res. 73, 1–34. doi: 10.1016/S0378-4290(01)00179-4
Aranjuelo, I., Cabrera-Bosquet, L., Morcuende, R., Avice, J. C., Nogués, S., Araus, J. L., et al. (2011). Does ear C sink strength contribute to overcoming photosynthetic acclimation of wheat plants exposed to elevated CO2? J. Exp. Bot. 62, 3957–3969. doi: 10.1093/jxb/err095
Aranjuelo, I., Irigoyen, J. J., Nogués, S., and Sánchez-Díaz, M. (2009). Elevated CO2 and water-availability effect on gas exchange and nodule development in N2-fixing alfalfa plants. Environ. Exp. Bot. 65, 18–26. doi: 10.1016/j.envexpbot.2008.06.006
Araus, J. L., Cabrera-Bosquet, L., Serret, M. D., Bort, J., and Nieto-Taladriz, M. T. (2013). Comparative performance of δ13C, δ18O and δ15N for phenotyping durum wheat adaptation to a dryland environment. Funct. Plant Biol. 40, 595–608. doi: 10.1071/FP12254
Araus, J. L., Slafer, G. A., Reynolds, M. P., and Royo, C. (2002). Plant breeding and drought in C3 cereals: what should we breed for? Ann. Bot. 89, 925–940. doi: 10.1093/aob/mcf049
Araus, J. L., Villegas, D., Aparicio, N., García del Moral, L. F., El Hani, S., Rharrabti, Y., et al. (2003). Environmental factors determining carbon isotope discrimination and yield in durum wheat under Mediterranean conditions. Crop Sci. 43, 170–180. doi: 10.2135/cropsci2003.1700
Arnone, J. A. III. (1999). Symbiotic N2 fixation in a high Alpine grassland: effects of four growing seasons of elevated CO2. Funct. Ecol. 13, 383–387. doi: 10.1046/j.1365-2435.1999.00325.x
Bassirirad, H., Constable, J. V. H., Lussenhop, J., Kimball, B. A., Norbys, R. J., Oechel, W. C., et al. (2003). Widespread foliage δ15N depletion under elevated CO2: inferences for the nitrogen cycle. Global Change Biol. 9, 1582–1590. doi: 10.1046/j.1365-2486.2003.00679.x
Bowes, G. (1993). Facing the inevitable: plants and increasing atmospheric CO2. Annu. Rev. Plant Physiol. Plant Mol. Biol. 44, 309–332. doi: 10.1146/annurev.pp.44.060193.001521
Bradford, M. M. (1976). A rapid and sensitive method for the quantitation of microgram quantities of protein utilizing the principle of protein–dye binding. Ann. Biochem 72, 248–254. doi: 10.1016/0003-2697(76)90527-3
Cernusak, L. A., Winter, K., and Turner, B. L. (2009). Plant δ15N correlates with the transpiration efficiency of nitrogen acquisition in tropical trees. Plant Physiol. 151, 1667–1676. doi: 10.1104/pp.109.145870
Coque, M., Bertin, P., Hirel, B., and Gallais, A. (2006). Genetic variation and QTLs for 15N natural abundance in a set of maize recombinant inbred lines. Field Crops Res. 97, 310–321. doi: 10.1016/j.fcr.2005.11.002
De Luis, I., Irigoyen, J. J., and Sánchez-Díaz, M. (1999). Elevated CO2 enhances plant growth in droughted N2-fixing alfalfa without improving water status. Physiol Plantarum. 107, 84–89. doi: 10.1034/j.1399-3054.1999.100112.x
Evans, R. D. (2001). Physiological mechanisms influencing plant nitrogen isotope composition. Trends Plant Sci. 6, 121–126. doi: 10.1016/S1360-1385(01)01889-1
Farquhar, G. D., Firth, P. M., Wetselaar, R., and Weir, B. (1980b). On the gaseous exchange of amnonia between leaves and the environment: determination of the ammonia compensation point. Plant Physiol. 66, 710–714. doi: 10.1104/pp.66.4.710
Farquhar, G. D., and Sharkey, T. D. (1982). Stomatal conductance and photosynthesis. Ann. Rev. Plant Physiol. 33, 317–345. doi: 10.1146/annurev.pp.33.060182.001533
Farquhar, G. D., von Caemmerer, S., and Berry, J. A. (1980a). A biochemical model of photosynthetic CO2 assimilation in leaves of C3 species. Planta 149, 78–90. doi: 10.1007/BF00386231
Handley, L. L., Austin, A. T., Robinson, D., Scrimgeour, C. M., Raven, J. A., Heaton, T. H. E., et al. (1999). The 15N natural abundance (δ15N) of ecosystem samples reflects measures of water availability. Aust. J. Plant Physiol. 26, 185–199. doi: 10.1071/PP98146
Kalcsits, L. A., and Guy, R. D. (2013). Whole-plant and organ-level nitrogen isotope discrimination indicates modification of partitioning of assimilation, fluxes and allocation of nitrogen in knockout lines of Arabidopsis thaliana. Physiol. Plantarum. 149, 249–259. doi: 10.1111/ppl.12038
Kaspar, H., Dettmer, K., Gronwald, W., and Oefner, P. J. (2008). Automated GC-MS analysis of free amino acids in biological fluids. J. Chromatogr. B 870, 222. doi: 10.1016/j.jchromb.2008.06.018
Levene, H. (1960). “Robust tests for equality of variances,” in Contributions to Probability and Statistic: Essays in Honor of Harold Hotelling, eds I. Olkin, S. G. Ghurye, W. Hoeffding, W. G. Madow, and H. B. Mann (Chicago, IL: Stanford University Press), 278–292.
Long, S. P., Ainsworth, E. A., Rogers, A., and Ort, D. R. (2004). Rising atmospheric carbon dioxide: plants FACE the future. Annu. Rev. Plant Biol. 55, 591–628. doi: 10.1146/annurev.arplant.55.031903.141610
Morales, F., Pascual, I., Sánchez-Díaz, M., Aguirreolea, J., Irigoyen, J. J., Goicoechea, N., et al. (2014). Methodological advances: using greenhouses to simulate climatechange scenarios. Plant Sci. 226, 30–40. doi: 10.1016/j.plantsci.2014.03.018
Myhre, G. D., Shindell, F.-M., Bréon, W., Collins, J., Fuglestvedt, J., Huang, D., et al. (2013). “Anthropogenic and natural radiative forcing,” in Climate Change 2013: The Physical Science Basis. Contribution of Working Group I to the Fifth Assessment Report of the Intergovernmental Panel on Climate Change, eds T. F. D. Stocker, G.-K. Qin, M. Plattner, S. K. Tignor, J. Allen, A. Boschung, et al. (Cambridge; New York, NY: Cambridge University Press), 659–740.
O'Deen, W. A. (1989). Wheat volatilized ammonia and resulting nitrogen isotopic fractionation. Agron J. 81, 980–985.
Peuke, A. D., Gessler, A., and Rennenberg, H. (2006). The effect of drought on C and N stable isotopes in different fractions of leaves, stems and roots of sensitive and tolerant beech ecotypes. Plant Cell Environ. 29, 823–835. doi: 10.1111/j.1365-3040.2005.01452.x
Pritchard, E. S., and Guy, R. D. (2005). Nitrogen isotope discrimination in white spruce fed with low concentrations of ammonium and nitrate. Trees Struct. Funct. 19, 89–98. doi: 10.1007/s00468-004-0367-2
Rampino, P., Mita, G., Fasano, P., Borrelli, G. M., Aprile, A., Dalessandro, G., et al. (2012). Novel durum wheat genes up-regulated in response to a combination of heat and drought stress. Plant Physiol. Biochem. 56, 72–78. doi: 10.1016/j.plaphy.2012.04.006
Robinson, D., Handley, L. L., Scrimgeour, C. M., Gordon, D. C., Forster, B. P., and Ellis, R. P. (2000). Using stable isotope natural abundances (δ15N and δ13C) to integrate the stress responses of wild barley (Hordeum spontaneum C. Koch.) genotypes. J. Exp. Bot. 51, 41–50. doi: 10.1093/jexbot/51.342.41
Rogers, A., Ainsworth, E. A., and Leakey, A. D. B. (2009). Will elevated carbon dioxide concentration amplify the benefits of nitrogen fixation in legumes? Plant Physiol. 151, 1009–1016. doi: 10.1104/pp.109.144113
Shearer, G., Feldman, L., Bryan, B. A., Skeeters, J. L., Kohl, D. H., and Amarger, N. (1982). 15N abundance of nodules as an indicator of N metabolism in N2-fixing plants. Plant Physiol. 70, 465–468. doi: 10.1104/pp.70.2.465
Shearer, G., and Kohl, D. H. (1988). Natural 15N abundance as a method of estimating the contribution of biologically fixed nitrogen to N2-fixing systems: potential for non-legumes. Plant Soil. 110, 317–327. doi: 10.1007/BF02226812
Tcherkez, G. (2011). Natural 15N/14N isotope composition in C3 leaves: are enzymatic isotope effectes informative for predicting the 15N-abundance in key metabolites? Funct. Plant Biol. 38, 1–12. doi: 10.1071/FP10091
Unkovich, M. (2013). Isotope discrimination provides new insight into biological nitrogen fixation. New Phytol. 198, 643–646. doi: 10.1111/nph.12227
von Caemmerer, S., and Farquhar, G. D. (1981). Some relationships between the biochemistry of photosynthesis and the gas exchange of leaves. Planta 153, 376–387. doi: 10.1007/BF00384257
Wanek, W., and Arndt, S. K. (2002). Difference in δ15N signatures between nodulated roots and shoots of soybean is indicative of the contribution of symbiotic N2 fixation to plant N. J. Exp. Bot. 53, 1109–1118. doi: 10.1093/jexbot/53.371.1109
Werner, R. A., and Schmidt, H. (2002). The in vivo nitrogen isotope discrimination among organic plant compounds. Phytochemistry 61, 465–484. doi: 10.1016/S0031-9422(02)00204-2
Yousfi, S., Serret, M. D., and Araus, J. L. (2009). Shoot δ15N gives a better indication than ion concentration or Δ13C of genotypic differences in the response of durum wheat to salinity. Funct. Plant Biol. 36, 144–155. doi: 10.1071/FP08135
Yousfi, S., Serret, M. D., Márquez, A. J., Voltas, J., and Araus, J. L. (2012). Combined use of δ13C, δ 18O and δ15N tracks nitrogen metabolism and genotypic adaptation of durum wheat to salinity and water deficit. New Phytol. 194, 230–244. doi: 10.1111/j.1469-8137.2011.04036.x
Keywords: alfalfa, climate change, growth, δ15N, physiology
Citation: Ariz I, Cruz C, Neves T, Irigoyen JJ, Garcia-Olaverri C, Nogués S, Aparicio-Tejo PM and Aranjuelo I (2015) Leaf δ15N as a physiological indicator of the responsiveness of N2-fixing alfalfa plants to elevated [CO2], temperature and low water availability. Front. Plant Sci. 6:574. doi: 10.3389/fpls.2015.00574
Received: 16 February 2015; Accepted: 13 July 2015;
Published: 11 August 2015.
Edited by:
Jean-Michel Ané, University of Wisconsin - Madison, USAReviewed by:
Uener Kolukisaoglu, University of Tuebingen, GermanyNaser A. Anjum, University of Aveiro, Portugal
Copyright © 2015 Ariz, Cruz, Neves, Irigoyen, Garcia-Olaverri, Nogués, Aparicio-Tejo and Aranjuelo. This is an open-access article distributed under the terms of the Creative Commons Attribution License (CC BY). The use, distribution or reproduction in other forums is permitted, provided the original author(s) or licensor are credited and that the original publication in this journal is cited, in accordance with accepted academic practice. No use, distribution or reproduction is permitted which does not comply with these terms.
*Correspondence: Iker Aranjuelo, Plant Biology and Ecology Department, Science and Technology Faculty, University of the Basque Country, Barrio Sarriena, 48940 Leioa, Spain,aWtlci5hcmFuanVlbG9AZWh1LmVz