 Chaevien S. Clendinen1,2Gregory S. Stupp3Ramadan Ajredini1,2Brittany Lee-McMullen1,2Chris Beecher1,2,4Arthur S. Edison1,2*†
- 1Southeast Center for Integrated Metabolomics, University of Florida, Gainesville, FL, USA
- 2Department of Biochemistry and Molecular Biology, University of Florida, Gainesville, FL, USA
- 3The Scripps Research Institute, La Jolla, CA, USA
- 4IROA Technologies, Ann Arbor, MI, USA
Compound identification is a major bottleneck in metabolomics studies. In nuclear magnetic resonance (NMR) investigations, resonance overlap often hinders unambiguous database matching or de novo compound identification. In liquid chromatography-mass spectrometry (LC-MS), discriminating between biological signals and background artifacts and reliable determination of molecular formulae are not always straightforward. We have designed and implemented several NMR and LC-MS approaches that utilize 13C, either enriched or at natural abundance, in metabolomics applications. For LC-MS applications, we describe a technique called isotopic ratio outlier analysis (IROA), which utilizes samples that are isotopically labeled with 5% (test) and 95% (control) 13C. This labeling strategy leads to characteristic isotopic patterns that allow the differentiation of biological signals from artifacts and yield the exact number of carbons, significantly reducing possible molecular formulae. The relative abundance between the test and control samples for every IROA feature can be determined simply by integrating the peaks that arise from the 5 and 95% channels. For NMR applications, we describe two 13C-based approaches. For samples at natural abundance, we have developed a workflow to obtain 13C–13C and 13C–1H statistical correlations using 1D 13C and 1H NMR spectra. For samples that can be isotopically labeled, we describe another NMR approach to obtain direct 13C–13C spectroscopic correlations. These methods both provide extensive information about the carbon framework of compounds in the mixture for either database matching or de novo compound identification. We also discuss strategies in which 13C NMR can be used to identify unknown compounds from IROA experiments. By combining technologies with the same samples, we can identify important biomarkers and corresponding metabolites of interest.
Introduction
Metabolomics and natural product studies share many common goals. Indeed, we and others have argued that the two fields are essentially the same (Robinette et al., 2012). Both have the ultimate goal of identifying a small molecule that is responsible for a particular activity or phenotype. Both utilize the same analytical tools, namely mass spectrometry (MS) and nuclear magnetic resonance (NMR). However, metabolomics and natural products traditionally approach the identification task from different directions. Whereas metabolomics utilizes less chemical purification and more statistical analysis, natural products studies generally utilize some sort of biological assay to guide the purification and identification of an active compound, which may be biosynthesized from any metabolic pathway(s). We believe that by applying the most powerful tools from each field, the task of compound identification can be greatly simplified.
In our experience, the use of 13C isotopes (13C) in metabolomics studies greatly enhances the ability to identify and quantify biomarkers. NMR and MS, commonly used in natural products studies, can be efficiently applied to complex metabolic mixtures through the simplification of spectra by 13C filtering. This concept is not new, as 13C has a long history in targeted metabolomics (Sumner et al., 1992, 2003; Fennell et al., 2006; Garner et al., 2006; Kwon et al., 2014), flux studies (Merritt et al., 2007; Moseley et al., 2011; Moreno et al., 2014; Purmal et al., 2014; Yang et al., 2014; Buescher et al., 2015), and in vivo metabolic studies (Golman et al., 2006; Schroeder et al., 2008; Colombo Serra et al., 2012). However, 13C has not seen widespread use in untargeted metabolomics, where we believe it has great potential to improve compound identification.
As we will demonstrate below, 13C can be utilized in liquid chromatography-MS (LC-MS) studies to allow for the discrimination between biosynthesized metabolites and background noise, which is a common problem in LC-MS. Moreover, through such 13C labeling strategies, the number of carbons of each metabolite can be determined, greatly enhancing the determination of molecular formulae. The same labeling strategy can be used to obtain accurate relative quantification of metabolites in an untargeted LC-MS experiment, which can be difficult to quantify without the use of internal standards (Bennett et al., 2008; Feldberg et al., 2009; Giavalisco et al., 2009; Bueschl et al., 2014). In NMR studies, 13C can also provide several advantages. Perhaps most important is the large chemical shift range (∼200 ppm) of 13C compared to 1H (∼10 ppm). This allows for less overlap in NMR spectra and for more efficient statistical analysis. 13C chemical shifts alone, or in addition to 1H chemical shifts, allow for more efficient database matching for compound identification or dereplication. Finally, direct 13C correlations that can be obtained from NMR studies are an extremely effective way to determine the identity of unknown metabolites or ones that are not in databases.
With all of these advantages of 13C, why is it not more commonly used in NMR? The most obvious answer is the low isotopic abundance of 13C (1.1%). This effectively dilutes the signal of interest by 100-fold from standard 1H-based NMR methods. More importantly, the 1.1% abundance of 13C leads to low probabilities of two or more 13C atoms being next to each other in the same molecule, which is a necessary condition for many of the approaches we will describe below. All of these problems can be offset by isotopically labeling with 13C. In some cases, isotopic labeling is simple and cost effective, while in others it is difficult or impossible. We also present some strategies below to get around the problem of labeling.
The plan of this review is as follows: First we will describe an LC-MS based method called isotopic ratio outlier analysis (IROA; de Jong and Beecher, 2012) and show how this technique can achieve many of the advantages described above (Stupp et al., 2013). Next, we will show how 13C can be used at natural abundance in NMR metabolomics studies (Clendinen et al., 2014). This relatively simple approach can provide much more robust compound identification through database matching than by using 1H NMR alone. We will then describe a method using 13C enrichment that utilizes the 2D NMR experiment called INADEQUATE [incredible natural abundance double quantum transfer experiment (INADEQUATE); Clendinen et al., 2015]. Although INADEQUATE was developed for samples at natural abundance 13C, we use the same pulse sequence with 13C-labeled samples and thus keep the same name to avoid confusion about which NMR experiment is being used. INADEQUATE is perhaps the “gold standard” for natural product identification by NMR, and it has great advantages in metabolomics studies. Finally, we describe how 13C NMR can be used to identify unknown metabolites from an IROA LC-MS experiment.
The majority of applications we use to illustrate the 13C methods focus on the rich-soil or compost-dwelling nematode, Caenorhabditis elegans. All of the methods we present can be applied to plants or, if they can be cultured, plant parasitic nematodes. The NMR technique using natural abundance 13C NMR can use any type of sample if enough material is available. Other methods may require 13C isotopic labeling, which is easily done in plants. Some interesting recent applications of whole plant labeling include: (1) the examination of carbon flux in isoprenoid pathways in poplar grown with 13CO2 (Ghirardo et al., 2014), (2) the identification of sulfur-containing metabolites from onions using high-resolution FT-ICR MS (Nakabayashi et al., 2013), (3) the 13C isotopic labeling of tomatoes (Moran et al., 2013) and parsley, spinach, and peppermint (Gleichenhagen et al., 2013) to obtain biologically active phytochemicals for human metabolic studies, and (4) the 13CO2 labeling of potato plants to identify metabolites that are released by their roots and are subsequently incorporated into fungi in the rhizosphere (Hannula et al., 2012).
Isotopic Ratio Outlier Analysis
Isotopic ratio outlier analysis is an LC-MS-based stable isotope labeling strategy that allows for the discrimination of real compounds from artifacts (de Jong and Beecher, 2012; Stupp et al., 2013). In an IROA experiment, a group of experimental cells, tissues, or organisms, are labeled with 5% 13C, while a common reference or control population is labeled with 95% 13C. Extracts from both samples are mixed together, ideally in a 1:1 ratio so that the 5% labeled material is mixed with a comparable amount of the 95%. The mixed sample is then extracted and analyzed by LC-MS. A summary of this method is provided in Figure 1, using Caenorhabditis elegans as an example. Mixing the extracts reduces the technical variation between experimental and control pairs, because the 5 and 95% extracts are run at the same time on the LC-MS. In addition, the 95 and 5% gives rise to a distinctive isotopic peak pattern, allowing for simple discrimination between biosynthesized compounds and noise. An additional benefit of mixing is the decrease in the total number of samples to be run on the spectrometer, reducing the LC-MS cost per sample by half.
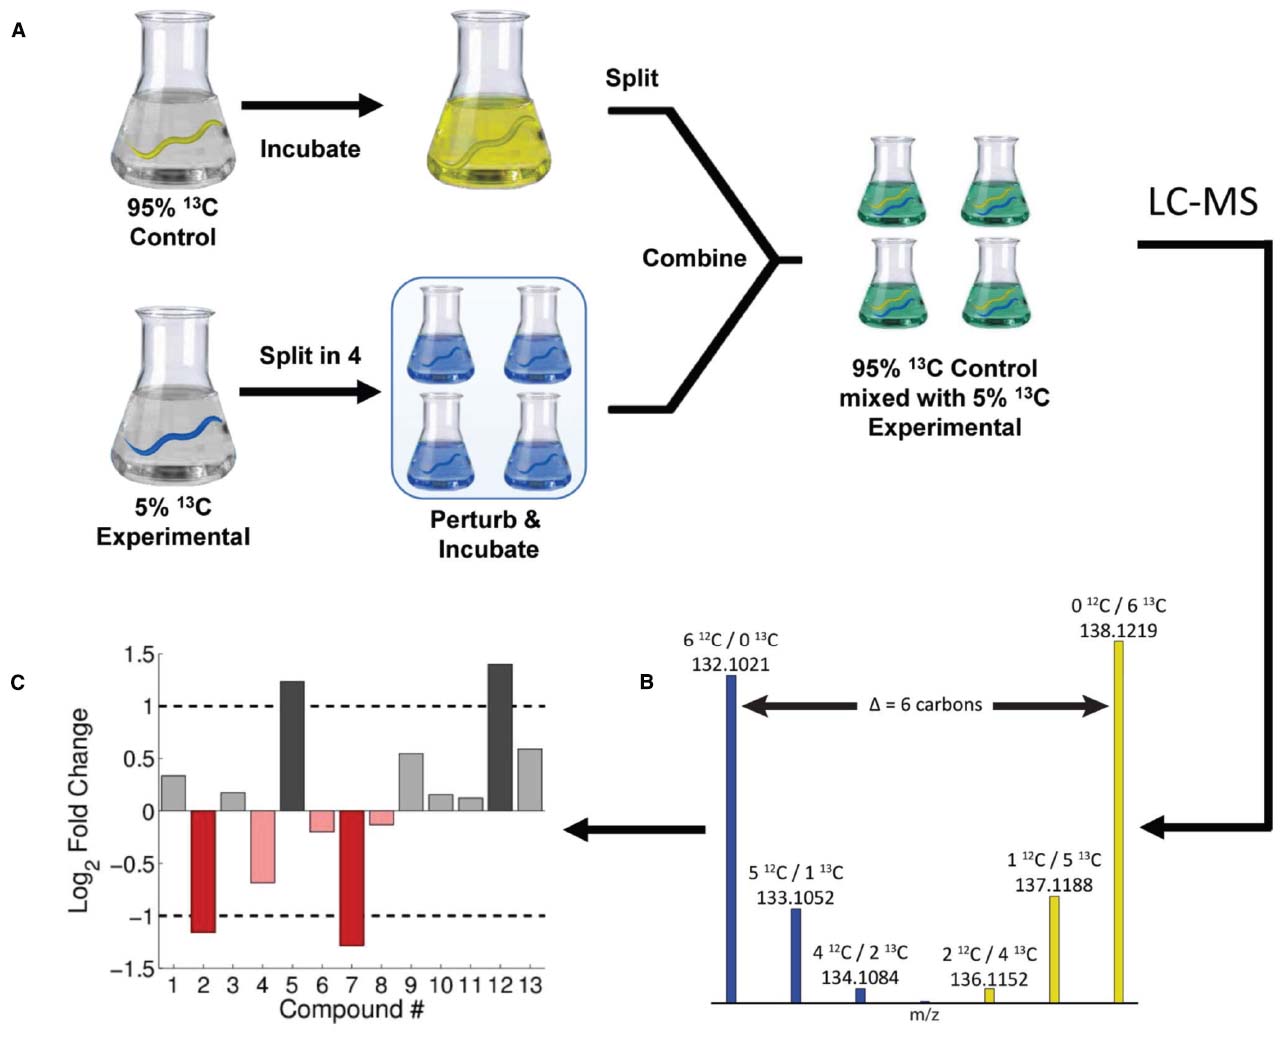
Figure 1. Summary of IROA methods using C. elegans. Control and experimental populations of C. elegans were grown on 95 and 5% 13C labeled bacteria, respectively (A). The experimental population were split prior to perturbation and then combined with control yielding mixed 95 and 5% 13C populations. LC-MS analysis on IROA samples reveals isotopic peak patters that provide carbon number (B) as well as relative quantitation (C). Figure used with permission from Stupp et al. (2013).
Unlike methods that use full isotopic labeling (>99% 13C) vs. unlabeled or natural abundance (∼1.1% 13C; Birkemeyer et al., 2005; Bueschl et al., 2014; Huang et al., 2014; Neumann et al., 2014), the use of 5% and the 95% 13C facilitates the detection of isotopic peaks that may be absent using other methods. This is because at natural abundance, particularly for low intensity features, more than one isotopic peak is not always detectable or simply mistaken as noise. Isotopic distribution patterns created by the use of enhanced universal but random incorporations, such as 5 or 95% 13C, allow automated determination of the number of carbons in a metabolite, which as shown in Figure 2, reduces the number of possible formulae (Stupp et al., 2013), and makes identification easier.
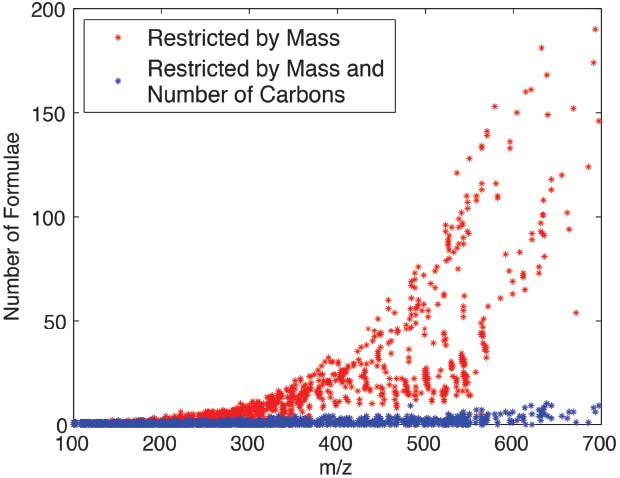
Figure 2. Number of possible molecular formulae as a function of mass restricted by mass alone (red) or both mass and number of carbons (blue). When restrained by both mass and number of carbons, the number of possible molecular formulae for a given mass is severely restricted. Figure adapted with permission from Stupp et al. (2013).
In the initial experimental demonstration of IROA, we used C. elegans and developed new strategies for isotopic labeling of this model organism (Stupp et al., 2013). The goal was to demonstrate the overall technical approach and to minimize or eliminate biological variation. Therefore, two populations of worms were grown to young adults on a diet of E. coli that was grown on either 5 or 95% 13C glucose as the primary carbon source. In order to examine the reproducibility of the method, the 5% 13C flask was split into 4 experimental replicates and heat shocked at 33°C for 30 min, while the 95% 13C control flask was kept at room temperature, as illustrated in Figure 1. The control was then split into 4, combined with the heat shock flasks, and separated into supernatant (exometabolome) and worm pellets (endometabolome). The processed extracts were then analyzed on a high mass-resolution Q-Exactive Orbitrap mass spectrometer (Thermo Scientific), and MS/MS was used to confirm the identity select compounds. For example, we found that purines were down-regulated in the heat shocked endometabolome (Stupp et al., 2013), consistent with literature (Lindquist, 1986; Richter et al., 2010; Morimoto, 2011).
It is often difficult or impossible to achieve complete isotopic labeling. In the case of C. elegans, not all potential carbon sources could be eliminated. This resulted in a dilution of the planned 13C labeling. Assuming the samples were prepared and handled identically, these dilution effects were acceptable because the general patterns still remained and the same material was used as an internal reference for all samples. The dilution/incorporation of the 13C in metabolites differed across metabolite features. In the 95% 13C channel, we experimentally measured incorporation ranges from about 80 to 98% 13C enrichment (Stupp et al., 2013). This range can be reduced by eliminating 12C sources of unlabeled nutrients, yet it cannot be totally eliminated, as there will always likely be some enzymatic isotope effects. The concern is whether the experimental study (e.g., heat shock) or the isotope effect is causing an observed change between the 5 and 95% 13C channels. For many studies, variation in labeling or isotope effects can be tolerated, because the same reference material is added to all samples. However, if isotope effects are determined to be a problem for quantification, it is possible to correct for these with a modified protocol, as shown in Figure 3. In this case, the 95% 13C group is now more appropriately termed a “reference” (Figure 3A), and the 5% 13C group is split into two populations, the experiment (e.g., heat shock) and a control (Figure 3B). The 95% reference material is then added to each of the 5% flasks (Figure 3C), and the relative response of each 5% channel compared to the same 95% reference will separate isotope effects from the response to the experimental perturbation.
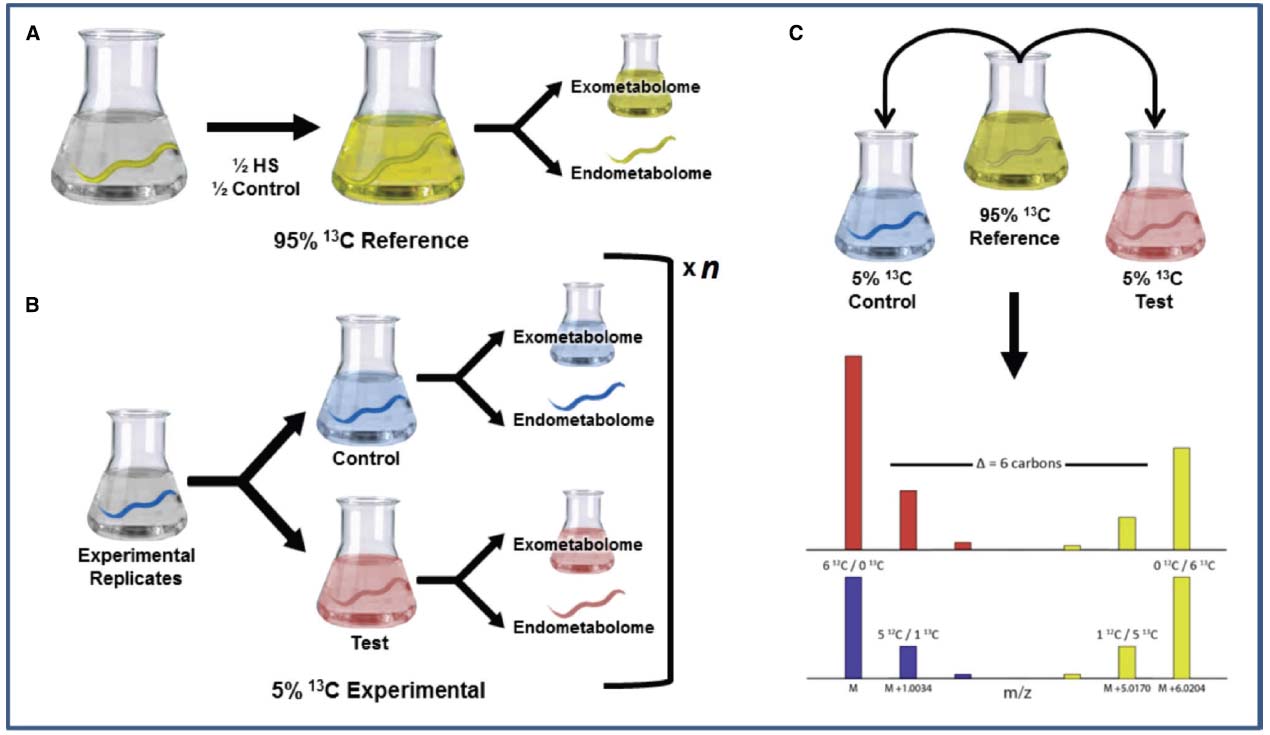
Figure 3. Experimental design to compensate for isotopic effects. (A) In this experiment, the 95% 13C population is mixed with replicates of both experimental and control groups and serves as an internal 13C metabolic reference. (B) Both test and control populations are then labeled with 5% 13C. (C) The 95% 13C reference is combined with each 5% test and control in equal concentrations. Such a design allows the 95%, which exhibits the largest isotopic effect (Stupp et al., 2013) to serve as a reference standard by which the 5% control and test metabolites are compared. Figure from the Ph.D. dissertation of Stupp (2014).
Isotopic ratio outlier analysis experiments allow for the relative quantification of hundreds to thousands of features, but like all MS-based experiments, exact compound identification remains a challenge. Standardization of LC conditions and calibration with compound libraries can help significantly, but even with known molecular formulae and retention times, a large fraction of features cannot be identified without additional information.
Nuclear Magnetic Resonance
Sensitivity is the major limitation of NMR in metabolomics and natural products studies, especially with 13C detection. The frequency of a resonance transition in NMR is equal to the product of the gyromagnetic ratio and the magnetic field ω0 = – γ * B0. A 1H nucleus in a 14.1 T magnet has a frequency of 600 MHz, and a 13C in the same magnetic field resonates at 150 MHz. The energies of these NMR transitions are approximately five orders of magnitude lower than thermal energy at room temperature. The result is extremely low starting Boltzmann polarization, with only 1 in over 65,000 of the 1H nuclei contributing to the signal. It is even worse for 13C (1 in 260,000). When this poor starting point is combined with the 1.1% natural abundance of 13C, it is not surprising that 13C is not typically used in metabolomics or natural products studies.
There are several ways to improve the situation with NMR sensitivity: use higher magnetic fields (costly; Fu et al., 2005); reduce the sample temperature (impractical for biological applications); dynamic nuclear polarization (Ardenkjaer-Larsen et al., 2003; Sze et al., 2012); improved NMR probes (Ramaswamy et al., 2013b); and isotopic labeling. The use of optimized NMR probes is a cost-effective way to improve sensitivity (Olson et al., 1995; Brey et al., 2006). Cryogenic probes with coils constructed from high-temperature superconducting (HTS) materials are especially sensitive and have been recently reviewed (Ramaswamy et al., 2013b). For the studies outlined below, we have used a specialized 1.5-mm cryogenic 13C-optimized probe made from HTS material and a sample volume of 40 μL (Ramaswamy et al., 2013a). Small volume probes are desirable for mass-limited samples, but for many 13C metabolomics applications, outstanding results can be obtained with commercially available 5-mm 13C cryogenic probes.
Natural Abundance 13C
Although the natural abundance of 13C is only 1.1%, it is still possible to obtain useful information for compound identification in metabolomics experiments if the probe and acquisition parameters are optimal. In fact, there are several advantages of 13C NMR at natural abundance. The resonances are narrow singlets; this significantly reduces resonance overlap and improves the ability to analyze dense spectral regions. In addition, spectral overlap is further reduced by the large spectral width (>200 ppm). Because organic molecules are carbon-based, 13C NMR gives a unique insight into the backbone structure rather than the periphery, as detected with 1H NMR. Unlike 1H-based methods, 13C NMR can detect quaternary carbons. With isotopic labeling the 13C signal is enhanced; however, isotopic labeling results in loss of the narrow singlets making the 13C spectrum resemble the 1H spectrum with all of its complications. In addition, isotopic labeling is not always possible.
Our specialized 13C probe (Ramaswamy et al., 2013a) allows for efficient collection of 13C 1D data at natural abundance. Figure 4 shows 1H and 13C NMR spectra of the same sample, which contains a mixture of 20 standard metabolites. The primary spectroscopic advantages of 13C NMR are easily seen: large chemical shift dispersion and narrow peaks. These advantages translate to improved metabolomics studies of mixtures (Clendinen et al., 2014). The basic strategy that we developed using just 1D 13C and 1H NMR data was to use statistical correlations to obtain 2D 13C–13C and 13C–1H correlation maps.
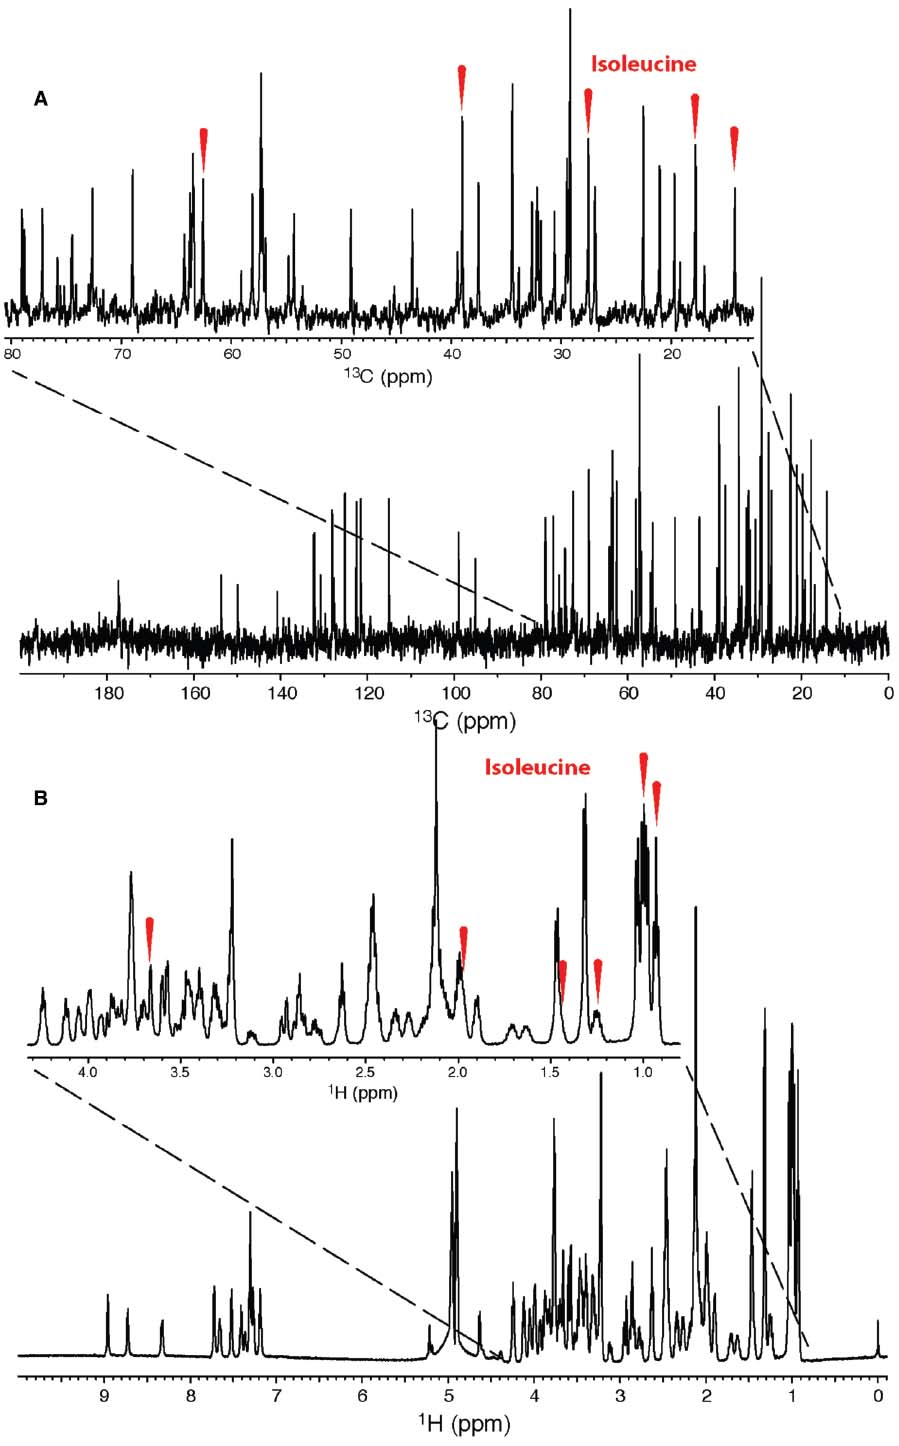
Figure 4. 1D 13C (A) and 1H (B) NMR spectra of a metabolic mixture. Due to the 13C spectral dispersion and narrow peaks, metabolite resonances such as those belonging to isoleucine (peaks indicated by red ticks), can be easily identified. Resonances in the corresponding 1D 1H spectrum often overlap due to coupling and small spectral width, resulting in difficult analysis. Figure used with permission from Ramaswamy et al. (2013a).
Statistical correlations of NMR or other types of data are extremely useful in metabolomics and natural products studies. There are several variations, but the simplest conceptually is statistical total correlation spectroscopy (STOCSY; Cloarec et al., 2005). We illustrate STOCSY here with Figure 5, in which we used 20 common metabolites from the biological magnetic resonance data bank (BMRB; Biological Magnetic Resonance Data Bank: Ulrich et al., 2008) to simulate 100 different spectra with randomly assigned concentrations of each metabolite (Figure 5A). The key concept underlying STOCSY is that all of the resonances of a given metabolite are perfectly correlated; that is, they will all change intensity in proportion to the concentration of the molecule. This is shown in Figure 5B where we show all correlations to the methyl peak of alanine, which in this case is considered the “driver” peak. When overlap is not severe, STOCSY will result in highly correlated peaks (red in Figure 5B) that are in the same molecule. Compounds from a common biosynthetic pathway can also show weaker correlations. The STOCSY in Figure 5B is one-dimensional, because it is only correlations to the alanine methyl. Two-dimensional STOCSYs (e.g., Figure 6A) can be made by correlating all resonances; these look similar to 2D TOCSY spectra, which correlate resonances spectroscopically rather than statistically. The difference is that STOCSY will also lead to correlations of resonances that are not J-coupled. For example, all of the peaks in phenylalanine will have STOCSY correlations but the aromatic and aliphatic resonances will not be correlated in TOCSY. A more extensive review of different versions of STOCSY has recently been published (Robinette et al., 2013). Another statistical tool that is useful is statistical heterospectroscopy or SHY (Crockford et al., 2006). SHY is essentially identical to STOCSY except that the correlations are between different types of datasets. The original demonstration of SHY was to correlate NMR and ultra performance liquid chromatography (UPLC)-MS (Ultra Performance Liquid Chromatography-MS) datasets, but other types of quantitative data can be analyzed using the same approach. One of the challenges with SHY is to find the proper scaling and normalization for the different datasets. In the example below, we used SHY to correlate 1H and 13C 1D data, which produces statistical maps that are similar to spectroscopic 2D HSQC-TOCSY data.
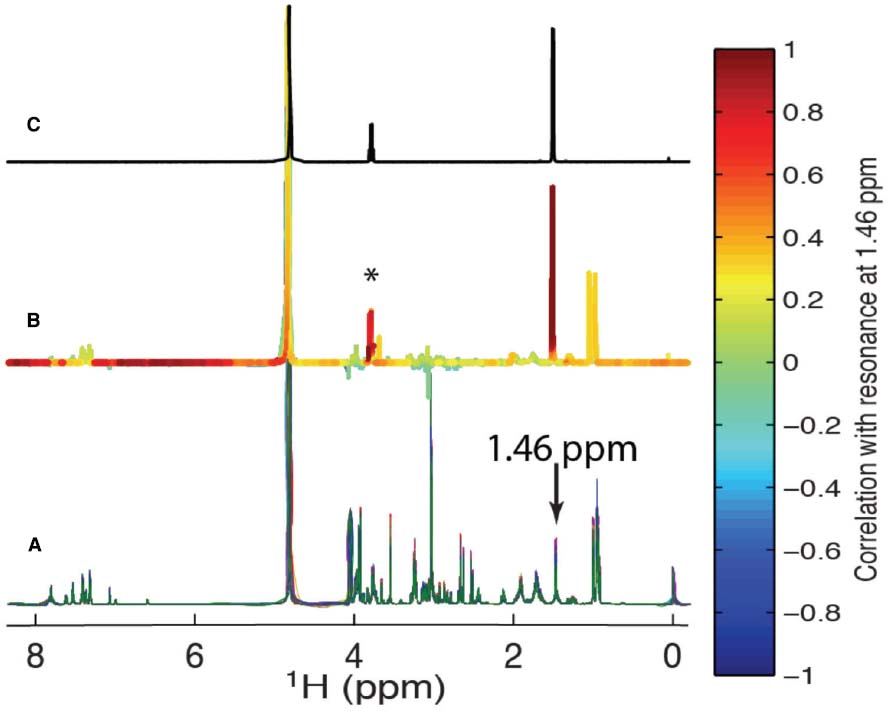
Figure 5. Statistical total correlation spectroscopy (STOCSY; Cloarec et al., 2005). In (A) we simulated 100 different spectra from a mixture of 20 common metabolites obtained from the BMRB (Ulrich et al., 2008). The concentrations of the metabolites were randomly adjusted in each spectrum. The STOCSY spectrum (B) was obtained by correlating all points in the spectra with the alanine methyl resonance at 1.46 ppm. The peak with a high correlation (*) is the alanine α-1H. The reference spectrum for alanine from the BMRB is shown in (C).
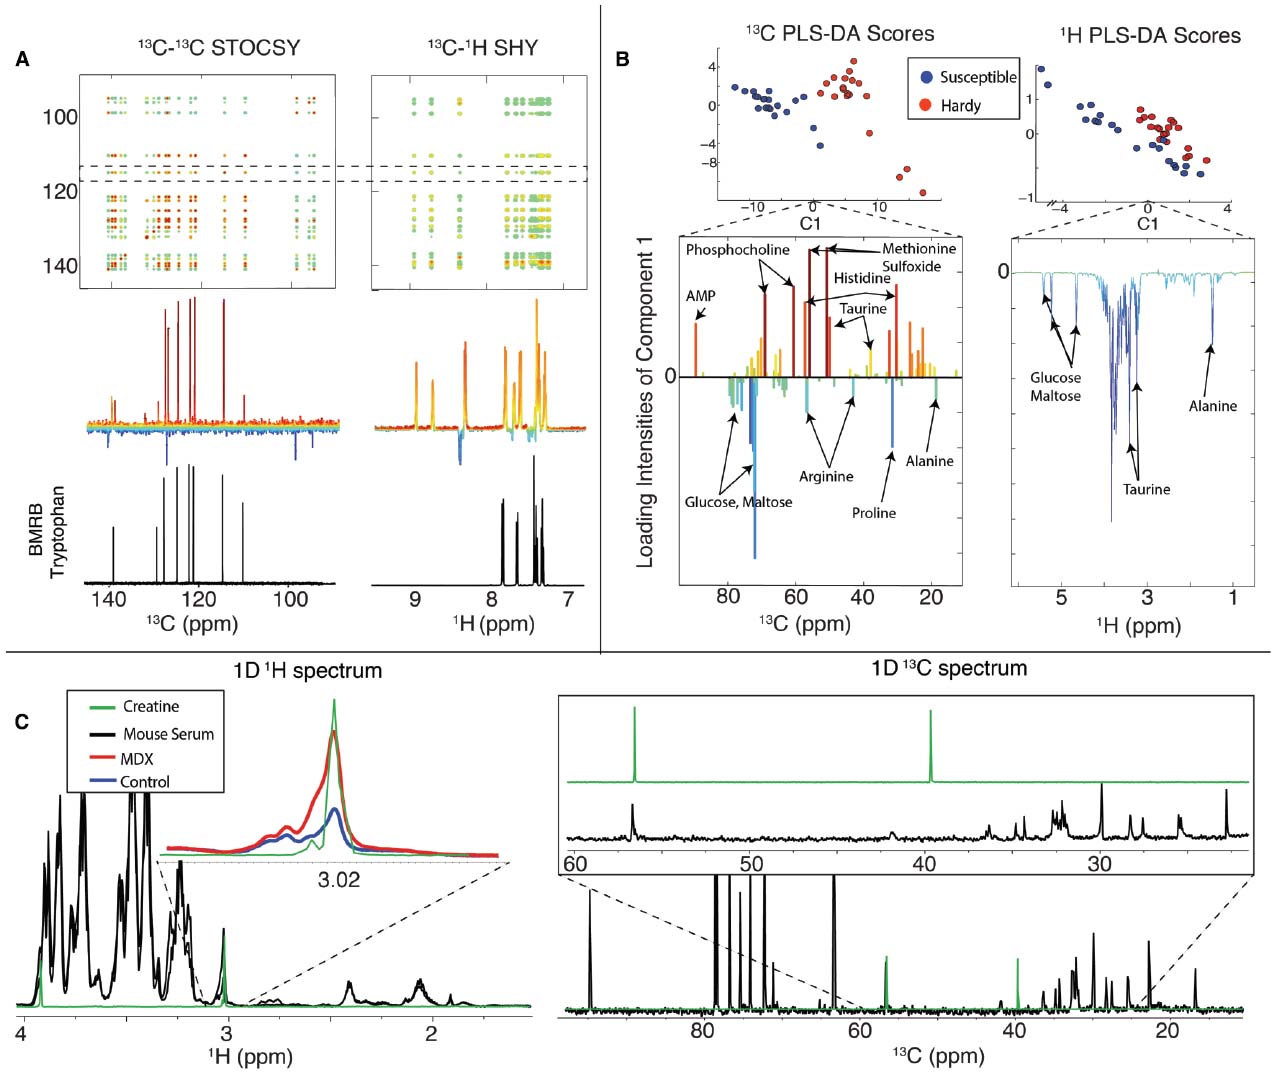
Figure 6. Summary of natural abundance 13C NMR metabolomics. In (A) we show 2D STOCSY and SHY correlation maps that were produced from the same mixture of 20 common metabolites that are shown in Figure 4. We made two groups with five replicates each that had variation introduced by individual pipetting. The 2D 13C–13C STOCSY spectrum in (A) is the 13C statistical correlation map from all the 13C 1D NMR data. The 2D 13C–1H SHY is the statistical correlation map between 13C and 1H 1D NMR data. In (B) we present a summary of a PLS-DA of fruit flies that were either cold susceptible (blue) or cold hardy (red). The left side shows the PLS-DA using 13C and the right side using 1H data. The improved 13C spectral resolution greatly improves the performance in multivariate analyses, such as PLS-DA. In (C) we obtained both 1H (left) and 13C 1D NMR data from mice with a mutation in the mdx gene, which causes Duchenne muscular dystrophy in humans. The resonances around 3.02 ppm in the 1H spectrum were consistent with creatine (green), but inspection of the 13C 1D spectra on the right shows no evidence for the corresponding 13C resonances, indicating that creatine is not the major component at 3.02 ppm. Thus, 13C data can help prevent misidentifications of metabolites. This figure was adapted from Clendinen et al. (2014), where more details about these studies can be found.
These statistical correlation maps were very useful in that they allowed us to generate peak lists that could be used to query databases of known compounds. When we compared the results of using 1H data alone with 13C, we were able to correctly match more metabolites to the BMRB database. We also investigated S/N limits of this approach and found that 60 nmol in 40 μL was about the lower limit with the NMR probe (Ramaswamy et al., 2013a) and parameters we used for data collection (∼2 h per spectrum). We discuss factors influencing NMR sensitivity below.
Multivariate analysis is routinely used in metabolomics. The simplest and most common approach is principal component analysis (PCA). The goal of PCA is to represent a high-dimensionality dataset in just a few dimensions that capture most of the variance. For example, in NMR data, each data point in a spectrum can be considered a dimension, meaning that for even 1D NMR studies the dimensionality is often as high as 64 or 128 k. Using PCA the data are rotated to a new coordinate system, which represents the variance of the data, ordered from highest to lowest. Thus, the first principal component (PC1) will be the axis with the greatest variance in the data, followed by PC2, PC3, etc. The output of a PCA is a scores plot, which is often a two-dimensional representation (e.g., PC1 vs. PC2) where every point is a sample in the study. An example of a simple PCA scores plot is shown in the inset of Figure 8 below, in which heat-shocked C. elegans (red triangles) are separated along PC1 from the controls (blue circles). Loadings plots indicate the specific features (e.g., NMR resonances or MS m/z values) that are responsible for the group separation represented by the scores plot.
Principal component analysis is an unsupervised technique, which means that the algorithm does not use information about sample groups (e.g., heat-shocked vs. controls). This is in contrast to supervised methods that use information about the origin of the samples. For example, in Figure 6B we show partial least squares-discriminant analysis (PLS-DA), a supervised method that includes in the algorithm knowledge of the groups (in Figure 6B cold hardy vs. cold susceptible fruit flies). Supervised methods are widely used and can be very useful, but they also must be used with care, because they are starting with a bias that the groups are meaningful to any differences that might be found.
We found that using 13C NMR at natural abundance led to improved performance in both PCA and PLS-DA. We compared the group separation and loadings using 13C NMR over 1D 1H alone. This improved performance follows from the greater spectral dispersion of 13C resonances when compared with 1H, as shown in Figure 4.
By using 1D 13C NMR, metabolite identification can be more robust when combined with 1H data. For example, we compared data from mdx mice (models for Duchenne muscular dystrophy) with control and found a peak in the 1H NMR spectra at 3.02 ppm that is normally ascribed to creatine. However, the 1D 13C NMR spectra did not contain the corresponding 13C resonance, which allowed us to rule out creatine as being the largest contributor to the 1H resonance (Figure 6C). Thus, 1D 13C NMR was able to prevent the misidentification of a metabolite. Our study showed that 1D 13C NMR global metabolomics at natural abundance is feasible and also yields (1) improved metabolite identification through the use of better peak lists resulting from reduced peak overlap (Figure 6A), (2) improved multivariate statistical analysis and therefore better group separation and more informative loadings plots (Figure 6B), and (3) additional important data, which can prevent the misidentification of metabolites (Figure 6C; Clendinen et al., 2014).
The major limitation to 13C NMR at natural abundance is sensitivity. The 13C 1D spectra required for the study summarized above required about 2 h each with very rapid recycling rates that attenuated resonances with long T1 relaxation times like quaternary carbons. The small volume probe that we used is ideal for mass-limited samples and provides excellent results for samples that can be concentrated. However, it is not ideal for samples with limited concentrations. The overall design of the NMR probe and sample size is critical in optimizing performance, and there are many factors that need to be considered. Two sample scenarios need to be taken into account: mass limited or concentration limited. When samples are mass limited, it is best to use the smallest volume probe and sample tube, because mass sensitivity is inversely proportional to the diameter of a sample (Olson et al., 1995). This is the situation with many natural product studies (e.g., Srinivasan et al., 2008; Dalisay et al., 2009; Molinski, 2009; Dalisay and Molinski, 2010). However, if the sample is not mass limited or if the sample has limited solubility, a larger volume probe will perform better. Another factor is the effect of salt, which can seriously degrade the performance of NMR probes, especially cryogenic probes (Kovacs et al., 2005). A smaller volume tube (Voehler et al., 2006) or a rectangular geometry (de Swiet, 2005) will improve cryogenic probe performance in salt. Salt loss is also dependent on frequency, with higher frequencies showing more severe loss than lower (Horiuchi et al., 2005). Therefore, an additional advantage of 13C detection is that it is less salt dependent than 1H detection. The small volume 13C probe that we used in the studies described here is optimal for mass limited samples. For example, using the 60 nmol of material mentioned above, we would expect between 2 and 3 times greater S/N from that sample in 40 μL using our customized HTS probe than the same 60 nmol in 600 μL using a commercial 5-mm cryogenic 13C-optimized probe (Ramaswamy et al., 2013a). However, as previously described (Clendinen et al., 2014), if the sample quantity is not limited, the same concentration of sample in a 5-mm 13C-optimized probe would produce about seven times greater S/N than we were able to measure in our reduced volume probe.
13C Isotopic Enrichment
To improve 13C sensitivity in NMR, the most straightforward approach is isotopic labeling. Although labeling adds cost to the sample preparation and is not always possible, it can greatly expand the utility of NMR-based metabolomics and natural products studies. The benefit of labeling goes beyond the obvious advantage of increasing the number of 13C nuclei beyond natural abundance. The method we describe below is based on the INADEQUATE experiment, which provides networks of carbons from correlations of directly bonded 13C atoms. INADEQUATE is one of the most powerful 2D NMR experiments for the identification of unknown compounds, but it is rarely used because of its insensitivity. An example of a nice alternate approach is the use of 1H detected 13C–13C TOCSY with the TOCCATA (TOCSY Customized Carbon Trace Archive) database developed by the Brüschweiler laboratory (Bingol et al., 2012). TOCCATA is a metabolomics NMR database adapted from the BMRB (Ulrich et al., 2008) and the human metabolome database (HMDB; Wishart et al., 2013) and contains over 400 compounds. The 13C–13C TOCSY, when used with TOCCATA, has yielded impressively accurate metabolite query results when compared to existing 13C chemical shift queries online (Bingol et al., 2012). The Brüschweiler laboratory has developed several other approaches using 13C NMR for metabolomics mixture analysis (Bingol et al., 2012, 2013, 2014a). The database matching protocol using just 13C-HSQC (directly bonded 13C–1H pairs) is particularly useful for generating potential matches to databases (Bingol et al., 2014b).
INADEQUATE
Incredible natural abundance double quantum transfer experiment obtains correlations of directly bonded 13C networks for unknown compound identification (Bax et al., 1980; Sorensen et al., 1982; Buddrus and Bauer, 1987). However, at natural abundance, very high concentrations of compounds are needed in order for the INADEQUATE experiment to provide any useful information. As stated previously, INADEQUATE reveals the carbon backbone of a molecule by connecting carbon networks through direct bond correlations. Beyond the general problems of 13C NMR sensitivity described above, INADEQUATE relies on adjacent 13C nuclei, which at natural abundance have a probability of 1 in 8264. However, with 99% 13C labeling, the probability of adjacent 13C atoms is essentially 100%. Markley and co-workers showed that excellent results on proteins could be obtained using INADEQUATE with 26% 13C labeling (Oh et al., 1988). This lower percentage of 13C slightly decreases the probability of obtaining two adjacent spins but also decreases longer range couplings and higher order interactions that are observed with 99% 13C labeling. A combination of 13C isotopic labeling, as well as better 13C sensitive HTS probe designs (Ramaswamy et al., 2013a), allows for INADEQUATE NMR to be a useful tool for metabolomics and compound identification (Clendinen et al., 2015).
Figure 7 shows an INADEQUATE spectrum collected from the endometabolome of one million C. elegans that have been isotopically labeled with 99% 13C. Clearly there is a great deal of information in this NMR spectrum, which is comparable in its complexity to a standard 1H–1H COSY experiment of a complex mixture. Some 13C–13C networks of metabolites are included in Figure 7 to illustrate the sort of information contained in these spectra. To make this approach useful for metabolomics and large numbers of samples, the process must be automated.
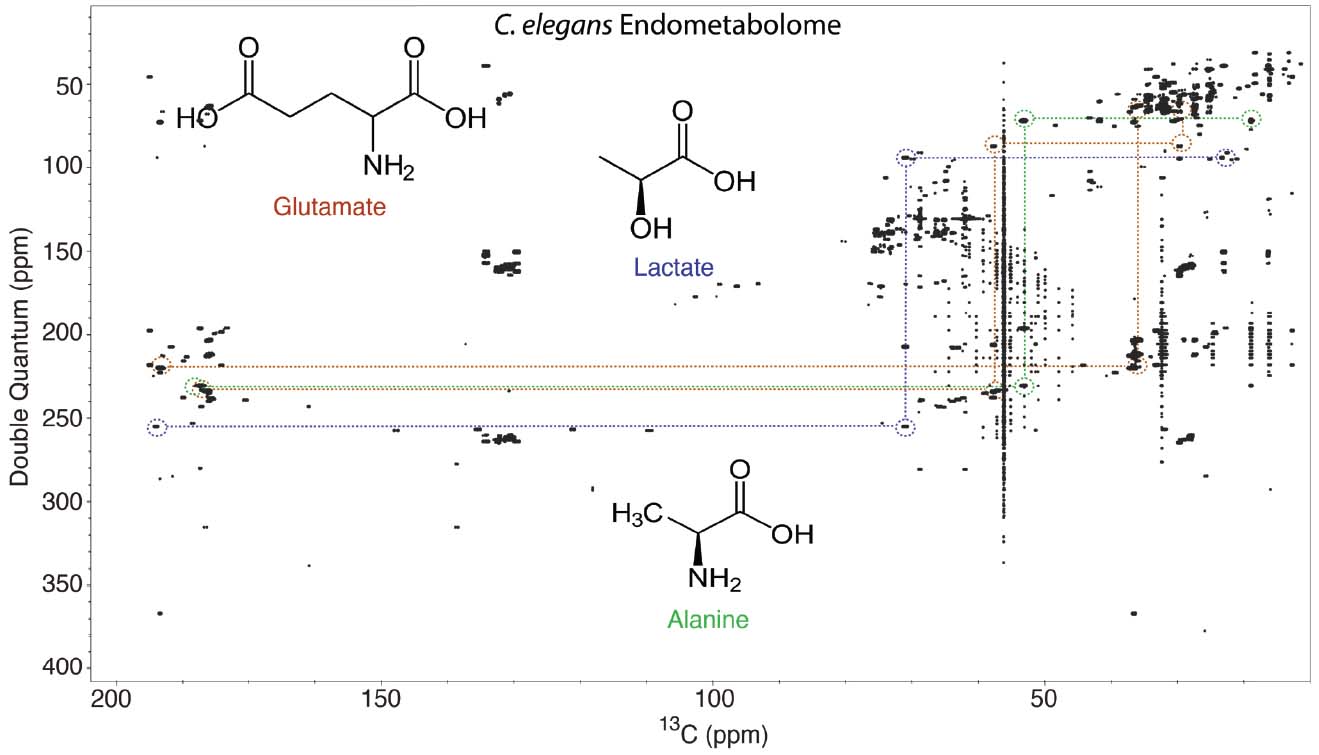
Figure 7. 2D INADEQUATE NMR spectrum of the endometabolome of 13C-labeled C. elegans. The horizontal axis is the 13C chemical shift, and the vertical axis is the double quantum chemical shift. Cross-peaks appear on the double quantum axis at the sum of the two interacting 13C frequencies. This spectrum has a very large amount of information, and we developed INETA to extract some of this information in a semi-automated way. Details can be found in the original publication (Clendinen et al., 2015), but some of the output of INETA applied to this spectrum is shown in the dashed lines, which highlight INADEQUATE spin systems from glutamate (brown), lactate (blue), and alanine (green) in the endometabolome.
One of the advantages of 13C NMR is efficient database matching of known compounds. However, there are no databases of INADEQUATE spectra for metabolites and natural products. In order to construct an in silico database, one only needs 13C 1D spectra of a known compounds with resonance assignments. For two correlated 13C resonances, an INADEQUATE spectrum has two peaks; the horizontal axis gives the 13C chemical shifts of each resonance and the vertical double quantum axis is the sum of the two 13C chemical shifts (Figure 7). Using this information, we have made an INADEQUATE database from over 1000 reference metabolites in the BMRB. To extract metabolites from spectra like that shown in Figure 7, we have written a software package called INETA (INADEQUATE Network Analysis) that identifies networks in experimental INADEQUATE spectra (Clendinen et al., 2015). The steps of INETA are (1) to peak-pick the spectrum, (2) find all the pairs of peaks that follow the rules of INADEQUATE (double quantum frequency is the sum of the two interacting peaks), (3) match the chemical shifts of all the pairs to make partial or complete 13C–13C networks, and (4) match the networks to the in silico database. This is all described in complete detail in the primary reference (Clendinen et al., 2015). Using INETA, the NMR analyst can also directly analyze networks that did not match known compounds. Unknown compounds can be discovered using traditional natural products approaches of 13C network analysis with the addition of LC-MS data, such as IROA, and quantum mechanical calculations of 13C chemical shifts (Wang et al., 2009).
In addition to extracting networks, we are able to analyze multiple INADEQUATE spectra from a metabolomics study using a 2D NMR multivariate analysis method developed previously (Robinette et al., 2011). When networks from INETA are superimposed onto the resulting PCA 2D NMR loadings plots, one can quickly identify metabolites that change in a study (Figure 8).
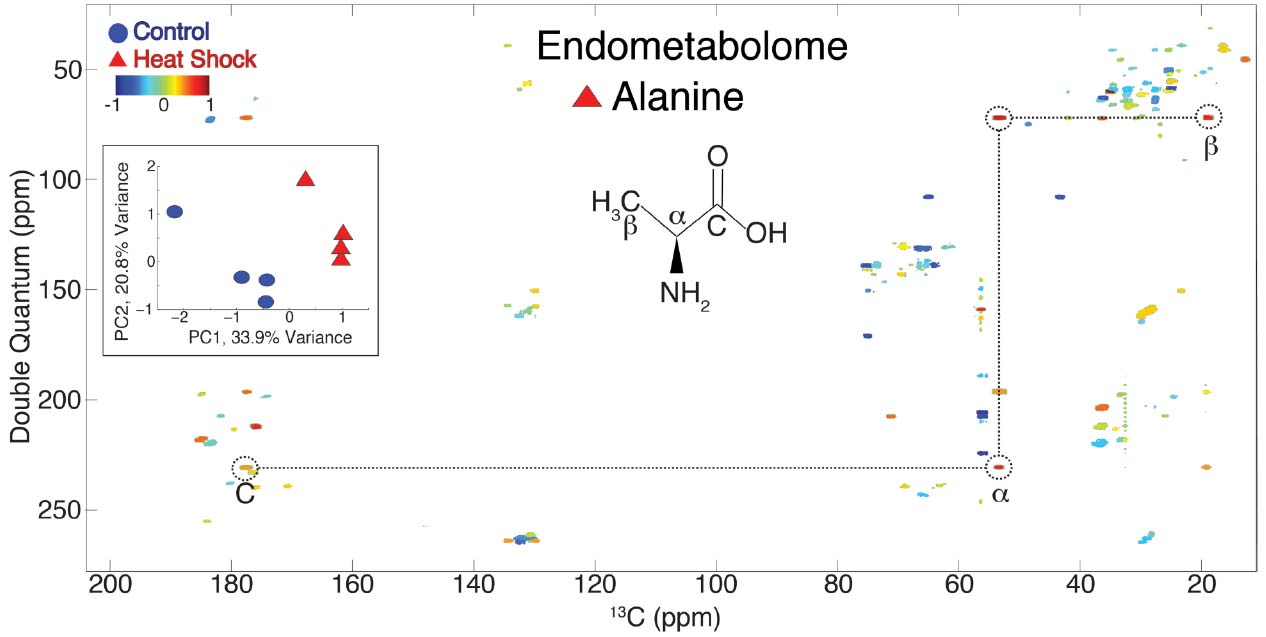
Figure 8. Principal component analysis scores and loadings plot of control (blue circle) and heat shock (red triangle) for all the INADEQUATE 2D NMR data from the C. elegans endometabolome. This 2D NMR PCA was developed for TOCSY spectra but can be applied to any 2D NMR data (Robinette et al., 2011). The PCA scores plot (inset) displays clear separation along PC1. The loadings plot from PC1 is shown in the main spectrum and indicates which resonances are correlated with the control (blue) or heat shock (red). Alanine, for example, strongly correlates with heat shocked animals (Clendinen et al., 2015).
Combining NMR and IROA for Compound ID
Isotopic ratio outlier analysis relies on database matching or standard libraries for definitive compound identification, and discrimination of isomers can be difficult or impossible using just MS alone. To identify truly unknown compounds or those not in databases, it is generally necessary to combine LC-MS with NMR (Lambert et al., 2007; Tayyari et al., 2013; Wolfender et al., 2013). The challenge is that NMR sensitivity is much lower than LC-MS sensitivity. A properly selected NMR probe can help. Although many factors influence NMR probe sensitivity, as discussed above, one of the major variables is size: NMR mass sensitivity is roughly proportional to the inverse of the diameter of the coil of the probe. Thus, a small volume probe can help bridge the NMR/LC-MS sensitivity mismatch. Using our 1.5-mm 13C-optimized probe, we have been exploring ways to combine the power of NMR in structural determination with LC-MS sensitivity. The overall approach is to collect fractions from an LC-MS run of an IROA experiment. If necessary, several samples could be reinjected to obtain enough material for NMR. Then, using the LC-MS as a guide, we find an IROA fraction of interest that we are not able to identify using libraries or databases. The LC-MS fraction can be dried, and the resulting material can be resuspended in an appropriate NMR solvent. The IROA labeling leads to a mixture of 5 and 95% 13C, and for 13C NMR the majority of the signal originates from the 95% material. In our preliminary studies, we have been able to collect useful 13C 1D as well as various 2D NMR data with five LC-MS injections. The 13C chemical shifts, along with other 2D experiments and the molecular formula provided from the IROA LC-MS experiment, are often enough to identify unknowns.
Conclusion
13C-based metabolomics is both useful and practical. Using a combination of isotopic labeling strategies, high-resolution LC-MS instruments, and 13C-optimized NMR probes, it is now possible to more efficiently dereplicate complex mixtures through improved database matching and to identify unknown metabolites or natural products of interest. LC-MS techniques such as IROA allow for the detection of thousands of features in an untargeted manner. IROA not only allows for the discrimination of features from the background, but also provides relative quantitation of features and a more accurate estimate of molecular formulae. Natural abundance 13C NMR can give nice advantages over exclusively 1H-based methods due to narrow peaks that are well-resolved over large spectral widths. Isotopic labeling greatly increases the S/N of 13C NMR, especially in 13C–13C correlation experiments like INADEQUATE. By combining NMR and LC-MS experiments, unknown compounds can be identified.
Conflict of Interest Statement
Chris Beecher is the inventor and CSO of IROA Technologies. Patent 7,820,963. Beecher (Inventor) “Method for generation and use of isotopic patterns in mass spectral data of simple organisms,” issued October 2010. This is the base IROA patent (main patent and CIPs). Patent 7,820,964. Beecher (Inventor) “Method for generation and use of stable isotope patterns in mass spectral data” issued October 2010. This is the IROA standards patent. The other authors declare that the research was conducted in the absence of any commercial or financial relationships that could be construed as a potential conflict of interest.
Acknowledgments
We thank Bill Brey, Jerris Hooker, and Vijay Ramaswamy for the HTS NMR probe and continued support. Mark Szewc at Thermo Fisher Scientific and Tim Garrett helped with IROA LCMS data collection. Hamadi McIntosh helped with the simulations of STOCSY data shown in Figure 5. NMR data were collected at the National High Magnetic Field Laboratory’s AMRIS Facility, which is supported by National Science Foundation Cooperative Agreement No. DMR-1157490 and the State of Florida. Funding for this study was from the NIH (1U24DK097209-01A1 and R01EB009772 to AE).
References
Ardenkjaer-Larsen, J. H., Fridlund, B., Gram, A., Hansson, G., Hansson, L., Lerche, M. H., et al. (2003). Increase in signal-to-noise ratio of > 10,000 times in liquid-state NMR. Proc. Natl. Acad. Sci. U.S.A. 100, 10158–10163. doi: 10.1073/pnas.1733835100
Bax, A., Freeman, R., and Kempsell, S. P. (1980). Natural abundance 13C–13C coupling observed via double-quantum coherence. J. Am. Chem. Soc. 102, 4849–4851. doi: 10.1021/ja00534a056
Bennett, B. D., Yuan, J., Kimball, E. H., and Rabinowitz, J. D. (2008). Absolute quantitation of intracellular metabolite concentrations by an isotope ratio-based approach. Nat. Protoc. 3, 1299–1311. doi: 10.1038/nprot.2008.107
Bingol, K., Bruschweiler-Li, L., Li, D.-W., and Brüschweiler, R. (2014a). Customized metabolomics database for the analysis of NMR 1H-1H TOCSY and 13C-1H HSQC-TOCSY spectra of complex mixtures. Anal. Chem. 86, 5494–5501. doi: 10.1021/ac500979g
Bingol, K., Li, D.-W., Bruschweiler-Li, L., Cabrera, O., Megraw, T., Zhang, F., et al. (2014b). Unified and isomer-specific NMR metabolomics database for the accurate analysis of 13C-1H HSQC spectra. ACS Chem. Biol. 10, 452–459. doi: 10.1021/cb5006382
Bingol, K., Zhang, F., Bruschweiler-Li, L., and Brüschweiler, R. (2012). TOCCATA: a customized carbon total correlation spectroscopy NMR metabolomics database. Anal. Chem. 84, 9395–9401. doi: 10.1021/ac302197e
Bingol, K., Zhang, F., Bruschweiler-Li, L., and Brüschweiler, R. (2013). Quantitative analysis of metabolic mixtures by two-dimensional 13C constant-time TOCSY NMR spectroscopy. Anal. Chem. 85, 6414–6420. doi: 10.1021/ac400913m
Birkemeyer, C., Luedemann, A., Wagner, C., Erban, A., and Kopka, J. (2005). Metabolome analysis: the potential of in vivo labeling with stable isotopes for metabolite profiling. Trends Biotechnol. 23, 28–33. doi: 10.1016/j.tibtech.2004.12.001
Brey, W. W., Edison, A. S., Nast, R. E., Rocca, J. R., Saha, S., and Withers, R. S. (2006). Design, construction, and validation of a 1-mm triple-resonance high-temperature-superconducting probe for NMR. J. Magn. Reson. 179, 290–293. doi: 10.1016/j.jmr.2005.12.008
Buddrus, J., and Bauer, H. (1987). Direct identification of the carbon skeleton of organic compounds using double quantum coherence 13C NMR spectroscopy. The INADEQUATE Pulse Sequence. Angew. Chem. Int. Ed. Engl. 26, 625–642. doi: 10.1002/anie.198706251
Buescher, J. M., Antoniewicz, M. R., Boros, L. G., Burgess, S. C., Brunengraber, H., Clish, C. B., et al. (2015). A roadmap for interpreting C metabolite labeling patterns from cells. Curr. Opin. Biotechnol. 34, 189–201. doi: 10.1016/j.copbio.2015.02.003
Bueschl, C., Kluger, B., Lemmens, M., Adam, G., Wiesenberger, G., Maschietto, V., et al. (2014). A novel stable isotope labelling assisted workflow for improved untargeted LC-HRMS based metabolomics research. Metabolomics 10, 754–769. doi: 10.1007/s11306-013-0611-0
Clendinen, C. S., Lee-Mcmullen, B., Williams, C. M., Stupp, G. S., Vandenborne, K., Hahn, D. A., et al. (2014). 13C NMR metabolomics: applications at natural abundance. Anal. Chem. 86, 9242–9250. doi: 10.1021/ac502346h
Clendinen, C. S., Pasquel, C., Ajredini, R., and Edison, A. S. (2015). 13C NMR Metabolomics: INADEQUATE Network Analysis. Anal. Chem. 87, 5698–5706. doi: 10.1021/acs.analchem.5b00867
Cloarec, O., Dumas, M. E., Craig, A., Barton, R. H., Trygg, J., Hudson, J., et al. (2005). Statistical total correlation spectroscopy: an exploratory approach for latent biomarker identification from metabolic 1H NMR data sets. Anal. Chem. 77, 1282–1289. doi: 10.1021/ac048630x
Colombo Serra, S., Karlsson, M., Giovenzana, G. B., Cavallotti, C., Tedoldi, F., and Aime, S. (2012). Hyperpolarized 13C-labelled anhydrides as DNP precursors of metabolic MRI agents. Contrast Media Mol. Imaging 7, 469–477. doi: 10.1002/cmmi.1474
Crockford, D. J., Holmes, E., Lindon, J. C., Plumb, R. S., Zirah, S., Bruce, S. J., et al. (2006). Statistical heterospectroscopy, an approach to the integrated analysis of NMR and UPLC-MS data sets: application in metabonomic toxicology studies. Anal. Chem. 78, 363–371. doi: 10.1021/ac051444m
Dalisay, D. S., and Molinski, T. F. (2010). Structure elucidation at the nanomole scale. 3. Phorbasides G-I from Phorbas sp. J. Nat. Prod. 73, 679–682. doi: 10.1021/np1000297
Dalisay, D. S., Rogers, E. W., Edison, A. S., and Molinski, T. F. (2009). Structure elucidation at the nanomole scale. 1. Trisoxazole macrolides and thiazole-containing cyclic peptides from the nudibranch Hexabranchus sanguineus. J. Nat. Prod. 72, 732–738. doi: 10.1021/np8007649
de Jong, F. A., and Beecher, C. (2012). Addressing the current bottlenecks of metabolomics: Isotopic Ratio Outlier Analysis™, an isotopic-labeling technique for accurate biochemical profiling. Bioanalysis 4, 2303–2314. doi: 10.4155/bio.12.202
de Swiet, T. M. (2005). Optimal electric fields for different sample shapes in high resolution NMR spectroscopy. J. Magn. Reson. 174, 331–334. doi: 10.1016/j.jmr.2005.02.007
Feldberg, L., Venger, I., Malitsky, S., Rogachev, I., and Aharoni, A. (2009). Dual labeling of metabolites for metabolome analysis (DLEMMA): a new approach for the identification and relative quantification of metabolites by means of dual isotope labeling and liquid chromatography-mass spectrometry. Anal. Chem. 81, 9257–9266. doi: 10.1021/ac901495a
Fennell, T. R., Sumner, S. C. J., Snyder, R. W., Burgess, J., and Friedman, M. A. (2006). Kinetics of elimination of urinary metabolites of acrylamide in humans. Toxicol. Sci. 93, 256–267. doi: 10.1093/toxsci/kfl069
Fu, R., Brey, W. W., Shetty, K., Gor’kov, P., Saha, S., Long, J. R., et al. (2005). Ultra-wide bore 900 MHz high-resolution NMR at the National High Magnetic Field Laboratory. J. Magn. Reson. 177, 1–8. doi: 10.1016/j.jmr.2005.07.013
Garner, C. E., Sumner, S. C. J., Davis, J. G., Burgess, J. P., Yueh, Y., Demeter, J., et al. (2006). Metabolism and disposition of 1-bromopropane in rats and mice following inhalation or intravenous administration. Toxicol. Appl. Pharmacol. 215, 23–36. doi: 10.1016/j.taap.2006.01.010
Ghirardo, A., Wright, L. P., Bi, Z., Rosenkranz, M., Pulido, P., Rodriguez-Concepcion, M., et al. (2014). Metabolic flux analysis of plastidic isoprenoid biosynthesis in poplar leaves emitting and nonemitting isoprene. Plant Physiol. 165, 37–51. doi: 10.1104/pp.114.236018
Giavalisco, P., Kohl, K., Hummel, J., Seiwert, B., and Willmitzer, L. (2009). 13C isotope-labeled metabolomes allowing for improved compound annotation and relative quantification in liquid chromatography-mass spectrometry-based metabolomic research. Anal. Chem. 81, 6546–6551. doi: 10.1021/ac900979e
Gleichenhagen, M., Zimmermann, B. F., Herzig, B., Janzik, I., Jahnke, S., Boner, M., et al. (2013). Intrinsic isotopic 13C labelling of polyphenols. Food Chem. 141, 2582–2590. doi: 10.1016/j.foodchem.2013.05.070
Golman, K., Zandt, R. I., Lerche, M., Pehrson, R., and Ardenkjaer-Larsen, J. H. (2006). Metabolic imaging by hyperpolarized 13C magnetic resonance imaging for in vivo tumor diagnosis. Cancer Res. 66, 10855–10860. doi: 10.1158/0008-5472.CAN-06-2564
Hannula, S. E., Boschker, H. T., De Boer, W., and Van Veen, J. A. (2012). 13C pulse-labeling assessment of the community structure of active fungi in the rhizosphere of a genetically starch-modified potato (Solanum tuberosum) cultivar and its parental isoline. New Phytol. 194, 784–799. doi: 10.1111/j.1469-8137.2012.04089.x
Horiuchi, T., Takahashi, M., Kikuchi, J., Yokoyama, S., and Maeda, H. (2005). Effect of dielectric properties of solvents on the quality factor for a beyond 900 MHz cryogenic probe model. J. Magn. Reson. 174, 34–42. doi: 10.1016/j.jmr.2005.01.004
Huang, X., Chen, Y. J., Cho, K., Nikolskiy, I., Crawford, P. A., and Patti, G. J. (2014). X13CMS: global tracking of isotopic labels in untargeted metabolomics. Anal. Chem. 86, 1632–1639. doi: 10.1021/ac403384n
Kovacs, H., Moskau, D., and Spraul, M. (2005). Cryogenically cooled probes—a leap in NMR technology. Prog. Nucl. Magn. Reson. Spectrosc. 46, 131–155. doi: 10.1016/j.pnmrs.2005.03.001
Kwon, Y., Park, S., Shin, J., and Oh, D. C. (2014). Application of 13C-labeling and 13C–13C COSY NMR experiments in the structure determination of a microbial natural product. Arch. Pharm. Res. 37, 967–971. doi: 10.1007/s12272-013-0254-8
Lambert, M., Wolfender, J.-L., Stærk, D., Christensen, S. B., Hostettmann, K., and Jaroszewski, J. W. (2007). Identification of natural products using HPLC-SPE combined with CapNMR. Anal. Chem. 79, 727–735. doi: 10.1021/ac0616963
Lindquist, S. (1986). The heat-shock response. Annu. Rev. Biochem. 55, 1151–1191. doi: 10.1146/annurev.bi.55.070186.005443
Merritt, M. E., Harrison, C., Storey, C., Jeffrey, F. M., Sherry, A. D., and Malloy, C. R. (2007). Hyperpolarized 13C allows a direct measure of flux through a single enzyme-catalyzed step by NMR. Proc. Natl. Acad. Sci. U.S.A. 104, 19773–19777. doi: 10.1073/pnas.0706235104
Molinski, T. F. (2009). Nanomole-scale natural products discovery. Curr. Opin. Drug Discov. Devel. 12, 197–206.
Moran, N. E., Rogers, R. B., Lu, C. H., Conlon, L. E., Lila, M. A., Clinton, S. K., et al. (2013). Biosynthesis of highly enriched 13C-lycopene for human metabolic studies using repeated batch tomato cell culturing with 13C-glucose. Food Chem. 139, 631–639. doi: 10.1016/j.foodchem.2013.01.016
Moreno, K. X., Satapati, S., Deberardinis, R. J., Burgess, S. C., Malloy, C. R., and Merritt, M. E. (2014). Real-time detection of hepatic gluconeogenic and glycogenolytic states using hyperpolarized [2-13C]dihydroxyacetone. J. Biol. Chem. 289, 35859–35867. doi: 10.1074/jbc.M114.613265
Morimoto, R. I. (2011). The heat shock response: systems biology of proteotoxic stress in aging and disease. Cold. Spring Harb. Symp. Quant. Biol. 76, 91–99. doi: 10.1101/sqb.2012.76.010637
Moseley, H. N., Lane, A. N., Belshoff, A. C., Higashi, R. M., and Fan, T. W. (2011). A novel deconvolution method for modeling UDP-N-acetyl-d-glucosamine biosynthetic pathways based on 13C mass isotopologue profiles under non-steady-state conditions. BMC Biol. 9:37. doi: 10.1186/1741-7007-9-37
Nakabayashi, R., Sawada, Y., Yamada, Y., Suzuki, M., Hirai, M. Y., Sakurai, T., et al. (2013). Combination of liquid chromatography-Fourier transform ion cyclotron resonance-mass spectrometry with 13C-labeling for chemical assignment of sulfur-containing metabolites in onion bulbs. Anal. Chem. 85, 1310–1315. doi: 10.1021/ac302733c
Neumann, N. K., Lehner, S. M., Kluger, B., Bueschl, C., Sedelmaier, K., Lemmens, M., et al. (2014). Automated LC-HRMS(/MS) approach for the annotation of fragment ions derived from stable isotope labeling-assisted untargeted metabolomics. Anal. Chem. 86, 7320–7327. doi: 10.1021/ac501358z
Oh, B. H., Westler, W. M., Darba, P., and Markley, J. L. (1988). Protein carbon-13 spin systems by a single two-dimensional nuclear magnetic resonance experiment. Science 240, 908–911.
Olson, D. L., Peck, T. L., Webb, A. G., Magin, R. L., and Sweedler, J. V. (1995). High-resolution microcoil H-1-NMR for mass-limited, nanoliter-volume samples. Science 270, 1967–1970. doi: 10.1126/science.270.5244.1967
Purmal, C., Kucejova, B., Sherry, A. D., Burgess, S. C., Malloy, C. R., and Merritt, M. E. (2014). Propionate stimulates pyruvate oxidation in the presence of acetate. Am. J. Physiol. Heart Circ. Physiol. 307, H1134–H1141. doi: 10.1152/ajpheart.00407.2014
Ramaswamy, V., Hooker, J. W., Withers, R. S., Nast, R. E., Brey, W. W., and Edison, A. S. (2013a). Development of a 13C-optimized 1.5-mm high temperature superconducting NMR probe. J. Magn. Reson. 235C, 58–65. doi: 10.1016/j.jmr.2013.07.012
Ramaswamy, V., Hooker, J. W., Withers, R. S., Nast, R. E., Edison, A. S., and Brey, W. W. (2013b). Microsample Cryogenic Probes: Technology and Applications. eMagRes 2, 215–228. doi: 10.1002/9780470034590
Richter, K., Haslbeck, M., and Buchner, J. (2010). The heat shock response: life on the verge of death. Mol. Cell 40, 253–266. doi: 10.1016/j.molcel.2010.10.006
Robinette, S., Ajredini, R., Rasheed, H., Zeinomar, A., Schroeder, F., Dossey, A., et al. (2011). Hierarchical alignment and full resolution pattern recognition of 2D NMR spectra: application to nematode chemical ecology. Anal. Chem. 83, 1649–1657. doi: 10.1021/ac102724x
Robinette, S., Brüschweiler, R., Schroeder, F., and Edison, A. (2012). NMR in metabolomics and natural products research: two sides of the same coin. Acc. Chem. Res. 45, 288–297. doi: 10.1021/ar2001606
Robinette, S. L., Lindon, J. C., and Nicholson, J. K. (2013). Statistical spectroscopic tools for biomarker discovery and systems medicine. Anal. Chem. 85, 5297–5303. doi: 10.1021/ac4007254
Schroeder, M. A., Cochlin, L. E., Heather, L. C., Clarke, K., Radda, G. K., and Tyler, D. J. (2008). In vivo assessment of pyruvate dehydrogenase flux in the heart using hyperpolarized carbon-13 magnetic resonance. Proc. Natl. Acad. Sci. U.S.A. 105, 12051–12056. doi: 10.1073/pnas.0805953105
Sorensen, O. W., Freeman, R., Frenkiel, T., Mareci, T. H., and Schuck, R. (1982). Observation of 13C–13C couplings with enhanced sensitivity. J. Magn. Reson. 46, 180–184. doi: 10.1016/0022-2364(82)90181-0
Srinivasan, J., Kaplan, F., Ajredini, R., Zachariah, C., Alborn, H. T., Teal, P. E., et al. (2008). A blend of small molecules regulates both mating and development in Caenorhabditis elegans. Nature 454, 1115–1118. doi: 10.1038/nature07168
Stupp, G. S., Clendinen, C. S., Ajredini, R., Szewc, M. A., Garrett, T., Menger, R. F., et al. (2013). Isotopic ratio outlier analysis global metabolomics of Caenorhabditis elegans. Anal. Chem. 85, 11858–11865. doi: 10.1021/ac4025413
Stupp, G. S. (2014). Metabolomics as a Tool for Understanding Stress Responses in Caenorhabditis elegans. Ph. D. thesis, University of Florida, Gainesville, FL.
Sumner, S. C. J., Macneela, J. P., and Fennell, T. R. (1992). Characterization and quantitation of urinary metabolites of [1,2,3-13C] acrylamide in rats and mice using 13C nuclear-magnetic-resonance spectroscopy. Chem. Res. Toxicol. 5, 81–89. doi: 10.1021/tx00025a014
Sumner, S. C. J., Williams, C. C., Snyder, R. W., Krol, W. L., Asgharian, B., and Fennell, T. R. (2003). Acrylamide: a comparison of metabolism and hemoglobin adducts in rodents following dermal, intraperitoneal, oral, or inhalation exposure. Toxicol. Sci. 75, 260–270. doi: 10.1093/toxsci/kfg191
Sze, K. H., Wu, Q., Tse, H. S., and Zhu, G. (2012). Dynamic nuclear polarization: new methodology and applications. Top. Curr. Chem. 326, 215–242. doi: 10.1007/128_2011_297
Tayyari, F., Gowda, G. A., Gu, H., and Raftery, D. (2013). 15N-cholamine—a smart isotope tag for combining NMR- and MS-based metabolite profiling. Anal. Chem. 85, 8715–8721. doi: 10.1021/ac401712a
Ulrich, E. L., Akutsu, H., Doreleijers, J. F., Harano, Y., Ioannidis, Y. E., Lin, J., et al. (2008). BioMagResBank. Nucleic Acids Res. 36, D402–D408. doi: 10.1093/nar/gkm957
Voehler, M. W., Collier, G., Young, J. K., Stone, M. P., and Germann, M. W. (2006). Performance of cryogenic probes as a function of ionic strength and sample tube geometry. J. Magn. Reson. 183, 102–109. doi: 10.1016/j.jmr.2006.08.002
Wang, B., Dossey, A. T., Walse, S. S., Edison, A. S., and Merz, K. M. J. (2009). Relative configuration of natural products using NMR chemical shifts. J. Nat. Prod. 72, 709–713. doi: 10.1021/np8005056
Wishart, D. S., Jewison, T., Guo, A. C., Wilson, M., Knox, C., Liu, Y., et al. (2013). HMDB 3.0–The Human Metabolome Database in 2013. Nucleic Acids Res. 41, D801–D807. doi: 10.1093/nar/gks1065
Wolfender, J. L., Bohni, N., Ndjoko-Ioset, K., and Edison, A. S. (2013). “Advanced spectroscopic detectors for identification and quantification: nuclear magnetic resonance,” in Liquid Chromatography: Fundamentals and Instrumentation eds S. Fanali, P. R. Haddad, C. F. Poole, P. Schoenmakers, and D. Lloyd. (Amsterdam: Elsevier), 349–384.
Keywords: isotope, NMR, LC-MS, metabolomics, natural products
Citation: Clendinen CS, Stupp GS, Ajredini R, Lee-McMullen B, Beecher C and Edison AS (2015) An overview of methods using 13C for improved compound identification in metabolomics and natural products. Front. Plant Sci. 6:611. doi: 10.3389/fpls.2015.00611
Received: 05 May 2015; Accepted: 23 July 2015;
Published: 25 August 2015.
Edited by:
Daniel A. Dias, The University of Melbourne, AustraliaReviewed by:
Subrata H. Mishra, Johns Hopkins University, USAJens Rohloff, Norwegian University of Science and Technology, Norway
Copyright © 2015 Clendinen, Stupp, Ajredini, Lee-McMullen, Beecher and Edison. This is an open-access article distributed under the terms of the Creative Commons Attribution License (CC BY). The use, distribution or reproduction in other forums is permitted, provided the original author(s) or licensor are credited and that the original publication in this journal is cited, in accordance with accepted academic practice. No use, distribution or reproduction is permitted which does not comply with these terms.
*Correspondence: Arthur S. Edison, Southeast Center for Integrated Metabolomics and Department of Biochemistry and Molecular Biology, University of Florida, 1600 Archer Road, Rm R3-226, Box 100245, Gainesville, FL 32610-0245, USA,YWVkaXNvbkB1ZmwuZWR1
†Present address: Arthur S. Edison, Department of Genetics, Department of Biochemistry and Molecular Biology, University of Georgia, Athens, GA 30602, USA,YWVkaXNvbkB1Z2EuZWR1