 Yu Song
 Wenpan Dong
 Bing Liu
 Chao Xu
 Xin Yao
 Jie Gao
 Richard T. Corlett
- 1Center for Integrative Conservation, Xishuangbanna Tropical Botanical Garden, Chinese Academy of Sciences, Mengla, China
- 2Graduate School of the Chinese Academy of Sciences, Beijing, China
- 3Peking-Tsinghua Center for Life Sciences, Academy for Advanced Interdisciplinary Studies, Peking University, Beijing, China
- 4State Key Laboratory of Systematic and Evolutionary Botany, Institute of Botany, Chinese Academy of Sciences, Beijing, China
- 5Key Laboratory of Tropical Forest Ecology, Xishuangbanna Tropical Botanical Garden, Chinese Academy of Sciences, Mengla, China
Machilus is a large (c. 100 sp.) genus of trees in the family Lauraceae, distributed in tropical and subtropical East Asia. Both molecular species identification and phylogenetic studies of this morphologically uniform genus have been constrained by insufficient variable sites among frequently used biomarkers. To better understand the mutation patterns in the chloroplast genome of Machilus, the complete plastomes of two species were sequenced. The plastomes of Machilus yunnanensis and M. balansae were 152, 622 and 152, 721 bp, respectively. Seven highly variable regions between the two Machilus species were identified and 297 mutation events, including one micro-inversion in the ccsA-ndhD region, 65 indels, and 231 substitutions, were accurately located. Thirty-six microsatellite sites were found for use in species identification and 95 single-nucleotide changes were identified in gene coding regions.
Introduction
The genus Machilus in the family Lauraceae includes nearly 100 tree species distributed in tropical and subtropical East and South Asia, with most species in China (Tang et al., 2010). Machilus species are known for their high-quality wood. Although the relationships among the genera traditionally recognized within the monophyletic ‘Persea group’ are still unclear, Machilus (with two misplaced species of Phoebe) forms a distinct, monophyletic, Asian clade (Chen et al., 2009; Rohwer et al., 2009; Li et al., 2011). At the species level, however, the reported nuclear ITS and LEAFY intron II sequences failed to resolve the phylogenetic and species identification problems in this genus. Rohwer et al. (2009) suggest that the extremely low genetic variation among species of Machilus could be explained by recent species differentiation and/or a greatly decreased substitution rate within the genus. Besides nuclear sequences, 14 chloroplast genomic markers (matK, trnK, accD, ndhJ, psbC-trnS, rpoB, rpoC1, trnD-trnT2, trnH-trnK, psbA-trnH, psbB-psbH, trnS-trnG, rpoB-trnC, and trnS-trnfM) also failed to resolve either the phylogenetic problems within the Persea group or species delineation within Machilus (Rohwer, 2000; Rohwer and Rudolph, 2005; Rohwer et al., 2009; Li et al., 2011). All of these results showed very little variation in those chloroplast genomic markers. This raises the question, are there any useful sequences for the phylogenetic classification of Machilus species in the chloroplast genome?
The chloroplast genome is more conserved than the nuclear genome in plants, but many mutation events in the chloroplast DNA sequence have been identified, including indels, substitutions, and inversions (Ingvarsson et al., 2003). At a high taxonomic level, a 22 kb DNA inversion event was used to confirm that the Barnadesioideae is the most basal lineage in the Asteraceae (Jansen and Palmer, 1987), and three DNA inversion events composed a nested set of phylogenetic characters to clarify the close relationship between the Poaceae and Joinvilleaceae (Doyle et al., 1992). At a low taxonomic level in ginseng, the DNA polymorphism rates of indels and SNPs between Panax ginseng and P. notoginseng were 0.40% (Dong et al., 2014), and 0.20% among four chloroplast genomes of different Chinese ginseng strains (Zhao et al., 2015). In rice, the DNA polymorphism rate of indels and SNPs between Oryza sativa and O. nivara were 0.02% (Masood et al., 2004), and 0.07% between O. sativa indica and O. sativa japonica (Tang et al., 2004). All of these results show that variable characters exist among the chloroplast genomes at the species level.
Here, two species of Machilus (Lauraceae) were selected to determine the entire chloroplast genome sequences. Machilus yunnanensis Lecomte is distributed at high altitudes in Yunnan, Sichuan, and Tibet of SW China (Wei and Werff, 2008), while M. balansae (Airy Shaw) F. N. Wei and S. C. Tang occurs mainly at low elevations in North Vietnam (Tang et al., 2010). By comparing these two complete chloroplast genomes we will try to answer the following questions: (1) What is the size range of chloroplast genomes in Machilus? (2) Which types of mutation events occurred in chloroplast genomes of Machilus? (3) Is there any highly variable region in the chloroplast genomes of Machilus? Comparisons were also made with the recently published chloroplast genome of Cinnamomum kanehirae (Wu et al., 2015).
Materials and Methods
DNA Extraction and Sequencing
We collected young leaves of M. yunnanensis and M. balansae from single seedlings growing in the nursery of the Xishuangbanna Tropical Botanical Garden (XTBG) on May 20, 2014. We also collected fruiting branches of both mother trees (Supplementary Figure S1) and compared them with the types to confirm their identifications (Supplementary Figure S2). Genomic DNA was extracted from 1 g fresh leaves using the mCTAB method (Li et al., 2013). Both genomes were sequenced following Dong et al. (2013), and their 138 pair specific primers were used to bridge gaps in the plastomes.
Chloroplast Genome Assembling and Annotation
Sanger sequence reads were proofread and assembled with Sequencher 4.10 (http://www.genecodes.com). All of the genes encoding proteins, transfer RNAs (tRNAs), and ribosomal RNAs (rRNAs) were annotated on Machilus plastomes using the Dual Organellar Genome Annotator (DOGMA) software (Wyman et al., 2004). To further verify the identified tRNA genes, the tRNAscan-SE 1.21 program was used to predict their corresponding structures (Schattner et al., 2005). The genome map of M. yunnanensis and M. balansae was drawn by GenomeVx (Conant and Wolfe, 2008).
Sliding Window Analysis of the Plastomes
After alignment using Clustal X 1.83 (Aiyar, 2000), the sequences were manually adjusted with Bioedit software (http://www.mbio.ncsu.edu/bioedit/bioedit.html). Further, we conducted a sliding window analysis to evaluate the variability (Pi) all over the plastomes in DnaSP version 5 software (Librado and Rozas, 2009). The window length was set to 600 base pairs and the step size was set as 200 base pairs.
Mutation Events Analysis
To identify the microstructural mutations between M. yunnanensis and M. balansae, the two aligned sequences were further analyzed using DnaSP version 5 (Librado and Rozas, 2009) and MEGA version 5 (Tamura et al., 2011). Indel and SNP events were counted and positioned in the plastome using an R program. For the SSRs search, the minimum repeat unit was limited to eight for mononucleotides and four for dinucleotides. For non-SSR indel and SNP detection, the plastome of M. yunnanensis was used as a reference to determine the insertion or deletion events and transition (Ts) or transversion (Tv) events. In addition, the SNPs in the exon of the plastome were further classified into synonymous (S) and non-synonymous (N) substitutions. The gene classification was according to Chang et al. (2006).
Results
Size, Gene Content, and Organization of M. yunnanensis and M. balansae Plastomes
The chloroplast genome of M. yunnanensis (deposited in GenBank: KT348516), with a length of 152, 622 bp, was 99 bp smaller than that of M. balansae (deposited in GenBank: KT348517) (Figure 1), and 78 bp smaller than that of Cinnamomum kanehirae (152,700 bp, GenBank accession No. KR014245) (Wu et al., 2015). All three are smaller than the genome of Calycanthus fertilis (153, 337 bp, GenBank accession No. NC_004993) in the Calycanthaceae, which is in the same order as the Lauraceae (Goremykin et al., 2003). A+T content is 61% in all four species. The Machilus chloroplast genomes include a pair of inverted repeats (IRs) of 20, 074 bp in M. yunnanensis and M. balansae, separated by a large single copy (LSC) region of 93, 675 bp in M. yunnanensis and 93, 676 bp in M. balansae and a small single copy (SSC) region of 18, 799 bp in M. yunnanensis and 18, 897 bp in M. balansae (Table 1). Both contain 113 different functional genes, including 79 protein-coding genes, 30 tRNA genes, and 4 rRNA genes (Supplementary Table S1). The gene map is shown in Figure 1. Among the functional genes, twelve protein-coding genes and six tRNA genes contain introns in both species (Supplementary Table S1).
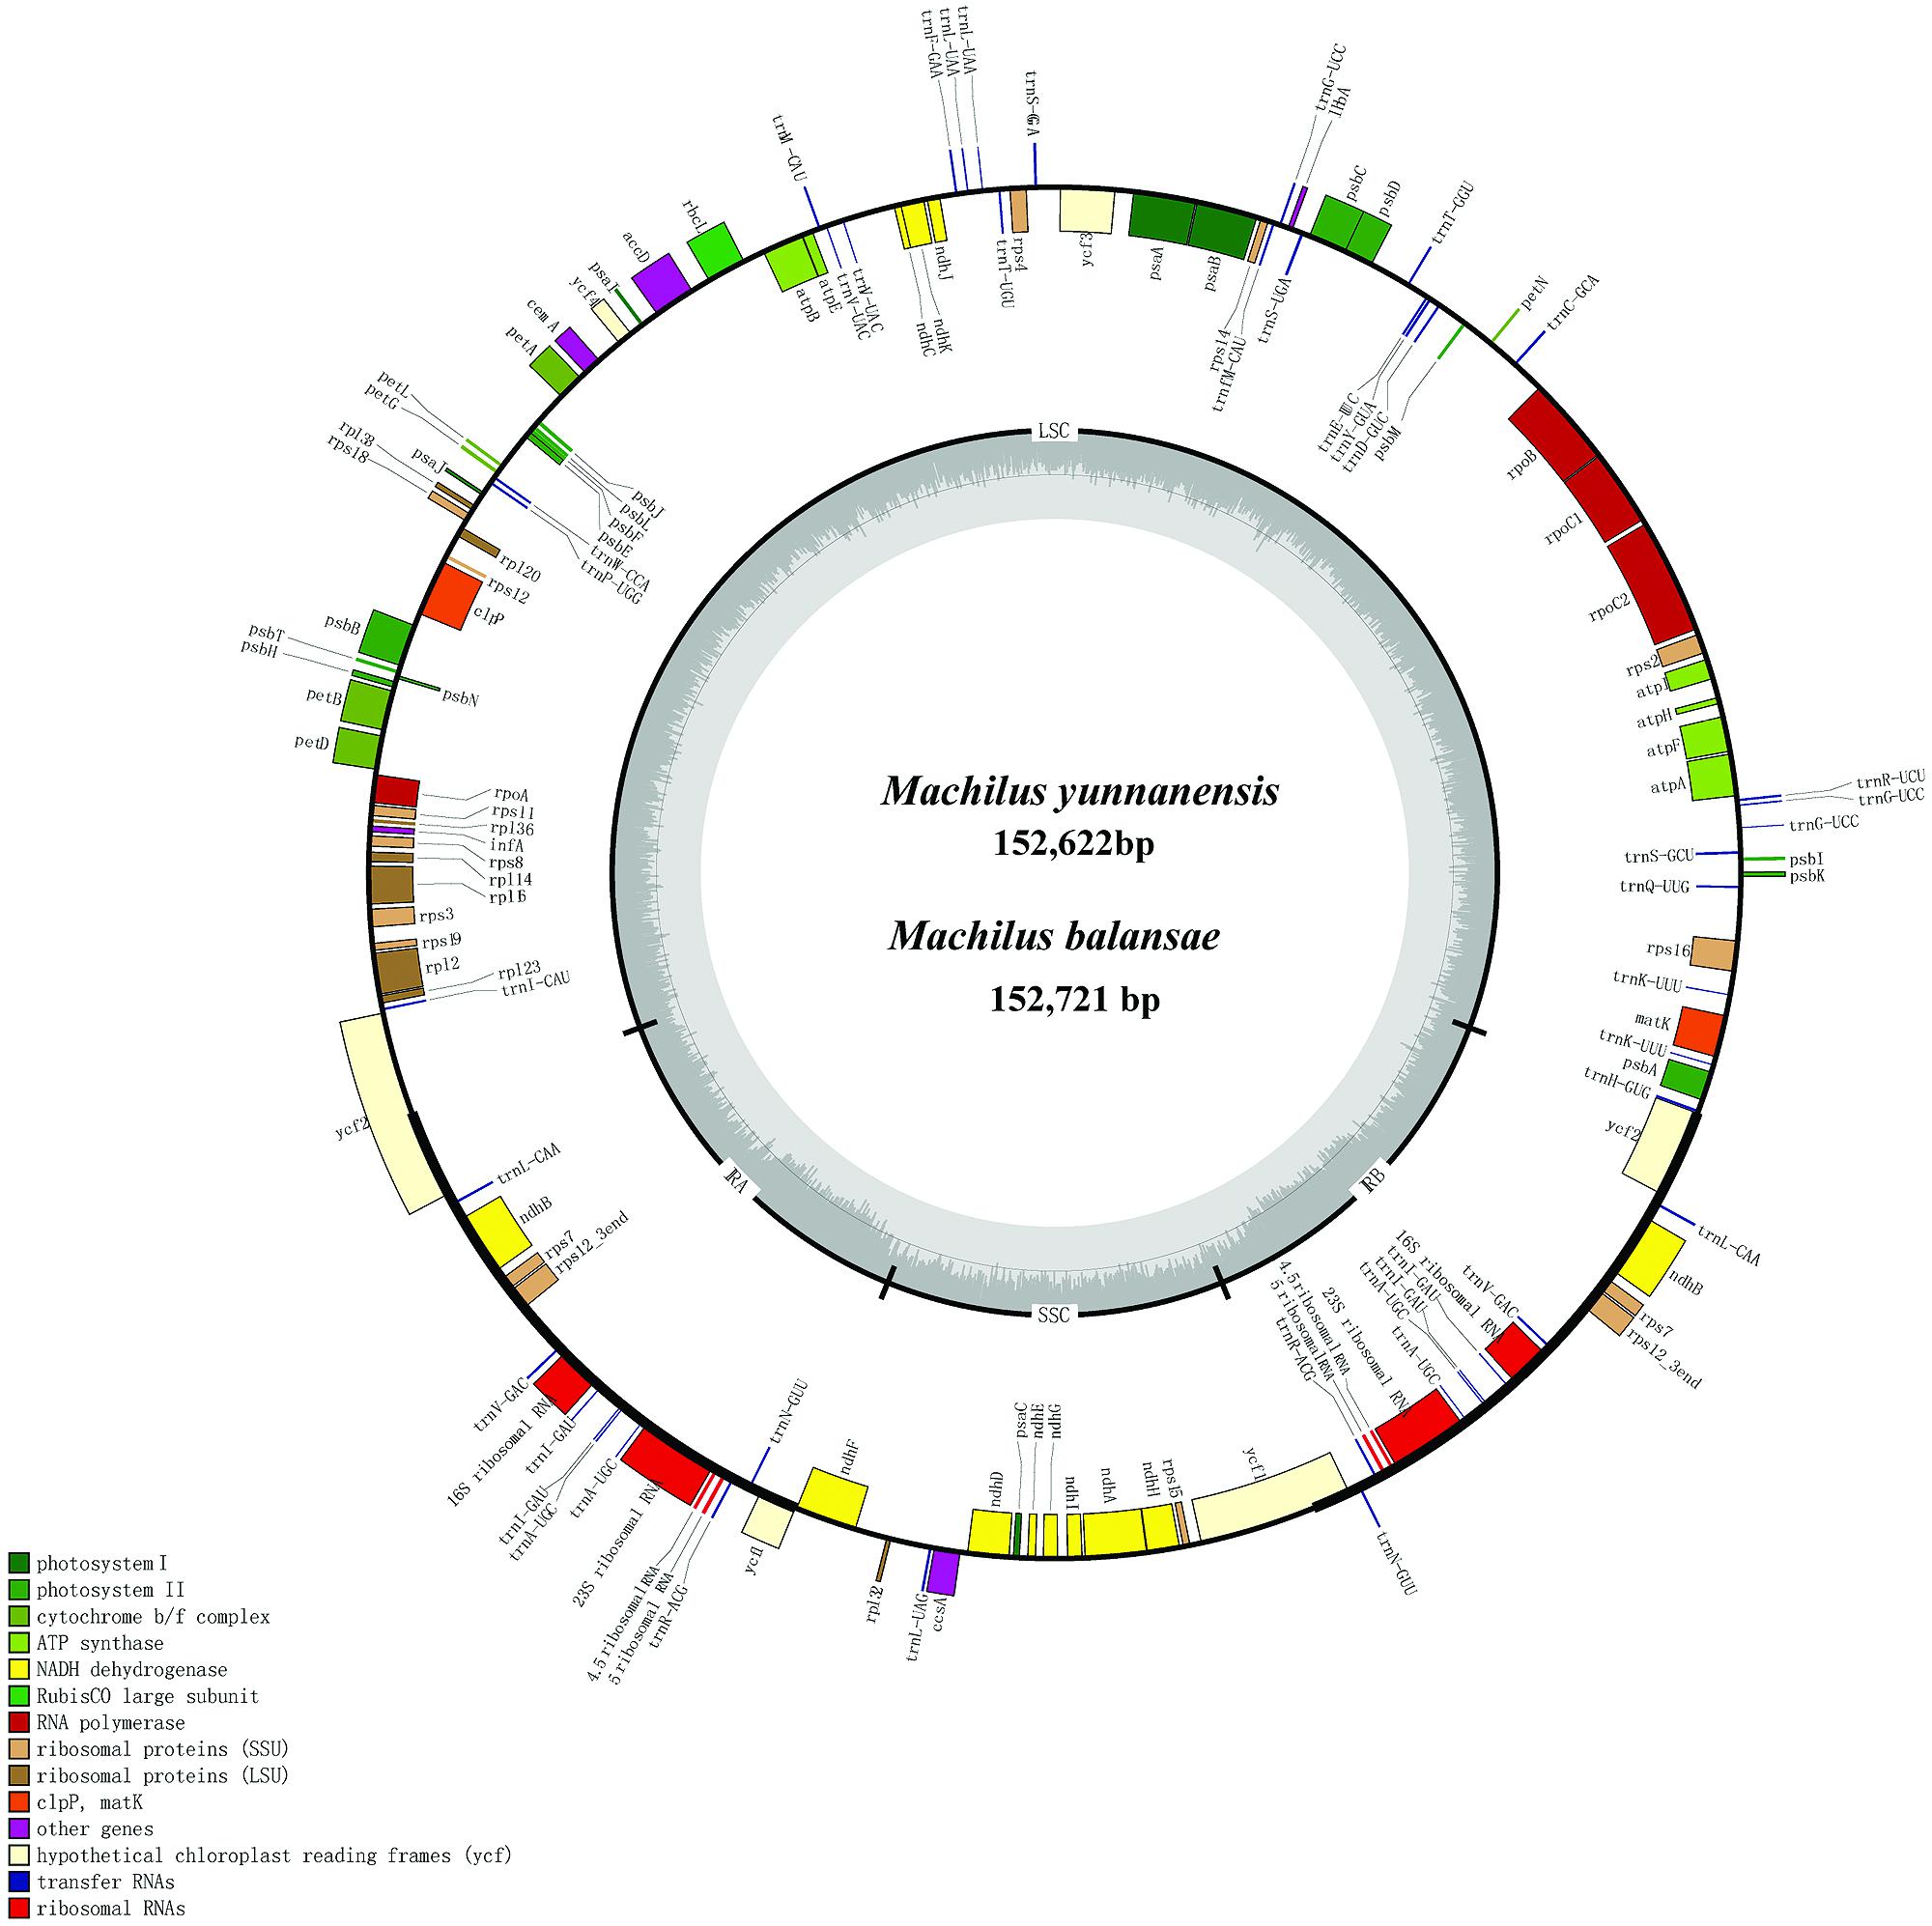
FIGURE 1. Gene map of Machilus yunnanensis and M. balansae plastomes. The annotation of the genome was performed using DOGMA. The genes that are drawn outside of the circle are transcribed clockwise, while those inside are counterclockwise. Small single copy (SSC), large single copy (LSC), and inverted repeats (IRa, IRb) are indicated.
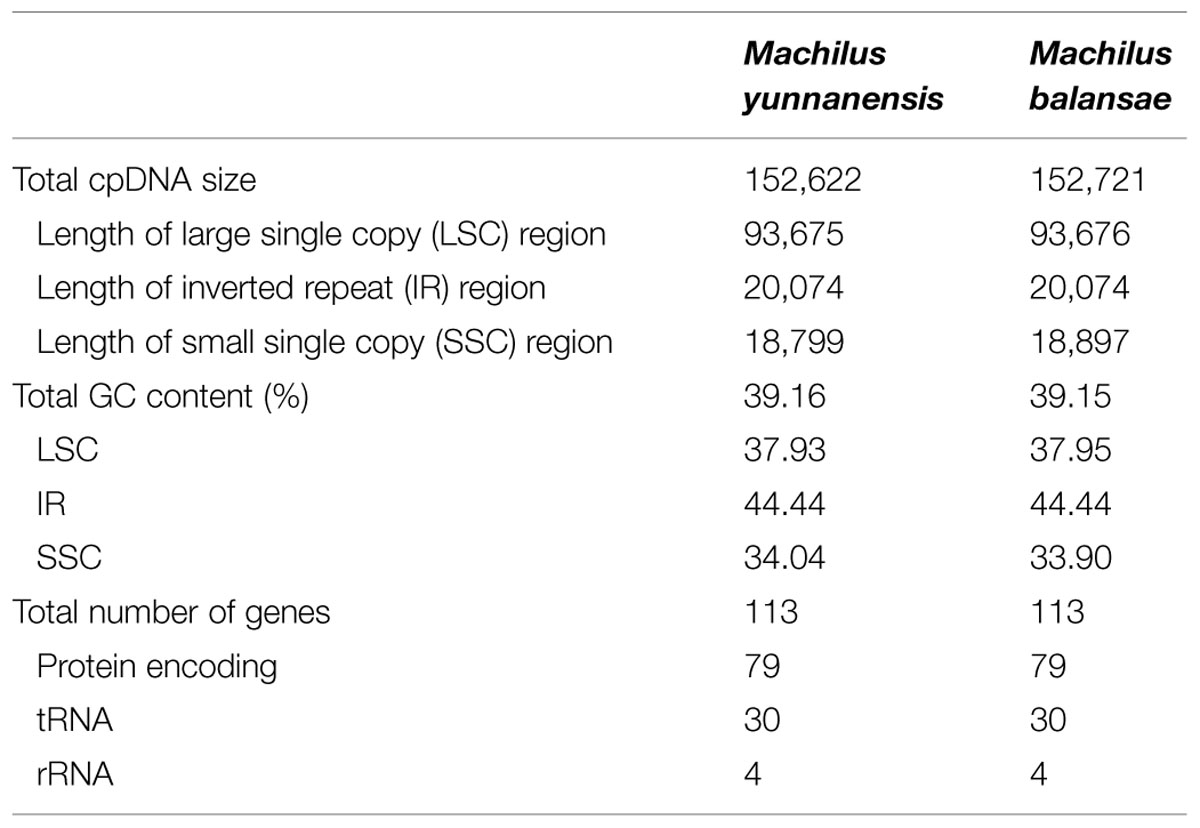
TABLE 1. Summary of two complete plastomes of Machilus.
Divergence Hotspots of M. yunnanensis, M. balansae, and Cinnamomum kanehirae Plastomes
To elucidate the level of sequence divergence, the nucleotide variability (Pi) values within 600 bp in both chloroplast genomes of M. yunnanensis, M. balansae, and Cinnamomum kanehirae were calculated with DnaSP 5.0 software. Between two Machilus species these values varied from 0 to 0.01333 with a mean of 0.00154, indicating that the differences between the genomes were small. However, seven highly variable loci including the second intron of clpP, ndhF-rpl32, trnQ-psbI, rps8-rpl14, ycf2, rpl32-trnL, and ycf1 were precisely located (Figure 2A). All of these regions had much higher values than other regions (Pi > 0.008). Three of these loci lie in the LSC region, three in the SSC region, and one in the IR region. Among them, the introns of clpP, rpl32-trnL, and ycf1 loci have been reported before as highly variable regions in seed plants (Dong et al., 2012), while ndhF-rpl32, trnQ-psbI, rps8-rpl14, and ycf2 loci seem to be especially variable in Machilus. Among Cinnamomum kanehirae and the two Machilus species the Pi values varied from 0 to 0.02444, indicating that the differences between the two genera were larger than those between congeneric species. Three of the seven loci, including ndhF-rpl32, rpl32-trnL, and ycf1, were particularly highly variable between Cinnamomum and Machilus species (Pi > 0.015; Figure 2B).
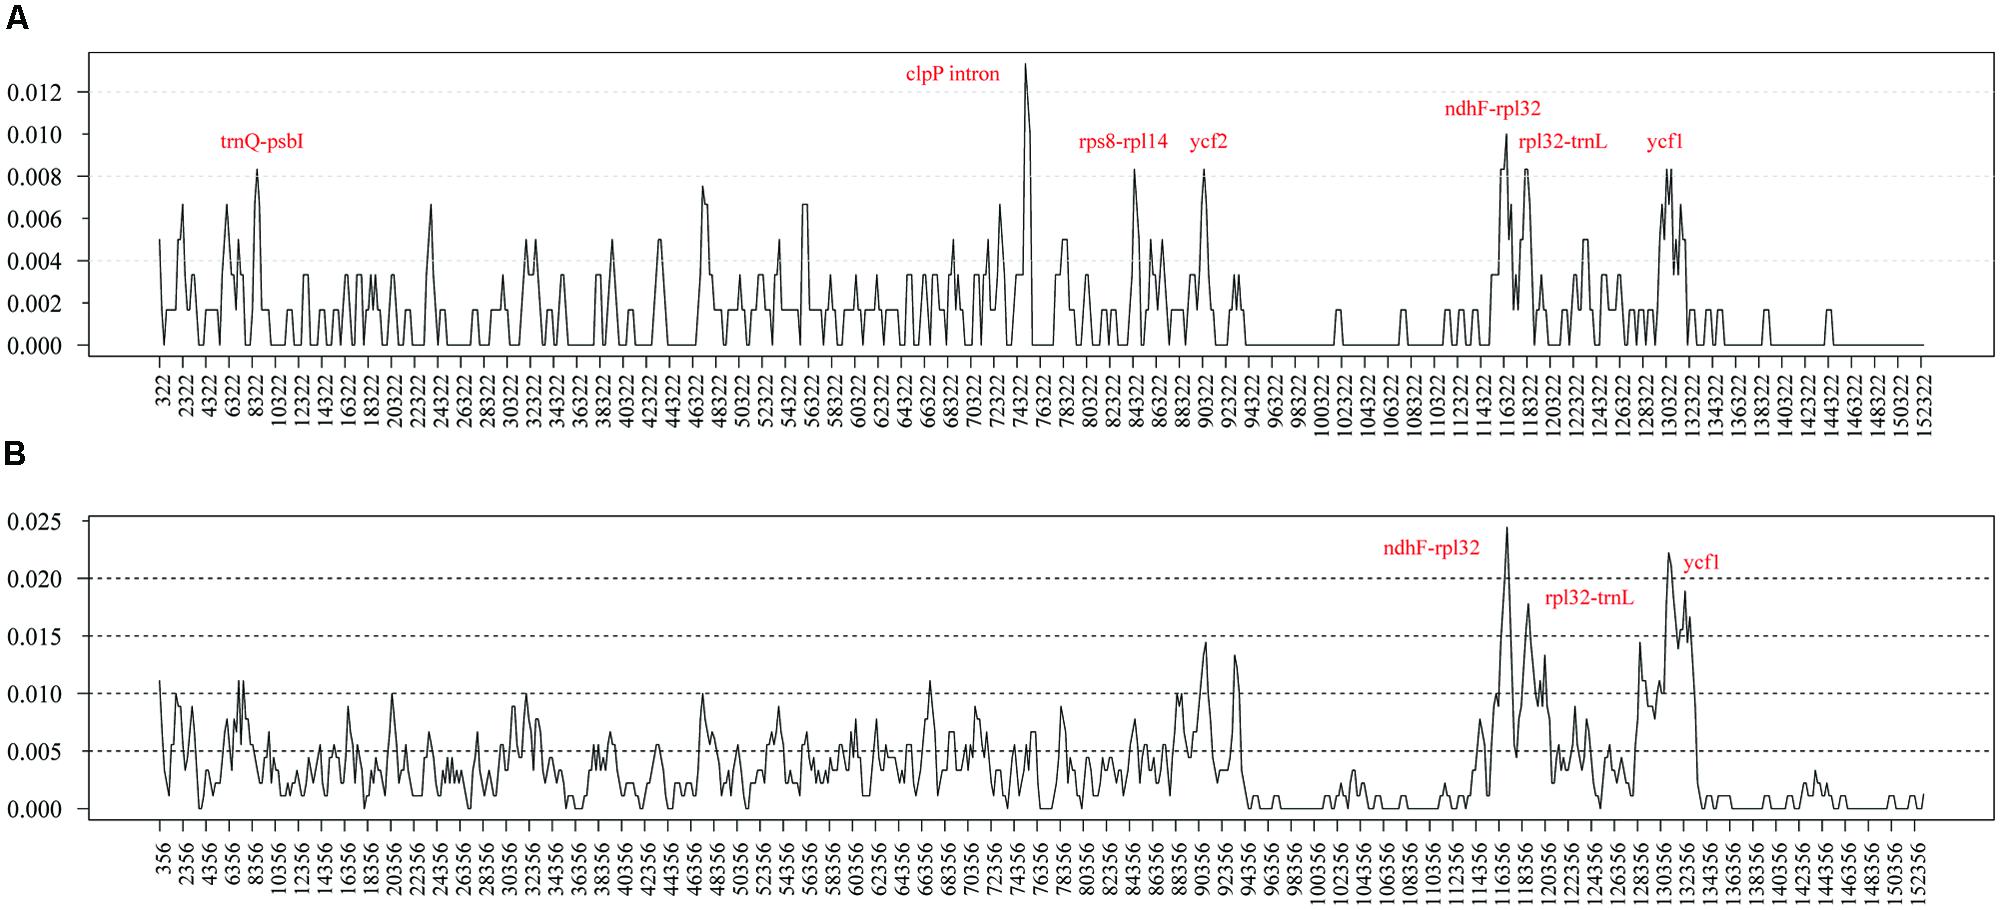
FIGURE 2. Sliding window analysis of the whole plastomes of M. yunnanensis and M. balansae (A) and those of Cinnamomum kanehirae and the two Machilus species (B). (window length: 600 bp, step size: 200 bp). X-axis: position of the midpoint of a window, Y-axis: nucleotide diversity of each window.
Number and Forms of Microstructural Mutations
Indel markers display no ambiguity in complex mutation patterns with the advantages of low cost and high precision. To detect more variable sites in Machilus, indel mutations between the chloroplast genomes of M. yunnanensis and M. balansae were compared. There are 52 indels in gene spacer regions, 12 indels in introns, and one in the exon of ndhF. Further, these indels were classified into 36 simple sequences repeat (SSR) indels (Table 2) and 29 non-SSR indels (Table 3). For the SSR indels, there are 34 single nucleotide repeats A/T ranged from 8 to 19 bp, one 9 bp single nucleotide repeat C in the petA-psbJ gene spacer region, and one double nucleotide repeat AT with 5 and 7 bp in the petN-psbM region (Table 2). The sizes of most non-SSR indels ranged from 1 to 7 bp, while that within the ndhF-rpl32, trnH-psbA, and psbM-trnD gene spacer sequences were 94 bp, 22 bp, and 21 bp, respectively (Table 3). Of all of these indel events, 83.08% of sites were in the LSC region while 3.07% of sites were in the IR regions. In addition, one micro-inversion event with five bases was detected in the ccsA-ndhD gene spacer region (Supplementary Figure S3).
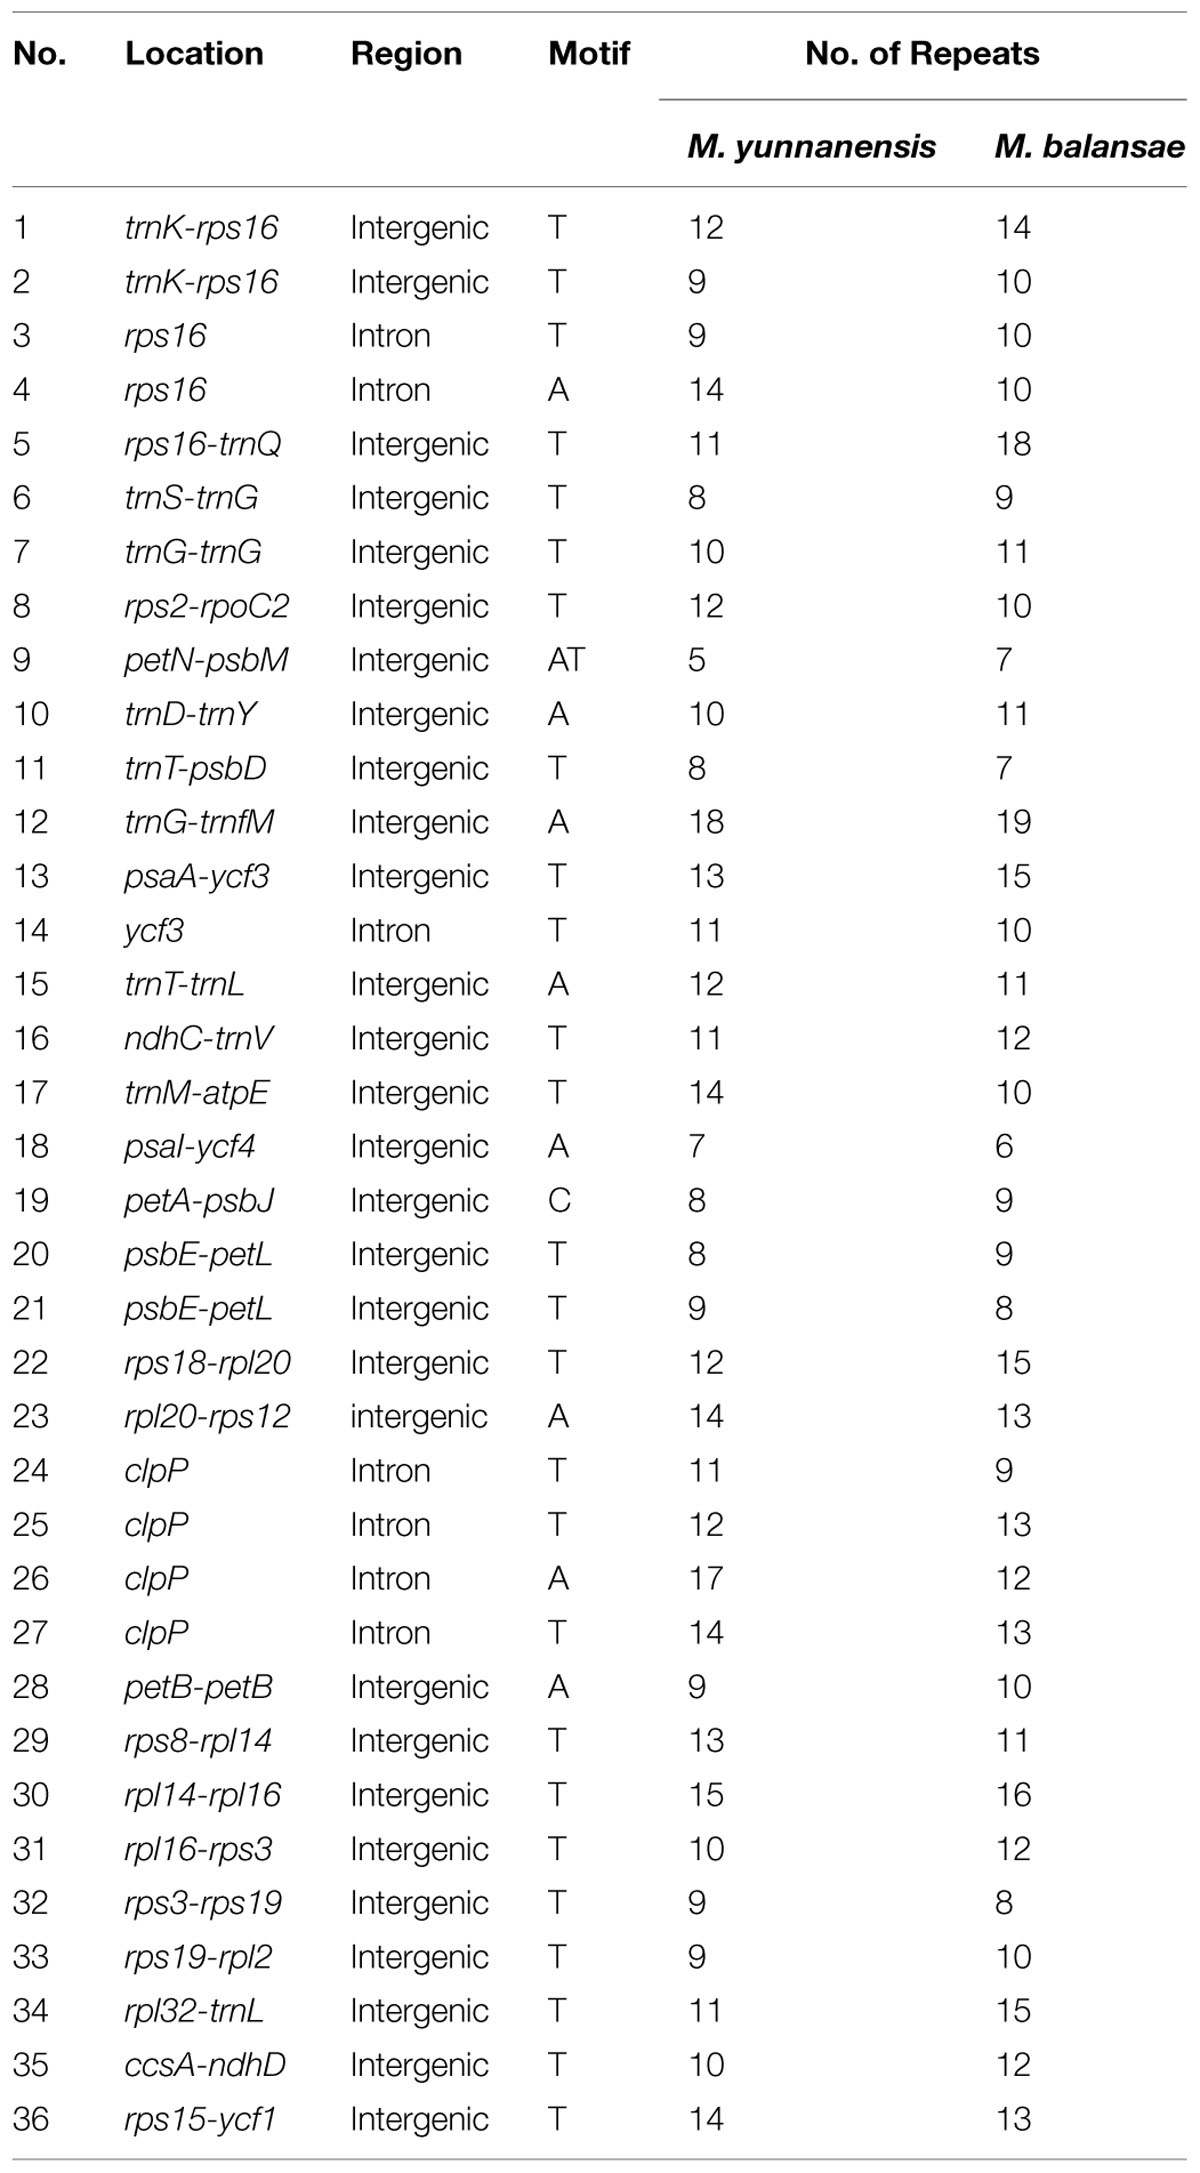
TABLE 2. Location of simple sequence repeats in the Machilus plastomes.
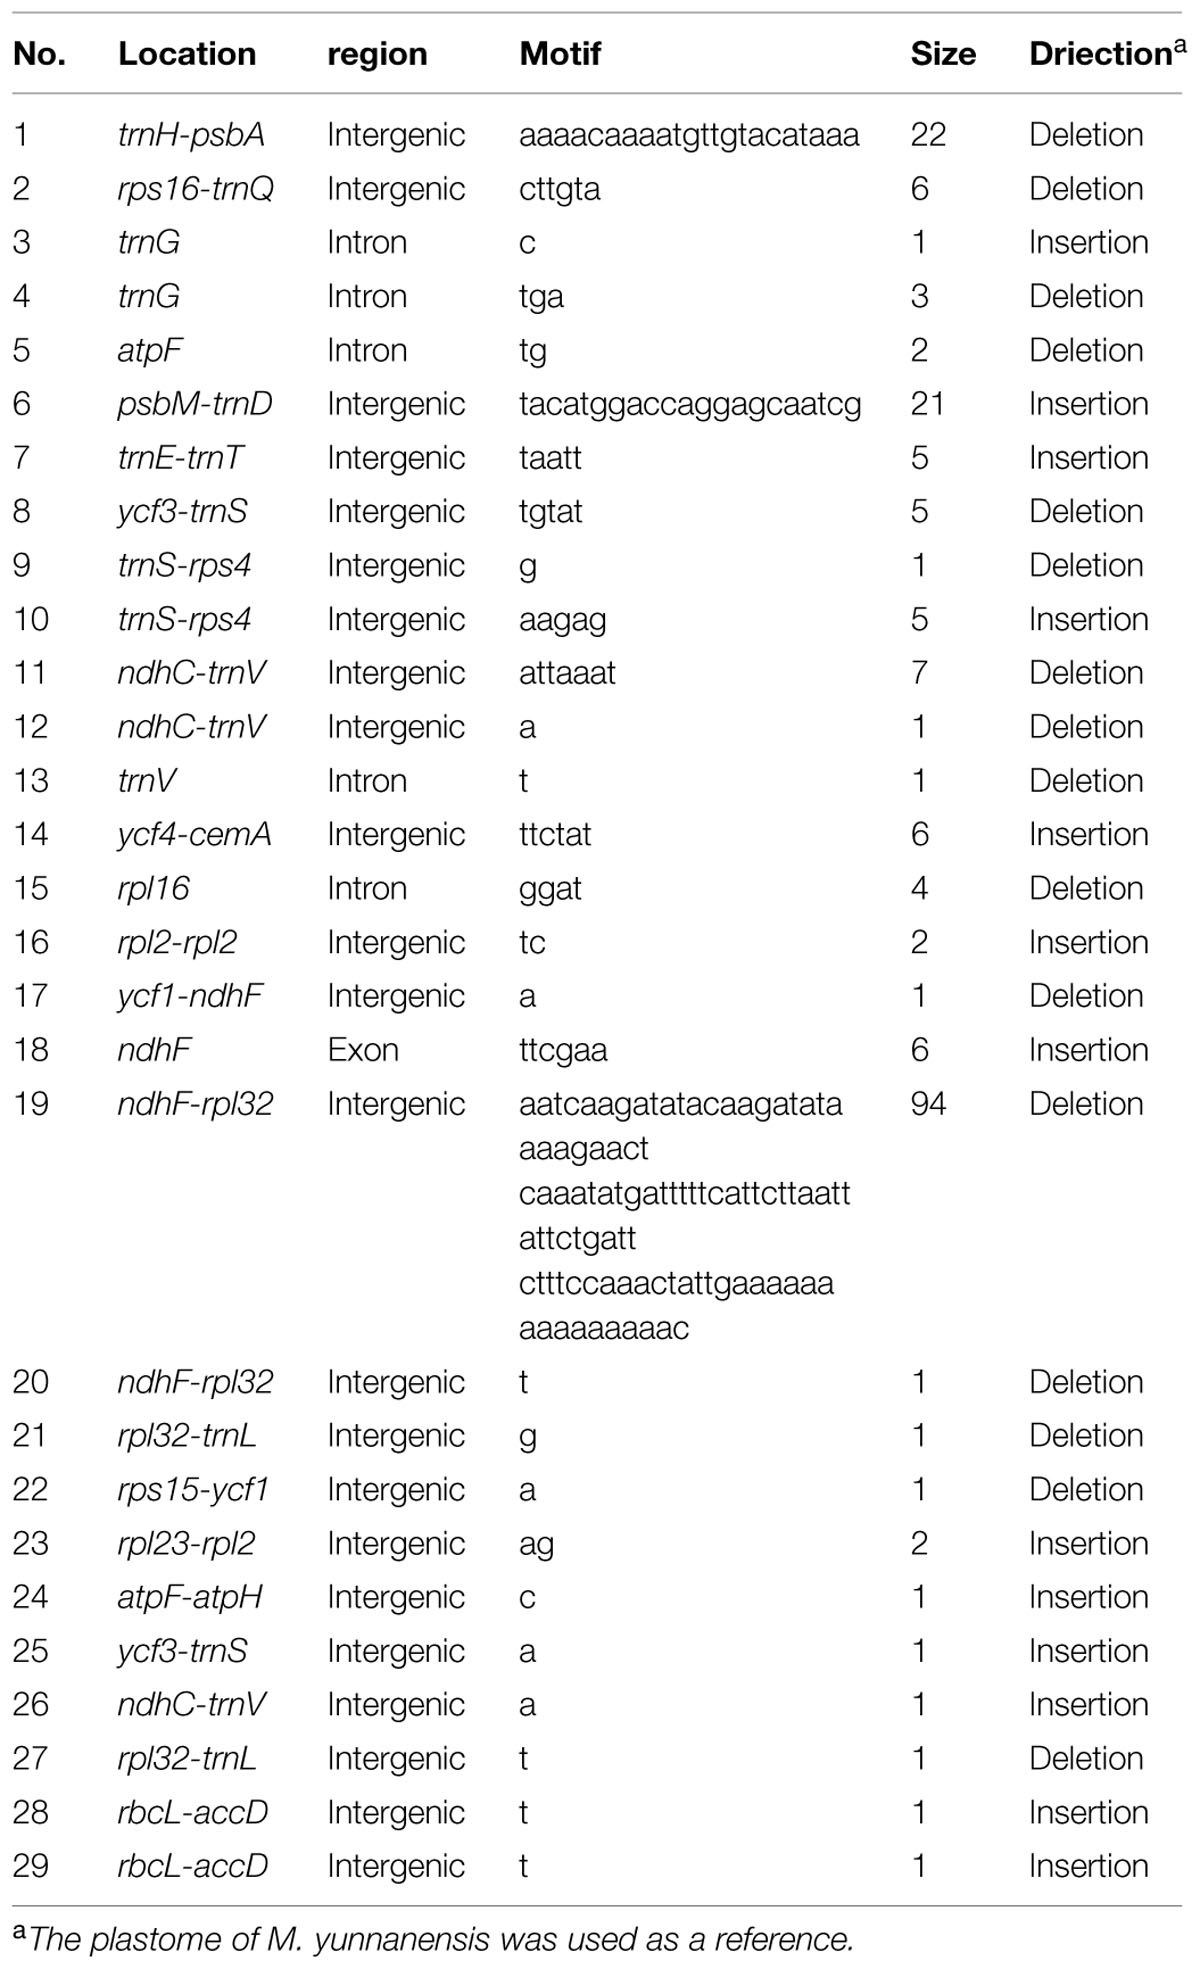
TABLE 3. Forms and numbers of indel mutation events in the plastome between the two Machilus species.
Numbers and Pattern of SNP Mutations
SNP markers are the most abundant type of mutations, but have never been screened in Machilus species. We detected 95 SNPs, including 48 Ts and 47 Tv, in gene coding regions (Figure 3) and 136 SNPs, including 58 Ts and 78 Tv, in non-coding regions (Supplementary Table S2). The Tv to Ts ratio was 1: 0.74. Among the Tv, 14 were Tv between T and A, 9 were Tv between C and G, and the other 101 were related to GC content changes. Among substitution events in the gene coding regions, non-synonymous and synonymous substitutions shared 48 and 47 of 95 sites in the entire plastomes, and 23 of 79 genes had non-synonymous substitution sites. However, two genes psaA and ycf1 had more non-synonymous than synonymous substitutions sites, suggesting these two genes had a relatively high evolution rate (Table 4). In all of these substitution events, 74.03% of SNP sites were in the LSC region while 1.73% of SNP sites were in the IR regions.
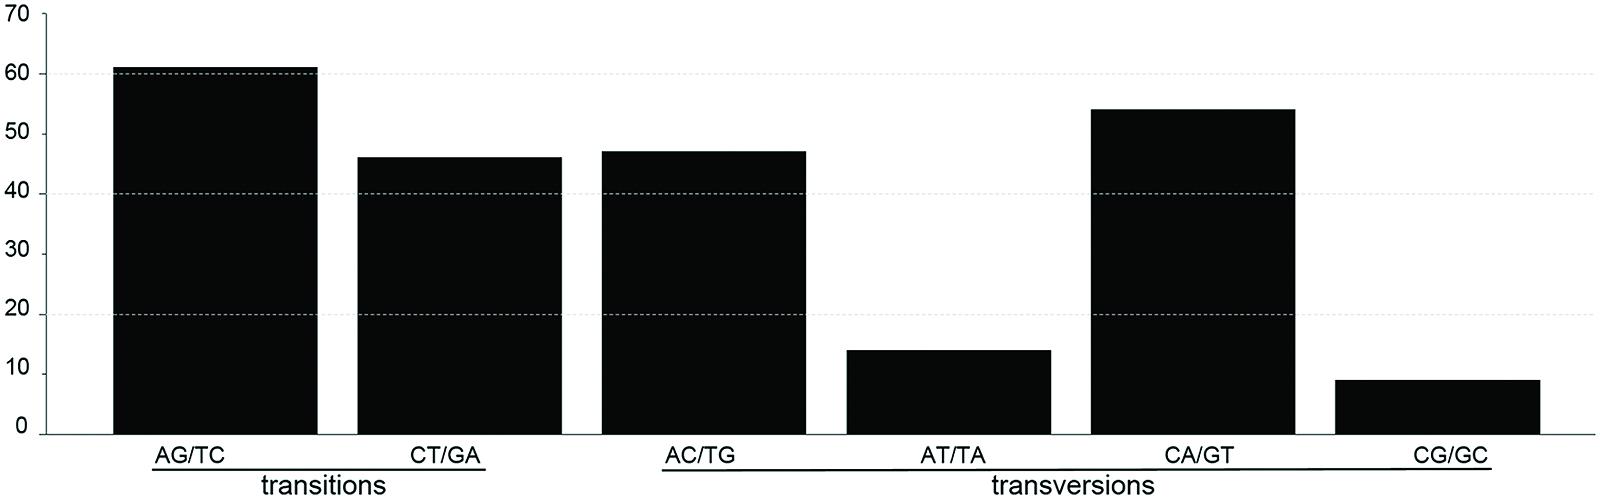
FIGURE 3. The patterns of nucleotide substitutions among M. yunnanensis and M. balansae plastomes. The patterns were divided into six types as indicated by the six non-strand-specific base-substitution types (i.e., numbers of considered G to A and C to T sites for each respective set of associated mutation types). The plastome of M. yunnanensis was used as a reference.
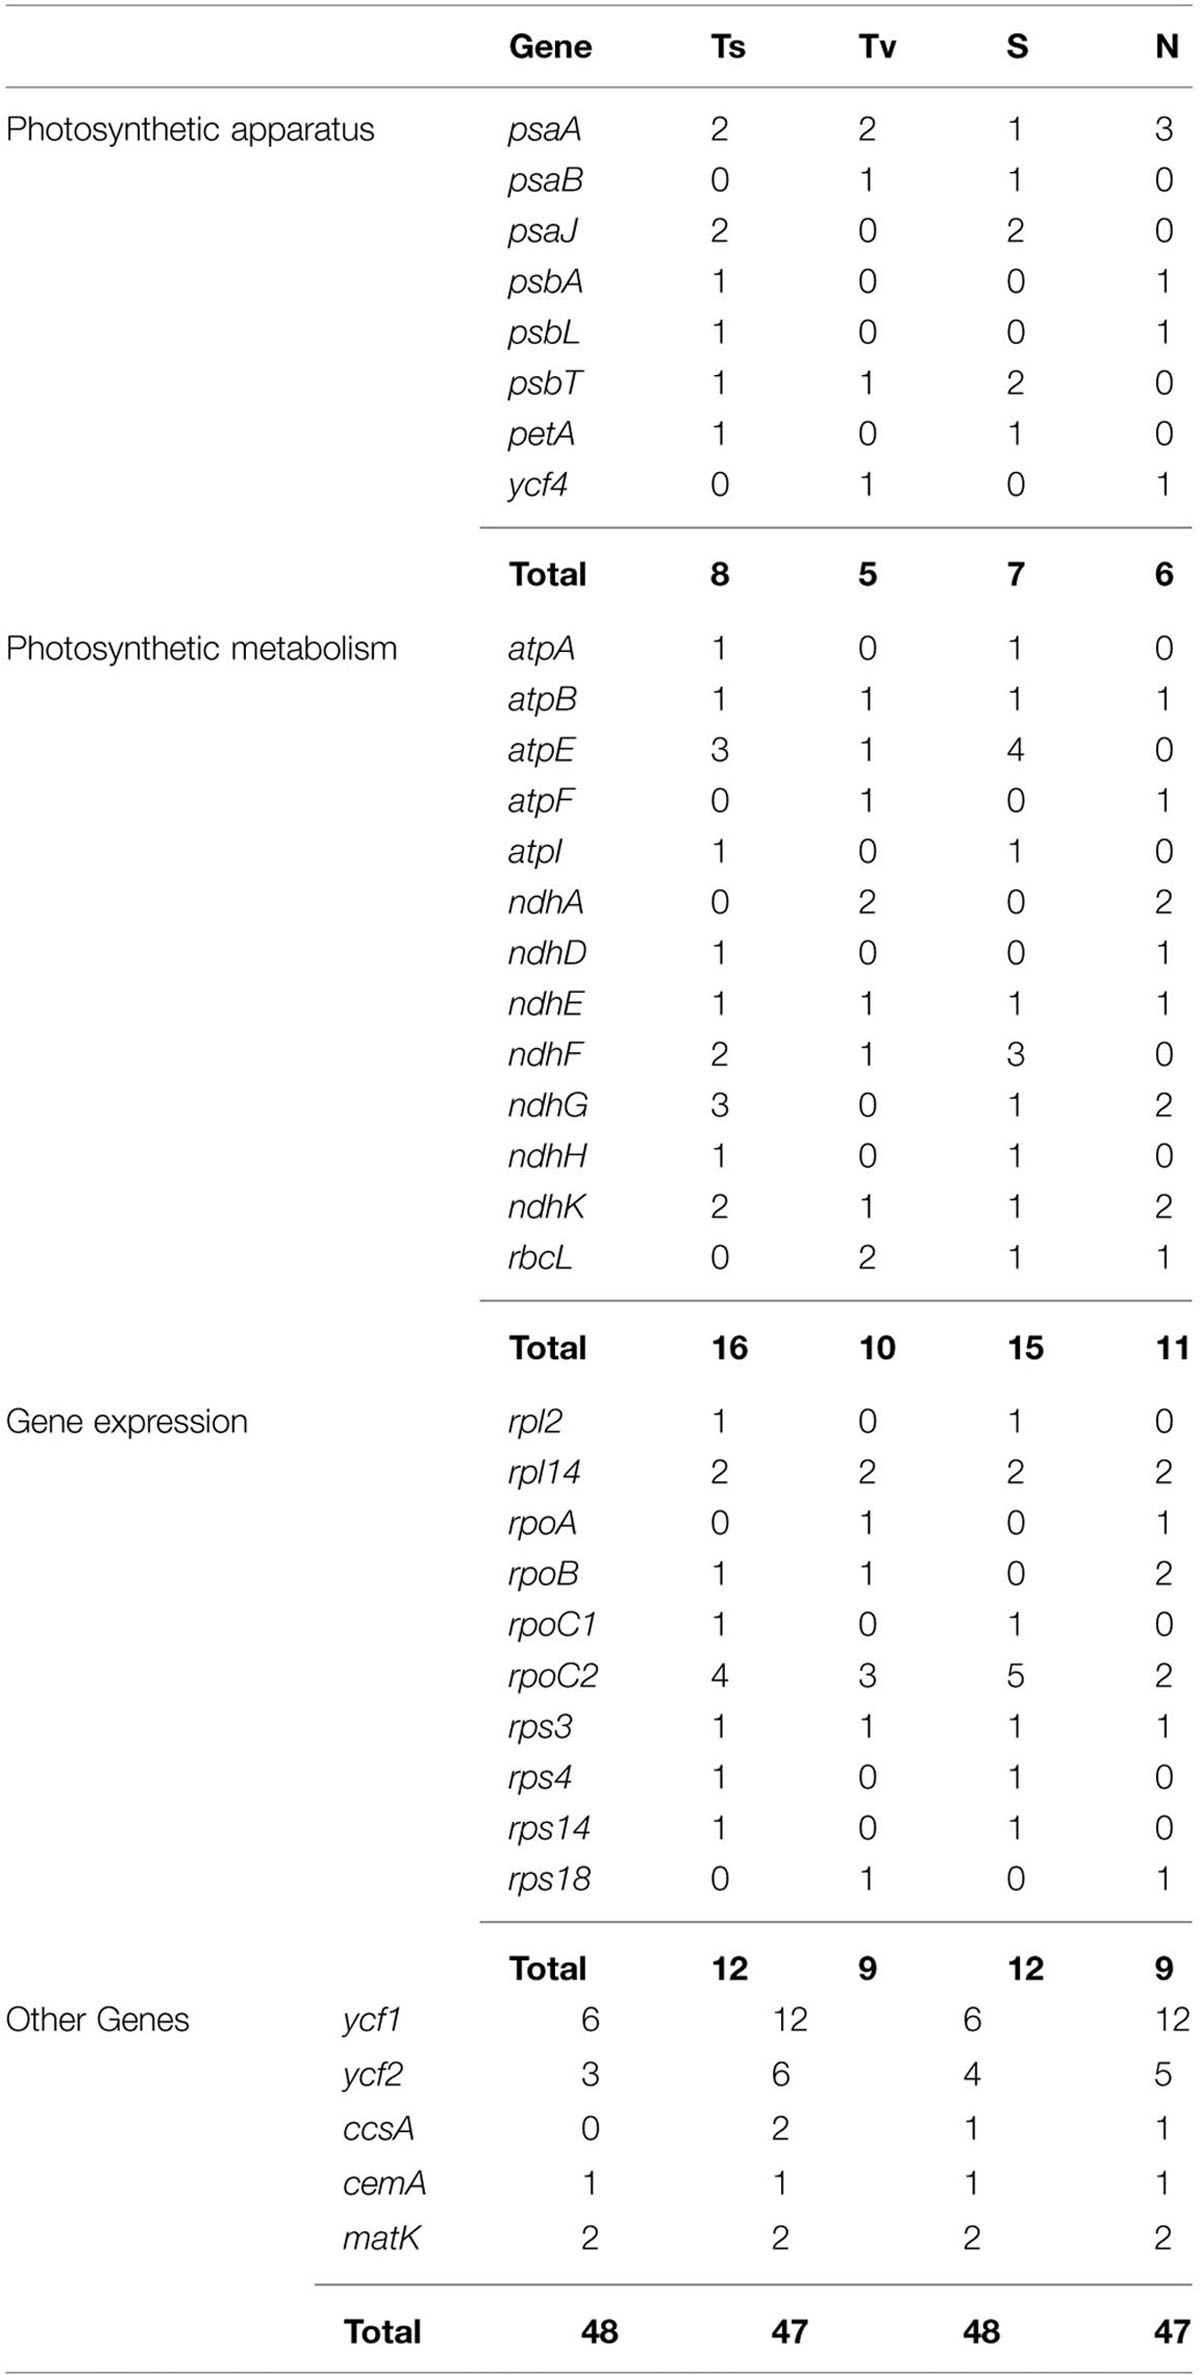
TABLE 4. Comparisons of mutational changes, number of transitions (Ts) and transversions (Tv), synonymous (S), and non-synonymous (N) substitutions per gene of protein coding chloroplast genes between M. yunnanensis and M. balansae.
Discussion
This study produced two complete chloroplast genomes for species in the Lauraceae, which comprises nearly 3500 species in over 50 genera worldwide. For species identification and population structure analysis in this family, the rapidly developed molecular markers such as indels and SNPs have been proved to have significant potential. Global alignment of 13 Gossypium plastomes (Malvaceae) indicated that the total number of SNPs varied from 6 to 1000 and the number of indels ranged from 3 to 178, which supported that the plastome divergence was approximate 0.00159 to 0.00454 within allotetraploids of Gossypium (Xu et al., 2012). Plastome comparative analysis of five Camellia species identified 15 molecular markers with over 1.5% sequence divergences, which were used to promote the further phylogenetic analysis and species identification of Camellia species (Huang et al., 2014). The indel and SNP variable sites of plastomes of 12 Triticeae species were used to estimate that barley diverged from rye and wheat around 8.5 million years ago and rye diverged from Triticum aestivum around 3.5 million years ago (Middleton et al., 2014). These results show that molecular markers including indels and SNPs are useful tools in research.
Out of the 65 indel markers between M. yunnanensis and M. balansae plastomes, the largest indel is located within the intergenic sequence ndhF-rpl32 (94 bp) in the SSC region. Another two large indels were found within trnH-psbA (22 bp) and psbM-trnD (21 bp) in the LSC region. Previous work in other plants has identified large indels in intergenic spacers, such as ndhF–rpl32, rpoB–trnC, trnE-trnT, rpl32-trnL, trnQ-rps16, and protein coding genes, such as accD, rpl20, ycf1, and ycf15 (Shaw et al., 2007; Nashima et al., 2015). Most of these large indel events occurred in single copy regions but not IR regions. The 36 SSR loci identified in this study may be useful in population and evolutionary studies as well, as they were in Panax ginseng (Kim and Lee, 2004a), Cucumis sativus (Kim et al., 2006), Vigna radiata (Tangphatsornruang et al., 2010), and Pyrus pyrifolia (Terakami et al., 2012). In addition, one micro-inversion of five nucleotides was detected between M. yunnanensis and M. balansae plastomes, which indicate that differences in micro-inversion events could exist between Machilus species as previously report in Solanum species (Kim and Lee, 2004b; Gargano et al., 2012).
Besides the indel markers, 231 SNP markers were detected between M. yunnanensis and M. balansae plastomes, which indicated that the nucleotide substitution events in the chloroplast genome of Machilus species are more than that between species of rice and less than species of ginseng, potato, and orange. Comparative analysis of genomes found 159 SNP sites between two chloroplast genomes of O. sativa and O. nivara (Masood et al., 2004), 464 between plastomes of P. ginseng and P. notoginseng (Dong et al., 2014), 591 between plastomes of Solanum tuberosum and S. bulbocastanum (Chung et al., 2006), and 330 between plastomes of Citrus sinensis and C. aurantiifolia (Su et al., 2014). For the 95 SNP markers in gene coding regions, non-synonymous and synonymous substitutions shared similar numbers of 48 and 47 sites in the entire Machilus plastomes, implying that constraint mechanisms of substitution existed. Under the constraint background, photosynthetic metabolism genes atpE and ndhF and gene expression genes rpoC2 and rpl2 shared the extra synonymous substitution sites which are equal with the non-synonymous substitution sites of ycf1, ycf2, and photosynthetic apparatus gene psaA.
The Indel and SNP mutation events in the genome were not random but clustered as “hotspots” (Shaw et al., 2007; Worberg et al., 2007). Such mutational dynamics created the highly variable regions in the genome. In M. yunnanensis and M. balansae plastomes, we identified seven highly variable loci including the second intron of clpP, ndhF-rpl32, trnQ-psbI, rps8-rpl14, ycf2, rpl32-trnL, and ycf1. Three of the seven, including ndhF-rpl32, rpl32-trnL, and ycf1, were particularly highly variable between Machilus and Cinnamomum plastomes. The second intron of clpP, rpl32-trnL, and ycf1 were the focus of previous analyses investigating sequence variation in seed plants (Dong et al., 2012, 2015; Sarkinen and George, 2013). The ycf2 and ndhF-rpl32 loci have also been widely used for phylogenetic studies (Shaw et al., 2007; Huang et al., 2010). Here, two rarely reported highly variable loci rps8-rpl14 and trnQ-psbI were present in Machilus plastomes. In contrast, none of the 14 regions in the chloroplast genome used previously for phylogenetic analysis were found to be variable (Rohwer et al., 2009; Li et al., 2011). All of these seven highly variable regions and the indel or SNP markers are better to use for phylogenetic studies at the species level in Machilus. We encourage researchers working on the Lauraceae family to use the seven highly variable regions identified in this study for phylogenetic analysis.
Conflict of Interest Statement
The authors declare that the research was conducted in the absence of any commercial or financial relationships that could be construed as a potential conflict of interest.
Acknowledgments
We would like to thank Prof. Shiliang Zhou from the Institute of Botany, Chinese Academy of Sciences, and two reviewers for useful suggestions. This work was supported by the 1000 Talents Program (WQ20110491035).
Supplementary Material
The Supplementary Material for this article can be found online at: http://journal.frontiersin.org/article/10.3389/fpls.2015.00662
References
Aiyar, A. (2000). The use of CLUSTAL W and CLUSTAL X for multiple sequence alignment. Methods Mol. Biol. 132, 221–241. doi: 10.1385/1-59259-192-2:221
Chang, C. C., Lin, H. C., Lin, I. P., Chow, T. Y., Chen, H. H., Chen, W. H., et al. (2006). The chloroplast genome of Phalaenopsis aphrodite (Orchidaceae): comparative analysis of evolutionary rate with that of grasses and its phylogenetic implications. Mol. Biol. Evol. 23, 279–291. doi: 10.1093/molbev/msj029
Chen, J. Q., Li, L., Li, J., and Li, X. W. (2009). Bayesian inference of nrDNA ITS sequences from Machilus (Lauraceae) and its systematic significance. Acta Bot. Yunnan. 31, 117–126. doi: 10.3724/SP.J.1143.2009.08206
Chung, H. J., Jung, J. D., Park, H. W., Kim, J. H., Cha, H. W., Min, S. R., et al. (2006). The complete chloroplast genome sequences of Solanum tuberosum and comparative analysis with Solanaceae species identified the presence of a 241-bp deletion in cultivated potato chloroplast DNA sequence. Plant Cell Rep. 25, 1369–1379. doi: 10.1007/s00299-006-0196-4
Conant, G. C., and Wolfe, K. H. (2008). GenomeVx: simple web-based creation of editable circular chromosome maps. Bioinformatics 24, 861–862. doi: 10.1093/bioinformatics/btm598
Dong, W., Liu, H., Xu, C., Zuo, Y., Chen, Z., and Zhou, S. (2014). A chloroplast genomic strategy for designing taxon specific DNA mini-barcodes: a case study on ginsengs. BMC Genet. 15:138. doi: 10.1186/s12863-014-0138-z
Dong, W., Liu, J., Yu, J., Wang, L., and Zhou, S. (2012). Highly variable chloroplast markers for evaluating plant phylogeny at low taxonomic levels and for DNA barcoding. PLoS ONE 7:e35071. doi: 10.1371/journal.pone.0035071
Dong, W., Xu, C., Cheng, T., Lin, K., and Zhou, S. (2013). Sequencing angiosperm plastid genomes made easy: a complete set of universal primers and a case study on the phylogeny of saxifragales. Genome Biol. Evol. 5, 989–997. doi: 10.1093/gbe/evt063
Dong, W., Xu, C., Li, C., Sun, J., Zuo, Y., Shi, S., et al. (2015). ycf1, the most promising plastid DNA barcode of land plants. Sci. Rep. 5, 8348. doi: 10.1038/srep08348
Doyle, J. J., Davis, J. I., Soreng, R. J., Garvin, D., and Anderson, M. J. (1992). Chloroplast DNA inversions and the origin of the grass family (Poaceae). Proc. Natl. Acad. Sci. U.S.A. 89, 7722–7726. doi: 10.1073/pnas.89.16.7722
Gargano, D., Scotti, N., Vezzi, A., Bilardi, A., Valle, G., Grillo, S., et al. (2012). Genome-wide analysis of plastome sequence variation and development of plastidial CAPS markers in common potato and related Solanum species. Genet. Resour. Crop Evol. 59, 419–430. doi: 10.1007/s10722-011-9692-7
Goremykin, V., Hirsch-Ernst, K. I., Wolfl, S., and Hellwig, F. H. (2003). The chloroplast genome of the basal angiosperm Calycanthus fertilis - structural and phylogenetic analyses. Plant Syst. Evol. 242, 119–135. doi: 10.1007/s00606-003-0056-4
Huang, H., Shi, C., Liu, Y., Mao, S. Y., and Gao, L. Z. (2014). Thirteen Camellia chloroplast genome sequences determined by high-throughput sequencing: genome structure and phylogenetic relationships. BMC Evol. Biol. 14:151. doi: 10.1186/1471-2148-14-151
Huang, J. L., Sun, G. L., and Zhang, D. M. (2010). Molecular evolution and phylogeny of the angiosperm ycf2 gene. J. Syst. Evol. 48, 240–248. doi: 10.1111/j.1759-6831.2010.00080.x
Ingvarsson, P. K., Ribstein, S., and Taylor, D. R. (2003). Molecular evolution of insertions and deletion in the chloroplast genome of Silene. Mol. Biol. Evol. 20, 1737–1740. doi: 10.1093/molbev/msg163
Jansen, R. K., and Palmer, J. D. (1987). A chloroplast DNA inversion marks an ancient evolutionary split in the sunflower family (Asteraceae). Proc. Natl. Acad. Sci. U.S.A. 84, 5818–5822. doi: 10.1073/pnas.84.16.5818
Kim, J. S., Jung, J. D., Lee, J. A., Park, H. W., Oh, K. H., Jeong, W. J., et al. (2006). Complete sequence and organization of the cucumber (Cucumis sativus L. cv. Baekmibaekdadagi) chloroplast genome. Plant Cell Rep. 25, 334–340. doi: 10.1007/s00299-005-0097-y
Kim, K. J., and Lee, H. L. (2004a). Complete chloroplast genome sequences from Korean ginseng (Panax schinseng Nees) and comparative analysis of sequence evolution among 17 vascular plants. DNA Res. 11, 247–261. doi: 10.1093/dnares/11.4.247
Kim, K. J., and Lee, H. L. (2004b). Widespread occurrence of small inversions un the chloroplast genomes of land plants. Mol. Cells 19, 104–113.
Li, J., Wang, S., Jing, Y., Wang, L., and Zhou, S. (2013). A modified CTAB protocol for plant DNA extraction. Chin. Bull. Bot. 48, 72–78. doi: 10.3724/SP.J.1259.2013.00072
Li, L., Li, J., Rohwer, J. G., van der Werff, H., Wang, Z. H., and Li, H. W. (2011). Molecular phylogenetic analysis of the Persea group (Lauraceae) and its biogeographic implications on the evolution of tropical and subtropical Amphi-Pacific Disjunctions. Am. J. Bot. 98, 1520–1536. doi: 10.3732/ajb.1100006
Librado, P., and Rozas, J. (2009). DnaSP v5: a software for comprehensive analysis of DNA polymorphism data. Bioinformatics 25, 1451–1452. doi: 10.1093/bioinformatics/btp187
Masood, M. S., Nishikawa, T., Fukuoka, S., Njenga, P. K., Tsudzuki, T., and Kadowaki, K. (2004). The complete nucleotide sequence of wild rice (Oryza nivara) chloroplast genome: first genome wide comparative sequence analysis of wild and cultivated rice. Gene 340, 133–139. doi: 10.1016/j.gene.2004.06.008
Middleton, C. P., Senerchia, N., Stein, N., Akhunov, E. D., Keller, B., Wicker, T., et al. (2014). Sequencing of chloroplast genomes from wheat, barley, rye and their relatives provides a detailed insight into the evolution of the Triticeae tribe. PLoS ONE 9:e85761. doi: 10.1371/journal.pone.0085761
Nashima, K., Terakami, S., Nishitani, C., Kunihisa, M., Shoda, M., Takeuchi, M., et al. (2015). Complete chloroplast genome sequence of pineapple (Ananas comosus). Tree Genet. Genomes 11, 60. doi: 10.1007/s11295-015-0892-8
Rohwer, J. G. (2000). Toward a phylogenetic classification of the lauraceae: evidence from matK sequences. Syst. Bot. 25, 60–71. doi: 10.2307/2666673
Rohwer, J. G., Li, J., Rudolph, B., Schmidt, S. A., van der Werff, H., and Li, H. W. (2009). Is Persea (Lauraceae) monophyletic? Evidence from nuclear ribosomal ITS sequences. Taxon 58, 1153–1167.
Rohwer, J. G., and Rudolph, B. (2005). Jumping genera: the phylogenetic positions of Cassytha, Hypodaphnis, and Neocinnamomum (Lauraceae) based on different analyses of trnK intron sequences. Ann. Mo. Bot. Gard. 92, 153–178.
Sarkinen, T., and George, M. (2013). Predicting plastid marker variation: can complete plastid genomes from closely related species help? PLoS ONE 8:e82266. doi: 10.1371/journal.pone.0082266
Schattner, P., Brooks, A. N., and Lowe, T. M. (2005). The tRNAscan-SE, snoscan and snoGPS web servers for the detection of tRNAs and snoRNAs. Nucleic Acids Res. 33, W686–W689. doi: 10.1093/nar/gki366
Shaw, J., Lickey, E. B., Schilling, E. E., and Small, R. L. (2007). Comparison of whole chloroplast genome sequences to choose noncoding regions for phylogenetic studies in angiosperms: the tortoise and the hare III. Am. J. Bot. 94, 275–288. doi: 10.3732/ajb.94.3.275
Su, H. J., Hogenhout, S. A., Al-Sadi, A. M., and Kuo, C. H. (2014). Complete chloroplast genome sequence of omani lime (Citrus aurantiifolia) and comparative analysis within the Rosids. PLoS ONE 9:e113049. doi: 10.1371/journal.pone.0113049
Tamura, K., Peterson, D., Peterson, N., Stecher, G., Nei, M., and Kumar, S. (2011). MEGA5: molecular evolutionary genetics analysis using maximum likelihood, evolutionary distance, and maximum parsimony methods. Mol. Biol. Evol. 28, 2731–2739. doi: 10.1093/molbev/msr121
Tang, J. B., Xia, H. A., Cao, M. L., Zhang, X. Q., Zeng, W. Y., Hu, S. N., et al. (2004). A comparison of rice chloroplast genomes. Plant Physiol. 135, 412–420. doi: 10.1104/pp.103.031245
Tang, S. C., Xu, W. B., and Wei, F. N. (2010). Machilus parapauhoi sp. nov. and a new synonym of Machilus (Lauraceae) from east Asia. Nord. J. Bot. 28, 503–505. doi: 10.1111/j.1756-1051.2010.00748.x
Tangphatsornruang, S., Sangsrakru, D., Chanprasert, J., Uthaipaisanwong, P., Yoocha, T., Jomchai, N., et al. (2010). The chloroplast genome sequence of mungbean (Vigna radiata) determined by high-throughput pyrosequencing: structural organization and phylogenetic relationships. DNA Res. 17, 11–22. doi: 10.1093/dnares/dsp025
Terakami, S., Matsumura, Y., Kurita, K., Kanamori, H., Katayose, Y., Yamamoto, T., et al. (2012). Complete sequence of the chloroplast genome from pear (Pyrus pyrifolia): genome structure and comparative analysis. Tree Genet. Genomes 8, 1–14. doi: 10.1007/s11295-012-0469-8
Wei, F. N., and Werff, H. V. D. (2008). “Flora of China,” in Dipterocarpaceae, Vol. 13, eds Z. Y. Wu, P. H. Raven, and D. Y. Hong (St. Louis, MO: Science Press, Beijing, and Missouri Botanical Garden Press), 201–224.
Worberg, A., Quandt, D., Barniske, A. M., Lohne, C., Hilu, K. W., and Borsch, T. (2007). Phylogeny of basal eudicots: insights from non-coding and rapidly evolving DNA. Organ. Diver Evol. 7, 55–77. doi: 10.1016/j.ode.2006.08.001
Wu, C. C., Ho, C. K., and Chang, S. H. (2015). The complete chloroplast genome of Cinnamomum kanehirae Hayata (Lauraceae). Mitochondr. DNA 8, 1–2.
Wyman, S. K., Jansen, R. K., and Boore, J. L. (2004). Automatic annotation of organellar genomes with DOGMA. Bioinformatics 20, 3252–3255. doi: 10.1093/bioinformatics/bth352
Xu, Q., Xiong, G., Li, P., He, F., Huang, Y., Wang, K., et al. (2012). Analysis of complete nucleotide sequences of 12 gossypium chloroplast genomes: origin and evolution of allotetraploids. PLoS ONE 7:e37128. doi: 10.1371/journal.pone.0037128
Keywords: mutation, genome, chloroplast, Machilus, Lauraceae
Citation: Song Y, Dong W, Liu B, Xu C, Yao X, Gao J and Corlett RT (2015) Comparative analysis of complete chloroplast genome sequences of two tropical trees Machilus yunnanensis and Machilus balansae in the family Lauraceae. Front. Plant Sci. 6:662. doi: 10.3389/fpls.2015.00662
Received: 24 June 2015; Accepted: 11 August 2015;
Published: 25 August 2015.
Edited by:
Maureen Hanson, Cornell University, USACopyright © 2015 Song, Dong, Liu, Xu, Yao, Gao and Corlett. This is an open-access article distributed under the terms of the Creative Commons Attribution License (CC BY). The use, distribution or reproduction in other forums is permitted, provided the original author(s) or licensor are credited and that the original publication in this journal is cited, in accordance with accepted academic practice. No use, distribution or reproduction is permitted which does not comply with these terms.
*Correspondence: Richard T. Corlett, Center for Integrative Conservation, Xishuangbanna Tropical Botanical Garden, Chinese Academy of Sciences, Mengla 666303, China,Y29ybGV0dEB4dGJnLm9yZy5jbg==
†These authors have contributed equally to this work.