 Vojtěch Čada
 Hana Šantrůčková2
 Lenka Kubištová
 Meelis Seedre
- 1Department of Forest Ecology, Faculty of Forestry and Wood Sciences, Czech University of Life Sciences Prague, Prague, Czech Republic
- 2Faculty of Science, University of South Bohemia in České Budějovice, České Budějovice, Czech Republic
Atmospheric pollution critically affects forest ecosystems around the world by directly impacting the assimilation apparatus of trees and indirectly by altering soil conditions, which subsequently also leads to changes in carbon cycling. To evaluate the extent of the physiological effect of moderate level sulfate and reactive nitrogen acidic deposition, we performed a retrospective dendrochronological analysis of several physiological parameters derived from periodic measurements of carbon stable isotope composition (13C discrimination, intercellular CO2 concentration and intrinsic water use efficiency) and annual diameter increments (tree biomass increment, its inter-annual variability and correlation with temperature, cloud cover, precipitation and Palmer drought severity index). The analysis was performed in two mountain Norway spruce (Picea abies) stands of the Bohemian Forest (Czech Republic, central Europe), where moderate levels of pollution peaked in the 1970s and 1980s and no evident impact on tree growth or link to mortality has been reported. The significant influence of pollution on trees was expressed most sensitively by a 1.88‰ reduction of carbon isotope discrimination (Δ13C). The effects of atmospheric pollution interacted with increasing atmospheric CO2 concentration and temperature. As a result, we observed no change in intercellular CO2 concentrations (Ci), an abrupt increase in water use efficiency (iWUE) and no change in biomass increment, which could also partly result from changes in carbon partitioning (e.g., from below- to above-ground). The biomass increment was significantly related to Δ13C on an individual tree level, but the relationship was lost during the pollution period. We suggest that this was caused by a shift from the dominant influence of the photosynthetic rate to stomatal conductance on Δ13C during the pollution period. Using biomass increment-climate correlation analyses, we did not identify any clear pollution-related change in water stress or photosynthetic limitation (since biomass increment did not become more sensitive to drought/precipitation or temperature/cloud cover, respectively). Therefore, we conclude that the direct effect of moderate pollution on stomatal conductance was likely the main driver of the observed physiological changes. This mechanism probably caused weakening of the spruce trees and increased sensitivity to other stressors.
Introduction
Atmospheric pollution and particularly acid sulfate and reactive nitrogen depositions influence ecosystem functioning and services such as carbon sequestration, water purification and nutrient cycling around the world (e.g., Oulehle et al., 2011). While sulfur dioxide (SO2) emissions have been successfully regulated since the end of the 20th century in Europe and North America, they are increasing in other parts of the world (Klimont et al., 2013). Emissions of nitrogen oxides (NOx) and ammonia (NH3) have also decreased since the end of the 20th century in Europe, but remain at relatively high levels compared to the pre-industrial period (Hůnová, 2014).
Low levels of sulfur and nitrogen deposition have a fertilizing effect on plants (Meng et al., 1994; Högberg et al., 2006), while increased levels of deposition can acidify soils causing soil nutrient depletion and toxic aluminium (Al3+) mobilization that can weaken the tree root system and cause nutrient deficiency or water stress (Jentschke et al., 2001; Hruška et al., 2012). High levels of deposition directly damage foliage by entering the intercellular space through the stomata and decrease photosynthetic rate, stomatal conductance (Meng et al., 1994) and alter plant water use efficiency (Thomas et al., 2013). Evergreen conifers covering large areas of temperate forests are especially sensitive to atmospheric pollution (Greaver et al., 2012) because the relatively larger surface area of their leaves (also retained during the winter season) effectively captures the deposition of pollutants from the atmosphere (Kopáček and Hruška, 2010). In this study, we examine the extent of the pollution physiological effects on conifers subjected to moderate pollution load, which is not satisfactorily understood at present. This is achieved by characterizing tree physiology using variables derived from plant carbon stable isotope composition and tree biomass increment.
Forest biomass production also plays a fundamental role in the global carbon cycle and forests represent a major terrestrial storage and sink of atmospheric CO2 (Pregitzer and Euskirchen, 2004). Therefore, mechanistic understanding of complex environmental effects (including pollution) on forest biomass production is needed (Pregitzer and Euskirchen, 2004). For example, some studies predict an increase in biomass production due to a possible fertilizing effect of increased atmospheric CO2 (Peñuelas et al., 2011; Saurer et al., 2014). However, if other limiting factors such as atmospheric pollution or temperatures overwhelm the CO2 effect, very complex and variable responses could be observed (Rydval and Wilson, 2012; Treml et al., 2012; Thomas et al., 2013). This study improves understanding of Norway spruce biomass production by examining its temporal trends and inter-annual variations in relation to air pollution and carbon isotope discrimination.
Environmental changes such as air pollution and climate change can alter the importance of different factors limiting tree physiological processes. Dendrochronological studies have shown for example that temperature limited trees can become insensitive to temperature as a result of pollution load (Elling et al., 2009) or can become sensitive to drought in older ages, under higher competition pressure or in warmer climate (Primicia et al., 2015). More importantly, if a change in the correlation is detected during the peak in air pollution, it may indicate changes in water stress (correlation with precipitation or drought index) and/or photosynthesis limitation by climate (correlation with temperature or cloud cover). Increased water stress could be a consequence of pollution related root weakening and decreased temperature/cloud cover response could be a consequence of pollution related photosynthesis limitation by nutrient deficiency or direct foliage damage.
In central Europe atmospheric pollution peaked in the 1970s and 1980s with highest levels in the region called the “Black Triangle,” where widespread mortality and reduction in tree growth, particularly in Norway spruce stands, occurred (Kandler and Innes, 1995; Sander et al., 1995; Rydval and Wilson, 2012). Although the direct link between air pollution and forest decline is evident in the “Black Triangle,” there is lack of evidence about the pollution effect from moderately polluted areas beyond the “Black Triangle” (see Figure 1; Kandler and Innes, 1995). The unique study from a moderately polluted area by Šantrůčková et al. (2007) indicated increased stress of Norway spruce trees exposed to moderate pollution load by the analysis of carbon isotope discrimination. Previous studies also often focused on a single physiological parameter (e.g., Šantrůčková et al., 2007; Rydval and Wilson, 2012). In this work we will expand on previous studies with the analysis of the complex response of spruce trees to air pollution as indicated by several physiological variables.
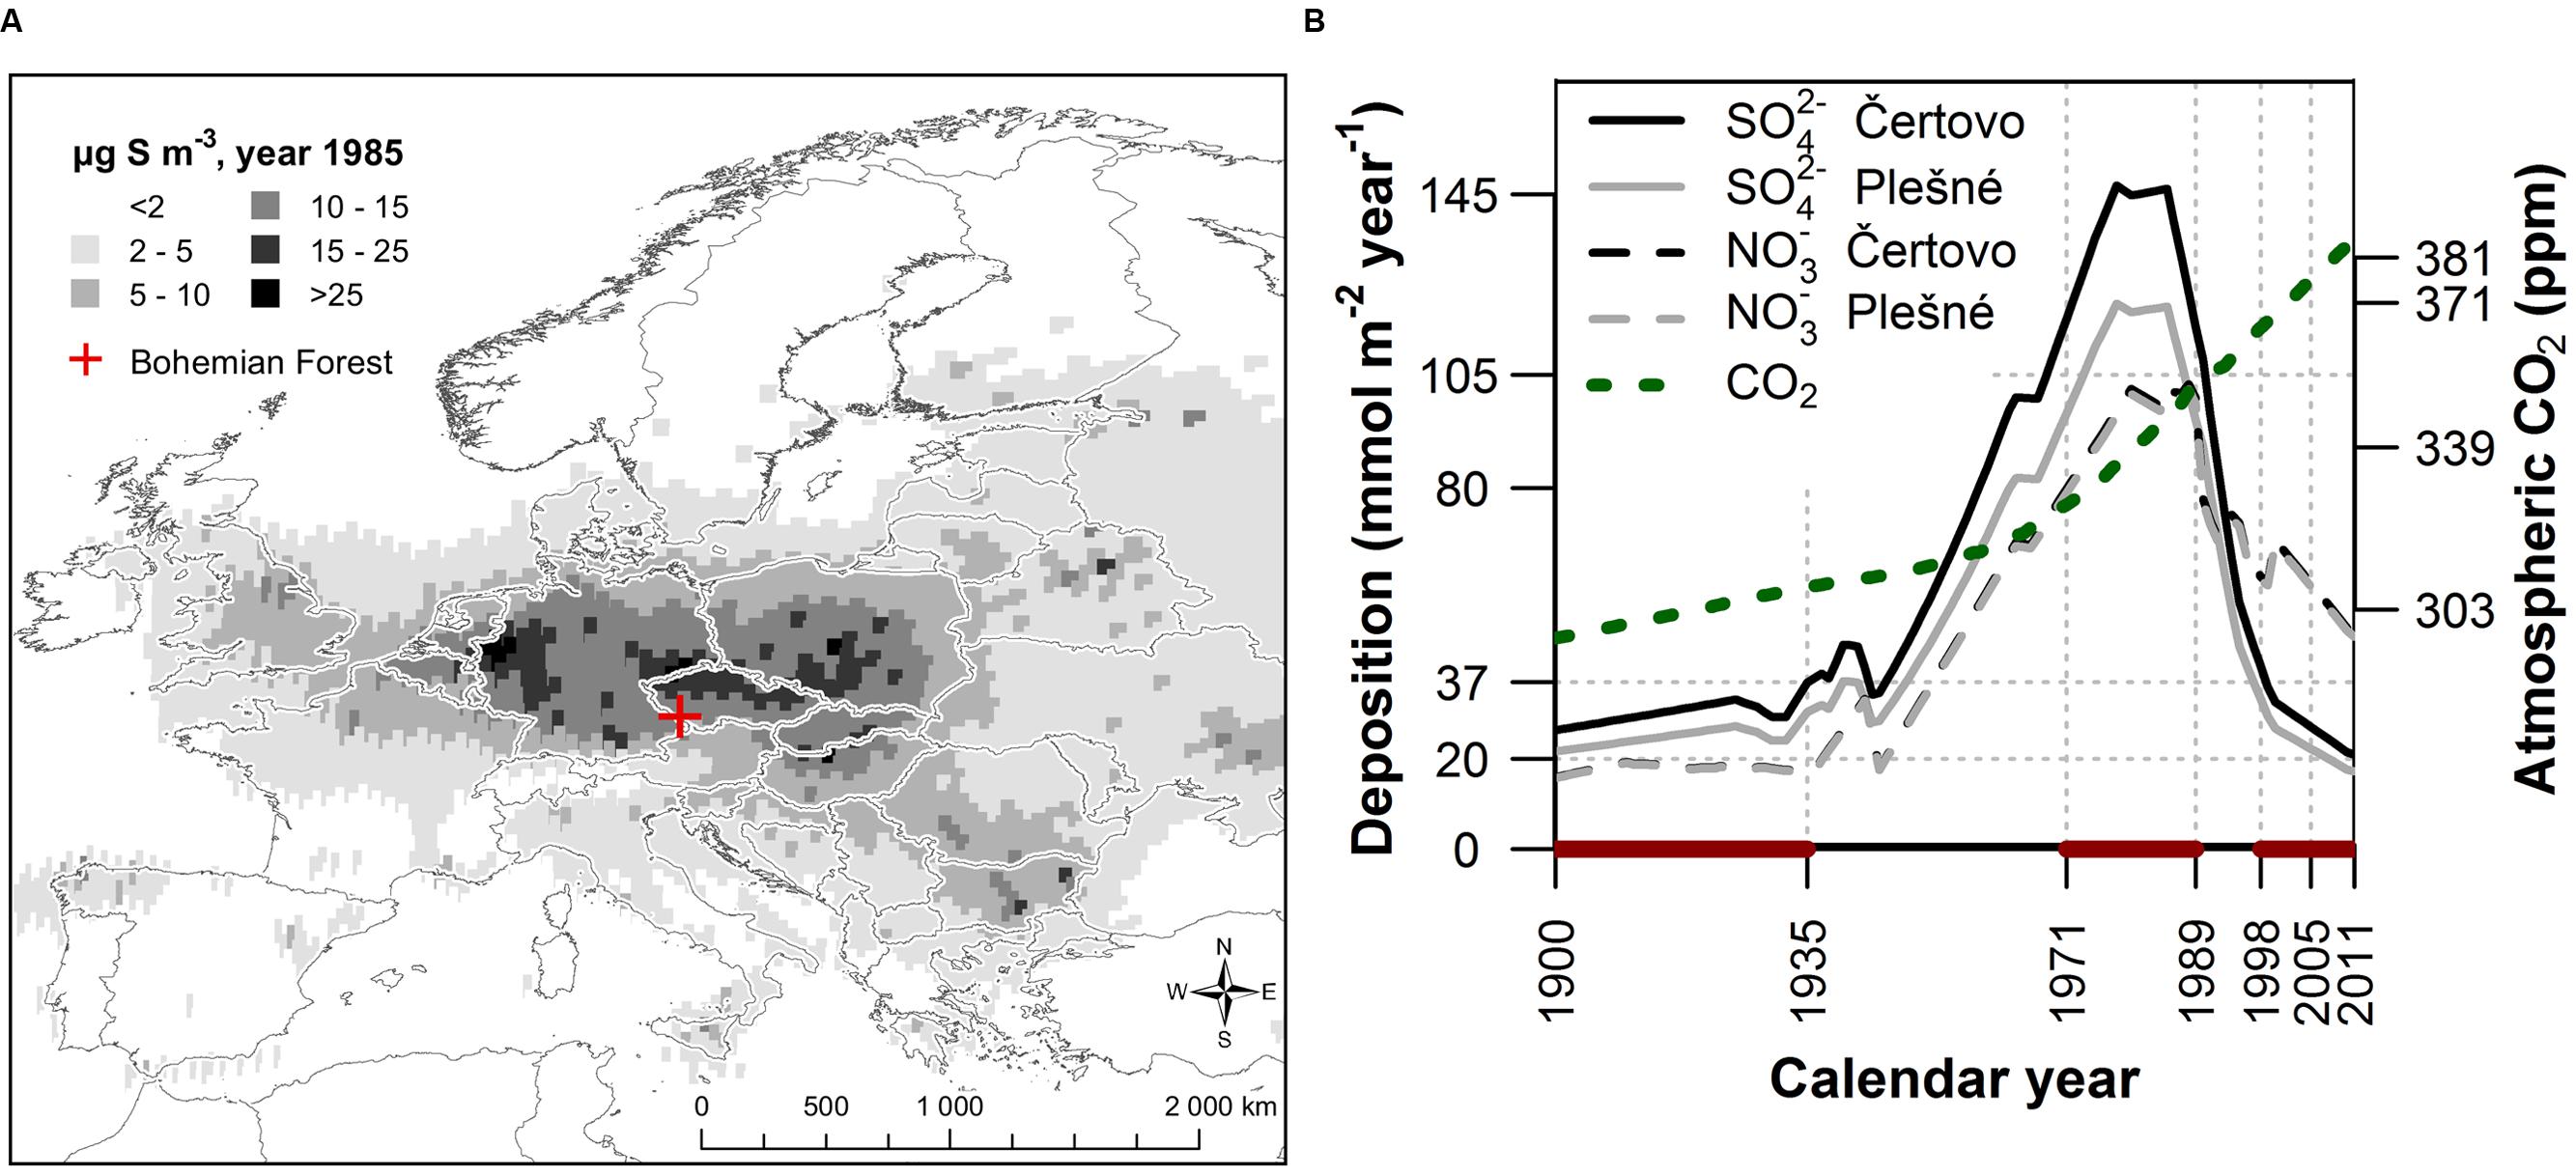
FIGURE 1. (A) European atmospheric SO2 concentrations in 1985 (http://www.emep.int) and the location of the moderately polluted study area in the Bohemian Forest situated outside the most severely polluted “Black Triangle” spanning the northern Czech Republic, eastern Germany and southern Poland. (B) Temporal trends of SO42- and NO3- deposition (Kopáček and Hruška, 2010) together with the increasing trend of atmospheric CO2 concentration (McCarroll and Loader, 2004), highlighting selected periods before (1900 – 1935), during (1971 – 1989) and after (1998 – 2005 and 2006 – 2011) the peak in air pollution.
The primary goal of this study is to investigate the extent to which moderate air pollution affected the physiology of mountain Norway spruce in the Bohemian Forest in central Europe. The physiological response is represented using variables obtained from tree-ring carbon isotope composition [13C discrimination, intercellular CO2 concentration (Ci) and intrinsic water use efficiency (iWUE)] and tree-ring increment (biomass increment, its inter-annual variability and correlation with climate). We specifically aim to address the following questions:
(1) Did the temporal trend of selected spruce physiological parameters follow the temporal trend of air pollution?
(2) What is the relationship between biomass increment and carbon isotope discrimination within tree individuals?
(3) Did biomass increment-climate (temperature, cloud cover, precipitation and Palmer drought severity index) correlations changed during the peak in air pollution?
Materials and Methods
Study Area
The study was conducted in the mountain range called the Bohemian Forest in central Europe located along the borders of the Czech Republic, Germany (Bavaria), and Austria (Figure 1A). This area was affected by significant pollution load, which peaked in the 1970s and 1980s, although the pollution levels were relatively lower compared to other areas of Central Europe. Sulfur emissions reached values of 10–15 μg S m-3 in comparison to more than 25 μg S m-3 in the most severely polluted areas such as the Ore Mts. (Figure 1A)1. In the 1970s and 1980s, deposition of SO42- and NO3- was around 125 and 95 mmol m-2 year-1, respectively, based on model results, which is more than 10 and 25 times higher compared to pre-industrial conditions (Figure 1B; Kopáček and Hruška, 2010). To account for this temporal pattern, we divided the data into four periods; before (1900 – 1935), during (1971 – 1989) and after (1998 – 2005 and 2006 – 2011) the period of maximum air pollution. The period after the peak in air pollution was split into two periods to analyze the pattern of forest recovery. By comparing the various tree physiological parameters between these periods we characterize their change over time (hereafter referred to as temporal trend) and association with air pollution.
Our study focuses on natural mountain Norway spruce [Picea abies (L.) Karst.] forest, which are present at high elevations of the mountain range. Norway spruce dominates the tree layer (>90%) with minor components of Sorbus aucuparia L., Abies alba Mill., and Fagus sylvatica L.. The understorey is mostly dominated by Calamagrostis villosa (Chaix) J. F. Gmel., Vaccinium myrtillus L. and Athyrium distentifolium Tausch ex Opiz (Svoboda et al., 2006). A large part of the forest comprises of natural old-growth forest, which developed under a natural disturbance regime and which was recently affected by extensive disturbances (Čada et al., 2016).
We selected two glacial-lake catchments 65 km apart; Čertovo (49°10′N, 13°12′E, 1027 – 1343 m.a.s.l.) in the NW and Plešné (48°47′N, 13°51′E, 1089 – 1378 m.a.s.l.) in the SE part of the mountain range. These lakes and catchments are subjected to long-term ecosystem monitoring and research (e.g., Kopáček and Vrba, 2006; Vrba et al., 2014; Kaňa et al., 2015). The bedrock of the Čertovo and Plešné catchments is characterized by poor mica schist and richer granite, respectively, (Cháb et al., 2007). Soils in the area mostly include acidic leptosols, podsols, and dystric cambisols with a higher level of base saturation in the Plešné catchment (Šantrůčková et al., 2007). The climate is cold and humid with mean annual temperatures of around 4°C (Turek et al., 2014), and mean annual precipitation above 1200 mm year-1 (CRU TS3.10; Harris et al., 2014).
Data Collection
Samples for the stable carbon isotopic analyses of wood were collected along a slope transect in both catchments. We extracted increment cores at breast height (1.3 m) from 25 and 6 dominant and healthy (without signs of injury or defoliation) trees in the Čertovo and Plešné catchment, respectively. Samples were analyzed separately for each individual tree. Cores were sectioned into 1–5-year segments, dried and homogenized to a fine powder in a ball mill (MM200 Retsch, Haan, Germany). Carbon isotope composition was determined using an elemental analyzer (EA1110, ThermoQuest, Italy) linked to DeltaXLplus (ThermoFinnigan, Bremen, Germany) for each 1–5-year sample of bulk wood, because the bulk wood provides unbiased estimates in comparison to cellulose composition (Harlow et al., 2006). The 13C/12C isotopic ratio was calculated relative to the Vienna-Pee Dee Belemnite (VPDB) standard to obtain δ13C (McCarroll and Loader, 2004). Trees sampled for isotopic analysis recruited to breast height between 1728 and 1878 (median 1828). We therefore believe that the isotopic composition in the studied period after 1900 was not affected by a juvenile effect.
Samples for biomass increment analysis were collected using a regular grid set across the forest stand. We utilized part of the published datasets of Seedre et al. (2015) and Svoboda et al. (2012) for Čertovo and Plešné catchment, respectively. The regular grid was set across the Čertovo catchment, while the Plešné catchment samples come from a 20 ha plot 2 km from the lake. Increment cores were taken at breast height from 105 canopy trees in both localities. Cores were air-dried, glued to wooden mounts and cut with a razor blade. Ring widths were measured to the nearest 0.01 mm using a sliding table LINTAB and TsapWin software (RINNTECH, Heidelberg, Germany)2. Each tree-ring series was cross-dated visually and also using statistical tests implemented in Past4 (Knibbe, 2007; SCIEM, Vienna, Austria). We only used samples which could be reliably cross-dated. All series began before 1900 and median recruitment to breast height was 1859 for the Čertovo and 1814 for the Plešné catchment. Mean sensitivity was 0.21 and 0.20 and mean first order autocorrelation reached 0.86 and 0.88 at the Plešné and Čertovo catchment, respectively. Distance to the pith for cores that did not intersect the pith was estimated using the curvature of the innermost rings and concentric circles printed on transparent foil. Tree age was then estimated by subtracting from the innermost dated ring the estimated distance to the pith divided by the width of the five innermost rings along with 10 additional years to roughly account for the time that a spruce takes to grow from the stump height (30 cm) to the coring height (130 cm).
Physiological Parameters
Plants obtain their carbon from the atmosphere, yet their 13C/12C isotopic ratio is reduced relative to CO2 in air. This process, called carbon isotope discrimination (against heavier 13C isotopes), yields variable isotope ratios depending on the specific plant response to the environment (e.g., irradiance, drought, temperature). CO2 diffusion through stomata and photosynthetic carbon fixation are the main processes involved in carbon isotope discrimination. The lighter 12C isotope diffuses more easily than the heavier 13C and is preferred during fixation by the carboxylation enzyme (Farquhar et al., 1982; McCarroll and Loader, 2004). The leaf internal CO2 concentration is also intimately related to 13C discrimination because the relative proportion between the CO2 influx through stomata and photosynthetic rate control both variables. For example, if the photosynthetic rate is higher than stomatal CO2 influx, the internal CO2 concentration decreases, and 13C discrimination decreases likewise because internal proportion of 13C increases (Farquhar et al., 1982; McCarroll and Loader, 2004). By opening their stomata, plants not only obtain CO2 for photosynthesis but also loose water vapor. Therefore, plant carbon isotope composition is proportional to water-use efficiency (Farquhar et al., 1982; McCarroll and Loader, 2004).
The carbon isotope ratio of sugars synthetized during photosynthesis is imprinted in plant tissues produced during a given season and we reconstructed the annually integrated spruce physiological parameters (i.e., discrimination against 13C, Ci and iWUE) from the carbon isotope ratio of wood. We reconstructed carbon isotope composition of tree foliage using the relationship (δ13Cfoliage = 1.0523 ∗ δ13Cwood - 0.205) presented in Gebauer and Schulze (1991) and expressed in terms of discrimination against 13C in the atmosphere (Δ13C) while accounting for the anthropogenic increase in 12C atmospheric concentrations (McCarroll and Loader, 2004):
where δ13Cair and δ13Cfoliage is the relative isotopic composition of the atmosphere and foliage, respectively, for each 5-year segent. Values of δ13Cair were interpolated from the Law Dome ice cores (McCarroll and Loader, 2004). To reveal the amount of CO2 supply for photosynthesis in the conditions of increasing atmospheric CO2 concentrations, we calculated the seasonally integrated Ci according to Farquhar et al. (1982):
where Ca is the atmospheric CO2 concentration in the relevant years, ‘a’ and ‘b’ are constants representing the fractionation during diffusion of CO2 through the stomata (4.4‰) and during carboxylation (27‰); values of Ca were obtained from the Law Dome ice cores (McCarroll and Loader, 2004). iWUE reflects the proportion of carbon assimilated in photosynthesis (A) in relation to the potential water loss through stomata (stomatal conductance to water vapor, gw), i.e., iWUE = A/gw. iWUE was calculated according to McCarroll and Loader (2004):
where the constant 0.625 reflects the ratio of CO2 and H2O diffusivity based on the assumption that A = (Ca – Ci) ∗ gc, where gc is the stomatal conductance to CO2.
Biomass increments were calculated for each calendar year between 1900 and 2006 (2007) for the Čertovo (Plešné) catchment based on ring width series, which were converted to diameters of each year proceeding from pith to bark (including the estimated distance to the pith). The diameters were multiplied by a constant of 1.096 to account for bark thickness and water loss. This value was obtained by comparing the diameters in the final year with actual diameter measurements (Table 1). Total tree biomass (needles + branches + dry branches + stem + roots) was calculated using the obtained diameters, ages and modeled heights and crown lengths (Table 1) based on best available models developed by Wirth et al. (2004). We used two separate models for height/diameter relationships for the Čertovo and Plešné catchments using data from Svoboda and Pouska (2008) and Seedre et al. (2015), respectively, and one model for the crown length/diameter relationship using data published in Seedre et al. (2015) from the Čertovo catchment, which was considered sufficient because the trends between the two catchments were expected to be similar and because crown length has a relatively minor influence on total biomass. Finally, the biomass increment was obtained by subtracting the biomass of the preceding year from that of the current year. Mean correlation between individual tree biomass increment series for 1900–2007 was 0.20 for the Čertovo and 0.23 for the Plešné catchments. The inter-annual variability of biomass increment was evaluated using a standard dendrochronological metric called sensitivity (Fritts, 1976), which was calculated as:
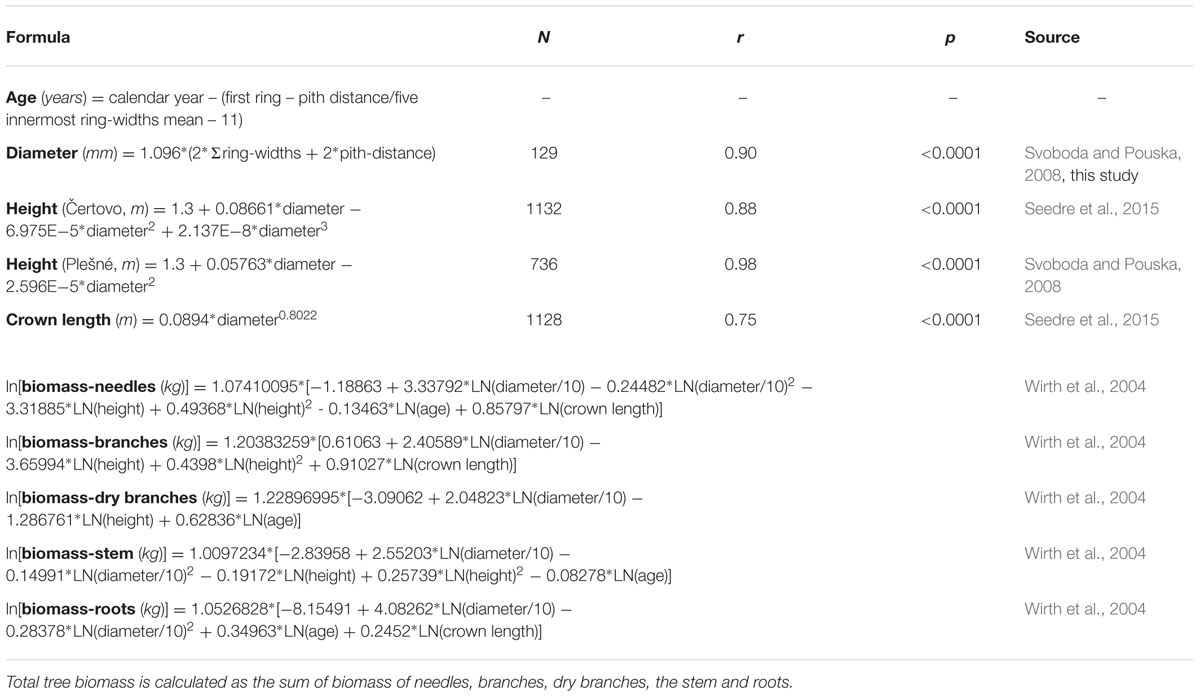
TABLE 1. Formulas and model descriptions used for biomass calculation.
where |incrementi – incrementi-1| is the absolute value of the difference between the increment of the current and preceding year.
For the biomass increment-climate correlation analysis we removed the decadal and longer scale trends from the biomass increment series in order to remove the influence of confounding effects such as age and competition dynamics from the data. The biomass increments were first power transformed and the optimal power (p) was computed as
where m is the slope of the regression of the log10 median ring width against the log10 interquartile range of ring width based on non-overlapping, 10-year segments (Emerson, 1983). We obtained an optimal power of p = 0.14 (N = 3779, r = 0.82). We fit a 30-year cubic smoothing spline with a 50% frequency cutoff to each transformed tree biomass increment series and subtracted the spline from the transformed increments (Cook and Peters, 1997). The detrending procedure was performed using the package dplR (Bunn, 2008) in the R statistical software (version 3.1.1; R Development Core Team, 2014). This procedure removes not only the above-mentioned confounding effects, but also decadal scale climate-related trends (e.g., Wilson et al., 2005). To account for this trend removal, the climatic data were detrended following the same procedure.
Gridded monthly climatic data from the CRU TS3.10 database (Harris et al., 2014) were used for the biomass increment-climate correlation analysis. We selected two pairs of variables that could potentially limit photosynthesis or water availability [i.e., temperature, cloud cover, precipitation and Palmer drought severity index (PDSI)]. PDSI is a normalized index based on a water balance model of soil moisture where values around zero represent normal conditions and increasingly negative (positive) values represent progressively drier (wetter) conditions. We then performed a preliminary increment-climate correlation analysis (for the whole 1901 – 2007 period) to determine for which months each of the climatic variables show a significant relationship with the annual biomass increment. The months with strongest relationships for each variable were used to examine potential changes in the relationship between each climatic variable and biomass increment over time. If relevant the individualmonths with strong correlation were averaged (or summed for precipitation) into periods to obtain stronger relationship. Highest correlations were identified with growing season temperatures (May to September), cloud cover of the early growing season (May to July), precipitation in the late growing season of the previous year (previous-year July to previous-year September) and drought PDSI in September of the previous year, which is consistent with other studies of the same forest type (Levanič et al., 2009; Treml et al., 2012; Primicia et al., 2015). Mean correlations of average biomass increment series were 0.38 with temperature, 0.36 with cloud cover, 0.24 with precipitation and 0.19 with drought index (all relationships were statistically significant at p < 0.05 except drought index for the Čertovo catchment). Finally, we calculated the Spearman correlation coefficient between the detrended climatic variable series of the above-specified months and the detrended biomass increment series of each individual tree for the periods defined using temporal trend of air pollution (Figure 1B). The use of Spearman correlation was suitable here because of the relatively short periods used and the robustness of Spearman correlation against the effect of single extreme values. Nevertheless, the interpretation of increment-climate correlations should be viewed with caution considering the short periods examined. To support our interpretations we also present running Spearman correlations in the Appendix to acknowledge the temporal variability of the increment-climate relationship.
Statistical Analysis
To assess the temporal trend of the physiological parameters in relation to air pollution, we averaged all of the parameters into periods defined by the air pollution trend (Figure 1B) so that for each period we obtained one value for each individual tree (see Supplementary Figures S1, S2 and S3 for the original time series). Using R software (version 3.1.1; R Development Core Team, 2014) for statistical analysis, we applied linear mixed effect models in the package lme4 (Bates et al., 2015) to test if the physiological parameters differed between the defined periods. The analysis was followed by Tukey’s pairwise comparison in the ‘lsmeans’ package (Lenth, 2015). We included tree individuals as a random effect and the time periods and catchment as a fixed effect. The catchment effect was significant in some models (see Table 2) and we present the effect in figures only for those cases where catchment effect was found to be significant. For Δ13C we also calculated a more complex model which included the biomass increment, inter-annual variability of the biomass increment, elevation, age, and diameter. Of these variables only the biomass increment showed a significant relationship. We selected the best model using the lowest Akaike Information Criterion (AIC) values and ANOVA comparison. We also calculated a pseudo-R2 based on Nakagawa and Schielzeth (2013) using the package piecewiseSEM (Lefcheck, 2015). Calculated pseudo-R2 comprises of marginal (R2m) and conditional (R2c) values that account for the proportion of the variance explained by the fixed factors and whole model (i.e., fixed plus random factors), respectively.
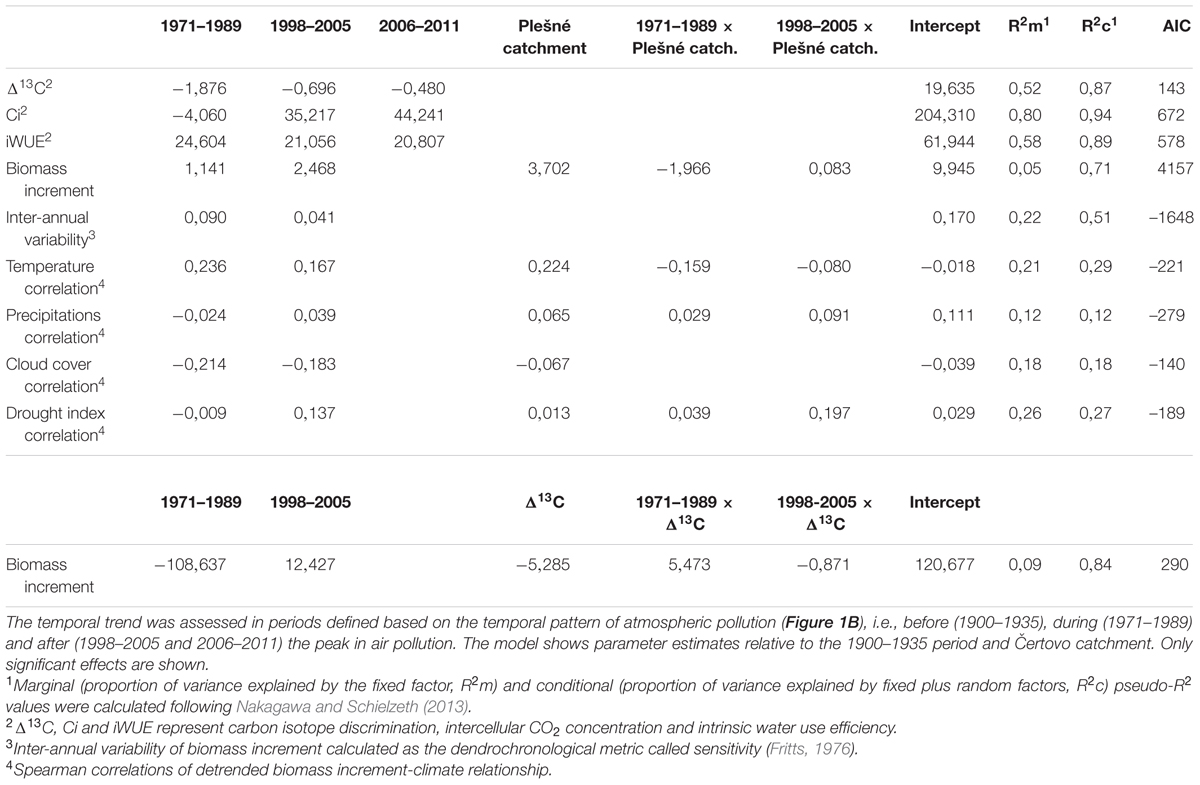
TABLE 2. Parameter estimates of the best mixed–effect models including tree–individual as a random effect.
Results
We found significant temporal changes in spruce physiological parameters in response to the peak in air pollution (Table 2), but the temporal trend of the individual parameters was different. The most distinct deviation during the air pollution period was observed in the discrimination against heavier carbon isotope (Δ13C, Figure 2A) that transiently decreased and recovered after the pollution period. This result indicates a relatively lower internal leaf CO2 concentration (in comparison to atmospheric CO2) and most likely stressful conditions due to polluted air. Model estimates (Table 2) show a 10% decrease in Δ13C in response to the pollution and a subsequent recovery of 7%. Surprisingly, considering the atmospheric CO2 concentration increase (Figure 1B), it seems that intercellular CO2 availability remained relatively stable during the peak in pollution compared to the earlier period (Figure 2B). We observed a slight, though insignificant, decrease of Ci by 2% in the pollution period, but a sharp increase in the recent periods by 17 – 24% likely as a result of release from polluted conditions and higher CO2 availability. The combined effect of air pollution and CO2 resulted in changes of spruce water use efficiency (Figure 2C), which sharply increased (by 40%) during the peak in air pollution and decreased slightly (by 4%) after pollution levels declined. Water use efficiency was highest during the pollution period, but the effect of increased atmospheric CO2 can be observed in the difference between the iWUE before and after the pollution (34% increase).
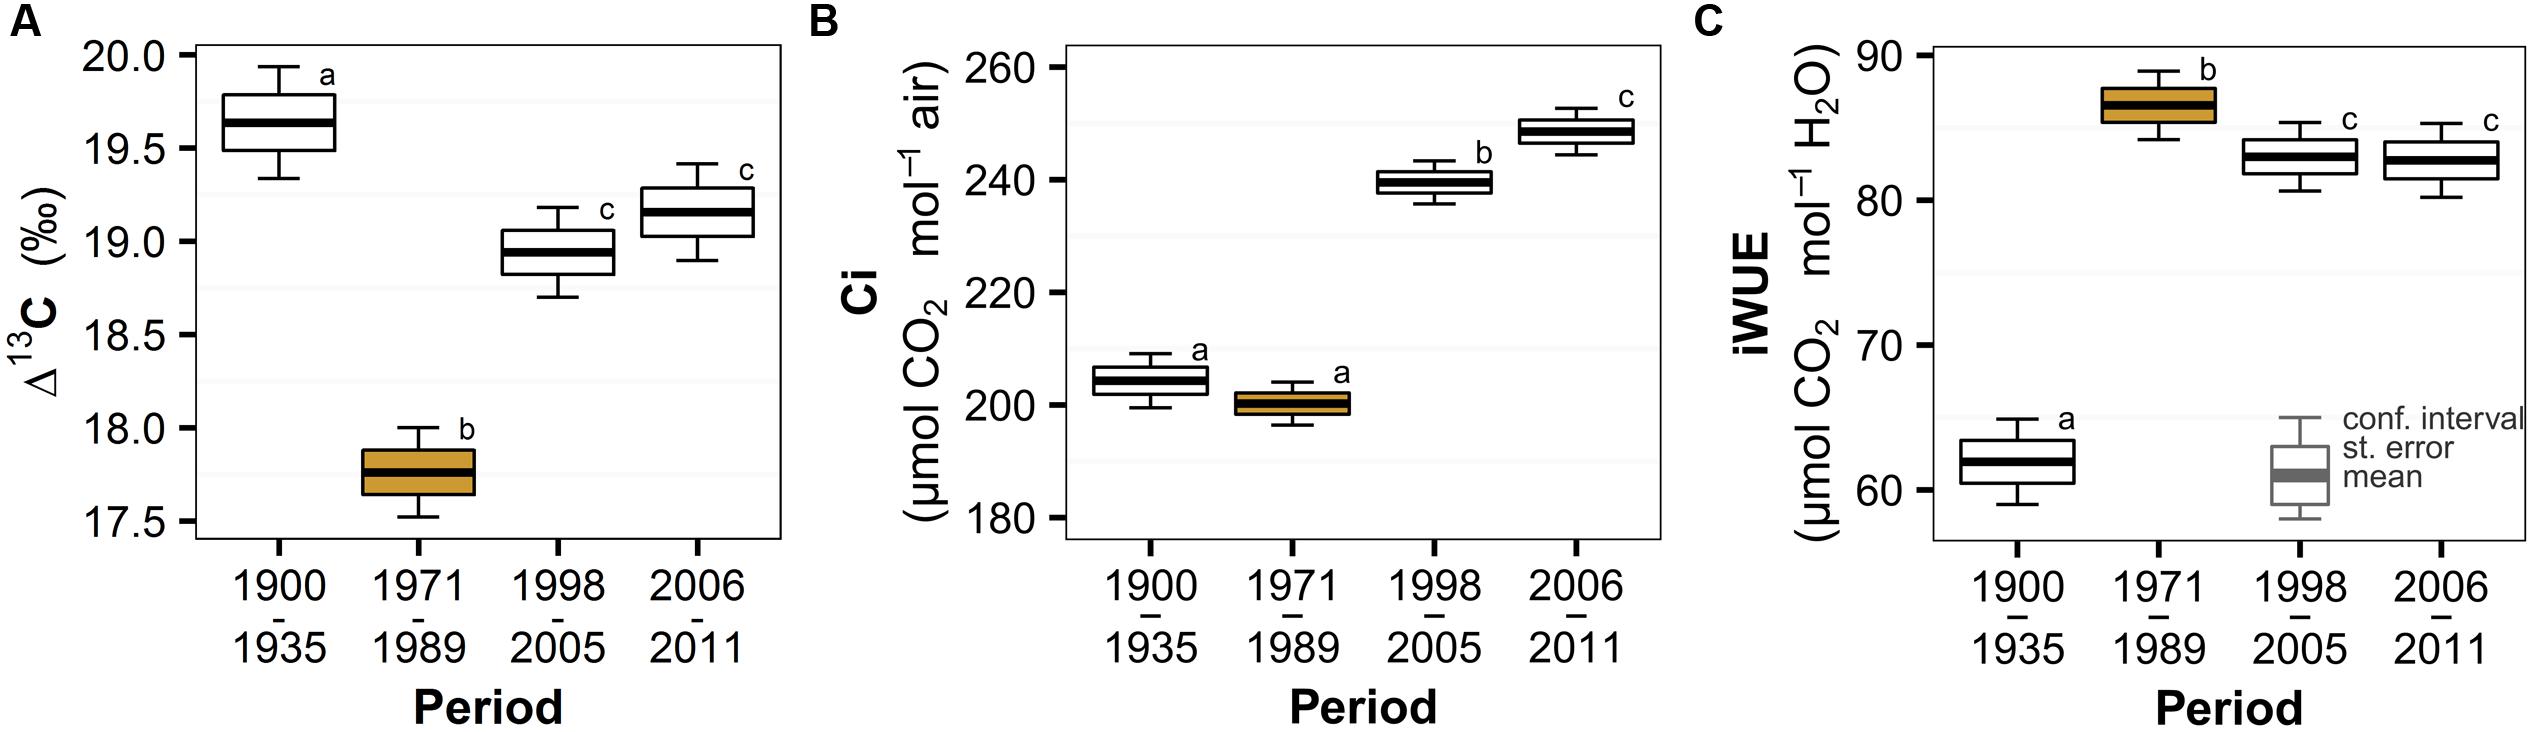
FIGURE 2. Temporal trend of Norway spruce (A) carbon isotope discrimination (Δ13C), (B) intercellular CO2 concentration (Ci) and (C) intrinsic water-use efficiency (iWUE) divided into periods based on the trend of atmospheric pollution (the period with peaking pollution is orange highlighted) in the Bohemian Forest. Significant changes are represented by different lowercase letters.
Mean tree biomass increment did not show any consistent temporal trend with air pollution or Δ13C since the periods before and during pollution did not differ significantly (Figure 3A). However, we observed a slight increase in the recent period after the pollution diminished, though significant at Plešné (26% increase) and insignificant at Čertovo (12% increase) catchment. On the other hand, inter-annual variability of the biomass increment followed a similar trend to Δ13C and air pollution (Figure 3B), which may suggest increased sensitivity to environmental factors induced by pollution. We observed a 53% increase in inter-annual variability during the pollution period relative to the pre-pollution period and a subsequent decrease of 19% after pollution levels decreased. The biomass increment generally reflects diverse environmental factors (such as age or competition) as displayed in the lowest explained variance in the models of biomass increment and the involvement of catchments ant catchment–period interactions.
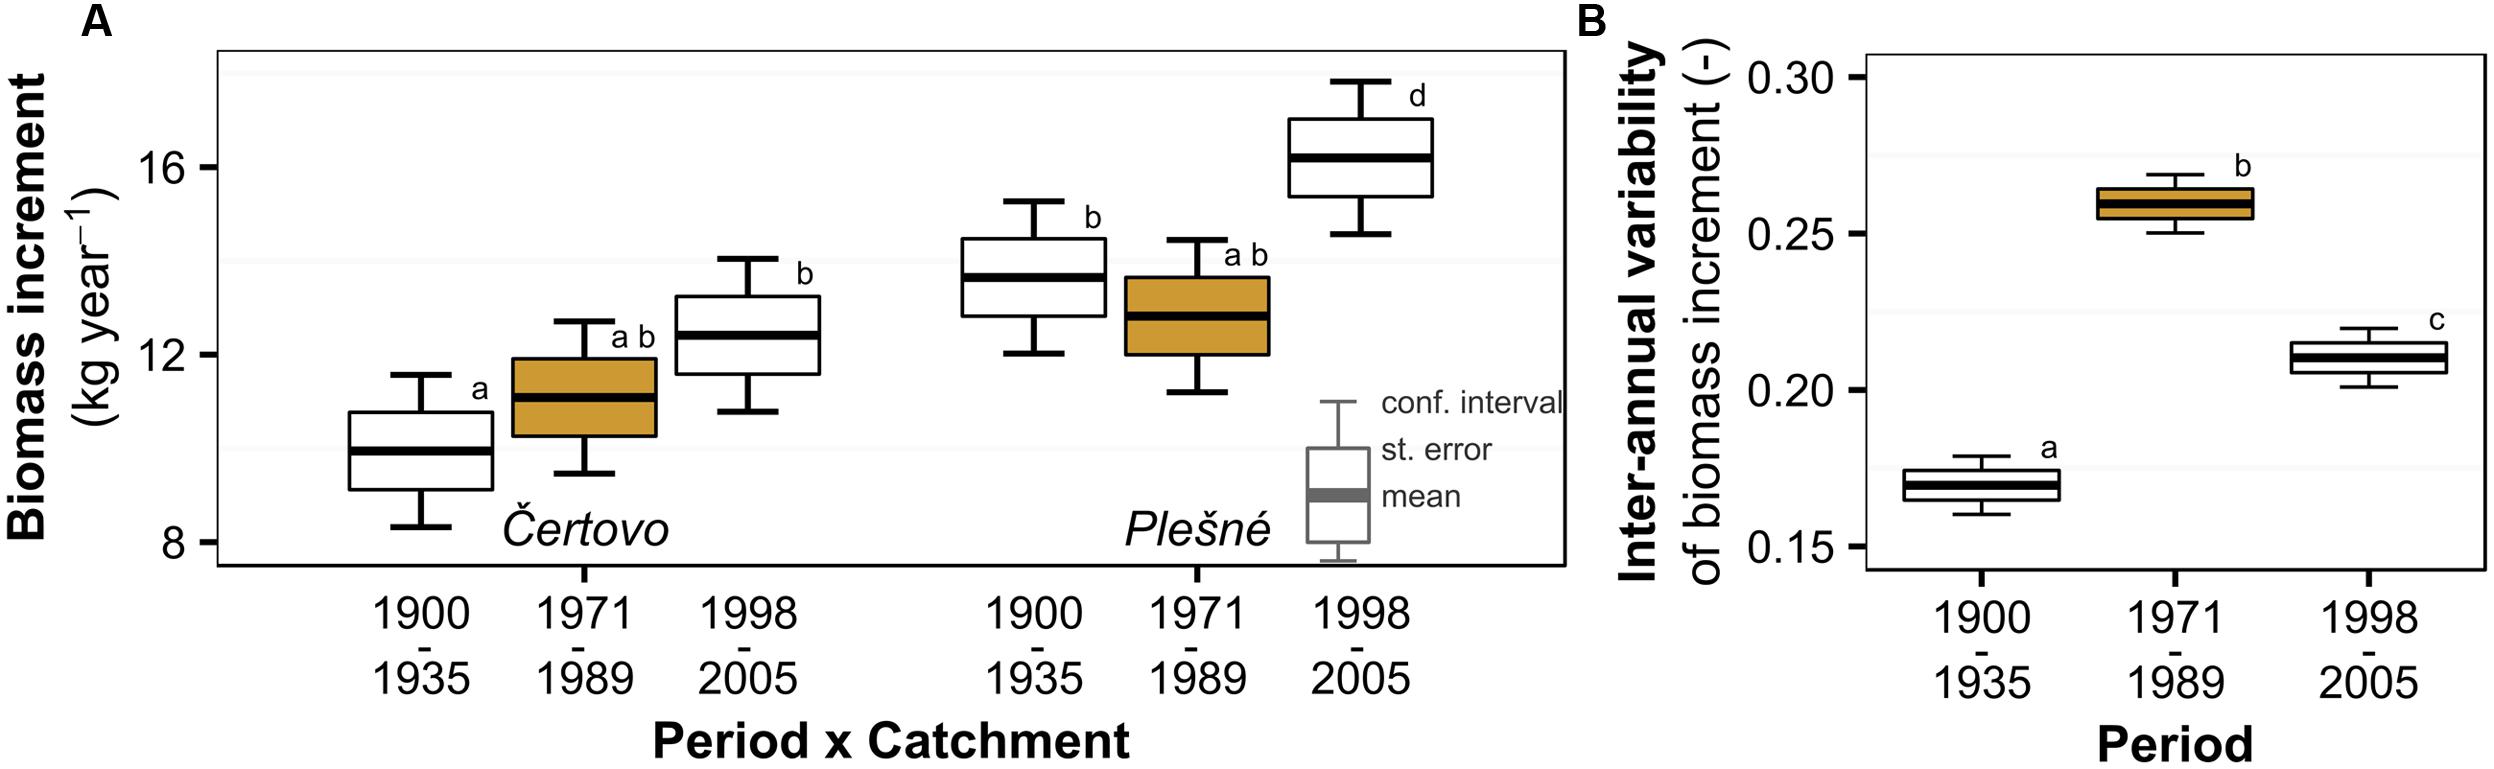
FIGURE 3. Temporal trend of Norway spruce (A) biomass increment and (B) its inter-annual variability divided into periods based on the trend of atmospheric pollution (the period with peaking pollution is orange highlighted) in the Bohemian Forest. Significant changes are represented by different lowercase letters.
At the individual tree level, biomass increment was significantly related to variables obtained from isotopic analysis. Figure 4 shows the relationship of individual tree biomass increment with Δ13C and indicates that the growth of trees which fixed more of the heavier isotope was more vigorous. The relationship was similar for periods before and after the peak in air pollution, but was non-significant for the air pollution period (as the model included interactions; Table 2). This result suggests that the increased fixation of 13C during air pollution was more prominent in trees, which grew slowly, and the influence of air pollution on Δ13C likely overrode other environmental effects (expressed in the biomass increment).
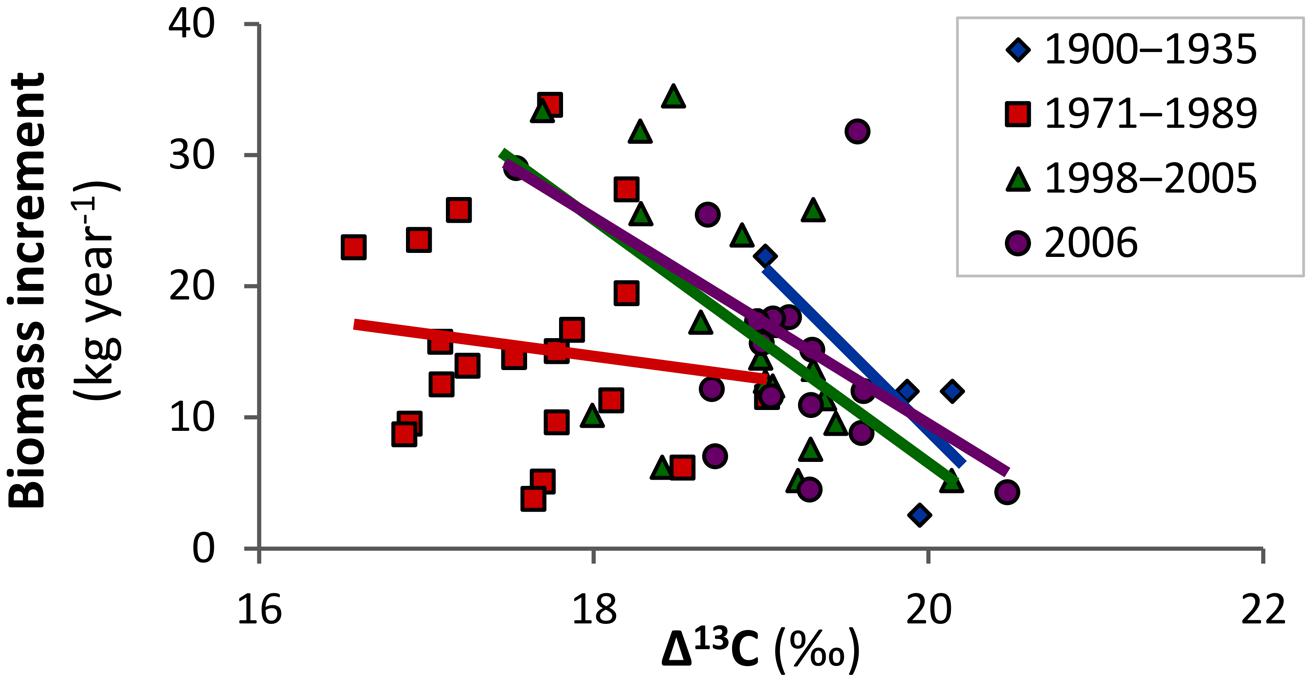
FIGURE 4. Biomass increment of mountain Norway spruce is significantly related to carbon isotope discrimination (Δ13C) prior to and after the period affected by air pollution, but the relationship was lost during the peak in air pollution (1971–1989) in the Bohemian Forest.
We found no clear trend consistent with air pollution when examining the increment-climate relationships (Figure 5 and Supplementary Figure S3). Correlations with variables potentially limiting photosynthesis (i.e., temperatures and cloud cover) were weaker at the beginning of the 20th century but remained stable in later periods. Correlations between biomass increment and variables potentially indicating water stress (i.e., precipitation and drought) increased in the last few years, indicating that severe drought has an effect on the increment. However, we observed no significant effect of air pollution. Catchment effect and catchment–period interactions were again significant and Plešné catchment trees showed generally better climate relationships. Older ages or lower competition pressure at Plešné catchment are the possible explanations for this pattern.
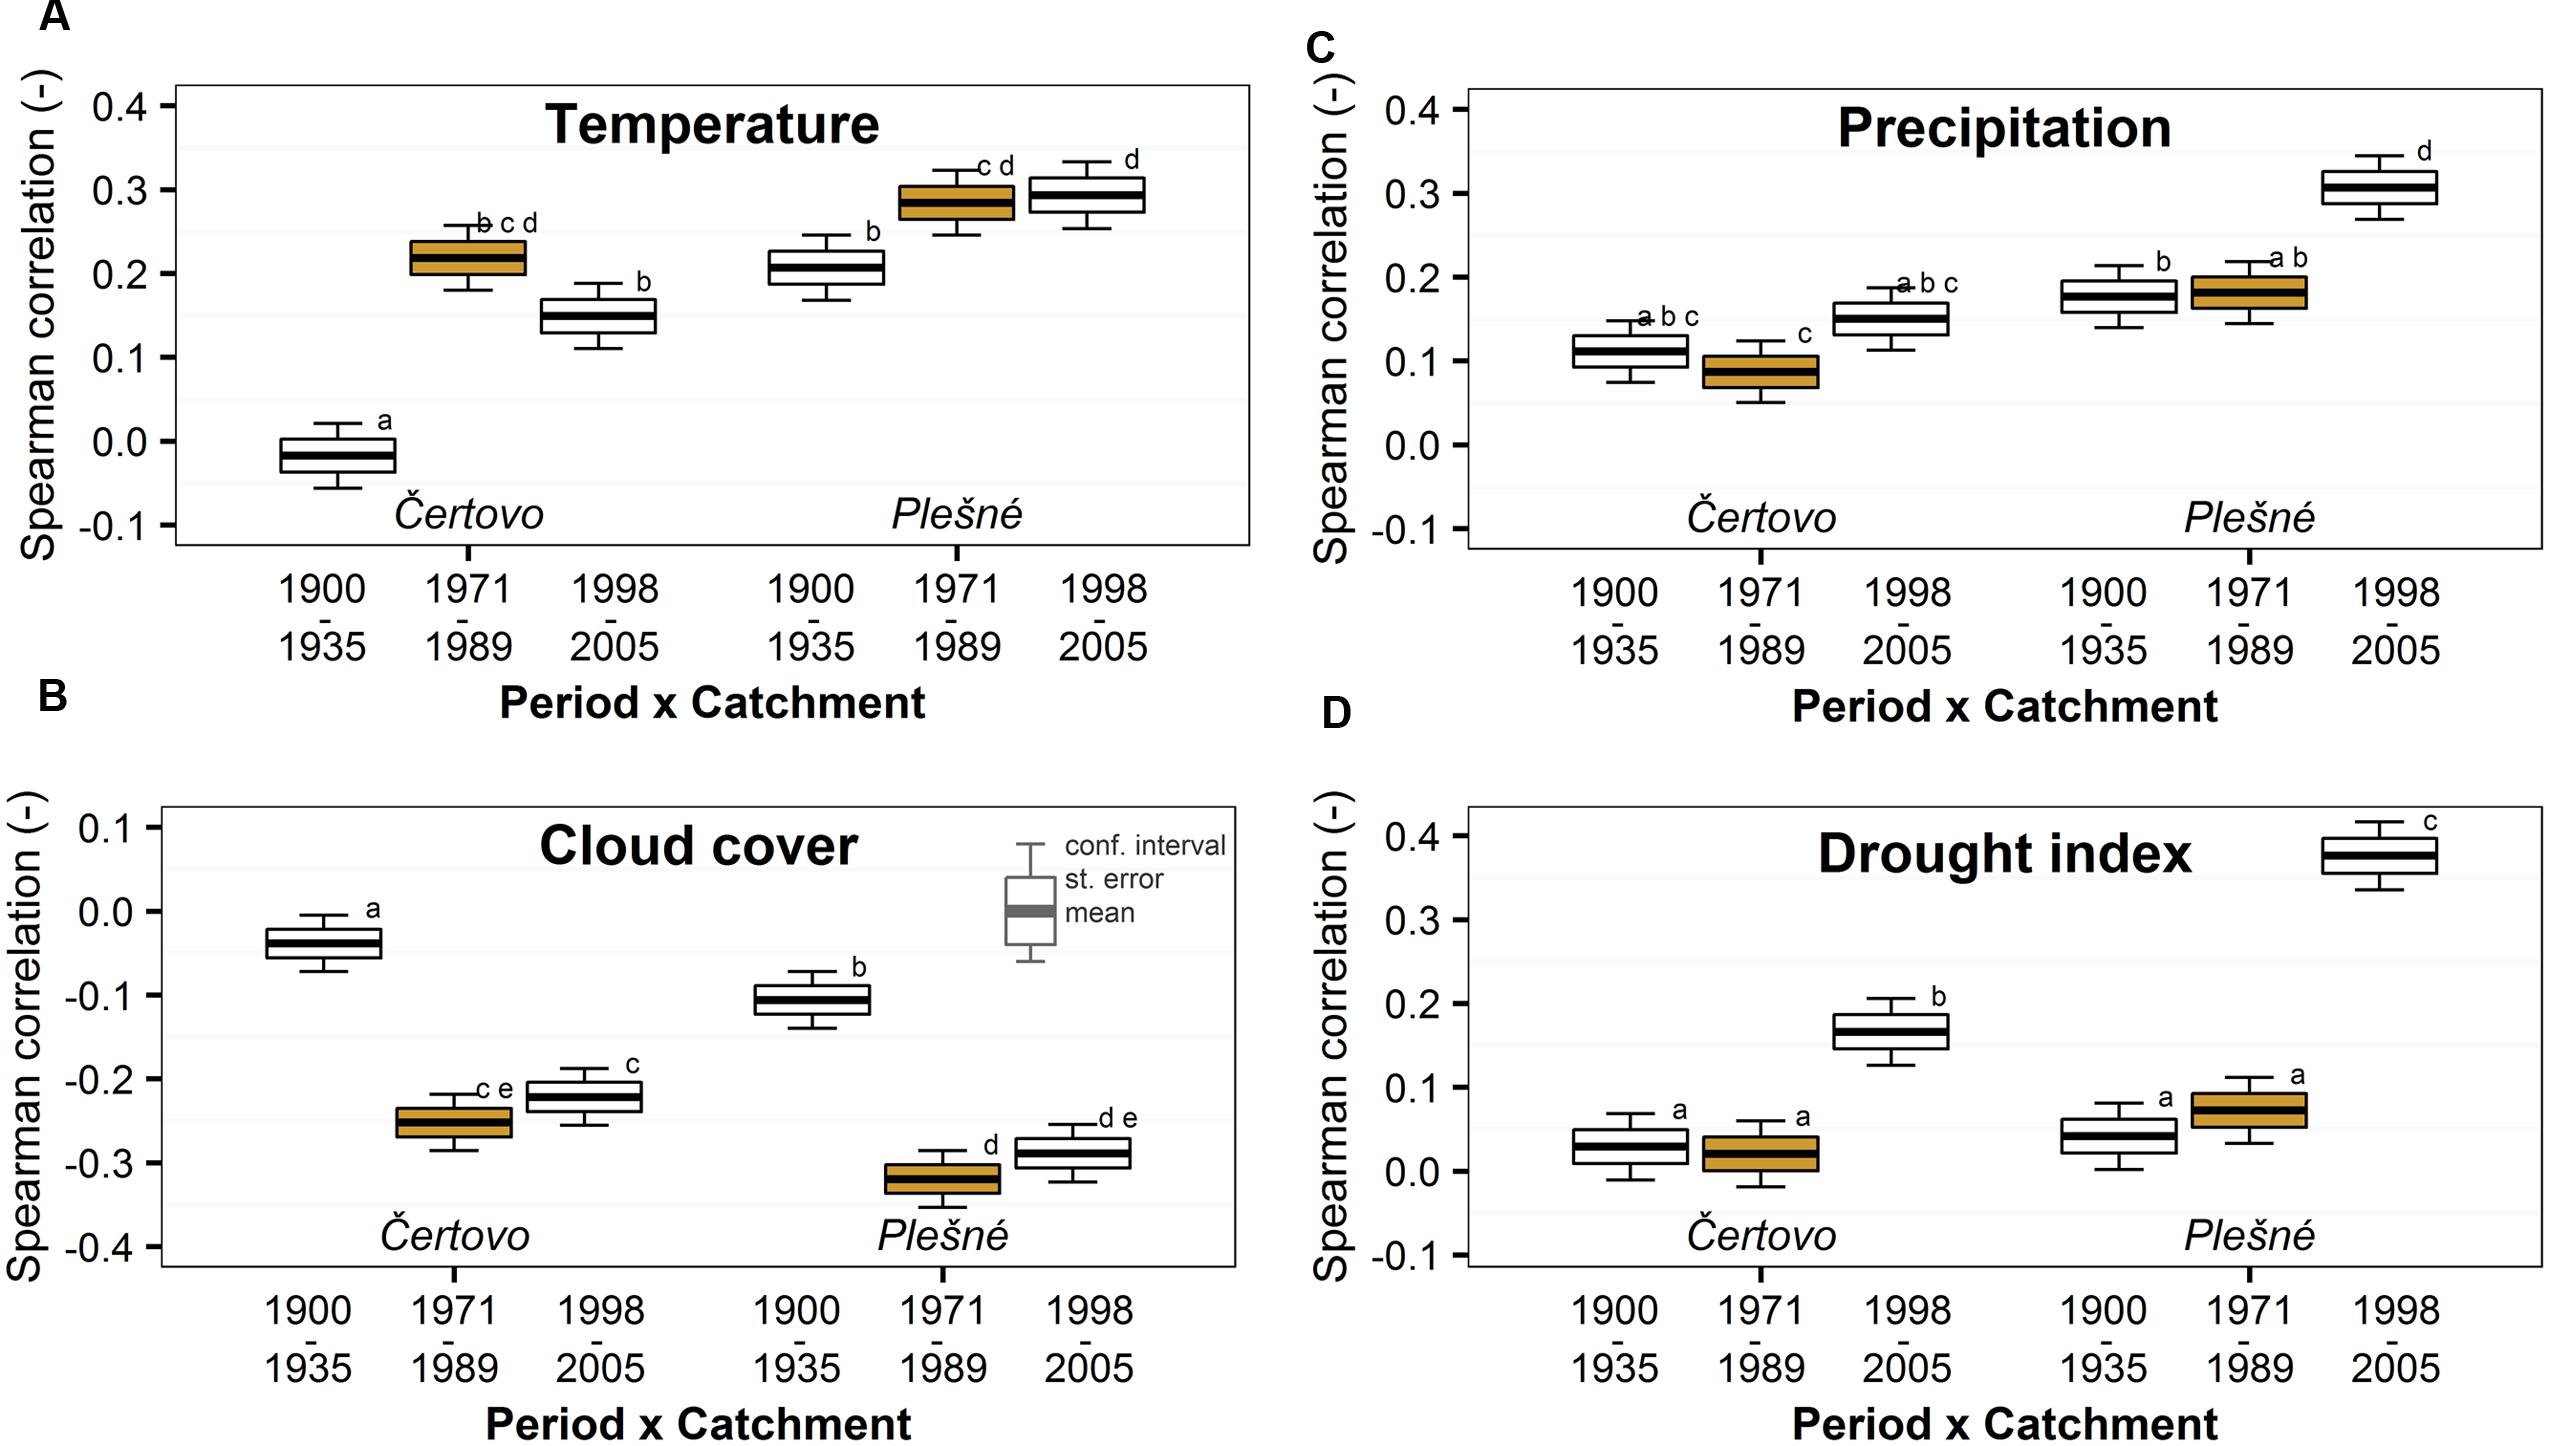
FIGURE 5. Temporal trend of Spearman correlations between biomass increment and growing season (A) temperatures (May–September), (B) cloud cover in the early growing season (May–July), (C) precipitation in the previous late growing season (previous July–September) and (D) drought (Palmer drought severity index) of the previous September. The trend was divided into periods based on the trend of atmospheric pollution (the period with peaking pollution is orange highlighted) in the Bohemian Forest. Significant changes are represented by different lowercase letters.
Discussion
We investigated the extent to which moderate air pollution affected the physiology of Norway spruce. We found that the physiology was significantly influenced, but different physiological parameters showed variable responses because of the interaction with increasing atmospheric CO2 concentrations and increasing temperatures due to climate change. As a result, the biomass increment did not change significantly during the peak in air pollution, yet increased slightly in the recent period. Biomass increment was inversely related to carbon isotope discrimination at the individual tree level, but the relationship was lost during the pollution period. As our results did not indicate increased water stress or decreased influence of climate on photosynthesis in response to the pollution (because tree biomass increment did not become more or less sensitive to drought/precipitation or temperature/cloud cover, respectively), we suggest that the direct influence of pollution on stomatal conductance was the main driver of the observed physiological changes (see below).
Carbon isotope discrimination is a sensitive indicator of the physiological response of plants to air pollution (particularly SO2 deposition; Savard, 2010). We found a decrease of 1.88‰ Δ13C in response to the deposition of, particularly, 124 mmol SO42- m-2 year-1 and 95 mmol NO3- m-2 year-1. This Δ13C decrease is in the middle of the range of values reported in other studies, where the decrease ranged from 1‰ to more than 3‰ in both conifers and deciduous species (Niemelä et al., 1997; Rinne et al., 2010; Savard, 2010; Thomas et al., 2013). The Δ13C decrease exceeds the typical range of natural variation (usually less than 0.5‰) and is proportional to the pollution load (Niemelä et al., 1997; Savard, 2010), which was at moderate level in our study area. Our results demonstrate that changes in Δ13C can be used as a sensitive indicator of acid pollution stress far earlier than tree mortality, reduction of growth or possibly even before reduction in the rate of photosynthesis occurs (Thomas et al., 2013). We also provide evidence that air pollution significantly affected tree physiology throughout central Europe and not only in the most polluted regions such as the “Black Triangle” as suggested by Kandler and Innes (1995).
The effects of air pollution on tree physiology interacted with other environmental changes such as the increase in atmospheric CO2 or temperature. Observed 20th century increases of iWUE in many ecosystems can be related not only to the increase in atmospheric CO2 (Peñuelas et al., 2011; Saurer et al., 2014), but also to increased atmospheric pollution. The iWUE significantly increased by 3.8 μmol CO2 mol-1 H2O in the polluted conditions with 339 ppm CO2 in comparison to the recent post-pollution conditions when the concentration of atmospheric CO2 reached 381 ppm. Increased atmospheric CO2 can compensate for the negative effects of air pollution because the Ci can remain similar (Thomas et al., 2013). Despite the major iWUE increase in the second half of the 20th century in our study location, the biomass increment did not increase correspondingly, suggesting that there is no causal relationship between the two variables and that an increase in iWUE does not necessarily mean increase in the carbon storage of the forest (Peñuelas et al., 2011).
Compensation of the negative effect of pollution by increased ambient CO2 concentrations which produced comparable Ci before and during the pollution period could partly explain why the biomass increment did not change significantly. Similarly to CO2, air temperature, which is a limiting factor for spruce biomass increment in our study area, increased during the 20th century and could have therefore also mitigated the negative effect of air pollution (Levanič et al., 2009; Treml et al., 2012; Primicia et al., 2015). It is also possible that the carbon partitioning pattern of the trees may have changed in favor of above-ground biomass during the pollution period resulting in unchanged biomass increment derived from stem diameter increments. The negative effects of high nitrogen load on trees (Högberg et al., 2006) and particularly on below-ground carbon allocation (root growth and mycorrhiza; Jentschke et al., 2001; Nilsson and Wallander, 2003) have been documented. Similarly, rather than affecting biomass increment in terms of volume, air pollution could affect wood density (Sander et al., 1995). Generally, the stem volume increment is probably affected when air pollution exceeds some threshold value, as occurred in the most polluted part of central Europe (Hauck et al., 2012; Rydval and Wilson, 2012).
However, the sensitivity of different tree species to pollution is likely variable. Silver fir (A. alba) was found to be highly sensitive with growth significantly affected even in the moderately polluted region of southern Germany near our study area (Elling et al., 2009). In addition to the effect on the growth increment, the fir carbon isotope ratio changed by about 3‰ in this area and the oxygen isotope ratio also showed a distinct effect of pollution on fir physiology (Boettger et al., 2014). The physiology of other coniferous (e.g., pine Pinus sylvestris) and deciduous (e.g., oak Quercus robur) species was also found to be influenced by pollution (Rinne et al., 2010). Pinus sylvestris was observed to react sensitively even to low pollution loads (Niemelä et al., 1997). However, direct comparisons of the response of different tree species to pollution, excluding the influence of site, climatic and environmental conditions and variability in pollutant deposition, are required, particularly because these factors significantly influence the specific reaction of each species to the pollution load. For instance, mountain areas with shallow and acidic soils are the most sensitive to acid pollution and conifers, which have a relatively large leaf area that remains exposed during the winter, are subjected to higher total amounts of pollutant – a factor unrelated to their physiological resistance (Kopáček and Hruška, 2010; Greaver et al., 2012).
The biomass increment increase in the recent period may not be related only to the direct effects discussed above, but also to the complex ecosystem release from the acidic conditions. These are related for example to increased decomposition of organic matter accumulated during the pollution period, its utilization (cessation of nitrate leaching) and improved nutrition as indicated by needle nitrogen concentrations (Oulehle et al., 2011). Changes in between tree competitions related to disturbance events could also play a role in determining changes in biomass increment and particularly in the higher recent growth increase at Plešné catchment, which was affected by bark beetle outbreak since 1990s (Svoboda et al., 2012; Janda et al., 2014). As our results indicate that extreme droughts periodically influenced the increment, an increase in the frequency of drought years due to climate change can also lead to the increasing importance of drought as a stress factor that negatively influences spruce biomass increment (Primicia et al., 2015).
Inter-annual variability of the biomass increment increased significantly during the pollution period. This may be related to the increased sensitivity of pollution affected trees to other stress factors such as frost, insects or drought (Kandler and Innes, 1995). Moderate pollution loads probably do not directly cause widespread tree damage as observed in most polluted regions, but increase tree vulnerability to other stressors, which can in combination cause forest decline (Kandler and Innes, 1995). Increased variability is thought to be an indicator of increased stress or an “early warning signal” for a critical state transition (Scheffer et al., 2009). At the same time we cannot discount the possibility that this result was related to a series of favorable and unfavorable growth years which may have occurred during the air pollution period.
Air pollution can influence trees via several pathways, i.e., directly through foliage or indirectly through the soil. Soil acidification decreases soil nutrient availability and often mobilizes aluminum, which is toxic to plants and can obstruct nutrient uptake (Jentschke et al., 2001; Hruška et al., 2012). Our biomass increment-climate correlation analysis does not support the hypothesis that possible root weakness caused water stress in our study site. Nutrient deficiency can lead to a reduction in photosynthesis rate. While decreased capacity of photosynthesis alone would lead to an increase in Δ13C (followed by increased Ci), we instead observed a decrease in Δ13C and therefore refute the notion that soil acidification would be the main driver of the observed physiological changes (Viet et al., 2013).
A direct effect of pollution on foliage can decrease the rate of photosynthesis and/or stomatal conductance (Meng et al., 1994). Our results, which show a reduction of Δ13C during the air pollution period, do not support the pollution influence via reduced photosynthesis alone, but are instead in line with decreased stomatal conductance (Farquhar et al., 1982; McCarroll and Loader, 2004). No consistent trend in the correlation between biomass increment and temperature or cloud cover, which would have also indicated photosynthesis limitation, supports the idea that stomatal conductance was the main driving force of the observed Δ13C decrease. Minor limitation of photosynthesis in response to either the direct or indirect pollution impact could be indicated by physiological patterns such as non-significantly decreased biomass increment and Ci or greatest iWUE during pollution period. Increased dark respiration was also proposed to be related to air polluted conditions and could have also played a role (Savard, 2010). We suppose that photosynthesis limitation and root weakening are of higher importance in locations with different site conditions or a higher pollution load as suggested by some studies showing decreased responses to temperature (Sander et al., 1995; Elling et al., 2009) or in more sensitive species (Boettger et al., 2014). Our interpretation is also supported by Kandler and Innes (1995) that reviewed in situ measurements of gas exchange done around the year 1990 and found no influence on photosynthesis rate in moderately polluted areas, but significant effect in most polluted areas. We therefore conclude that moderate pollution levels have the greatest effect directly on stomatal conductance (Thomas et al., 2013), which increases tree stress and sensitivity to other stressors.
The negative relationship between Δ13C and biomass increment was significant in the periods before and after the pollution, while it was lost during the pollution period. The positive or negative relationship between Δ13C and growth was used to indicate stomatal or non-stomatal (i.e., carboxylation rate) limitation of assimilation in trees (Viet et al., 2013). The relationship was positive in P. strobus limited by soil water availability and, presumably, stomatal conductance (McNulty and Swank, 1995), while it was negative in P. densiflora, where photosynthesis was limited by soil acidity. In our case, air temperature is the main climatic variable driving physiological processes of mountain Norway spruce growing in non-polluted conditions (Levanič et al., 2009; Treml et al., 2012; Primicia et al., 2015) and the negative relationship between Δ13C and biomass increment supports the statement about the dominant control of the rate of photosynthesis on Δ13C in non-polluted conditions. This implies that trees exposed to more sunlight grow better, utilize intercellular CO2 faster and their Δ13C is therefore lower in comparison to more slowly growing shaded trees. We therefore suggest that the loss of the negative relationship between biomass increment and Δ13C during the pollution period in our study area indicates a loss of photosynthetic rate as the dominant control of Δ13C in favor of stomatal conductance. This supports our conclusion that moderate pollution predominantly influenced studied physiological processes by reducing stomatal conductance.
Conclusion
Moderate levels of atmospheric pollution and particularly sulfate and reactive nitrogen acid deposition significantly affected the physiology of mountain Norway spruce in central Europe. We observed a complex response of spruce trees to pollution with Δ13C being the most sensitive indicator of the pollution effect. The atmospheric pollution effects interacted with those of increasing atmospheric CO2 and temperature resulting in unchanged intercellular CO2 concentrations abruptly increased water use efficiency and unchanged biomass increment, which could also partly result from changes in carbon partitioning. Our biomass increment-climate correlation analyses did not indicate any clear pollution-related changes in water stress or photosynthetic limitation due to climate. We therefore concluded that the direct effect of moderate pollution on stomatal conductance was likely the main driver of the observed physiological changes. We also assume that the shift from the dominant control of the photosynthetic rate to the stomatal conductance on Δ13C during the pollution period caused the loss of the negative relationship between biomass increment and Δ13C. This mechanism probably caused weakening of the spruce trees and increased sensitivity to other stressors, as indicated by increased inter-annual variability of biomass increment.
Author Contributions
HŠ, LK and MSv designed the research and data collection. JŠ and LK performed the laboratory analysis. VČ, HŠ, LK and MSe did the calculations and statistical analysis. VČ organized the manuscript preparation with the contribution of all the authors.
Funding
The study was funded by the Ministry of Education (project COST CZ no. LD13064) and the Czech Science Foundation (project GAČR no. P504/12/1218). JŠ was supported by the project GAČR no. 14-12262S of the Czech Science Foundation.
Conflict of Interest Statement
The authors declare that the research was conducted in the absence of any commercial or financial relationships that could be construed as a potential conflict of interest.
Acknowledgments
The study was performed under the framework of the COST Action FP1106 “STReESS - Studying Tree Responses to extreme Events: a SynthesiS.” We thank the staff of the National Park and Protected Landscape Area Šumava for their permission to conduct this research. We are grateful to M. Rydval for language editing. Suggestions of both reviewers greatly improved the manuscript.
Supplementary Material
The Supplementary Material for this article can be found online at: http://journal.frontiersin.org/article/10.3389/fpls.2016.00805
Footnotes
References
Bates, D., Mächler, M., Bolker, B., and Walker, S. (2015). Fitting linear mixed-effects models using lme4. J. Stat. Softw. 67:51. doi: 10.18637/jss.v067.i01
Boettger, T., Haupt, M., Friedrich, M., and Waterhouse, J. S. (2014). Reduced climate sensitivity of carbon, oxygen and hydrogen stable isotope ratios in tree-ring cellulose of silver fir (Abies alba Mill.) influenced by background SO2 in Franconia (Germany, Central Europe). Environ. Pollut. 185, 281–294. doi: 10.1016/j.envpol.2013.10.030
Bunn, A. G. (2008). A dendrochronology program library in R (dplR). Dendrochronologia 26, 115–124. doi: 10.1016/j.dendro.2008.01.002
Čada, V., Morrissey, R. C., Michalová, Z., Bače, R., Janda, P., and Svoboda, M. (2016). Frequent severe natural disturbances and non-equilibrium landscape dynamics shaped the mountain spruce forest in central Europe. For. Ecol. Manage. 363, 169–178. doi: 10.1016/j.foreco.2015.12.023
Cháb, J., Stráník, Z., and Eliáš, M. (2007). Geological Map of the Czech Republic 1:500 000. Prague: Czech Geological Survey.
Cook, E. R., and Peters, K. (1997). Calculating unbiased tree-ring indices for the study of climatic and environmental change. Holocene 7, 361–370. doi: 10.1177/095968369700700314
Elling, W., Dittmar, C., Pfaffelmoser, K., and Rötzer, T. (2009). Dendroecological assessment of the complex causes of decline and recovery of the growth of silver fir (Abies alba Mill.) in Southern Germany. For. Ecol. Manage. 257, 1175–1187. doi: 10.1016/j.foreco.2008.10.014
Emerson, J. D. (1983). “Mathematical aspects of transformation,” in Understanding Robust and Exploratory Data Analysis, eds D. C. Hoaglin, F. Mosteller, and J. W. Tukey (New York, NY: John Wiley & Sons).
Farquhar, G., O’Leary, M., and Berry, J. (1982). On the relationship between carbon isotope discrimination and the intercellular carbon dioxide concentration in leaves. Aust. J. Plant Physiol. 9, 121. doi: 10.1071/PP9820121
Gebauer, G., and Schulze, E. (1991). Carbon and nitrogen isotope ratios in different compartments of a healthy and a declining Picea abies forest in the Fichtelgebirge, NE Bavaria. Oecologia 87, 198–207. doi: 10.1007/BF00325257
Greaver, T. L., Sullivan, T. J., Herrick, J. D., Barber, M. C., Baron, J. S., Cosby, B. J., et al. (2012). Ecological effects of nitrogen and sulfur air pollution in the US: what do we know? Front. Ecol. Environ. 10:365. doi: 10.1890/110049
Harlow, B. A., Marshall, J. D., and Robinson, A. P. (2006). A multi-species comparison of δ13C from whole wood, extractive-free wood and holocellulose. Tree Physiol. 26, 767–774. doi: 10.1093/treephys/26.6.767
Harris, I., Jones, P. D., Osborn, T. J., and Lister, D. H. (2014). Updated high-resolution grids of monthly climatic observations - the CRU TS3.10 Dataset. Int. J. Climatol. 34, 623–642. doi: 10.1002/joc.3711
Hauck, M., Zimmermann, J., Jacob, M., Dulamsuren, C., Bade, C., Ahrends, B., et al. (2012). Rapid recovery of stem increment in Norway spruce at reduced SO2 levels in the Harz Mountains, Germany. Environ. Pollut. 164, 132–141. doi: 10.1016/j.envpol.2012.01.026
Hruška, J., Oulehle, F., Šamonil, P., Šebesta, J., Tahovská, K., Hleb, R., et al. (2012). Long-term forest soil acidification, nutrient leaching and vegetation development: linking modelling and surveys of a primeval spruce forest in the Ukrainian Transcarpathian Mts. Ecol. Modell. 244, 28–37. doi: 10.1016/j.ecolmodel.2012.06.025
Hůnová, I., Maznová, J., and Kurfürst, P. (2014). Trends in atmospheric deposition fluxes of sulphur and nitrogen in Czech forests. Environ. Pollut. 184, 668–675. doi: 10.1016/j.envpol.2013.05.013
Högberg, P., Fan, H., Quist, M., Binkley, D., and Tamm, C. O. (2006). Tree growth and soil acidification in response to 30 years of experimental nitrogen loading on boreal forest. Glob. Chang. Biol 12, 489–499. doi: 10.1111/j.1365-2486.2006.01102.x
Janda, P., Svoboda, M., Bače, R., Čada, V., and Peck, J. E. (2014). Three hundred years of spatio-temporal development in a primary mountain Norway spruce stand in the Bohemian Forest, central Europe. For. Ecol. Manage. 330, 304–311. doi: 10.1016/j.foreco.2014.06.041
Jentschke, G., Drexhage, M., Fritz, H. W., Fritz, E., Schella, B., Lee, D. H., et al. (2001). Does soil acidity reduce subsoil rooting in Norway spruce (Picea abies)? Plant Soil 237, 91–108. doi: 10.1023/A:1013305712465
Kaňa, J., Tahovská, K., Kopáček, J., and Šantrůčková, H. (2015). Excess of organic carbon in mountain spruce forest soils after bark beetle outbreak altered microbial N transformations and mitigated N-saturation. PLoS ONE 10:e0134165. doi: 10.1371/journal.pone.0134165
Kandler, O., and Innes, J. L. (1995). Air pollution and forest decline in Central Europe. Environ. Pollut. 90, 171–180. doi: 10.1016/0269-7491(95)00006-D
Klimont, Z., Smith, S. J., and Cofala, J. (2013). The last decade of global anthropogenic sulfur dioxide: 2000–2011 emissions. Environ. Res. Lett. 8:014003. doi: 10.1088/1748-9326/8/1/014003
Knibbe, B. (2007). Past4: Personal Analysis System for Treering Research, Version 4.2. Vienna: SCIEM.
Kopáček, J., and Hruška, J. (2010). Reconstruction of acidic deposition in the catchments of Plešné and Čertovo lakes (the Bohemian Forest). Silva Gabreta 16, 149–163.
Kopáček, J., and Vrba, J. (2006). Integrated ecological research of catchment-lake ecosystems in the Bohemian Forest (Central Europe): a preface. Biologia (Bratisl.) 61, S363–S370.
Lefcheck, J. S. (2015). PiecewiseSEM: pecewise structural equation modeling in R for ecology, evolution, and systematics. Methods Ecol. Evol. doi: 10.1111/2041-210X.12512
Lenth, R. (2015). lsmeans: Least-Squares Means. R Package Version 2.21-1. Available at: http://cran.r-project.org/package=lsmeans.
Levanič, T., Gričar, J., Gagen, M., Jalkanen, R., Loader, N. J., McCarroll, D., et al. (2009). The climate sensitivity of Norway spruce [Picea abies (L.) Karst.] in the southeastern European Alps. Trees 23, 169–180. doi: 10.1007/s00468-008-0265-0
McCarroll, D., and Loader, N. (2004). Stable isotopes in tree rings. Quat. Sci. Rev. 23, 771–801. doi: 10.1016/j.quascirev.2003.06.017
McNulty, S. G., and Swank, W. T. (1995). Wood δ13C as a measure of annual basal area growth and soil water stress in a Pinus strobus forest. Ecology 76, 1581–1586. doi: 10.2307/1938159
Meng, F. R., Cox, R. M., and Arp, P. A. (1994). Fumigating mature spruce branches with SO2 effects on net photosynthesis and stomatal conductance. Can. J. For. Res. Can. Rech. For. 24, 1464–1471. doi: 10.1139/x94-189
Nakagawa, S., and Schielzeth, H. (2013). A general and simple method for obtaining R2 from generalized linear mixed-effects models. Methods Ecol. Evol. 4, 133–142. doi: 10.1111/j.2041-210x.2012.00261.x
Niemelä, P., Lumme, I., Mattson, W., and Arkhipov, V. (1997). 13C in tree rings along an air pollution gradient in the Karelian Isthmus, northwest Russia and southeast Finland. Can. J. For. Res. 27, 609–612. doi: 10.1139/x97-005
Nilsson, L. O., and Wallander, H. (2003). Production of external mycelium by ectomycorrhizal fungi in a norway spruce forest was reduced in response to nitrogen fertilization. New Phytol. 158, 409–416. doi: 10.1046/j.1469-8137.2003.00728.x
Oulehle, F., Evans, C. D., Hofmeister, J., Krejci, R., Tahovska, K., Persson, T., et al. (2011). Major changes in forest carbon and nitrogen cycling caused by declining sulphur deposition. Glob. Chang. Biol. 17, 3115–3129. doi: 10.1111/j.1365-2486.2011.02468.x
Peñuelas, J., Canadell, J. G., and Ogaya, R. (2011). Increased water-use efficiency during the 20th century did not translate into enhanced tree growth. Glob. Ecol. Biogeogr. 20, 597–608. doi: 10.1111/j.1466-8238.2010.00608.x
Pregitzer, K. S., and Euskirchen, E. S. (2004). Carbon cycling and storage in world forests: Biome patterns related to forest age. Glob. Chang. Biol. 10, 2052–2077. doi: 10.1111/j.1365-2486.2004.00866.x
Primicia, I., Camarero, J. J., Janda, P., Čada, V., Morrissey, R. C., Trotsiuk, V., et al. (2015). Age, competition, disturbance and elevation effects on tree and stand growth response of primary Picea abies forest to climate. For. Ecol. Manage. 354, 77–86. doi: 10.1016/j.foreco.2015.06.034
R Development Core Team (2014). R: A Language and Environment for Statistical Computing. Vienna: R Foundation for Statistical Computing. doi: 10.1007/978-3-540-74686–74687
Rinne, K. T., Loader, N. J., Switsur, V. R., Treydte, K. S., and Waterhouse, J. S. (2010). Investigating the influence of sulphur dioxide (SO2) on the stable isotope ratios (δ13C and δ18O) of tree rings. Geochim. Cosmochim. Acta 74, 2327–2339. doi: 10.1016/j.gca.2010.01.021
Rydval, M., and Wilson, R. (2012). The Impact of Industrial SO2 Pollution on North Bohemia Conifers. Water Air Soil Pollut. 223, 5727–5744. doi: 10.1007/s11270-012-1310-6
Sander, C., Eckstein, D., Kyncl, J., and Dobrý, J. (1995). The growth of spruce (Picea abies (L) Karst) in the Krkonoše-(Giant) Mountains as indicated by ring width and wood density. Ann. Des Sci. For. 52, 401–410. doi: 10.1051/forest:19950501
Šantrůčková, H., Šantrůček, J., Šetlík, J., Svoboda, M., and Kopáček, J. (2007). Carbon isotopes in tree rings of Norway spruce exposed to atmospheric pollution. Environ. Sci. Technol. 41, 5778–5782. doi: 10.1021/es07001
Saurer, M., Spahni, R., Frank, D. C., Joos, F., Leuenberger, M., Loader, N. J., et al. (2014). Spatial variability and temporal trends in water-use efficiency of European forests. Glob. Chang. Biol. 20, 3700–3712. doi: 10.1111/gcb.12717
Savard, M. M. (2010). Tree-ring stable isotopes and historical perspectives on pollution - an overview. Environ. Pollut. 158, 2007–2013. doi: 10.1016/j.envpol.2009.11.031
Scheffer, M., Bascompte, J., Brock, W. A., Brovkin, V., Carpenter, S. R., Dakos, V., et al. (2009). Early-warning signals for critical transitions. Nature 461, 53–59. doi: 10.1038/nature08227
Seedre, M., Kopáček, J., Janda, P., Bače, R., and Svoboda, M. (2015). Carbon pools in a montane old-growth Norway spruce ecosystem in Bohemian Forest: effects of stand age and elevation. For. Ecol. Manage. 346, 106–113. doi: 10.1016/j.foreco.2015.02.034
Svoboda, M., Janda, P., Nagel, T. A., Fraver, S., Rejzek, J., and Bače, R. (2012). Disturbance history of an old-growth sub-alpine Picea abies stand in the Bohemian Forest, Czech Republic. J. Veg. Sci. 23, 86–97. doi: 10.1111/j.1654-1103.2011.01329.x
Svoboda, M., Matějka, K., and Kopáček, J. (2006). Biomass and element pools of understory vegetation in the catchments of Čertovo Lake and Plešné Lake in the Bohemian Forest. Biologia (Bratisl) 61, S509–S521. doi: 10.2478/s11756-007-0074-8
Svoboda, M., and Pouska, V. (2008). Structure of a Central-European mountain spruce old-growth forest with respect to historical development. For. Ecol. Manage. 255, 2177–2188. doi: 10.1016/j.foreco.2007.12.031
Thomas, R. B., Spal, S. E., Smith, K. R., and Nippert, J. B. (2013). Evidence of recovery of Juniperus virginiana trees from sulfur pollution after the Clean Air Act. Proc. Natl. Acad. Sci. U.S.A. 110, 15319–15324. doi: 10.1073/pnas.1308115110
Treml, V., Ponocná, T., and Büntgen, U. (2012). Growth trends and temperature responses of treeline Norway spruce in the Czech-Polish Sudetes Mountains. Clim. Res. 55, 91–103. doi: 10.3354/cr01122
Turek, J., Fluksová, H., Hejzlar, J., Kopáček, J., and Porcal, P. (2014). Modelling air temperature in catchments of Čertovo and Plešné lakes in the Bohemian Forest back to 1781. Silva Gabreta 20, 1–24.
Viet, H. D., Kwak, J. H., Lee, K. S., Lim, S. S., Matsushima, M., Chang, S. X., et al. (2013). Foliar chemistry and tree ring δ13C of Pinus densiflora in relation to tree growth along a soil pH gradient. Plant Soil 363, 101–112. doi: 10.1007/s11104-012-1301-9
Vrba, J., Kopáček, J., Fott, J., and Nedbalova, L. (2014). Forest die-back modified plankton recovery from acidic stress. Ambio 43, 207–217. doi: 10.1007/s13280-013-0415-5
Wilson, R. J. S., Luckman, B. H., and Esper, J. (2005). A 500 year dendroclimatic reconstruction of spring-summer precipitation from the lower Bavarian Forest region, Germany. Int. J. Climatol. 25, 611–630. doi: 10.1002/joc.1150
Keywords: climate change, carbon dynamics, growth trends, soil acidification, spruce decline, tree-ring analysis, tree stress
Citation: Čada V, Šantrůčková H, Šantrůček J, Kubištová L, Seedre M and Svoboda M (2016) Complex Physiological Response of Norway Spruce to Atmospheric Pollution – Decreased Carbon Isotope Discrimination and Unchanged Tree Biomass Increment. Front. Plant Sci. 7:805. doi: 10.3389/fpls.2016.00805
Received: 02 February 2016; Accepted: 23 May 2016;
Published: 09 June 2016.
Edited by:
Achim Braeuning, Friedrich-Alexander University Erlangen-Nürnberg, GermanyReviewed by:
Marco Carrer, Università degli Studi di Padova, ItalyRaquel Esteban, Consejo Superior de Investigaciones Científicas, Spain
Copyright © 2016 Čada, Šantrůčková, Šantrůček, Kubištová, Seedre and Svoboda. This is an open-access article distributed under the terms of the Creative Commons Attribution License (CC BY). The use, distribution or reproduction in other forums is permitted, provided the original author(s) or licensor are credited and that the original publication in this journal is cited, in accordance with accepted academic practice. No use, distribution or reproduction is permitted which does not comply with these terms.
*Correspondence: Vojtěch Čada, Y2FkYUBmbGQuY3p1LmN6