 Miguel Nemesio-Gorriz1*
 Peter B. Blair2
 Kerstin Dalman3†
 Almuth Hammerbacher4Jenny Arnerup1
 Jan Stenlid1
 Shahid M. Mukhtar2
 Malin Elfstrand1
- 1Department of Forest Mycology and Plant Pathology, Swedish University of Agricultural Sciences, Uppsala, Sweden
- 2Department of Biology, University of Alabama at Birmingham, Birmingham, AL, USA
- 3Department of Chemistry and Biotechnology, Swedish University of Agricultural Sciences, Uppsala, Sweden
- 4Department of Microbiology, Forestry and Agricultural Biotechnology Institute, University of Pretoria, Pretoria, South Africa
Transcription factors (TFs) forming MYB-bHLH-WDR complexes are known to regulate the biosynthesis of specialized metabolites in angiosperms through an intricate network. These specialized metabolites participate in a wide range of biological processes including plant growth, development, reproduction as well as in plant immunity. Studying the regulation of their biosynthesis is thus essential. While MYB (TFs) have been previously shown to control specialized metabolism (SM) in gymnosperms, the identity of their partners, in particular bHLH or WDR members, has not yet been revealed. To gain knowledge about MYB-bHLH-WDR transcription factor complexes in gymnosperms and their regulation of SW, we identified two bHLH homologs of AtTT8, six homologs of the MYB transcription factor AtTT2 and one WDR ortholog of AtTTG1 in Norway spruce. We investigated the expression levels of these genes in diverse tissues and upon treatments with various stimuli including methyl-salicylate, methyl-jasmonate, wounding or fungal inoculation. In addition, we also identified protein-protein interactions among different homologs of MYB, bHLH and WDR. Finally, we generated transgenic spruce cell lines overexpressing four of the Norway spruce AtTT2 homologs and observed differential regulation of genes in the flavonoid pathway and flavonoid contents.
Introduction
As trait complexity grows larger in organisms, gene families encoding regulatory proteins, such as transcription factors (TFs) are generally expanded and this expansion contributes to the evolutionary diversification of traits, e.g., developmental fate or specialized metabolism (SM) (Lang et al., 2010). The concerted action of multiple classes of TFs in regulatory protein complexes may allow for further trait diversification (Singh, 1998). A well-known example of a specific regulatory protein complex driving the diversification of multiple traits in plants is the R2R3-MYB/basic helix-loop-helix (bHLH)/WD-Repeat (MBW) complex (Pesch et al., 2015; Xu et al., 2015). The MBW members cooperatively participate to form a transcriptional activating complex in which the bHLH member plays a central role and interacts with both, the MYB transcription factor and the WD40 protein. Collectively, these three members are required for the regulation of specialized metabolic pathways and of specific developmental programs in higher plants (Baudry et al., 2004; Feller et al., 2011; Tominaga-Wada and Wada, 2014; Xu et al., 2015). The MBW complex is essentially modular in its organization in diverse plant systems (Xu et al., 2015) and is well studied in the model plant Arabidopsis thaliana. For instance, Arabidopsis WD40 protein is represented by the single-copy gene Transparent Testa Glabra 1 (TTG1) that controls all traits associated with MBW complexes (Tominaga-Wada et al., 2011). Three bHLH proteins, TT8, EGL3 and GL3, act in a partially redundant manner in the Arabidopsis' MBW complex (Nesi et al., 2001; Heim et al., 2003; Toledo-Ortiz et al., 2003; Baudry et al., 2004; Pires and Dolan, 2010). Finally, the MYB TFs regulate the expression of specific genes involved in the biosynthesis of specialized metabolites (SM) (Dias et al., 2003; Baudry et al., 2004; Gonzalez, 2009). Angiosperms and gymnosperms diverged around 300 million years ago (Savard et al., 1994; Lu et al., 2014). The most widespread among the extant gymnosperms are the conifers, which dominate large forest areas, especially in boreal and montane forests in the Northern Hemisphere. Despite their evolutionary history and their ecological importance, our knowledge of the MBW complex in conifers is episodic and focused on R2R3-MYB TFs, which have been relatively well studied regarding their regulatory roles in the biosynthesis of different classes of SMs. Xue et al. (2003) identified 10 black spruce (Picea mariana) R2R3-MYBs. PmMBF1, a member of R2R3-MYBs family, is capable of inducing pigment accumulation during transient overexpression in maize cell lines and caused transactivation of the anthocyanidin-related Bz2 promoter in spruce and larch cell lines. 18 R2R3-MYBs have been discovered in white spruce (Picea glauca) and loblolly pine (Pinus taeda) (Bedon et al., 2007). Tissue specific expression patterns suggest potential roles of particular members of R2R3-MYBs in lignin biosynthesis. Indeed, the roles of at least two of the pine R2R3-MYB TFs in lignification was later confirmed as white spruce lines overexpressing these two pine R2R3-MYB TFs showed increased lignin accumulation in cell walls and induction of genes in the shikimate and monolignol biosynthetic pathways (Bomal et al., 2008). In addition, white spruce lines overexpressing the white spruce TF PgMYB14 showed increased terpene and flavonoid accumulation (Bedon et al., 2010). Similar to Arabidopsis, there appears to be a high degree of complexity associated with the R2R3-MYB component of the MBW complex in conifers, resulting in specific transcriptional responses. It has been recently shown that a similar set of genes exhibit opposing transcriptional outputs in the transgenic lines overexpressing diverse members of the R2R3-MYB TF family (Bomal et al., 2008, 2014), suggesting distinct actions of closely related R2R3-MYB TFs in conifers. In two independent studies, Bedon et al. (2010) and Xue et al. (2003) identified bHLH-binding motifs in the upstream regulatory regions of R2R3-MYB TFs, suggesting bHLH-MYB regulatory interactions that carry out a downstream gene activation cascade. However, there are very few reports on potential coniferous bHLH or WD40 members of the MBW complex. In addition, there are no reports involving conifer WD40 genes, while a stress-induced bHLH gene in Norway spruce (Picea abies) encoding a predicted protein with similarity to Arabidopsis TT8 was superficially reported by Lundén et al. (2015).
Given the previous reports of spruce transcripts with similarity to Arabidopsis TT8 and TT2 genes where two different genes have been identified as potential spruce AtTT2 homologs (Xue et al., 2003; Arnerup et al., 2011; Lundén et al., 2015), the aim of this study was to survey and identify potential members of the MBW complex in Norway spruce (Picea abies). We hypothesized that the Norway spruce genome includes a complete MBW complex repertoire, including WD40 proteins homologous to TTG1. We also hypothesized that Norway spruce would harbor several potential AtTT2 homologs in the R2R3-MYBs of subgroup S5 as seen in other species (Stracke et al., 2001; Yoshida et al., 2008; Schaart et al., 2013; Soler et al., 2015). Consistent with our hypotheses, one AtTTG1 homolog, two AtTT8 homologs and six putative AtTT2 homologs were identified in the Norway spruce genome, including the previously described TT2 (Arnerup et al., 2011). As we could identify two TT8 and six TT2 paralogs, we hypothesized that these sets of paralogs would display differentiation in protein function and/or expression patterns consistent with the theory of sub-functionalization (Innan and Kondrashov, 2010). Therefore, we quantified the expression patterns of the paralogs in different tissues and in response to various hormone analogs simulating abiotic and biotic stress and assessed their biophysical interaction with each other and the Norway spruce AtTTG1 homolog in a Yeast-two-Hybrid (Y2H) assay. In angiosperms, members of the MBW complex are known to regulate late biosynthetic genes in the flavonoid biosynthetic pathway when overexpressed in combination or as individual genes (Baudry et al., 2004; Mellway et al., 2009; Matus et al., 2010; Schaart et al., 2013). Thus, in order to elucidate if the previously identified spruce AtTT2 homologs (Xue et al., 2003; Arnerup et al., 2011) control secondary metabolism, we created transgenic Norway spruce cell lines overexpressing these two R2R3-MYB TFs and two of the newly identified R2R3-MYB TFs that showed transcriptional activity. We measured the expression levels of genes in the flavonoid biosynthetic pathway as well as the flavonoid, neolignan and stilbene contents of the transgenic lines.
Materials and Methods
Plant Material
Four-year-old Norway spruce (Picea abies [L.] Karst.) genotypes from the Forestry Research Institute of Sweden were used for tissue dissection and RNA extraction. The plants were placed at 25°C and 16 h photoperiod in a growth chamber for 3 weeks before sampling. Tissues were obtained from roots and twigs from the plants. The phloem and bark were separated with a knife from the sapwood in both, twigs and roots, and shoots were isolated from the tip of the twigs. In total, five samples were taken per plant. Each of the four genotypes was used as one independent biological replicate. All tissues were frozen separately in liquid nitrogen and stored at −80°C until further use.
The wild type Norway spruce embryogenic cell line 95:61:21 (Högberg et al., 1998) was used for measuring expression levels of candidate genes under abiotic stress conditions, for Agrobacterium-mediated cell transformation and for chemical analysis.
The plant material in Supplemental Material 8 is described in Arnerup et al. (2013).
In vitro Treatments
Norway spruce cells (line 95:61:21), grown on half-strenght LP agar (von Arnold and Eriksson, 1981) without plant growth regulators, were treated with several types of abiotic stress for 48 h at 21°C. The abscisic acid treatment was based on the addition of 8 μg/ml of abscisic acid to the medium. To study the effect of jasmonic acid and salicylic acid in gene expression (Arnerup et al., 2013), unsealed plates with cells were placed in a sealed jar and a cotton ball with 25 μL of either, 10% methyl salicylate or 10% methyl jasmonate, was placed inside of the jars next to the plates in the beginning of the treatment and after 24 h. At harvest, cells were collected, frozen in liquid nitrogen and stored at −80°C until further use.
Norway Spruce Transformation and Line Selection
Transformation of the WT cell line 95:61:21 was carried out according to Minina et al. (2013). Transgenic calli were picked from the plates after 3 weeks. Transgenic lines were selected and verified by PCR and the expression levels of the transgenes were assessed by qPCR.
For quantification of target genes, three Norway spruce transformant lines per construct overexpressing their transgene between 10 and 20 times more than the control lines were selected (Supplemental Material 1). Expression of the Norway spruce early biosynthetic genes PAL1 (Koutaniemi et al., 2007) and CHS (Richard et al., 2000), and the late biosynthetic genes LAR1, LAR2, LAR3, LAR4, ANR2, ANR3, and ANR5 (Arnerup, 2011; Hammerbacher et al., 2014) of the flavonoid biosynthetic pathway were tested in these lines.
RNA Extraction and cDNA Synthesis
For lignified tissues, total RNA extraction was done essentially according to the protocol by Chang et al. (1993) with modifications described in Arnerup et al. (2011). RNA extraction of in vitro material was performed using the RNeasy Plant Mini Kit (Qiagen) following the manufacturer's instructions. Purified RNA samples were treated with DNase1 (Sigma Aldrich) according to the manufacturer's instructions and RNA concentration was determined with the NanoDrop (Spectrophotometer ND 1000, Saveen Werner). Five hundred ng of total RNA were reverse transcribed to cDNA with the iScript™ cDNA Synthesis Kit (Bio-Rad) in a total reaction volume of 20 μl according to the manufacturer's instructions.
Candidate Identification and Primer Design
To identify candidates, amino acid sequences of TT2, TT8, and TTG1 were used to query the Norway spruce genome version 1.0 (www.congenie.org) and GenBank (http://www.ncbi.nlm.nih.gov/genbank/) using Blastp.
For cloning the different candidates, Primer3 (http://biotools.umassmed.edu/bioapps/primer3_www.cgi) was used to predict and design PCR primers (20 nucleotide length and Tm 60°C) covering the whole predicted ORF of the transcripts (gene models can be found in Supplemental Material 7). Primer quality and properties were checked at www.bioinformatics.org/sms2/pcr_primer_stats and AttB borders were added to the sequences before primers were synthesized at TAG Copenhagen (Supplemental Material 1).
For quantitative RT-PCR, Primer3 was used to design primers amplifying sequences of 120–150 bp within the predicted ORF of the transcript sequences and primer quality and properties were also checked at www.bioinformatics.org/sms2/pcr_primer_stats before primers were synthesized at TAG Copenhagen (Supplemental Material 2).
Candidate Isolation and Vector Construction
For the isolation of candidate genes, primer pairs with AttB borders specific for each of the candidates were used (Supplemental Material 2). A 50 μl PCR-mixes consisting of 1x Dream-Taq green buffer (Thermo Fischer Scientific), 0.2 μM of each of the primers, 0.2 mM dNTPs (Qiagen), 1.25 U Dream-Taq Polymerase (Thermo Fischer Scientific), a final concentration of MgCl2 of 3.25 mM, and 0.5–5 ng/μl reaction volume of Norway spruce cDNA, was prepared. The PCR conditions were as follows: initial denaturation at 95°C for 5 min, followed by 35 cycles of: 30 s at 95°C, 30 s at 57°C, and 2 min at 72°C and a final elongation step of 7 min at 72°C.
The PCR products were cloned into the Gateway pDONR/Zeo (Thermo Fisher Scientific) entry vector according to manufacturer's instructions. Entry vectors were purified using the PlasmidMini Kit® (Qiagen) and 500 ng were sent to Macrogen (Amsterdam, The Netherlands) for Sanger sequencing and the sequences were used to enable phylogenetic analyses.
To prepare the vectors for transformation of Norway spruce the isolated genes were transferred to the pMDC32 (Curtis and Grossniklaus, 2003) vector by LR recombination. The resulting vectors was verified by test-digestion and sequencing.
To prepare the destination vectors for the yeast two-hybrid experiment, LR recombination reactions (Thermo Fisher Scientific) were used to transfer our isolated genes into pDest-AD-CYH2 and pDest-DB destination vectors (Mukhtar et al., 2011) according to the manufacturer's instructions. Vectors were purified using the PlasmidPrep minikit® (Qiagen) and an aliquot of each vector was sent for Sanger sequencing to Macrogen (Amsterdam, The Netherlands).
Phylogenetic Analyses
Predicted amino acid sequences were obtained by exporting DNA sequences of the isolated genes to ORF finder (www.ncbi.nlm.nih.gov/projects/gorf/). Sequences were translated and amino acid sequences were imported into MEGA6 (Tamura et al., 2013) and aligned by ClustalW algorithm with default settings (Gap opening penalty 15, gap extension penalty 6.66, IUB DNA weight matrix and transition weight 0.5).
Due to the presence of a single member representing TTG1 in Norway spruce and Arabidopsis, the construction of a phylogenetic tree was not possible and we used the LALIGN analysis (http://www.ch.embnet.org/software/LALIGN_form.html) to calculate the identity and similarity between the protein sequences of our Norway spruce candidate, PaWD40-1, and AtTTG1.
EMBL/GenBank accession numbers for Figures 1, 2 can be found in Supplemental Material 3.
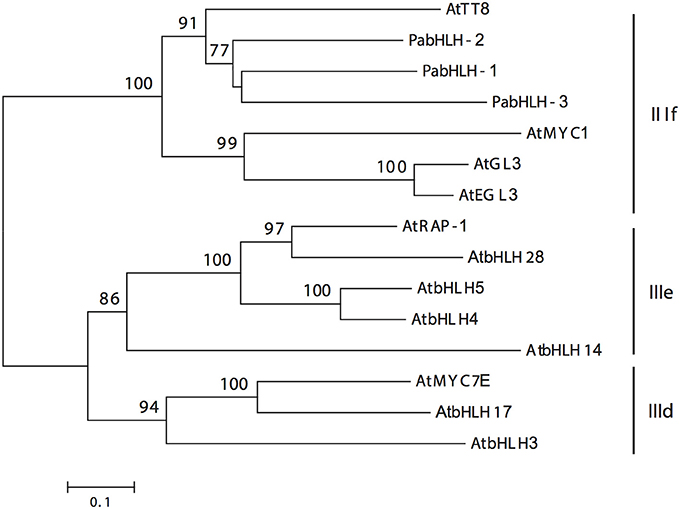
Figure 1. Unrooted neighbor-joining tree of the three Norway spruce bHLH proteins and the Arabidopsis thaliana bHLH proteins of subgroups IIId, IIIe, and IIIf (Pires and Dolan, 2010), which are indicated by the black vertical lines. The numbers on the braches correspond to the bootstrap support (1000 replications).
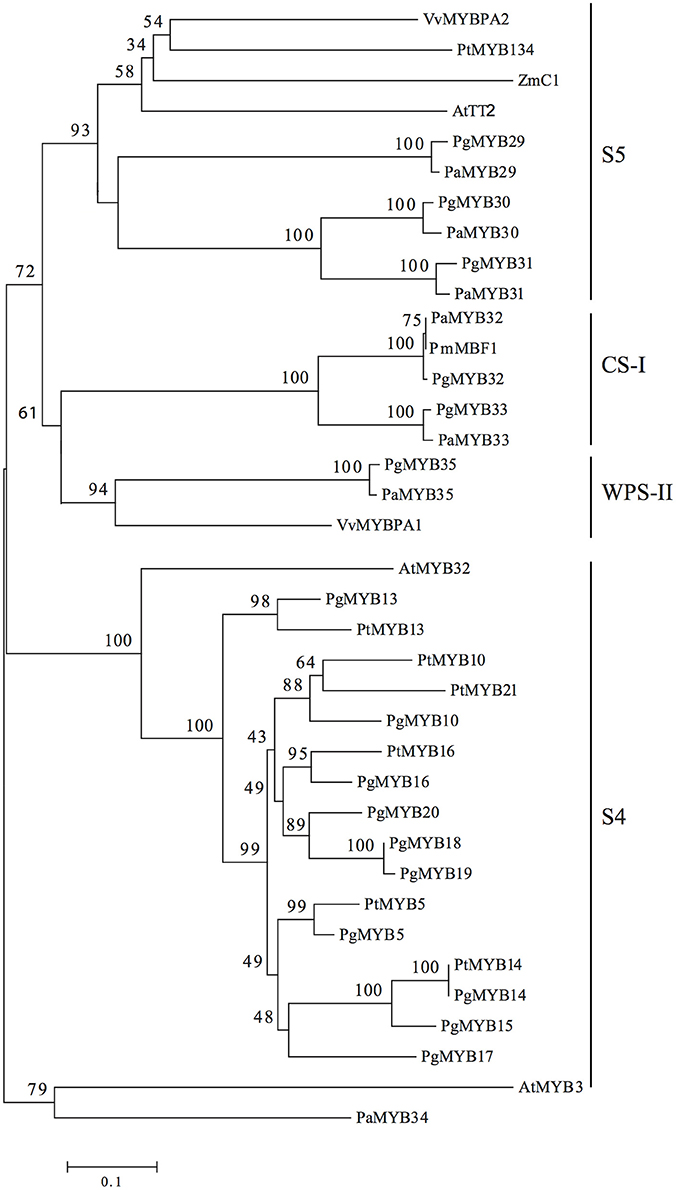
Figure 2. Unrooted neighbor-joining tree of R2R3-MYB subgroups 4 and 5 in Pinaceae. Angiosperm R2R3-MYB proteins are included as a reference. Black lines indicate subdivisions within the tree. Pg, Picea glauca; Pm, Picea mariana; Pa, Picea abies; At, Arabidopsis thaliana; Vv, Vitis vinifera; Zm, Zea mays; Pt, Populus tremuloides. The numbers on the braches correspond to the bootstrap support (1000 replications).
Quantitative RT-PCR
For preparation of standards for the qPCR reaction, PCR reactions consisted of 1x Dream-Taq green buffer (Thermo Fischer Scientific), 0.25 μM of each of the qPCR primers, 0.2 mM dNTPs (Qiagen), 6.25 U Dream-Taq Polymerase (Thermo Fischer Scientific) and 1 μl of Norway spruce cDNA. Initial denaturation was at 95°C for 5 min, followed by 35 cycles of: 15 s at 95°C, 20 s at 60°C, and 20 s at 72°C and a final elongation step of 3 min at 72°C. PCR products were cloned into TOPO®-TA vectors (Thermo Fischer Scientific) following the manufacturer's instructions. Plasmids were purified using The Qiagen PlasmidMini Kit® and dilution series were then prepared from 108 to 103 copies/μl.
Quantitative PCR reactions were performed with the SsoFast™ EvaGreen® Supermix (Bio-Rad) according to the instructions in the manual, using 0.3 μM of each primer and 1 μl of Norway spruce cDNA. The qPCRs were carried out in an iQ5™ Multicolor Real-Time PCR Detection System thermo cycler (Bio-Rad) using a program with a 30 s initial denaturation step at 95°C, followed by 40 cycles of 5 s denaturation at 95°C and 10 s at 60°C. Melt curve analyses were used to validate the amplicon. Two repetitions per standard, sample, and negative control were run.
For the tissue panel, 2 ΔΔCT values and standard curves were used to calculate expression levels. Elongation Factor 4 Alpha (EF4α) (Vestman et al., 2011) was used as a reference gene to normalize the values of the target genes in each sample. For each gene, relative expression levels were calculated by comparing the expression levels in a tissue to the average in all the tissues that were analyzed.
For the Stress panel and the transgenic cell lines, Ct values were imported into REST (Pfaffl et al., 2002) software 2009 and EF4a was used as a control gene. Expression levels of treated and transgenic cells were compared to untreated and untransformed cells, respectively.
Yeast Two-Hybrid Assay
DB and AD plasmids were individually transformed into haploid yeast (S. cerevisiae) strains Y8930 (MATα) and Y8800 (MATa) to create baits and preys, respectively as described by Mukhtar et al. (2011). Briefly, Y8930 and Y8800 strains were grown in liquid YEPD overnight as pre-cultures. Cultures were prepared with a starting OD of 0.1 and the cells were harvested and prepared for transformations, once they reached an OD between 0.4 and 0.6. The baits and preys were selected on Difco™ yeast nitrogen base (YNB) with leucine dropout (-L) and tryptophan dropout (-T) selective media, respectively. The haploid bait and prey yeast strains were pairwise mated overnight in YEPD. The diploid yeast cells were selected onto YNB -LT selective liquid media, and subsequently spotted onto YNB -LTH as well as -LH containing cycloheximide (CHX) selective media. In addition, we also determined the strength of protein-protein interaction by supplementing–LTH and -LH media with 3-Amino- 1, 2, 4-trizole (3AT), a competitive inhibitor of histidine biosynthesis. Yeast growth on–LTH but not on -LH containing CHX media were scored as positive interactions. Yeast growth found on both –LTH and –LH containing CHX were due to de novo autoactivation and hence removed from the data set.
Analysis of Phenolic Specialized Metabolites in Overexpression Lines
Norway spruce cells from suspension cultures of three transformant lines per construct were harvested, stored immediately in liquid nitrogen, and later freeze-dried. The weights of the dried samples were annotated and the samples were then ground in a shaking ball mill using metal beads. Chemical content was measured using the same method as described by Wadke et al. (2016) and Hammerbacher et al. (2014).
Variances in the chemical contents of specific compound groups were analyzed by Principal Component Analysis (PCA, Past 3; Hammer et al., 2001). A one-way ANOVA with Dunns Post-test (GraphPad Prism 5.0) was used to detect differences in specific compounds between lines.
Results
Identification of Homologs of AtTT8, AtTTG1, and AtTT2 in Norway Spruce
Three putative Norway spruce bHLH genes, PabHLH-1 (2019 bp), PabHLH-2 (2274 bp), and PabHLH-3 (1071 bp), encoding TFs homologous to AtTT8 were isolated and cloned from Norway spruce. In all three cases, the sequenced ORFs matched the length of the high-confidence gene models in the Norway spruce genome assembly (Nystedt et al., 2013). The predicted amino acid sequences clustered together with AtTT8 in a well-supported clade (Figure 1) in subgroup IIIf, identified by Pires and Dolan (2010). PabHLH-1/2 both possess the characteristic 30 AA domain 8 (Pires and Dolan, 2010) sequence N-terminally in the amino acid sequence, while this domain appears to be truncated in PabHLH-3. Furthermore, the predicted PabHLH3 appears to lack the conserved bHLH domain (Supplemental Material 4) and for this reason it was not used in further experiments.
Based on the high-confidence gene model with a predicted protein homologous to TTG1 in the Norway spruce genome v.1.0 (Supplemental Material 5), the cDNA sequence of PaWD40-1 was isolated. The sequence covered the ORF gene (1020 bp) and was identical to the gene model predicted in the Norway spruce genome assembly. Alignment of the amino acid sequences of the Arabidopsis TTG1 (341 aa) and our candidate, PaWD40-1 (339 aa), showed a highly conserved structure between the two proteins (Supplemental Material 5), 85% similarity and 66% identity, suggesting that PaWD40-1 is the Norway spruce ortholog of AtTTG1.
Seven transcripts encoding R2R3-MYB TFs homologous to AtTT2, the only member of the R2R3-MYB subgroup 5 in Arabidopsis (Stracke et al., 2001), were identified in Norway spruce. To achieve this, we used the amino acid sequence of AtTT2 to query the Norway spruce genome 1.0 (Nystedt et al., 2013). Seven gene models were identified (Supplemental Material 5) covering the full ORF except for the one corresponding to PaMYB29, which lacked the 3′ end of the ORF based on the previously isolated GenBank accession JF810440. We successfully isolated the full ORF sequences for the seven candidates: PaMYB29 (909 bp), PaMYB30 (1116 bp), PaMYB31 (1074 bp), PaMYB32 (1149 bp), PaMYB33 (1041 bp), PaMYB34 (1077 bp), and PaMYB35 (1173 bp). All seven genes were named following the numeration established for the already published white spruce R2R3-MYB TFs (Bedon et al., 2007, 2010; Duval et al., 2014). All isolated R2R3-MYB TFs showed conserved R2R3 domains, located in the N-terminal site of the predicted protein, and a highly variable C-terminal sequence (Supplemental Material 6).
Phylogenetic analyses of the amino acid sequences revealed three subdivisions within the subgroup, which we classified as S5, WPS-II and CS-I based on the MYB classification presented by Soler et al. (2015) (Figure 2). Subgroup S5 enclosed the TFs with the highest homology to AtTT2 and its orthologs from poplar (PtMYB134), grape (VvMYBPA2) and maize (C1) into a single clade with high bootstrap support. Orthologus sequences from Norway spruce, represented by PaMYB29, which was previously named PaTT2 (Arnerup, 2011), together with its paralogs PaMYB30 and PaMYB31, grouped closely together with their respective ortholog from white spruce in a well-supported group corresponding to the previously identified subgroup 5. A second subgroup previously identified as WPS-II (Soler et al., 2015), only included PaMYB35, the Norway spruce ortholog of VvMYBPA1 (Bogs et al., 2007), which regulates proanthocyanidin biosynthesis in grapevine. Finally, we identified subgroup CS-I (Conifer-specific I), which comprisesPaMYB33 and PaMYB32, the Norway spruce homolog of the Picea mariana MYB TF MBF1 (Xue et al., 2003). PaMYB34 has no known homologs in any other species and could not be placed phylogenetically in any of the MYB subgroups 4 or 5, therefore, it was not included in any further analyses. The pair of closely related paralogs PaMYB30/PaMYB31 showed high levels of identity (66.7%) and similarity (80.4%) over their whole protein sequences, respectively (Supplemental Material 6). The BLAST analysis against the conifer genomes and GenBank showed that the white spruce genome contains orthologous scaffolds for all the genes, and the loblolly pine genome contains orthologous scaffolds for five, including the two members of subgroup CS-I. GenBank sequences homologous to our candidates were also found in other conifers (Supplemental Material 7). No MYB proteins homologous to the subgroup CS-I (PaMYB32 and PaMYB33) members could be found outside the Pinaceae family.
Differential Physical Interaction Patterns of MYB Subgroup 5 Transcription Factors in Norway Spruce
We did not observe any significant difference between the expression patterns of PabHLH-1 and PabHLH-2 in different tissues (Figure 3) and upon treatments with diverse hormones (Figure 4). Furthermore, both proteins interacted with PaWD40-1, when PaWD40-1 was expressed as the bait in the yeast two-hybrid assay (Figure 5, Supplemental Material 10). However, our yeast two-hybrid experiment revealed differences in interaction patterns between our bHLH and R2R3-MYB candidates. Specifically, we showed direct physical interactions of PabHLH-2 expressed as bait with PaMYB29, PaMYB31, and PaMYB33 and with PaMYB32 when expressed as prey. PabHLH-1, on the other hand, only interacted with PaMYB33 when expressed as bait (Figure 5, Supplemental Material 10). This suggests divergent roles of PabHLH-1 and PabHLH-2 in conjunction with MYB TFs in Norway spruce.
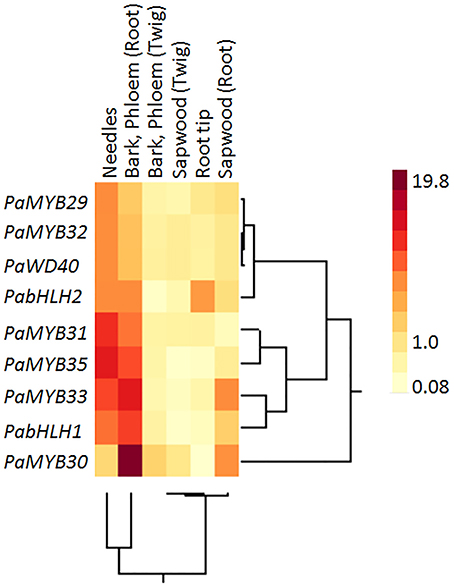
Figure 3. Two-way cluster of the relative expression of PaWD40, PabHLH and R2R3 MYB genes in specific Norway spruce tissues measured by qPCR. The expression in a specific tissue compared to the average expression over all tissues. Four independent Norway spruce genotypes were used for this experiment.
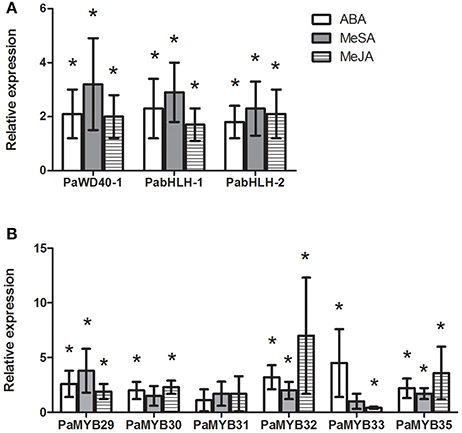
Figure 4. Relative expression in Norway spruce of PaWD40-1, PabHLH-1, PabHLH-2 (A) and six PaMYB genes (B) in Norway spruce cell lines treated with ABA (open bars), MeSA (shaded bars) or MeJA (hashed bars) compared to untreated controls (n = 3). An asterisk (*) indicates significant regulation of the gene (p < 0.05, T-test) relative to the untreated control.
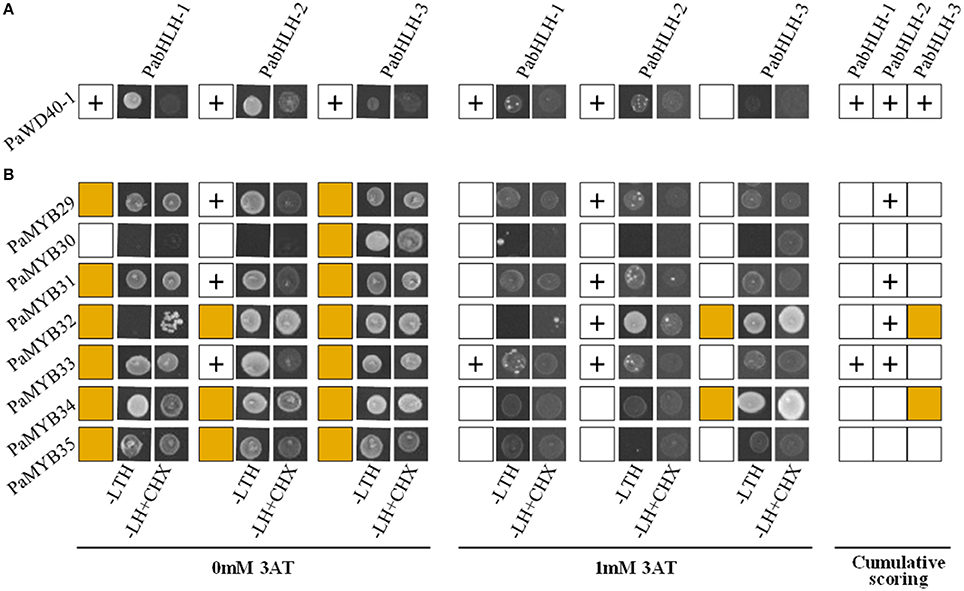
Figure 5. Interaction of P. abies proteins using yeast-two-hybrid (Y2H). (A) Interaction between PaWD40-1 and bHLH proteins. (B) Interaction between bHLH and MYB transcription factors. Plus sign (+) indicates positive interaction between a protein pair tested at 0 mM 3-Amino-1,2,4-triazole (3AT) or 1 mM 3AT. Brown box indicates autoactivations at both 0 mM 3AT or 1 mM 3AT conditions. Cumulative scoring encompasses positive interactions at any given conditions.
Specific Expression Patterns of Norway Spruce MYBs
In contrast to the bHLH genes, the expression analysis showed significant differences in tissue specificity and hormone inducibility between our MYB genes (Figures 3, 4). Some tissues like shoots, phloem and root bark were considerably more transcriptionally active than sapwood, where only PaMYB29, PaMYB32 and PaMYB33 showed significant expression levels (Figure 3). Furthermore, we detected the transcripts of PaMYB29 and PaMYB32 in almost all tissues analyzed. Being these two transcripts the most ubiquitous and active, we analyzed the expression of PaMYB29 and PaMYB32 and a set of flavonoid biosynthesis genes in the phloem of 4-year old Norway spruce plants wounded or inoculated with H. parviporum. PaMYB29, PaPAL1, and some of the genes involved in the later steps of flavonoid biosynthesis that were tested showed induction after wounding and inoculation, while PaMYB32 was neither induced by wounding or inoculation after 3 days, and only showed a small, but significant upregulation 7 days after inoculation (Supplemental Material 8).
The identified R2R3-MYB genes responded to hormonal treatments except for PaMYB31, which was expressed at very low levels. For the other MYB genes, our data showed that they responded to ABA and MeJA treatments, while MeSA treatment caused no or low induction for all MYB genes except for PaMYB29 (Figure 4B). Interestingly, the two closely related paralogs, PaMYB32 and PaMYB33, showed opposite transcriptional responses to treatment with MeJA (Figure 4B). While PaMYB32 was strongly upregulated, PaMYB33 was repressed. The expression analysis revealed that the highly expressed PaMYB29 and PaMYB32 genes were further induced by all treatments (Figure 4B).
Norway Spruce R2R3-MYB TFs of the Subgroup 5 Differentially Regulate Genes Involved in the Flavonoid Biosynthesis Pathway
To elucidate if PaMYB29 and PaMYB32, the previously identified (Xue et al., 2003; Arnerup et al., 2011) and also most highly expressed spruce AtTT2 homologs, control secondary metabolism in Norway spruce we created transgenic cell lines overexpressing these two genes and two of the newly identified R2R3-MYB genes. These were the PaMYB32 paralog, PaMYB33, and PaMYB35, the only representative of the flavonoid-related subgroup WPS-II in the Norway spruce genome. Twenty independent hygromycin-resistant Norway spruce cell lines were isolated 3 weeks after Agrobacterium-mediated transformation for each construct. The presence of the transgene (pMDC32::PaMYB29, pMDC32::PaMYB32, pMDC32::PaMYB33, or pMDC32::PaMYB35) was verified by PCR and the relative expression levels of the MYBs were determined by qPCR. Three lines per construct overexpressing the targeted MYB TF 10 to 20 times were selected for subsequent analyses together with the WT line.
We measured expression levels of PaPAL1, PaCHS and eight genes in the late flavonoid biosynthetic pathway (LBGs) in Norway spruce transgenic cells lines overexpressing PaMYB29, PaMYB32, PaMYB33 or PaMYB35 (Figure 6). Our results showed that overexpression of PaMYB33 and PaMYB35 induced expression of the early biosynthetic genes in the flavonoid pathway PaPAL1 and PaCHS, while PaMYB29 and PaMYB32 did not induce these genes. Overexpression of all four R2R3-MYB TFs upregulated the expression of late biosynthetic genes. Our results suggested, however, that the four R2R3-MYB genes target different genes downstream in the flavonoid pathway. PaMYB29 overexpression induced PaANR3 and PaLAR3, while PaMYB32 overexpression upregulated PaANR3, PaLAR3, and PaLAR4. Overexpression of both PaMYB33 and PaMYB35 induced the expression of all the LBGs that we tested (PaANR2, PaANR3, PaANR5, PaLAR1, PaLAR2, PaLAR3, and PaLAR4) except for specific members of the PaLAR gene family (PaLAR2 in the case of PaMYB33 and PaLAR1 in the case of PaMYB35) (Figure 6). In all cases, the induction of transcription by PaMYB33 and PaMYB35 overexpression was higher than the induction by PaMYB29 and PaMYB32.
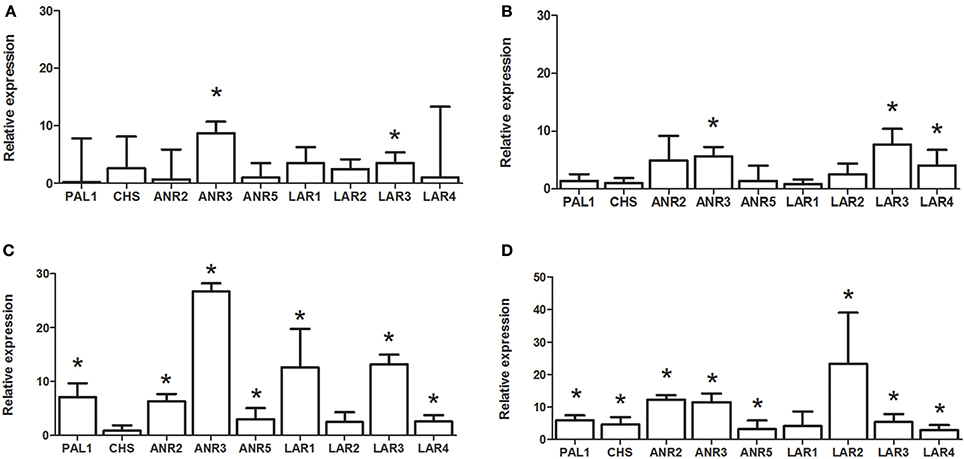
Figure 6. Expression of genes in the flavonoid biosynthetic pathway in PaMYB overexpressing lines; OE-PaMYB29 (A); OE-PaMYB32 (B); OE-PaMYB33 (C) and OE-PaMYB35 (D) measured by qPCR. The graphs show average relative gene expression of three independent over expressing cell lines per construct compared to the untransformed WT line. An asterisk (*) indicates significant regulation of the gene (p < 0.05, T-test) relative to the untransformed WT line.
The flavonoid, stilbene and neolignan profiles differed between lines overexpressing PaMYB29, PaMYB32, PaMYB33, and PaMYB35, and WT material according to the PCA of these metabolite groups (Supplemental Material 9). The PCA revealed that the variation in flavonoids was mainly accounted for by differences in catechin and naringenin content between lines overexpressing different MYB genes (Supplemental Material 9A). Subsequent one-way ANOVA analyses verified significant differences in the levels these two metabolites between lines. Catechin, levels were higher in lines overexpressing PaMYB32 and PaMYB33, compared to WT and to the lines overexpressing PaMYB29 and PaMYB35, the latter actually showing a significant lower catechin content than WT and lines overexpressing PaMYB29 (Figure 7B). Naringenin levels were significantly elevated in lines overexpressing PaMYB33 (Figure 7A), Stilbene profiles were not different between lines overexpressing different R2R3-MYB TFs but all lines exhibited stilbene profiles different from WT material (Supplemental Material 9C). Neolignan-2 (β-D-Xylopyranoside, 4-[1,3-dihydroxy-2-[2-hydroxy-4-(3-hydroxypropyl)-phenoxy]-propyl]-2-methoxyphenyl) explained 98% of the variation in neolignans in our dataset (Supplemental Material 9B). The subsequent one-way ANOVA analysis of neolignan-2 levels in the overexpression lines showed that lines overexpressing PaMYB32 had significantly higher neolignan-2 levels compared to WT and the lines overexpressing PaMYB29, PaMYB33, and PaMYB35 (Figure 7C).
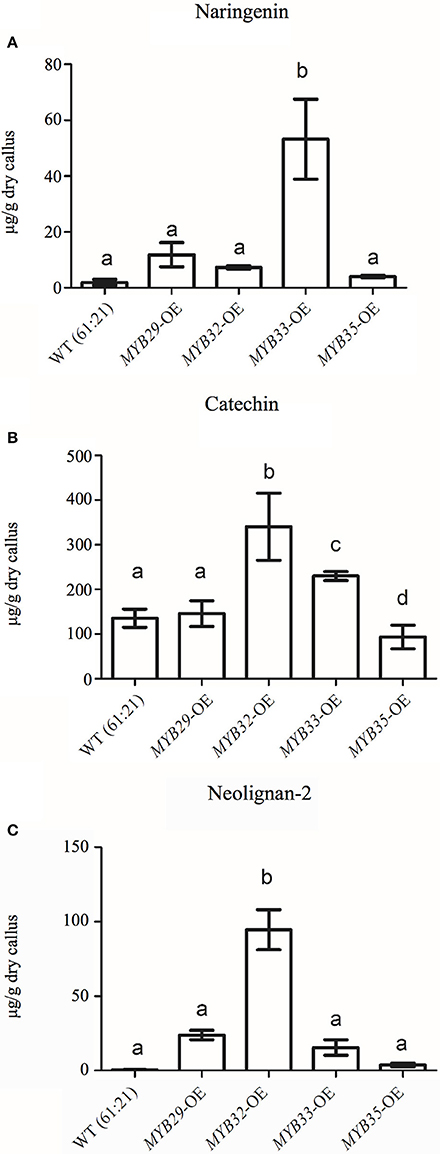
Figure 7. Average naringenin (A), catechin (B), and neolignan-2 (C) contents in μg/g of dry callus for WT (p < 0.05) and the transformant lines overexpressing MYB29, MYB32, MYB33, and MYB35 (n = 3). Letters indicate statistical differences (p > 0.05) in a one-way ANOVA with Dunns post-test (P < 0.05).
Discussion
Plants depend on (TFs) to respond and adapt to environmental changes. For this reason, plants possibly possess a higher TF diversity than other living organisms (Shiu et al., 2005). The amount of TFs varies between plant species, but higher plants generally have expanded TF gene families (Lang et al., 2010). Even though previous studies suggested that conifers have a lower number of TFs than angiosperms (Rigault et al., 2011; Canales et al., 2014), the publication of their genomes has shown that the TF number is similar but that TF families evolved differently in conifers, showing expansion or contraction of specific subgroups within TF families (Bedon et al., 2010; Nystedt et al., 2013). In this study we explored the specific diversity of a MYB-bHLH-WDR (MBW) complex in Norway spruce and compare our results with the present knowledge in conifers.
The WD40 protein is portrayed as the ubiquitous member of modular MBW complexes (Ramsay and Glover, 2005; Xu et al., 2015). In Arabidopsis, the WD40 member is represented by the stably expressed single-copy gene AtTTG1, which influences all traits associated with the MBW complex (Tominaga-Wada et al., 2011). Consistent with these reports, we find a single potential homolog of AtTTG1 in Norway spruce, PaWD40-1, which is constitutively expressed in all tissues and in response to various types of abiotic stressors as expected of an AtTTG1 Homolog. The predicted PaWD40-1 protein sequence shows substantial identity and similarity to AtTTG1, particularly in the C-terminal region, which has been shown to be important for the interaction between AtTTG1 with the bHLH TF member of the complex, AtTT8 (Matsui and Ohme-Takagi, 2010). Furthermore, consistent with the conservation of the predicted interaction domain, PaWD40-1 interacts with the tested Norway spruce bHLH proteins included in the yeast two-hybrid assay. We could not detect direct physical interactions between PaWD40-1 and any of the PaMYB proteins and we do not preclude that the proteins may still interact in vivo. This also has been reported in Arabidopsis (Baudry et al., 2004), where direct interactions between TTG1 and TT2 homologs were not observed, and in strawberry (Schaart et al., 2013). Directionality appears to be relatively common in yeast two-hybrid assays involving members of MBW complexes and it has been attributed to partial misfolding possibly producing false negatives (Baudry et al., 2004; Schaart et al., 2013). Taken together, our data suggest that PaWD40-1 is the TTG1 homolog in Norway spruce.
R/B-like subgroup IIIf bHLH proteins participate in MBW complexes and some of these proteins in subgroup IIIf are involved in the control of pigmentation and flavonoid biosynthesis in angiosperms (Park et al., 2007; Park, 2012; Schwinn et al., 2014). Our study gives a first insight into this subgroup of bHLH TFs in conifers. The phylogenetic analyses of our bHLH candidates suggested that the three paralogous bHLH proteins are the closest homologs to AtTT8, as the three bHLH candidates showed a shorter phylogenetic distance to AtTT8 than to the other Arabidopsis bHLH subgroup IIIf members. Further analysis of the predicted amino acid sequences suggested that PabHLH-1 and PabHLH-2 encode functional bHLH proteins and that PabHLH-3 is, most likely, a pseudogene. PabHLH-3 lacks large parts of the ID, AD and bHLH domains, which are essential for TT8 function (Pattanaik et al., 2008; Feller et al., 2011). Thus, we conclude that the Norway spruce genome contains two functional AtTT8 homologs, PabHLH-1 and PabHLH-2. However, the level of sequence divergence between the paralogs and the identification of orthologous sequences to both genes in the white spruce and loblolly pine genomes indicate that it is not a recent duplication but that it predates the divergence between Picea and Pinus, approximately 90–100 Mya (Lu et al., 2014). Even though PabHLH-1 and PabHLH-2 show similar expression patterns in most tissues and in response to abiotic stress, their protein interaction with subgroup 5 R2R3-MYB is largely dissimilar. PabHLH-2 interacts with the MYB proteins of the subgroup S5, PaMYB29, PaMYB31, and with PaMYB32 and PaMYB33, while PabHLH-1 only interacts with PaMYB33 (Figure 5). Thus, the two paralogs appear to have diverged functionally since their separation.
In Arabidopsis, the R2R3-MYB TF subgroup 5 is represented by the single member AtTT2 (Nesi et al., 2001), but in the legume model plant Lotus japonicus there are three members of this subgroup capable of restoring function in tt2 mutants (Yoshida et al., 2008). When co-expressed with LjTT8 and LjTTG1, the three LjTT2s show different activation of late biosynthetic gene transcription in the flavonoid biosynthesis pathway (Yoshida et al., 2010) and this variation in activation strength is associated with substitutions in the amino acid sequences of the LjTT2s. Previously, two different genes with similarity to AtTT2 have been reported from the genus Picea (Xue et al., 2003; Arnerup, 2011), leading us to hypothesize that the conifer R2R3-MYB TF subgroup 5 also would contain multiple members with different functions. We isolated the cDNA sequence from seven Norway spruce R2R3-MYB TFs. Based on phylogenetic analysis, we suggest that six of these genes PaMYB29, PaMYB30, PaMYB31, PaMYB32, PaMYB33, and PaMYB35 are members of, or highly similar to members of, subgroup 5 of the R2R3-MYB TF family. The phylogeny also indicated that the R2R3-MYB TFs have different evolutionary paths; PaMYB29, PaMYB30, and PaMYB31 cluster together with AtTT2 (Nesi et al., 2001) and its homologs in angiosperms (Pazares et al., 1987; Mellway et al., 2009; Terrier et al., 2009) forming the subgroup S5, while PaMYB35 shows similarity to VvMBPA1 and WPS-II SG MYBs of woody angiosperms (Bogs et al., 2007; Soler et al., 2015). However, PaMYB32 and PaMYB33 have no known homologs outside the gymnosperms, indicating that they represent a gymnosperm-specific subgroup of the R2R3-MYB TF family, which we named CS-I. Examples of R2R3-MYB family subgroup expansions in conifers compared to Arabidopsis have already been reported as it is the case for the expanded R2R3-MYB family subgroup 4, which was shown to be involved in the regulation of early flavonoid biosynthesis genes in conifers (Bedon et al., 2010; Bomal et al., 2014). Soler et al. (2015) reported that subgroup 5 is one of three R2R3–MYB TF subgroups, all controlling proanthocyanidin and anthocyanin pathways, which appear to be expanded in woody perennial angiosperms compared to herbaceous angiosperms. Thus, the formation of woody tissues may depend on a more refined regulation of these pathways, and that some of these subgroups may predate the separation of angiosperm gymnosperm lineages while others appear lineage specific.
Grotewold (2005) proposed a model to explain the functional divergence of recently duplicated regulatory genes and how that relates to metabolic diversity in plants. In that model, “the duplication of a regulatory gene for a metabolic pathway is followed by mutations that result in a TF with a partial loss of function” modulating the expression of some but not all genes in a pathway and allowing intermediates to accumulate. This sub-functionalization of the recently duplicated regulatory genes is then followed by its apparent neo-functionalization of metabolic pathways. Thus, under this model, the paralogous R2R3-MYB TFs identified in Norway spruce would regulate genes in the flavonoid pathway differently. To test this, we generated transgenic lines overexpressing PaMYB29, PaMYB32, PaMYB33, and PaMYB35. Overexpression of either of these TFs lead to higher expression levels of PaLAR3 compared to wild type lines. PaLAR3 catalyzes the last step in the flavonoid biosynthesis pathway to produce catechin and it is a key factor in resistance of Norway spruce to fungal pathogens (Hammerbacher et al., 2014; Nemesio-Gorriz et al., 2016). Interestingly, PaMYB32, the Norway spruce ortholog of PmMBF1 (Xue et al., 2003), appeared to also specifically regulate PaLAR3 as well as PaLAR4, while overexpression of its close paralog, PaMYB33, activated the expression of PaPAL1 and PaANR2, PaANR3, PaANR5, PaLAR1, PaLAR3, and PaLAR4 encoding enzymes in the late flavonoid biosynthesis. Together with their contrasting transcriptional responses to hormones and abiotic stress, our observations suggest that the gene duplication that gave rise to PaMYB32 and PaMYB33 was followed by a sub-functionalization of the paralogs, as predicted by the model on functional divergence of recently duplicated regulatory genes (Grotewold, 2005). Similar evolutionary changes have been observed for R2R3-MYB family TFs in several angiosperms (Dias et al., 2003; Chai et al., 2014; Zhao and Bartley, 2014).
The contrasting expression pattern of the gene pair PaMYB32 and PaMYB33 is the most obvious example, in this study, of distinct separation of tissue- or stress-dependent expression patterns between the R2R3–MYB TFs, but all studied genes show individual expression patterns. Such variation in expression patterns is consistent with the proposed modularity of the MBW complex where an exchange, or the tissue specificity, of the R2R3-MYB TFs would specify the regulation of individual traits (Dias et al., 2003; Baudry et al., 2004; Gonzalez, 2009; Xu et al., 2015) in combination with particular bHLH proteins (Ramsay and Glover, 2005). The gene expression profiles of the Norway spruce R2R3-MYB TFs and the expression patterns of late genes in flavonoid biosynthesis in the overexpression lines could indicate that the previously isolated genes PaMYB29 and PaMYB32 (Xue et al., 2003; Arnerup, 2011) control specific functions irrespective of tissue. The two genes were expressed at similar levels in most tested tissues, responded to abiotic and biotic stress, and PaMYB29 and PaMYB32 overexpressing lines showed an upregulation of specific genes in flavonoid biosynthesis. Interestingly enough, the gene expression patterns in the PaMYB29 overexpression lines suggest that this particular TF may contribute to the induction of the genes PaANR3 and PaLAR3 in response to biotic stress. The more generalized late-biosynthesis-gene upregulation seen in PaMYB33 and PaMYB35 overexpression lines and the expression pattern of PaMYB30, PaMYB31, PaMYB33, and PaMYB35, which showed a higher degree of tissue specificity and more restricted responses to abiotic stress compared to PaMYB29 and PaMYB32, suggests that these R2R3-MYB family TFs may perform their regulatory role in particular organs or distinct cell types. Such organ specificity is reported for Arabidopsis' subgroup 7 R2R3-MYB members (Stracke et al., 2007), for paralogous R2R3-MYB genes, PdMYB2 and PdMYB20, in poplar (Chai et al., 2014) and to some extent among conifer subgroup 4 R2R3-MYB family TFs (Bedon et al., 2007, 2010).
Previously, transcriptional profiling studies have shown that overexpression of conifer R2R3-MYBs acting on the shikimate and monolignol pathways can regulate specific sets of genes depending on the MYB that is overexpressed (Bedon et al., 2014). This regulation could potentially channel carbon flux into different directions leading to the accumulation of different metabolites, however such changes in metabolite patterns was not confirmed by metabolite profiling. In this study we attempted to correlate activation of genes in the flavonoid pathway with the soluble flavonoid, stilbene and lignan levels in the overexpression lines. The R2R3-MYB overexpressing lines showed higher expression levels of members of the PaLAR gene family compared to WT controls and overall this was reflected in their chemical profiles. All R2R3-MYB overexpressing lines, except lines overexpressing PaMYB35, had significantly higher catechin levels. This apparent incongruence between gene expression and metabolite accumulation in lines overexpressing PaMYB35 could be an effect of substrate unavailability for particular enzymatic processes, due to the general activation of the late flavonoid biosynthesis pathway, leading to lower metabolite accumulation despite high levels of gene expression (Treutter, 2005). Furthermore, the possibility that the products made by the activated flavonoid biosynthesis pathway were laid down as insoluble lignin or proanthocyanidins affecting the profiles of soluble phenolics cannot be excluded. In fact, Bomal et al. (2008) observed reduced levels of soluble phenolics and an increased deposition of lignin and in PtMYB1 and PtMYB8 overexpressing white spruce lines. Despite the difficulties to find simple correlations of specific specialized metabolites with the overexpression of specific Norway spruce subgroup 5 R2R3-MYB TFs, the general impression is that several of the Norway spruce subgroup 5 R2R3-MYB TFs regulate the activity of the genes in the late flavonoid biosynthesis pathway and the subsequent accumulation flavonoids.
Concluding Discussion
Comparative analyses of gymnosperm and angiosperm TF gene families provided evidence of monophyletic gene family expansions that occurred in gymnosperms after the angiosperm–gymnosperm split (Guillet-Claude et al., 2004; Liu and Ekramoddoullah, 2004; Bedon et al., 2010) and illustrates the different evolutionary trajectories of the gene families in seed plants (Bedon et al., 2010). Our study on selected members of the MBW complex in Norway spruce further adds to this picture as we identified a bHLH gene pair orthologous to AtTT8 and several members of the R2R3-MYB TF family subgroup 5 in the conifer, Norway spruce. Taken together, previous studies on conifer MBW members and this study indicate that conifer Subgroups 4 and 5 control early and late gene expression in the flavonoid pathway as well as stilbene and neolignan biosynthetic pathways. To fulfill these functions, it is likely that they form complexes with bHLH and WD40 proteins as suggested by Zhao et al. (2013). Testing interactions of PabHLH-1 and PabHLH-2 with members of R2R3-MYB subgroups 4 and 5 would shed light on the involvement of the bHLH paralogs in the control of the different biosynthetic modules. Furthermore, overexpression of members of R2R3-MYB under inducible promoters or silencing expression by RNA-interference might lead to a clearer elucidation of their functions.
Author Contributions
MN and ME conceived the study. MN isolated the candidate genes, performed the phylogenetic analyses, prepared the vectors for yeast and spruce transformation, extracted the RNA and performed the expression studies on plant tissues and cell lines. PB performed the protein interaction experiment and analyzed the data together with SM. JA performed the expression study to test biotic and abiotic stress on spruce plants. KD conducted the experiment to test abiotic stress on spruce cell lines. AH performed the chemical analysis of the cell lines. MN drafted the manuscript and coordinated the writing. PB, KD, AH, JS, SM, and ME contributed with advice on data analyses and advice during the process of writing the manuscript. MN wrote the final manuscript and all co-authors read and approved the final version of the manuscript.
Conflict of Interest Statement
The authors declare that the research was conducted in the absence of any commercial or financial relationships that could be construed as a potential conflict of interest.
Acknowledgments
We are grateful to Dr. Heriberto Vélëz for language correction of the manuscript and Dr. Åke Olson for valuable advice during the project. We thank the SLU travel grant for covering the travel and accommodation costs for the study visit of Miguel Nemesio-Gorriz at the University of Alabama. This project has received funding from The Swedish Research Council Formas grant No. 2012–1276 and the Swedish Foundation for Strategic Research (SSF) grant No. R8b08-0011. This work was also supported by the National Science Foundation (IOS-1557796) to SM. Parts of this work was included in Miguel Nemesio-Gorriz's Ph.D. thesis.
Supplementary Material
The Supplementary Material for this article can be found online at: http://journal.frontiersin.org/article/10.3389/fpls.2017.00305/full#supplementary-material
References
Arnerup, J. (2011). Induced Defence Responses in Picea Abies Triggered by Heterobasidion Annosum s.l. Diss. Uppsala: Swedish University of Agricultural Sciences.
Arnerup, J., Lind, M., Olson, Å., Stenlid, J., and Elfstrand, M. (2011). The pathogenic white-rot fungus Heterobasidion parviporum triggers non-specific defence responses in the bark of Norway spruce. Tree Physiol. 31, 1262–1272. doi: 10.1093/treephys/tpr113
Arnerup, J., Nemesio-Gorriz, M., Lundén, K., Asiegbu, F. O., Stenlid, J., and Elfstrand, M. (2013). The primary module in Norway spruce defence signalling against H. annosum s.l. seems to be jasmonate-mediated signalling without antagonism of salicylate-mediated signalling. Planta 237, 1037–1045. doi: 10.1007/s00425-012-1822-8
Baudry, A., Heim, M. A., Dubreucq, B., Caboche, M., Weisshaar, B., and Lepiniec, L. (2004). TT2, TT8, and TTG1 synergistically specify the expression of BANYULS and proanthocyanidin biosynthesis in Arabidopsis thaliana. Plant J. 39, 366–380. doi: 10.1111/j.1365-313X.2004.02138.x
Bedon, F., Bomal, C., Caron, S., Levasseur, C., Boyle, B., Mansfield, S. D., et al. (2010). Subgroup 4 R2R3-MYBs in conifer trees: gene family expansion and contribution to the isoprenoid- and flavonoid-oriented responses. J. Exp. Bot. 61, 3847–3864. doi: 10.1093/jxb/erq196
Bedon, F., Grima-Pettenati, J., and Mackay, J. (2007). Conifer R2R3-MYB transcription factors: sequence analyses and gene expression in wood-forming tissues of white spruce (Picea glauca). BMC Plant Biol. 7:17. doi: 10.1186/1471-2229-7-17
Bedon, F., Ziolkowski, L., Walford, S. A., Dennis, E. S., and Llewellyn, D. J. (2014). Members of the MYBMIXTA-like transcription factors may orchestrate the initiation of fiber development in cotton seeds. Front. Plant Sci. 5:179. doi: 10.3389/fpls.2014.00179
Bogs, J., Jaffé, F. W., Takos, A. M., Walker, A. R., and Robinson, S. P. (2007). The grapevine transcription factor VvMYBPA1 regulates proanthocyanidin synthesis during fruit development. Plant Physiol. 143, 1347–1361. doi: 10.1104/pp.106.093203
Bomal, C., Bedon, F., Caron, S., Mansfield, S. D., Levasseur, C., Cooke, J. E., et al. (2008). Involvement of Pinus taeda MYB1 and MYB8 in phenylpropanoid metabolism and secondary cell wall biogenesis: a comparative in planta analysis. J. Exp. Bot. 59, 3925–3939. doi: 10.1093/jxb/ern234
Bomal, C., Duval, I., Giguére, I., Fortin, È., Caron, S., Stewart, D., et al. (2014). Opposite action of R2R3-MYBs from different subgroups on key genes of the shikimate and monolignol pathways in spruce. J. Exp. Bot. 65, 495–508. doi: 10.1093/jxb/ert398
Canales, J., Bautista, R., Label, P., Gómez-Maldonado, J., Lesur, I., Fernández-Pozo, N., et al. (2014). De novo assembly of maritime pine transcriptome: implications for forest breeding and biotechnology. Plant Biotechnol. J. 12, 286–299. doi: 10.1111/pbi.12136
Chai, G., Wang, Z., Tang, X., Yu, L., Qi, G., Wang, D., et al. (2014). R2R3-MYB gene pairs in Populus: evolution and contribution to secondary wall formation and flowering time. J. Exp. Bot. 65, 4255–4269. doi: 10.1093/jxb/eru196
Chang, S., Puryear, J., and Cairney, J. (1993). A simple and efficient method for extracting RNA from pine trees. Plant Mol. Biol. Rep. 11, 113–116. doi: 10.1007/BF02670468
Curtis, M. D., and Grossniklaus, U. (2003). A gateway cloning vector set for high-throughput functional analysis of genes in planta. Plant Physiol. 133, 462–469. doi: 10.1104/pp.103.027979
Dias, A. P., Braun, E. L., McMullen, M. D., and Grotewold, E. (2003). Recently duplicated maize R2R3-MYB genes provide evidence for distinct mechanisms of evolutionary divergence after duplication. Plant Physiol. 131, 610–620. doi: 10.1104/pp.012047
Duval, I., Lachance, D., Giguère, I., Bomal, C., Morency, M. J., Pelletier, G., et al. (2014). Large-scale screening of transcription factor-promoter interactions in spruce reveals a transcriptional network involved in vascular development. J. Exp. Bot. 65, 2319–2333. doi: 10.1093/jxb/eru116
Feller, A., Machemer, K., Braun, E. L., and Grotewold, E. (2011). Evolutionary and comparative analysis of MYB and bHLH plant transcription factors. Plant J. 66, 94–116. doi: 10.1111/j.1365-313X.2010.04459.x
Gonzalez, A. (2009). Pigment loss in response to the environment: a new role for the WD/bHLH/MYB anthocyanin regulatory complex. New Phytol. 182, 1–3. doi: 10.1111/j.1469-8137.2009.02771.x
Grotewold, E. (2005). Plant metabolic diversity: a regulatory perspective. Trends Plant Sci. 10, 57–62. doi: 10.1016/j.tplants.2004.12.009
Guillet-Claude, C., Isabel, N., Pelgas, B., and Bousquet, J. (2004). The evolutionary implications of knox-I gene duplications in conifers: correlated evidence from phylogeny, gene mapping, and analysis of functional divergence. Mol. Biol. Evol. 21, 2232–2245. doi: 10.1093/molbev/msh235
Hammer, Ø., Harper, D. A. T., and Ryan, P. D. (2001). “Past: paleontological statistics software package for education and data analysis,” in Palaeontologia Electronica, Vol. 4, ed J. Louys (California, CA: Coquina Press), 1–9.
Hammerbacher, A., Paetz, C., Wright, L. P., Fischer, T. C., Bohlmann, J., Davis, A. J., et al. (2014). Flavan-3-ols in Norway spruce: biosynthesis, accumulation, and function in response to attack by the bark beetle-associated fungus Ceratocystis polonica. Plant Physiol. 164, 2107–2122. doi: 10.1104/pp.113.232389
Heim, M. A., Jakoby, M., Werber, M., Martin, C., Weisshaar, B., and Bailey, P. C. (2003). The basic helix-loop-helix transcription factor family in plants: a genome-wide study of protein structure and functional diversity. Mol. Biol. Evol. 20, 735–747. doi: 10.1093/molbev/msg088
Högberg, K. A., Ekberg, I., Norell, L., and von Arnold, S. (1998). Integration of somatic embryogenesis in a tree breeding programme: a case study with Picea abies. Can. J. For. Res. 28, 1536–1545. doi: 10.1139/x98-137
Innan, H., and Kondrashov, F. (2010). The evolution of gene duplications: classifying and distinguishing between models. Nat. Rev. Genet. 11, 97–108. doi: 10.1038/nrg2689
Koutaniemi, S., Warinowski, T., Kärkönen, A., Alatalo, E., Fossdal, C. G., Saranpää, P., et al. (2007). Expression profiling of the lignin biosynthetic pathway in Norway spruce using EST sequencing and real-time RT-PCR. Plant Mol. Biol. 65, 311–328. doi: 10.1007/s11103-007-9220-5
Lang, D., Weiche, B., Timmerhaus, G., Richardt, S., Riaño-Pachón, D. M., Corrêa, L. G., et al. (2010). Genome-wide phylogenetic comparative analysis of plant transcriptional regulation: a timeline of loss, gain, expansion, and correlation with complexity. Genome Biol. Evol. 2, 488–503. doi: 10.1093/gbe/evq032
Liu, J. J., and Ekramoddoullah, A. K. (2004). Characterization, expression and evolution of two novel subfamilies of Pinus monticola cDNAs encoding pathogenesis-related (PR)-10 proteins. Tree Physiol. 24, 1377–1385. doi: 10.1093/treephys/24.12.1377
Lu, Y., Ran, J. H., Guo, D. M., Yang, Z. Y., and Wang, X. Q. (2014). Phylogeny and divergence times of gymnosperms inferred from single-copy nuclear genes. PLoS ONE 9:e107679. doi: 10.1371/journal.pone.0107679
Lundén, K., Danielsson, M., Durling, M. B., Ihrmark, K., Nemesio Gorriz, M., Stenlid, J., et al. (2015). Transcriptional responses associated with virulence and defence in the interaction between Heterobasidion annosum s.s. and Norway Spruce. PLoS ONE 10:e0131182. doi: 10.1371/journal.pone.0131182
Matsui, K., and Ohme-Takagi, M. (2010). Detection of protein-protein interactions in plants using the transrepressive activity of the EAR motif repression domain. Plant J. 61, 570–578. doi: 10.1111/j.1365-313X.2009.04081.x
Matus, J. T., Poupin, M. J., Cañón, P., Bordeu, E., Alcalde, J. A., and Arce-Johnson, P. (2010). Isolation of WDR and bHLH genes related to flavonoid synthesis in grapevine (Vitis vinifera L.). Plant Mol. Biol. 72, 607–620. doi: 10.1007/s11103-010-9597-4
Mellway, R. D., Tran, L. T., Prouse, M. B., Campbell, M. M., and Constabel, C. P. (2009). The wound-, pathogen-, and ultraviolet B-responsive MYB134 gene encodes an R2R3-MYB transcription factor that regulates proanthocyanidin synthesis in poplar. Plant Physiol. 150, 924–941. doi: 10.1104/pp.109.139071
Minina, E. A., Filonova, L. H., Fukada, K., Savenkov, E. I., Gogvadze, V., Clapham, D., et al. (2013). Autophagy and metacaspase determine the mode of cell death in plants. J. Cell Biol. 203, 917–927. doi: 10.1083/jcb.201307082
Mukhtar, M. S., Carvunis, A. R., Dreze, M., Epple, P., Steinbrenner, J., Moore, J., et al. (2011). Independently evolved virulence effectors converge onto hubs in a plant immune system network. Science 333, 596–601. doi: 10.1126/science.1203659
Nemesio-Gorriz, M., Hammerbacher, A., Ihrmark, K., Källman, T., Olson, Å., Lascoux, M., et al. (2016). Different Alleles of a Gene Encoding Leucoanthocyanidin Reductase (PaLAR3) Influence Resistance Against the Fungus Heterobasidion Parviporum in Picea Abies. Ph.D. thesis.
Nesi, N., Jond, C., Debeaujon, I., Caboche, M., and Lepiniec, L. (2001). The Arabidopsis TT2 gene encodes an R2R3 MYB domain protein that acts as a key determinant for proanthocyanidin accumulation in developing seed. Plant Cell 13, 2099–2114. doi: 10.1105/TPC.010098
Nystedt, B., Street, N. R., Wetterbom, A., Zuccolo, A., Lin, Y. C., Scofield, D. G., et al. (2013). The Norway spruce genome sequence and conifer genome evolution. Nature 497, 579–584. doi: 10.1038/nature12211
Park, K. I (2012). A bHLH protein partially controls proanthocyanidin and phytomelanin pigmentation in the seed coats of morning glory Ipomoea tricolor. Hortic. Environ. Biotechnol. 53, 304–309. doi: 10.1007/s13580-012-0006-6
Park, K. I., Morita, Y., Ishikawa, N., Choi, J. D., Hoshino, A., and Iida, S. (2007). A bHLH regulatory gene controls pigmentation of both flower and seed, and seed trichome formation in the common morning glory. Plant Cell Physiol. 48, S66–S66. doi: 10.1111/j.1365-313X.2006.02988.x
Pattanaik, S., Xie, C. H., and Yuan, L. (2008). The interaction domains of the plant Myc-like bHLH transcription factors can regulate the transactivation strength. Planta 227, 707–715. doi: 10.1007/s00425-007-0676-y
Paz-Ares, J., Ghosal, D., Wienand, U., Peterson, P. A., and Saedler, H. (1987). The regulatory c1 locus of Zea mays encodes a protein with homology to MYB proto-oncogene products and with structural similarities to transcriptional activators. EMBO J. 6, 3553–3558.
Pesch, M., Schultheiß, I., Klopffleisch, K., Uhrig, J. F., Koegl, M., Clemen, C. S., et al. (2015). TRANSPARENT TESTA GLABRA1 and GLABRA1 compete for binding to GLABRA3 in Arabidopsis. Plant Physiol. 168, 584–597. doi: 10.1104/pp.15.00328
Pfaffl, M. W., Horgan, G. W., and Dempfle, L. (2002). Relative expression software tool (REST©) for group-wise comparison and statistical analysis of relative expression results in real-time PCR. Nucleic Acids Res. 30:e36. doi: 10.1093/nar/30.9.e36
Pires, N., and Dolan, L. (2010). Origin and diversification of basic-helix-loop-helix proteins in plants. Mol. Biol. Evol. 27, 862–874. doi: 10.1093/molbev/msp288
Ramsay, N. A., and Glover, B. J. (2005). MYB-bHLH-WD40 protein complex and the evolution of cellular diversity. Trends Plant Sci. 10, 63–70. doi: 10.1016/j.tplants.2004.12.011
Richard, S., Lapointe, G., Rutledge, R. G., and Séguin, A. (2000). Induction of chalcone synthase expression in white spruce by wounding and jasmonate. Plant Cell Physiol. 41, 982–987. doi: 10.1093/pcp/pcd017
Rigault, P., Boyle, B., Lepage, P., Cooke, J. E., Bousquet, J., and MacKay, J. J. (2011). A white spruce gene catalog for conifer genome analyses. Plant Physiol. 157, 14–28. doi: 10.1104/pp.111.179663
Savard, L., Li, P., Strauss, S. H., Chase, M. W., Michaud, M., and Bousquet, J. (1994). Chloroplast and nuclear gene sequences indicate late Pennsylvanian time for the last common ancestor of extant seed plants. Proc. Natl. Acad. Sci. U.S.A. 91, 5163–5167. doi: 10.1073/pnas.91.11.5163
Schaart, J. G., Dubos, C., Romero De La Fuente, I. R., van Houwelingen, A. M. M. L., de Vos, R. C. H., Jonker, H. H., et al. (2013). Identification and characterization of MYB-bHLH-WD40 regulatory complexes controlling proanthocyanidin biosynthesis in strawberry (Fragaria x ananassa) fruits. New Phytol. 197, 454–467. doi: 10.1111/nph.12017
Schwinn, K. E., Boase, M. R., Bradley, J. M., Lewis, D. H., Deroles, S. C., Martin, C. R., et al. (2014). MYB and bHLH transcription factor transgenes increase anthocyanin pigmentation in petunia and lisianthus plants, and the petunia phenotypes are strongly enhanced under field conditions. Front. Plant Sci. 5:603. doi: 10.3389/fpls.2014.00603
Shiu, S.-H., Shih, M.-C., and Li, W.-H. (2005). Transcription factor families have much higher expansion rates in plants than in animals. Plant Physiol. 139, 18–26. doi: 10.1104/pp.105.065110
Singh, K. B. (1998). Transcriptional regulation in plants: the importance of combinatorial control. Plant Physiol. 118, 1111–1120. doi: 10.1104/pp.118.4.1111
Soler, M., Camargo, E. L., Carocha, V., Cassan-Wang, H., San Clemente, H., Savelli, B., et al. (2015). The Eucalyptus grandis R2R3-MYB transcription factor family: evidence for woody growth-related evolution and function. New Phytol. 206, 1364–1377. doi: 10.1111/nph.13039
Stracke, R., Ishihara, H., Huep, G., Barsch, A., Mehrtens, F., Niehaus, K., and Weisshaar, B. (2007). Differential regulation of closely related R2R3-MYB transcription factors controls flavonol accumulation in different parts of the Arabidopsis thaliana seedling. Plant J. 50, 660–677. doi: 10.1111/j.1365-313X.2007.03078.x
Stracke, R., Werber, M., and Weisshaar, B. (2001). The R2R3-MYB gene family in Arabidopsis thaliana. Curr. Opin. Plant Biol. 4, 447–456. doi: 10.1016/S1369-5266(00)00199-0
Tamura, K., Stecher, G., Peterson, D., Filipski, A., and Kumar, S. (2013). MEGA6: molecular evolutionary genetics analysis version 6.0. Mol. Biol. Evol. 30, 2725–2729. doi: 10.1093/molbev/mst197
Terrier, N., Torregrosa, L., Ageorges, A., Vialet, S., Verries, C., Cheynier, V., et al. (2009). Ectopic expression of VvMybPA2 promotes proanthocyanidin biosynthesis in grapevine and suggests additional targets in the pathway. Plant Physiol. 149, 1028–1041. doi: 10.1104/pp.108.131862
Toledo-Ortiz, G., Huq, E., and Quail, P. H. (2003). The Arabidopsis basic/helix-loop-helix transcription factor family. Plant Cell 15, 1749–1770. doi: 10.1105/tpc.013839
Tominaga-Wada, R., Ishida, T., and Wada, T. (2011). New insights into the mechanism of development of Arabidopsis root hairs and trichomes. Int. Rev. Cell Mol. Biol. 286, 67–106. doi: 10.1016/B978-0-12-385859-7.00002-1
Tominaga-Wada, R., and Wada, T. (2014). Regulation of root hair cell differentiation by R3 MYB transcription factors in tomato and Arabidopsis. Front. Plant Sci. 5:91. doi: 10.3389/fpls.2014.00091
Treutter, D. (2005). Significance of flavonoids in plant resistance and enhancement of their biosynthesis. Plant Biol. 7, 581–591. doi: 10.1055/s-2005-873009
Vestman, D., Larsson, E., Uddenberg, D., Cairney, J., Clapham, D., Sundberg, E., et al. (2011). Important processes during differentiation and early development of somatic embryos of Norway spruce as revealed by changes in global gene expression. Tree Genet. Genomes 7, 347–362. doi: 10.1007/s11295-010-0336-4
von Arnold, S., and Eriksson, T. (1981). In vitro studies of adventitious shoot formation in Pinus contorta. Can. J. Bot. 59, 870–874. doi: 10.1139/b81-121
Wadke, N., Kandasamy, D., Vogel, H., Lah, L., Wingfield, B. D., Paetz, C., et al. (2016). The bark-beetle-associated fungus, Endoconidiophora polonica, utilizes the phenolic defense compounds of its host as a carbon source. Plant Physiol. 171, 914–931. doi: 10.1104/pp.15.01916
Xu, W., Dubos, C., and Lepiniec, L. (2015). Transcriptional control of flavonoid biosynthesis by MYB–bHLH–WDR complexes. Trends Plant Sci. 20, 176–185. doi: 10.1016/j.tplants.2014.12.001
Xue, B., Charest, P. J., Devantier, Y., and Rutledge, R. G. (2003). Characterization of a MYB-R2R3 gene from black spruce (Picea mariana) that shares functional conservation with maize C1. Mol. Genet. Genomics 270, 78–86. doi: 10.1007/s00438-003-0898-z
Yoshida, K., Iwasaka, R., Kaneko, T., Sato, S., Tabata, S., and Sakuta, M. (2008). Functional differentiation of Lotus japonicus TT2s, R2R3-MYB transcription factors comprising a multigene family. Plant Cell Physiol. 49, 157–169. doi: 10.1093/pcp/pcn009
Yoshida, K., Kume, N., Nakaya, Y., Yamagami, A., Nakano, T., and Sakuta, M. (2010). Comparative analysis of the triplicate proathocyanidin regulators in Lotus japonicus. Plant Cell Physiol. 51, 912–922. doi: 10.1093/pcp/pcq067
Zhao, K., and Bartley, L. E. (2014). Comparative genomic analysis of the R2R3 MYB secondary cell wall regulators of Arabidopsis, poplar, rice, maize, and switchgrass. BMC Plant Biol. 14:135. doi: 10.1186/1471-2229-14-135
Keywords: MYB, Picea, yeast two-hybrid, TT2, TT8, TTG1, flavonoid
Citation: Nemesio-Gorriz M, Blair PB, Dalman K, Hammerbacher A, Arnerup J, Stenlid J, Mukhtar SM and Elfstrand M (2017) Identification of Norway Spruce MYB-bHLH-WDR Transcription Factor Complex Members Linked to Regulation of the Flavonoid Pathway. Front. Plant Sci. 8:305. doi: 10.3389/fpls.2017.00305
Received: 11 November 2016; Accepted: 20 February 2017;
Published: 09 March 2017.
Edited by:
Kevin Davies, Plant & Food Research Auckland, New ZealandReviewed by:
Concepcion Avila, University of Málaga, SpainNobutaka Mitsuda, National Institute of Advanced Industrial Science and Technology, Japan
Copyright © 2017 Nemesio-Gorriz, Blair, Dalman, Hammerbacher, Arnerup, Stenlid, Mukhtar and Elfstrand. This is an open-access article distributed under the terms of the Creative Commons Attribution License (CC BY). The use, distribution or reproduction in other forums is permitted, provided the original author(s) or licensor are credited and that the original publication in this journal is cited, in accordance with accepted academic practice. No use, distribution or reproduction is permitted which does not comply with these terms.
*Correspondence: Miguel Nemesio-Gorriz, bWFsaW4uZWxmc3RyYW5kQHNsdS5zZQ==
†Present Address: Kerstin Dalman, Department of Molecular Sciences, Swedish University of Agricultural Sciences, Uppsala, Sweden