 Honglei Zheng
 Liqiang Fan
 Richard I. Milne2
 Kangshan Mao
- 1MOE Key Laboratory of Bio-Resources and Eco-Environment, College of Life Science, Sichuan University, Chengdu, China
- 2Institute of Molecular Plant Sciences, School of Biological Sciences, University of Edinburgh, Edinburgh, UK
- 3Life Science and Engineering College, Northwest University for Nationalities, Lanzhou, China
Species delimitation in tree species is notoriously challenging due to shared polymorphisms among species. An integrative survey that considers multiple operational criteria is a possible solution, and we aimed to test it in a species complex of aspens in China. Genetic [four chloroplast DNA (cpDNA) fragments and 14 nuclear microsatellite loci (nSSR)] and morphological variations were collected for 76 populations and 53 populations, respectively, covering the major geographic distribution of the Populus davidiana-rotundifolia complex. Bayesian clustering, analysis of molecular variance (AMOVA), Principle Coordinate Analysis (PCoA), ecological niche modeling (ENM), and gene flow (migrants per generation), were employed to detect and test genetic clustering, morphological and habitat differentiation, and gene flow between/among putative species. The nSSR data and ENM suggested that there are two separately evolving meta-population lineages that correspond to P. davidiana (pd) and P. rotundifolia (pr). Furthermore, several lines of evidence supported a subdivision of P. davidiana into Northeastern (NEC) and Central-North (CNC) groups, yet they are still functioning as one species. CpDNA data revealed that five haplotype clades formed a pattern of [pdNEC, ((pdCNC, pr), (pdCNC, pr))], but most haplotypes are species-specific. Meanwhile, PCA based on morphology suggested a closer relationship between the CNC group (P. davidiana) and P. rontundifolia. Discrepancy of nSSR and ENM vs. cpDNA and morphology could have reflected a complex lineage divergence and convergence history. P. davidiana and P. rotundifolia can be regarded as a recently diverged species pair that experienced parapatric speciation due to ecological differentiation in the face of gene flow. Our findings highlight the importance of integrative surveys at population level, as we have undertaken, is an important approach to detect the boundary of a group of species that have experienced complex evolutionary history.
Introduction
Species is a fundamental unit of biology, but there has been much debate about how to define species (e.g., Sites and Marshall, 2003; De Queiroz, 2007). During the last decade, great efforts have been made to delimit plant species based on DNA sequence variation (Kress et al., 2005; China Plant BOL Group et al., 2011; CBOL Plant Working Group et al., 2009), yet species delimitation between closely related plant species remains a challenge (Naciri and Linder, 2015). Speciation is a temporally extended process, typically requiring millions of years before total reproductive isolation is achieved (Coyne and Orr, 2004; Seehausen et al., 2014). During speciation, divergence does not happen at an even rate across the genome, because of selection, genetic drift, reinforcement (if sympatric), and varying mutation rates between DNA regions (Noor and Feder, 2006; Nosil et al., 2009; Nosil and Feder, 2012; Abbott et al., 2013).
Of particular concern to efforts to delimit plant species based on DNA markers is lineage sorting (Naciri and Linder, 2015). Lineage sorting ultimately renders diverging species reciprocally monophyletic for genetic markers, but until this process is completed, one or both species may appear non-monophyletic for some DNA markers, even if they have achieved complete reproductive isolation (Shaffer and Thomson, 2007; Freeland et al., 2011).
Species need not be completely reproductively isolated, provided there is some ecological separation (Feder et al., 2012); indeed a unifying concept defining species as separately evolving meta-population lineages is now widely accepted (De Queiroz, 2007; Fujita et al., 2012; Su et al., 2015). Hence interspecific gene flow (i.e., introgression) can, like incomplete lineage sorting, also lead to shared polymorphisms between closely related species (Degnan and Rosenberg, 2009). Given that ecological niches commonly overlap within plants, there is no single operational criterion that can consistently reveal true boundaries between closely related species (Givnish, 2010). A potential solution to this is to simultaneously evaluate multiple operational criteria, for example reciprocally monophyletic haplotypes or genotypes, reproductive isolation, ecological divergence, and distinct morphology (De Queiroz, 2007; Bond and Stockman, 2008; Fujita et al., 2012; Su et al., 2015); boundaries between species will be found where these criteria are largely in agreement (e.g., Leaché et al., 2009; Satler et al., 2013; Su et al., 2015).
For trees, species delimitation is notoriously difficult. Factors such as long generation time and large effective population sizes may slow down lineage sorting (Rosenberg, 2003; Daïnou et al., 2014), and this plus frequent introgression increases the chance of shared polymorphisms of markers or traits (Freeland et al., 2011; Jones et al., 2013). High levels of intraspecific morphological variation may further obscure species boundaries, e.g., in Abies, Eucalyptus, Picea, Pinus, and Populus (Wang et al., 2011a; Feng et al., 2013; Hernández-León et al., 2013; Jones et al., 2013; Sun et al., 2014).
The genus Populus L. (Poplars, Salicaceae) is widely distributed in the Northern Hemisphere (Bradshaw et al., 2000; Hamzeh and Dayanandan, 2004; Cervera et al., 2005), and plays an important ecological role in boreal and temperate forests, serving as wildlife habitats and watersheds; they can dominate riparian forests, but are ecologically adaptable (Braatne et al., 1992; Dickmann, 2001). In addition, they are widely cultivated for their wood (Dickmann and Stuart, 1983; Stettler et al., 1996; Heilman, 1999). However, due to high levels of morphological variation and extensive interspecific hybridization, species delimitation within Populus is highly contentious (Eckenwalder, 1996; Hamzeh and Dayanandan, 2004; Fladung and Buschbom, 2009; Schroeder et al., 2012). The number of proposed species in Populus has ranged from 22 to 85, plus hundreds of hybrids, varieties and cultivars (Eckenwalder, 1977, 1996; Dickmann and Stuart, 1983; Hamzeh and Dayanandan, 2004). Various markers have been tested for use in differentiating species, hybrids, and even clones of Populus, i.e., nuclear DNA fragments, simple sequence repeats (SSRs), amplified fragment-length polymorphisms (AFLPs), chloroplast DNA fragments, and mitochondrial DNA fragments (Cervera et al., 2005; Smulders et al., 2008; Feng et al., 2013; Wan et al., 2013). Based on a sample of 95 individuals from 21 native Chinese Populus species, it was found that the sharing of chloroplast haplotypes and nuclear genotypes among closely related species is common (Feng et al., 2013). From this, Populus in China might better be regarded as a series of species complexes, i.e., groups of closely related species that are difficult to differentiate and may still exchange some germplasm. Species complexes could be separated from one another relatively easily using sparse sampling and a universal DNA barcode, but species delimitation within a species complex would require dense, population-level sampling, and highly variable markers (Feng et al., 2013).
The P. davidiana-rotundifolia complex, within section Populus, comprises P. davidiana and P. rotundifolia (Fang et al., 1999). Populus davidiana occurs in northern and central parts of China, plus Mongolia, Korea, and the Far East of Russia. Populus rotundifolia occurs in southwestern China, specifically the southeastern Qinghai-Tibetan Plateau, the Hengduan Mountains, and the Yunnan-Guizhou Plateau; also Bhutan (Fang et al., 1999). Where allopatric, the two species differ consistently in subtle morphological traits (see Table S1). However, transitional morphological traits blur the distinction between them where their ranges meet, i.e., the eastern Qinghai-Tibetan Plateau to central China. Based on 14 individuals, these two species together formed a monophyletic group for cpDNA and were identical for nuclear ITS (Feng et al., 2013); they were shown to be closely related to each other in phylogenetic and population genetic studies (Wang Z. et al., 2014; Du et al., 2015).
In the current study, we sought to identify independent evolutionary lineages within the P. davidiana-rotundifolia complex. We surveyed and analyzed genetic variation of four chloroplast DNA (cpDNA) regions and 14 nuclear microsatellite loci (nSSR) for 375 individuals from 76 populations, and conducted morphometric analyses of leaf traits for representative populations across the distribution range of P. davidiana and P. rotundifolia. Subsequently, Bayesian clustering of nSSR genotypes were adopted to differentiate separate evolutionary lineages, Principal Component Analysis (PCA) was used to examine morphological variation across lineages, a maximum likelihood model (MIGRATE) was employed to assess gene flow between/among lineages, and ecological niche modeling was conducted to quantify niche differentiation between/among lineages. We aimed to address the following questions: (1) How many species are there in the P. davidiana-rotundifolia complex using an integrative survey, e.g., genetic variation, morphological variation and ecological divergence? (2) What lineage separation history has the species complex experienced?
Materials and Methods
Sample Collection
Populations of the Populus davidiana-rotundifolia complex were sampled throughout its geographical distribution in China. We sampled a total of 375 trees from 76 populations. From 3 to 5 trees at least 100 m apart in each population, leaf samples were taken and dried immediately in silica gel for DNA extraction. No population was encountered that appeared to contain both P. davidiana and P. rotundifolia. Latitude, longitude, and altitude for each sampled population were recorded using an Etrex GIS monitor (Garmin, Taiwan; Table S2; Figure 1).
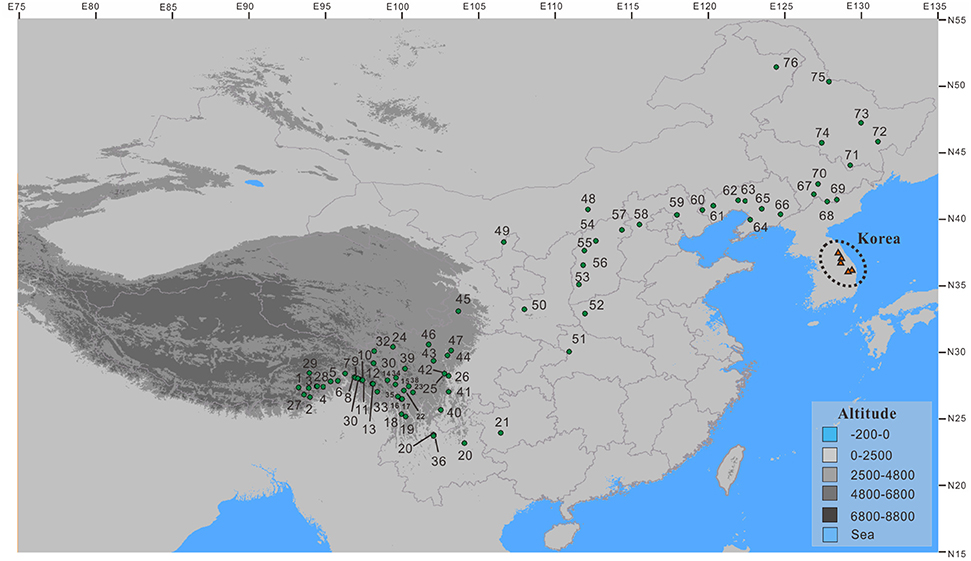
Figure 1. The sampling sites for the Populus davidiana-rotundifolia complex (small green circles) in China. Red triangles represent the five populations from Korea (Lee et al., 2011) that were included in ecological niche modeling.
DNA Isolation, PCR, Genotyping, and Sequencing
Total genomic DNA was isolated from each individual using the hexadecyltrimethyl ammonium bromide (CTAB) method (Doyle and Doyle, 1987), following the modifications of Su et al. (2015). The total genomic DNA was then subject to nSSR genotyping and cpDNA fragments sequencing. A total of 16 SSRs primers were developed based on the genome sequences of Populus euphratica Oliv. and P. trichocarpa Torr. using the MIcroSAtellite (MISA) program (Thiel et al., 2003; Ma et al., 2013; Jiang et al., 2016); these were used to genotype each individual (see Table S3A for details of each SSR primer pair). The PCRs were performed in a volume of 25 ml, which contained: 50–100 ng diluted genomic DNA, 0.5 mM of each dNTP, 0.5 μl of each primer, 2.5 μl 10 × Taq buffer and 0.5 unit of Taq polymerase (Vazyme Biotech, Nanjing, China). The PCR program used was: initially a single cycle at 95°C for 5 min, followed by 36 cycles at 95°C for 45 s, 55°C for 40 s, and 72°C for 80 s, with a final extension at 72°C for 10 min. The PCR products were checked on 1% agarose gels and sent to Honor Tech (Beijing, China) for nSSR genotyping. Allele sizes for each nSSR locus were analyzed with GeneMarker version 2.2.0 (Softgenetics, Pennsylvania, USA).
We also sequenced four chloroplast DNA (cpDNA) fragments: matK, trnG-psbK, psbK-psbI, and ndhC-trnV, for three individuals from each sampled population; in addition, one individual of P. adenopoda was sequenced as outgroup. Primers for the ndhC-trnV fragment were designed according to the complete chloroplast genomes of P. rotundifolia (GenBank accession number KX425853; Zheng et al., 2016) and P. alba (GenBank accession number AP008956; Okumura et al., 2006; Table S3B). Primers for the other cpDNA fragments were taken from Feng et al. (2013) (Table S3B). Protocols for all cpDNA PCRs followed Schroeder et al. (2012) and the China Plant BOL Group et al. (2011). The PCR products were checked with 1% agarose gels and sent to Tsingke Biological Technology (Beijing, China) for DNA sequencing.
Nuclear Microsatellite Data: Genetic Diversity and Population Structure
Steps were taken to minimize two types of potential error at each nSSR locus. First, the effective allele sizes that are generated by ABI sequencers may often be longer or shorter than the true allele size. Therefore, we used the Program FlexiBin (Amos et al., 2007) to automate the binning of nSSR alleles in order to obtain accurate genotyping results. Second, null alleles are alleles that fail to amplify in a PCR (Oddou-Muratorio et al., 2009); these are common in microsatellites. The inclusion of null alleles in population genetic analyses can lead to false results, e.g., an apparent excess of the proportion of homozygous genotypes within a population as compared to the expected proportion under Hardy–Weinberg equilibrium (Paetkau and Strobeck, 1995). Therefore, we checked for null alleles using CERVUS version 3.0 (Kalinowski et al., 2007; http://www.fieldgenetics.com). Two SSR loci that showed high null allele frequencies (GCPM_126, PeuSSR_4817; p > 0.40; Dakin and Avise, 2004) were excluded from all subsequent analyses.
Since all population genetic analyses will require a delimitation of separate evolutionary lineages, we first conducted a Bayesian clustering approach implemented in STRUCTURE version 2.3.4 (Pritchard et al., 2000) to infer the number of randomly mating groups in the P. davidiana-rotundifolia complex. STRUCTURE simulations were run, using the admixture model separately with each of correlated allele frequencies and independent allele frequencies (Miao et al., 2013; Havrdová et al., 2015; Zeng et al., 2015), under K-values from 1 to 8. Each simulation had 20 independent repeats, and comprised a burn-in of 500,000 steps followed by 1,500,000 MCMC (Monte Carlo Markov Chain) steps. The optimal value of K was determined using the method of Pritchard et al. (2000) and Evanno et al. (2005). To visualize the STRUCTURE output, we used Structure Harvester (http://taylor0.biology.ucla.edu/structureHarvester/; Earl and von Holdt, 2012). To cross-validate the results of STRUCTURE, we also conducted a Principal Coordinates Analysis (PCoA) on the nSSR data using GenAlEx version 6.5 (Peakall and Smouse, 2012).
Having identified separate groupings, here termed evolutionary lineages (i.e., potential species), using STRUCTURE, we conducted a series analyses. Genetic diversity indices were estimated in GenAlEx version 6.5 (Peakall and Smouse, 2012), for each population in each presumed evolutionary lineage across all SSR loci. For each nSSR locus, descriptive statistics were assessed by estimating the average number of alleles (Aa), effective number of alleles (Ae), observed heterozygosity (Ho), expected heterozygosity (He), Shannon's information index (I) (Lewontin, 1972), Nei's (1973) expected heterozygosity, and F-statistics (Wright, 1965, 1978).
The distribution of genetic variation was examined using analysis of molecular variance (AMOVA) as implemented in ARLEQUIN version 3.0 (Excoffier et al., 2005), with significance tests based on 1,000 permutations. Genetic variation was hierarchically partitioned into three levels: among evolutionary lineages, among populations within evolutionary lineage, and within populations.
To test the significance of isolation by distance, we performed a Mantel test on the matrix of genetic distances and the matrix of geographical distances between populations with 1,000 random permutations, using GenAlEx version 6.5 (Peakall and Smouse, 2012). This was done separately for each evolutionary lineage, and for all samples grouped as one species complex.
CpDNA Data: Genetic Variation and Phylogeographic Structure
Sequences were edited and aligned with ClustalW in MEGA 5 (Tamura et al., 2011) with subsequent manual adjustments. All sequences were then deposited in GenBank (Accession Numbers: KY285968–KY285983, KY285946–KY285967). Haplotypes and variable sites were identified in DnaSP v5 (Librado and Rozas, 2009), and indels were coded as single binary characters using Gapcoder (Young and Healy, 2003). Network version 4.2.0.1 (Bandelt et al., 1999) was then used to construct the network of relationships between haplotypes according to the median-joining model. Additionally, a phylogenetic tree of haplotypes was constructed based on cpDNA sequences using Bayesian method. Bayesian analysis was conducted using the parallel version of MrBayes 3.2 (Ronquist et al., 2012). MrBayes was run for 10,000,000 generations, sampling and printing every 1,000 generations. Two independent Markov chain Monte Carlo (MCMC) chains runs with four chains (one cold and three hot) were conducted per Bayesian analysis. Subsequently, genetic diversity was estimated, including haplotype diversity (Hd) and nucleotide diversity (πs) at the species and the population level respectively using DNASP v5. Furthermore, using 1,000 permutations within PERMUT (available at: http://www.pierroton.inra.fr/genetics/labo/Software/PermutCpSSR) we estimated the population differentiation coefficients GST and NST, the total genetic diversity (HT), and average genetic diversity within population (HS). A significantly larger NST than GST implies the presence of significant phylogeographic structure (Pons and Petit, 1996). Finally, a hierarchical analysis of genetic differentiation for cpDNA was examined between and within the evolutionary lineages by analysis of molecular variance (AMOVA) as implemented in ARLEQUIN version 3.0 (Excoffier et al., 2005), with significance tests based on 1,000 permutations.
Examination of Gene Flow between the Two Evolutionary Lineages
Based on nSSR variation, cpDNA variation, and previous phylogeographic hypotheses (Guo et al., 2014; Liu et al., 2014; Bai et al., 2016), we divided populations of the species complex into three range sectors to aid analysis: Southwestern China (“SWC”, P1–P42), Central-North China (“CNC”, P43–P60), and Northeastern China (“NEC”, P61–P76; Table S2; Figure 6B). Historical gene flow among different evolutionary lineages and range sectors of the P. davidiana-rotundifolia complex was assessed using the software package MIGRATE version 3.2.6 (Beerli, 2006). The amount of immigrants received per generation from neighboring populations and direction of gene flow was estimated from the nSSR data by calculating mutation-scaled effective population sizes (θ = 4Neμ) and mutation-scaled migration rates (M = m/μ), under an assumption that θ is variable between/among populations and M is symmetric between any pair of populations. We adopted the mutation rate of 10−3 per gamete per generation in Populus (Lexer et al., 2005), and applied the continuous Brownian motion model. We used uniform priors for both effective population size (θ = 4Neμ) and mutation-scaled migration (M = m/μ) with ranges (0, 0.05) and (0, 5,000), respectively. The initial 100,000 steps were discarded as burn-in, and followed by two long chains of 10,000,000 steps, with sampling every 100 steps, under a constant mutation model. After checking for data convergence from two parallel runs, we estimated for each parameter the mode, mean, median, and 95% highest posterior density (HPD) values. The MIGRATE analyses were evaluated based on effective sampling size as well as the posterior distribution of each parameter.
Ecological Niche Modeling
To determine the degree of ecological divergence between the evolutionary lineages comprising the P. davidiana-rotundifolia complex, we employed ecological niche modeling (ENM) to predict their potential distribution at present, during the Middle Holocene [MH, ca. 6,000 years ago (Kya) before present] and the last glacial maximum (LGM, ca. 21 to 18 Kya before present). To model the ecological niches of each evolutionary lineage, the maximum entropy machine-learning algorithm was implemented in MAXENT v3.3.3 software package (Phillips et al., 2006; Pearson et al., 2007; Phillips and Dudík, 2008). All 76 locilities of occurence, from our field survey dataset (Table S2) were assigned to lineages and range sectors according to our DNA analyses, creating a subset of occurrence points for each lineage and range sector. Because the northwestern part of the range of the P. davidiana-rotundifolia complex contained only one genealogical cluster from the STRUCTURE analysis when K = 2, five additional records from Korea (Table S4; Lee et al., 2011) were assumed to belong to this lineage, and used to provide additional presence points for it.
For each of the three periods, 20 environmental variables (altitude and 19 bioclimatic variables) were downloaded from WorldClim database (Hijmans et al., 2005). Data layers were of 2.5 arc-min spatial resolutions. To avoid contradiction between different global climate models during the MH (CCSM4, MIROC-ESM, MPI-ESM-P, and the other six models available at the WorldClim database) and the LGM (CCSM4, MIROC-ESM, MPI-ESM-P), we generated average-over-pixel bioclimatic variables for these two periods using DIVA-GIS 7.5 (http://www.diva-gis.org/; Hijmans et al., 2001). To reduce over-fitting of ecological niche modeling, we conducted Pearson correlation for environmental variables using the methods of Sheppard (2013). Any environmental variable that possessed pairwise Pearson correlation (with any other variable) greater than 0.75 with two or more other environmental variables was excluded; this reduced to 10 the number of environmental variables. These 10 (Table S5) were used to model the distributional ranges of each evolutionary lineage.
ENMs were constructed according to the present-day environmental layers and then projected onto the MH and the LGM periods. The maximum entropy model was simulated for 20 replicates, 80% of the distribution coordinates for training and 20% for testing, and the maximum number of iterations was set to 5,000. The “10 percentile presence” threshold was applied because presence-only data were available. The output format was set to be logistic, and for each grid cell the probability of suitable environmental conditions may range from 0 to 1. DIVA-GIS version 7.5 (Hijmans et al., 2001) was employed to draw the graphics for the potential distributions of niche model for each period.
To evaluate the performance of each niche model, the area under the ROC curve (AUC) can quantify the ability of the model to discriminate between sites with or without the presence of the species in question (Peterson et al., 2008; Elith and Leathwick, 2009). AUC values range from 0 to 1, where a score of 1 indicates perfect discrimination, a score of 0.5 indicates that the model performs no better than random, and scores above 0.7 are considered to indicate good model performance (Fielding and Bell, 1997). We also performed a jackknife test to measure the percent contributions of different environmental variables to model simulations.
To measure niche differences between evolutionary lineages or range sectors, we calculated Schoener's D (Schoener, 1968) and standardized Hellinger distance (calculated as I) in ENMTOOLS version 1.3 (Warren et al., 2008, 2010). Both D and I ranged from 0 (no niche overlap) to 1 (identical niches). We then performed an identity test with 100 replicates to estimate the similarity of the ENMs of the identified evolutionary lineages. The observed niche overlaps were compared with the null distribution, and tested for significance; histograms were drawn using R 2.13 (http://www.r-project.org/).
Detecting the Differentiation of Morphological Traits
Finally, to test whether or not the differentiation of morphological traits corroborates with genetic divergence, we examined a set of morphological traits of leaves and analyzed their pattern of variation. We took images from 252 representative herbarium specimens, gathered from 53 of the sampled populations during fieldwork (23 populations, 118 specimens for P. rotundifolia; 30 populations, 134 specimens for P. davidiana; Figure S1), and transformed every image into a vector diagram using tpsUtil32 software. We recorded the x and y coordinates of 16 landmarks from the leaf blade, and 1 ruler landmark from each image by using TPSDIG (Rohlf, 2001). We implemented morphometrics analyses in MORPHOJ software package, within which a principal component analysis of morphological variations was conducted and plotted (http://www.flywings.org.uk/MorphoJ_page.htm; Klingenberg, 2011).
Results
Population Genetic Diversity and Structure Inferred From Nuclear Microsatellite Markers
We genotyped 16 nSSR loci for 375 sampled individuals from 76 populations of the P. davidiana-rotundifolia complex. Two loci that showed a high frequency of null alleles were eliminated from further analyses. A total of 141 alleles were scored for the remaining 14 loci, and across all populations the number of alleles per locus varied from 4 to 19 alleles, with an average of 10.071 (Table S6). Averaged across all 76 populations, allele number (Aa) was 34.408, effective allele number (Ae) per locus was 1.990, observed heterozygosity (Ho) was 0.390, and expected heterozygosity (He) was 0.376 (Table S7). The fixation index averaged across all loci (average FST = 0.363; Table S6) indicated a pronounced level of genetic differentiation among populations.
Our Bayesian clustering analyses using STRUCTURE with correlated allele frequencies suggested that the optimal number of free mating meta-populations across the 76 sampled populations is two (K = 2). The log-likelihood value reached a plateau after K = 2, although it increased gradually as K raised from 2 to 8; meanwhile, the delta K had a single peak value at K = 2 (Figure 2). When K = 2, the southwestern populations clustered into one group and the northeastern and central populations clustered into the other group, although lineage admixture was observed in a few populations where the distribution of the two lineages overlapped (Figure 3). Similar results were obtained using STRUCTURE with independent allele frequencies (see Figure S2). The PCoA based on genetic distance revealed a clear separation between the same two lineages (Figure 4). Under STRUCTURE analysis with K = 3, southwestern populations remained as one group, whereas the northeastern populations now formed a separate group from the central populations although there was considerable admixture between them (Figure S3).
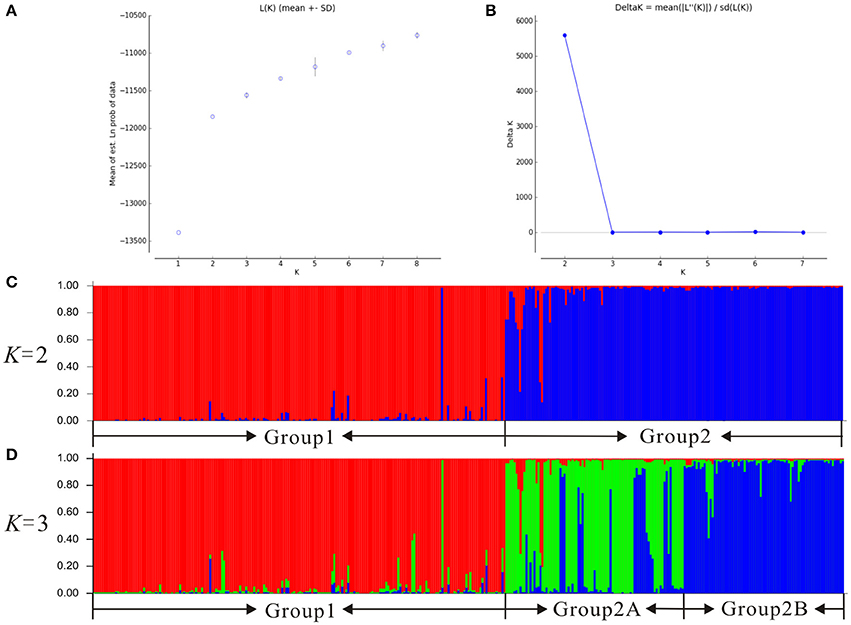
Figure 2. Bayesian clustering plots for 76 populations of the Populus davidiana-rotundifolia complex based on variation at 14 nSSR loci. The optimal K-value was estimated using (A) the posterior probability of the data given each K (20 replicates) (mean ± SD) and (B) the distribution of delta K, the histogram of the STRUCTURE assignment test when (C) K = 2 and (D) K = 3 were presented.
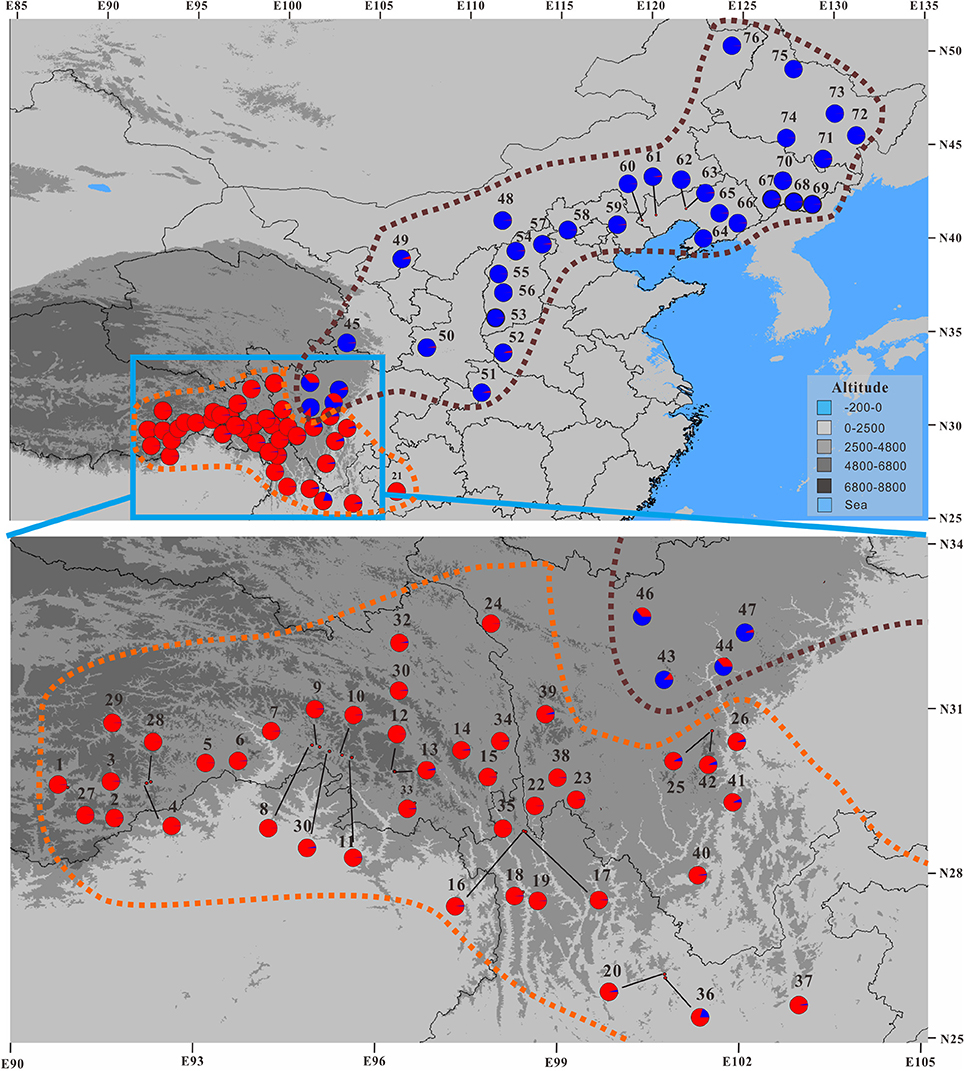
Figure 3. Geographic distribution of nSSR genetic clusters for the 76 populations of the Populus davidiana-rotundifolia complex under the optimal K-value (K = 2) as inferred by STRUCTURE. See Figure 2C for the histogram of STRUCTURE assignment test. Brown and orange dashed lines encompass the putative assignment of populations to P. davidiana and P. rotundifolia, respectively.
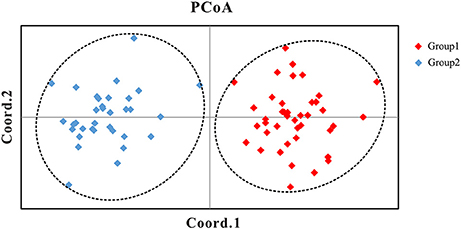
Figure 4. Principal Coordinates Analysis (PCoA) of the 76 populations of the Populus davidiana-rotundifolia complex based on genetic distance using nSSR data. Group 1: the populations in southwestern China (SWC); Group 2: the populations in northeastern (NEC) and central-north China (CNC).
Mantel tests revealed a significant correlation between geographical distance and genetic differentiation across the P. davidiana-rotundifolia complex (r2 = 0.0407, P = 0.01; Figure 5). However, when Mantel tests were applied to each of the two evolutionary lineages separately, no significant correlation between geographic structure and genetic differentiation was detected (southwestern cluster: r2 = 0.0003, P = 0.420; central/northeastern cluster: r2 = 0.0001, P = 0.430). These results suggested that the hierarchical population structure is credible, as geographic isolation may have contributed to differentiation between lineages but not within them.
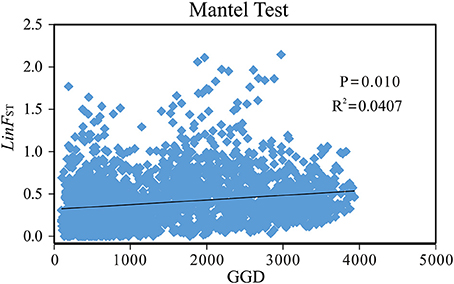
Figure 5. The Mantel Test plotting of genetic distance [y-axis: Linearized FST(LinFST)] vs. geographical distance (x-axis: GGD) for the 76 populations of the Populus davidiana-rotundifolia complex based on nSSR data.
At the same time, AMOVA analyses revealed that 15.58% of genetic variation was attributed to genetic differentiation between the two groups (i.e., evolutionary lineages), 17.47% was due to genetic differentiation among populations within groups, and 66.95% was ascribed to genetic differentiation between individuals within populations (Table 1).
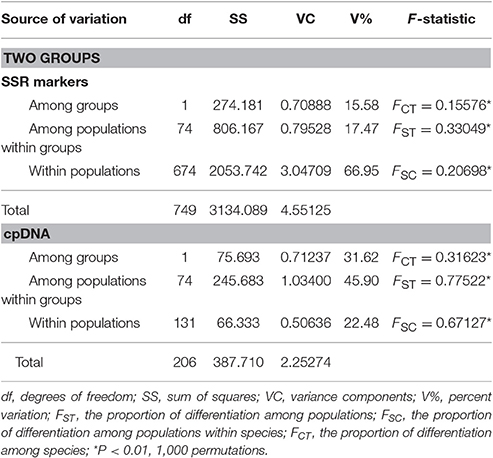
Table 1. Analysis of molecular variance (AMOVA) for the two groups of populations (two putative species, P. davidiana and P. rotundifolia) based on nSSR and cpDNA.
Therefore, the allocation of genetic variation at our 14 sampled nSSR loci suggested that the species complex comprises two separate evolutionary lineages. Since the geographic distributions of them roughly correspond to that of P. davidiana and P. rotundifolia, from here on we will refer to the southwestern populations (SWC sector, and Group 1 in Figures 2–4) as P. rotundifolia, and the northeastern and central populations as P. davidiana (NEC + CNC sectors; Group 2 in Figures 2–4).
Genetic Variation of CpDNA Markers
The total length of the alignment matrix of concatenated cpDNA sequences is 2,113 bp, within which 14 substitutions and 21 indels were detected (Table S8). These polymorphisms differentiated a total of 21 haplotypes (Figure 6), which were clustered into five clades (I–V) according to NETWORK analysis (Figure 6A). Among these, haplotypes H6–H12 were present only in the populations of P. rotundifolia; these form subgroups III and IV in the network analysis, which occur only in the SWC range sector (Figure 6). Likewise haplotypes H18–H21 form Group I, a monophyletic clade present only in the NEC range sector of P. davidiana. The other two groups, II and V, each formed monophyletic clades, but were shared between evolutionary lineages. Group V comprised five haplotypes (H13–H17), of which four H13–H16 were present in P. davidiana's CNC range sector, whereas H17 was only in the westernmost edge of the NEC range sector. Notably, H13 also occurred disjunctly in the southern part of P. rotundifolia's range (Figure 6; Figure S4). Group II likewise occurred mainly in the western part of P. davidiana's range; but was also in three populations of P. rotundifolia. Among the haplotype groups, I is basal, Group V is derived from Group IV, and these two together are sister to a clade wherein Group II is sister to Group III (Figure 6B). Bayesian analysis also supported the basal position of Group I, but could not resolve relationships among the other four groups (Figure S5).
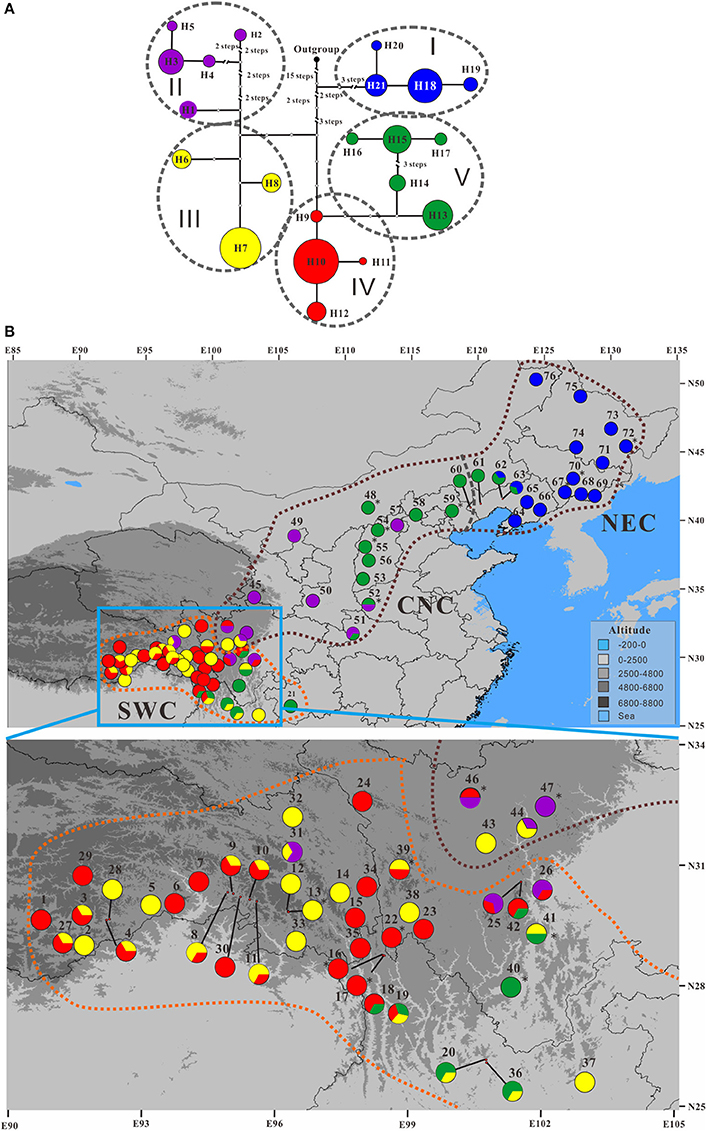
Figure 6. The (A) minimum spanning network showing the phylogenetic relationships among the 21 chloroplast DNA (cpDNA) haplotypes in the Populus davidiana-rotundifolia complex and (B) their geographic distribution pattern. Colors of these haplotypes in any of the five haplotype groups are identical. Population codes are identified in Table S2. In (A), the black dot represents an outgroup haplotype from P. adenopoda that was involved as outgroup for rooting purpose; each circle represents a haplotype and circle sizes are proportional to the number of samples per haplotype; oval black dashed lines encompass haplotypes representing the five cpDNA haplotype groups. Brown and orange dashed lines in (B) delineate P. davidiana and P. rotundifolia, and gray dashed line in (B) delineate the Central-North China (CNC) and Northeastern China (NEC) regions within P. davidiana.
A significant phylogeographic structure was detected for cpDNA across the whole species complex, as well as within each of P. davidiana and P. rotundifolia individually (NST > GST, P < 0.05; Pons and Petit, 1996; Table 2), reflecting that genetic closely related haplotypes tend to occur in adjacent areas (Figure 6). Furthermore, AMOVA analyses of the cpDNA sequence dataset revealed a high FCT value, which indicated significant differentiation between P. davidiana and P. rotundifolia (FCT = 0.3162, P < 0.01; Table 1), although the percentage of variation among populations within evolutionary lineages (45.90%) is higher than variation between evolutionary lineages (31.62%).
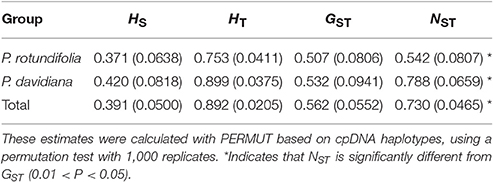
Table 2. Estimates of average gene diversity within populations (HS), total gene diversity (HT), inter-population differentiation considering only haplotype frequency (GST), and inter-population differentiation considering both haplotype frequency and phylogenetic relationships among haplotypes (NST) (mean ± SE in parentheses) within the distribution range of each putative species and the Populus davidiana-rotundifolia complex.
The total genetic diversity (HT) and the diversity within populations (HS) based on cpDNA were higher in P. davidiana than P. rotundifolia (Table 2). The within-population haplotype diversity (Hd) was 0.7523 for P. rotundifolia, 0.8884 for P. davidiana, and 0.8950 across all populations. Nucleotide diversity (πs) was 0.00112 for P. rotundifolia, 0.00207 for P. davidiana, and 0.00189 across all populations.
Examination of Gene Flow between and Within the Two Evolutionary Lineages
The MIGRATE analysis produced a single module posterior distribution for θ and M parameters and the effective sampling size of all parameters are >5,000. θ for P. rotundifolia was slightly higher than P. davidiana, and effective immigration was slightly higher from P. rotundifolia into P. davidiana (2Nem = 8.05) than vice versa (2Nem = 7.43; Table 3A). To examine gene flow between geographical sectors, two populations where the percentage of the predominant cluster is lower than 0.875 were excluded (P44 and P46). These admixed populations would have caused biased (most likely overestimation) of gene flow between the SWC and CNC range sectors. Gene flow was far stronger from NEC to CNC (2Nem = 5.14) and to SWC (2Nem: 4.30) than from CNC to NEC (2Nem = 2.07) or SWC to NEC (2Nem = 2.90). Gene flow from SWC to CNC (2Nem = 5.14) was stronger than vice versa (2Nem = 3.52; Table 3B; Figure S6).
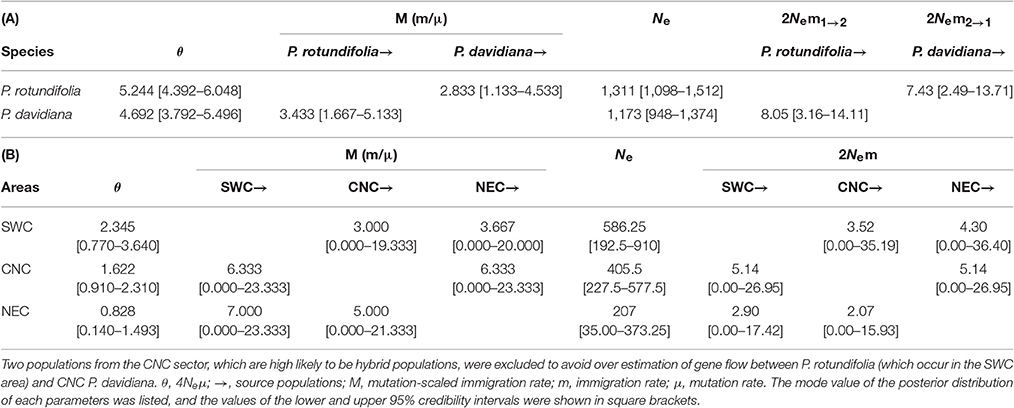
Table 3. (A) Historical gene flow as estimated by MIGRATE between the two putative species of the Populus davidiana-rotundifolia complex based on nSSR data; (B) Historical gene flow as estimated by MIGRATE among P. rotundifolia and the two range sectors (CNC and NEC) of P. davidiana based on nSSR data.
Ecological Niche Modeling
The predicted distributions of the two evolutionary lineages at present, during the MH and the LGM are illustrated in Figure 7A. The respective areas under the receiver operating characteristic curve (AUC) values for the present-day model, the MH model and the LGM model, for different groupings, were as follows: P. rotundifolia, 0.989 ± 0.004, 0.988 ± 0.007, 0.985 ± 0.006; P. davidiana, 0.954 ± 0.019, 0.948 ± 0.022, 0.957 ± 0.018. This indicates that all models were better than random expectation. According to variable jackknife analyses, the environmental variables that contributed most to potential models were Altitude, Isothermality (bio 3) and Mean Temperature of the Driest Quarters (bio 9) for P. rotundifolia, and Mean Temperature of the Driest Quarters (bio 9), Precipitation of Wettest Month (bio 13) and Precipitation of Warmest Quarter (bio 18) for P. davidiana (Figure S7). Although, the potential distribution of both evolutionary lineages for the present day partly overlaps in the southwestern China (Figure 7A), the niche identity tests of the pair of evolutionary lineages showed that observed values for both I and D were significantly smaller than the predicted scores under the null hypothesis (Figure 7B), suggesting that they occupy significantly different ecological niches. Meanwhile, considering that P. davidiana populations in the NEC and CNC are genetically different from each other, we further tested ecological niche differentiation between them, as well as between the CNC populations and P. rotundifolia (i.e., the SWC populations) (Figure S8A). The AUC values for the present-day model of CNC and NEC populations of P. davidiana were 0.966 ± 0.017 and 0.968 ± 0.023, respectively. Niche identity tests suggested that CNC occupies a significantly different ecological niche from both NEC and SWC (Figures S8B,C).
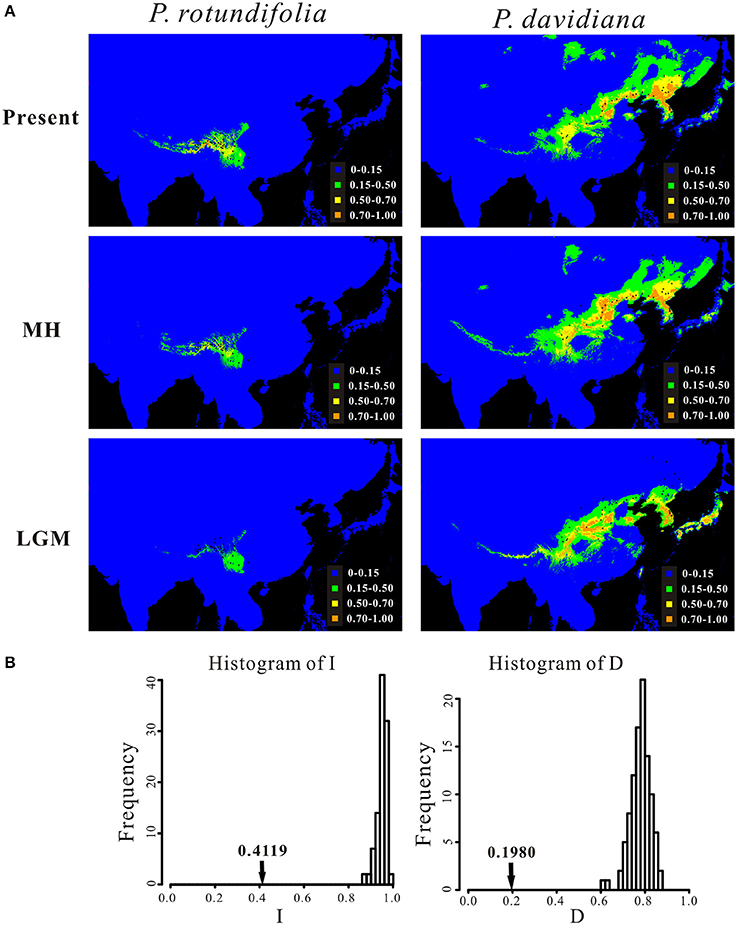
Figure 7. (A) Potential distributions of P. rotundifolia, P. davidianaas predicted by ecological niche modeling using MAXENT, and (B) identity test between their ecological niches. In (A), the potential distributions are shown for the present time (Present), during the middle Holocene (MH) and the last glacial maximum (LGM). In (B), bars indicate the null distributions of D or I, x-axis indicates values of I or D, y-axis indicates number of randomizations, and arrow indicates value of I or D in actual MAXENT runs.
Principal Component Analysis on Morphology
Based on morphological traits of all specimens sampled across the entire species complex, statistical analysis detected no clear differentiation between P. davidiana and P. rotundifolia (Figure 8). However, when populations of P. davidiana from the CNC and NEC sectors are treated separately, then a clear dividing line appears between NEC and P. rotundifolia, whereas CNC overlaps with P. rotundifolia more than it overlaps with NEC (Figures S9A,B). Hence the CNC populations might contain an admixture of characters from the two lineages.
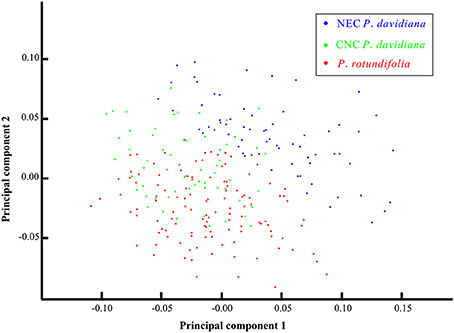
Figure 8. The Principal Component Analysis (PCA) plot for the morphological variations of 53 representative populations of the Populus davidiana-rotundifolia complex. Each dot represents one individual; blue, green, red dots represent individuals of NEC P. davidiana, CNC P. davidiana and P. rotundifolia, respectively.
Discussion
Recognition of Two Species Based on Multiple Nuclear Loci and Ecological Niche Differentiation
An integrative survey of 76 representative populations of the P. davidiana-rotundifolia complex revealed clear evidence from nSSRs for two separate evolutionary lineages (Figures 2, 4). Bayesian clustering suggested that the most likely number of free mating meta-populations is two (Figure 2), and PCoA of genetic variation based on genetic distance also supported the same genetic clustering pattern (Figure 4). Admixture between lineages for these markers is only detectable in those populations close to the contact zone of the two evolutionary lineages (Figure 3), consistent with the limited gene flow between lineages that was indicated by our coalescent-based approach (Table 3A). The two lineages occur in central (CNC) to northeastern (NEC) China, and in southwestern China (SWC; Figure 3), which corresponds with the respective distributions of the described species P. davidiana and P. rotundifolia (Fang et al., 1999).
Ecological niche modeling confirms that these two lineages have a clear ecological separation (Figure 7). Considering only areas predicted to have high habitat suitability (>0.50), the distributions of the two lineages have no overlap; however when predicted ranges also incorporate areas of lower suitability (0.15–0.50), then there is overlap in the eastern Hengduan mountains and northern Yunnan–Guizhou Plateau (Figure 7A). This visible pattern is supported by the niche identity test, where both indices (D and I) indicated that they occupy significantly different niches (Figure 7B).
Out of 21 cpDNA haplotypes detected, 17 were lineage specific (Figure S10A), and 31.62% of cpDNA variation occurred between lineages (Table 1). Despite this, the network of haplotypes resolved neither of the two lineages as monophyletic (Figure 6A; Figure S10B). Morphological separation was also incomplete: P. rotundifolia was clearly differentiated from NEC populations of P. davidiana (Figure S9B), but CNC populations of P. davidiana overlapped the morphology of both (Figure 8).
According to a unified species concept that defines species as separately evolving meta-population lineages (De Queiroz, 2007), sister species may become genetically isolated, and then subsequently become genetically monophyletic; they also gradually become morphologically and ecologically distinct as the speciation process advances. In the case of the P. davidiana-rotundifolia complex, separation has arisen at the functional level—i.e., for nuclear germplasm (multiple loci) and ecology; however, for other markers often used to distinguish taxa, i.e., morphology and cpDNA, separation is incomplete. Hence, P. davidiana and P. rotundifolia are functioning as two distinct species. Our findings support arguments that multiple criteria should be considered when delimitating closely related species in evolutionarily complex taxonomic groups (De Queiroz, 2007; Leaché et al., 2009; Fujita et al., 2012; Hendrixson et al., 2013; Su et al., 2015), and demonstrate the value of using population level sampling and highly variable markers, as a part of a tiered barcoding system, for such a purpose (Feng et al., 2013).
Parapatric Speciation between P. davidiana and P. rotundifolia
In the geographic context, the modes of speciation could be classified as allopatric, sympatric or parapatric speciation depending on the degree of range overlaps between evolutionary lineages during the speciation process (Mayr, 1942; Schluter, 2001; Coyne and Orr, 2004; Butlin et al., 2008). Where there is total (sympatric) or partial (parapatric) range overlap, speciation can proceed despite a degree of gene flow between speciating lineages (Schluter, 2001; Butlin et al., 2008). In these modes, ecological divergence and the formation of an intrinsic barrier to gene flow may have played important roles (Feder et al., 2012).
In the case of P. davidiana and P. rotundifolia, multiple lines of evidence suggest that they most likely have undergone parapatric speciation. First of all, as noted above, the two species occupy significant different ecological niches (Figures 7A,B) yet their distribution ranges are adjacent. Interestingly, the distribution of each species roughly matches a different floristic subkingdom in China (Wu and Wu, 1996; Qiu et al., 2011). The range of P. davidiana corresponds roughly to the northern part of the “Sino-Japanese Forest” floristic subkingdom (Wu and Wu, 1996; Qiu et al., 2011), which comprises North China (30/33N-42N), subtropical (Central/East/South) China (22N-30/33N), the Korean Peninsula, and the Japanese Archipelago. Likewise, P. rotundifolia occurs within the “Sino-Himalayan Forest” floristic subkingdom (Wu and Wu, 1996; Qiu et al., 2011), stretching from the eastern Himalaya Mountains through the Hengduan Mountains to the Yunnan–Guizhou Plateau. Hence the genetic divergence between these two species might reflect adaptation to these two environmentally divergent subkingdoms. Genetic divergence between sister species or sister lineages within species due to ecological differentiation have been observed in many plant species in China (Li et al., 2013; Wang et al., 2013; Sun et al., 2015; Yin et al., 2016), especially within the “Sino-Himalayan Forest” floristic subkingdom (Fan et al., 2013; Liu et al., 2013; Zhao et al., 2016) where environmental heterogeneity is relatively high.
A second line of evidence is the lack of functional geographic barriers that would prevent gene flow between these species, based both on currently known sites (Figure 1) and the range predicted by ecological niche modeling (Figure 7A). The mountains at the eastern edge of the Qinghai-Tibetan Plateau form a potential geographic barrier, yet four populations containing P. davidiana occur to the south of these, very close to P. rotundifolia (Figure 3). Moreover, the predicted distributions of these species during the MH and LGM periods revealed a greater degree of overlap than exists at present (Figure 7), showing no evidence for geographic separation nor functional geographic barriers to gene flow between them. Hence there is no obvious mechanism for allopatric speciation based on current geography or reconstructed past ranges; for it to have happened, there would have to have been some other separating factor not detectable by our analysis.
MIGRATE analyses based on nSSR markers, which may be dispersed via both seeds and pollen, revealed that a considerable level of gene flow has occurred in both directions between the two lineages (2Nem ≥ 7.43, Table 3A). Seeds and pollen of poplars are wind-dispersed (e.g., Fang et al., 1999); hence both are able to travel a long distance, mediating gene flow between populations. A similar level of bi-directional gene flow was detected using nuclear markers in a pair of ecologically diverged Populus species (euphratica and pruinosa), which co-occur in desert regions in Western China, and which underwent speciation during the Pleistocene (Wang et al., 2011b; Wang J. et al., 2014). Similarly, nuclear gene flow occurs between P. trichocarpa and P. balsamifera, which diverged even more recently, and occupy significantly different habitats in the North America (Levsen et al., 2012). Hence, speciation in the face of gene flow appears to be a common pattern in the genus Populus.
Finally, our data is consistent with gene flow having occurred at different periods during the speciation process. In addition to gene flow we have detected using nSSR loci, NETWORK analysis revealed sharing between lineages of both haplotypes and clades (haplotype groups). The 21 detected cpDNA haplotypes were clustered into five groups (Figure 6A), with the basal Group I confined to the northeastern range of P. davidiana (NEC). Otherwise, the haplotypes formed two pairs of groups, with each pair containing one group that was mainly in P. davidiana and another mainly in P. rotundifolia. Group III is almost exclusively P. rotundifolia, the exception being its presence in two nearby populations that are mainly P. davidiana according to nuclear data. However, it is sister to Group II, which occurs mainly in P. davidiana but also three populations of P. rotundifolia that are close to where the species overlap. A very similar pattern occurs in Groups IV and V: Group IV occurs in P. rotundifolia, plus one nearby population that is mainly P. davidiana according to nuclear data; Group IV is derived from Group V, all of whose haplotypes occur in P. davidiana, although haplotype H13 is also present in eight populations in the southeastern range of P. rotundifolia (Figure S11). Taken at face value, such a pattern fits the stochastic nature of lineage sorting (Freeland et al., 2011), with the five groups predating the divergence of the two species, and then the diverging P. rotundifolia happening to contain groups III and IV while the others were in P. davidiana. Limited sharing of groups II–IV near the contact zone between these species could be attributed to recent and possibly ongoing but limited gene flow, as detected by our data.
Our data is also consistent with an alternative hypothesis, wherein the initially diverging lineages gave rise to the current NEC and SWC populations, which subsequently gave rise to the CNC populations through ongoing admixture and hybridization, with SWC populations contributing cpDNA haplotypes and NEC contributing most of the nuclear genomes (based on nSSR clusters). In this scenario, the sister relationship of two pairs of cpDNA haplotype groups could represent two independent rounds of hybridization and introgression between lineages shortly after initial divergence. A third possibility is that the initial split was between NEC and the common ancestor of CNC and SWC populations, following which CNC diverged from SWC, and then finally the CNC populations were homogenized by nuclear gene flow from NEC, which left their chloroplast genomes unaffected.
Regardless of exactly how speciation occurred, the interspecific sharing of H13 must reflect a gene flow event that occurred long after speciation, because it concerns one haplotype, rather than a clade or its common ancestor. Even so, the event must have occurred some time ago, because the haplotype is spread across eight populations of P. rotundifolia. Hence it might have been caused by Quaternary climate oscillations.
Intraspecific Differentiation of P. davidiana
Our data indicates that the NEC and CNC populations function as a single species, P. davidiana, yet multiple lines of evidence support a subdivision between NEC and CNC. First, as we have discussed above, NEC harbors predominantly haplotype Group I, and CNC has groups II and V (Figure 6; Figures S4,S10B). Second, STRUCTURE analysis using the admittedly suboptimal value of K = 3 split P. davidiana into two groups, roughly matching this geographic divide, although mixed populations occurred especially in CNC (Figure S3). Third, it appears from MIGRATE analysis that the CNC group received similar levels of gene flow from both NEC and P. rotundifolia (SWC; Table 3B). Fourth, while NEC material had a consistent morphological separation from P. rotundifolia, CNC material was closer in morphology to P. rotundifolia than to NEC material (Figure 8). This morphological pattern might be due to recent divergence between the species (Figure 6), bi-directional gene flow between them (Table 3B; Figure S6), or both, but either is consistent with a degree of separation between NEC and CNC material. Finally, the ecological niche of the CNC group is significantly different from the NEC group (Figures S8A,C). The geographical dividing line between these NEC and CNC roughly corresponds to an infraspecific genetic divide within Acer mono (Guo et al., 2014; Liu et al., 2014), and a significant between-species dividing line among members of Juglans section Cardiocaryon (Bai et al., 2016). This suggests the presence of an enduring of incomplete phytogeographic barrier between these regions.
Remarkably, our cpDNA data appears to indicate that NEC material diverged from CNC material before the divergence between the latter and P. rotundifolia (SWC material), because NEC material is dominated by the earliest diverging haplotype group, I (Figure 6; Figure S5). Conversely, nuclear divergence between NEC and CNC, indicated by nSSR data, happened later, and after the divergence of P. rotundifolia. This fits with a hypothesis of ongoing, or periodic, nuclear gene flow between CNC and NEC, but could also reflect separation followed by a phase of nuclear homogenization. Either way, the two currently seem to function as a single species, and are separated neither by the optimal STRUCTURE value of K (K = 2; Figure 3), nor PCoA analysis (Figure 4). Genetic differentiation between NEC and CNC occurs when K = 3 (Figure S3), but it is much weaker than that between the species. Moreover, Mantel tests on nSSR data within P. davidiana found no significant correlation between geographic structure and genetic differentiation (r2 = 0.0001, P = 0.430), indicating at most weak geographical structuring, hence minimal separation between NEC and CNC. Conversely, significant geographic structuring is revealed when both species are examined together (r2 = 0.0407, P = 0.01; Figure 5). In summary, weak differentiation and periodic or ongoing gene flow between populations of NEC and CNC based on nSSR data suggest that they are currently functioned as one species.
In summary, our integrative approach which considering multiple lines of evidence suggests that although P. davidiana and P. rotundifolia are not completely separated according to cpDNA and morphology data, they are functionally two species that possess distinct nuclear germplasms and habitats. The species pair most likely have experienced a lineage separation history that is consistent with parapatric speciation in the face of gene flow due to adaptation to different ecological niches. A further subdivision of P. davidiana into Central-North and Northeastern groups is supported by multiple lines of evidence, with the former sharing morphological traits and some cpDNA with P. rotundifolia. This indicates a complex history, with interspecific gene flow likely occurring after the incipient species began to diverge. Hence, P. davidiana and P. rotundifolia can be regarded as a recently diverged species pair, where the speciation process is more or less complete, but the signature of the early divergence stages is still visible. Our findings emphasize that taking integrative survey at population level, as we have undertaken here, is an important approach to detect the boundary of a group of species that have experienced complex evolutionary history.
Author Contributions
KM conceived and designed the research; KM, LZ, LF collected samples; HZ, LF, and YW performed experiments; HZ, LF, and LZ conducted data analyses; HZ and KM drafted the manuscript; RM contributed new reagents and analysis tools; all authors revised and approved the final manuscript.
Funding
This work was financially supported by the National Natural Science Foundation of China (grant 31590821, 41571054, 31622015), by the National Key Basic Research Program of China (grant 2014CB954100), Sichuan Provincial Department of Science and Technology (grant 2015JQ0018) and Sichuan University.
Conflict of Interest Statement
The authors declare that the research was conducted in the absence of any commercial or financial relationships that could be construed as a potential conflict of interest.
Acknowledgments
The authors thank Drs. Matthew Olson, Markus Rhusam, and Jianquan Liu for their constructive suggestions on earlier version of the manuscript, Dr. Frederic Chain and two reviewers for their constructive comments, and Qianlong Liang for his helps with ecological niche modeling.
Supplementary Material
The Supplementary Material for this article can be found online at: http://journal.frontiersin.org/article/10.3389/fpls.2017.00375/full#supplementary-material
Table S1. Morphological difference between Populus davidiana and P. rotundifolia according to the Flora of China (Fang et al., 1999).
Table S2. Detailed information for the 76 sampled populations of the Populus davidiana-rotundifolia complex that were adopted for genetic survey using nSSR and cpDNA.
Table S3. Details for the (A) 14 microsatellite loci and (B) four chloroplast DNA fragments adopted in genetic survey.
Table S4. Locations of the five Populus davidiana populations from Korea (Lee et al., 2011) that were used for ecological niche modeling.
Table S5. The 10 environmental variables used for ecological niche modeling in this study.
Table S6. Estimates of genetic diversity among the populations of the Populus davidiana-rotundifolia complex based on each of the 14 nSSR loci.
Table S7. Descriptive statistics of genetic variation for each populations of the Populus davidiana-rotundifolia complex based on nSSR.
Table S8. Variable sites of the aligned chloroplast DNA sequences among the 21 detected haplotypes in the Populus davidiana-rotundifolia complex.
Figure S1. The sampling location of the 53 representative populations of P. rotundifolia (small red pie), CNC P. davidiana (small green pie), and NEC P. davidiana (small blue pie), respectively, that were adopted for morphologically statistical analysis.
Figure S2. The result of STRUCTURE simulations that used admixture model with independent allele frequencies.
Figure S3. Geographic distribution of nSSR genetic clusters for the 76 populations of the Populus davidiana-rotundifolia complex under the suboptimal K-value (K = 3) as inferred by STRUCTURE. See Figure 2D for the histogram of STRUCTURE assignment test. Brown and orange dashed lines encompass the putative assignment of populations to P. davidiana and P. rotundifolia, respectively.
Figure S4. The (A) minimum spanning network showing the phylogenetic relationships among the 21 chloroplast DNA (cpDNA) haplotypes in the Populus davidiana-rotundifolia complex and (B) their geographic distribution pattern, emphasizing the geographic distribution of haplotypes in group II and V. Colors of these haplotypes in haplotype groups I, III, and IV are identical. Population codes are identified in Table 1. In (A), the black dot represents an outgroup haplotype from P. adenopoda that was involved as outgroup for rooting purpose; each circle represents a haplotype and circle sizes are proportional to the number of samples per haplotype; oval black dashed lines encompass haplotypes representing the five cpDNA haplotype groups. Brown and orange dashed lines in (B) delineate P. davidiana and P. rotundifolia, and gray dashed line in (B) delineate the Central-North China (NCN) and Northeastern China (NEC) regions within P. davidiana.
Figure S5. A phylogenetic tree of haplotypes was constructed based on cpDNA sequences using MrBayes 3.2 version in parallel. The posterior probability support values are labeled for each node.
Figure S6. Pie chart of the effective population sizes (Ne) in P. rotundifolia, and P. davidiana in the Central-North China (CNC) and the Northeastern China (NEC), and effective migration rates (Nem) between three groups estimated by MIGRATE.
Figure S7. Effects of bioclimatic variables on gain of the species distribution models using jackknife test.
Figure S8. (A) Predicted distributions of Populus rotundifolia, Central-North group (CNC) and the Northeastern group (NEC) of P. davidiana at present based on ecological niche modeling using Maxent. (B) The identity test between the ecological niches of P. rotundifolia and CNC P. davidiana, and (C) of NEC and CNC P. davidiana, respectively. In (B,C), bars indicate the null distributions of D or I, x-axis indicates values of I or D, y-axis indicates number of randomizations, and arrow indicates value of I or D in actual MAXENT runs.
Figure S9. (A) The location of the representative populations of P. rotundifolia and the northeastern P. davidiana for morphologically statistical analysis. (B) The Principal Component Analysis (PCA) plot for the morphological variations of the representative populations of P. rotundifolia and the northeastern P. davidiana. Each dot represents one individual; blue and red dots represent individuals of NEC P. davidiana and P. rotundifolia, respectively.
Figure S10. The minimum spanning network showing the phylogenetic relationships among the 21 chloroplast DNA (cpDNA) haplotypes in the Populus davidiana-rotundifolia complex, and their occurrence in (A) each species and (B) each range sector. (A) Red and blue on the pie chart of network represent haplotypes that occur in P. rotundifolia and P. davidiana, respectively. (B) Red, green, and blue represent haplotypes that occur in P. rotundifolia, CNC P. davidiana, and NEC P. davidiana, respectively.
Figure S11. The (A) minimum spanning network showing the phylogenetic relationships among the 21 chloroplast DNA (cpDNA) haplotypes in the Populus davidiana-rotundifolia complex and (B) their geographic distribution pattern. Each haplotype was assigned a unique color. Population codes are identified in Table S2. In (A), the black dot represents an outgroup haplotype from P. adenopoda that was involved as outgroup for rooting purpose; each circle represents a haplotype and circle sizes are proportional to the number of samples per haplotype; oval black dashed lines encompass haplotypes representing the five cpDNA haplotype groups. Brown and orange dashed lines in (B) delineate P. davidiana and P. rotundifolia. The boundary between the CNC and NEC populations of P. davidiana runs between Pop 60 and 61.
References
Abbott, R., Albach, D., Ansell, S., Arntzen, J. W., Baird, S. J., Bierne, N., et al. (2013). Hybridization and speciation. J. Evol. Biol. 26, 229–246. doi: 10.1111/j.1420-9101.2012.02599.x
Amos, W., Hoffman, J., Frodsham, A., Zhang, L., Best, S., and Hill, A. (2007). Automated binning of microsatellite alleles: problems and solutions. Mol. Ecol. Notes 7, 10–14. doi: 10.1111/j.1471-8286.2006.01560.x
Bai, W. N., Wang, W. T., and Zhang, D. Y. (2016). Phylogeographic breaks within Asian butternuts indicate the existence of a phytogeographic divide in East Asia. New Phytol. 209, 1757–1772. doi: 10.1111/nph.13711
Bandelt, H. J., Forster, P., and Röhl, A. (1999). Median-joining networks for inferring intraspecific phylogenies. Mol. Biol. Evol. 16, 37–48. doi: 10.1093/oxfordjournals.molbev.a026036
Beerli, P. (2006). Comparison of Bayesian and maximum-likelihood inference of population genetic parameters. Bioinformatics 22, 341–345. doi: 10.1093/bioinformatics/bti803
Bond, J. E., and Stockman, A. K. (2008). An integrative method for delimiting cohesion species: finding the population-species interface in a group of Californian trapdoor spiders with extreme genetic divergence and geographic structuring. Syst. Biol. 57, 628–646. doi: 10.1080/10635150802302443
Braatne, J., Hinckley, T., and Stettler, R. (1992). Influence of soil water on the physiological and morphological components of plant water balance in Populus trichocarpa, Populus deltoides and their F1 hybrids. Tree Physiol. 11, 325–339. doi: 10.1093/treephys/11.4.325
Bradshaw, H., Ceulemans, R., Davis, J., and Stettler, R. (2000). Emerging model systems in plant biology: poplar (Populus) as a model forest tree. J. Plant Growth Regul. 19, 306–313. doi: 10.1007/s003440000030
Butlin, R. K., Galindo, J., and Grahame, J. W. (2008). Sympatric, parapatric or allopatric: the most important way to classify speciation? Philos. Trans. R. Soc. B Biol. Sci. 363, 2997–3007. doi: 10.1098/rstb.2008.0076
CBOL Plant Working Group, Hollingsworth, P. M., Forrest, L. L., Spouge, J. L., Hajibabaei, M., Ratnasingham, S., et al. (2009). A DNA barcode for land plants. Proc. Natl. Acad. Sci. U.S.A. 106, 12794–12797. doi: 10.1073/pnas.0905845106
Cervera, M. T., Storme, V., Soto, A., Ivens, B., Van Montagu, M., Rajora, O. P., et al. (2005). Intraspecific and interspecific genetic and phylogenetic relationships in the genus Populus based on AFLP markers. Theor. Appl. Genet. 111, 1440–1456. doi: 10.1007/s00122-005-0076-2
China Plant BOL Group, Li, D. Z., Gao, L. M., Li, H. T., Wang, H., Ge, X. J., et al. (2011). Comparative analysis of a large dataset indicates that internal transcribed spacer (ITS) should be incorporated into the core barcode for seed plants. Proc. Natl. Acad. Sci. U.S.A. 108, 19641–19646. doi: 10.1073/pnas.1104551108
Daïnou, K., Mahy, G., Duminil, J., Dick, C. W., Doucet, J.-L., Donkpégan, A. S. L., et al. (2014). Speciation slowing down in widespread and long-living tree taxa: insights from the tropical timber tree genus Milicia (Moraceae). Heredity (Edinb.) 113, 74–85. doi: 10.1038/hdy.2014.5
Dakin, E., and Avise, J. (2004). Microsatellite null alleles in parentage analysis. Heredity (Edinb.) 93, 504–509. doi: 10.1038/sj.hdy.6800545
De Queiroz, K. (2007). Species concepts and species delimitation. Syst. Biol. 56, 879–886. doi: 10.1080/10635150701701083
Degnan, J. H., and Rosenberg, N. A. (2009). Gene tree discordance, phylogenetic inference and the multispecies coalescent. Trends Ecol. Evol. 24, 332–340. doi: 10.1016/j.tree.2009.01.009
Dickmann, D. I. (2001). “An overview of the genus Populus,” in Popular Culture in North America, Part 2, ed D. I. Dickmann (Montreal, QC: NRC Research Press), 1–42.
Dickmann, D. I., and Stuart, K. W. (1983). The culture of Poplars in Eastern North America. East Lansing, MI: Department of Forestry, Michigan State University.
Doyle, J. J., and Doyle, J. L. (1987). A rapid DNA isolation procedure for small quantities of fresh leaf tissue. Phytochem. Bull. 19, 11–15.
Du, S., Wang, Z., Ingvarsson, P. K., Wang, D., Wang, J., Wu, Z., et al. (2015). Multilocus analysis of nucleotide variation and speciation in three closely related Populus (Salicaceae) species. Mol. Ecol. 24, 4994–5005. doi: 10.1111/mec.13368
Earl, D. A., and von Holdt, B. M. (2012). STRUCTURE HARVESTER: a website and program for visualizing STRUCTURE output and implementing the Evanno method. Conserv. Genet. Resour. 4, 359–361. doi: 10.1007/s12686-011-9548-7
Eckenwalder, J. E. (1977). Systematics of Populus, L. (Salicaceae) in Southwestern North America with Special Reference to Sect. Aigeiros Duby. Doctor's thesis, University of California, Berkeley CA.
Eckenwalder, J. E. (1996). “Systematics and evolution of Populus,” in Biology of Populus and its Implications for Management and Conservation, ed R. F. Stettler (Montreal, QC: NRC Research Press), 7–32.
Elith, J., and Leathwick, J. R. (2009). Species distribution models: ecological explanation and prediction across space and time. Annu. Rev. Ecol. Evol. Syst. 40, 677–697. doi: 10.1146/annurev.ecolsys.110308.120159
Evanno, G., Regnaut, S., and Goudet, J. (2005). Detecting the number of clusters of individuals using the software STRUCTURE: a simulation study. Mol. Ecol. 14, 2611–2620. doi: 10.1111/j.1365-294X.2005.02553.x
Excoffier, L., Laval, G., and Schneider, S. (2005). Arlequin (version 3.0): an integrated software package for population genetics data analysis. Evol. Bioinform. Online 1, 47–50. doi: 10.1111/j.1755-0998.2010.02847.x
Fan, D. M., Yue, J. P., Nie, Z. L., Li, Z. M., Comes, H. P., and Sun, H. (2013). Phylogeography of Sophora davidii (Leguminosae) across the 'Tanaka-Kaiyong Line', an important phytogeographic boundary in Southwest China. Mol. Ecol. 22, 4270–4288. doi: 10.1111/mec.12388
Fang, C. F., Zhao, S. D., and Skvortsov, A. K. (1999). “Salicaceae mirbel: 1. populus linnaeus,” in Flora of China Vol. 4, eds C. Y. Wu, P. H. Raven (Beijing; St. Louis, MO: Science Press; Missouri Botanical Garden Press), 139–162.
Feder, J. L., Egan, S. P., and Nosil, P. (2012). The genomics of speciation-with-gene-flow. Trends Genet. 28, 342–350. doi: 10.1016/j.tig.2012.03.009
Feng, J., Jiang, D., Shang, H., Dong, M., Wang, G., He, X., et al. (2013). Barcoding poplars (Populus, L.) from western China. PLoS ONE 8:e71710. doi: 10.1371/journal.pone.0071710
Fielding, A. H., and Bell, J. F. (1997). A review of methods for the assessment of prediction errors in conservation presence/absence models. Environ. Conserv. 24, 38–49. doi: 10.1017/S0376892997000088
Fladung, M., and Buschbom, J. (2009). Identification of single nucleotide polymorphisms in different Populus species. Trees 23, 1199–1212. doi: 10.1007/s00468-009-0359-3
Freeland, J. R., Kirk, H., and Petersen, S. D. (2011). Molecular Ecology. West Sussex, UK: Wiley-Blackwell Press.
Fujita, M. K., Leaché, A. D., Burbrink, F. T., McGuire, J. A., and Moritz, C. (2012). Coalescent-based species delimitation in an integrative taxonomy. Trends Ecol. Evol. 27, 480–488. doi: 10.1016/j.tree.2012.04.012
Guo, X. D., Wang, H. F., Bao, L., Wang, T. M., Bai, W. N., Ye, J. W., et al. (2014). Evolutionary history of a widespread tree species Acer mono in East Asia. Ecol. Evol. 4, 4332–4345. doi: 10.1002/ece3.1278
Hamzeh, M., and Dayanandan, S. (2004). Phylogeny of Populus (Salicaceae) based on nucleotide sequences of chloroplast trnT-trnF region and nuclear rDNA. Am. J. Bot. 91, 1398–1408. doi: 10.3732/ajb.91.9.1398
Havrdová, A., Douda, J., Krak, K., Vit, P., Hadincová, V., Zákravský, P., et al. (2015). Higher genetic diversity in recolonized areas than in refugia of Alnus glutinosa triggered by continent-wide lineage admixture. Mol. Ecol. 24, 4759–4777. doi: 10.1111/mec.13348
Hendrixson, B. E., DeRussy, B. M., Hamilton, C. A., and Bond, J. E. (2013). An exploration of species boundaries in turret-building tarantulas of the Mojave Desert (Araneae, Mygalomorphae, Theraphosidae, Aphonopelma). Mol. Phylogenet. Evol. 66, 327–340. doi: 10.1016/j.ympev.2012.10.004
Hernández-León, S., Gernandt, D. S., de la Rosa, J. A. P., and Jardón-Barbolla, L. (2013). Phylogenetic relationships and species delimitation in Pinus section Trifoliae inferrred from plastid DNA. PLoS ONE 8:e70501. doi: 10.1371/journal.pone.0070501
Hijmans, R. J., Cameron, S. E., Parra, J. L., Jones, P. G., and Jarvis, A. (2005). Very high resolution interpolated climate surfaces for global land areas. Int. J. Climatol. 25, 1965–1978. doi: 10.1002/joc.1276
Hijmans, R. J., Guarino, L., Cruz, M., and Rojas, E. (2001). Computer tools for spatial analysis of plant genetic resources data: 1. DIVA-GIS. Plant Genet. Resour. Newslett. 127, 15–19.
Jiang, D., Feng, J., Dong, M., Wu, G., Mao, K., and Liu, J. (2016). Genetic origin and composition of a natural hybrid poplar Populus × jrtyschensis from two distantly related species. BMC Plant Biol. 16:89. doi: 10.1186/s12870-016-0776-6
Jones, R. C., Steane, D. A., Lavery, M., Vaillancourt, R. E., and Potts, B. M. (2013). Multiple evolutionary processes drive the patterns of genetic differentiation in a forest tree species complex. Ecol. Evol. 3, 1–17. doi: 10.1002/ece3.421
Kalinowski, S. T., Taper, M. L., and Marshall, T. C. (2007). Revising how the computer program CERVUS accommodates genotyping error increases success in paternity assignment. Mol. Ecol. 16, 1099–1106. doi: 10.1111/j.1365-294X.2007.03089.x
Klingenberg, C. P. (2011). MorphoJ: an integrated software package for geometric morphometrics. Mol. Ecol. Resour. 11, 353–357. doi: 10.1111/j.1755-0998.2010.02924.x
Kress, W. J., Wurdack, K. J., Zimmer, E. A., Weigt, L. A., and Janzen, D. H. (2005). Use of DNA barcodes to identify flowering plants. Proc. Natl. Acad. Sci. U.S.A. 102, 8369–8374. doi: 10.1073/pnas.0503123102
Leaché, A. D., Koo, M. S., Spencer, C. L., Papenfuss, T. J., Fisher, R. N., and McGuire, J. A. (2009). Quantifying ecological, morphological, and genetic variation to delimit species in the coast horned lizard species complex (Phrynosoma). Proc. Natl. Acad. Sci. U.S.A. 106, 12418–12423. doi: 10.1073/pnas.0906380106
Lee, K. M., Kim, Y. Y., and Hyun, J. O. (2011). Genetic variation in populations of Populus davidiana Dode based on microsatellite marker analysis. Genes and Genomics, 33, 163–171. doi: 10.1007/s13258-010-0148-9
Levsen, N. D., Tiffin, P., and Olson, M. S. (2012). Pleistocene speciation in the genus Populus (Salicaceae). Syst. Biol. 61, 401–412. doi: 10.1093/sysbio/syr120
Lewontin, R. C. (1972). The apportionment of human diversity. Evol. Biol. 6, 381–398. doi: 10.1007/978-1-4684-9063-3_14
Lexer, C., Fay, M., Joseph, J., Nica, M. S., and Heinze, B. (2005). Barrier to gene flow between two ecologically divergent Populus species, P. alba (white poplar) and P. tremula (European aspen): the role of ecology and life history in gene introgression. Mol. Ecol. 14, 1045–1057. doi: 10.1111/j.1365-294X.2005.02469.x
Li, L., Abbott, R. J., Liu, B., Sun, Y., Li, L., Zou, J., et al. (2013). Pliocene intraspecific divergence and Plio-Pleistocene range expansions within Picea likiangensis (Lijiang spruce), a dominant forest tree of the Qinghai-Tibet Plateau. Mol. Ecol. 22, 5237–5255. doi: 10.1111/mec.12466
Librado, P., and Rozas, J. (2009). DnaSP v5: a software for comprehensive analysis of DNA polymorphism data. Bioinformatics 25, 1451–1452. doi: 10.1093/bioinformatics/btp187
Liu, C., Tsuda, Y., Shen, H., Hu, L., Saito, Y., and Ide, Y. (2014). Genetic structure and hierarchical population divergence history of Acer mono var. mono in South and Northeast China. PLoS ONE 9:e87187. doi: 10.1371/journal.pone.0087187
Liu, J., Moeller, M., Provan, J., Gao, L. M., Poudel, R. C., and Li, D. Z. (2013). Geological and ecological factors drive cryptic speciation of yews in a biodiversity hotspot. New Phytol. 199, 1093–1108. doi: 10.1111/nph.12336
Ma, T., Wang, J., Zhou, G., Yue, Z., Hu, Q., Chen, Y., et al. (2013). Genomic insights into salt adaptation in a desert poplar. Nat. Commun. 4:2797. doi: 10.1038/ncomms3797
Mayr, E. (1942). Systematics and the Origin of Species, from the Viewpoint of a Zoologist. Cambridge, MA: Harvard University Press.
Miao, Y. C., Lang, X. D., Zhang, Z. Z., and Su, J. R. (2013). Phylogeography and genetic effects of habitat fragmentation on endangered Taxus yunnanensis in southwest China as revealed by microsatellite data. Plant Biol. 16, 365–374. doi: 10.1111/plb.12059
Naciri, Y., and Linder, H. P. (2015). Species delimitation and relationships: the dance of the seven veils. Taxon 64, 3–16. doi: 10.12705/641.24
Nei, M. (1973). Analysis of gene diversity in subdivided populations. Proc. Natl. Acad. Sci. U.S.A. 70, 3321–3323. doi: 10.1073/pnas.70.12.3321
Noor, M. A., and Feder, J. L. (2006). Speciation genetics: evolving approaches. Nat. Rev. Genet. 7, 851–861. doi: 10.1038/nrg1968
Nosil, P., and Feder, J. L. (2012). Genomic divergence during speciation: causes and consequences. Philos. Trans. R. Soc. B Biol. Sci. 367, 332–342. doi: 10.1098/rstb.2011.0263
Nosil, P., Funk, D. J., and Ortiz-Barrientos, D. (2009). Divergent selection and heterogeneous genomic divergence. Mol. Ecol. 18, 375–402. doi: 10.1111/j.1365-294X.2008.03946.x
Oddou-Muratorio, S., Vendramin, G. G., Buiteveld, J., and Fady, B. (2009). Population estimators or progeny tests: what is the best method to assess null allele frequencies at SSR loci? Conserv. Genet. 10, 1343–1347. doi: 10.1007/s10592-008-9648-4
Okumura, S., Sawada, M., Park, Y. W., Hayashi, T., Shimamura, M., Takase, H., et al. (2006). Transformation of poplar (Populus alba) plastids and expression of foreign proteins in tree chloroplasts. Transgenic Res. 15, 637–646. doi: 10.1007/s11248-006-9009-3
Paetkau, D., and Strobeck, C. (1995). The molecular basis and evolutionary history of a microsatellite null allele in bears. Mol. Ecol. 4, 519–520. doi: 10.1111/j.1365-294X.1995.tb00248.x
Peakall, E., and Smouse, P. E. (2012). GenAlEx 6.5: genetic analysis in Excel. Population genetic software for teaching and research-an update. Bioinformatics 28, 2537–2539. doi: 10.1093/bioinformatics/bts460
Pearson, R. G., Raxworthy, C. J., Nakamura, M., and Townsend, P. A. (2007). Predicting species distributions from small numbers of occurrence records: a test case using cryptic geckos in Madagascar. J. Biogeogr. 34, 102–117. doi: 10.1111/j.1365-2699.2006.01594.x
Peterson, A. T., Papeş, M., and Soberón, J. (2008). Rethinking receiver operating characteristic analysis applications in ecological niche modeling. Ecol. Modell. 213, 63–72. doi: 10.1016/j.ecolmodel.2007.11.008
Phillips, S. J., Anderson, R. P., and Schapire, R. E. (2006). Maximum entropy modeling of species geographic distributions. Ecol. Modell. 190, 231–259. doi: 10.1016/j.ecolmodel.2005.03.026
Phillips, S. J., and Dudík, M. (2008). Modeling of species distributions with Maxent: new extensions and a comprehensive evaluation. Ecography 31, 161–175. doi: 10.1111/j.0906-7590.2008.5203.x
Pons, O., and Petit, R. (1996). Measwring and testing genetic differentiation with ordered versus unordered alleles. Genetics 144, 1237–1245.
Pritchard, J. K., Stephens, M., and Donnelly, P. (2000). Inference of population structure using multilocus genotype data. Genetics 155, 945–959.
Qiu, Y. X., Fu, C. X., and Comes, H. P. (2011). Plant molecular phylogeography in China and adjacent regions: tracing the genetic imprints of Quaternary climate and environmental change in the world's most diverse temperate flora. Mol. Phylogenet. Evol. 59, 225–244. doi: 10.1016/j.ympev.2011.01.012
Rohlf, F. J. (2001). Comparative methods for the analysis of continuous variables: geometric interpretations. Evolution 55, 2143–2160. doi: 10.1111/j.0014-3820.2001.tb00731.x
Ronquist, F., Teslenko, M., van der Mark, P., Ayres, D. L., Darling, A., Höhna, S., et al. (2012). Mrbayes 3.2: efficient bayesian phylogenetic inference and model choice across a large model space. Syst. Biol. 61, 539–542. doi: 10.1093/sysbio/sys029
Rosenberg, N. A. (2003). The shapes of neutral gene genealogies in two species: probabilities of monophyly, paraphyly, and polyphyly in a coalescent model. Evolution 57, 1465–1477. doi: 10.1111/j.0014-3820.2003.tb00355.x
Satler, J. D., Carstens, B. C., and Hedin, M. (2013). Multilocus species delimitation in a complex of morphologically conservedtrapdoor spiders (Mygalomorphae, Antrodiaetidae, Aliatypus). Syst. Biol. 62, 805–823. doi: 10.1093/sysbio/syt041
Schluter, D. (2001). Ecology and the origin of species. Trends Ecol. Evol. 16, 372–380. doi: 10.1016/S0169-5347(01)02198-X
Schoener, T. W. (1968). The Anolis lizards of Bimini: resource partitioning in a complex fauna. Ecology 49, 704–726. doi: 10.2307/1935534
Schroeder, H., Hoeltken, A., and Fladung, M. (2012). Differentiation of Populus species using chloroplast single nucleotide polymorphism (SNP) markers-essential for comprehensible and reliable poplar breeding. Plant Biol. 14, 374–381. doi: 10.1111/j.1438-8677.2011.00502.x
Seehausen, O., Butlin, R. K., Keller, I., Wagner, C. E., Boughman, J. W., Hohenlohe, P. A., et al. (2014). Genomics and the origin of species. Nat. Rev. Genet. 15, 176–192. doi: 10.1038/nrg3644
Shaffer, H. B., and Thomson, R. C. (2007). Delimiting species in recent radiations. Syst. Biol. 56, 896–906. doi: 10.1080/10635150701772563
Sheppard, C. S. (2013). How does selection of climate variables affect predictions of species distributions? A case study of three new weeds in New Zealand. Weed Res. 53, 259–268. doi: 10.1111/wre.12021
Sites, J. W., and Marshall, J. C. (2003). Delimiting species: a renaissance issue in systematic biology. Trends Ecol. Evol. 18, 462–470. doi: 10.1016/S0169-5347(03)00184-8
Smulders, M. J. M., Cottrell, J. E., Lefèvre, F., Van der Schoot, J., Arens, P., Vosman, B., et al. (2008). Structure of the genetic diversity in black poplar (Populus nigra L.) populations across European river systems: consequences for conservation and restoration. For. Ecol. Manage. 255, 1388–1399. doi: 10.1016/j.foreco.2007.10.063
Stettler, R. F., Bradshaw, T., Heilman, P., and Hinckley, T. (1996). Biology of Populus and its Implications for Management and Conservation. Montreal, QC: NRC Research Press.
Su, X., Wu, G., Li, L., and Liu, J. (2015). Species delimitation in plants using the Qinghai-Tibet Plateau endemic Orinus (Poaceae: Tridentinae) as an example. Ann. Bot. 116, 35–48. doi: 10.1093/aob/mcv062
Sun, Y., Abbott, R. J., Li, L., Li, L., Zou, J., and Liu, J. (2014). Evolutionary history of Purple cone spruce (Picea purpurea) in the Qinghai-Tibet Plateau: homoploid hybrid origin and Pleistocene expansion. Mol. Ecol. 23, 343–359. doi: 10.1111/mec.12599
Sun, Y., Li, L., Li, L., Zou, J., and Liu, J. (2015). Distributional dynamics and interspecific gene flow in Picea likiangensis and P. wilsonii triggered by climate change on the Qinghai-Tibet Plateau. J. Biogeogr. 42, 475–484. doi: 10.1111/jbi.12434
Tamura, K., Peterson, D., Peterson, N., Stecher, G., Nei, M., and Kumar, S. (2011). MEGA 5: molecular evolutionary genetics analysis using maximum likelihood, evolutionary distance, and maximum parsimony methods. Mol. Biol. Evol. 28, 2731–2739. doi: 10.1093/molbev/msr121
Thiel, T., Michalek, W., and Varshney, R. (2003). Exploiting EST databasesfor the development of cDNA derived microsatellite markers in bar-ley (Hordeum vulgare L.). Theor. Appl. Genet. 106, 411–422. doi: 10.1007/s00122-002-1031-0
Wan, X. Q., Zhang, F., Zhong, Y., Ding, Y. H., Wang, C. L., and Hu, T. X. (2013). Study of genetic relationships and phylogeny of the native Populus in Southwest China based on nucleotide sequences of chloroplast trnT-trnF and nuclear DNA. Plant Syst. Evol. 299, 57–65. doi: 10.1007/s00606-012-0702-9
Wang, J., Abbott, R. J., Peng, Y. L., Du, F. K., and Liu, J. (2011a). Species delimitation and biogeography of two fir species (Abies) in central China: cytoplasmic DNA variation. Heredity 107, 362–370. doi: 10.1038/hdy.2011.22
Wang, J., Källman, T., Liu, J., Guo, Q., Wu, Y., Lin, K., et al. (2014). Speciation of two desert poplar species triggered by Pleistocene climatic oscillations. Heredity 112, 156–164. doi: 10.1038/hdy.2013.87
Wang, J., Wu, Y., Ren, G., Guo, Q., Liu, J., and Lascoux, M. (2011b). Genetic differentiation and delimitation between ecologically diverged Populus euphratica and P. pruinosa. PLoS ONE 6:e26530. doi: 10.1371/journal.pone.0026530
Wang, Q., Abbott, R. J., Yu, Q. S., Lin, K., and Liu, J. Q. (2013). Pleistocene climate change and the origin of two desert plant species, Pugionium cornutum and Pugionium dolabratum (Brassicaceae), in northwest China. New Phytol. 199, 277–287. doi: 10.1111/nph.12241
Wang, Z., Du, S., Dayanandan, S., Wang, D., Zeng, Y., Zhang, J., et al. (2014). Phylogeny reconstruction and hybrid analysis of Populus (Salicaceae) based on nucleotide sequences of multiple single-copy nuclear genes and plastid fragments. PLoS ONE 9:e103645. doi: 10.1371/journal.pone.0103645
Warren, D. L., Glor, R. E., and Turelli, M. (2008). Environmental niche equivalency versus conservatism: quantitative approaches to niche evolution. Evolution 62, 2868–2883. doi: 10.1111/j.1558-5646.2008.00482.x
Warren, D. L., Glor, R. E., and Turelli, M. (2010). ENMTools: a toolbox for comparative studies of environmental niche models. Ecography 33, 607–611. doi: 10.1111/j.1600-0587.2009.06142.x
Wright, S. (1965). The interpretation of population structure by F-statistics with special regard to systems of mating. Evolution 19, 395–420. doi: 10.2307/2406450
Wright, S. (1978). Variability Within and Among Natural Populations. Chicago, IL: University of Chicago Press.
Wu, Z. Y., and Wu, S. (1996). “A proposal for a new floristic kingdom (realm)-the E. Asiatic Kingdom, its delineation and characteristics,” in Proceedings of the First International Symposium of Floristic Characteristics and Diversity of East Asian Plants, eds A. L. Zhang and S. G. Wu (Beijing; Berlin; Heidelberg: China Higher Education Press; Springer Verlag), 3–42.
Yin, H., Yan, X., Zhang, W., Shi, Y., Qian, C., Yin, C., et al. (2016). Geographical or ecological divergence between the parapatric species Ephedra sinica and E. intermedia? Plant Syst. Evol. 302, 1157–1170. doi: 10.1007/s00606-016-1323-5
Young, N. D., and Healy, J. (2003). GapCoder automates the use of indel characters in phylogenetic analysis. BMC Bioinformatics 4:6. doi: 10.1186/1471-2105-4-6
Zeng, Y. F., Wang, W. T., Liao, W. J., Wang, H. F., and Zhang, D. Y. (2015). Multiple glacial refugia for cool-temperate deciduous trees in northern East Asia: the Mongolian oak as a case study. Mol. Ecol. 24, 5676–5691. doi: 10.1111/mec.13408
Zhao, J. L., Gugger, P. F., Xia, Y. M., and Li, Q. J. (2016). Ecological divergence of two closely related Roscoea species associated with late Quaternary climate change. J. Biogeogr. 43, 1990–2001. doi: 10.1111/jbi.12809
Keywords: coalescent-based approach, ecological differentiation, gene flow, microsatellite, morphometric analysis, Populus davidiana, Populus rotundifolia
Citation: Zheng H, Fan L, Milne RI, Zhang L, Wang Y and Mao K (2017) Species Delimitation and Lineage Separation History of a Species Complex of Aspens in China. Front. Plant Sci. 8:375. doi: 10.3389/fpls.2017.00375
Received: 07 January 2017; Accepted: 06 March 2017;
Published: 21 March 2017.
Edited by:
Frederic J. J. Chain, McGill University, CanadaCopyright © 2017 Zheng, Fan, Milne, Zhang, Wang and Mao. This is an open-access article distributed under the terms of the Creative Commons Attribution License (CC BY). The use, distribution or reproduction in other forums is permitted, provided the original author(s) or licensor are credited and that the original publication in this journal is cited, in accordance with accepted academic practice. No use, distribution or reproduction is permitted which does not comply with these terms.
*Correspondence: Kangshan Mao, bWFva2FuZ3NoYW5Ac2N1LmVkdS5jbg==; bWFva2FuZ3NoYW5AMTYzLmNvbQ==
†These authors have contributed equally to this work.