 Yong Zhou1†Yajun Tao1†
 Dongnan Tang1
 Jun Wang2Jun Zhong1Yi Wang1Qiumei Yuan1Xiaofeng Yu1Yan Zhang1Yulong Wang1
 Guohua Liang1*Guichun Dong1*
- 1Jiangsu Key Laboratory of Crop Genetics and Physiology/Co-Innovation Center for Modern Production Technology of Grain Crops, Key Laboratory of Plant Functional Genomics of the Ministry of Education, Yangzhou University, Yangzhou, China
- 2Institute of Food Crops, Jiangsu High Quality Rice Research and Development Center, Nanjing Branch of China National Center for Rice Improvement, Jiangsu Academy of Agricultural Sciences, Nanjing, China
Nitrogen (N) availability is a major factor limiting crop growth and development. Identification of quantitative trait loci (QTL) for N uptake (NUP) and N use efficiency (NUE) can provide useful information regarding the genetic basis of these traits and their associated effects on yield production. In this study, a set of high throughput genotyped chromosome segment substitution lines (CSSLs) derived from a cross between recipient 9311 and donor Nipponbare were used to identify QTL for rice NUP and NUE. Using high throughput sequencing, each CSSL were genotyped and an ultra-high-quality physical map was constructed. A total of 13 QTL, seven for NUP and six for NUE, were identified in plants under hydroponic culture with all nutrients supplied in sufficient quantities. The proportion of phenotypic variation explained by these QTL for NUP and NUE ranged from 3.16–13.99% and 3.76–12.34%, respectively. We also identified several QTL for biomass yield (BY) and grain yield (GY), which were responsible for 3.21–45.54% and 6.28–7.31%, respectively, of observed phenotypic variation. GY were significantly positively correlated with NUP and NUE, with NUP more closely correlated than NUE. Our results contribute information to NUP and NUE improvement in rice.
Introduction
The world’s population will reach 9 billion by 2050 (Gregory and George, 2011). Food shortages are becoming a serious global problem. To guarantee global food security for future generations in view of this population explosion, the estimated annual increase in agricultural productivity needs to be raised to 3% from the current 2% (von Braun, 2010). Nitrogen (N), an essential element for crop growth, is considered to be the main factor limiting crop productivity, second only to water deficiency. In most agricultural regions, crop production is highly dependent on supply of exogenous N fertilizer (Kraiser et al., 2011). To satisfy the food requirements of an increasing population, the amount of synthetic N applied to crops has risen dramatically, from 12 to 104 terrogram per year (Tg year-1) over the last 40 years (Mulvaney et al., 2009; Godfray et al., 2010). Much of the N applied to the soil is lost to the atmosphere or leached into groundwater and other freshwater bodies, however, with an average of only 30–50% of total applied N actually harvested in grains. N fertilizer input is essential to high crop yield, but excessive use of N fertilizer causes many pollution such as air pollution and water pollution (Vance, 2001; Hirel et al., 2007; Vitousek et al., 2009; Godfray et al., 2010; Liu et al., 2010, 2013). The development of crops with high N utilization ability is therefore urgently needed. N utilization can be subdivided into two processes: N uptake (the ability of the plant to remove N from the soil as nitrate and ammonium ions, NUP) and N utilization (efficiency of N use to produce grain yield, NUE). The urgent need for advances in agricultural research and technology, especially in the aspect of N utilization, has raised strict requirements that we must develop sustainable agricultural methods to increase food yield (Zeigler and Mohanty, 2010).
Rice (Oryza sativa L.) is an important food and feeds half of the world’s population (Zhou et al., 2009). As a fertilizer, N is widely used in the whole stage of rice growth and development (Cassman et al., 1998). In China, N fertilizer is excessively used and accounting for 35% of global N fertilizer consumption (FAO, 2004), 7% of which is applied to irrigated rice (Peng et al., 2006). In recent years, N fertilizer application rates in many regions of China have been significantly higher than the world average. The average amount of N fertilizer applied annually in China is 220 kg ha-1, with rates as high as 314 kg ha-1 over a single rice season (Shen and Zhang, 2006; Zeng et al., 2012). Although N fertilizer application is one of the major expenses incurred by Chinese rice farmers, rice NUE is less than 30–35%, resulting in N losses over 50% (Peng et al., 2002, 2006; Shen and Zhang, 2006). Reducing N input is beneficial not only to farmers but also to the environment. Consequently, the introduction of rice varieties with high NUP and NUE is now an objective of many rice breeding programs (Dong et al., 2006), which necessitates a better understanding of the genetic basis of NUP and NUE in rice.
Quantitative trait locus (QTL) mapping can reveal chromosomal locations of unknown genes that influence quantitative variation of complex traits such as NUP and NUE. Several studies have been carried out to map QTL for NUE in rice. Using 98 backcross inbred lines (BILs) developed from Nipponbare and Kasalash, QTL associated with rice NUE were firstly mapped (Obara et al., 2001). One QTL, qNUEP-6, controlling NUE on chromosome 6, was identified in a recombinant inbred line (RIL) population of Zhenshan 97 and Minghui 63 (Shan et al., 2005). Under three N levels, a major QTL associated with NUE on chromosome 3 was detected in a doubled haploid (DH) population from IR64 and Azucena (Senthilvel et al., 2008). Under low N conditions, one QTL for NUE, pnue9, was identified on chromosome 9 using a RIL population from Dasanbyeo and TR22183 (Cho et al., 2007). Dozens of QTL for various traits correlated with NUE were detected in two japonica × japonica RILs (Li et al., 2010). Four and six QTL for rice NUE were identified in 2006 and 2007, respectively, using 127 RILs derived from Zhenshan 97 and Minghui 63 (Wei et al., 2011). Reports have also appeared on QTL analysis of NUP or N content (Ishimaru et al., 2001; Ju et al., 2006; Cho et al., 2007; Piao et al., 2009), low N tolerance (Lian et al., 2005; Wei et al., 2012), and glutamine synthetase content (Obara et al., 2001, 2004). Despite these advances, the genetic control of NUP and NUE in rice is still not well-understood.
Our study was designed to precisely characterize more QTL for rice NUP and NUE under hydroponic conditions using a population of chromosome segment substitution lines (CSSLs). These results provide useful information for further dissection of the genetic basis of NUE and NUP, and should facilitate development of rice varieties with better nitrogen uptake and nitrogen use efficiency.
Materials and Methods
Materials
As described previously, to uncover the genetic basis of rice important agronomic traits, a population consisting of 128 CSSLs, developed from a cross between japonica cultivar Nipponbare as the donor parent and indica cultivar 9311 as the recurrent parent, was developed (Xu et al., 2010). Based on high throughput sequencing, an ultra-high-quality physical map of the CSSLs was constructed (Xu et al., 2010). According to the physical map, the 128 CSSLs totally carried 142 substituted chromosome segments, which ranged from 0.65 to 22.3 Mb with an average of 6.21 Mb. In this study, these 128 CSSLs were employed for QTL mapping of rice NUP, NUE and other related traits.
Hydroponic Culture
Chromosome segment substitution lines and their parents were grown under hydroponic conditions at Yangzhou University (latitude 32°24′ N, longitude 119°26′ E), Yangzhou City, China. All rice seedlings were solution-cultured in eight 5.72 m3 (8.8 m × 1.3 m × 0.5 m) concrete ponds connected to one another at the bottom by iron tubes. The ponds were covered with concrete planks (135.0 cm × 16.7 cm × 2.5 cm) containing 14 holes (4 cm in diameter) for seedling fixation (Dong et al., 2011). Plump seeds were surface-sterilized in a 2.5% NaClO solution for 15 min, and then washed three times with distilled water. In an illumination incubator, seeds were germinated at 30°C and transplanted into the holes after 30 days. 56 seedlings for each line were planted in a randomized complete block design with two replications. The nutrient solution was formulated with a N concentration of 7 mg L-1, as described previously (Dong et al., 2006, 2011).
When transplanting, the nutrient solution was poured into the ponds and refreshed every 10 days. In order to maintain pH between 5.5 and 6.5, we added diluted H2SO4. We also improved O2 supply and used a pump to keeping the solution cycling continuously.
Evaluation of Phenotypes
We measured NUP, NUE, biomass yield (BY), and grain yield (GY) at plant maturity. After deactivating enzymes at 105°C for 10 min, each plant portion (including aboveground organs and roots) was dried at 75°C to constant weight, and then weighed to obtain BY (g m-2). For GY (g m-2), total grains were stored and dried at room temperature for at least 1 month before weighing.
N content of grains (Ngrain), shoots (Nshoot), and roots (Nroot) was estimated in each line by the Kjeldahl method, and plant N content (Nplant) was calculated as Ngrain + Nshoot + Nroot. Total N uptake ability (NUP) was then calculated as Nplant = (Ngrain + Nshoot + Nroot)/S (g m-2). S denotes the sampled area. NUE was calculated as GY/Nplant (g g-1).
Statistical and QTL Analyses
Phenotypic data were analyzed using SPSS statistical software, and frequency distributions were plotted using Sigma Plot 10.0. QTL analysis was conducted as described previously (Xu et al., 2010). The following multiple linear model was used in the SAS software package:
where yi, b0 denotes the mean value of the ith CSSL line and the mean of overall population, respectively. m is the total number of bins in the whole genome, bk is the main effect associated with bin k. xik = 1 or -1 corresponding to the donor parent and the recurrent parent bin, respectively. ei is the residual error. According to multiple linear regression, we estimated the contributions of each bin to phenotypic variation.
Results
Phenotypic Performance of CSSLs and Their Parents
A set of CSSLs and their parents (9311 and Nipponbare) under hydroponic culture conditions were investigated. Phenotypic values of NUP and NUE in the CSSLs and parents are listed in Table 1. The NUP of 9311 was 1.60-fold higher than that of Nipponbare, whereas the NUE was similar (28.60 ± 1.00 g g-1 vs. 27.74 ± 0.95 g g-1). 9311 is a high-yield indica variety developed in the 1990s, and Nipponbare is a low-yield japonica variety developed in the 1950s. We also compared BY and GY of these two parents. BY and GY of 9311 were 1.39- and 1.65-fold higher, respectively, than those of Nipponbare. These data indicate that the higher yield of 9311 is due to increased NUP rather than NUE.
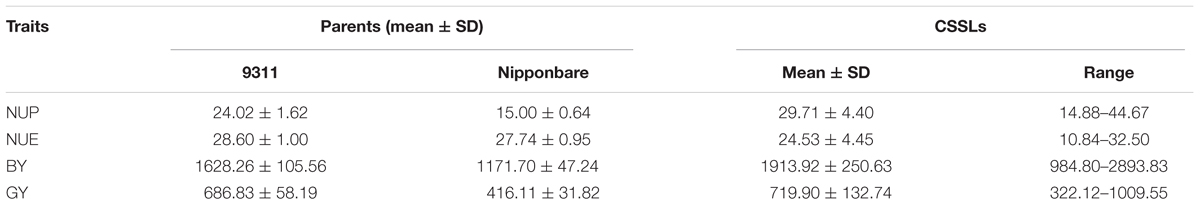
TABLE 1. Mean values and ranges of nitrogen uptake (NUP), nitrogen use efficiency (NUE), biomass yield (BY), and grain yield (GY) in rice CSSLs and their parents.
In the CSSL population, extensive variation, and normal distributions were observed for NUP and NUE, consistent with the characteristics of quantitative traits (Figure 1). NUP, BY and GY in the CSSL population were all closer to those of 9311 (Table 1), as 9311 was the recurrent parent.
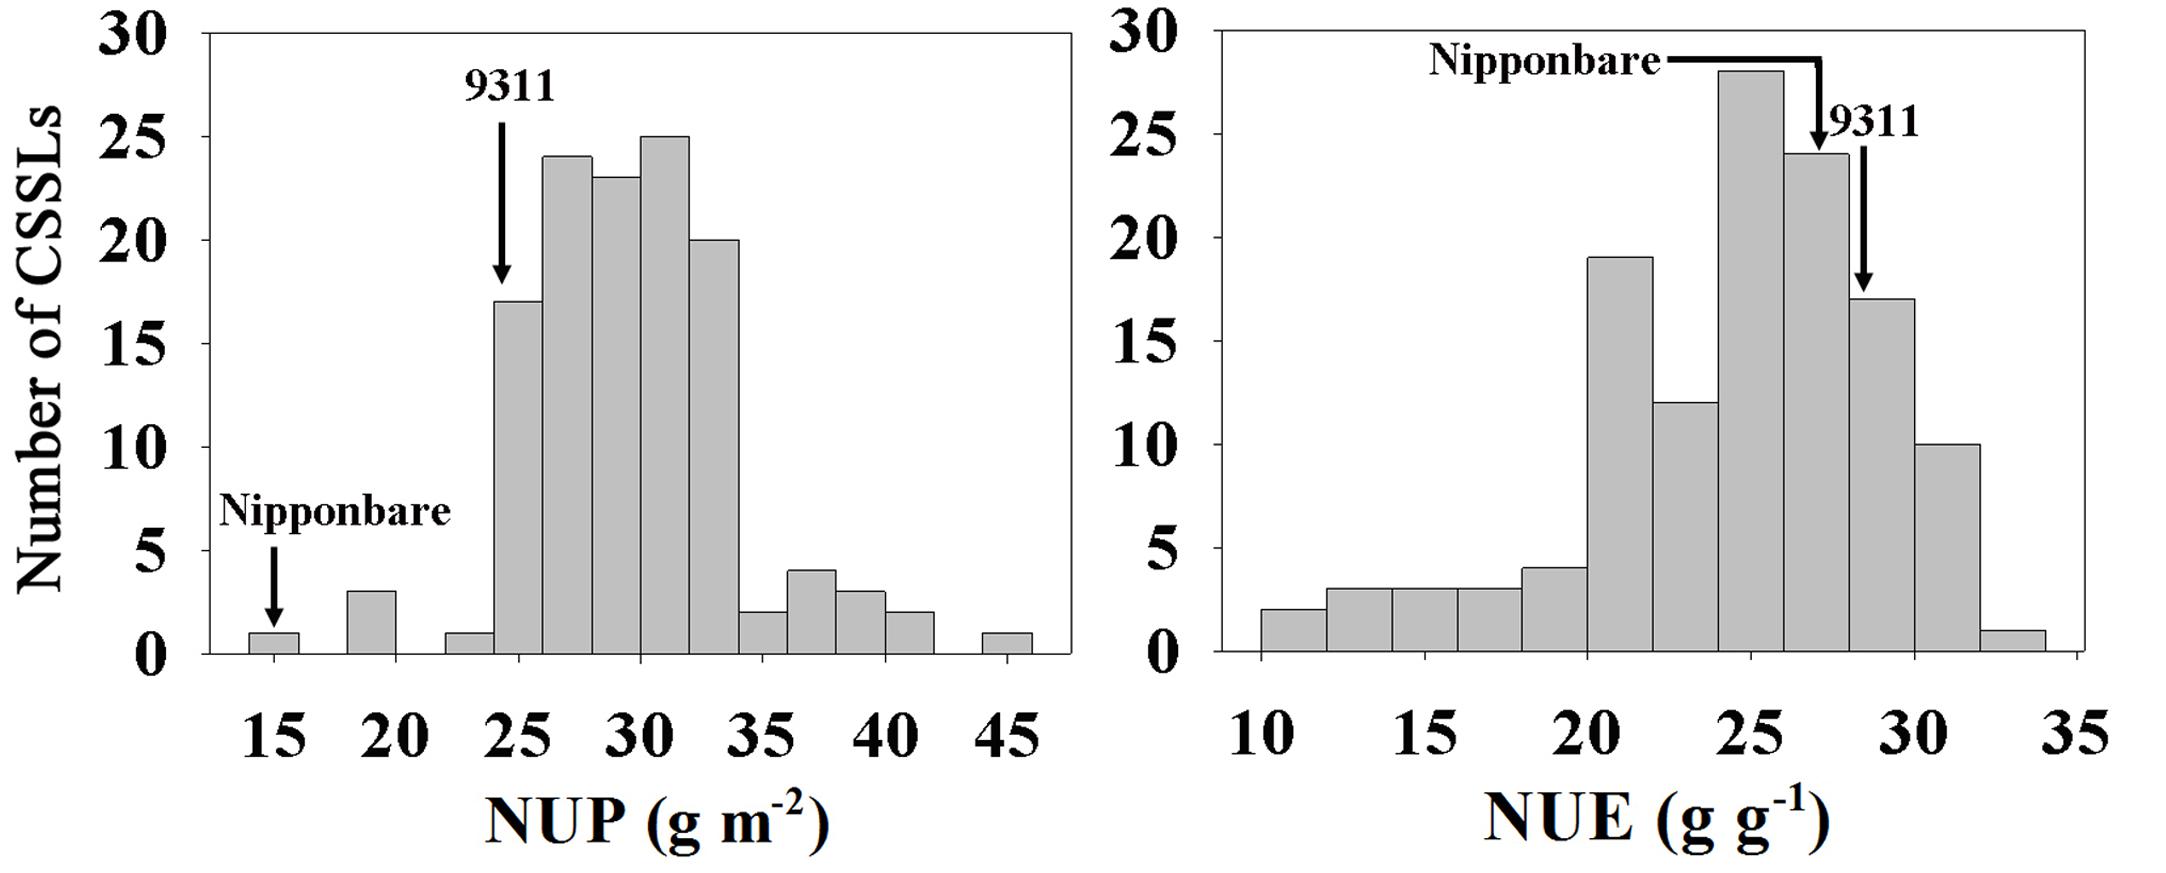
FIGURE 1. N uptake (NUP) and NUE distributions in the CSSLs under hydroponic culture.
Relationship between Yield Production and N Utilization
We carried out a correlation analysis among NUP, NUE, BY, and GY. As shown in Figure 2, NUP was significantly positively correlated with BY (R2 = 0.742). Similar relationships were found between NUP and GY, with R2 values of 0.074 (Figure 2). Thus, the increased NUP could led to an increased BY and GY. NUP was more closely correlated with BY than with GY.
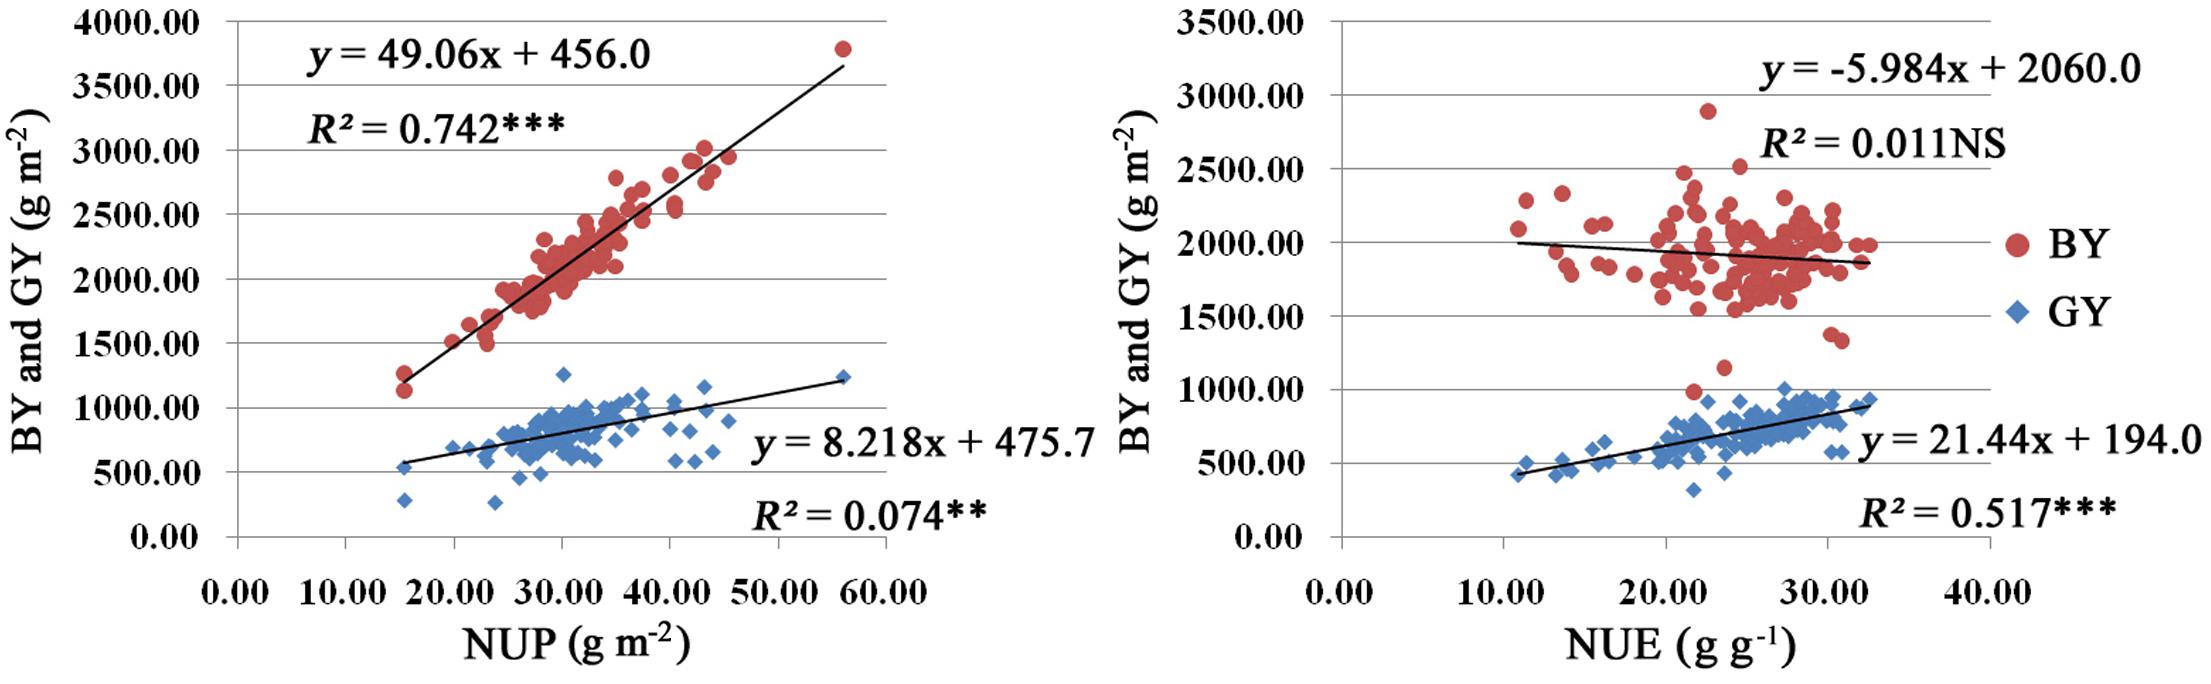
FIGURE 2. Results of correlation analysis among NUP, NUE, BY, and GY in rice plants under hydroponic culture. The linear regression equation model used and R2 are listed at the top right. Red and blue indicate BY and GY, respectively. Significance levels are as follows: ∗p < 0.05; ∗∗p < 0.01; ∗∗∗p < 0.001 level; NS, not significant.
N use efficiency displayed significant positive correlations with GY, with R2 values of 0.517 (Figure 2). However, there was no significance correlation between NUE and BY.
QTL Mapping
N Uptake
We detected seven putative QTL controlling NUP: qNUP2.1, qNUP3.1, qNUP6.1, qNUP8.1, qNUP10.1, qNUP11.1, and qNUP11.2. These QTL were found on chromosomes 2, 3, 6, 8, 10, and 11. Contributions of these QTL to observed phenotypic variance were 3.83, 4.75, 11.86, 13.99, 9.80, 3.16, and 4.30%, respectively. The QTL with the largest effect was mapped to X278 and occupied to the physical position of 2797908–3336084 bp (Table 2).
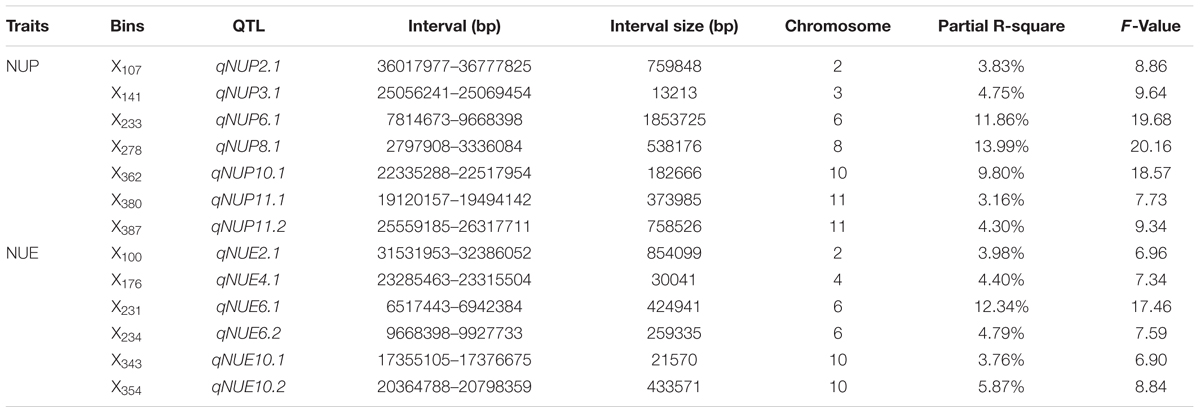
TABLE 2. Quantitative trait loci mapping associated with NUP and NUE in rice plants under hydroponic culture.
N Use Efficiency
A total of six QTL were detected for NUE. These QTL were qNUE2.1, qNUE4.1, qNUE6.1, qNUE6.2, qNUE10.1, and qNUE10.2, which were located in X100 on chromosome 2, X176 on chromosome 4, X231 on chromosome 6, X234 on chromosome 6 X343 on chromosome 10 and X354 on chromosome 10, respectively. qNUE6.1, is the QTL having the largest contribution to the phenotypic variance with its contribution of 12.34% (Table 2).
Grain Yield
Two putative QTL for GY were detected. These QTL, with their locations and phenotypic contributions, were as follows: qGY6.1 in X231 on chromosome 6 (6.28%), and qGY8.1 in X277 on chromosome 8 (7.31%) (Table 3).
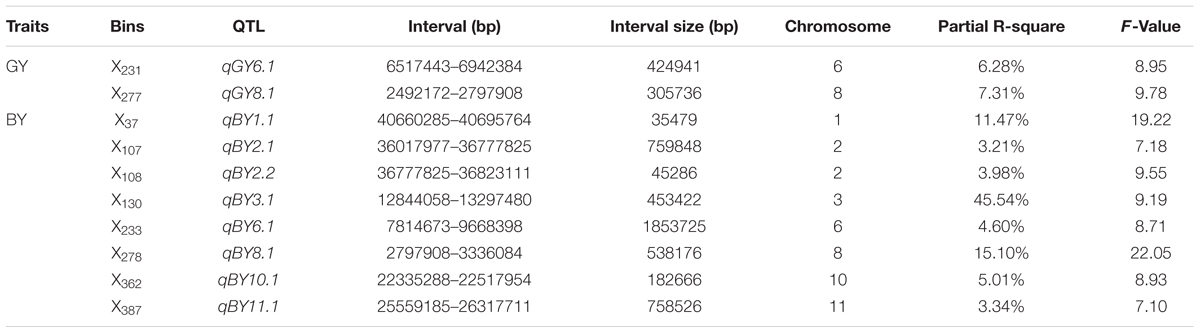
TABLE 3. Quantitative trait loci mapping associated with GY and BY in rice plants under hydroponic culture.
Biomass Yield
In total, eight QTL (qBY1.1, qBY2.1, qBY2.2, qBY3.1, qBY6.1, qBY8.1, qBY10.1, and qBY11.1) for BY were detected, which were located in X37 on chromosome 1, X107 on chromosome 2, X108 on chromosome 2, X130 on chromosome 3, X233 on chromosome 6, X278 on chromosome 8, X362 on chromosome 10 and X387 on chromosome 11, respectively. These QTL explained 11.47, 3.21, 3.98, 45.54, 4.60, 15.10, 5.01, and 3.34%, respectively of the phenotypic variance. The QTL with the largest effect was mapped to X130 (Table 3).
From the above analysis, we can find that several QTL show pleiotropic effect among traits. For example, the location X278 occupied the physical position of 2797908–3336084 bp comprises a 538176 bp region on chromosome 8, which simultaneously controlled NUP and BY. In X107, X233, X278, X362, and X387 on chromosome 2, 6, 8, and 11, respectively, the location also controlled NUP and BY simultaneously. Both qNUE6.1 and qGY6.1 were detected in X231 on chromosome 6. These results implied that these QTL may have potential value in rice breeding.
Discussion
N uptake and NUE improvement is becoming a major objective of modern rice breeding programs. The advent of modern breeding technologies has accelerated the pace of agricultural improvements. These new breeding methods not only affect crop yield, but also help meet the challenges associated with environmental sustainability, food supply, and fossil fuel replacement. A better understanding of the genetic basis of NUP and NUE, especially the relationship between these two traits and grain yield in rice, could be very important for food security and environmental benefits. Because of low heritability, field selection of NUP and NUE is always disturbed. Marker-assisted selection (MAS) enables the development of varieties with multiple target traits controlled by small-effect QTL/genes. Once the genes associated with agricultural and economical interest have been found, MAS can integrate this biological and genomic information into traditional crop breeding programs to greatly improve breeding efficiency. Most successful MAS breeding research, however, has been conducted on heading date (Takeuchi et al., 2006) and resistance to diseases or insects conferred by major genes (Fjellstrom et al., 2004, 2006; Jia et al., 2004; Hayashi et al., 2006). Few studies have addressed the improvement of complex quantitative traits including NUP and NUE; this situation is possibly due to lack of information on QTL epistasis, QTL × environment interaction (QEI) effects, gene action of QTL, and markers closely linked to target QTL.
Most agronomic traits, including NUP and NUE, are typical quantitative traits controlled by several genes, or QTL. Multiple QTL associated with NUP and NUE have been assigned to linkage maps using different mapping populations. Because of the noise of genetic background, F2, DHs, and RILs are rarely used for QTL fine mapping or cloning (Yamamoto et al., 2000). In this study, we used CSSLs as a mapping population to detect QTL for NUP and NUE under hydroponic conditions. CSSLs have the similar genetic backgrounds, except for the substituted segments, as the recurrent parent, making it possible to divide QTL into single Mendelian factors.
In the CSSLs, variation ranges of the target traits are large (Table 1). NUP, BY and GY in the CSSL population were closer to those of 9311, as 9311 was the recurrent parent. We also noticed that the average NUP of CSSLs was much higher than that of 9311. However, the average NUE of CSSLs was much lower. So, Nipponbare may carry multiple quantitative loci promoting rice nitrogen uptake. Actually, the NUP of Nipponbare itself was so low. A possible explanation is that gene interaction or antagonism between different QTL for NUP may exist in Nipponbare.
Because NUP and NUE both had large effects on rice grain yield, we also carried out QTL mapping for GY and BY using these CSSLs. We identified 23 QTL: 7 for NUP, 6 for NUE, 8 for BY, and 2 for GY under hydroponic culture. These QTL were located in 17 bins, with five QTL in Bins smaller than 50 kb: qNUP3.1, qNUE4.1, qNUE10.1, qBY1.1, and qBY2.2. These five QTL, with their small marker interval distances, are ideal for fine mapping, and their use in future studies should reduce time and labor costs.
We found that regions controlling BY in our study contained QTL for NUE detected in previous studies (Figure 3). For example, qBY1.1, which was detected in X37 and closed to the QTL qBMS1-1 and yld1.1, responsible for biomass per plant and grain yield per plant, respectively (Hittalmani et al., 2003; Fu et al., 2010), and was also close to the QTL, qNUEn1, for NUE detected in RILs from Zhenshan 97 and Minghui 63 (Wei et al., 2011). qBY3.1 on X130 with the region 12844058–13297480 bp close to qNUE-3 detected in IR64 and Azucena (Senthilvel et al., 2008). Additionally, this QTL explained 45.54% of the phenotypic variance, which should be further mapped to make it useful in rice breeding. Similarly, QTL for NUE and NUP detected in our study were located in the vicinity of QTL associated with GY in previous studies (Figure 3). For example, qNUE2.1 was detected in bin X100, the region encompassing positions 31531953–32386052, near the region where a QTL controlling GY in RILs from Zhenshan 97 and Minghui 63 has been detected (Xing et al., 2002). qNUE6.1 detected in bin X231, the region encompassing positions 6517443–6942384, was located close to the QTL yd6 detected in Zhenshan 97 and Minghui 63 has been detected (Xing et al., 2002). However, hardly a region controlling NUE or NUP were both detected in our or previous studies. One explanation is that QTL associated with NUE and NUP were highly susceptible to environment.
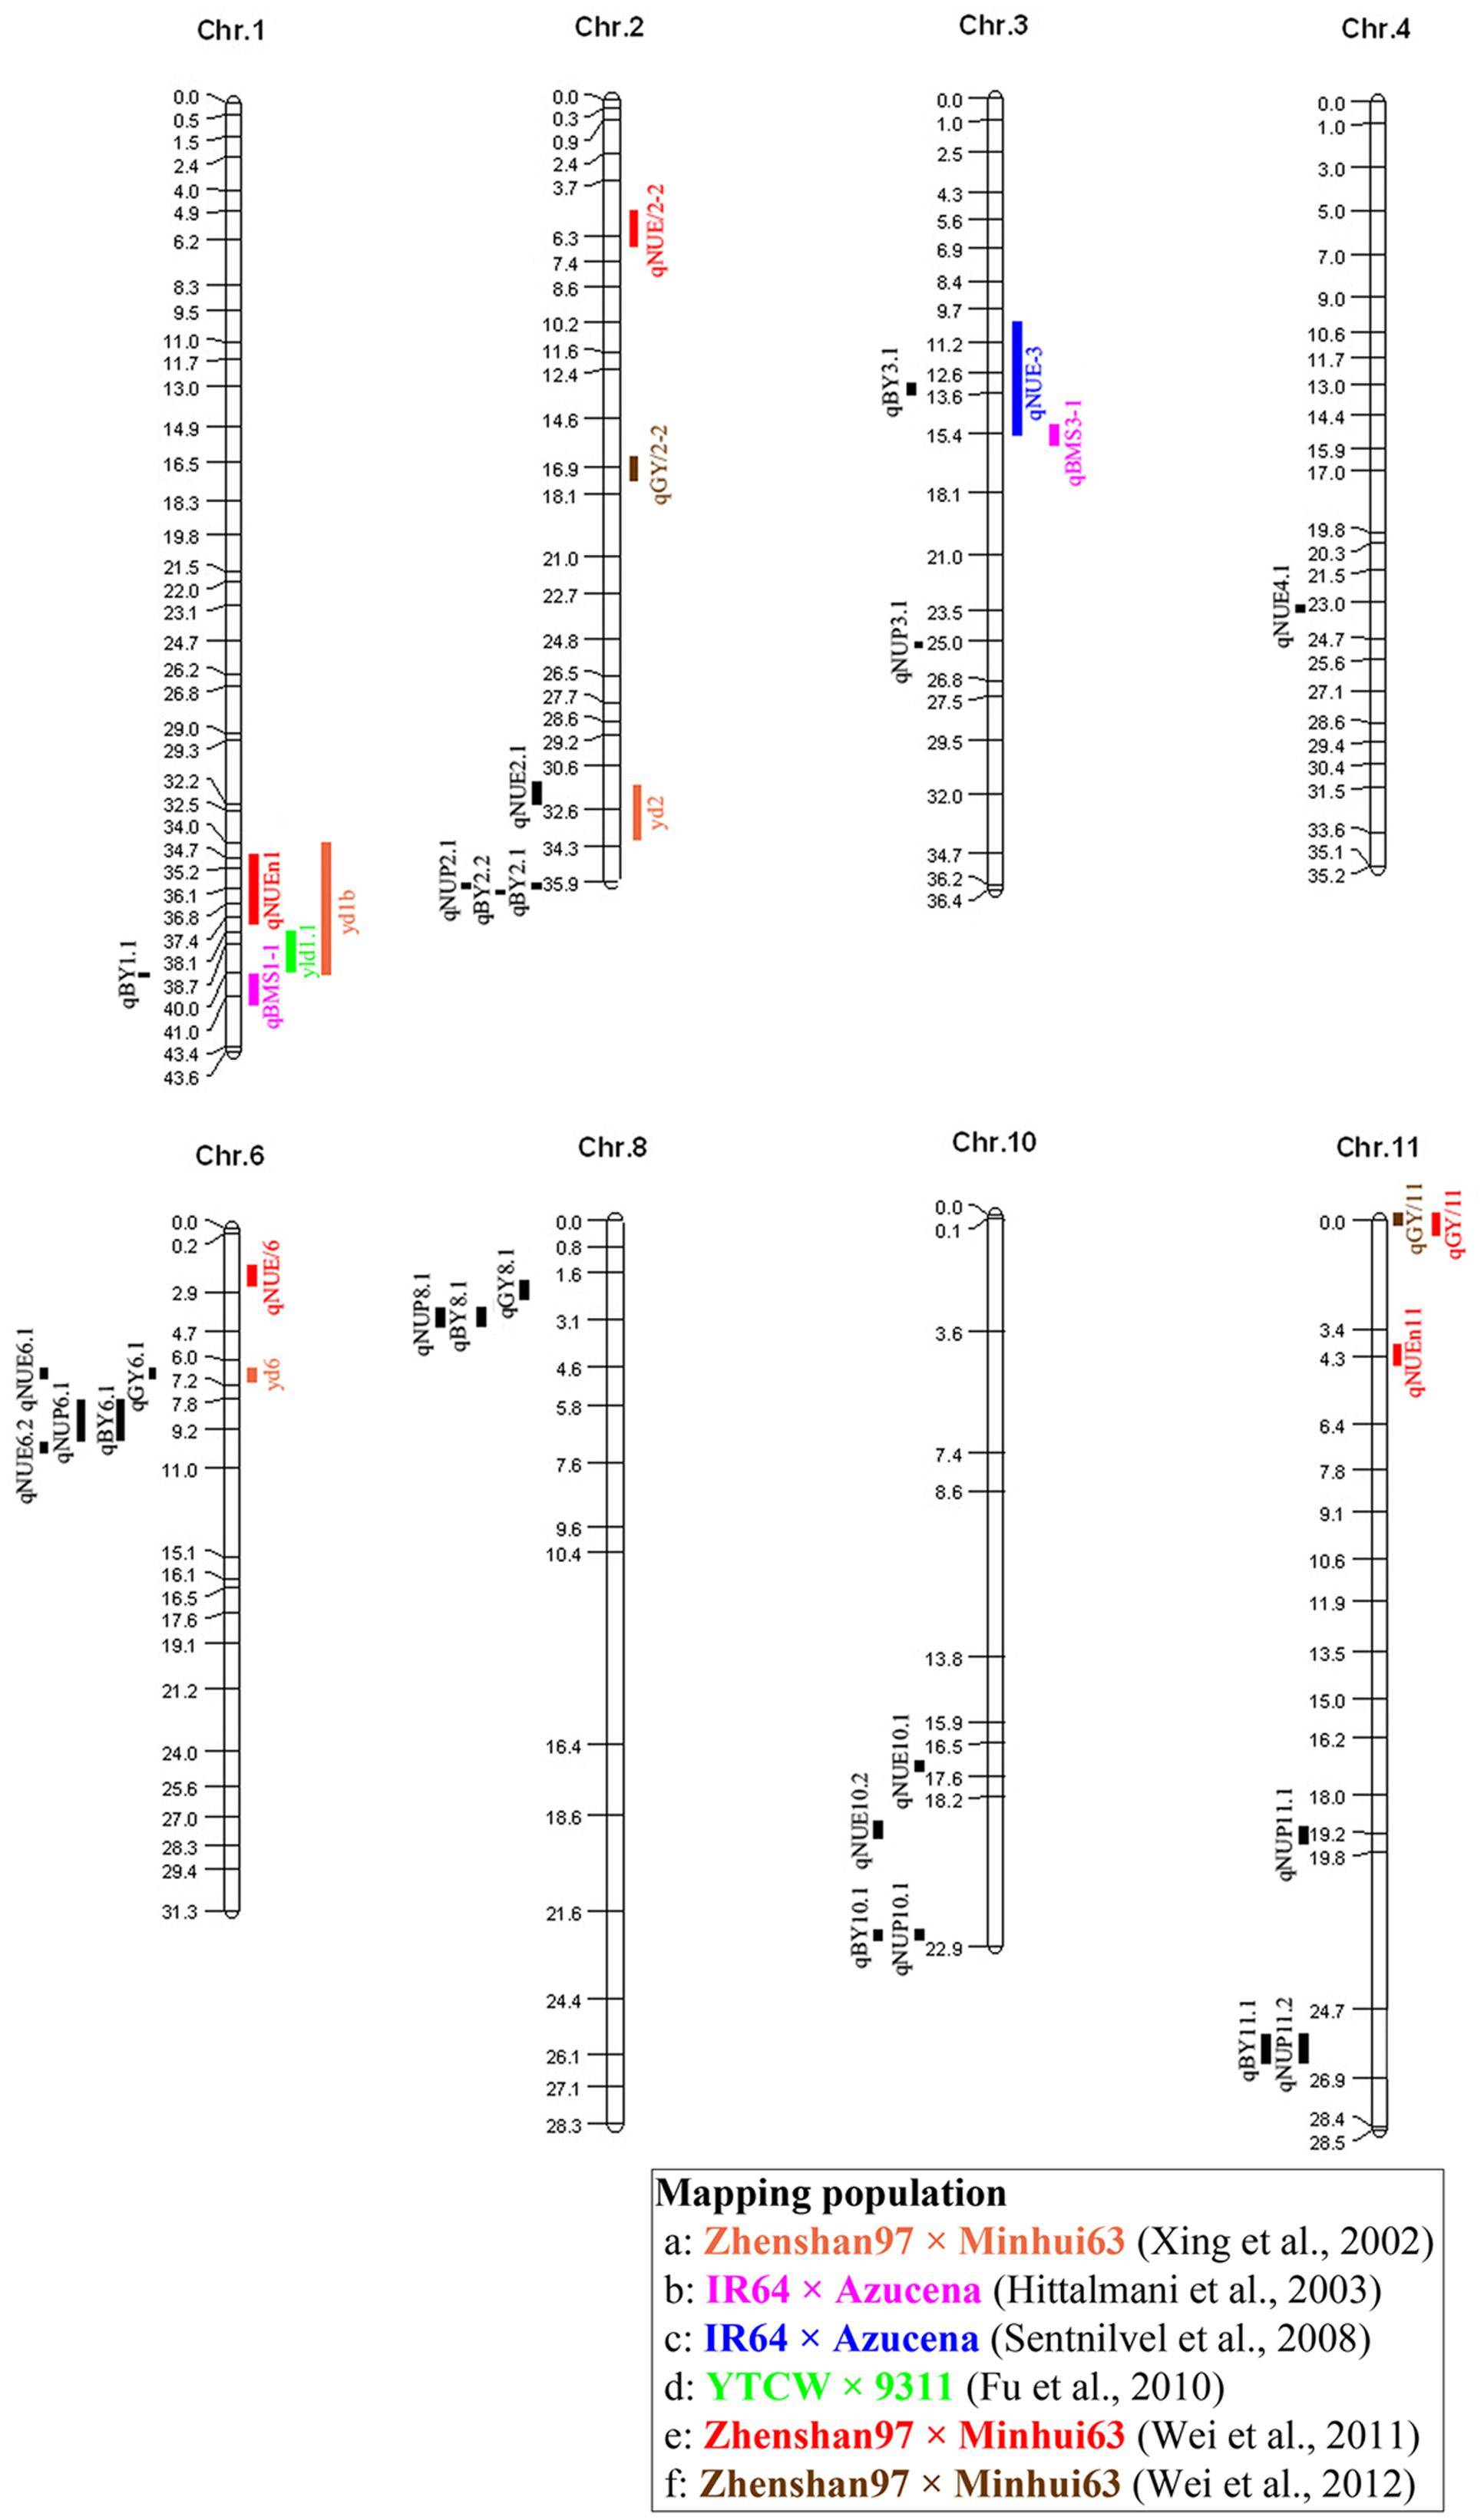
FIGURE 3. Rice molecular linkage map (without marker names) showing bin allocation of QTL detected in this study and six other mapping populations (a–f) evaluated for NUP, NUE, GY, and BY. QTL identified in this study and QTL identified in the six other mapping populations are labeled using acronyms on left and right sides, respectively, of chromosomes. The six populations (a–f) are labeled with different colors in accordance with corresponding acronyms for related traits.
Our correlation analysis results suggest that while both NUP and NUE have large effects on rice grain yield, NUP is more closely correlated with grain yield than NUE. In our previous studies (Dong et al., 2006, 2011), we reached similar conclusions based on NUP and NUE data from different varieties. It can thus be assumed that increasing NUP rather than NUE would be a more effective strategy for improving grain yield.
In this study, we identified 7 QTL for NUP and 6 QTL for NUE. Based on this information, we can pyramid high NUP and NUE loci using MAS to develop high-yield rice varieties requiring low N fertilizer input.
Author Contributions
YoZ conducted the statistical analysis and paper drafting; YT performed the experiments and data analysis; DT conducted the statistical analysis; JW revised the manuscript; JZ performed the experiments; YiW performed the experiments; QY performed the experiments; XY performed the experiments; YaZ performed the experiments; YuW performed the experiments; GL supervised the work and finalized the manuscript; GD designed the experiments and supervised the work.
Conflict of Interest Statement
The authors declare that the research was conducted in the absence of any commercial or financial relationships that could be construed as a potential conflict of interest.
Acknowledgments
This study was supported by grants from the Key Program of Basic Research of China (2013CBA01405), the National Natural Science Foundation of China (31100863 and 31571608) the Natural Science Fund for Colleges and Universities in Jiangsu Province (15KJA210003), the Prospective Agricultural Project of Yangzhou City (YZ2014165), the Research and Innovation Program of Postgraduates in Jiangsu Province (CXZZ12-0906), and the Priority Academic Program Development of Jiangsu Higher Education Institutions.
References
Cassman, K. G., Peng, S., Olk, D. C., Ladha, J. K., Reichardt, W., Dobermann, A., et al. (1998). Opportunities for increased nitrogen-use efficiency from improved resource management in irrigated rice systems. Field Crops Res. 56, 7–39. doi: 10.1016/S0378-4290(97)00140-8
Cho, Y. I., Jiang, W. Z., Chin, J. H., Piao, Z. Z., Cho, Y. G., McCouch, S. R., et al. (2007). Identification of QTLs associated with physiological nitrogen use efficiency in rice. Mol. Cells 23, 72–79.
Dong, G. C., Wang, Y., and Yu, X. F. (2011). Differences of nitrogen uptake and utilization of conventional rice varieties with different growth duration. Sci. Agric. Sin. 44, 4570–4582.
Dong, G. C., Wang, Y. L., Zhang, Y. F., Chen, P. F., Yang, L., and Huang, J. Y. (2006). Characteristics of yield and yield components in conventional indica rice cultivars with different nitrogen use efficiencies for grain output. Acta. Agron. Sin. 32, 1511–1518.
FAO (2004). Data from: “Food and Agriculture Organization (FAO) of the United Nations”. FAO Statistical Databases. Rome: FAO.
Fjellstrom, R., Conaway-Bormans, C. A., McClung, A. M., Marchetti, M. A., Shank, A. R., and Park, W. D. (2004). Development of DNA markers suitable for marker assisted selection of three Pi genes conferring resistance to multiple Pyricularia grisea pathotypes. Crop Sci. 44, 1790–1798. doi: 10.2135/cropsci2004.1790
Fjellstrom, R., McClung, A. M., and Shank, A. R. (2006). SSR markers closely linked to the Pi-z locus are useful for selection of blast resistance in a broad array of rice germplasm. Mol. Breed. 17, 149–157. doi: 10.1007/s11032-005-4735-4
Fu, Q., Zhang, P. J., Tan, L. B., Zhu, Z. F., Ma, D., Fu, Y. C., et al. (2010). Analysis of QTLs for yield-related traits in Yuanjiang common wild rice (Oryza rufipogon Griff.). J. Genet. Genomics 37, 147–157. doi: 10.1016/S1673-8527(09)60033-3
Godfray, H. C. J., Beddington, J. R., Crute, I. R., Haddad, L., Lawrence, D., Muir, J. F., et al. (2010). Food security: the challenge of feeding 9 billion people. Science 327, 812–818. doi: 10.1126/science.1185383
Gregory, P. J., and George, T. S. (2011). Feeding nine billion: the challenge to sustainable crop production. J. Exp. Bot. 62, 5233–5239. doi: 10.1093/jxb/err232
Hayashi, K., Yoshida, H., and Ashikawa, I. (2006). Development of PCR-based allele-specific and InDel marker sets for nine rice blast resistance genes. Theor. Appl. Genet. 113, 251–260. doi: 10.1007/s00122-006-0290-6
Hirel, B., Le Gouis, J., Ney, B., and Gallais, A. (2007). The challenge of improving nitrogen use efficiency in crop plants: towards a more central role for genetic variability and quantitative genetics within integrated approaches. J. Exp. Bot. 58, 2369–2387. doi: 10.1093/jxb/erm097
Hittalmani, S., Huang, N., Courtois, B., Venuprasad, R., Shashidhar, H. E., Zhuang, J. Y., et al. (2003). Identification of QTL for growth- and grain yield-related traits in rice across nine locations of Asia. Theor. Appl. Genet. 107, 679–690. doi: 10.1007/s00122-003-1269-1
Ishimaru, K., Kobayashi, N., Ono, K., Yano, M., and Ohsugi, R. (2001). Are contents of Rubisco, soluble protein and nitrogen in flag leaves of rice controlled by the same genetics? J. Exp. Bot. 52, 1827–1833. doi: 10.1093/jexbot/52.362.1827
Jia, Y. L., Wang, Z. H., Fjellstrom, R. G., Moldenhauer, K. A. K., Azam, M. A., Correll, J., et al. (2004). Rice Pi-ta gene confers resistance to the major pathotypes of the rice blast fungus in the United States. Phytopathology 94, 296–301. doi: 10.1094/PHYTO.2004.94.3.296
Ju, J., Yamamoto, Y., Wang, Y. L., Shan, Y. H., Dong, G. C., Yoshida, T., et al. (2006). Genotypic differences in grain yield, and nitrogen absorption and utilization in recombinant inbred lines of rice under hydroponic culture. Soil Sci. Plant Nutr. 52, 321–330. doi: 10.1111/j.1747-0765.2006.00041.x
Kraiser, T., Gras, D. E., Gutierrez, A. G., Gonzalez, B., and Gutierrez, R. A. (2011). A holistic view of nitrogen acquisition in plants. J. Exp. Bot. 62, 1455–1466. doi: 10.1093/jxb/erq425
Li, Y. F., Li, M. M., Cao, G. L., and Han, L. Z. (2010). Effects of genetic background on expression of QTL for nitrogen efficiency in irrigated rice and upland rice. Sci. Agric. Sin. 43, 4331–4340.
Lian, X. M., Xing, Y. Z., Yan, H., Xu, C. G., Li, X. H., and Zhang, Q. F. (2005). QTLs for low nitrogen tolerance at seedling stage identified using a recombinant inbred line population derived from an elite rice hybrid. Theor. Appl. Genet. 112, 85–96. doi: 10.1007/s00122-005-0108-y
Liu, J. G., You, L. Z., Amini, M., Obersteiner, M., Herrero, M., Zehnder, A. J. B., et al. (2010). A high-resolution assessment on global nitrogen flows in cropland. Proc. Natl. Acad. Sci. U.S.A. 107, 8035–8040. doi: 10.1073/pnas.0913658107
Liu, X. J., Zhang, Y., Han, W. X., Tang, A. H., Shen, J. L., Cui, Z. L., et al. (2013). Enhanced nitrogen deposition over China. Nature 494, 459–462. doi: 10.1038/nature11917
Mulvaney, R. L., Khan, S. A., and Ellsworth, T. R. (2009). Synthetic nitrogen fertilizers deplete soil nitrogen: a global dilemma for sustainable cereal production. J. Environ. Qual. 38, 2295–2314. doi: 10.2134/jeq2008.0527
Obara, M., Kajiura, M., Fukuta, Y., Yano, M., Hayashi, M., Yamaya, T., et al. (2001). Mapping of QTLs associated with cytosolic glutamine synthetase and NADH-glutamate synthase in rice (Oryza sativa L.). J. Exp. Bot. 52, 1209–1217.
Obara, M., Sato, T., Sasaki, S., Kashiba, K., Nagano, A., Nakamura, I., et al. (2004). Identification and characterization of a QTL on chromosome 2 for cytosolic glutamine synthetase content and panicle number in rice. Theor. Appl. Genet. 110, 1–11. doi: 10.1007/s00122-004-1828-0
Peng, S. B., Buresh, R. J., Huang, J. L., Yang, J. C., Zou, Y. B., Zhong, X. H., et al. (2006). Strategies for overcoming low agronomic nitrogen use efficiency in irrigated rice systems in China. Field Crops Res. 96, 37–47. doi: 10.1016/j.fcr.2005.05.004
Peng, S. B., Huang, J. L., Zhong, X. H., Yang, J. C., Wang, G. H., Zou, Y. B., et al. (2002). Challenge and opportunity in improving fertilizer-nitrogen use efficiency of irrigated rice in China. Sci. Agric. Sin. 1, 776–785.
Piao, Z. Z., Li, M. B., Li, P. D., Zhang, J. M., Zhu, C. M., Wang, H., et al. (2009). Bayesian dissection for genetic architecture of traits associated with nitrogen utilization efficiency in rice. Afr. J. Biotechnol. 8, 6834–6839.
Senthilvel, S., Vinod, K. K., Malarvizhi, P., and Maheswaran, M. (2008). QTL and QTL x environment effects on agronomic and nitrogen acquisition traits in rice. J. Integr. Plant. Biol. 50, 1108–1117. doi: 10.1111/j.1744-7909.2008.00713.x
Shan, Y. H., Wang, Y. L., and Pan, X. B. (2005). Mapping of QTLs for nitrogen use efficiency and related traits in rice (Oryza sativa L.). Agric. Sci. Chin. 4, 721–727. doi: 10.1007/s10142-016-0486-z
Shen, J., and Zhang, F. (2006). Theory and Practice of Nutrient Resources Management on Rice. Beijing: Agricultural University Press.
Takeuchi, Y., Ebitani, T., Yamamoto, T., Sato, H., Ohta, H., Hirabayashi, H., et al. (2006). Development of isogenic lines of rice cultivar Koshihikari with early and late heading by marker-assisted selection. Breed. Sci. 56, 405–413. doi: 10.1270/jsbbs.56.405
Vance, C. P. (2001). Symbiotic nitrogen fixation and phosphorus acquisition. Plant nutrition in a world of declining renewable resources. Plant Physiol. 127, 390–397. doi: 10.1104/pp.010331
Vitousek, P. M., Naylor, R., Crews, T., David, M. B., Drinkwater, L. E., Holland, E., et al. (2009). Nutrient imbalances in agricultural development. Science 324, 1519–1520. doi: 10.1126/science.1170261
von Braun, J. (2010). Food insecurity, hunger and malnutrition: necessary policy and technology changes. New Biotechnol. 27, 449–452. doi: 10.1016/j.nbt.2010.08.006
Wei, D., Cui, K. H., Pan, J. F., Ye, G. Y., Xiang, J., Nie, L. X., et al. (2011). Genetic dissection of grain nitrogen use efficiency and grain yield and their relationship in rice. Field Crops Res. 124, 340–346. doi: 10.1016/j.fcr.2011.07.003
Wei, D., Cui, K. H., Ye, G. Y., Pan, J. F., Xiang, J., Huang, J. L., et al. (2012). QTL mapping for nitrogen-use efficiency and nitrogen-deficiency tolerance traits in rice. Plant Soil 359, 281–295. doi: 10.1007/s11104-012-1142-6
Xing, Y. Z., Tan, Y. F., Hua, J. P., Sun, X. L., Xu, C. G., and Zhang, Q. (2002). Characterization of the main effects, epistatic effects and their environmental interactions of QTLs on the genetic basis of yield traits in rice. Theor. Appl. Genet. 105, 248–257. doi: 10.1007/s00122-002-0952-y
Xu, J. J., Zhao, Q. A., Du, P. N., Xu, C. W., Wang, B. H., Feng, Q., et al. (2010). Developing high throughput genotyped chromosome segment substitution lines based on population whole-genome re-sequencing in rice (Oryza sativa L.). BMC Genomics 11:656. doi: 10.1186/1471-2164-11-656
Yamamoto, T., Lin, H. X., Sasaki, T., and Yano, M. (2000). Identification of heading date quantitative trait locus Hd6 and characterization of its epistatic interactions with Hd2 in rice using advanced backcross progeny. Genetics 154, 885–891.
Zeigler, R. S., and Mohanty, S. (2010). Support for international agricultural research: current status and future challenges. New Biotechnol. 27, 565–572. doi: 10.1016/j.nbt.2010.08.003
Zeng, X. M., Han, B. J., Xu, F. S., Huang, J. L., Cai, H. M., and Shi, L. (2012). Effects of modified fertilization technology on the grain yield and nitrogen use efficiency of midseason rice. Field Crops Res. 137, 203–212. doi: 10.1016/j.fcr.2012.08.012
Keywords: rice, nitrogen uptake, nitrogen use efficiency, QTL mapping, CSSLs
Citation: Zhou Y, Tao Y, Tang D, Wang J, Zhong J, Wang Y, Yuan Q, Yu X, Zhang Y, Wang Y, Liang G and Dong G (2017) Identification of QTL Associated with Nitrogen Uptake and Nitrogen Use Efficiency Using High Throughput Genotyped CSSLs in Rice (Oryza sativa L.). Front. Plant Sci. 8:1166. doi: 10.3389/fpls.2017.01166
Received: 30 March 2017; Accepted: 19 June 2017;
Published: 11 July 2017.
Edited by:
Maoteng Li, Huazhong University of Science and Technology, ChinaReviewed by:
Liezhao Liu, College of Agronomy and Biotechnology, Southwest University, ChinaMeixue Zhou, University of Tasmania, Australia
John Lu, Agriculture and Agri-Food Canada, Canada
Copyright © 2017 Zhou, Tao, Tang, Wang, Zhong, Wang, Yuan, Yu, Zhang, Wang, Liang and Dong. This is an open-access article distributed under the terms of the Creative Commons Attribution License (CC BY). The use, distribution or reproduction in other forums is permitted, provided the original author(s) or licensor are credited and that the original publication in this journal is cited, in accordance with accepted academic practice. No use, distribution or reproduction is permitted which does not comply with these terms.
*Correspondence: Guichun Dong, Z2Nkb25nQHl6dS5lZHUuY24= Guohua Liang, cmljZWdiQHl6dS5lZHUuY24=
†These authors have contributed equally to this work.