 Phanu T. Serivichyaswat
 Hendry Susila
 Ji Hoon Ahn
- Department of Life Sciences, Korea University, Seoul, South Korea
Arabidopsis microRNA169 (miR169) is an ambient temperature-responsive microRNA that plays an important role in stress responses and the floral transition. However, the transcription factors that regulate the expression of MIR169 have remained unknown. In this study, we show that Elongated Hypocotyl 5-Homolog (HYH) directly binds to the promoter of MIR169a and negatively regulates its expression. Absolute quantification identified MIR169a as the major locus producing miR169. GUS reporter assays revealed that the deletion of a 498-bp fragment (–1,505 to –1,007, relative to the major transcriptional start site) of MIR169a abolished its ambient temperature-responsive expression. DNA-affinity chromatography followed by liquid chromatography-mass spectrometry analysis identified transcription factor HYH as a trans-acting factor that binds to the 498-bp promoter fragment of pri-miR169a. Electrophoretic mobility shift assays and chromatin immunoprecipitation–quantitative PCR demonstrated that the HYH.2 protein, a predominant isoform of HYH, directly associated with a G-box-like motif in the 498-bp fragment of pri-miR169a. Higher enrichment of HYH.2 protein on the promoter region of MIR169a was seen at 23°C, consistent with the presence of more HYH.2 protein in the cell at the temperature. Transcript levels of pri-miR169a increased in hyh mutants and decreased in transgenic plants overexpressing HYH. Consistent with the negative regulation of MIR169a by HYH, the diurnal levels of HYH mRNA and pri-miR169a showed opposite patterns. Taken together, our results suggest that HYH is a transcription factor that binds to a G-box-like motif in the MIR169a promoter and negatively regulates ambient temperature-responsive expression of MIR169a at higher temperatures in Arabidopsis.
Introduction
Temperature is one of the major factors that govern plant development and physiological processes. For example, in Arabidopsis thaliana (Arabidopsis), exposure to a prolonged period of low temperature (i.e., vernalization) can shorten the time of flowering, especially in winter accessions. Small changes in temperature within the tolerable range, i.e., ambient temperature, also affect physiology and development of numerous plant species. For example, fluctuation of ambient temperature correlates with an increase of respiration rates (Atkin and Tjoelker, 2003), and higher ambient temperatures can shorten the time to flowering (Fitter and Fitter, 2002).
MicroRNAs (miRNAs) can induce sequence-specific gene silencing transcriptionally and post-transcriptionally (Voinnet, 2009), and regulate environmental responses, development, and hormone signaling in plants and animals (Bartel, 2009). In Arabidopsis, numerous miRNAs affect plant development. For example, miR169 affects plant responses to abiotic stress (Zhang et al., 2011a), cold stress (Zhou et al., 2008), salinity (Zhao et al., 2009), nitrogen deficiency (Zhao et al., 2011), and exposure to UV-B radiation (Zhou et al., 2007). MiR169 is also involved in development (Gonzalez-Ibeas et al., 2011) and floral initiation (Xu et al., 2014). Expression and accumulation of miR169 are significantly up-regulated at a low temperature (16°C), suggesting that miR169 may be involved in the ambient temperature response (Lee et al., 2010). Therefore, the transcriptional regulation of miR169 may be one of the key regulatory events in the ambient temperature response in plants.
MiR169 targets Nuclear Factor Y Subunit A (NF-YA) family genes (Jones-Rhoades and Bartel, 2004; German et al., 2008). NF-YA forms a heterotrimeric transcription factor complex with NF-YB and NF-YC subunits. The NF-Ys of animals are produced from single genes, but in plants, the three NF-Y subunits are encoded by multi-gene families (Edwards et al., 1998). The A. thaliana genome has 10 A subunit genes, 13 B subunit genes, and 13 C subunit genes (Siefers et al., 2009); this diversity could theoretically produce 1,690 unique NF-Y complexes. The NF-Y transcription factors act as positive transcriptional regulators but can also repress gene expression (Ceribelli et al., 2008; Leyva-Gonzalez et al., 2012).
Elongated Hypocotyl 5 (HY5) and its homolog HY5-Homolog (HYH) are basic leucine zipper (bZIP) transcription factors that function in lateral root formation, secondary root thickening, and photomorphogenesis of seedlings (Oyama et al., 1997). In A. thaliana, HYH is the closest homolog of HY5, showing 49% amino acid identity with HY5, especially in the DNA-binding basic domain (21 identical residues out of 24) and the bZIP transcription factor domain in the C-terminal half (Holm et al., 2002). Due to their high sequence similarity, HYH and HY5 bind to many of the same DNA motifs, including the G-box (Holm et al., 2002) and GATA box (Shi et al., 2011). In addition to their functions in transcriptional regulation in response to light, increasing evidence suggests that HYH and HY5 are involved in temperature acclimatization and transcriptional regulation (for instance, promotion of the transcription of PEX11b, YUC8, XTR7, and EXP8) (Hu and Desai, 2008; Zhang et al., 2011b,c; Toledo-Ortiz et al., 2014; Gangappa and Kumar, 2017; Park et al., 2017).
Although several reports have examined miR169-mediated regulation of target gene expression (Jones-Rhoades and Bartel, 2004; German et al., 2008), the upstream transcriptional regulation of MIR169 itself remains unexplored. In this study, we identified cis-acting elements and a transcription factor involved in the regulation of ambient temperature-responsive expression of MIR169. We found that HYH binds the region of the MIR169 promoter required for response to ambient temperature and represses MIR169 expression. Taking our results together, we propose that HYH acts in the ambient temperature pathway as a transcription factor that binds to a G-box-like motif upon increasing temperature to repress the expression of MIR169a.
Materials and Methods
Plant Materials and Growth Conditions
Arabidopsis thaliana (L.) ecotypes Columbia (Col-0) and Wassilewskija-2 (Ws-2) were used in this study. The hyh mutants, which are in the Ws-2 background, were generously provided by Prof. Gareth Jenkins (University of Glasgow, United Kingdom). MIM169, a target mimic of miR169 that was designed to target miR169a, b, c, h, i, j, k, l, m, and n, was used to inhibit the miR169 activity (Todesco et al., 2010). Plants were grown in soil or on Murashige and Skoog (MS) media at 16 and 23°C under standard long-day (LD) conditions (16 h:8 h light:dark) with light intensity of 120 μmol m-2 s-1. Eight-day-old seedlings (unless otherwise indicated) were sampled and immediately frozen in liquid nitrogen prior to RNA or protein extraction.
Generation of Transgenic Plants
For the promoter deletion analyses, the full-length promoter (2.1 kb) of MIR169a along with a series of 5′-deletions of the promoter (1.7, 1.2, 0.6, and 0.14 kb) were amplified from the genomic DNA using PCR. Each amplicon was named p169.1, p169.2, p169.3, p169.4, and p169.5, respectively. The full-length promoter and 5′-deletion fragments were then cloned into the pBI101 vector (Clontech, United States), which contains the β-glucuronidase (GUS) reporter gene. We named the resulting constructs p169.1::GUS, p169.2::GUS, p169.3::GUS, p169.4::GUS, and p169.5::GUS. To generate MIR169a-overexpressing plants, the genomic fragment of MIR169a was amplified by PCR, and then cloned into the pCHF3 binary vector harboring the 35S promoter. To generate HYH-overexpressing plants, HYH cDNAs were amplified from total RNA using RT-PCR and then cloned into the pBA-HA binary vector. The sequence of each plasmid construct was verified by sequencing (Cosmogenetech, South Korea). The constructed plasmids were then introduced into wild-type Col-0 plants using the floral dip method (Clough and Bent, 1998). The homozygous transgenic plants were isolated and used for the subsequent experiments. Information on the primers that were used in this study is shown in Supplementary Table 1.
Gene Expression Analyses
Total RNA was extracted from 8-day-old seedlings using Plant RNA Purification Reagent (Invitrogen, United States). The extracted RNA was treated with DNase I (NEB, United States) to eliminate DNA contamination, then cDNA was synthesized using the Transcriptor First-Strand cDNA Synthesis Kit (Roche Applied Science, United States). The transcript levels were measured by quantitative real-time PCR (qRT-PCR), using Green I Master Mix (Roche Applied Science, United States) with specific primers (Supplementary Table 1). The data were normalized against two stable reference genes, PP2AA3 (AT1G13320) and a SAND family gene (AT2G28390) (Hong et al., 2010). All reactions were carried out with three biological replicates, each with three technical replicates. The absolute quantification was performed as previously described (Whelan et al., 2003), using serial dilutions of known concentrations of the cloned open-reading frames for the generation of the standard curve. For the analyses of the expression of HYH splice variants, our published RNA sequencing (RNA-seq) data for Col-0 plants grown at 23°C (GSE87851) (Nasim et al., 2017) were downloaded and analyzed.
For western blot experiments, total proteins were extracted with Pro-Prep protein extraction buffer (Intron Biotechnology) using 8-day-old seedlings grown on MS media supplemented with 1.5% sucrose at 16 and 23°C under LD conditions. Samples were harvested at zeitgeber time 4 (ZT4). HA:HYH protein was detected using monoclonal anti-HA-antibodies (Sigma, H9658) and polyclonal anti-Actin-antibodies (Agrisera) were used to detect actin, which was used as a loading control.
Histochemical and Fluorometric GUS Assays
Histochemical localization of GUS was analyzed in the 8-day-old transgenic seedlings expressing GUS under the control of the MIR169a promoter fragments. The samples were incubated for 12 h at 37°C with the substrate solution (1 mM 5-bromo-4-chloro-3-indolyl-β-D-glucuronide, pH 7.0, 100 mM sodium phosphate buffer, 10 mM Na2EDTA, 0.5 mM potassium ferricyanide, 0.5 mM potassium ferrocyanide, and 0.1% Triton X-100). Stained seedlings were washed with 70% ethanol to eliminate chlorophyll, and were then photographed with a Nikon SMZ1000 Stereomicroscope (Tokyo, Japan). GUS enzymatic activity was quantified using the GUS Fluorescent Reporter Gene Activity Detection Kit (Sigma, United States) according to the manufacturer’s instructions. The assay was performed with three biological replicates, each with three technical replicates. Statistical analysis for the enzymatic activity was conducted using one-way analysis of variance (ANOVA), and the means were compared using Duncan’s Multiple Range Test.
DNA-Affinity Chromatography and Liquid Chromatography-Mass Spectrometry (LC-MS)
DNA-binding proteins were enriched using DNA-affinity chromatography as previously described (Jutras et al., 2012). Total protein was extracted from 8-day-old Col-0 seedlings grown on MS media at 16 and 23°C. A bait DNA was designed based on the 498-bp fragment (-1,505 to -1,007, relative to the major transcription start site, TSS) on the MIR169a promoter, and generated from the genomic DNA using PCR with one 5′-biotin-modified and one unmodified primers (Supplementary Table 1). The biotin-labeled bait DNA was affixed to Dynabeads MyOne Streptavidin T1 (Invitrogen, United States). Elution was carried out with various NaCl concentrations. The eluents were then subjected to SDS gel electrophoresis, and visualized by silver staining. A single band that was eluted in the 200 mM NaCl buffer was excised, and subjected to Liquid Chromatography-Mass Spectrometry (LC-MS) (Korea Basic Science Institute). Peptide sequences were compared against Arabidopsis proteins using Protein BLAST1. Significant parameters were fixed at p < 0.05.
Recombinant Protein Production and Purification
To produce His-tagged HYH protein, the open-reading frame of Arabidopsis HYH.2 (the major splice variant of HYH) was cloned from cDNA using RT-PCR (primer information in Supplementary Table 1), and ligated into the pET28a+ vector (EMD Biosciences, United States). The cloned insert was sequenced to confirm that it lacked mutations, was in-frame, and had the histidine tag. The plasmid was then introduced into Escherichia coli BL21 cells. The recombinant protein was induced by the addition of 1 mM IPTG after 3 h of incubation at 37°C in LB media. The IPTG-induced cell pellets were collected by centrifugation, resuspended in 1× His-binding buffer (5 mM imidazole, 0.5 M NaCl, 20 mM Tris–HCl pH 7.9), sonicated, then centrifuged. The supernatant containing soluble HYH.2-His protein was collected and then purified using His GraviTrap (GE Healthcare Life Sciences, United States). SDS–PAGE and western blotting using anti-His antibody were then carried out to check the protein quality and identity, respectively.
Electrophoretic Mobility Shift Assays (EMSAs)
The DNA sequences of the predicted HYH-binding motifs were synthesized with a 5′-biotin label (Cosmogen, Korea). Electrophoretic mobility shift assays (EMSAs) were performed using the LightShift Chemiluminescent EMSA Kit (Thermo Scientific, United States) according to the manufacturer’s instructions. Double-stranded 5′-biotin-labeled oligonucleotides were used as DNA probes (Supplementary Table 1), and together with the purified HYH.2-His protein (100 ng), the reactions were incubated at room temperature for 30 min. The reaction samples were then subjected to electrophoresis in an 8% native polyacrylamide gel and transferred to a nylon membrane. Visualization was performed as described in the manufacturer’s instructions (Thermo Scientific, United States).
Chromatin Immunoprecipitation (ChIP)–qPCR
Chromatin immunoprecipitation (ChIP) was performed as described (Song et al., 2016) using 12-day-old seedlings grown on MS media supplemented with 1.5% sucrose at 16 and 23°C under LD conditions. Samples were harvested at ZT4. The genomic fragment was immunoprecipitated with monoclonal anti-HA-antibodies (Sigma, H9658) conjugated with Dynabeads Protein G (Thermo Scientific, 10003D). The relative enrichment of each amplified fragment was analyzed according to the “% of input” method (Haring et al., 2007). ChIP assay was carried out in two biological replicates, each with three technical replicates. qPCR was done using the primers shown in Supplementary Table 1.
Results
MIR169a Is the Major Locus of the miR169 Family
Mature miR169 is generated from 14 loci in the A. thaliana genome, comprising the largest family among Arabidopsis miRNAs. To identify the major locus of the miR169 family, we performed absolute quantification using qPCR to determine the abundance of transcripts from each pri-miR169 locus from wild-type Arabidopsis plants at 23 and 16°C. As shown in Figure 1, pri-miR169a was the most abundant of all transcripts generated from the loci (∼20,000 transcripts/ng of total RNA at 16°C and ∼5,000 transcripts/ng of total RNA at 23°C), followed by pri-miR169m, l, k, and d, which had similar amounts of transcripts (∼1,000–3,000 transcripts/ng of total RNA). By contrast, pri-miR169g, f, c, i, b, and j showed very low levels of transcripts (<500 transcripts/ng of total RNA at both temperatures). The results suggested that MIR169a was the major locus of the miR169 family at both 23 and 16°C and furthermore its expression levels were approximately four times higher at 16 than at 23°C. The 14 loci produce four mature miR169 isoforms; therefore, we suggest that the miR169a isoform has the highest abundance, followed by miR169h–n, d–g, and bc. Consistent with our observation, deep-sequencing results also suggest that MIR169a is the major locus of the miR169 family (Bologna et al., 2013), although levels of the minor isoforms are partly inconsistent with our results, most likely due to the different quantification methods used. Based on its high level of expression, we selected MIR169a for subsequent experiments in this study.
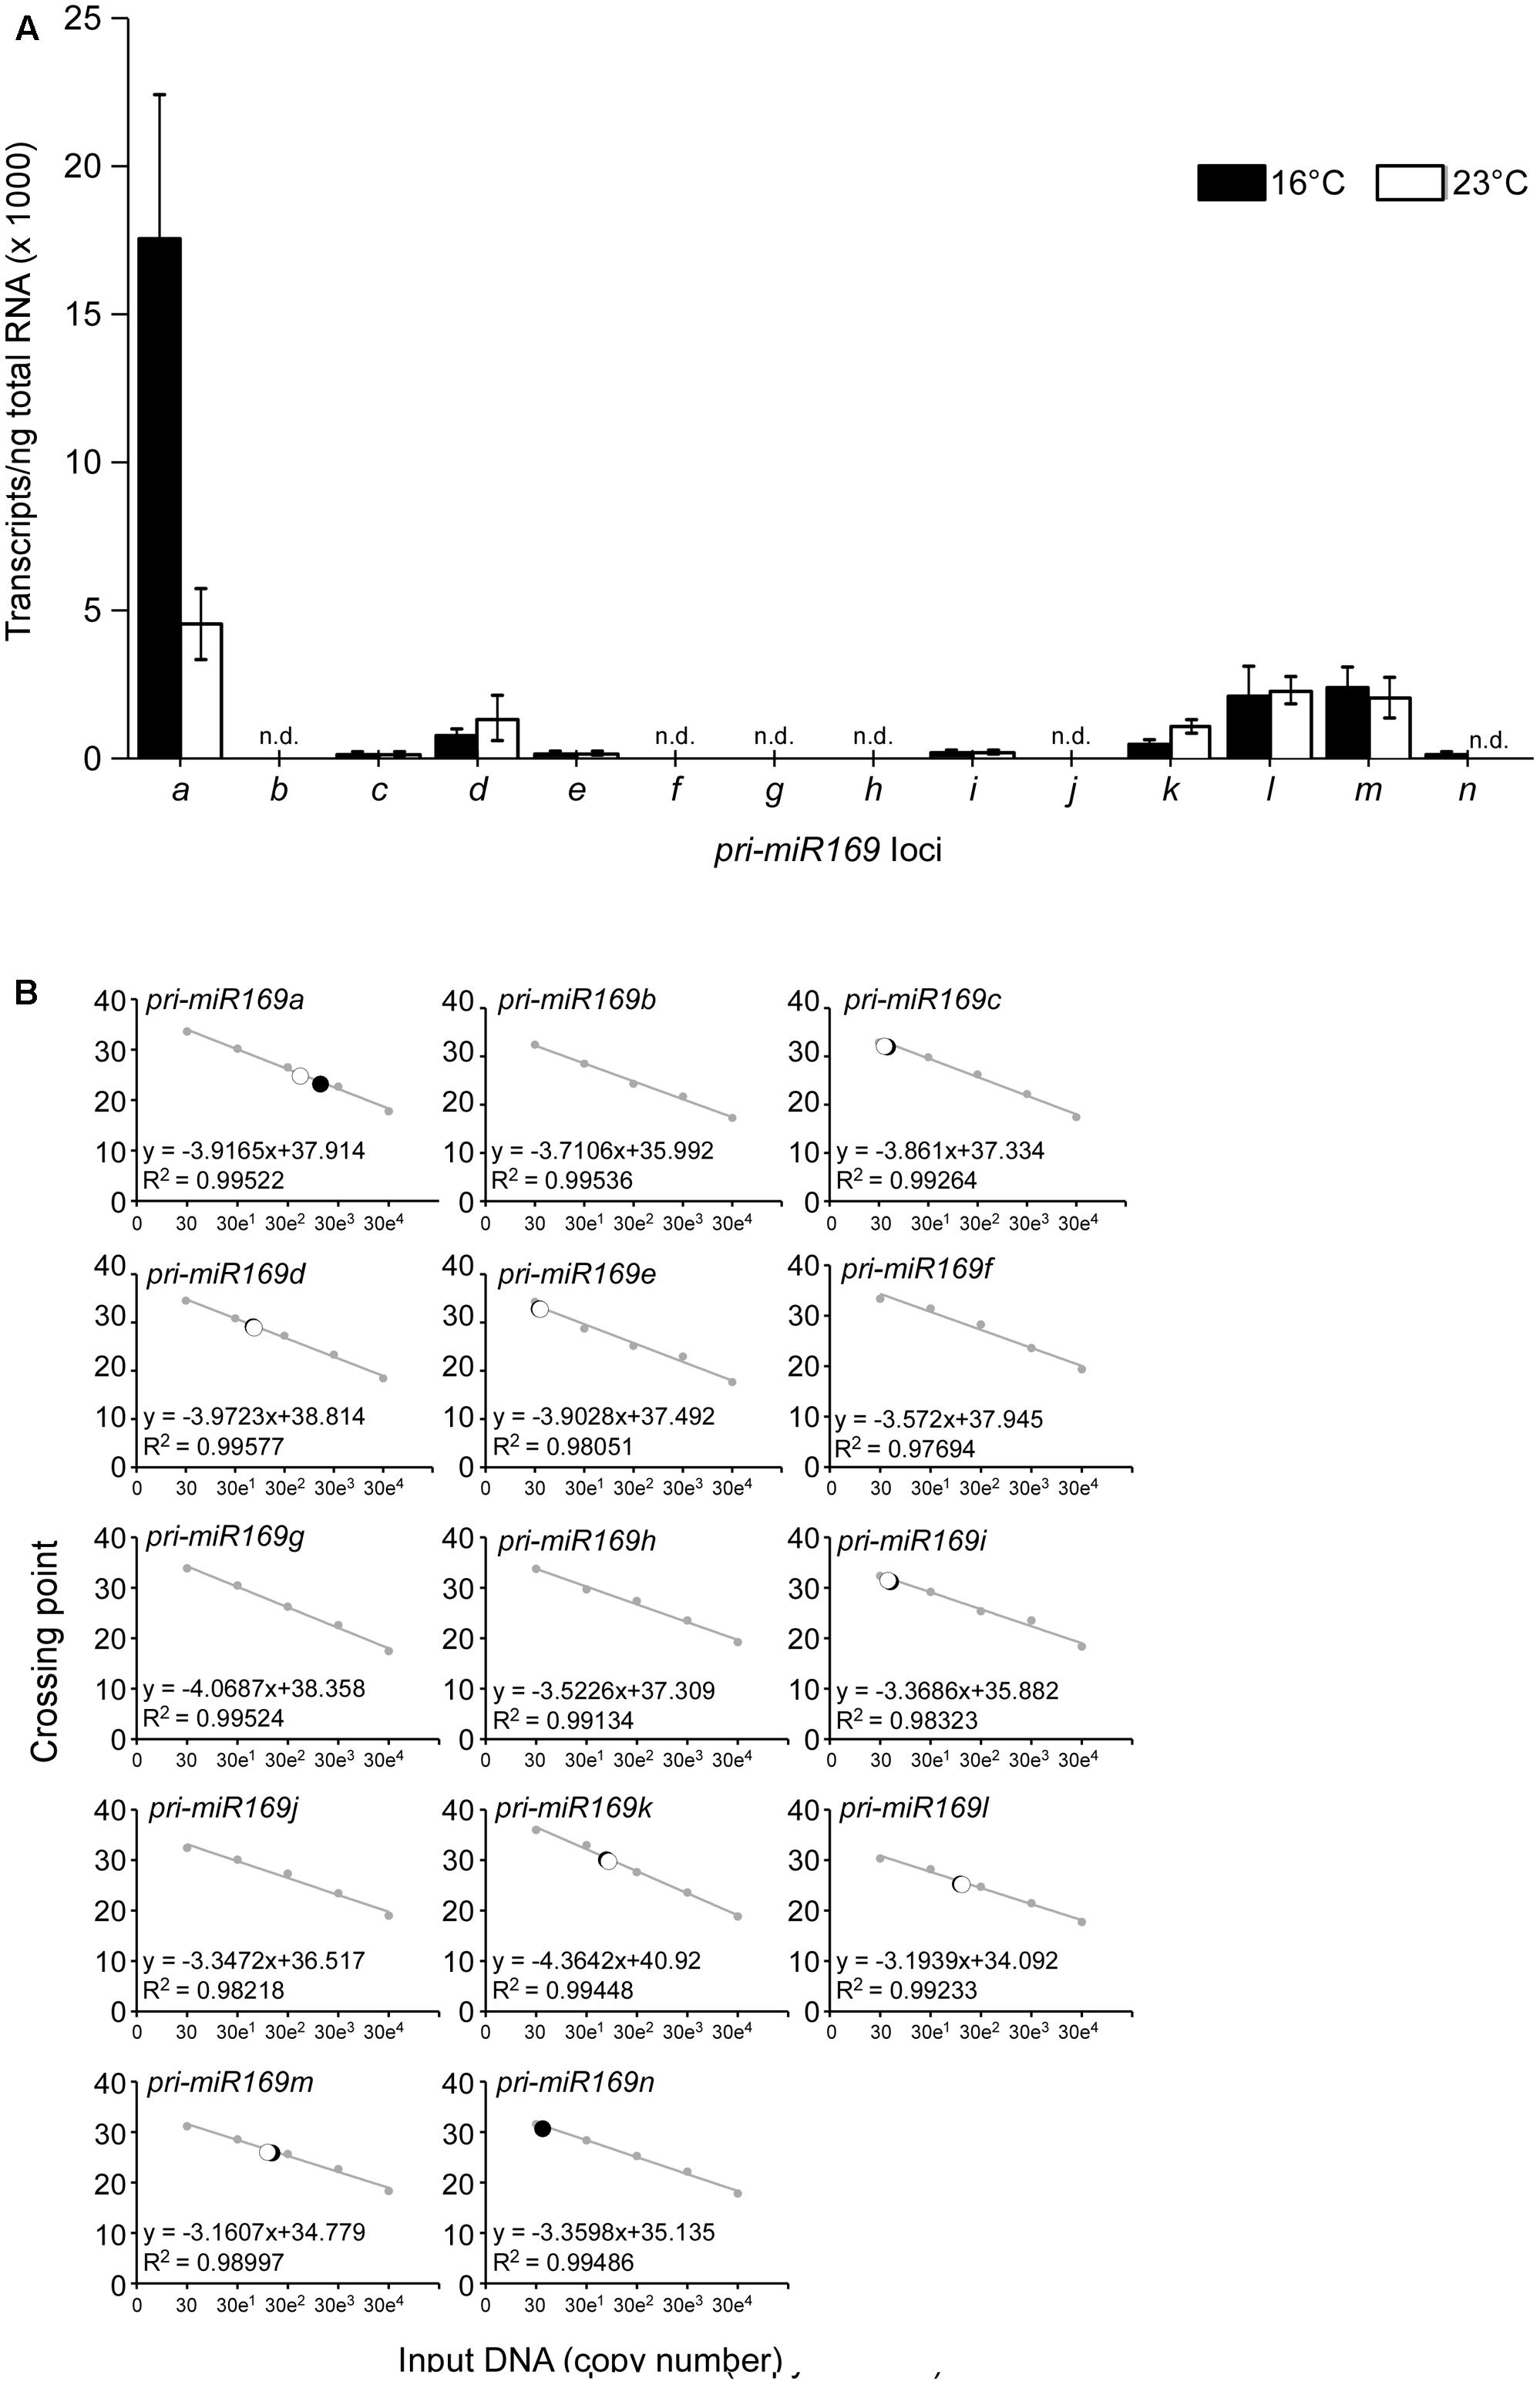
FIGURE 1. Absolute quantification of pri-miR169 species at 23 and 16°C. (A) Absolute quantification of the abundance of the primary transcripts of each MIR169 in 8-day-old Col-0 grown at 23 and 16°C under LD conditions. All values are presented as the mean ± SD of three biological replicates. n.d., not detectable. (B) The regression line from the standard curves used to determine the concentration of each pri-miR169 transcript at 23 and 16°C. The set of standards (gray) contains 10-fold serial dilutions from 30 to 300,000 copies of each transcript. The regression line from the dilution curve was used to determine the concentration of each transcript. Closed circles indicate data points at 16°C and open circles indicate data points at 23°C. Crossing point represents Ct-values from the qPCR.
The MIR169a Promoter Contains Several Regulatory Elements That Are Involved in Environmental Responses
To initially narrow down the important DNA regions that are responsible for the ambient temperature responsiveness of the MIR169a promoter, we performed a 5′-promoter deletion analysis. We cloned approximately 2 kb of the genomic region upstream from the previously reported major TSS of MIR169a (Xie et al., 2005). Analysis of the cis-acting elements of the MIR169a promoter using PlantCARE2 showed the presence of 19 different classes of potential cis-acting elements that may be involved in environmental responses (Figure 2A and Supplementary Table 1). These included 11 light-responsive elements (i.e., GA-motif, Box I, TCT-motif, GATA-motif, AE-box, MNF1, G-box, ACE, LAMP-element, GT1, and I-box), four abiotic stress-inducible elements including a low temperature-responsive (LTR) element, a drought-inducible element (MBS), an enhancer-like element involved in anoxic-specific inducibility (GC-motif), and an anaerobic induction element (ARE-box), and four defense-responsive elements including a wound-responsive element (Wun-box), a defense and stress-responsive element (TC-rich repeats), a salicylic acid-responsive element (TCA-element), and a jasmonate-responsive element (TGACG). The identification of these putative cis-acting elements suggests that the promoter of MIR169a may respond to various environmental signals, including low temperature, light, drought, anoxia, and pest and pathogen attack.
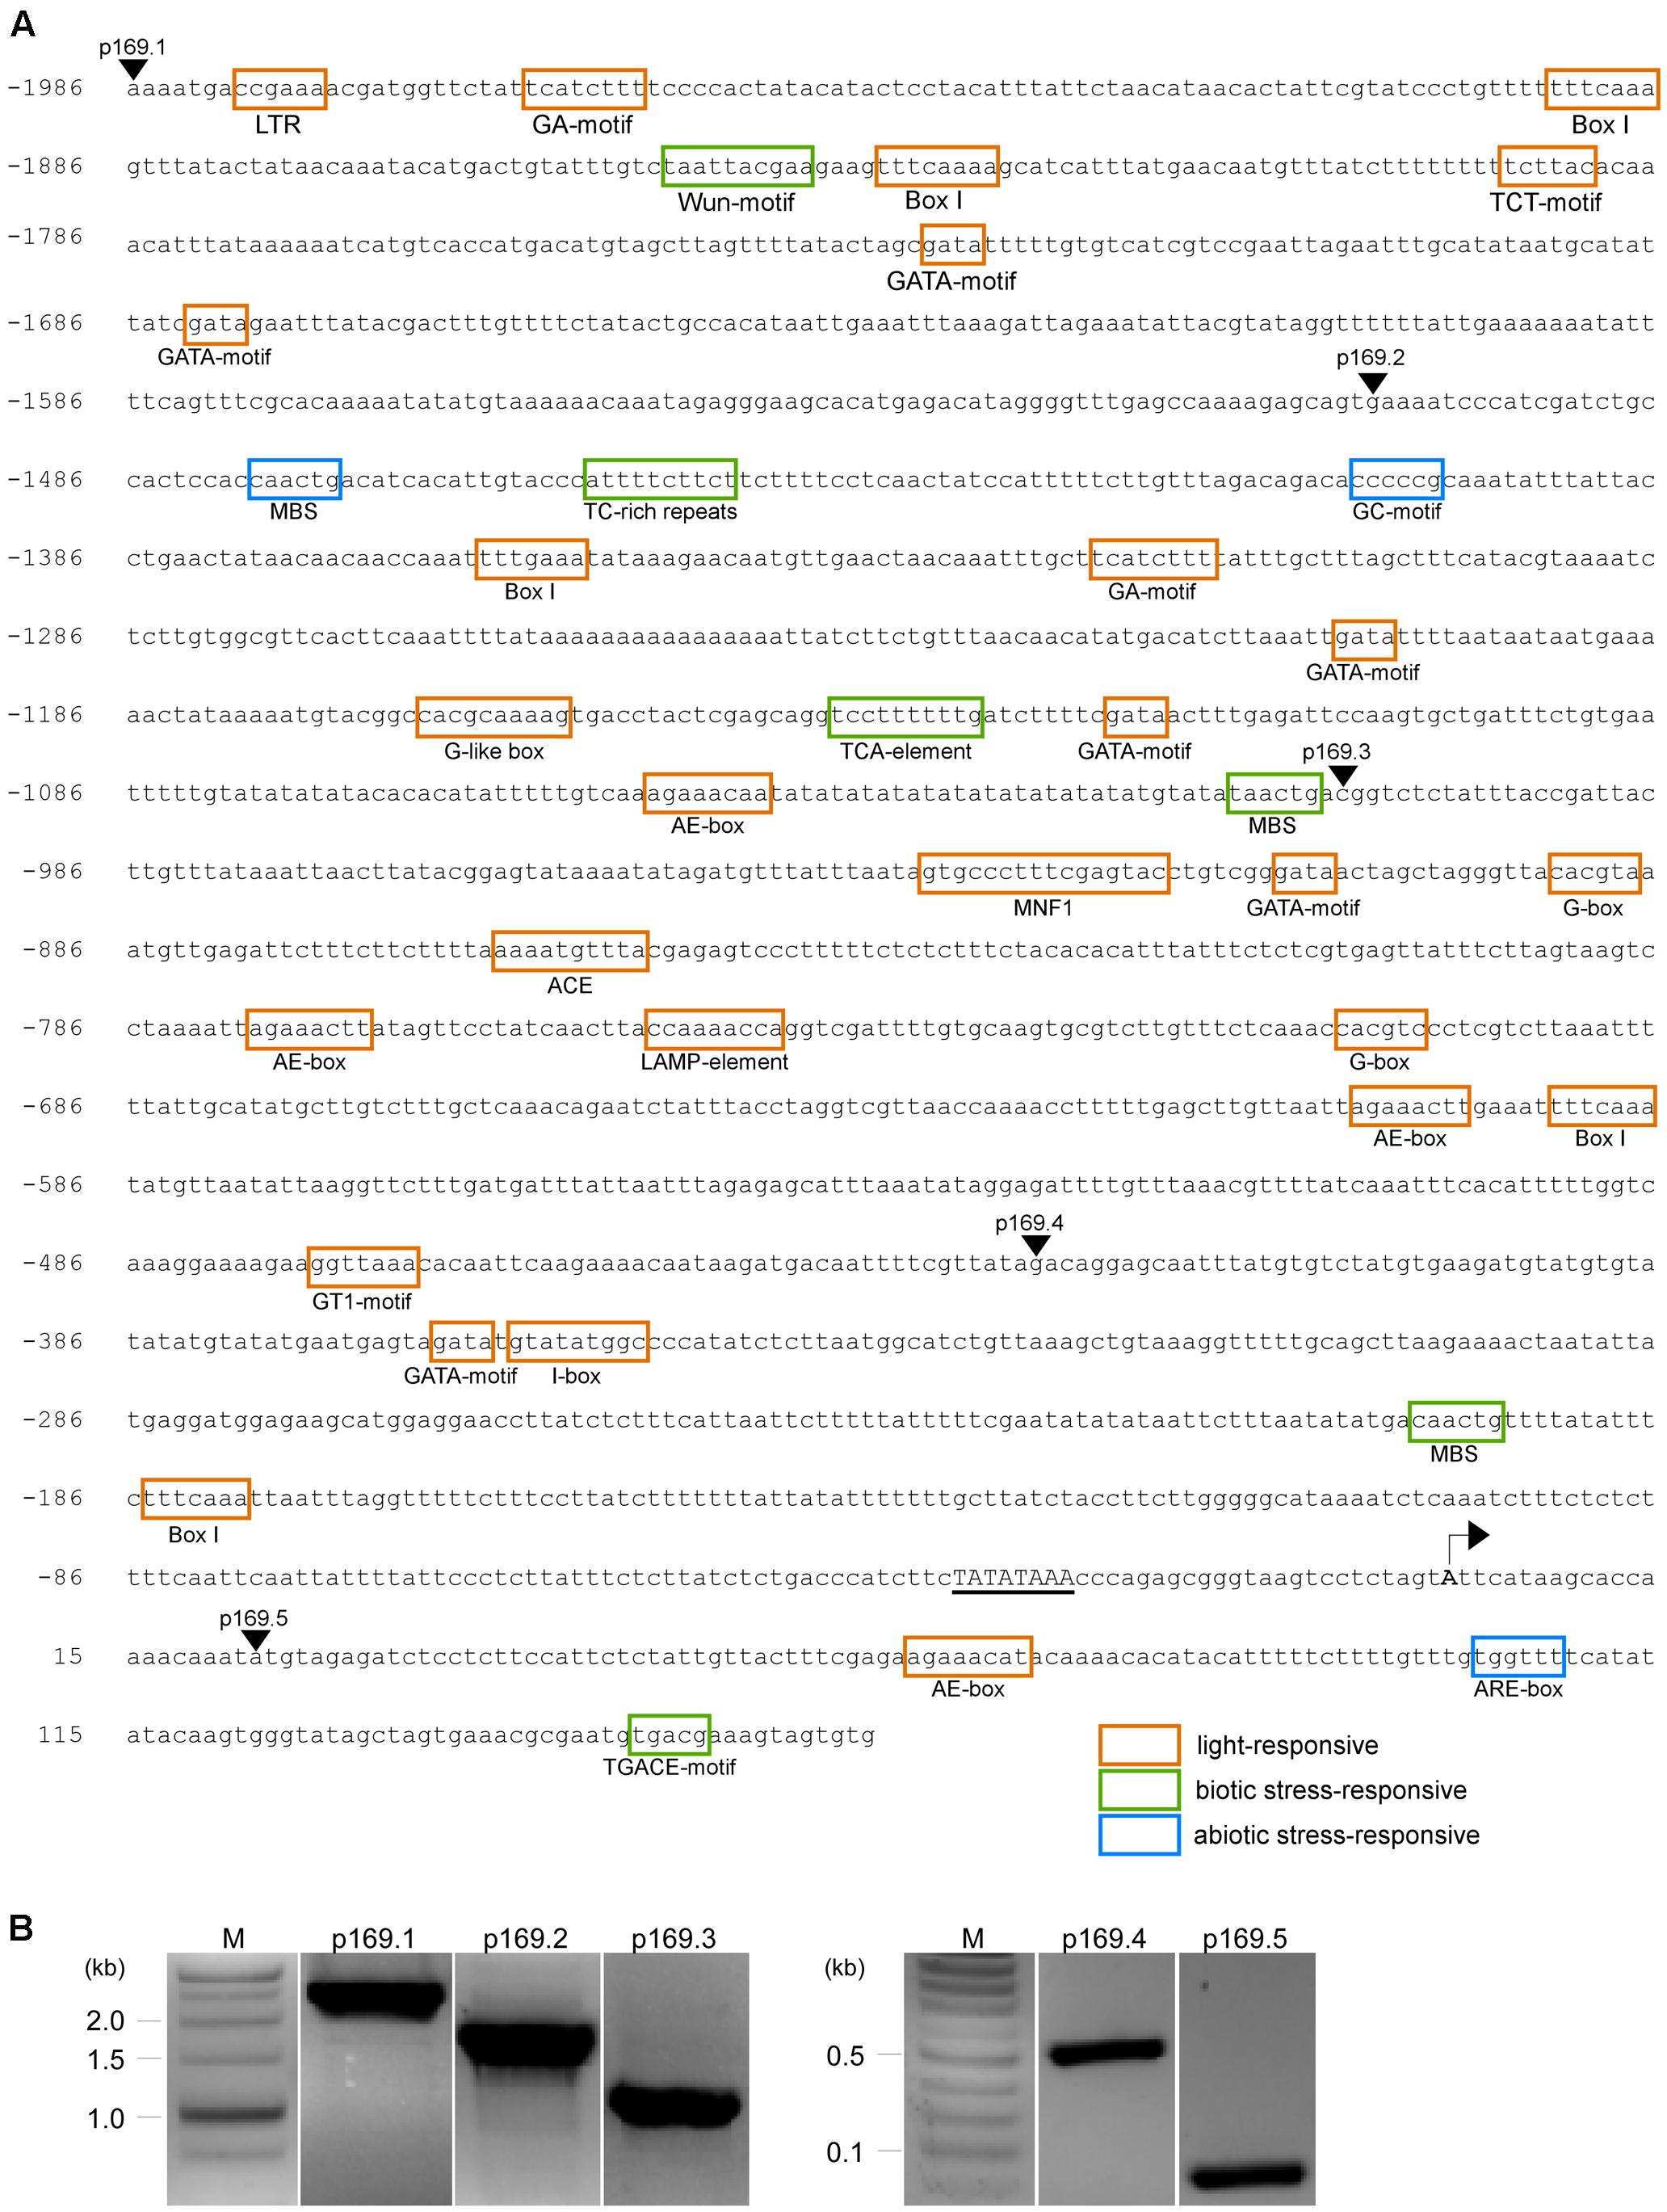
FIGURE 2. In silico analysis and cloning of the MIR169a promoter. (A) Putative cis-acting elements identified in the full-length promoter (2,149 bp) of MIR169a by PlantCARE (Lescot et al., 2002). The putative cis-acting elements involved in light signaling, biotic stresses, and abiotic stresses are indicated by orange, green, and blue boxes, respectively. The arrowheads indicate the location of the forward primers used for the amplification of the full-length promoter (p169.1) and its 5′-deletion derivatives (p169.2 to p169.5). A putative TATA box is underlined. The reported major TSS (Xie et al., 2005) is indicated with an arrow. The location is relative to the TSS. (B) Amplification of the full-length promoter of MIR169a (p169.1) and its 5′-deletion derivatives (p169.2 to p169.5). M, molecular marker.
Generation of Transgenic Plants Containing the MIR169a Promoter Deletion Constructs
The full-length promoter (2,149 bp) of MIR169a was amplified from the genomic region upstream of the first MIR169a intron (Lane p169.1, Figure 2B) by PCR and then cloned into the promoter-less binary vector pBI101 containing a GUS reporter gene, and named p169.1::GUS. In addition, promoter deletion fragments with serial deletions of approximately 500 bp from the 5′-end were generated using PCR, which resulted in promoter fragments of 1,668, 1,170, 590, and 141 bp (primer information in Supplementary Table 1) (Figure 2B). These fragments were cloned into the promoter-less binary vector pBI101 to generate p169.2::GUS, p169.3::GUS, p169.4::GUS, and p169.5::GUS constructs, respectively. All constructs were introduced into wild-type Arabidopsis Col-0 using the Agrobacterium-mediated floral dip method. The transformants were screened on MS media containing kanamycin, and then checked for the presence of the transgene insertion by PCR (data not shown). Homozygous lines were isolated from the T3 generation and used for subsequent experiments.
Promoter Deletion Analyses Identified a 498-bp Region Required for Ambient-Temperature Responsiveness
To examine the ambient temperature inducibility and identify the ambient temperature-responsive region of the MIR169a promoter, we first performed fluorometric GUS assays using transgenic plants containing the different MIR169a promoter fragments. At 23°C, GUS activities of plants harboring p169.1, p169.2, and p169.3 constructs were high but their levels were not statistically different. However, at 16°C, the highest levels of GUS activity were observed in the transgenic plants harboring p169.1 and p169.2 construct, and the activity was significantly induced at 16°C by approximately 2.7-fold, consistent with a previous study that reported higher accumulation of mature miR169 at 16°C (Lee et al., 2010). Since the GUS mRNA is not processed by the miRNA biogenesis machinery, these results suggested that the expression levels of MIR169a are proportional to the amount of the mature miR169a and the effects of ambient temperature on MIR169a occur at the transcriptional level. The induction at 16°C was slightly reduced in p169.2::GUS plants, but still approximately 2-fold higher than at 23°C. However, a significant loss of GUS activity at 16°C was observed in p169.3::GUS plants, resulting in similar GUS activities at 23 and 16°C. These results suggested that the 498-bp promoter region (-1,505 to -1,007, relative to the major TSS) was crucial for the ambient temperature response, raising a possibility that the regulatory elements are present in the 498-bp fragment. Further deletion of promoter to the -427 position (p169.4::GUS) caused a dramatic loss of promoter activity at both temperatures, indicating that the core promoter of the MIR169a gene is located between the -1,007 and -427 positions. GUS activity was completely abolished in the +22 deletion (p169.5::GUS). The pBI101 transgenic line, which contains a promoter-less GUS gene, showed no induction at both temperatures, as seen in p169.5::GUS plants.
To investigate the spatial and tissue-specificity of MIR169a promoter activity, the homozygous pMIR169::GUS plants were subjected to histochemical GUS staining. As expected, strong GUS staining was observed in p169.1::GUS plants at 16°C. Strong staining was detected in the cotyledons of the seedlings grown at 16°C. The hypocotyl, root, and true leaves also showed weaker GUS staining. Similar staining patterns were observed at 23°C but to a comparatively lesser extent (Figure 3B). In p169.2::GUS seedlings, the staining was still strongly detected in the cotyledon and hypocotyl, but not in the root. This implies that the region between -1,986 and -1,505 of the promoter contains a sequence that confers root-specific expression. The overall GUS staining intensity was higher at 16°C than at 23°C in p169.2::GUS plants, consistent with the results from the enzymatic activity assays. Notably, no apparent difference in GUS staining intensity was observed in p169.3::GUS plants at the two different temperatures. The p169.4::GUS and p169.5::GUS plants showed no visible GUS staining. The pBI101 plants, which contain the promoter-less GUS gene, did not show any GUS staining. These results suggested that the expression of MIR169a is upregulated by a low ambient temperature at the transcriptional levels and a cis-acting element that responds to ambient temperature changes is located in the 498-bp fragment (-1,505 to -1,007) of the MIR169a promoter.
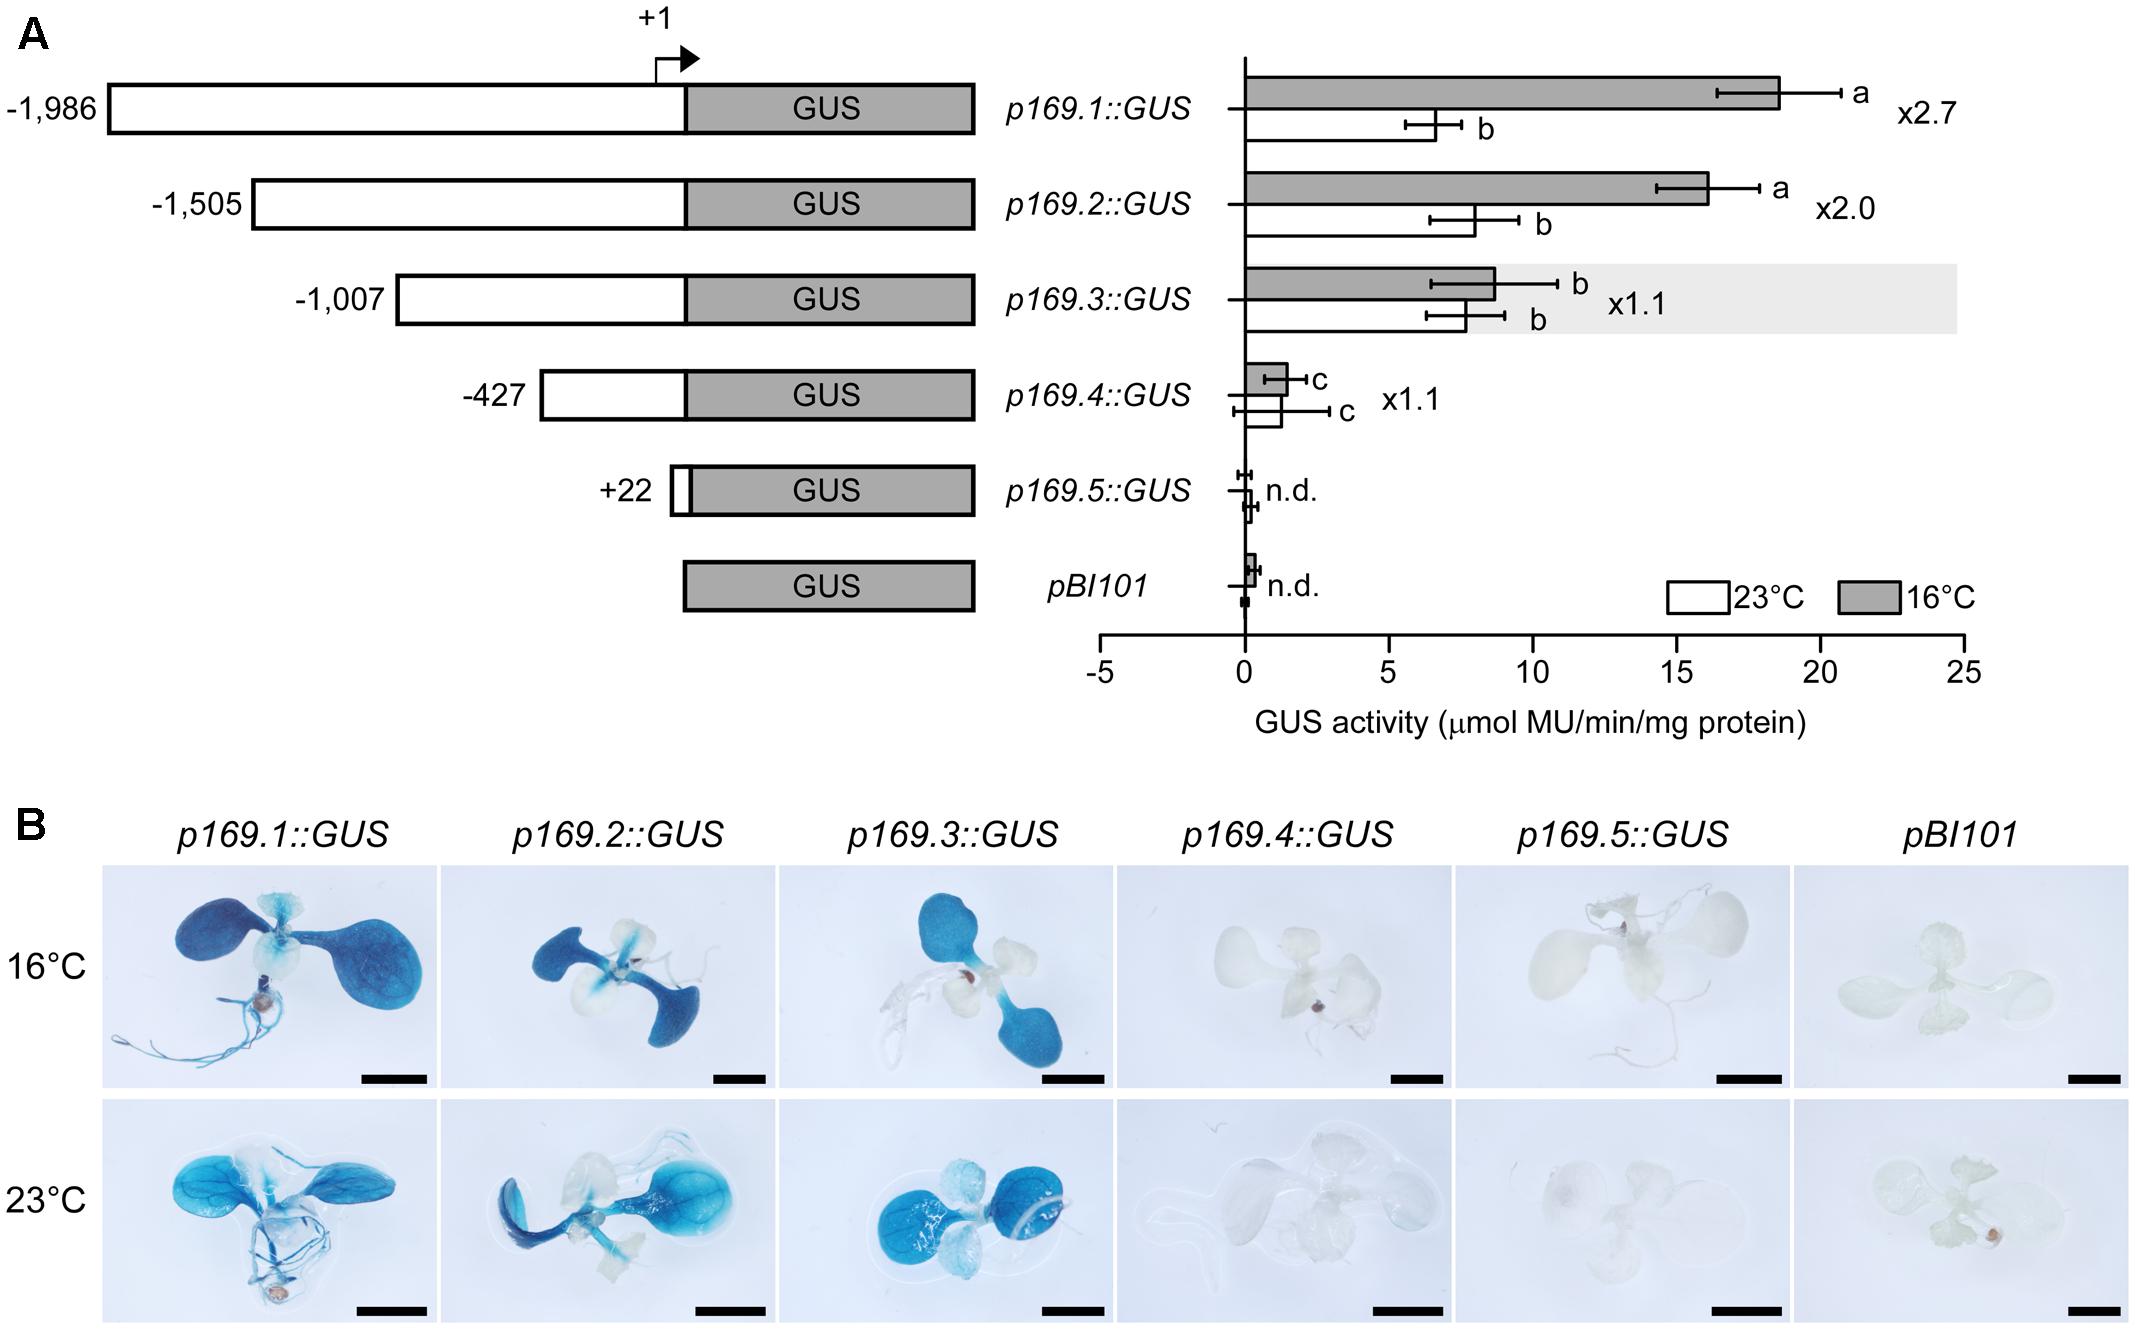
FIGURE 3. Deletion analysis of the MIR169a promoter. (A) Fluorometric GUS assays using transgenic plants expressing GUS under the control of different MIR169a promoter fragments at 23 and 16°C. Diagrams of the constructs used for GUS expression assays are shown on the left. Numbers in the diagram indicate the 5′-end points of the promoter fragments relative to the TSS (denoted as +1). The transgenic plants harboring GUS lacking a promoter (pBI101) were used as a negative control. The columns that are significantly different based on Duncan’s Multiple Range Tests (p < 0.05) are marked with different letters. The ratio of the promoter activity at 16°C to that at 23°C, i.e., the induction ratio, is indicated on the right. The values are presented as the mean ± SD of three biological replicates. n.d., not detectable. (B) Histochemical assay for GUS activity and tissue-specific localization. Transgenic plants harboring each construct were grown at 16 and 23°C. At least 10 seedlings were examined and typical results are presented. Scale bar = 2 mm.
The HYH Transcription Factor Binds to the 498-bp Fragment of the MIR169a Promoter
The deletion analysis showed that the 498-bp fragment is important for ambient temperature-responsive MIR169a expression; we therefore postulated that transcription factors involved in the ambient temperature response might bind to this region and regulate MIR169a expression. To identify such transcription factor(s), DNA-affinity chromatography was performed, using the 498-bp fragment as a DNA bait, and total protein extracted from 8-day-old seedlings grown at 16 and 23°C. We eluted affinity-captured proteins and visualized them after SDS-PAGE. After silver staining, we identified a single band (about 75 kDa) at 23°C (arrowhead in Figure 4A), but not at 16°C, suggesting that the eluted proteins bind to the 498-bp fragment of the MIR169a promoter in planta. The control reactions that used the same protein extracts without the 498-bp fragment as a bait did not elute these proteins.
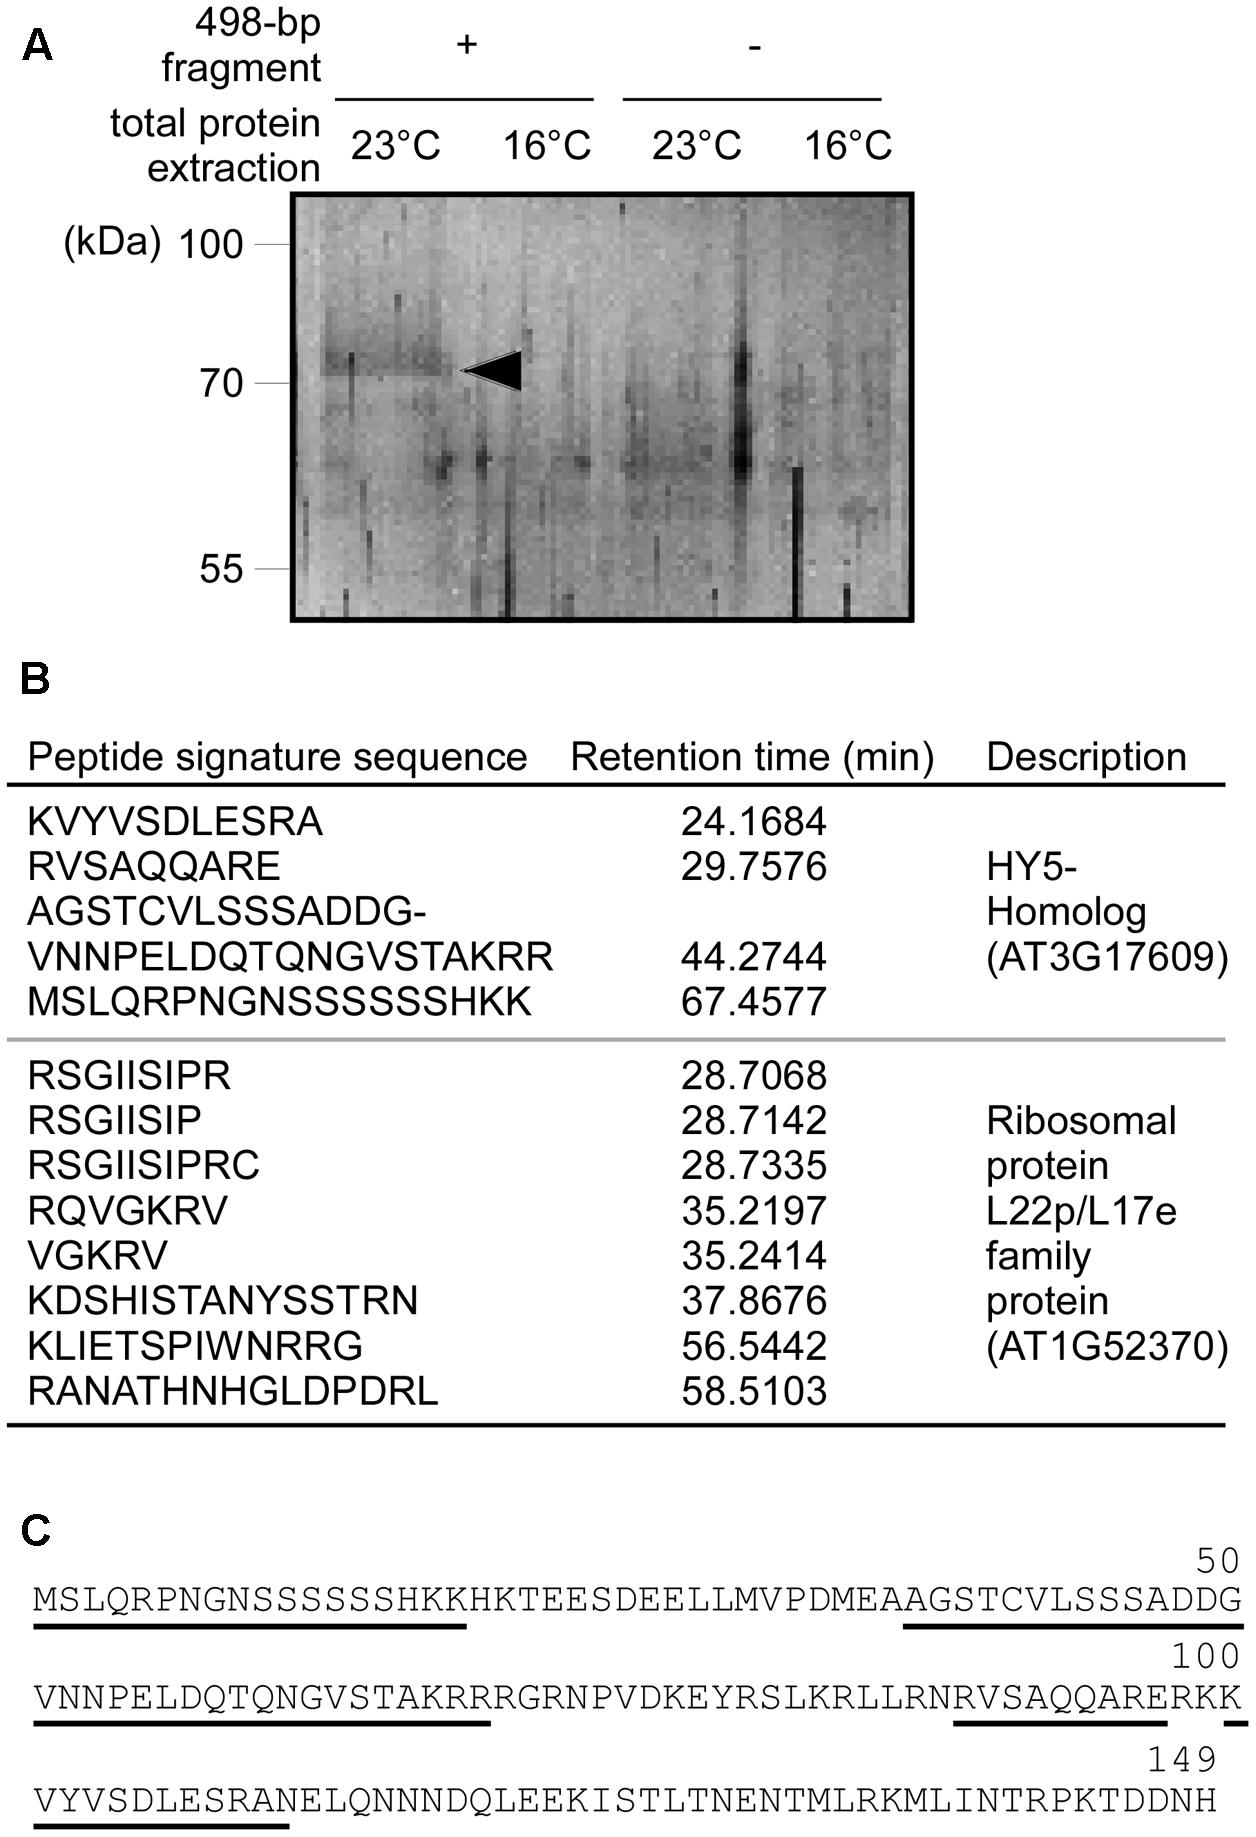
FIGURE 4. DNA-affinity chromatography and identification of HYH as a protein that binds to the 498-bp fragment of the MIR169a promoter. (A) SDS–PAGE following DNA-affinity chromatography. Total protein extracts were obtained from wild-type plants grown at 23 and 16°C, and purified by affinity chromatography using the 498-bp fragment as a DNA bait. Note that an apparent band (arrowhead) appeared in the first lane (498-bp fragment bait + total protein extracted at 23°C). (B) Peptide signature sequences of the band in (A), obtained by LC-MS. The retention time of each peptide is shown in the left column. (C) Amino acid sequence of Arabidopsis HYH protein. The sequences of the recovered peptides from LC-MS (B) are underlined.
To identify the unknown proteins, the band in Figure 4A was excised from the gel and then subjected to LC-MS to identify its amino acid composition. Twelve peptide signature sequences were recovered by LC-MS. By comparing them against the Arabidopsis protein database using Protein BLAST, four peptide sequences were identified as being encoded by the ORF of AT3G17609, which encodes the bZIP transcription factor protein Elongated Hypocotyl 5-Homolog (HYH) (Figures 4B,C). The remaining eight peptide sequences belonged to the ribosomal protein L22p/L17e family protein encoded by AT1G52370 (Figure 4B). As the ribosomal protein is thought to be ubiquitous in the cytosol, we regarded the ribosomal protein as a contaminant. These results suggest that HYH protein directly interacts with the cis-acting element(s) that are present within the 498-bp fragment (-1,505 to -1,007, relative to the major TSS) of the MIR169a promoter to regulate MIR169a expression at 23°C.
HYH.2 Is the Most Abundant Isoform among the Splice Variants of HYH
The recently released Araport version 11 revealed that nearly 40% of protein-coding loci produce two or more splicing isoforms (Cheng et al., 2017) and alternative splicing plays an important role in ambient temperature responses (Lee et al., 2013; Pose et al., 2013). Therefore, we analyzed our published RNA-seq data to find splicing variants of HYH (Nasim et al., 2017). The analysis revealed that four splicing variants of HYH are present in wild-type plants (Figure 5A), consistent with a previous report (Li et al., 2017). To confirm the alternative spliced isoforms, we performed RT-PCR using RNA isolated from wild-type plants. Although three amplified bands were visible (Figure 5B), we identified four splicing variants (HYH.1–HYH.4) after sequencing. This was due to the fact that amplicons from HYH.1 and HYH.4 were only 3-nt different in size (i.e., 408 and 405 bp, respectively). Amino acid alignment showed that of the four variants, HYH.2 is the longest, followed by HYH.1, which contains an extra codon at the 3′-splicing site, compared to HYH.4 (Figure 5C). HYH.3 appeared to be the shortest. Although all four HYH isoforms harbor the bZIP DNA-binding domain (underlined in Figure 5C), only HYH.2 contains the Constitutive Photomorphogenic1 (COP1) interaction domain, which was previously suggested to have a non-canonical interaction with COP1 (Li et al., 2017).
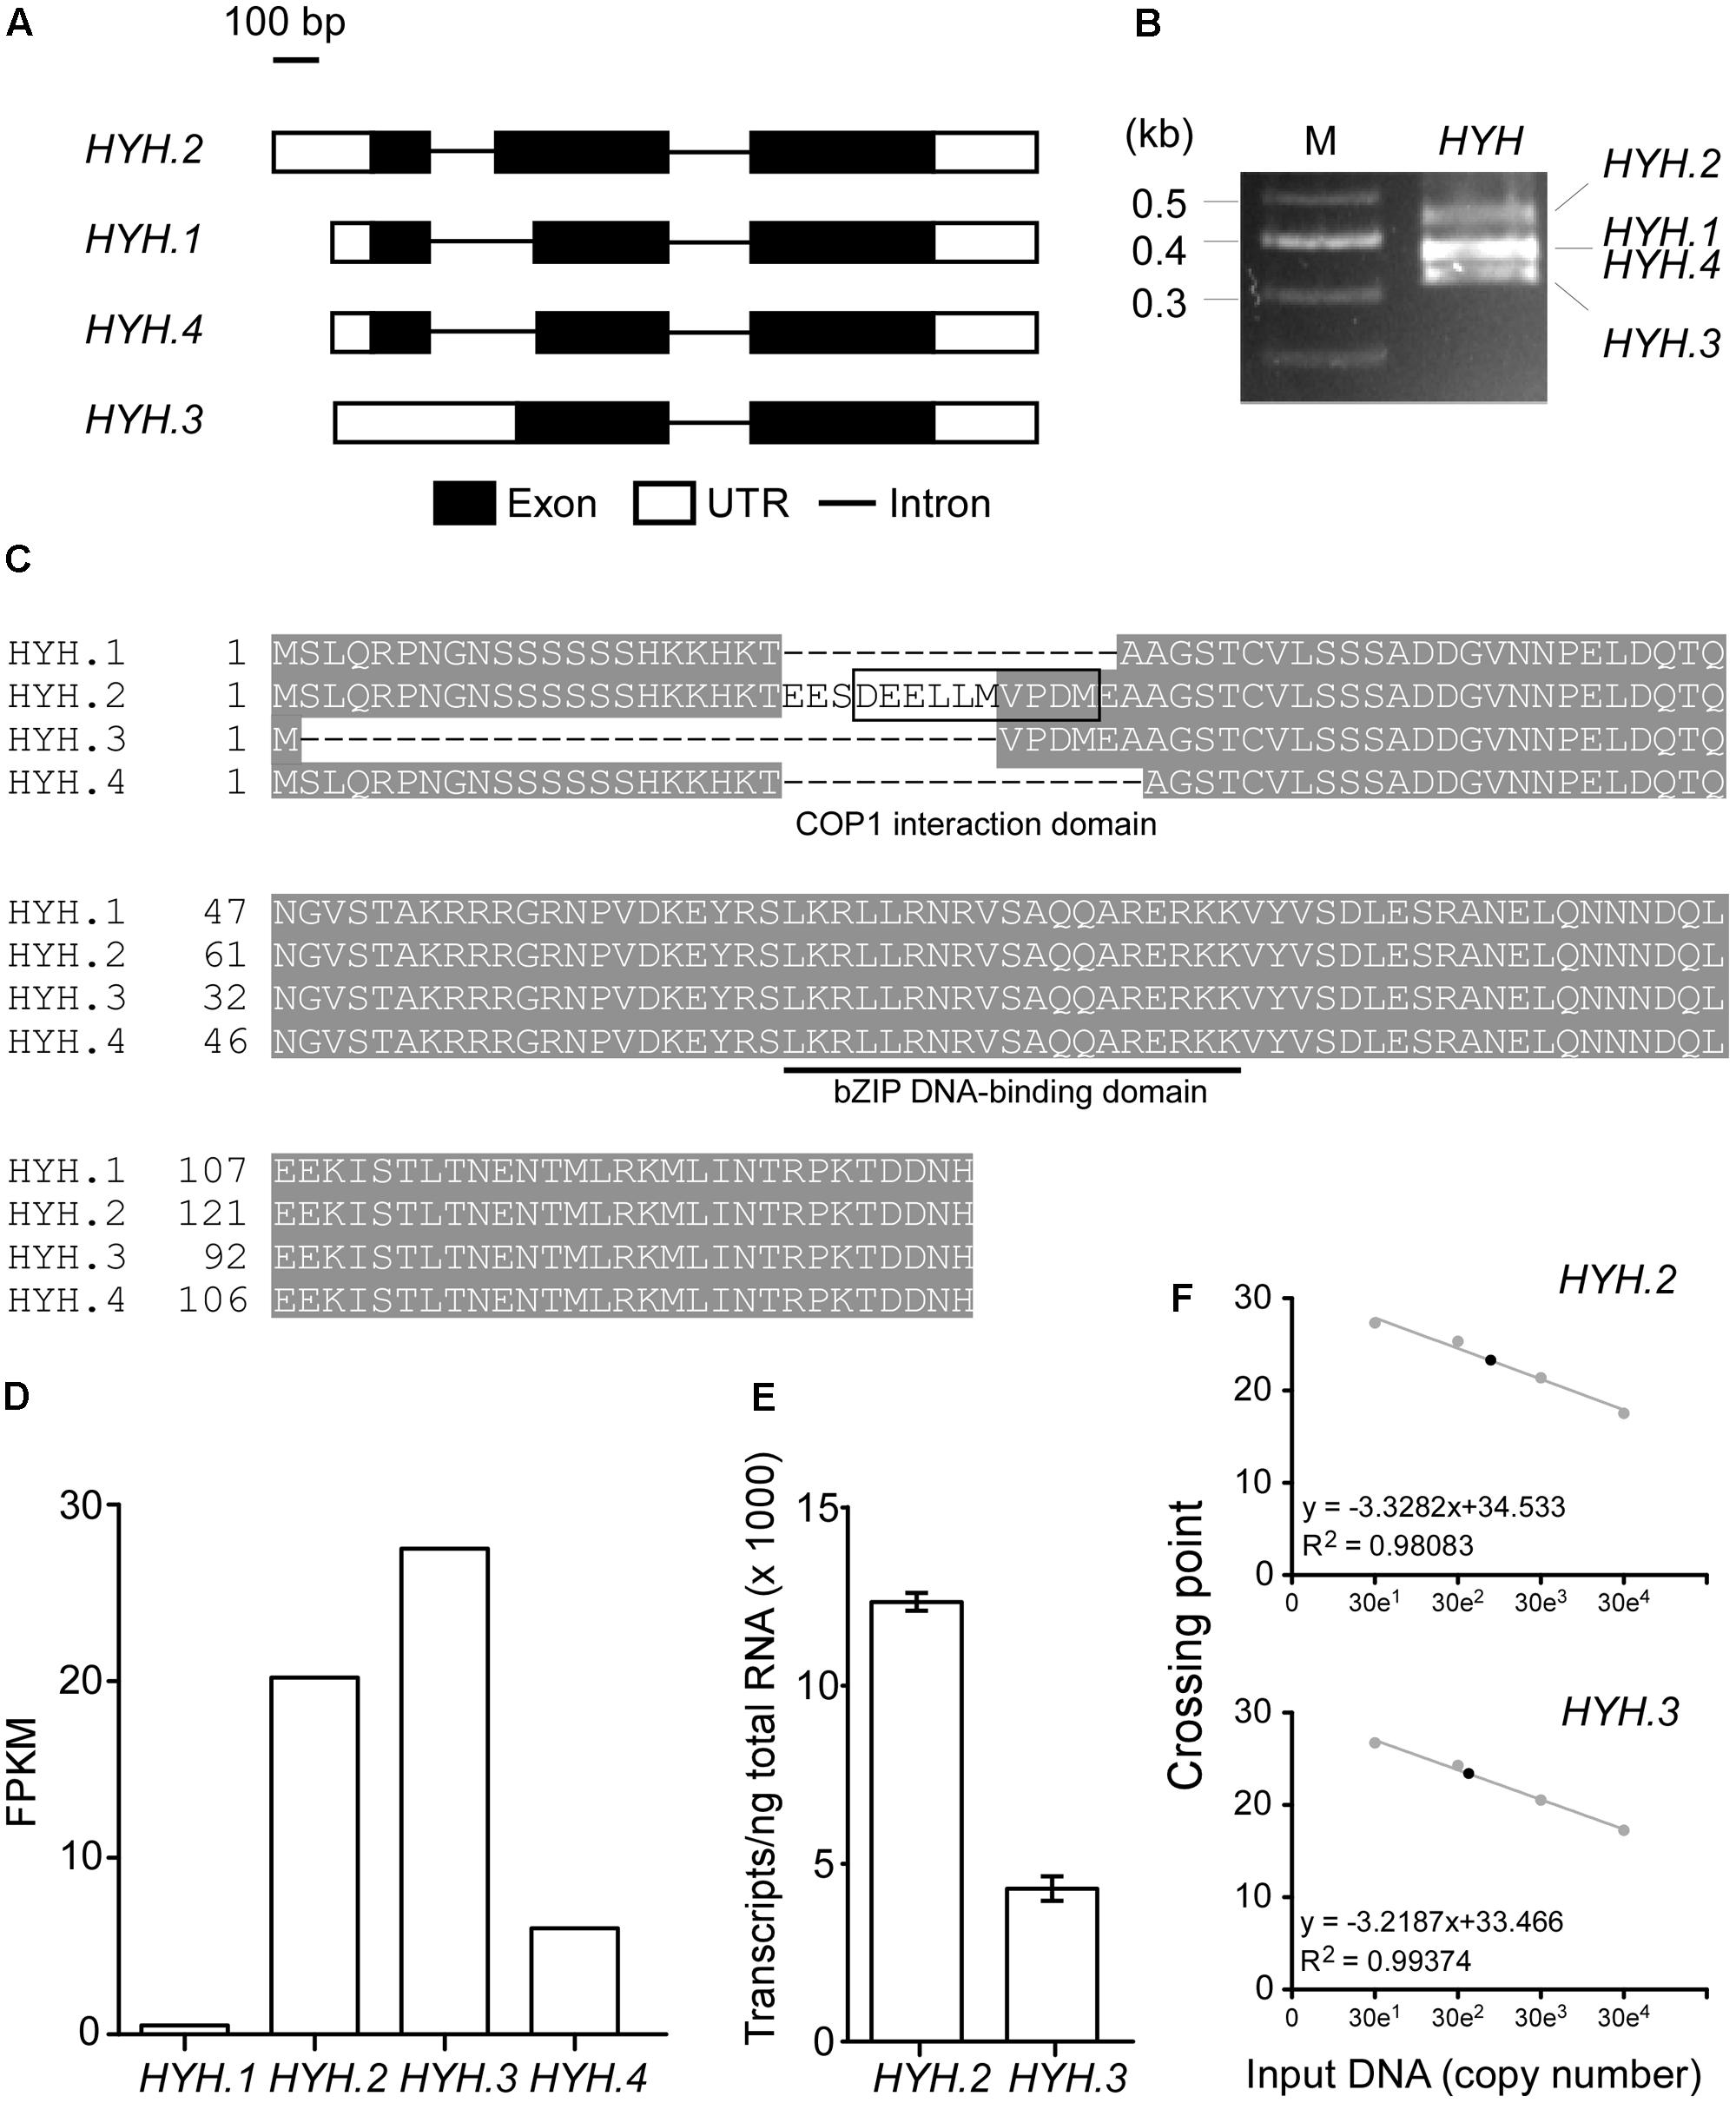
FIGURE 5. Identification of splicing variants of HYH and determination of its major isoform. (A) Schematic diagrams showing the four splicing variants of HYH. (B) Amplification of splicing variants of HYH using RT-PCR. M, molecular marker. (C) Multiple amino acid sequence alignment of four HYH protein isoforms. The COP1-binding domain is indicated by a box, and the bZIP DNA-binding domain is underlined. (D) RNA-seq-quantitative measurement of four HYH isoforms. FPKM, fragments per kilobase of transcript per million mapped reads. (E) Absolute quantification of the abundance of mRNAs of HYH.2 and HYH.3. The values are presented as the mean ± SD of three biological replicates. (F) The regression line from the standard curves used to determine the concentration of HYH.2 and HYH.3 transcripts. The set of standard curves contains 10-fold serial dilutions from 300 to 300,000 copies of each transcript. Closed circles indicate data points. Crossing point represents Ct-values from the qPCR.
Our RNA-seq data (Nasim et al., 2017) suggested that HYH.2 and HYH.3 had similarly high transcript levels [20.2 and 27.5 fragments per kilobase of transcript per million mapped reads (FPKM), respectively] (Figure 5D). To validate the RNA-seq results, absolute quantification was performed to quantify and compare the transcript abundance of HYH.2 and HYH.3 splicing variants in 8-day-old wild-type plants at 23°C. The results showed that HYH.2 had ∼13,000 transcripts/ng of total RNA, while HYH.3 had ∼4,000 transcripts/ng of total RNA (Figures 5E,F), implying that HYH.2 is the most abundant HYH splicing variant. Therefore, we chose HYH.2 for the subsequent experiments.
HYH Binds to a G-Box-Like Motif within the MIR169a Promoter
To identify the DNA motif(s) that were bound by HYH, we conducted in silico analyses, which identified four potential HYH-binding motifs within the 498-bp fragment of the MIR169a promoter: one A-box (Izawa et al., 1993), two GATA-boxes (Shi et al., 2011), and one derivative of the G-box (here denoted as G-box-like) (Holm et al., 2002) (Figure 6A). The sequences of the identified motifs and their locations relative to the major TSS (Xie et al., 2005) are shown in Figure 6B.
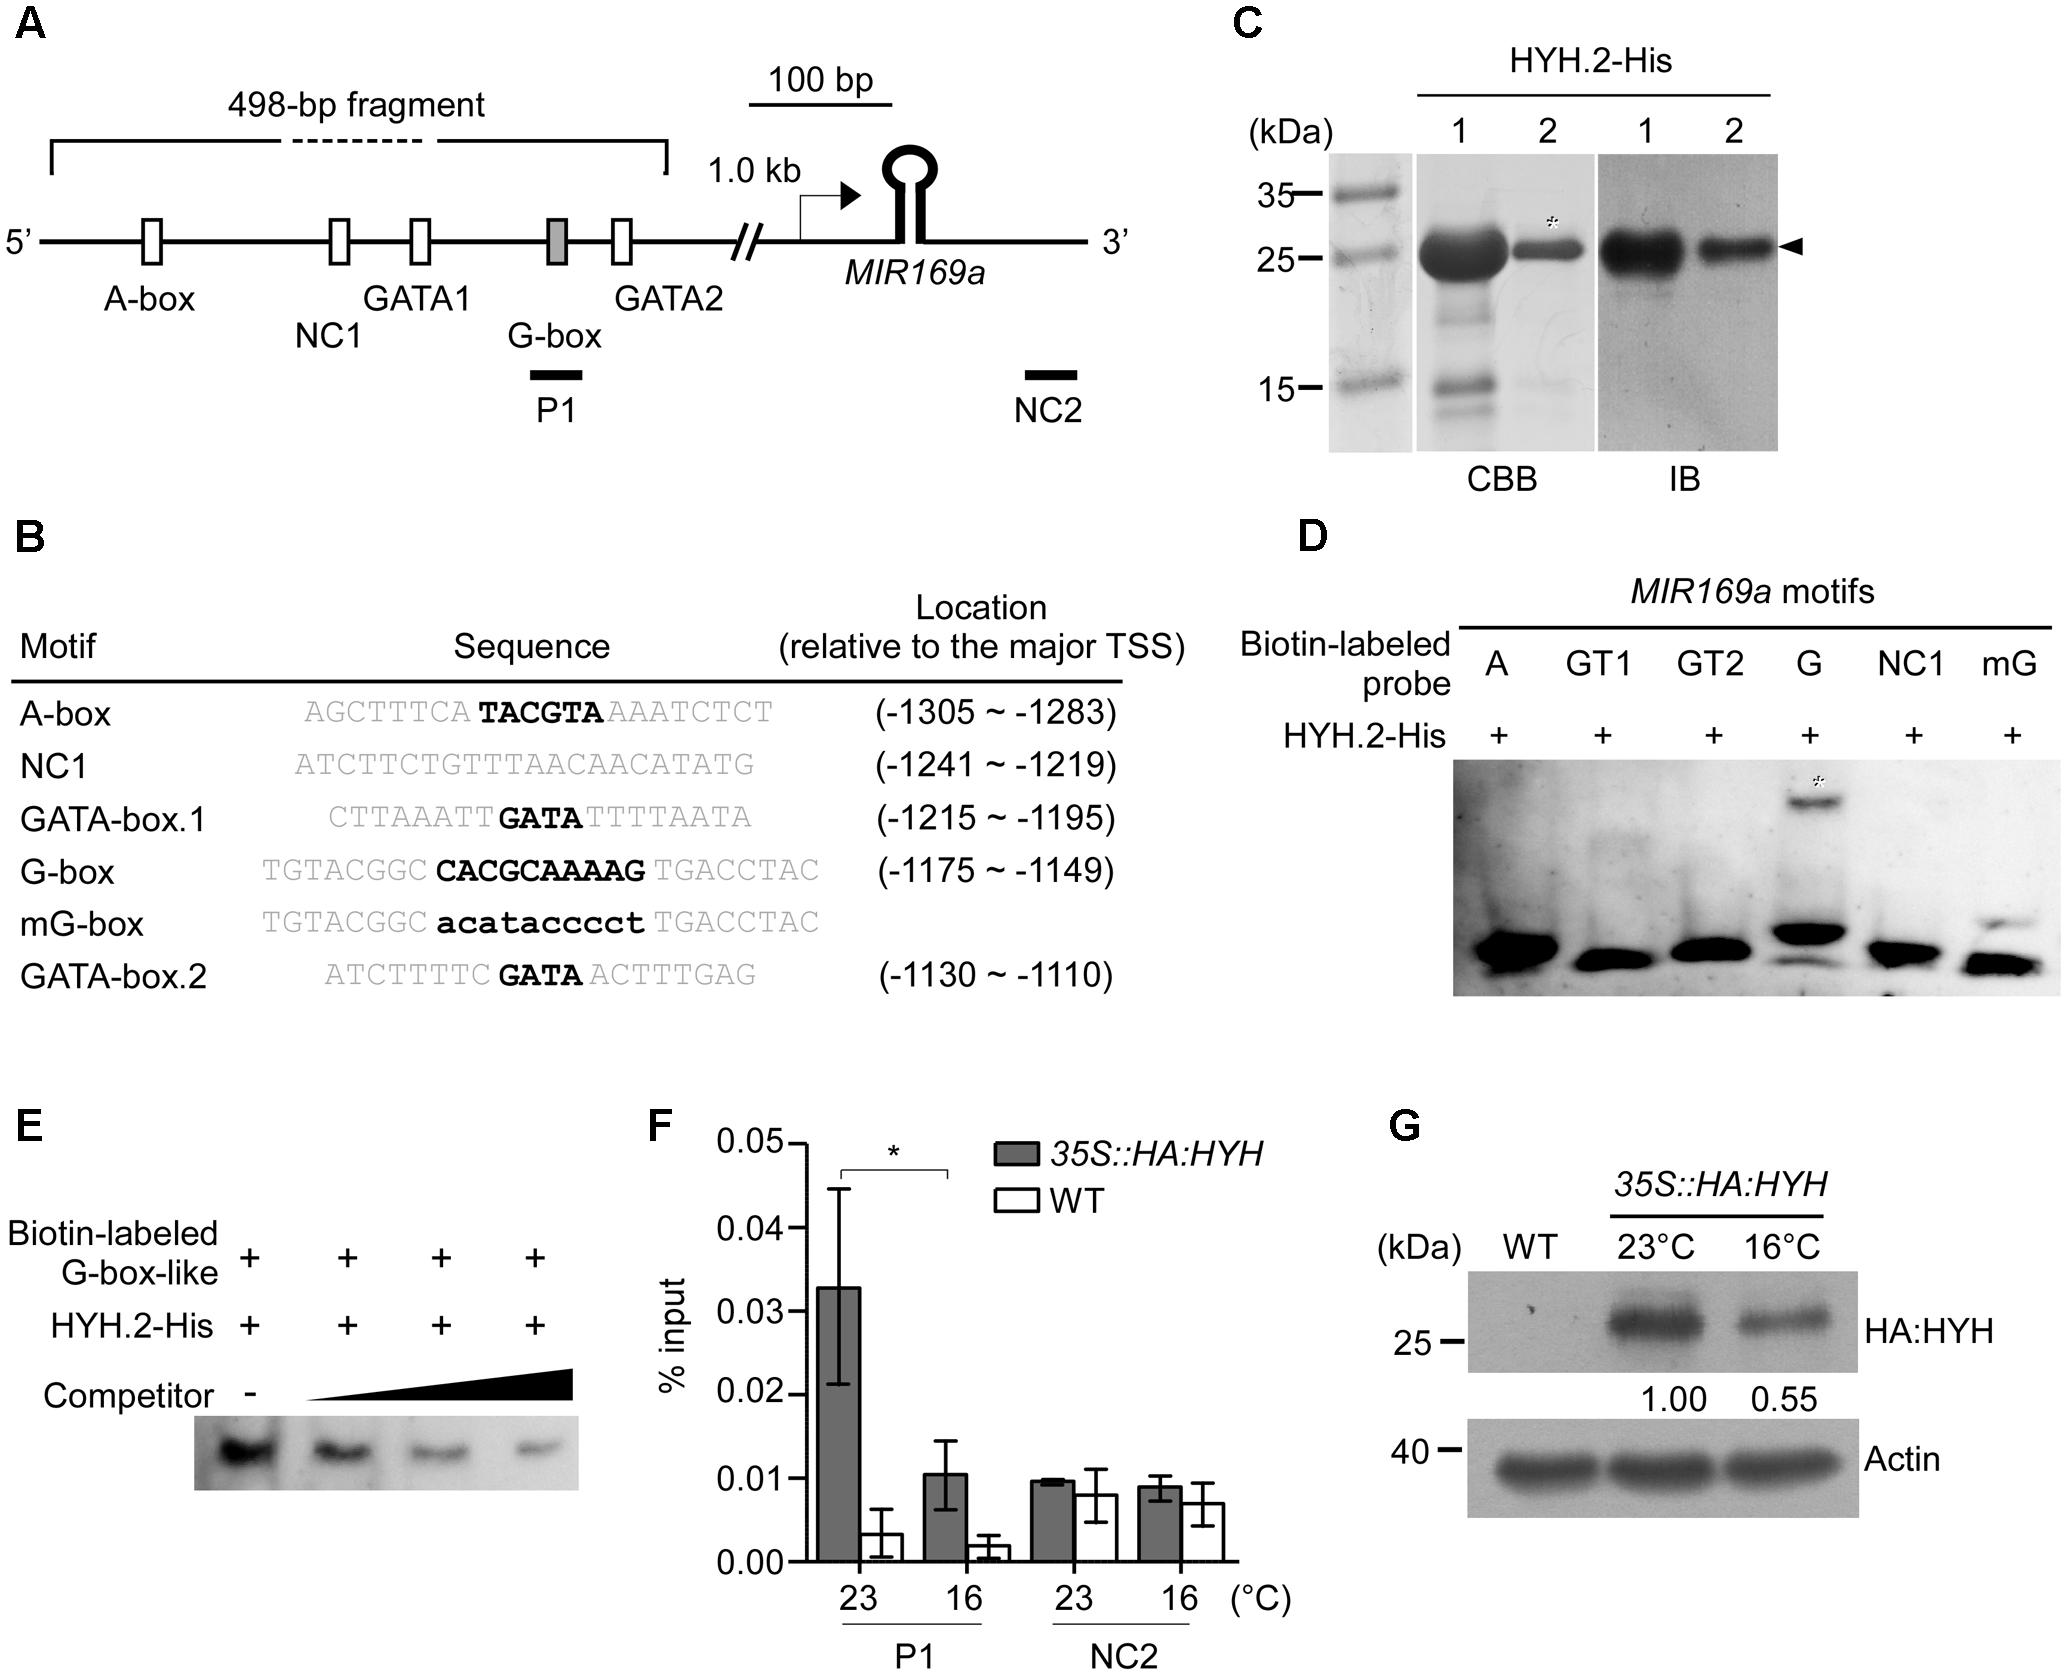
FIGURE 6. Electrophoretic mobility shift assays (EMSAs) and ChIP–qPCR analyses showing that HYH binds to a derivative of the G-box motif. (A) Schematic representation of the locations of four putative HYH-binding motifs within a 498-bp fragment of the MIR169a promoter. The reported major TSS (Xie et al., 2005) is denoted with an arrow. P1: a region (–1,353 to –1,273, relative to the major TSS) containing the G-box-like motif that was used for amplification in the ChIP–qPCR assay. NC1, negative control for the EMSAs, NC2, negative control for the ChIP–qPCR assays (+485 to +604, relative to the major TSS). (B) Sequence information for the putative motifs used as probes for the EMSA. Core motifs are marked in bold. (C) Production and purification of His-tagged HYH.2 proteins. SDS gel electrophoresis of column-purified recombinant HYH.2 protein (lanes 1 and 2, middle panel). The arrowhead indicates the soluble HYH.2-His protein of the expected size. Immunoblotting was performed using anti-His antibodies to confirm the purity of the HYH.2-His proteins (arrowhead, right panel). The eluted protein from lane 2 (asterisk) was subsequently used for further experiments. CBB, Coomassie brilliant blue staining; IB, immunoblot. (D) EMSA with HYH.2-His protein. Shifted bands are indicated with an asterisk. A, A-box, GT1; 2, GATA box 1 and 2; G, G-box-like motif; mG, mutant G-box-like motif; NC1, negative control. (E) Competition assay of HYH.2-His protein binding to the G-box-like motif. Unlabeled probes of identical sequence were used as competitors at 100×, 400×, and 1,600× molar excess. Only shifted bands are shown for simplicity. (F) ChIP–qPCR analyses to determine enrichment of HYH protein on the MIR169a promoter. Chromatin of 35S::HA:HYH and WT plants grown at 16 and 23°C was immunoprecipitated with anti-HA antibody. ChIP results are presented as the percentage recovered from the total input DNA (% input). All values are presented as the mean ± SD of three technical replicates, ∗p ≤ 0.05 (Student’s t-test). (G) Determination of HYH protein levels at 23 and 16°C. Total proteins of 35S::HA:HYH grown at 23 and 16°C were immunoblotted with anti-HA antibody. Actin was used as a loading control. Bands were quantified using Image J software and the numbers below each band denote fold change relative to the HA:HYH level at 23°C.
To investigate whether HYH binds to the cis-acting elements(s) in the promoter of MIR169a, recombinant His-tagged full-length soluble HYH.2 protein (approximately 20 kDa) was produced and purified on histidine affinity columns. The purified protein displayed a single major band after elution from the column at the expected molecular weight (asterisks in Figure 6C). We performed an immunoblot analysis using anti-His antibody to confirm that the purified product contained HYH.2-His protein. Anti-His antibody successfully detected HYH.2-His protein at the expected size after blotting (Figure 6C right panel).
To confirm that HYH protein indeed bound to the DNA motif(s) and was responsible for the interaction with the promoter, an EMSA was performed. Purified HYH.2-His protein and synthesized double-stranded 5′-biotin-labeled oligonucleotides of the possible HYH-binding motifs (Figure 6B) were allowed to interact before being separated by electrophoresis. The results showed that HYH.2-His bound to the G-box-like motif, as a shifted band was observed for the G-box-like DNA probe. This suggested that HYH binds to the G-box-like motif within the 498-bp fragment of the promoter of MIR169a. In contrast, the A-box, both GATA boxes, as well as the negative control (NC1) did not show detectable shifted bands (Figure 6D). To test whether the G-box-like sequence was accountable for the interaction, the core of the motif was mutated with G to T, or A to C (denoted as mG, Figure 6B). The binding reaction between HYH.2-His and mG failed to produce any apparent band-shifts (Figure 6D), suggesting that HYH specifically binds to the G-box-like motif in the 498-bp fragment. To further confirm the binding affinity, unlabeled competitor probe of the identical sequence was used to perform the competition assay. The results showed that the unlabeled probe was able to compete for HYH protein binding to the G-box-like motif, as the intensity of the shifted bands gradually decreased with the increasing concentrations of unlabeled probe (Figure 6E).
To further confirm the association of HYH with the MIR169a promoter region in vivo, we performed ChIP–qPCR assays. Chromatin from 35S::HA:HYH plants grown at 16 and 23°C was immunoprecipitated with anti-HA antibody and the immunoprecipitated DNA was used as a template for amplification of the MIR169a promoter region covering the G-box-like motif (P1). A region downstream of the hairpin loop structure of miR169 was also used as a negative control (NC2) for ChIP–qPCR experiments (Figure 6A and Supplementary Table 1). The results showed apparent binding of HYH in the P1 region of the MIR169a promoter at 23°C, whereas less enrichment of HYH in the P1 region was observed in the plants grown at 16°C. In contrast, we observed no enrichment in the NC2 region (Figure 6F and Supplementary Figure 1A). We then examined HYH protein levels using 35S:HA:HYH plants grown at 23 and 16°C. An immunoblot analysis showed that HA:HYH protein levels were higher at 23°C than at 16°C (Figure 6G and Supplementary Figure 1B), consistent with higher enrichment of HYH protein in the P1 region of the MIR169a promoter (Figure 6F). Taken together, our results suggested that HYH protein directly binds to the G-box-like motif of MIR169a in vitro and in vivo, especially at 23°C, to regulate its transcription.
HYH Acts Upstream of MIR169a to Negatively Regulate MIR169a Expression
To investigate the genetic relationship between HYH and MIR169a, pri-miR169a expression levels were measured using qPCR in hyh mutants grown at 16 and 23°C. The results showed that the levels of pri-miR169a were upregulated in hyh mutants at both temperatures when compared to the wild-type Ws plants (Figure 7A), indicating that MIR169a expression is induced upon the depletion of HYH. We also observed an increase of pri-miR169a transcript levels at 16°C in wild-type Ws-2 plants (Figure 7A), which is consistent with a previous report of higher accumulation of mature miR169a in wild-type Col-0 plants at 16°C (Lee et al., 2010).
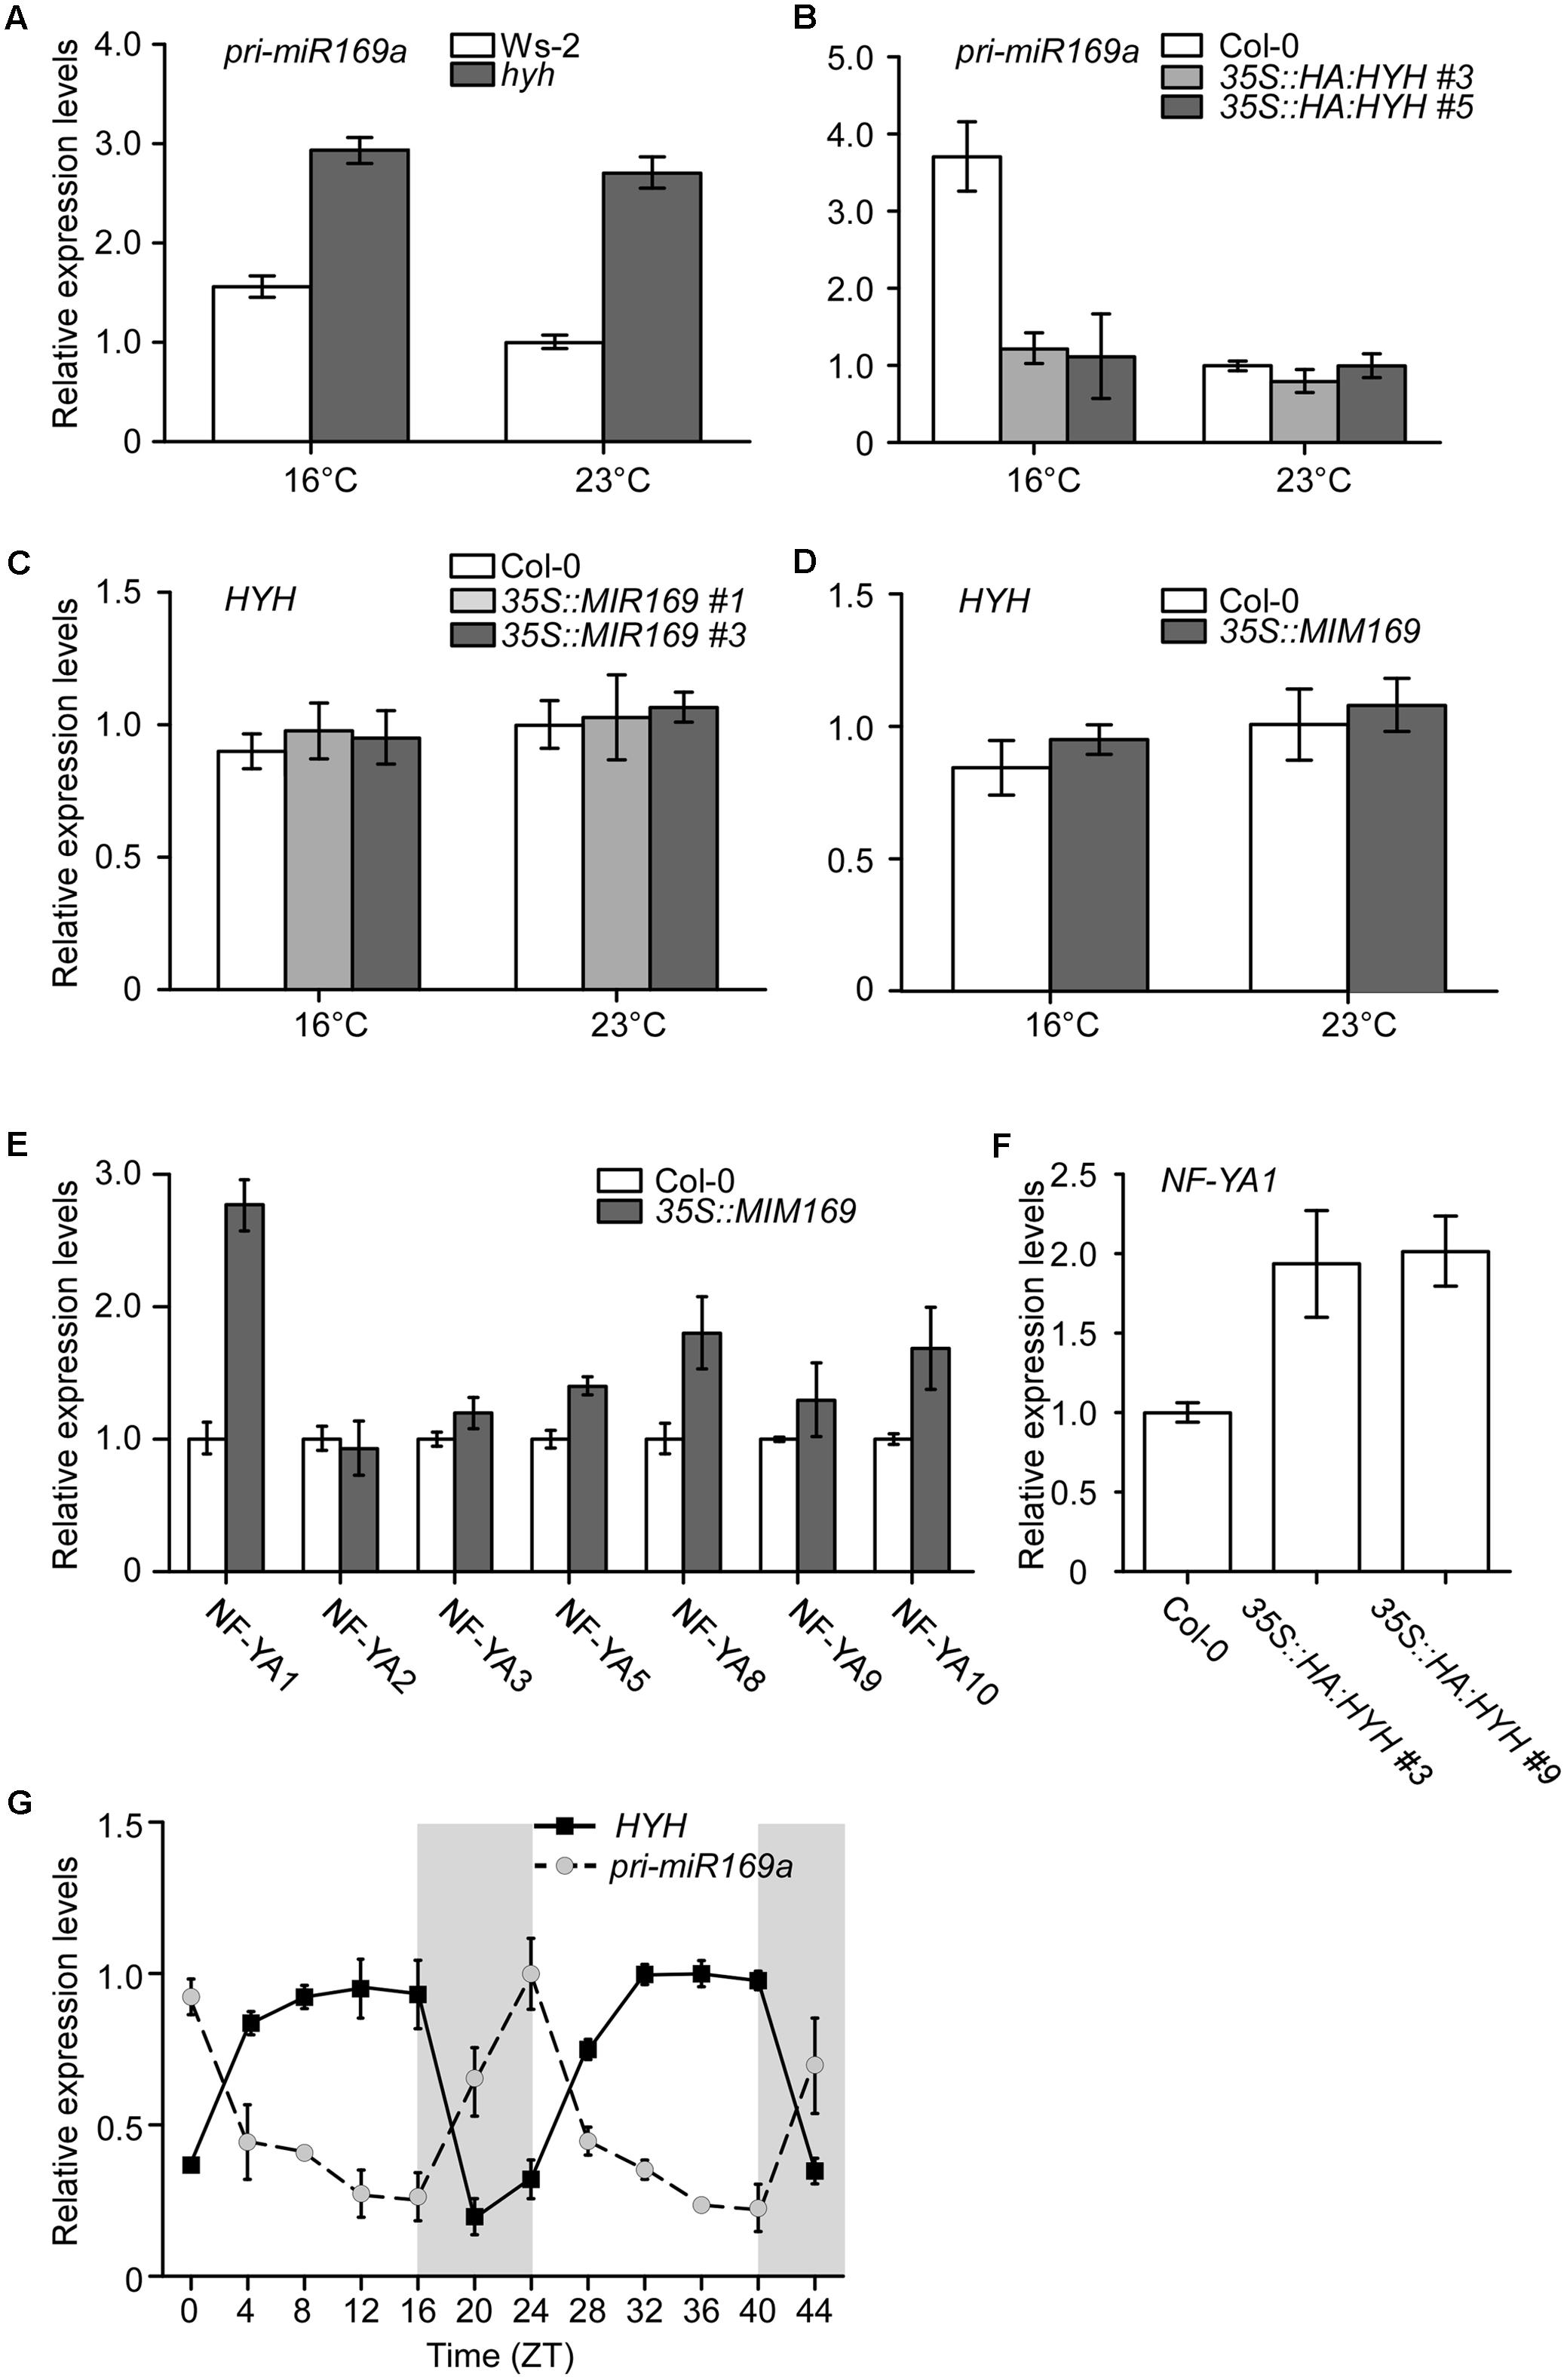
FIGURE 7. Measurement of HYH and pri-miR169a expression by qPCR. (A,B) The relative levels of pri-miR169a in Ws-2 and hyh mutants grown at 16 and 23°C (A), and in Col-0 plants and two independent lines overexpressing HYH-HA (B). (C,D) The relative levels of HYH transcripts in Col-0 and two independent lines overexpressing MIR169a (C) and MIM169 (D) grown at 16 and 23°C. (E) Analysis of transcript levels of seven Nuclear Factor Y Subunit A (NF-YA) genes in Col-0 and plants overexpressing MIM169. (F) Analysis of NF-YA transcript levels in Col-0 and plants overexpressing HYH-HA. (G) Diurnal expression of HYH and pri-miR169a in wild-type plants. Gray boxes indicate the dark period. The results represent an average ± SD of three biological replicates.
We measured the levels of pri-miR169a transcripts in 35S::HA:HYH plants to test whether the overexpression of HYH would negatively affect the expression of pri-miR169a. At 16°C, the levels of pri-miR169a transcripts in the HYH-overexpressing plants were suppressed by almost threefold as compared to that of wild-type plants (Figure 7B). Moreover, pri-miR169a levels were less responsive to the ambient temperature changes in 35S::HA:HYH plants. At 23°C, the suppression of pri-miR169a by overexpression of HYH was not dramatic, probably because the pri-miR169a levels were already low at a high ambient temperature (23°C). To further investigate, we measured the levels of HYH transcripts in the 35S::MIR169a plants and 35S::MIM169 plants, in which the cleavage activity of most miR169 isoforms is inhibited (Todesco et al., 2010). Our results showed that the expression of HYH was unaltered by miR169a overexpression (Figure 7C), or inhibition of miR169 function (Figure 7D) at both temperatures, indicating that alteration of miR169 activity did not affect the transcript levels of HYH. This suggested that HYH did not act downstream of miR169a. The expression levels of HYH in Col-0 plants at both temperatures were similar, suggesting that the ambient temperature does not regulate HYH at the transcriptional level.
Mature miR169 consists of four isoforms produced from 14 loci (Jones-Rhoades and Bartel, 2004; German et al., 2008; Li et al., 2017), and each miR169 isoform targets specific NF-YA genes (Sorin et al., 2014). To identify the main target of miR169a, we analyzed the transcript levels of different NF-YAs. Only NF-YA1 showed a major increase and was induced by more than 2.5-fold in 35S::MIM169 plants (Figure 7E), suggesting that NF-YA1 might be the target gene of miR169a. However, as it is proposed that 35S::MIM169 plants block the action of three miR169 isoforms (i.e, miR169a, bc, and hijklmn, but not defg) (Todesco et al., 2010), the data do not rule out the possibility that NF-YA1 might be the target of miR169bc and/or miR169hijklmn. Our results are in agreement with the notion that the depletion of mature miR169a is correlated with the increase of transcript levels of its target genes and vice versa (Lee et al., 2010). To evaluate whether NF-YA1, the target of miR169a, was positively regulated by the overexpression of HYH, the expression levels of NF-YA1 were analyzed in HYH-overexpressing plants. The results showed that the levels of NF-YA1 were indeed upregulated in 35S::HA:HYH plants (Figure 7F). Since we observed a consistent relationship between expression of the negative regulator and the target gene of miR169, this result suggested that upregulation of NF-YA1 was due to the depletion of miR169a by the overexpression of HYH.
We then analyzed the diurnal rhythm of HYH and pri-miR169a transcripts. We sampled 7- and 8-day-old wild-type Col-0 seedlings every 4 h from ZT0 to ZT44. Consistent with the previous report of induction of HYH expression by light (Li et al., 2017), HYH transcripts were consistently abundant during the light period and then decreased drastically in the dark until the next light period (Figure 7G). The levels of pri-miR169a showed an opposite pattern, remaining low during the light period, starting to increase at ZT16, and peaking at ZT24, just before the beginning of the next light period, when HYH transcription would be induced. Our results demonstrated a clear opposite relationship between the diurnal oscillation patterns of HYH and pri-miR169a transcripts, consistent with the negative role of HYH in the regulation of MIR169a transcription.
Discussion
Ambient Temperature Regulates MIR169 at the Transcriptional Level via HYH
In this study, we characterized the promoter of MIR169a, an ambient temperature-responsive miRNA gene (Lee et al., 2010), and identified the cis-acting elements. We also identified a transcription factor that is responsible for the ambient temperature response. The 5′-promoter deletion GUS analyses revealed that the promoter region -1,505 to -1,007 bp upstream of MIR169a conferred ambient temperature-responsive expression (Figure 3). The DNA-affinity chromatography coupled with LC-MS showed that HYH bound to the -1,505/-1,007 promoter region (Figure 4). EMSA data showed that HYH protein directly bound to a derivative of G-box motif, which is positioned at -1,167/-1,157 in the promoter (Figure 6D). Mutation of the core G-box-like sequence prevented the interaction with HYH (Figure 6D), supporting the idea that the G-box-like motif is crucial for the interaction between HYH and MIR169a. The genetic interaction using hyh mutants and plants overexpressing HYH, MIR169a, and MIM169 revealed that at a higher ambient temperature, HYH protein acted upstream of MIR169a as a negative regulator (Figure 7). Our finding on the negative role of HYH in the regulation of MIR169a expression is consistent with the observation that hyh mutants flower early (Holm et al., 2002) and overexpression of MIR169 also produced an early flowering phenotype (Xu et al., 2014). We found that HYH protein levels were higher at 23°C than at 16°C (Figure 6G and Supplementary Figure 1B), whereas HYH transcript levels were not affected by ambient temperature changes (Figure 7D). This suggested that ambient temperature might regulate HYH levels post-transcriptionally. Interestingly, COP1, an E3 ubiquitin ligase that is known to promote degradation of HYH and HY5 (Holm et al., 2002), is more stable in the night and dawn at a low ambient temperature (Jang et al., 2015). This suggests that COP1 mediates HYH protein degradation at lower temperatures, thereby leading to lower DNA binding capacity at lower temperatures (Figure 6F and Supplementary Figure 1A). Nevertheless, since there are four HYH isoforms and all of them contain the conserved bZIP DNA-binding domain (Li et al., 2017), it would be interesting to investigate whether the different ambient temperatures favor different splicing variants and whether each protein variant has a different DNA-binding affinity.
Based on our findings, we suggest a working model (Figure 8) to demonstrate the potential upstream negative regulation of MIR169a by ambient temperature via HYH protein. Upon exposure to a higher ambient temperature, HYH binds to the G-box-like motif in the promoter of MIR169a to repress its expression and subsequently decrease the abundance of miR169 at higher temperatures. At a lower temperature, HYH fails to bind to the MIR169a promoter; thus, MIR169a transcription occurs, which leads to more pre-miR169a and mature miR169a production. Since HYH is known to be involved in photomorphogenesis and light signaling (Oyama et al., 1997; Li et al., 2017), our results also suggest the existence of crosstalk between the ambient temperature and light signaling mechanisms.
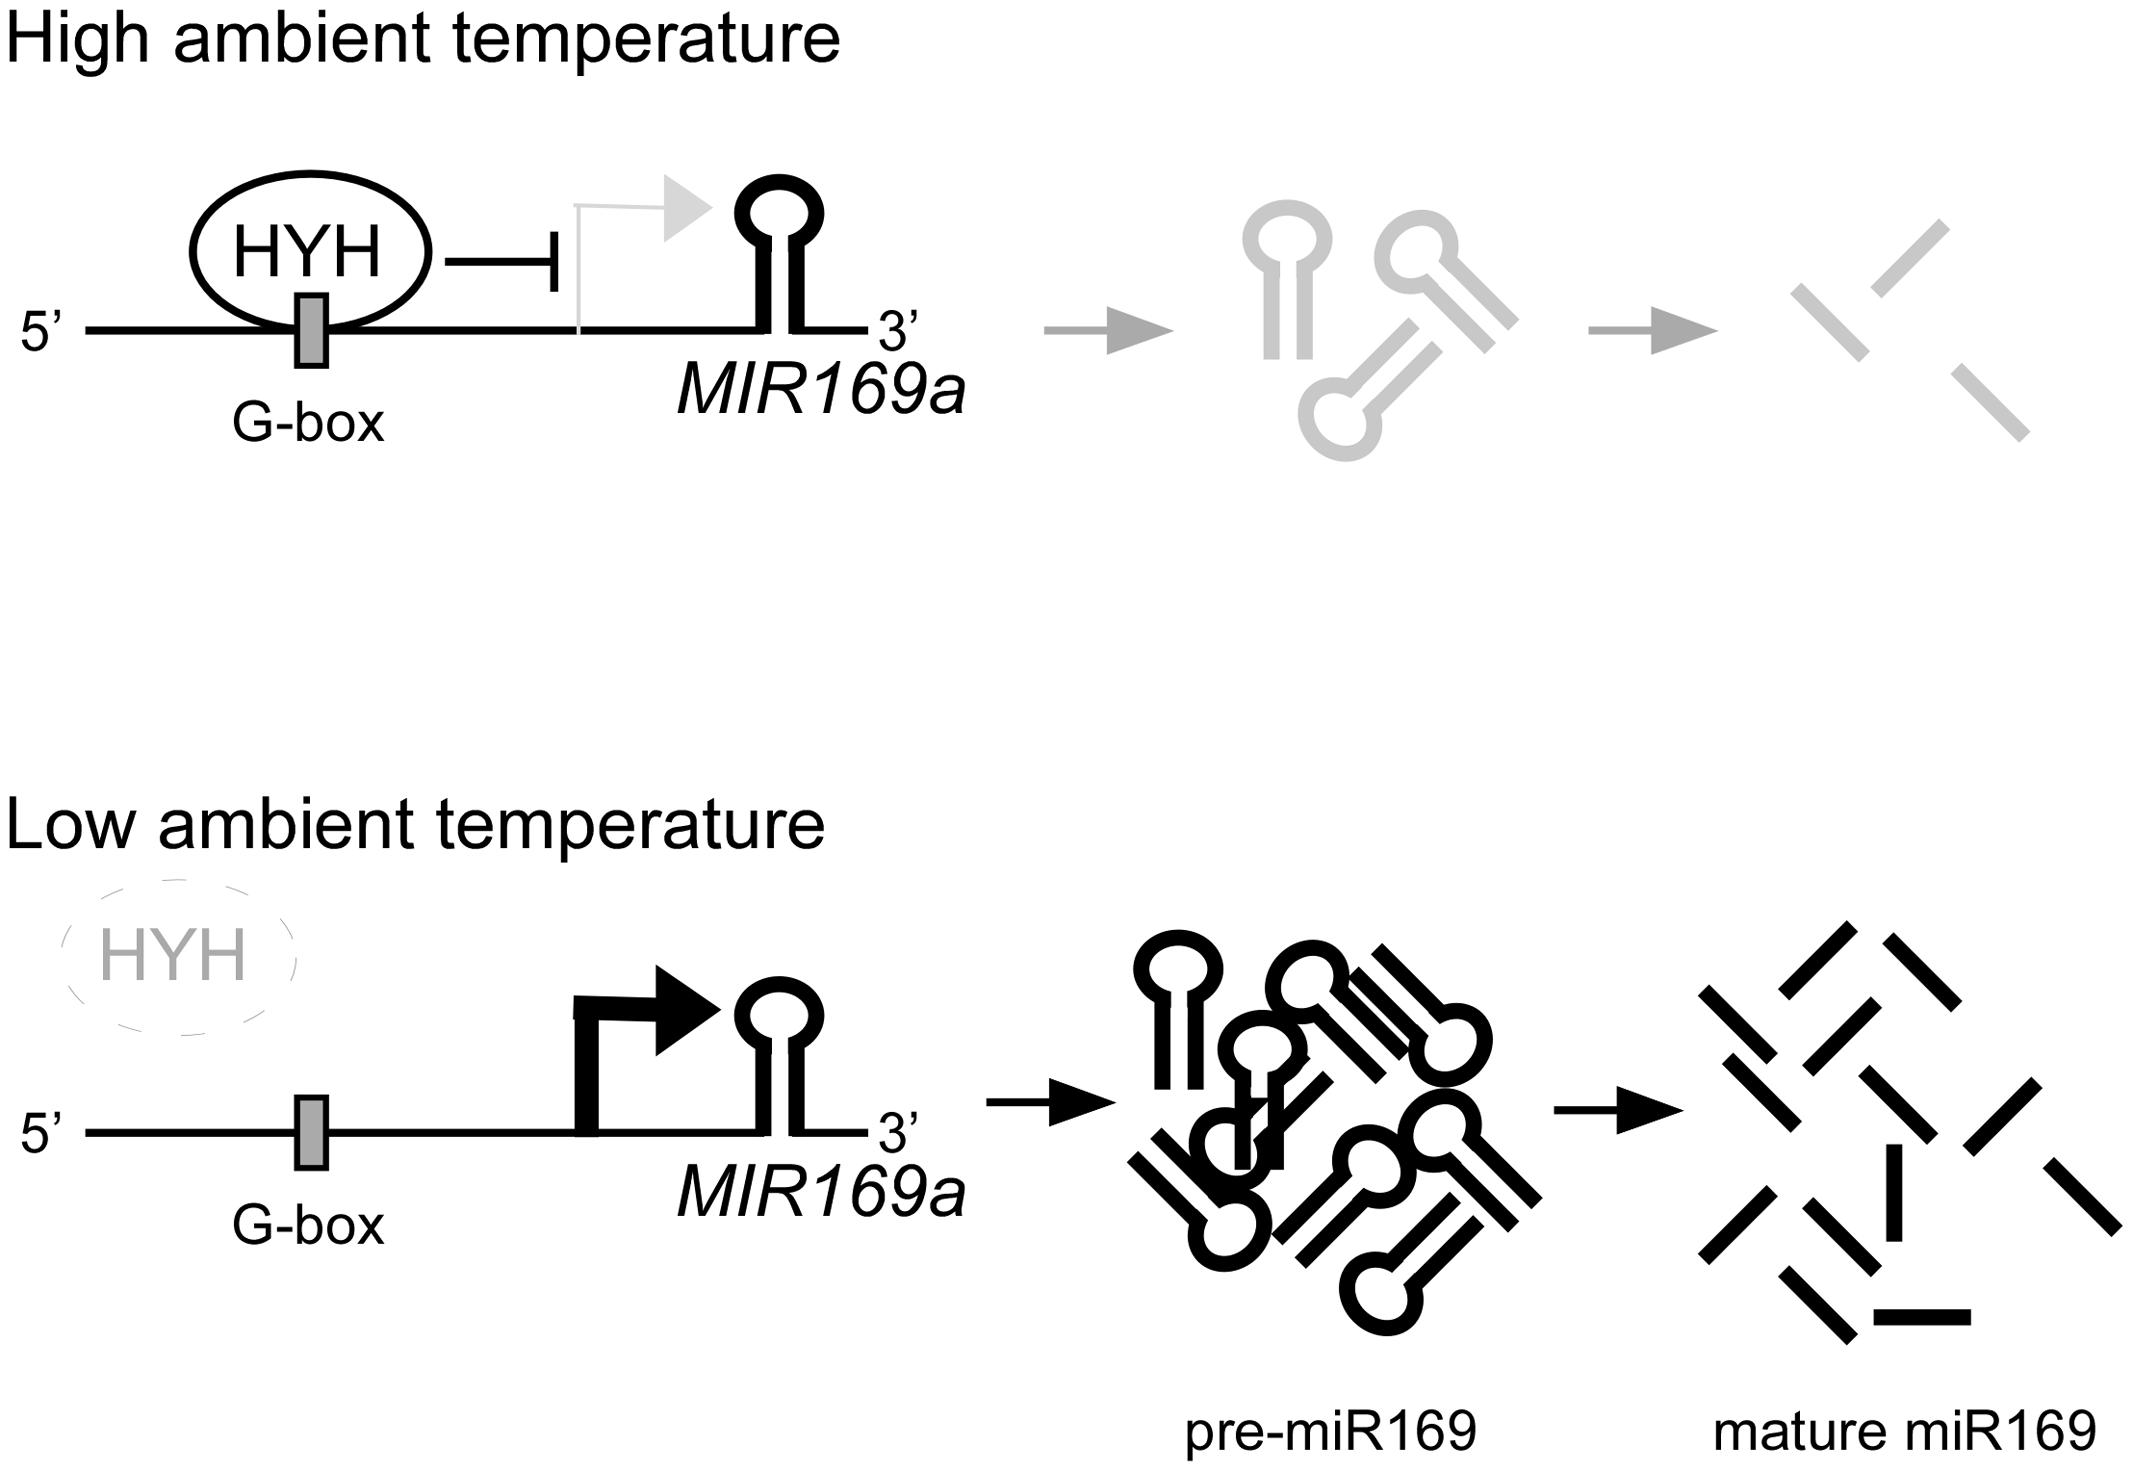
FIGURE 8. A proposed model for the function of HYH in regulating the expression of MIR169a. At higher ambient temperatures, HYH binds to the G-box-like motif in the promoter of MIR169a to repress its expression, which results in production of less pre-miR169a and less mature miR169. However, at lower ambient temperatures, HYH protein stability decreases and subsequently HYH enrichment on the G-box-like motif also decreases, and thus HYH fails to repress MIR169a expression, which results in production of more pre-miR169a and mature miR169. Other environmental factors such as light, or biotic and abiotic stresses may also affect the transcriptional regulation of MIR169a.
A Derivative of the G-Box Motif as a Novel Ambient Temperature-Responsive Element
The expression of MIR169a is affected by ambient temperature, making its promoter a model for enhancing our understanding of the transcriptional mechanism controlled by ambient temperature. In this study, we characterized an ambient temperature-responsive promoter in transgenic Arabidopsis plants. Our findings suggest that a G-box-like DNA motif at -1,167/-1,157 in the promoter of MIR169a could confer ambient temperature-responsive GUS expression (Figures 3, 4). The G-box motif is a cis-acting element that regulates responses to UV irradiation, anaerobiosis, abscisic acid, and light (Giuliano et al., 1988). Several bZIP transcription factors have high G-box-binding affinity (Vinson et al., 1989; Ellenberger et al., 1992). Since the deletion of the promoter region containing the G-box-like motif attenuated the ambient temperature response of the MIR169a promoter (Figures 3, 4), and the mutation of the core motif failed to interact with HYH protein (Figure 6D), we conclude that the G-box-like motif is required for the ambient temperature response of the MIR169a promoter.
Previously identified cis-acting elements involved in high and low temperature perception mechanisms include Abscisic Acid Response Element (ABRE), C-repeat/DRE (Yamaguchi-Shinozaki and Shinozaki, 1994; Stockinger et al., 1997), CCAAT (Sahara et al., 1999), Low Temperature Response Element (LTRE) (Jiang et al., 1996), Stress Response Element (STRE), SAR (Haralampidis et al., 2002), and Heat Shock Element (HSE) (Schoffl et al., 1998). The G-box-like motif (5′-CACGCAAAAG-3′) identified in this study did not show sequence similarity to any known temperature-responsive elements, suggesting that it is a novel cis-acting element conferring ambient temperature responsiveness. Considering that the G-box is a hexameric sequence (5′-CACGTG-3′), a derivative of the G-box identified in our study, despite its sequence similarity to the G-box, could possibly be an entirely different type of cis-acting element. The sequences flanking the core G-box affect the specificity of protein binding (Williams et al., 1992); therefore, a detailed mutational analysis of the core sequence must be performed to elucidate, define, and classify the type of cis-acting element we identified here. The G-box motif and its binding proteins HY5 and HYH also act in photomorphogenesis and light-sensing mechanisms (Holm et al., 2002); therefore, our findings additionally suggest their role in ambient temperature signaling and possible crosstalk between the two mechanisms.
Crosstalk between Ambient Temperature Sensing and Light-Sensing Mechanisms
Temperature and light are environmental cues recognized by plants as indicators of seasonal changes. Therefore, the mechanisms that perceive and integrate temperature and light signals are crucial for plant survival. There is an increasing body of evidence suggesting the existence of crosstalk between the ambient temperature and light-sensing mechanism in Arabidopsis; for instance, emerging evidence shows that phytochromes act as temperature sensors (Jung et al., 2016; Legris et al., 2016). Previous studies reported that a group of bHLH transcription factors, the phytochrome interacting factors (PIFs), regulate the light-responsive transcriptional network (Leivar and Quail, 2011) by interacting with the photoreceptors phyA and phyB (Khanna et al., 2004). PIFs and the bZIP transcription factor HY5, a close homolog of HYH, are antagonists that both target a G-box DNA motif; they form an activation-suppression transcriptional module responsive to light and temperature signals (Toledo-Ortiz et al., 2014). As the closest homolog of HY5, HYH can also bind to G-box motifs. HY5 and HYH show functional redundancy and are subjected to COP1-mediated dark-specific degradation as they contain the conserved COP1-binding domain (Holm et al., 2002). More recent studies further demonstrated that temperature and light sensing mechanisms share common signaling components during signal transduction. Delker et al. (2014) demonstrated overlapping elements of the two pathways in the DET1-COP1-HY5 module. Although the function of HYH has not been as well characterized, it has been shown that HYH also participates in the light-signaling mechanism, unlike its homolog HY5 (Singh et al., 2012). As HYH expression was previously shown to be induced by light (Li et al., 2017), our findings additionally suggest that it also exhibits a diurnal oscillation, being downregulated in the dark period (Figure 7G). Moreover, the opposite diurnal shifts observed in MIR169a and HYH expression levels either resulted from HYH depletion (Figure 7G) or light signals that might directly regulate MIR169a expression due to the presence of multiple light-responsive cis-acting elements in its promoter (Figure 2A). These observations support the notion that the ambient temperature regulation of MIR169a expression via the HYH might be modulated by crosstalk with the light-sensing mechanism.
Understanding how plants response to fluctuating temperature at the molecular level is a crucial step that must be taken to predict plant responses to climate change, mitigate the damage to agriculture, and support the conservation of biodiversity. Without activating temperature stress responses, ambient temperature influences plant growth and development (Samach and Wigge, 2005), disease resistance (Yang and Hua, 2004; Wang et al., 2009), and the circadian clock (Boikoglou et al., 2011). However, the elucidation of the ambient temperature sensing mechanism has been a challenge, considering that plants in their natural habitats are exposed to multiple environmental factors, and temperature signals are perceived in combination with other environmental stimuli. To understand how plants process complex environmental signals, on top of studies in environmentally controlled conditions, further investigation on the molecular interaction of plants in their natural habitats will give us a better insight into how plants perceive and response to ambient temperature changes.
Author Contributions
PS designed, performed, and analyzed data from the experiments. HS performed the experiments and data analysis. JA designed and supervised the study. PS, HS, and JA wrote the manuscript.
Funding
This work was supported by a National Research Foundation (NRF) of Korea grant funded by the Korean government (NRF-2017R1A2B3009624 to JA) and Samsung Science and Technology Foundation under Project Number (SSTF-BA1602-12) and Korea University.
Conflict of Interest Statement
The authors declare that the research was conducted in the absence of any commercial or financial relationships that could be construed as a potential conflict of interest.
Acknowledgments
The authors are grateful for Dr. S. Y. Kim (Korea University, South Korea) for her technical advices on protein analysis, A. Y. Jo for her technical assistance, and Prof. G. Jenkins (University of Glasgow, United Kingdom) for generously providing some of the mutant seeds used in this study.
Supplementary Material
The Supplementary Material for this article can be found online at: https://www.frontiersin.org/articles/10.3389/fpls.2017.02087/full#supplementary-material
Footnotes
- ^https://blast.ncbi.nlm.nih.gov/Blast.cgi?PAGE=Proteins
- ^http://bioinformatics.psb.ugent.be/webtools/plantcare/html/
References
Atkin, O. K., and Tjoelker, M. G. (2003). Thermal acclimation and the dynamic response of plant respiration to temperature. Trends Plant Sci. 8, 343–351. doi: 10.1016/S1360-1385(03)00136-5
Bartel, D. P. (2009). MicroRNAs: target recognition and regulatory functions. Cell 136, 215–233. doi: 10.1016/j.cell.2009.01.002
Boikoglou, E., Ma, Z., von Korff, M., Davis, A. M., Nagy, F., and Davis, S. J. (2011). Environmental memory from a circadian oscillator: the Arabidopsis thaliana clock differentially integrates perception of photic vs. thermal entrainment. Genetics 189, 655–664. doi: 10.1534/genetics.111.131417
Bologna, N. G., Schapire, A. L., Zhai, J., Chorostecki, U., Boisbouvier, J., Meyers, B. C., et al. (2013). Multiple RNA recognition patterns during microRNA biogenesis in plants. Genome Res. 23, 1675–1689. doi: 10.1101/gr.153387.112
Ceribelli, M., Dolfini, D., Merico, D., Gatta, R., Vigano, A. M., Pavesi, G., et al. (2008). The histone-like NF-Y is a bifunctional transcription factor. Mol. Cell. Biol. 28, 2047–2058. doi: 10.1128/MCB.01861-07
Cheng, C. Y., Krishnakumar, V., Chan, A. P., Thibaud-Nissen, F., Schobel, S., and Town, C. D. (2017). Araport11: a complete reannotation of the Arabidopsis thaliana reference genome. Plant J. 89, 789–804. doi: 10.1111/tpj.13415
Clough, S. J., and Bent, A. F. (1998). Floral dip: a simplified method for Agrobacterium-mediated transformation of Arabidopsis thaliana. Plant J. 16, 735–743. doi: 10.1046/j.1365-313x.1998.00343.x
Delker, C., Sonntag, L., James, G. V., Janitza, P., Ibanez, C., Ziermann, H., et al. (2014). The DET1-COP1-HY5 pathway constitutes a multipurpose signaling module regulating plant photomorphogenesis and thermomorphogenesis. Cell Rep. 9, 1983–1989. doi: 10.1016/j.celrep.2014.11.043
Edwards, D., Murray, J. A., and Smith, A. G. (1998). Multiple genes encoding the conserved CCAAT-box transcription factor complex are expressed in Arabidopsis. Plant Physiol. 117, 1015–1022. doi: 10.1104/pp.117.3.1015
Ellenberger, T. E., Brandl, C. J., Struhl, K., and Harrison, S. C. (1992). The GCN4 basic region leucine zipper binds DNA as a dimer of uninterrupted alpha helices: crystal structure of the protein-DNA complex. Cell 71, 1223–1237. doi: 10.1016/S0092-8674(05)80070-4
Fitter, A. H., and Fitter, R. S. (2002). Rapid changes in flowering time in British plants. Science 296, 1689–1691. doi: 10.1126/science.1071617
Gangappa, S. N., and Kumar, S. V. (2017). DET1 and HY5 control PIF4-mediated thermosensory elongation growth through distinct mechanisms. Cell Rep. 18, 344–351. doi: 10.1016/j.celrep.2016.12.046
German, M. A., Pillay, M., Jeong, D. H., Hetawal, A., Luo, S., Janardhanan, P., et al. (2008). Global identification of microRNA-target RNA pairs by parallel analysis of RNA ends. Nat. Biotechnol. 26, 941–946. doi: 10.1038/nbt1417
Giuliano, G., Pichersky, E., Malik, V. S., Timko, M. P., Scolnik, P. A., and Cashmore, A. R. (1988). An evolutionarily conserved protein binding sequence upstream of a plant light-regulated gene. Proc. Natl. Acad. Sci. U.S.A. 85, 7089–7093. doi: 10.1073/pnas.85.19.7089
Gonzalez-Ibeas, D., Blanca, J., Donaire, L., Saladie, M., Mascarell-Creus, A., Cano-Delgado, A., et al. (2011). Analysis of the melon (Cucumis melo) small RNAome by high-throughput pyrosequencing. BMC Genomics 12:393. doi: 10.1186/1471-2164-12-393
Haralampidis, K., Milioni, D., Rigas, S., and Hatzopoulos, P. (2002). Combinatorial interaction of cis elements specifies the expression of the Arabidopsis AtHsp90-1 gene. Plant Physiol. 129, 1138–1149. doi: 10.1104/pp.004044
Haring, M., Offermann, S., Danker, T., Horst, I., Peterhansel, C., and Stam, M. (2007). Chromatin immunoprecipitation: optimization, quantitative analysis and data normalization. Plant Methods 3:11. doi: 10.1186/1746-4811-3-11
Holm, M., Ma, L. G., Qu, L. J., and Deng, X. W. (2002). Two interacting bZIP proteins are direct targets of COP1-mediated control of light-dependent gene expression in Arabidopsis. Genes Dev. 16, 1247–1259. doi: 10.1101/gad.969702
Hong, S. M., Bahn, S. C., Lyu, A., Jung, H. S., and Ahn, J. H. (2010). Identification and testing of superior reference genes for a starting pool of transcript normalization in Arabidopsis. Plant Cell Physiol. 51, 1694–1706. doi: 10.1093/pcp/pcq128
Hu, J., and Desai, M. (2008). Light control of peroxisome proliferation during Arabidopsis photomorphogenesis. Plant Signal. Behav. 3, 801–803. doi: 10.4161/psb.3.10.5876
Izawa, T., Foster, R., and Chua, N. H. (1993). Plant bZIP protein DNA binding specificity. J. Mol. Biol. 230, 1131–1144. doi: 10.1006/jmbi.1993.1230
Jang, K., Lee, H. G., Jung, S. J., Paek, N. C., and Seo, P. J. (2015). The E3 ubiquitin ligase COP1 regulates thermosensory flowering by triggering GI degradation in Arabidopsis. Sci. Rep. 5:12071. doi: 10.1038/srep12071
Jiang, C., Iu, B., and Singh, J. (1996). Requirement of a CCGAC cis-acting element for cold induction of the BN115 gene from winter Brassica napus. Plant Mol. Biol. 30, 679–684. doi: 10.1007/BF00049344
Jones-Rhoades, M. W., and Bartel, D. P. (2004). Computational identification of plant microRNAs and their targets, including a stress-induced miRNA. Mol. Cell. 14, 787–799. doi: 10.1016/j.molcel.2004.05.027
Jung, J. H., Domijan, M., Klose, C., Biswas, S., Ezer, D., Gao, M., et al. (2016). Phytochromes function as thermosensors in Arabidopsis. Science 354, 886–889. doi: 10.1126/science.aaf6005
Jutras, B. L., Verma, A., and Stevenson, B. (2012). Identification of novel DNA-binding proteins using DNA-affinity chromatography/pull down. Curr. Protoc. Microbiol. 24, 1F.1.1–1F.1.13. doi: 10.1002/9780471729259.mc01f01s24
Khanna, R., Huq, E., Kikis, E. A., Al-Sady, B., Lanzatella, C., and Quail, P. H. (2004). A novel molecular recognition motif necessary for targeting photoactivated phytochrome signaling to specific basic helix-loop-helix transcription factors. Plant Cell 16, 3033–3044. doi: 10.1105/tpc.104.025643
Lee, H., Yoo, S. J., Lee, J. H., Kim, W., Yoo, S. K., Fitzgerald, H., et al. (2010). Genetic framework for flowering-time regulation by ambient a temperature-responsive miRNAs in Arabidopsis. Nucleic Acids Res. 38, 3081–3093. doi: 10.1093/nar/gkp1240
Lee, J. H., Ryu, H. S., Chung, K. S., Pose, D., Kim, S., Schmid, M., et al. (2013). Regulation of temperature-responsive flowering by MADS-box transcription factor repressors. Science 342, 628–632. doi: 10.1126/science.1241097
Legris, M., Klose, C., Burgie, E. S., Rojas, C. C., Neme, M., Hiltbrunner, A., et al. (2016). Phytochrome B integrates light and temperature signals in Arabidopsis. Science 354, 897–900. doi: 10.1126/science.aaf5656
Leivar, P., and Quail, P. H. (2011). PIFs: pivotal components in a cellular signaling hub. Trends Plant Sci. 16, 19–28. doi: 10.1016/j.tplants.2010.08.003
Lescot, M., Dehais, P., Thijs, G., Marchal, K., Moreau, Y., Van de Peer, Y., et al. (2002). PlantCARE, a database of plant cis-acting regulatory elements and a portal to tools for in silico analysis of promoter sequences. Nucleic Acids Res. 30, 325–327. doi: 10.1093/nar/30.1.325
Leyva-Gonzalez, M. A., Ibarra-Laclette, E., Cruz-Ramirez, A., and Herrera-Estrella, L. (2012). Functional and transcriptome analysis reveals an acclimatization strategy for abiotic stress tolerance mediated by Arabidopsis NF-YA family members. PLOS ONE 7:e48138. doi: 10.1371/journal.pone.0048138
Li, C., Zheng, L., Zhang, J., Lv, Y., Liu, J., Wang, X., et al. (2017). Characterization and functional analysis of four HYH splicing variants in Arabidopsis hypocotyl elongation. Gene 619, 44–49. doi: 10.1016/j.gene.2017.04.001
Nasim, Z., Fahim, M., and Ahn, J. H. (2017). Possible role of MADS AFFECTING FLOWERING 3 and B-BOX DOMAIN PROTEIN 19 in flowering time regulation of Arabidopsis mutants with defects in nonsense-mediated mRNA decay. Front. Plant Sci. 8:191. doi: 10.3389/fpls.2017.00191
Oyama, T., Shimura, Y., and Okada, K. (1997). The Arabidopsis HY5 gene encodes a bZIP protein that regulates stimulus-induced development of root and hypocotyl. Genes Dev. 11, 2983–2995. doi: 10.1101/gad.11.22.2983
Park, Y. J., Lee, H. J., Ha, J. H., Kim, J. Y., and Park, C. M. (2017). COP1 conveys warm temperature information to hypocotyl thermomorphogenesis. New Phytol. 215, 269–280. doi: 10.1111/nph.14581
Pose, D., Verhage, L., Ott, F., Yant, L., Mathieu, J., Angenent, G. C., et al. (2013). Temperature-dependent regulation of flowering by antagonistic FLM variants. Nature 503, 414–417. doi: 10.1038/nature12633
Sahara, T., Suzuki, M., Tsuruha, J., Takada, Y., and Fukunaga, N. (1999). cis-Acting elements responsible for low-temperature-inducible expression of the gene coding for the thermolabile isocitrate dehydrogenase isozyme of a psychrophilic bacterium, Vibrio sp. strain ABE-1. J. Bacteriol. 181, 2602–2611.
Samach, A., and Wigge, P. A. (2005). Ambient temperature perception in plants. Curr. Opin. Plant Biol. 8, 483–486. doi: 10.1016/j.pbi.2005.07.011
Schoffl, F., Prandl, R., and Reindl, A. (1998). Regulation of the heat-shock response. Plant Physiol. 117, 1135–1141. doi: 10.1104/pp.117.4.1135
Shi, Q. M., Yang, X., Song, L., and Xue, H. W. (2011). Arabidopsis MSBP1 is activated by HY5 and HYH and is involved in photomorphogenesis and brassinosteroid sensitivity regulation. Mol. Plant 4, 1092–1104. doi: 10.1093/mp/ssr049
Siefers, N., Dang, K. K., Kumimoto, R. W., Bynum, W. E. T., Tayrose, G., Holt, B. F. III, et al. (2009). Tissue-specific expression patterns of Arabidopsis NF-Y transcription factors suggest potential for extensive combinatorial complexity. Plant Physiol. 149, 625–641. doi: 10.1104/pp.108.130591
Singh, A., Ram, H., Abbas, N., and Chattopadhyay, S. (2012). Molecular interactions of GBF1 with HY5 and HYH proteins during light-mediated seedling development in Arabidopsis thaliana. J. Biol. Chem. 287, 25995–26009. doi: 10.1074/jbc.M111.333906
Song, L., Koga, Y., and Ecker, J. R. (2016). Profiling of transcription factor binding events by chromatin immunoprecipitation sequencing (ChIP-seq). Curr. Protoc. Plant Biol. 1, 293–306. doi: 10.1002/cppb.20014
Sorin, C., Declerck, M., Christ, A., Blein, T., Ma, L., Lelandais-Briere, C., et al. (2014). A miR169 isoform regulates specific NF-YA targets and root architecture in Arabidopsis. New Phytol. 202, 1197–1211. doi: 10.1111/nph.12735
Stockinger, E. J., Gilmour, S. J., and Thomashow, M. F. (1997). Arabidopsis thaliana CBF1 encodes an AP2 domain-containing transcriptional activator that binds to the C-repeat/DRE, a cis-acting DNA regulatory element that stimulates transcription in response to low temperature and water deficit. Proc. Natl. Acad. Sci. U.S.A. 94, 1035–1040. doi: 10.1073/pnas.94.3.1035
Todesco, M., Rubio-Somoza, I., Paz-Ares, J., and Weigel, D. (2010). A collection of target mimics for comprehensive analysis of microRNA function in Arabidopsis thaliana. PLOS Genet. 6:e1001031. doi: 10.1371/journal.pgen.1001031
Toledo-Ortiz, G., Johansson, H., Lee, K. P., Bou-Torrent, J., Stewart, K., Steel, G., et al. (2014). The HY5-PIF regulatory module coordinates light and temperature control of photosynthetic gene transcription. PLOS Genet. 10:e1004416. doi: 10.1371/journal.pgen.1004416
Vinson, C. R., Sigler, P. B., and McKnight, S. L. (1989). Scissors-grip model for DNA recognition by a family of leucine zipper proteins. Science 246, 911–916. doi: 10.1126/science.2683088
Voinnet, O. (2009). Origin, biogenesis, and activity of plant microRNAs. Cell 136, 669–687. doi: 10.1016/j.cell.2009.01.046
Wang, Y., Bao, Z., Zhu, Y., and Hua, J. (2009). Analysis of temperature modulation of plant defense against biotrophic microbes. Mol. Plant Microbe Interact. 22, 498–506. doi: 10.1094/MPMI-22-5-0498
Whelan, J. A., Russell, N. B., and Whelan, M. A. (2003). A method for the absolute quantification of cDNA using real-time PCR. J. Immunol. Methods 278, 261–269. doi: 10.1016/S0022-1759(03)00223-0
Williams, M. E., Foster, R., and Chua, N. H. (1992). Sequences flanking the hexameric G-box core CACGTG affect the specificity of protein binding. Plant Cell 4, 485–496. doi: 10.1105/tpc.4.4.485
Xie, Z., Allen, E., Fahlgren, N., Calamar, A., Givan, S. A., and Carrington, J. C. (2005). Expression of Arabidopsis MIRNA genes. Plant Physiol. 138, 2145–2154. doi: 10.1104/pp.105.062943
Xu, M. Y., Zhang, L., Li, W. W., Hu, X. L., Wang, M. B., Fan, Y. L., et al. (2014). Stress-induced early flowering is mediated by miR169 in Arabidopsis thaliana. J. Exp. Bot. 65, 89–101. doi: 10.1093/jxb/ert353
Yamaguchi-Shinozaki, K., and Shinozaki, K. (1994). A novel cis-acting element in an Arabidopsis gene is involved in responsiveness to drought, low-temperature, or high-salt stress. Plant Cell 6, 251–264. doi: 10.1105/tpc.6.2.251
Yang, S., and Hua, J. (2004). A haplotype-specific resistance gene regulated by BONZAI1 mediates temperature-dependent growth control in Arabidopsis. Plant Cell 16, 1060–1071. doi: 10.1105/tpc.020479
Zhang, X., Zou, Z., Gong, P., Zhang, J., Ziaf, K., Li, H., et al. (2011a). Over-expression of microRNA169 confers enhanced drought tolerance to tomato. Biotechnol. Lett. 33, 403–409. doi: 10.1007/s10529-010-0436-0
Zhang, Y., Liu, Z., Liu, R., Hao, H., and Bi, Y. (2011b). Gibberellins negatively regulate low temperature-induced anthocyanin accumulation in a HY5/HYH-dependent manner. Plant Signal. Behav. 6, 632–634.
Zhang, Y., Zheng, S., Liu, Z., Wang, L., and Bi, Y. (2011c). Both HY5 and HYH are necessary regulators for low temperature-induced anthocyanin accumulation in Arabidopsis seedlings. J. Plant Physiol. 168, 367–374. doi: 10.1016/j.jplph.2010.07.025
Zhao, B., Ge, L., Liang, R., Li, W., Ruan, K., Lin, H., et al. (2009). Members of miR-169 family are induced by high salinity and transiently inhibit the NF-YA transcription factor. BMC Mol. Biol. 10:29. doi: 10.1186/1471-2199-10-29
Zhao, M., Ding, H., Zhu, J. K., Zhang, F., and Li, W. X. (2011). Involvement of miR169 in the nitrogen-starvation responses in Arabidopsis. New Phytol. 190, 906–915. doi: 10.1111/j.1469-8137.2011.03647.x
Zhou, X., Wang, G., Sutoh, K., Zhu, J. K., and Zhang, W. (2008). Identification of cold-inducible microRNAs in plants by transcriptome analysis. Biochim. Biophys. Acta 1779, 780–788. doi: 10.1016/j.bbagrm.2008.04.005
Keywords: miR169, HYH, G-box-like motif, ambient temperature, Arabidopsis
Citation: Serivichyaswat PT, Susila H and Ahn JH (2017) Elongated Hypocotyl 5-Homolog (HYH) Negatively Regulates Expression of the Ambient Temperature-Responsive MicroRNA Gene MIR169. Front. Plant Sci. 8:2087. doi: 10.3389/fpls.2017.02087
Received: 27 July 2017; Accepted: 22 November 2017;
Published: 07 December 2017.
Edited by:
Stefan A. Rensing, Philipps University of Marburg, GermanyReviewed by:
Xiaosa Xu, Cold Spring Harbor Laboratory, United StatesVinod Kumar, John Innes Centre (BBSRC), United Kingdom
Copyright © 2017 Serivichyaswat, Susila and Ahn. This is an open-access article distributed under the terms of the Creative Commons Attribution License (CC BY). The use, distribution or reproduction in other forums is permitted, provided the original author(s) or licensor are credited and that the original publication in this journal is cited, in accordance with accepted academic practice. No use, distribution or reproduction is permitted which does not comply with these terms.
*Correspondence: Ji Hoon Ahn, amFobkBrb3JlYS5hYy5rcg==
†These authors have contributed equally to this work.