 Peter L. Cummins
 Babu Kannappan
 Jill E. Gready
- Gready Group, Department of Genome Science, John Curtin School of Medical Research, Australian National University, Canberra, ACT, Australia
The ubiquitous enzyme Ribulose 1,5-bisphosphate carboxylase-oxygenase (RuBisCO) fixes atmospheric carbon dioxide within the Calvin-Benson cycle that is utilized by most photosynthetic organisms. Despite this central role, RuBisCO's efficiency surprisingly struggles, with both a very slow turnover rate to products and also impaired substrate specificity, features that have long been an enigma as it would be assumed that its efficiency was under strong evolutionary pressure. RuBisCO's substrate specificity is compromised as it catalyzes a side-fixation reaction with atmospheric oxygen; empirical kinetic results show a trend to tradeoff between relative specificity and low catalytic turnover rate. Although the dominant hypothesis has been that the active-site chemistry constrains the enzyme's evolution, a more recent study on RuBisCO stability and adaptability has implicated competing selection pressures. Elucidating these constraints is crucial for directing future research on improving photosynthesis, as the current literature casts doubt on the potential effectiveness of site-directed mutagenesis to improve RuBisCO's efficiency. Here we use regression analysis to quantify the relationships between kinetic parameters obtained from empirical data sets spanning a wide evolutionary range of RuBisCOs. Most significantly we found that the rate constant for dissociation of CO2 from the enzyme complex was much higher than previous estimates and comparable with the corresponding catalytic rate constant. Observed trends between relative specificity and turnover rate can be expressed as the product of negative and positive correlation factors. This provides an explanation in simple kinetic terms of both the natural variation of relative specificity as well as that obtained by reported site-directed mutagenesis results. We demonstrate that the kinetic behaviour shows a lesser rather than more constrained RuBisCO, consistent with growing empirical evidence of higher variability in relative specificity. In summary our analysis supports an explanation for the origin of the tradeoff between specificity and turnover as due to competition between protein stability and activity, rather than constraints between rate constants imposed by the underlying chemistry. Our analysis suggests that simultaneous improvement in both specificity and turnover rate of RuBisCO is possible.
Introduction
Ribulose 1,5-bisphosphate carboxylase-oxygenase (RuBisCO) is the enzyme responsible for the fixation of carbon derived from atmospheric CO2 as part of the Calvin-Benson cycle that leads to production of the glucose essential for growth in most photosynthetic organisms. However, RuBisCO has a low turnover rate in higher plants (~3 s−1) and the efficiency of carbon fixation by the enzyme is compromised by a competing reaction with atmospheric O2 that leads to photorespiration at high cost to the organism in terms of both energy and loss of carbon. A recent analysis of kcat and KM values of several thousand enzymes (Bar-Even et al., 2011) has shown that RuBisCO's catalytic rate, kcat, and efficiency (kcat/KM) are not unusually low compared with values of the “average” enzyme (see their Figure 1), even though much lower than fast enzymes at the diffusion-controlled limit, for a variety of reasons including absence of strong evolutionary selection pressure and substrate properties, especially low molecular mass and hydrophobicity, limiting KM optimization. A later analysis (Bar-Even et al., 2015) showed that enzyme-substate encounters for the “average” enzyme are not productive(“futile”), again for various reasons. The insights from these analyses are useful in placing RuBisCO's catalytic rate and efficiency in the context of all enzymes, especially the significant dissociation rate for CO2 we find in this work, but nonetheless puzzles remain as RuBisCO has been subject to very strong evolutionary pressure.
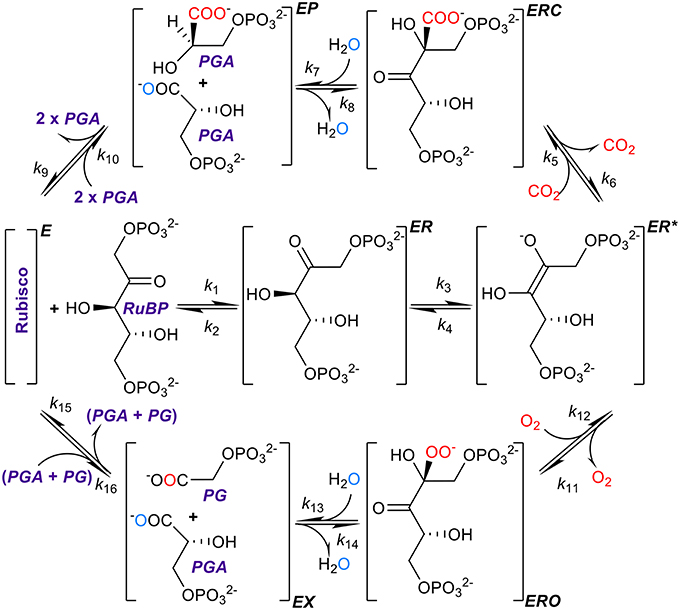
Figure 1. The kinetic mechanism of RuBisCO. RuBisCO must first be activated by carbamylation and binding of Mg2+ before it processes three substrates, ribulose bisphosphate (RuBP), and carbon dioxide or oxygen, the complete reactions taking place over several stages (Lorimer, 1981; Cleland et al., 1998; Andersson, 2008; Kannappan and Gready, 2008). RuBP binds first forming a complex (ER) with the activated form of the enzyme (E), followed by enolization of RuBP (ER*) which facilitates binding with the carbon dioxide or oxygen molecule to form the ERC or ERO enzyme-substrate complexes. After hydrolysis, the six-carbon compound formed by the addition of carbon dioxide to RuBP breaks at a C-C bond forming a product complex (EP) which dissociates into two three-carbon compounds, 3-phosphoglyceric acid (PGA), with the addition of two protons. Oxygenation proceeds through analogous steps except that the dissociation products are one PGA molecule and one of 2-phospho-glycolate (PG). Atoms originating from free CO2 and O2 are shown in red, and oxygen atom originating from the water molecule used for hydration is shown in aqua blue.
To mitigate this apparent torpidity of the enzyme, organisms have co-evolved other strategies for maintaining levels of photosynthesis. The observed large variations in RuBisCO kinetic parameters from photosynthetic organisms in different kingdoms down to different species (Jordan and Ogren, 1981, 1983) is a consequence of co-evolution with resource allocation into other strategies that lead to enhanced photosynthesis (largely by way of more efficient CO2 and nitrogen utilization) and suppressed photorespiration (Badger and Andrews, 1987; Badger et al., 1998).
Cyanobacterial RuBisCOs are characterized by lower values of activity with CO2 relative to that of O2 (the relative specificity, SC/O) and higher catalytic turnover rates (). These organisms utilize a carbon-concentrating mechanism (CCM) which compensates for the lower SC/O and limits photorespiration by increasing the CO2/O2 ratio at the site of fixation, while taking advantage of the higher by reducing RuBisCO concentration and hence the requirement for nitrogen. Some non-green algae with higher SC/O do not express a CCM but instead the lower is mitigated by increasing RuBisCO and, hence, higher investment of nitrogen in RuBisCO protein. In higher plants, the kinetic balances and photosynthetic pathways lie somewhere in the middle of these two extremes. In C3 plants SC/O is generally greater and less than in C4 plants expressing CCMs (Yeoh et al., 1980; Seemann et al., 1984; Ghannoum et al., 2005), while others are characterized as C3-C4 intermediate or C4-like (Kubien et al., 2008).
Understanding the nature of constraints imposed on RuBisCO's intrinsic efficiency is important for directing future research on photosynthesis. Study of RuBisCO activity has become a focus for improving photosynthesis (Bainbridge et al., 1995; Peterhansel et al., 2008; Gready and Kannappan, 2009; Whitney et al., 2011; Parry et al., 2013; Carmo-Silva et al., 2015) with a major aim of improving crop yields. However, some doubt has been cast on whether it can be significantly improved via mutation because of a hypothesis of “underlying constraints” in the chemistry of the reaction (Tcherkez et al., 2006; Savir et al., 2010; Tcherkez, 2013).
In the present study, we argue that this conclusion may have resulted from unsupported assumptions of the kinetic models and limited data sets used in the analyses. Resolving the precise nature of the constraints imposed on RuBisCO kinetics is clearly pivotal to providing direction of future research into improving photosynthesis. The rate constants (Figure 1) determine, and therefore ultimately limit, the physical binding of substrates, the breaking and formation of chemical bonds, and finally the release of products (Lorimer, 1981; Cleland et al., 1998; Andersson, 2008; Kannappan and Gready, 2008).
Although methods for computing individual rate constants from kinetic data have not been widely implemented for RuBisCO (McNevin et al., 2006), the more commonly measured kinetic parameters (, , KC, KO, and ), in vitro, are generally functions of these. Here we derive the equations for the kinetic mechanism (Figure 1) and estimate the mean (or expected) values for rate constants using regression analysis. Utilizing the compilation in Table 1, which includes the data used by Savir et al. in their analysis (Savir et al., 2010), we performed our own linear regression analysis on a wider range of data sets. This analysis was extended to other plant data (Galmés et al., 2014; Prins et al., 2016) to assist in validating the results. We found that the rate constants for dissociation of the CO2 and O2 substrates (k6 and k12 in Figure 1) are much larger relative to the corresponding catalytic rate than previously assumed and consequently have a significant effect on the kinetics. We also suggest the constraints on RuBisCO may be better explained by competing selection pressures, rather than by positive selection within hypothetical constraints (Tcherkez et al., 2006; Tcherkez, 2013) imposed by the chemical mechanism.
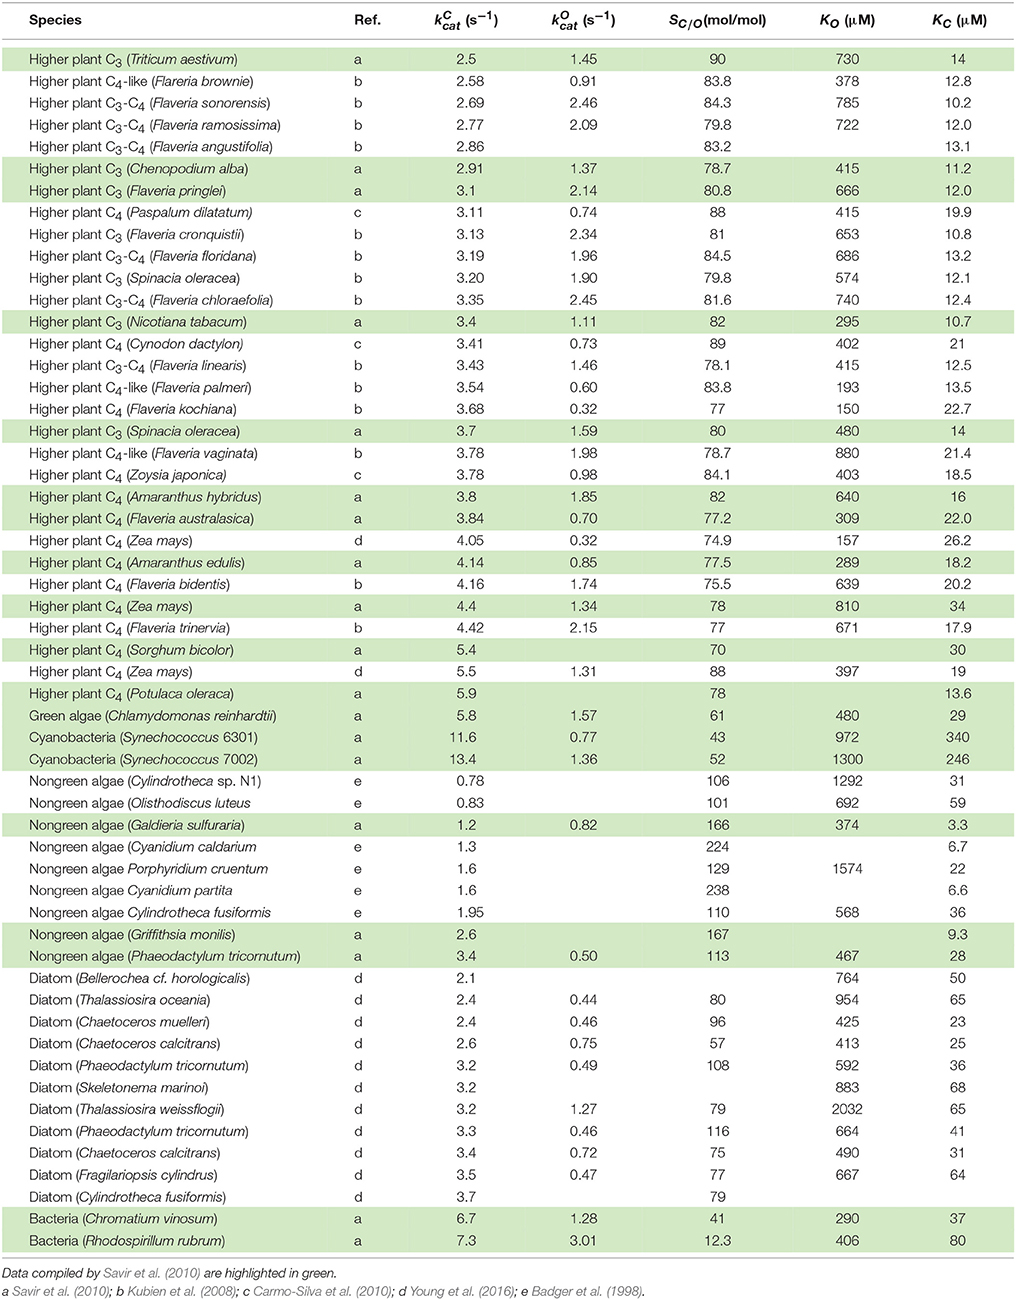
Table 1. RuBisCO kinetic parameters.
Our results and conclusions are indicative of a less constrained RuBisCO and are consistent with observed variations in the kinetics of a wider range of wild type and mutant RuBisCO that are now available, although such kinetic data is regrettably still sparse.
Methods
We consider the rate constants ki for the kinetic mechanism (Figure 1) to be a set of general random variables (Koralov and Sinai, 2007). The expected value, E(ki) ≡ 〈ki〉, is the mean value of ki, i.e., averaged over a number of sequences. In principle these averages can be extracted using both linear and non-linear regression methods to establish functional relationships between the RuBisCO kinetic parameters. As KC and KO depend explicitly on and , respectively, we restrict the independent variables (predictors) to and . The dependent (response) variables whose expected values, conditional on or , are determined by regression are then KC, KO and SC/O, e.g., .
The Generalized Extreme Studentized Deviate (ESD) test (Rosner, 1983) was used with P-value of 0.05 to eliminate multiple outliers in the data prior to regression analysis. The regression parameters were then used to estimate the expected values of various terms in the kinetic equations. We can illustrate the procedure by considering a more simplistic single-intermediate kinetic mechanism where the Michaelis constant is given by (e.g, Roberts, 1977; Farquhar, 1979). Enzyme assays typically provide KM and kcat but insufficient data to determine kon and koff which are, respectively, the rate constants for the binding and dissociation of substrate (e.g., CO2 or O2). However, if we consider that the rate constants kcat, kon and koff randomly fluctuate over a number of sequences, a linear correlation, 〈KM〉, may be obtained between KM and kcat from which the gradient and intercept give the expected values and , respectively, and using the approximation 〈xy〉 ≈ 〈x〉〈y〉 for a finite number of random variables x and y, we can hence determine the expected values of the rate constants 〈kon〉 and 〈koff〉. Although KM is linearly dependent on kcat, we should not necessarily expect to observe any correlation, as high variances may be associated with the other two terms, kon and koff. Where a linear correlation exists, we may infer that the rate constants kon and koff are fairly constant (low variance), while a non-linear correlation would be consistent with an additional correlation between kcat and at least one of these other two terms. Statistical (regression) methods are here used to show how these different scenarios are represented in the available kinetic data.
Results
Kinetic Equations
In deriving the following kinetic equations for this mechanism (Figure 1) we assumed only that both k10 and k16 are very much smaller than any of the remaining rate constants (effectively, k10 = k16 = 0). We emphasize that no such approximations (ki = 0) were made anywhere else in the derivation. The Michaelis constants (KM) for carboxylation and oxygenation are then given, respectively, by equations of the form (Equations A23, A24; see Appendix in Supplementary Materials for details of derivations)
The general equation for the specificity of carboxylation relative to that of oxygenation (relative specificity) is then (Equation A25).
In Equation (3), the relative specificity (SC/O) is formally a function of 10 rate constants (k5..k9, k11..k15), five for each of the carboxylation and oxygenation reactions. is a function only of rate constants for the enolization step (Equation A22), i.e., independent of carboxylation or oxygenation, and 0 < γ < 1. Both and γC are formally functions of k3, k7, k8 and k9 (Equation A26). It is evident (Equation A26) that if k7 is the slow step that determines the maximum catalytic rate (), then γC = 1. Similarly (Equation A27), if , then γO = 1. However, we need not make these types of assumptions here, and simply regard γCk6 and γOk12 as effective dissociation rate constants.
Michaelis Constants
The results of linear regression analysis performed on a number of data sets are summarized in Table 2. The green algae, bacteria and cyanobacteria data in Table 1 and other plant species (Galmés et al., 2014) could not be considered individually for analysis due to the small numbers of observations (N < 3). The log-scale plots (Figures 2A,B) of KC over the full range of values in Table 1 suggest a linear correlation and hence regression analysis of ln(KC) on (“All data” sets in Table 2). P < 0.05 for both coefficients were obtained only for carboxylation using the “All data” sets (Figures 2A,B), carboxylation using a subset of the C3 plants (Galmés et al., 2014), oxygenation using Triticeae data (Prins et al., 2016) and oxygenation using only the higher plant data (Figure 2C). The residuals were found to be near-normally distributed (Figure 3). Reliable expected values for effective CO2 and O2 dissociation rate constants can be derived from the coefficients in regressions (Table 2) that yield P < 0.05 for both coefficients (i.e., both the gradient and intercept). The results are given in Table 3. For the regression of ln(KC) on , equating the first terms () in the expansion of the exponential form () with Equation (1) we find that the value of KC at is given by . From the regression analysis carried out using the full data set in Table 1 (Figure 2A) and the subset utilized by Savir et al. (2010) (Figure 2B), we obtain values of a1 = 9.7 μM and a1 = 4.5 μM, respectively. From the expansion of the exponential we also find that at , where the two estimates are a1b1 = 2.2 μM.s and a1b1 = 1.5 μM.s, respectively. In Figures 2A,B, Equation (1), which will obviously deviate from the trend line as increases, has been graphed using these values. Combining these results obtained for and we estimate (at ) expected effective rate constants for CO2 dissociation (〈γCk6〉) of 4.3s−1 and 3.0s−1, respectively. Assuming the scheme (Figure 1) correctly describes the kinetic mechanism, the deviation from linear behavior suggests there exists at least one type of correlation between rate constants. From Equation (1), the expected value of KRk5 conditional on in terms of regression parameters a1 and b1 is then given by (Figure 4A).
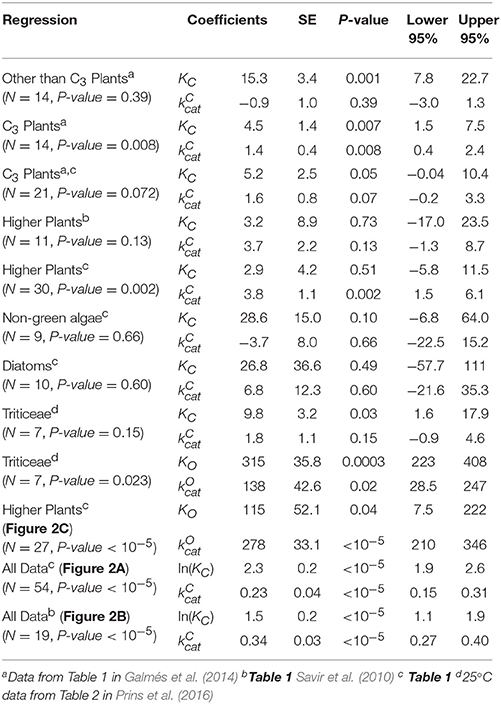
Table 2. Linear regressions of KM or ln(KM) on kcat for various data sets of sample size N: Coefficients of y-intercept, KM or ln(KM), and x-variable (gradient), kcat, with standard errors (SE), P-values and 95% (P = 0.05) confidence intervals.
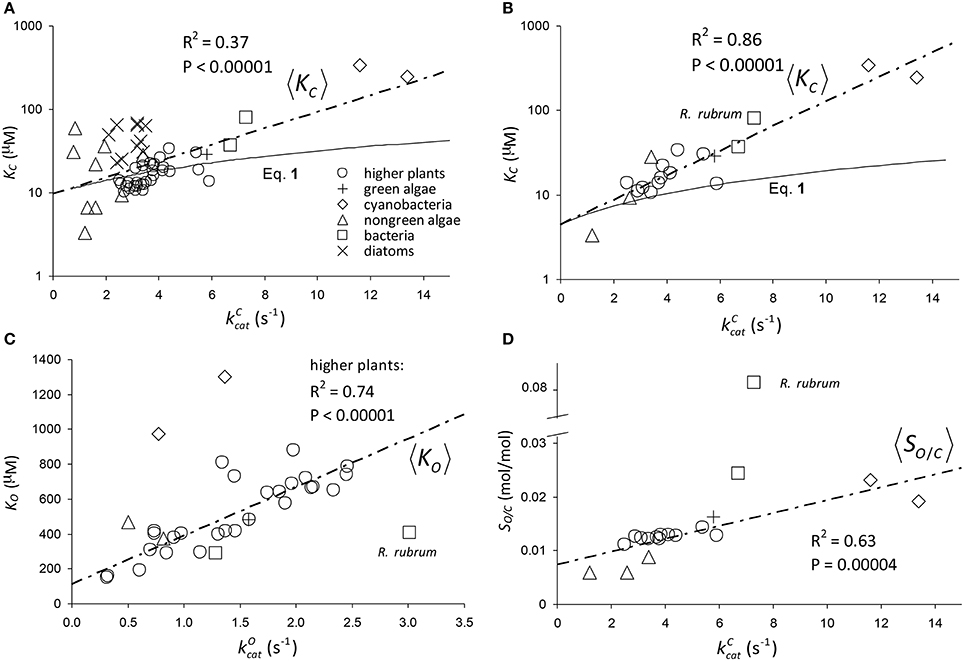
Figure 2. Regression of: (A) KC on using all data (Table 1) in the regression. The parameters of the exponential, , are a1 = 9.7 μM and b1 = 0.23s. (B) KC on using only the data compiled by Savir et al. (2010) in the regression. The parameters of the exponential are a1 = 4.5 μM and b1 = 0.34s. The Form II RuBisCO, R. rubrum, is not a significant outlier. (C) KO on using all higher plant data (Table 1) only. The gradient and intercept of the regression line are 278 μM.s and 114 μM, respectively. Form II RuBisCO, R. rubrum, and the cyanobacteria are the significant outliers by the ESD test with P = 0.05 (Rosner, 1983). (D) Reciprocal relative specificity () on using the data compiled by Savir et al. (2010). The Form II RuBisCO, R. rubrum is the only significant outlier by the ESD test (P = 0.05), due mainly to its relatively higher value for (Figure 2C), and was not included in the regression. The gradient and intercept are 1.2 × 10⁻³s and 7.4 × 10⁻³mol/mol, respectively. Note that in (A,B) KC is graphed in logarithmic scale and Equation (1) has been graphed using the parameters at as derived from the regression analysis (see text).
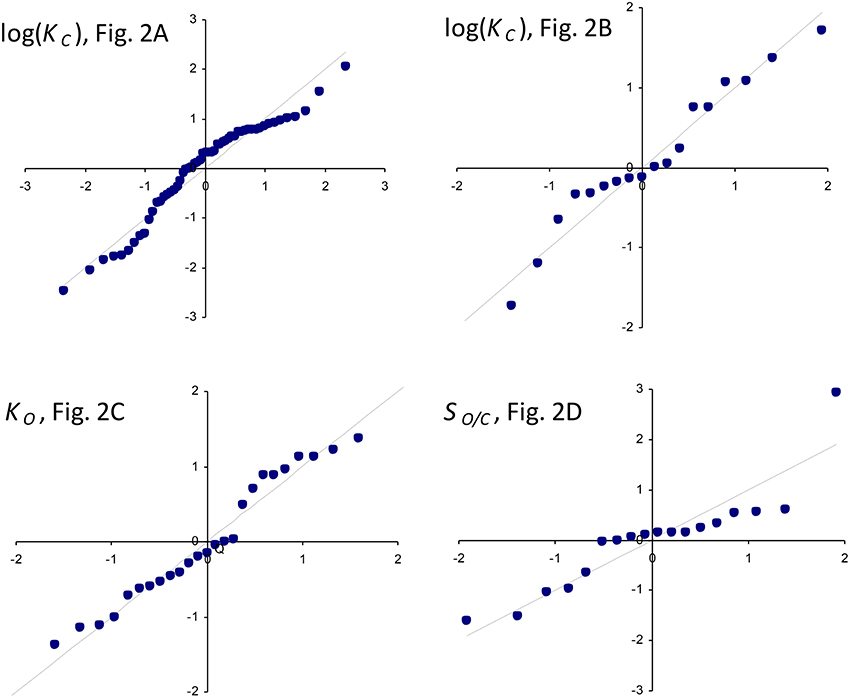
Figure 3. Normal Q-Q standardized plots of residuals for log(KC) (Figures 2A,B), KO (Figure 2C), and the reciprocal relative specificity, (Figure 2D).
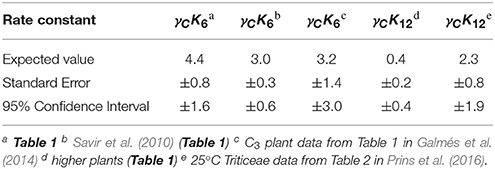
Table 3. Expected values of dissociation rate constants (s−1) for carboxylation (γCK6) and oxygenation (γCK12) with standard errors and corresponding 95% confidence intervals calculated from coefficients (gradient and intercept) with P < 0.05 in Table 2.
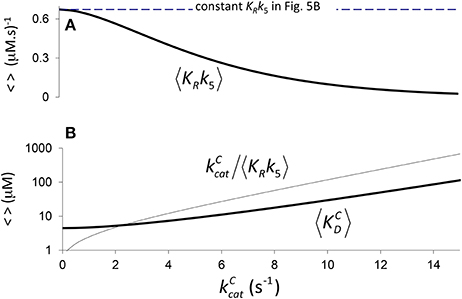
Figure 4. Components of KC if correlation is due to CO2 binding. (A) 〈KRk5〉 Equation (4) calculated assuming a constant value of (Figure 2B, a1 = 4.5 μM, b1 = 0.34 s), and (B) the corresponding components of 〈KC〉, i.e. and Equation (5), derived from Equation (1) (). (B) only is graphed in logarithmic scale.
Therefore, we may also use Equation (4) to define the expected effective dissociation constant conditional on as (Figure 4B).
In Figure 4 it is assumed (Tcherkez et al., 2006) that the exponential increase in 〈KC〉 conditional on arises from 〈KRk5〉 (one correlation effect, i.e., due to CO2 binding) while 〈γCk6〉 is a constant in Equation (4). Alternatively, in Figure 5 we have assumed that variation arises from 〈γCk6〉 (another correlation effect i.e., due to CO2 dissociation) while 〈KRk5〉 is now the constant. Here the respective constants are the values of 〈γCk6〉 and 〈KRk5〉 at as determined from the regression (Figure 2B). There is, of course, also the possibility that variability in both 〈KRk5〉 and 〈γCk6〉 contribute to the non-linear behavior of 〈KC〉, i.e., both 〈KRk5〉 and 〈γCk6〉 are conditional on . In general, therefore, we could ascribe any functional dependence for either 〈KRk5〉 or 〈γCk6〉 to this non-linear behavior.
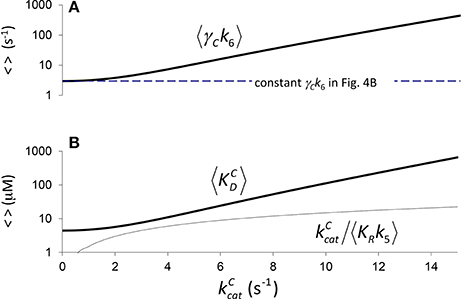
Figure 5. Components of KC if correlation is due to CO2 dissociation. (A) , (from rearranging Equation 4) calculated assuming a constant value of (Figure 2B, a1 = 4.5 μM, b1 = 0.34 s), and (B) the corresponding components of 〈KC〉, i.e., and . Both (A,B) are graphed in logarithmic scale.
For the regression of KO on (Figure 2C), we have included only the data for all higher plants (Table 1). Unlike the above regressions of KC on there are no indications of any deviations from non-linear behavior. The graph of KO on for the higher plants in particular clearly conforms to a linear function, and the residuals of regressed KO data are near normally distributed (Figure 3). From the intercept we find the expected value of the dissociation constant
and from the gradient we obtain the constant
From Equations (6, 7) we estimate the expected value of the effective O2 dissociation rate constant, . Finally, from the above determinations of (from Figure 2B) and we can estimate the expected CO2 to O2 ratio of the rate constants for binding at as .
Relative Specificity
The graph of reciprocal relative specificity, , against (Figure 2D) suggests a linear dependence. The residuals of regressed SO/C data are near normally distributed (Figure 3). We first consider the expected value of SC/O conditional on as the reciprocal of the equation for the straight line that describes 〈SO/C〉, i.e.,
where and are the regression parameters (Figure 2D). Although Equation (8) generally provides a good fit to the data (Figure 6), it clearly does not display the correct limiting behavior as approaches zero Equation (3). However, defining the expected value as the ratio and substituting (Figure 2A), the expected value of SC/O conditional on can be written as
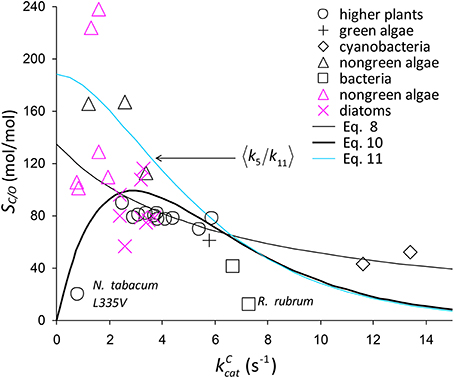
Figure 6. Selection of SC/O data from Table 1. The symbols in black are from the compilation of Savir et al. (2010). The SC/O value for N. tabacum L335V mutant is shown. Also on the graph is 〈SC/O〉 given by Equation (8) and Equation (10), including a possible factor of Equation (10), (Equation 11).
As there are no correlations between and (Figure 7A) or KO (Figure 7B), SO is also not correlated (Figure 7C), and so the best possible approximation for Equation (9) takes the form SC/O ∝ SC. The constant in Equation (9) can therefore be estimated by a linear regression of SC/O (excluding the outlier, R. rubrum, Figure 2D) on subject to the constraint SC/O = 0 at to obtain the correct general equation for the expected value of SC/O conditional on as (Figure 6).
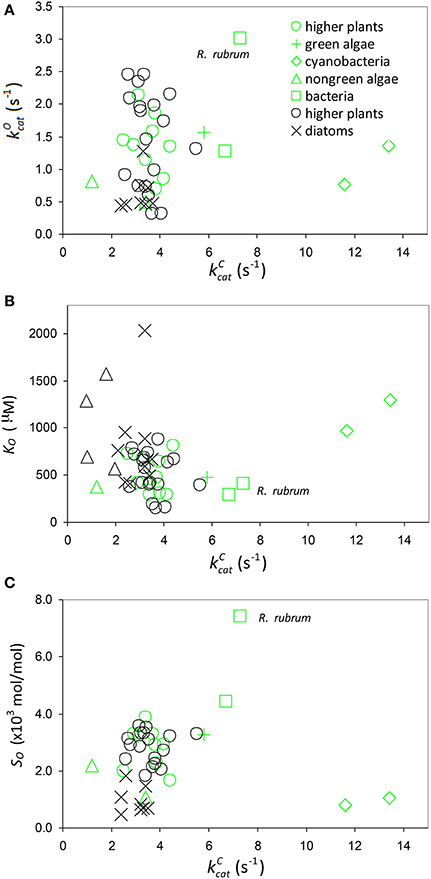
Figure 7. Oxygenation parameters. Scatter plots of (A) against (B) KO against and (C) specificity, , against including all data in Table 1. Data points highlighted in green are those compiled by Savir et al. (2010).
Assuming correlation (Figure 2B) arises from CO2 binding, the factor implicit in Equation (10) corresponding to (Figure 6) that is also conditional on is estimated by (Equations 4, 7, Figure 4A).
Mutant Example
We use Equation (3) to rationalize the in vitro kinetic data for the Leu to Val mutation at position 335 (L335V) in tobacco (Whitney et al., 1999). The decrease in from 3.43 s−1 in the wild type to 0.81 s−1 in the mutant is accompanied by a large decrease also in SC/O from 81 to 20 mol/mol. In Figure 8, SC/O is plotted against assuming that in Equation (3) the term is constant on the curve, i.e.,
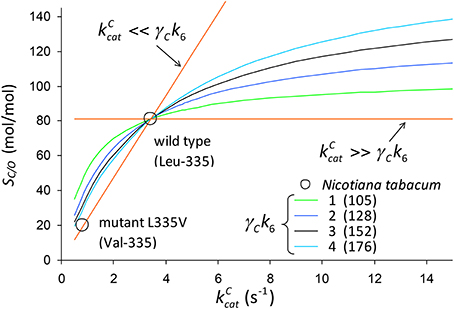
Figure 8. SC/O (Equation 3) plotted against assuming that is constant on the curve (Equation 12). The numbers in parentheses are the values of in Equation (3) that give SC/O = 81.1 mol/mol for wild-type tobacco given CO2 dissociation rate constants of γCk6 = 1, 2, 3 and 4s−1. For the wild type , and for the mutant (Val-335) and SC/O = 20.1mol/mol (Whitney et al., 1999).
We determine the constant factor such that SC/O = 81mol/mol for the wild-type tobacco at the two limits ( and ) for specific values of γCk6 = 1, 2, 3 and 4s−1. Note that in the limit we obtain , while the lower limit for gives SC/O = 0. Noting that , the remaining kinetic parameters [KC = 10.7 μM, , KO = 295 μM for wild type, and KC = 5.1 μM, , KO = 48.9 μM for the mutant] (Whitney et al., 1999) can be used to simply determine the expected value of the ratio as.
where Δ is the difference between wild type and mutant.
Discussion
Significant Dissociation of CO2 and O2 Substrates
The trend lines (Figure 2) clearly intercept the vertical axes well above zero, indicating significant expected values for the dissociation constants γCk6 and γOk12. However, the rate constant for CO2 dissociation has been previously estimated as not more than about 5% of (Pierce et al., 1986; McNevin et al., 2007), so that it has generally been assumed that . Our estimates (Figures 2A,B, Table 3) of the expected value (at least for low ) are much higher, and find support in the kinetics modeling study of RuBisCO from spinach. We find that the expected values of dissociation rate constants (γCk6) for the binding of the substrate CO2 are 4.3 s−1 (Figure 2A), 3.0 s−1 (Figure 2B), and 3.1 s−1 for a subset of C3 plants (Galmés et al., 2014; Prins et al., 2016), noting that the differences are not statistically significant (Table 3). These values can be compared with 1.6 ±1.1 s−1 estimated for the CO2 dissociation rate constant in spinach (McNevin et al., 2006, 2007), and the 5−10 μM range of for lower values of (Figures 4B, 5B) is also consistent with a of 3 μM for spinach RuBisCO (McNevin et al., 2006). The effective CO2 dissociation rate constant, γCk6, impacts the dependence of SC/O (Figure 8). As approaches γCk6 Equation (12) describes the rapid decline in SC/O due to increasing probability that the CO2 will dissociate from RuBP before catalysis takes place. The observed values of and SC/O for the L335V mutant (Whitney et al., 1999) are entirely consistent with a γCk6 greater than . The expected value of as given by Equation (13) is also consistent with the value obtained when averaged over a larger number of RuBisCOs with lower (Figure 6). Thus, changes in the gas-substrate binding in the mutant RuBisCO appear to be minimal, the bulk of the effect being described by Equation (12). The dissociation rate constant of O2 is generally considered effectively zero (Tcherkez, 2013, 2016). However, although the expected value of 0.4 ± 0.4 s−1 for γOk12 in higher plants obtained here (Table 3) is significantly lower than the mean of 1.3 ± 0.2 s−1 (from data in Table 1) it is still sufficient to have an impact on KO (Equation 2). Additionally, the expected value of 2.3 ± 1.9 s−1 for γOk12 in Triticeae (Table 3) and the corresponding mean of 0.83 ± 0.16 s−1 (Prins et al., 2016) are not significantly different. Statistical analysis of the available data therefore suggests the expected (or average) value of the dissociation rate is not significantly lower than that of the catalytic rate. Moreover, a knowledge of rate differences in any particular RuBisCO requires more kinetic data than is currently available. Consequently, there is no justification for generally neglecting either of the dissociation rate constants, γCk6 or γOk12, i.e., assuming they are an order of magnitude or more lower than the corresponding catalytic rates, as has been done previously (Tcherkez, 2013, 2016).
The Tight-Binding Hypothesis
Assuming decreases with increasing (Equation 11, Figure 6), it could be regarded as a proxy for SC/O (Tcherkez, 2013). Also as the specificity of oxygenation, SO, is not correlated with (Figure 7C), the variation in would be largely constrained to the dependence of 〈k5〉 on (Figure 4A). It has been hypothesized (Tcherkez et al., 2006; Tcherkez, 2013) that such a constraint is to be expected from the predicted energetics of the reaction as tighter binding of CO2 to ribulose bisphosphate (increasing k5) would necessarily raise the activation free energy (decreasing ) required for the subsequent steps leading to turnover of product. However, the generality of this tight-binding (TB) hypothesis has come under question (Hanson, 2016) for its inability to explain the variations in SC/O that have been observed in some RuBisCOs (Young et al., 2016). It would seem that the TB hypothesis suffers from a more fundamental problem in that it is based on an incomplete and unrepresentative data distribution. In the present analysis, Equation (8) provides the better fit R2 = 0.63 to the selected data (Figure 2D), although it is not the more general equation for 〈SC/O〉 (Equation 10, Figure 6). Similar types of relationships that provide an even tighter fit to the data have been reported elsewhere: [R2 = 0.90] and [R2 = 0.79] (Savir et al., 2010). The TB hypothesis is posited on determining the dependence of SC/O on . Significantly, all of these analyses are in fact conditional on , i.e, neglect of the CO2 dissociation rate constant, k6. However, the high level of variance in KC and SC/O (Figures 2A, 6, respectively) argues for a more cautious data interpretation in the regression analysis. Statistically, the quadratic (Savir et al., 2010) and exponential (Figure 2B) forms both describe the dependence of KC on equally well, but only the latter, more general case (Equations 3, 10), allows nonzero values for γCk6 (Figure 5A).
Rate Constants May Not Be Highly Correlated
The deviation of any given data point (Figure 6) from the expected value (Equation 10) can be attributed to variations in the parameters of Equation (3). We expect that SO will generally produce random variations in SC/O (Figure 7C), although, possibly lower k11 (higher KO, Figure 2C) for the cyanobacteria may in part account for a systematic reduction in SC/O. The CO2 dissociation term, γCk6, will certainly become apparent at low enough values (Figures 4, 5). In particular, variations in γCk6 may contribute significantly to the large variance seen in the non-green algae (Figures 2A, 6). If the catalytic rate correlates with k5, regression analysis defines only the first moment, 〈k5〉, of the distribution (Figure 4A and Equation 11, Figure 6), and provides no information on the variance. In the absence of any coupling, mutations produce random changes in the underlying rate constants, ki. Irrespective of whether rate constants are correlated, the expected value of ki is given by where is the value of a rate constant for a given sequence (s). In reality, the composition of the sequence space, Ω (i.e., any number of known sequences), will be determined in varying degrees by genetic drift and natural selection, as these determine the probability that a mutation becomes fixed. If the variations in themselves are entirely random (zero correlation), we might expect both SC/O and at the high end of their observed values, as there is nothing to constrain them and the combined effect should have become fixed in some species by positive selection. The TB hypothesis attempts to explain this absence of both high SC/O and high by positive selection processes occurring within particular constraints (Figures 4A, 6) imposed on the chemical reaction steps (Tcherkez et al., 2006), but it may also be explained by competing selection pressures. The essential difference is that the origin of the evolutionary constraints is shifted from to Ω.
Competing Selection Pressures May Constrain RuBisCo
From a biophysical perspective, thermodynamic stability is recognized as the most important constraint on the evolution of proteins and their ability to acquire new function (Tokuriki and Tawfik, 2009; Sikosek and Chan, 2014). The necessity of a protein to maintain the integrity of its folded structure despite the destabilizing effects of accumulated mutations results in only a small percentage being fixed by positive selection. Consequently, in the evolution of C3 to C4 plants, destabilizing mutations that are selected on the basis of improved activity are followed by mutations that restore stability with little impact on activity (Studer et al., 2014). This leads to an apparent tradeoff between activity and stability that may well limit the ability of RuBisCO to fix the number of mutations required to increase both SC/O and . Depending on the sub-cellular CO2/O2 ratio, the fixed mutations increase specificity (for low ratio) or catalytic rate (for high ratio), or a varying combination of both, whichever best optimizes photosynthesis.
Potential for Optimizing Carbon Fixation
The origin of the constraint(s) has significant implications for the optimization of RuBisCO activity. If the constraint is on Ω (i.e., from competing selection pressures) rather than , greater variability may be exhibited. To what extent the functional limits of RuBisCO are reflected in the minimum and maximum values of kinetic parameters is not yet clear for RuBisCOs with higher because of the absence of empirical data. Much effort has been directed toward research on higher plants with particular emphasis on the evolution of C3 to C4 plants with their associated CCMs, although the recent work on diatoms may now help stimulate investigations into a more diverse range of photosynthetic organisms (Hanson, 2016; Young et al., 2016). Diatoms and C3 plants share very similar , although the variance, var(SC/O), for diatoms is relatively large (with corresponding variations in CCM expression), whereas for C3 plants var(SC/O) is barely significant (Figure 6, Table 1). This could raise the possibility of improving specificity, if not , in higher plants. It is perhaps not surprising that the non-green (red) algae, from which diatoms have evolved with somewhat lower values, also exhibit high var(SC/O) (Figure 6). The data distributions are incomplete (Figures 2A, 6, Table 1); there is a scarcity of data for green algae, photosynthetic bacteria and cyanobacteria, with values between 6 s−1 and 14 s−1. Discoveries of significant variance among these also may provide important clues on how to achieve increases in both and SC/O in higher plants.
Conclusion
The results of our analysis using regression analysis on updated RuBisCO-kinetic data sets suggest that CO2 dissociation from the RuBisCO gas-addition complex is generally more important in rationalizing the observed variations in the kinetics of RuBisCO than hitherto assumed (Tcherkez et al., 2006; Tcherkez, 2013). Moreover, we have identified significant variations in the statistical correlations between KM and kcat in higher plants, i.e., the non-linear correlation for carboxylation as opposed to the linear correlation for oxygenation. These findings cast doubt on the hypothesis (Tcherkez et al., 2006; Savir et al., 2010; Tcherkez, 2013) that RuBisCO is so tightly constrained by the active-site chemistry that its activity is effectively optimized. Rather, the current body of kinetic parameters exhibits far more plasticity than this hypothesis predicts. We suggest that the possibility that the apparent tradeoff observed between and SC/O could arise from competing selection pressures on RuBisCO activity and stability (Studer et al., 2014) be given more attention. The relative strengths of these selection pressures would determine the strength of the constraints and, thus, the possibilities of improving the kinetics of RuBisCO by site-directed mutagenesis. Indeed, although published comments (Griffiths, 2006; Gutteridge and Pierce, 2006) on the paper of Tcherkez et al. (2006) noted the vastness of sequence space that would need to be sampled, neither showed any positivity that a rational method to increase the efficiency of such a search was possible merely noting (Griffiths, 2006) directed evolution as a possibility. However, a method to reduce the sequence-search space for RuBisCO has since been reported in a patent (Gready and Kannappan, 2009).
In summary, there is still wide conjecture in the literature regarding the mechanisms by which plants ultimately regulate photosynthesis (Igamberdiev, 2015), and the absolute limitations of RuBisCO functionality have only been partly explored, as recent studies (Hanson, 2016; Young et al., 2016) suggest. Consequently, the potential for increasing both the catalytic turnover and relative specificity in higher plants with the view to improving photosynthesis remains to be fully tested. As argued (Hanson, 2016), kinetic data for a wider diversity of RuBisCOs are much needed and will likely prove useful in guiding the reengineering of higher-plant RuBisCOs with both significantly higher turnover rate and specificity. Our analysis suggests that such simultaneous improvement in both specificity and turnover rate is possible, and that competing selection pressures of activity and stability better explain the nature of constraints. Improved understanding of these competing selection pressures is much needed.
Author Contributions
PC, BK, and JG designed and performed the research, wrote the paper and approved it for submission.
Conflict of Interest Statement
The authors declare that the research was conducted in the absence of any commercial or financial relationships that could be construed as a potential conflict of interest.
Acknowledgments
We sincerely thank Dr. Andrey Bliznyuk for checking the manuscript and helpful comments. We also acknowledge the Australian NCI (National Computational Infrastructure) for computing support. We thank the reviewers for helpful comments.
Supplementary Material
The Supplementary Material for this article can be found online at: https://www.frontiersin.org/articles/10.3389/fpls.2018.00183/full#supplementary-material
References
Andersson, I. (2008). Catalysis and regulation in Rubisco. J. Exp. Bot. 59, 1555–1568. doi: 10.1093/jxb/ern091
Badger, M. R., and Andrews, T. J. (1987). “Co-evolution of rubisco and CO2 concentrating mechanisms,” in Progress in Photosynthesis, Research: Vol. 3 Proceedings of the VIIth International Congress on Photosynthesis Providence, Rhode Island, U. S. A., ed J. Biggins. (Dordrecht: Springer Netherlands), 601–609.
Badger, M. R., Andrews, T. J., Whitney, S. M., Ludwig, M., Yellowlees, D. C., Leggat, W., et al. (1998). The diversity and coevolution of Rubisco, plastids, pyrenoids, and chloroplast-based CO2-concentrating mechanisms in algae. Can. J, Bot. 76, 1052–1071. doi: 10.1139/b98-074
Bainbridge, G., Madgwick, P., Parmar, S., Mitchell, R., Paul, M., Pitts, J., et al. (1995). Engineering Rubisco to change its catalytic properties. J. Exp. Bot. 46, 1269–1276. doi: 10.1093/jxb/46.special_issue.1269
Bar-Even, A., Milo, R., Noor, E., and Tawfik, D. S. (2015). The moderately efficient enzyme: futile encounters and enzyme floppiness. Biochemistry 54, 4969–4977. doi: 10.1021/acs.biochem.5b00621
Bar-Even, A., Noor, E., Savir, Y., Liebermeister, W., Davidi, D., Tawfik, D. S., et al. (2011). The moderately efficient enzyme: evolutionary and physicochemical trends shaping enzyme parameters. Biochemistry 50, 4402–4410. doi: 10.1021/bi2002289
Carmo-Silva, A. E., Keys, A. J., Andralojc, P. J., Powers, S. J., Arrabaça, M. C., and Parry, M. A. J. (2010). Rubisco activities, properties, and regulation in three different C(4) grasses under drought. J. Exp. Bot. 61, 2355–2366. doi: 10.1093/jxb/erq071
Carmo-Silva, E., Scales, J. C., Madgwick, P. J., and Parry, M. A. (2015). Optimizing Rubisco and its regulation for greater resource use efficiency. Plant Cell Environ. 38, 1817–1832. doi: 10.1111/pce.12425
Cleland, W. W., Andrews, T. J., Gutteridge, S., Hartman, F. C., and Lorimer, G. H. (1998). Mechanism of Rubisco: the carbamate as general base. Chem. Rev. 98, 549–562. doi: 10.1021/cr970010r
Farquhar, G. D. (1979). Models describing the kinetics of ribulose biphosphate carboxylase-oxygenase. Arch. Biochem. Biophys. 193, 456–468. doi: 10.1016/0003-9861(79)90052-3
Galmés, J., Kapralov, M. V., Andralojc, P. J., Conesa, M. À., Keys, A. J., Parry, M. A. J., et al. (2014). Expanding knowledge of the Rubisco kinetics variability in plant species: environmental and evolutionary trends. Plant Cell Environ. 37, 1989–2001. doi: 10.1111/pce.12335
Ghannoum, O., Evans, J. R., Chow, W. S., Andrews, T. J., Conroy, J. P., and von Caemmerer, S. (2005). Faster rubisco is the key to superior nitrogen-use efficiency in NADP-malic enzyme relative to NAD-malic enzyme C(4) grasses. Plant Physiol. 137, 638–650. doi: 10.1104/pp.104.054759
Gready, J. E., and Kannappan, B. (2009). Process for Generation of Protein and Uses Thereof. US patent No 12/422,190. Washington, DC: U.S. Patent and Trademark Office.
Gutteridge, S., and Pierce, J. (2006). A unified theory for the basis of the limitations of the primary reaction of photosynthetic CO2 fixation: was Dr. Pangloss right? Proc. Natl. Acad. Sci. U.S.A. 103, 7203–7204. doi: 10.1073/pnas.0602075103
Hanson, D. T. (2016). Breaking the rules of Rubisco catalysis. J. Exp. Bot. 67, 3180–3182. doi: 10.1093/jxb/erw197
Igamberdiev, A. U. (2015). Control of Rubisco function via homeostatic equilibration of CO2 supply. Front. Plant Sci. 6:106. doi: 10.3389/fpls.2015.00106
Jordan, D. B., and Ogren, W. L. (1981). Species variation in the specificity of ribulose biphosphate carboxylase/oxygenase. Nature 291, 513–515. doi: 10.1038/291513a0
Jordan, D. B., and Ogren, W. L. (1983). Species variation in kinetic properties of ribulose 1,5-bisphosphate carboxylase/oxygenase. Arch. Biochem. Biophys. 227, 425–433. doi: 10.1016/0003-9861(83)90472-1
Kannappan, B., and Gready, J. E. (2008). Redefinition of Rubisco carboxylase reaction reveals origin of water for hydration and new roles for active-site residues. J. Am. Chem. Soc. 130, 15063–15080. doi: 10.1021/ja803464a
Koralov, L. B., and Sinai, Y. G. (2007). Theory of Probability and Random Processes. Berlin; Heidelberg: Springer-Verlag.
Kubien, D. S., Whitney, S. M., Moore, P. V., and Jesson, L. K. (2008). The biochemistry of Rubisco in Flaveria. J. Exp. Bot. 59, 1767–1777. doi: 10.1093/jxb/erm283
Lorimer, G. H. (1981). The carboxylation and oxygenation of ribulose 1,5-bisphosphate: the primary events in photosynthesis and photorespiration. Annu. Rev. Plant Physiol. 32, 349–382. doi: 10.1146/annurev.pp.32.060181.002025
McNevin, D. B., Badger, M. R., Whitney, S. M., von Caemmerer, S., Tcherkez, G. G. B., and Farquhar, G. D. (2007). Differences in carbon isotope discrimination of three variants of D-Ribulose-1,5-bisphosphate carboxylase/oxygenase reflect differences in their catalytic mechanisms. J. Biol. Chem. 282, 36068–36076. doi: 10.1074/jbc.M706274200
McNevin, D., von Caemmerer, S., and Farquhar, G. (2006). Determining RuBisCO activation kinetics and other rate and equilibrium constants by simultaneous multiple non-linear regression of a kinetic model. J. Exp. Bot. 57, 3883–3900. doi: 10.1093/jxb/erl156
Parry, M. A., Andralojc, P. J., Scales, J. C., Salvucci, M. E., Carmo-Silva, A. E., Alonso, H., et al. (2013). Rubisco activity and regulation as targets for crop improvement. J. Exp. Bot. 64, 717–730. doi: 10.1093/jxb/ers336
Peterhansel, C., Niessen, M., and Kebeish, R. M. (2008). Metabolic engineering towards the enhancement of photosynthesis. Photochem. Photobiol. 84, 1317–1323. doi: 10.1111/j.1751-1097.2008.00427.x
Pierce, J., Andrews, T. J., and Lorimer, G. H. (1986). Reaction intermediate partitioning by ribulose-bisphosphate carboxylases with differing substrate specificities. J. Biol. Chem. 261, 10248–10256.
Prins, A., Orr, D. J., Andralojc, P. J., Reynolds, M. P., Carmo-Silva, E., and Parry, M. A. J. (2016). Rubisco catalytic properties of wild and domesticated relatives provide scope for improving wheat photosynthesis. J. Exp. Bot. 67, 1827–1838. doi: 10.1093/jxb/erv574
Rosner, B. (1983). Percentage points for a generalized ESD many-outlier procedure. Technometrics 25, 165–172. doi: 10.1080/00401706.1983.10487848
Savir, Y., Noor, E., Milo, R., and Tlusty, T. (2010). Cross-species analysis traces adaptation of Rubisco toward optimality in a low-dimensional landscape. Proc. Natl. Acad. Sci. U.S.A. 107, 3475–3480. doi: 10.1073/pnas.0911663107
Seemann, J. R., Badger, M. R., and Berry, J. A. (1984). Variations in the specific activity of ribulose-1,5-bisphosphate carboxylase between species utilizing differing photosynthetic pathways. Plant Physiol. 74, 791–794. doi: 10.1104/pp.74.4.791
Sikosek, T., and Chan, H. S. (2014). Biophysics of protein evolution and evolutionary protein biophysics. J. R. Soc. Interface 11:20140419. doi: 10.1098/rsif.2014.0419
Studer, R. A., Christin, P. A., Williams, M. A., and Orengo, C. A. (2014). Stability-activity tradeoffs constrain the adaptive evolution of RubisCO. Proc. Natl. Acad. Sci. U.S.A. 111, 2223–2228. doi: 10.1073/pnas.1310811111
Tcherkez, G. (2013). Modelling the reaction mechanism of ribulose-1,5-bisphosphate carboxylase/oxygenase and consequences for kinetic parameters. Plant Cell Environ. 36, 1586–1596. doi: 10.1111/pce.12066
Tcherkez, G. (2016). The mechanism of Rubisco-catalysed oxygenation. Plant Cell Environ. 39, 983–997. doi: 10.1111/pce.12629
Tcherkez, G. G., Farquhar, G. D., and Andrews, T. J. (2006). Despite slow catalysis and confused substrate specificity, all ribulose bisphosphate carboxylases may be nearly perfectly optimized. Proc. Natl. Acad. Sci. U.S.A. 103, 7246–7251. doi: 10.1073/pnas.0600605103
Tokuriki, N., and Tawfik, D. S. (2009). Stability effects of mutations and protein evolvability. Curr. Opin. Struct. Biol. 19, 596–604. doi: 10.1016/j.sbi.2009.08.003
Whitney, S. M., Houtz, R. L., and Alonso, H. (2011). Advancing our understanding and capacity to engineer nature's CO2-sequestering enzyme, Rubisco. Plant Physiol. 155, 27–35. doi: 10.1104/pp.110.164814
Whitney, S. M., von Caemmerer, S., Hudson, G. S., and Andrews, T. J. (1999). Directed mutation of the Rubisco large subunit of tobacco influences photorespiration and growth. Plant Physiol. 121, 579–588. doi: 10.1104/pp.121.2.579
Yeoh, H.-H., Badger, M. R., and Watson, L. (1980). Variations in KmCO2 of Ribulose-1,5-bisphosphate carboxylase among grasses. Plant Physiol. 66, 1110–1112. doi: 10.1104/pp.66.6.1110
Keywords: RuBisCO, carbon fixation, photosynthesis, enzyme kinetics and specificity, protein evolution, evolutionary constraints, enzyme-complex stability, gas-substrate binding
Citation: Cummins PL, Kannappan B and Gready JE (2018) Directions for Optimization of Photosynthetic Carbon Fixation: RuBisCO's Efficiency May Not Be So Constrained After All. Front. Plant Sci. 9:183. doi: 10.3389/fpls.2018.00183
Received: 30 August 2017; Accepted: 31 January 2018;
Published: 01 March 2018.
Edited by:
Hartmut Stützel, Leibniz University of Hanover, GermanyReviewed by:
Grant Pearce, University of Canterbury, New ZealandQiang Wang, Institute of Hydrobiology (CAS), China
Copyright © 2018 Cummins, Kannappan and Gready. This is an open-access article distributed under the terms of the Creative Commons Attribution License (CC BY). The use, distribution or reproduction in other forums is permitted, provided the original author(s) and the copyright owner are credited and that the original publication in this journal is cited, in accordance with accepted academic practice. No use, distribution or reproduction is permitted which does not comply with these terms.
*Correspondence: Jill E. Gready, amlsbC5ncmVhZHlAYW51LmVkdS5hdQ==