 Zhong Wang
 Zhigang Wu
 Yang Wang
- Department of Ecology, College of Life Sciences, Wuhan University, Wuhan, China
The variations in nitrogen (N) and phosphorus (P) stoichiometry between species and along environmental gradients reflects plant growth and survival under certain conditions. Exploring the determinants of plant N and P stoichiometry at species level could help us understand the mechanisms of plant distribution. Temperature is considered a driving factor in forming the geographical patterns of plant N and P stoichiometry at the community level. Here we selected four common aquatic plants to explore the divergence of plant N and P stoichiometry between species and the species-level variations across large geographical gradients on the Tibetan Plateau. We found that plant N and P concentrations and N:P ratios were significantly different among the four species/groups. Charophytes had the lowest N and P concentrations, but the N:P ratio did not differ significantly from those of angiosperms. All four species/groups plant N concentrations were positively correlated with P concentrations. The temperature was also the primary explanatory variable, while the habitats properties showed weak and inconsistent effects on plant N and P stoichiometry. Plant N and P concentrations increased, but N:P ratios decreased, with decreasing temperature. Altitude, rather than latitude, determined the environmental patterns of plant N and P stoichiometry by affecting the temperature. These findings indicated that, after removing the influences of species replacement at the community level, temperature still plays a primary role in forming the geographical patterns of plant N and P stoichiometry at species level. Plants of each species could optimize their investment strategies of elements under different environmental conditions. The Tibetan Plateau is recognized as an area that is sensitive to global warming. Our results provided evidence, in terms of N and P stoichiometry, of potential variations among aquatic plants in nutrient absorption and element cycling under climatic warming.
Introduction
Aquatic plants are the primary producers in freshwater ecosystems and supply food to the primary consumers (Bornette and Puijalon, 2011). Plants, with their species-specific nutrient concentrations and ratios, determine the amount of nutrients that enter ecosystems, support specific consumers with certain nutrient concentrations, and control the stability of freshwater ecosystems, especially under global change regimes (Brothers et al., 2013). Nitrogen (N) and phosphorus (P) are two vital elements for plant growth and survival (Sterner and Elser, 2002; Ågren, 2008). Biologically, plant nutrient concentrations are species-specific functional traits (Duarte, 1992; Demars and Edwards, 2007). The N and P absorption capacities of plants are under genetic control, and maintain the species-specific tissue concentrations under fluctuating conditions of nutrient supply from substrates, called “stoichiometric homeostasis” (Sterner and Elser, 2002; Elser et al., 2010). This theory explains the inter-species variations in plants under the same environmental conditions. However, plants exhibit relatively greater intra-species stoichiometric variability than heterotrophs (Wang et al., 2012), and show significant variations under different environmental conditions (Reich and Oleksyn, 2004).
At large geographic scale, temperature determines the patterns of plant elemental stoichiometry, by directly controlling plant physiological processes, or indirectly via altering species composition in the local community (Reich and Oleksyn, 2004; He et al., 2008; Zhang et al., 2012; Wang et al., 2015). In cold regions, plants usually invest more N and P to biochemical processes to counterbalance the depressed efficiency of enzymatic reactions, which are restricted by low temperature (Reich and Oleksyn, 2004). Furthermore, low temperature can pick out cold-tolerant species to assemble local community in cold regions (Bornette and Puijalon, 2011), and then enhance the plant N and P concentrations at the community level (Demars and Edwards, 2008; Frost and Hicks, 2012; Xia et al., 2014; Wang et al., 2015). Most previous studies have been carried out at the community level, mixing the direct effects of environmental factors on plant physiological process as well as species replacement (Elser et al., 2010). To differentiate the direct and indirect influences of temperature, stoichiometric studies on widespread species are necessary. The air-water interface can buffer the fluctuations of temperature, causing aquatic plants to be more cosmopolitan than terrestrial plants (Santamaría, 2002). The widespread species of aquatic plants allow us to examine the adaption mechanisms of plants at species level across sufficient environmental gradients.
In this study, we focused on four common aquatic plants species/groups (Stuckenia filiformis, Halerpestes tricuspis, Triglochin palustris and charophytes) on the Tibetan Plateau. S. filiformis is one of the most widespread submerged species on the Tibetan Plateau, and forms an underwater community as constructive species (Guo et al., 2010b). Charophytes are macroalgae that are ascribed to green plants Viridiplantae, possess superiority in oligotrophic or brackish waters, and can form dense underwater meadows in favorable conditions (Kufel et al., 2016). H. tricuspis and T. palustris are two common species inhabiting in riparin zones (Wang and Michio, 2001; Guo et al., 2010a). Climatic change (included warming and the variations in precipitation patterns) in the Tibetan plateau threaten the survival of common aquatic plants. With strong topographic relief and the resulting alpine climatic gradients, the Tibetan Plateau provides an ideal platform to explore the mechanisms for plants adapting to drastically varied abiotic environments. Our aims were to (1) test the inter-specific differences of plant N and P stoichiometry to clarify the effects of taxonomy, and (2) examine the intra-specific variations in plant N and P stoichiometry along environmental gradients, including geographical and climatic variables and habitats properties, to explore the relative importance of the environmental factors at species level.
Materials and Methods
Study Area
The field investigation was carried out on the Tibetan Plateau from July to August 2012. The Tibetan Plateau is known as “water tower” in Asia and is the source of many great rivers. Thus, the riparian habitats provide suitable environments for aquatic macrophytes. In addition, 1091 lakes (≥ 1 km2 in the area) were recorded in the Tibetan Plateau, and provide another type of aquatic habitat (Wang and Dou, 1998). Furthermore, vast expanses of marshes, numerous ponds and channels provide additional aquatic habitats for plants in the Tibetan Plateau.
Topographically, the elevation of the plateau rises from the southeast to northwest, creating variations in climatic variables and habitats properties. Because of the obstruction of the Himalayas, the warm and wet air current from the Indian Ocean travels to the plateau mainly via the canyon of the Yarlung Zangbo River, which lies in the southeastern part of the Tibetan Plateau. The mean multi-annual precipitation shows decreasing trend from about 800 mm in the southeast to about 20 mm in the northwest of the plateau. The mean air temperatures for the year, January, and July are -5 to 11°C, -18 to -6°C and 5 to 20°C, respectively, which also show a decreasing trend from the southeast to the northwest. On the Tibetan Plateau, the highest temperature is coupled with the greatest water availability on the same period in summer. The growing season on the plateau is from May to September (Wang et al., 2013).
Species
Stuckenia filiformis (Persoon) Börner
Stuckenia filiformis (Potamogetonaceae) is a perennial, cosmopolitan species and totally submerged in fresh or brackish water. The species mainly occurs on the Tibetan Plateau and adjacent regions in Asia and south and north America. On the Tibetan Plateau, S. filiformis is one of the most common species and frequently observed to dominate the aquatic community. The stems of the species are slender and the leaves are linear and sessile. The blossom and fruit period are from July to October (Guo et al., 2010b).
Halerpestes tricuspis (Maximowicz) Handel-Mazzetti
Halerpestes tricuspis (Ranunculaceae) is a perennial and small herb species, and always grows in marshes, wet meadows or spreads to water surface with slender stolons. The species mainly occurs on the Tibetan Plateau and adjacent regions and Mongolia. The basal leaves have a petiole, and the leaf blades are always 3-lobed with an area of less than 3 cm × 3 cm. The florescence last from May to August (Wang and Michio, 2001).
Triglochin palustris L.
Triglochin palustris (Juncaginaceae) is a perennial and slender herb species and always grows in marshes and wet meadows below 4500 m in elevation. The species is cosmopolitan in temperate regions. The basal leaves are linear with the shape of ca. 20 cm in length and ca. 1 mm in width. The blossom and fruit period are from June to October (Guo et al., 2010a).
Charophytes
Charophytes are cosmopolitan submerged cryptogams, especially in temperate regions, and prefer calcareous aquatic habitats (Forsberg, 1964; Wiik et al., 2015). Charophyte species have a height of 15–30 cm, and differentiate into rhizoid, stem (axis), and branchlet (Han and Li, 1994). Both stems and branchlets are photosynthetically active.
In this study, we did not identify the species of charophytes but treated all the species as a group and compare their stoichiometric characteristics with those of angiosperms.
Field Sampling
All of the samples were collected in July and August 2012. For the submerged species, S. filiformis and charophytes, 30 segments of plant shoots (ca. 20 cm from the tips) were sampled randomly from each site. All of the leaves (S. filiformis) were picked off, while whole shoots samples of charophytes were collected, and put together for each site. For the other two species, H. tricuspis and T. palustris, we collected 30–50 fully expanded and intact leaves randomly in each site, respectively. All of the samples were oven-dried at 75°C for 48 h, and then finely ground by pulverizer and ball-mill. In total, we investigated 126 sites of aquatic habitats, of which 98, 73, 54 and 36 sites were sampled for S. filiformis, H. tricuspis, T. palustris and charophytes, respectively (Figure 1).
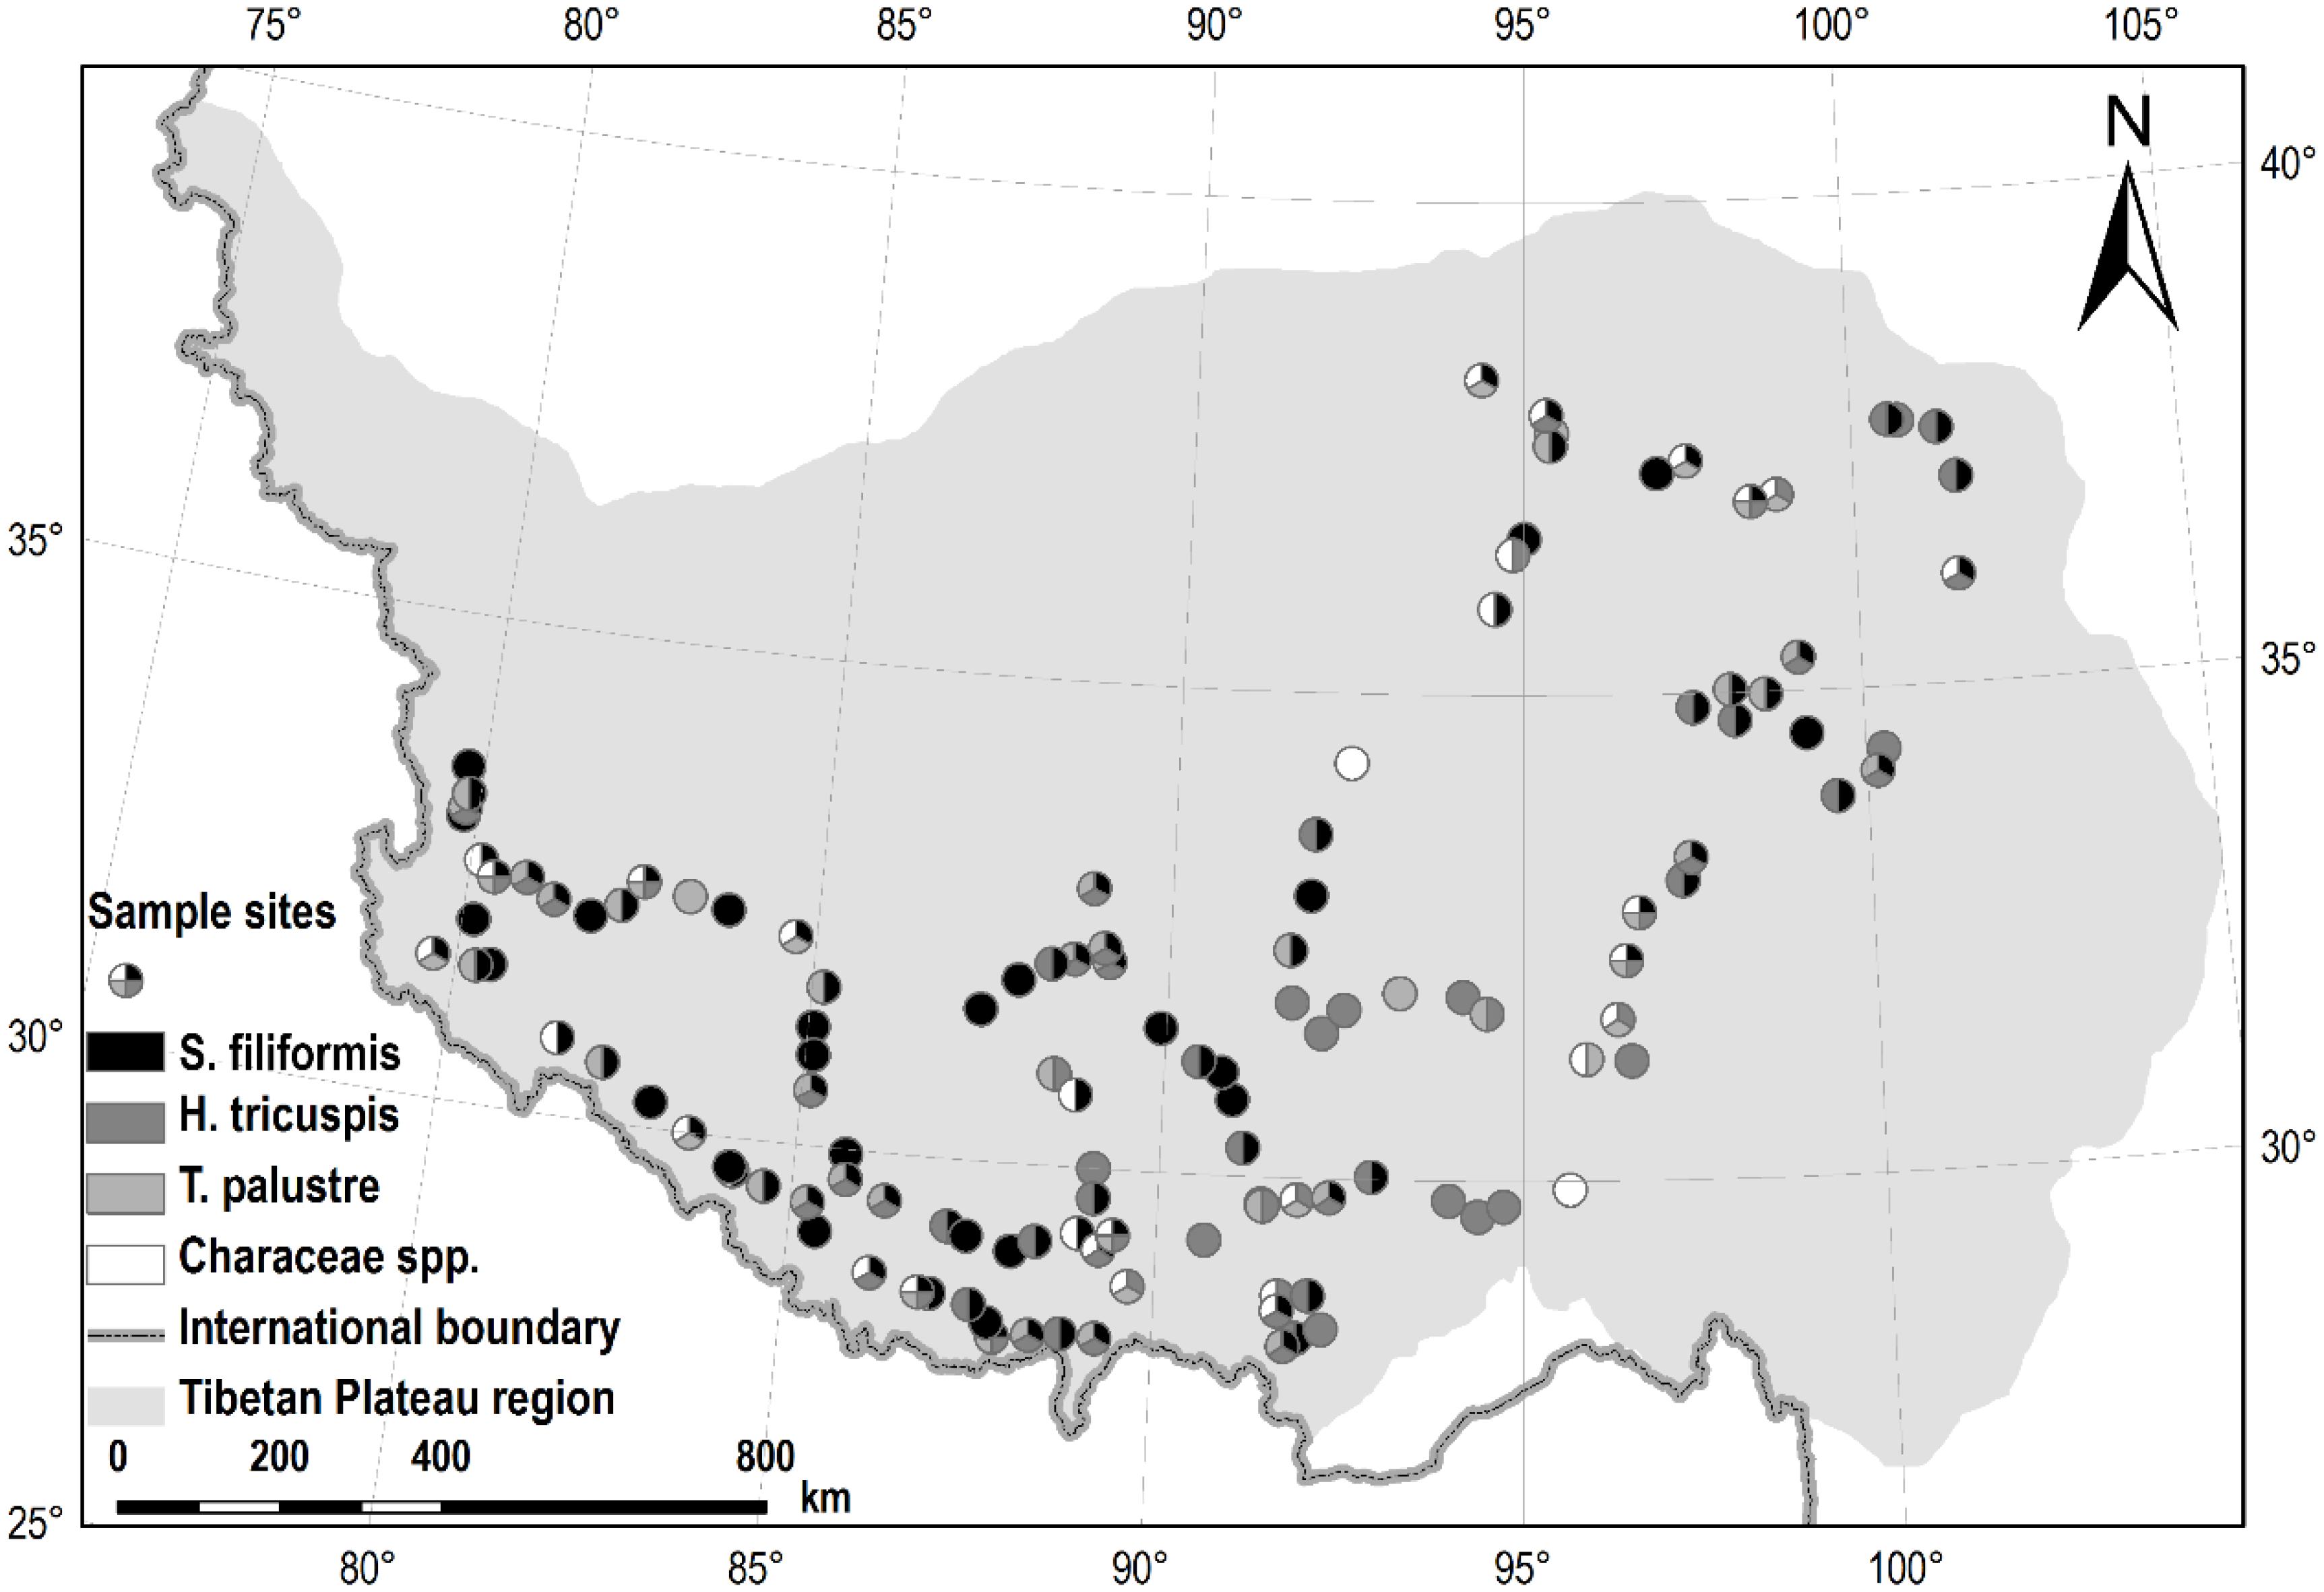
FIGURE 1. Sample sites in this study. Of all the 126 sites, S. filiformis, H. tricuspis, T. palustris and charophytes were sampled from 98, 73, 54, and 36 sites, respectively.
For the sediment samples, we dug three vertical and cylindrical cores (20 cm high × 3 cm diameter) randomly in each site. The samples were air-dried and sifted through an 80-mesh sieve. For water samples, we first measured the pH and salinity in the field using a handheld multi-parameter meter (PROPLUS, YSI, United States). A bottle of clean water was collected to measure WTN and WTP.
Chemical Measurements
All plants and sediments samples were ground to powder. The C and N concentrations were determined using a CN elemental analyzer (vario MACRO cube, Elementra, Germany), and the P concentrations were measured using the molybdate/stannous chloride method (Kuo, 1996). The N:P ratios were mass-based ratios which were calculated via N concentrations (mg g-1) divided by P concentrations (mg g-1). For water samples, the WTN and WTP were determined with a photometer (Palintest 7500, Palintest, United Kingdom) within 12 h of collection.
Data Analysis
The data of plant N and P concentrations and N:P ratios were first log10-transformed to normalize their distribution, and the relationships of plant N to P concentrations were regressed by power functions (Reich et al., 2010). Analysis of variance (ANOVA) and Bonferroni-adjusted significance values were employed to assess the differences in plant N and P concentrations and N:P ratios between the species. In this study, we had four groups of data for each variable (N, P and N:P) and performed six times pairwise comparisons in multiple testing of ANOVA. The significance values were adjusted to 0.0083 by dividing 0.05 by the six times of pairwise comparisons. We introduced one climatic variable (GST) and six habitats properties (water pH, salinity, WTN and WTP, and soil total nitrogen and phosphorus) to build general linear models (GLMs) for leaf N and P concentrations and N:P ratios. F-tests were used to perform ANOVAs of the GLMs. The percentage of the total sum of squares (%SS) were introduced to quantify the degree of each explanatory variable accounting for in the GLMs (He et al., 2008). In the GLMs, different orders of explanatory variables could not affect the total explaining degree of the model but could vary the degree of each explanatory variable. We entered the explanatory variables in different orders and offered the %SS for each variable when it was the first variable in the GLMs.
Using log10-transformed data of plant N and P concentrations and N:P ratios, we applied a family of simple regressions to test the effects of temperature, latitude and altitude on plant N and P concentrations and N:P ratios, respectively. Therefore, each family included 3 sequential tests applying to the same data (e.g., N concentration of each species). The Holm’s Sequential Bonferroni Procedures were introduced to increase the power of the statistical tests (Abdi, 2010). According to the procedure, the original p-value was firstly obtained from each test, and then the tests were ordered from the one with the smallest p-value to the one with the largest p-value. The corrected p-value for the ith-test, denoted pBonferroni, i/C was computed as:
where C was the number of tests (3 in this study) and p was the original p-value of each test. If the original p-value of ith-test was smaller than the corrected p-value, we kept the original one reported in the results. If not, the test was non-significant.
The air temperatures were obtained by entering geographic coordinates into equations derived from data collected at meteorological stations across China. The GST were calculated by averaging the monthly mean temperatures from May to September. All statistical analyses were conducted with R 3.4.2 (R Development Core Team, 2007).
Results
Plant N, P Concentrations and N:P Ratios
Results of ANOVA showed that plant N and P concentrations and N:P ratios were significantly different among the four species/groups, and among the three angiosperm species (significance level p < 0.001). When pairwise comparisons were performed, the N and P concentrations of charophytes were significantly lower, but the N:P ratio did not differ from their angiosperm counterparts (Table 1). Within angiosperms, S. filiformis showed the lowest leaf N concentration and leaf N:P ratio, while H. tricuspis showed the highest leaf N and P concentrations (Table 1).
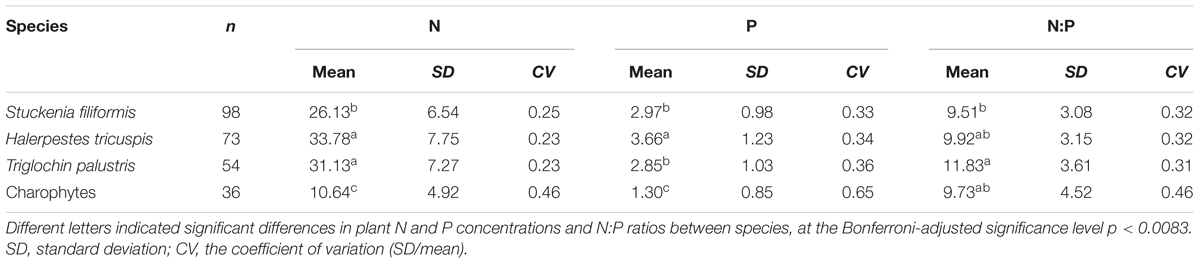
TABLE 1. Plant N, P concentrations and N:P ratios of the four aquatic species/groups.
For all of the four species/groups, plant N concentrations positively correlated with P concentrations (Figure 2).
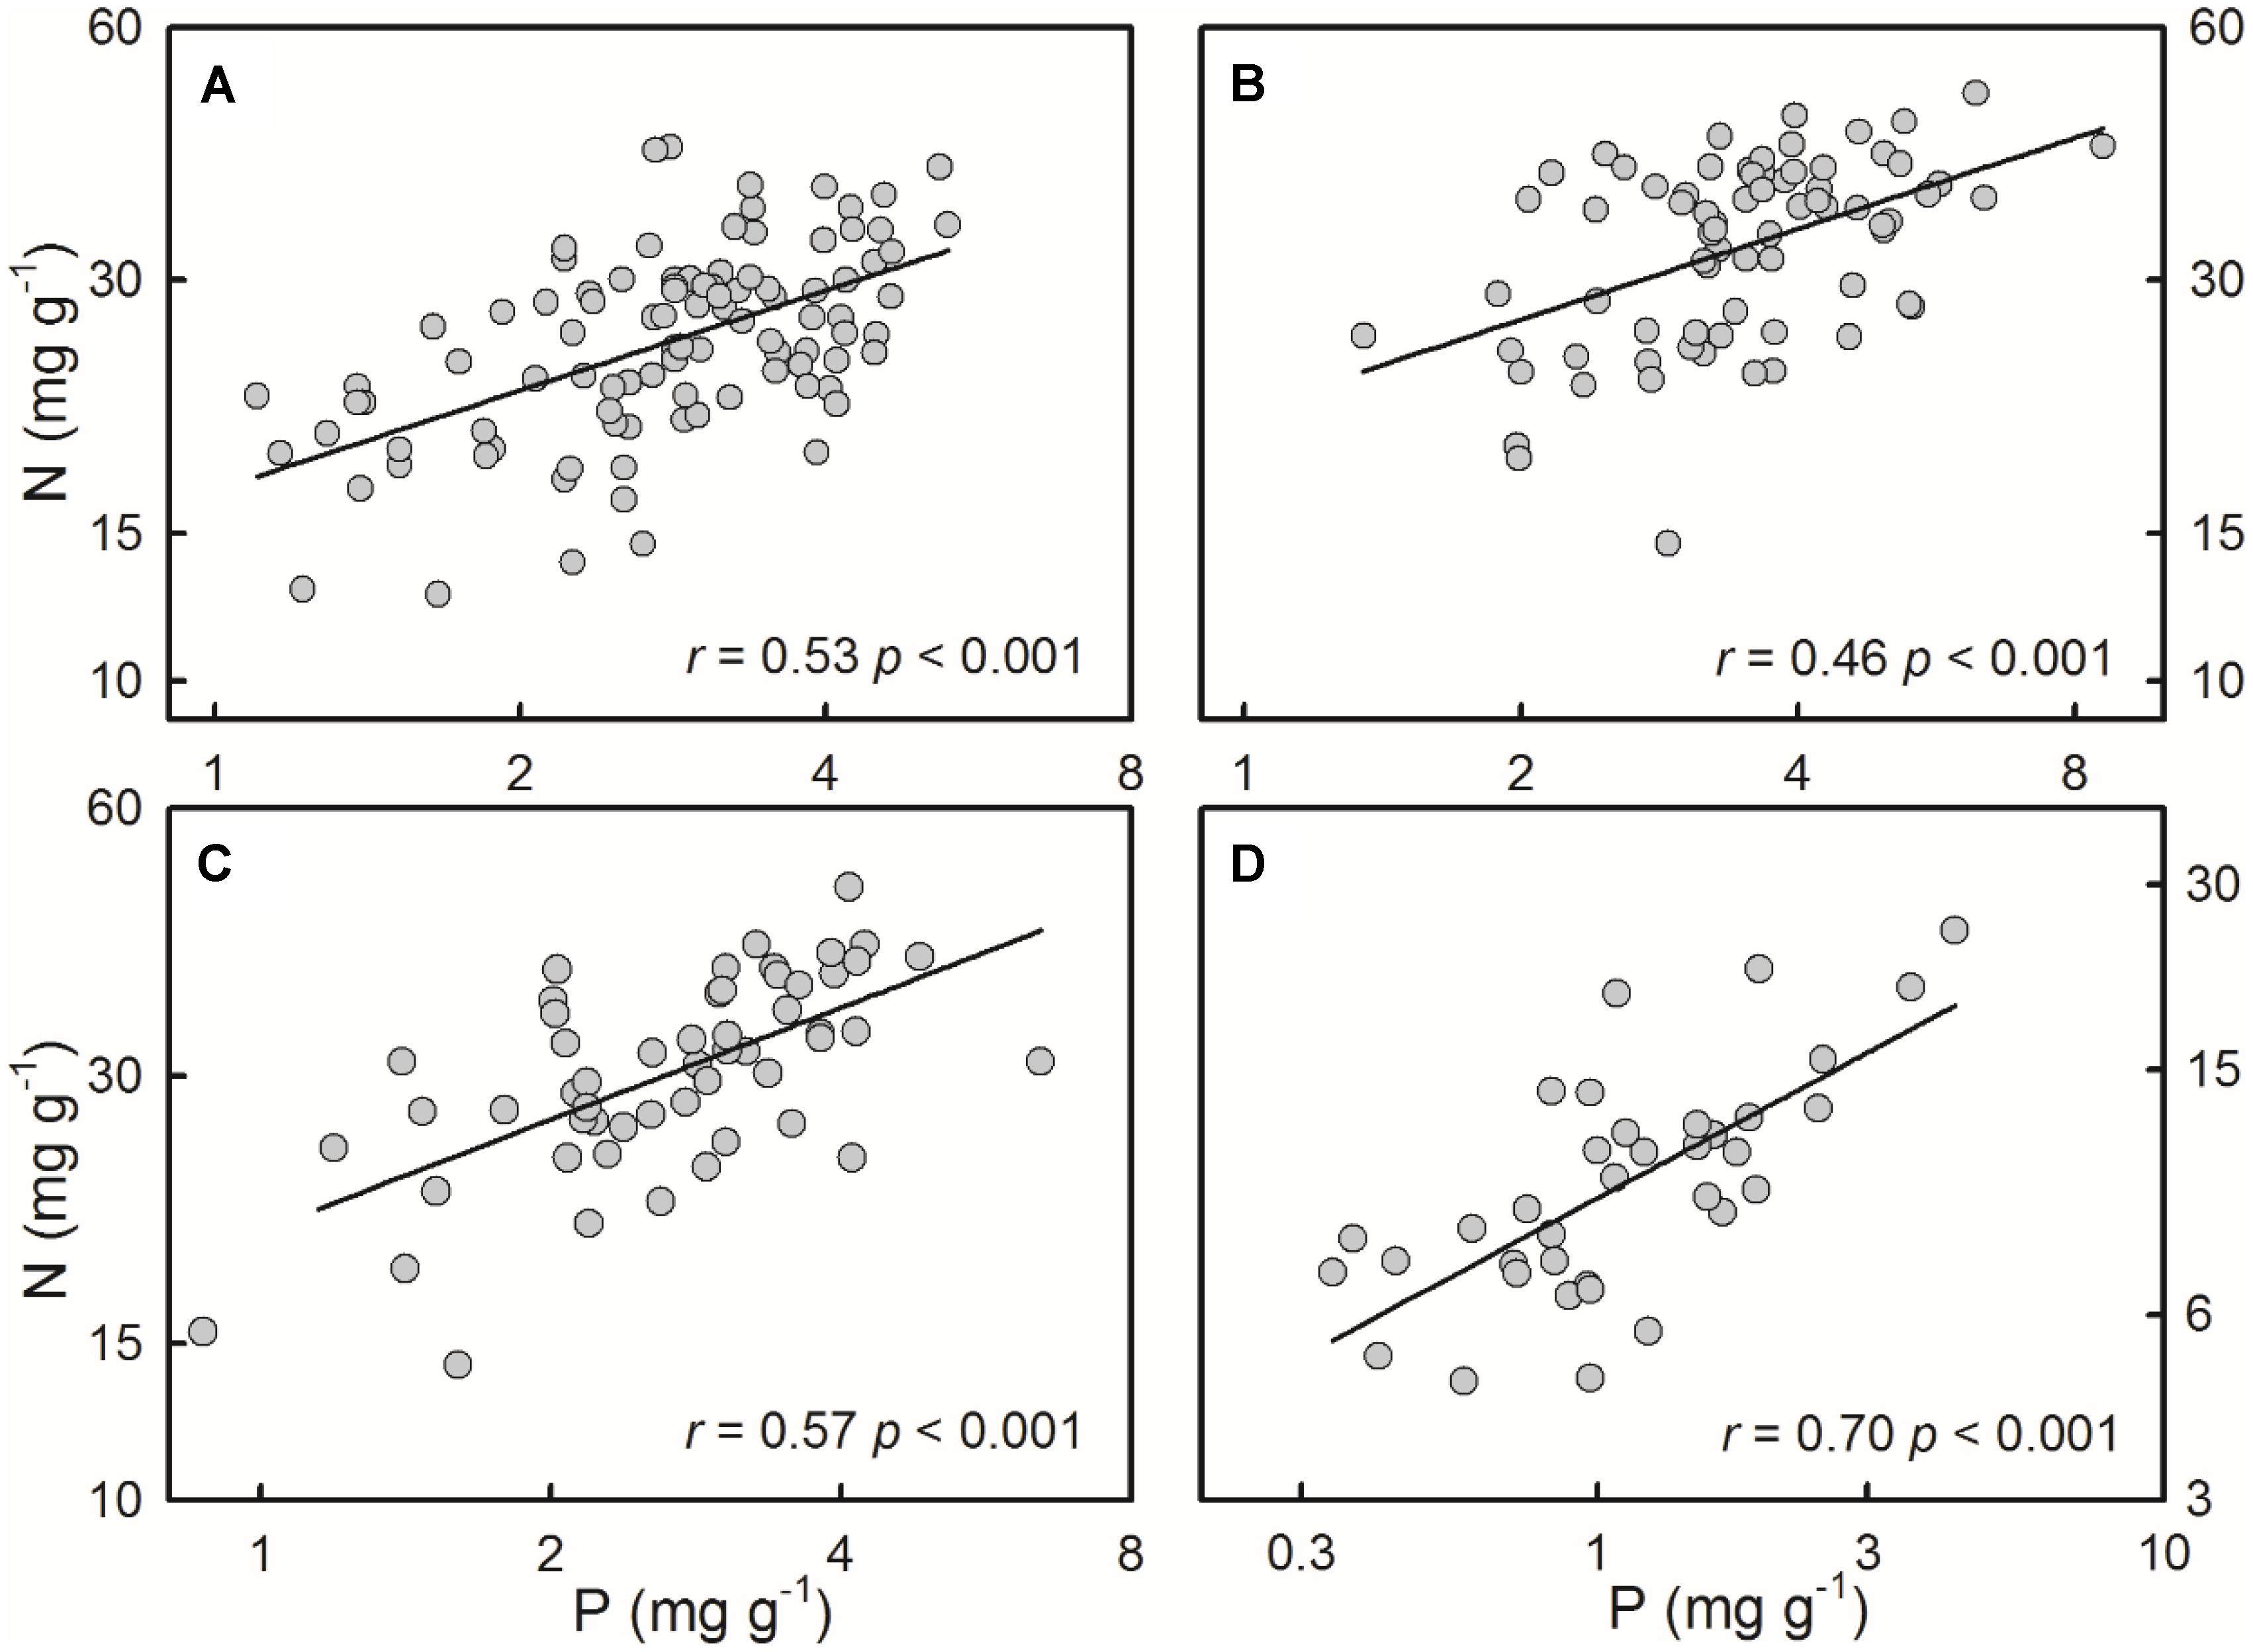
FIGURE 2. Positive relationships between N and P concentrations of the four species/groups. The correlations were fitted in power functions. (A) S. filiformis, (B) H. tricuspis, (C) T. palustris, and (D) Charophytes.
Effects of Environmental Factors on Plant N and P Stoichiometry
The general linear models (GLM) which contained seven explanatory variables explained 16.85 to 42.67%, 20.78 to 47.45%, and 6.75 to 33.87% of the variations in plant N, P concentrations and N:P ratios, respectively (Table 2). Among the explanatory variables, GST was the primary variable, while habitat properties showed weak and inconsistent effects on the plant N and P stoichiometry.
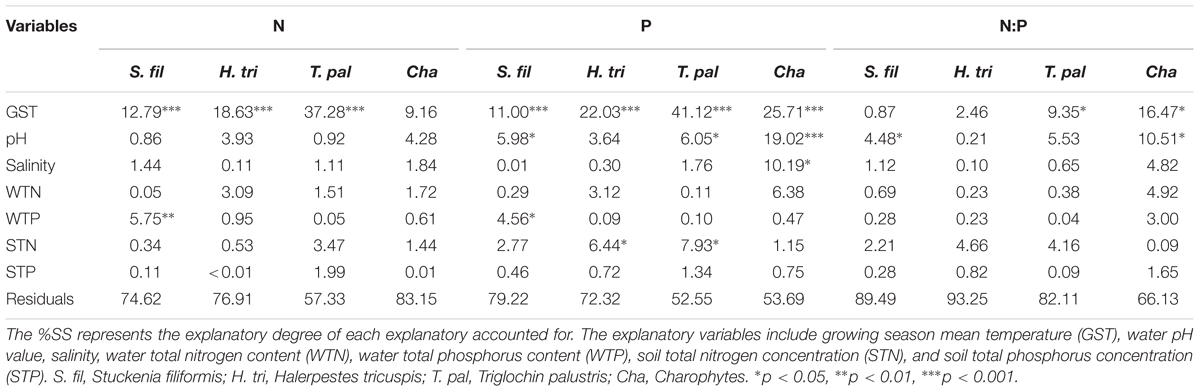
TABLE 2. The percentage of the total sum of square (%SS) of each explanatory variable in the general linear model.
Plant N and P concentrations of the four species/groups increased with decreasing GST (Figures 3A–H). The N:P ratios of T. palustris and charophytes decreased with decreasing GST (Figures 3K,L), while those of the other two species showed no significant relationships with GST (Figures 3I,J).
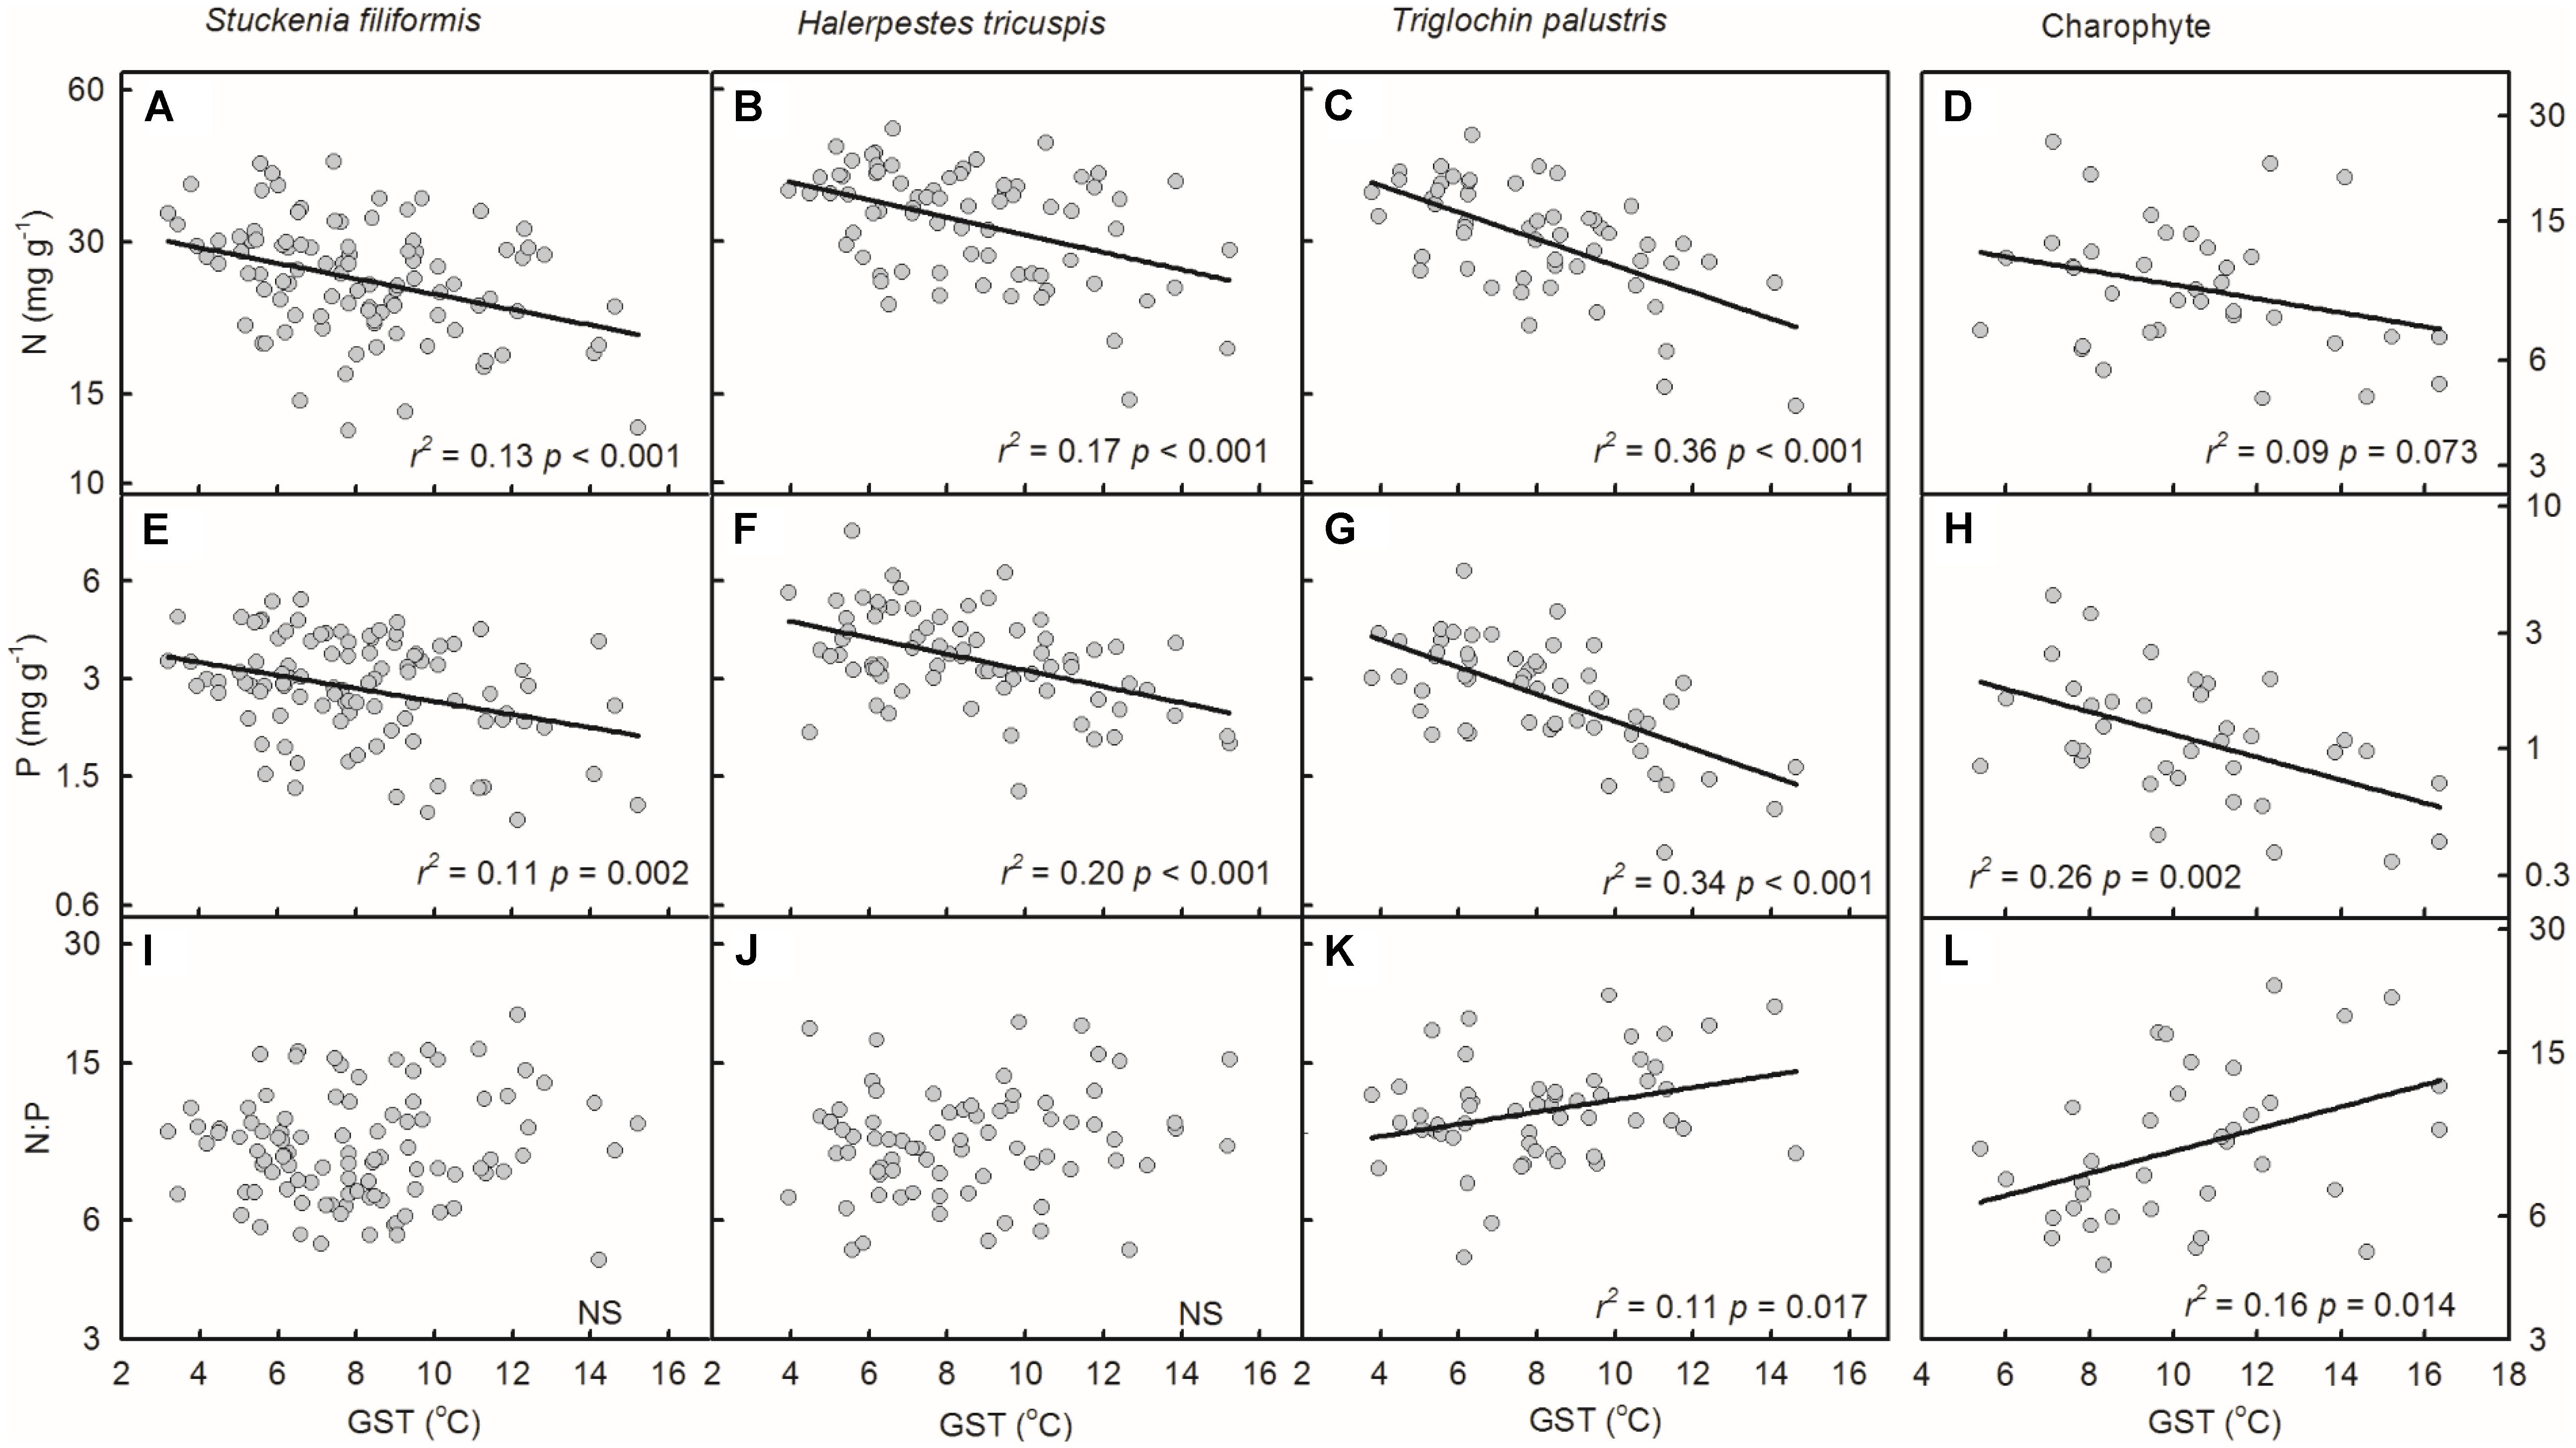
FIGURE 3. Trends of plant N and P concentrations and N:P ratios along temperature gradients (A–L). The growing season mean temperature (GST) was used to test the effects of temperature on plant N and P concentrations and N:P ratios. The p-value in each panel was the original one of each test if it was smaller than the corrected one obtained by Holm’s Sequential Bonferroni Procedure. If not, the test was non-significant (NS).
Geographic Patterns of Plant N and P Stoichiometry
Plant N and P concentrations and N:P ratios of the four species/groups did not show consistent trends along latitude gradients (Figures 4A–L). Regarding altitude gradients, plant N and P concentrations of the four species/groups increased toward high altitude (Figures 5A–H), except for N concentration of charophytes (Figure 5D). The N:P ratio of T. palustris and charophytes decreased, but those of the other two species showed no significant relationships with increasing altitude (Figures 5I–L).
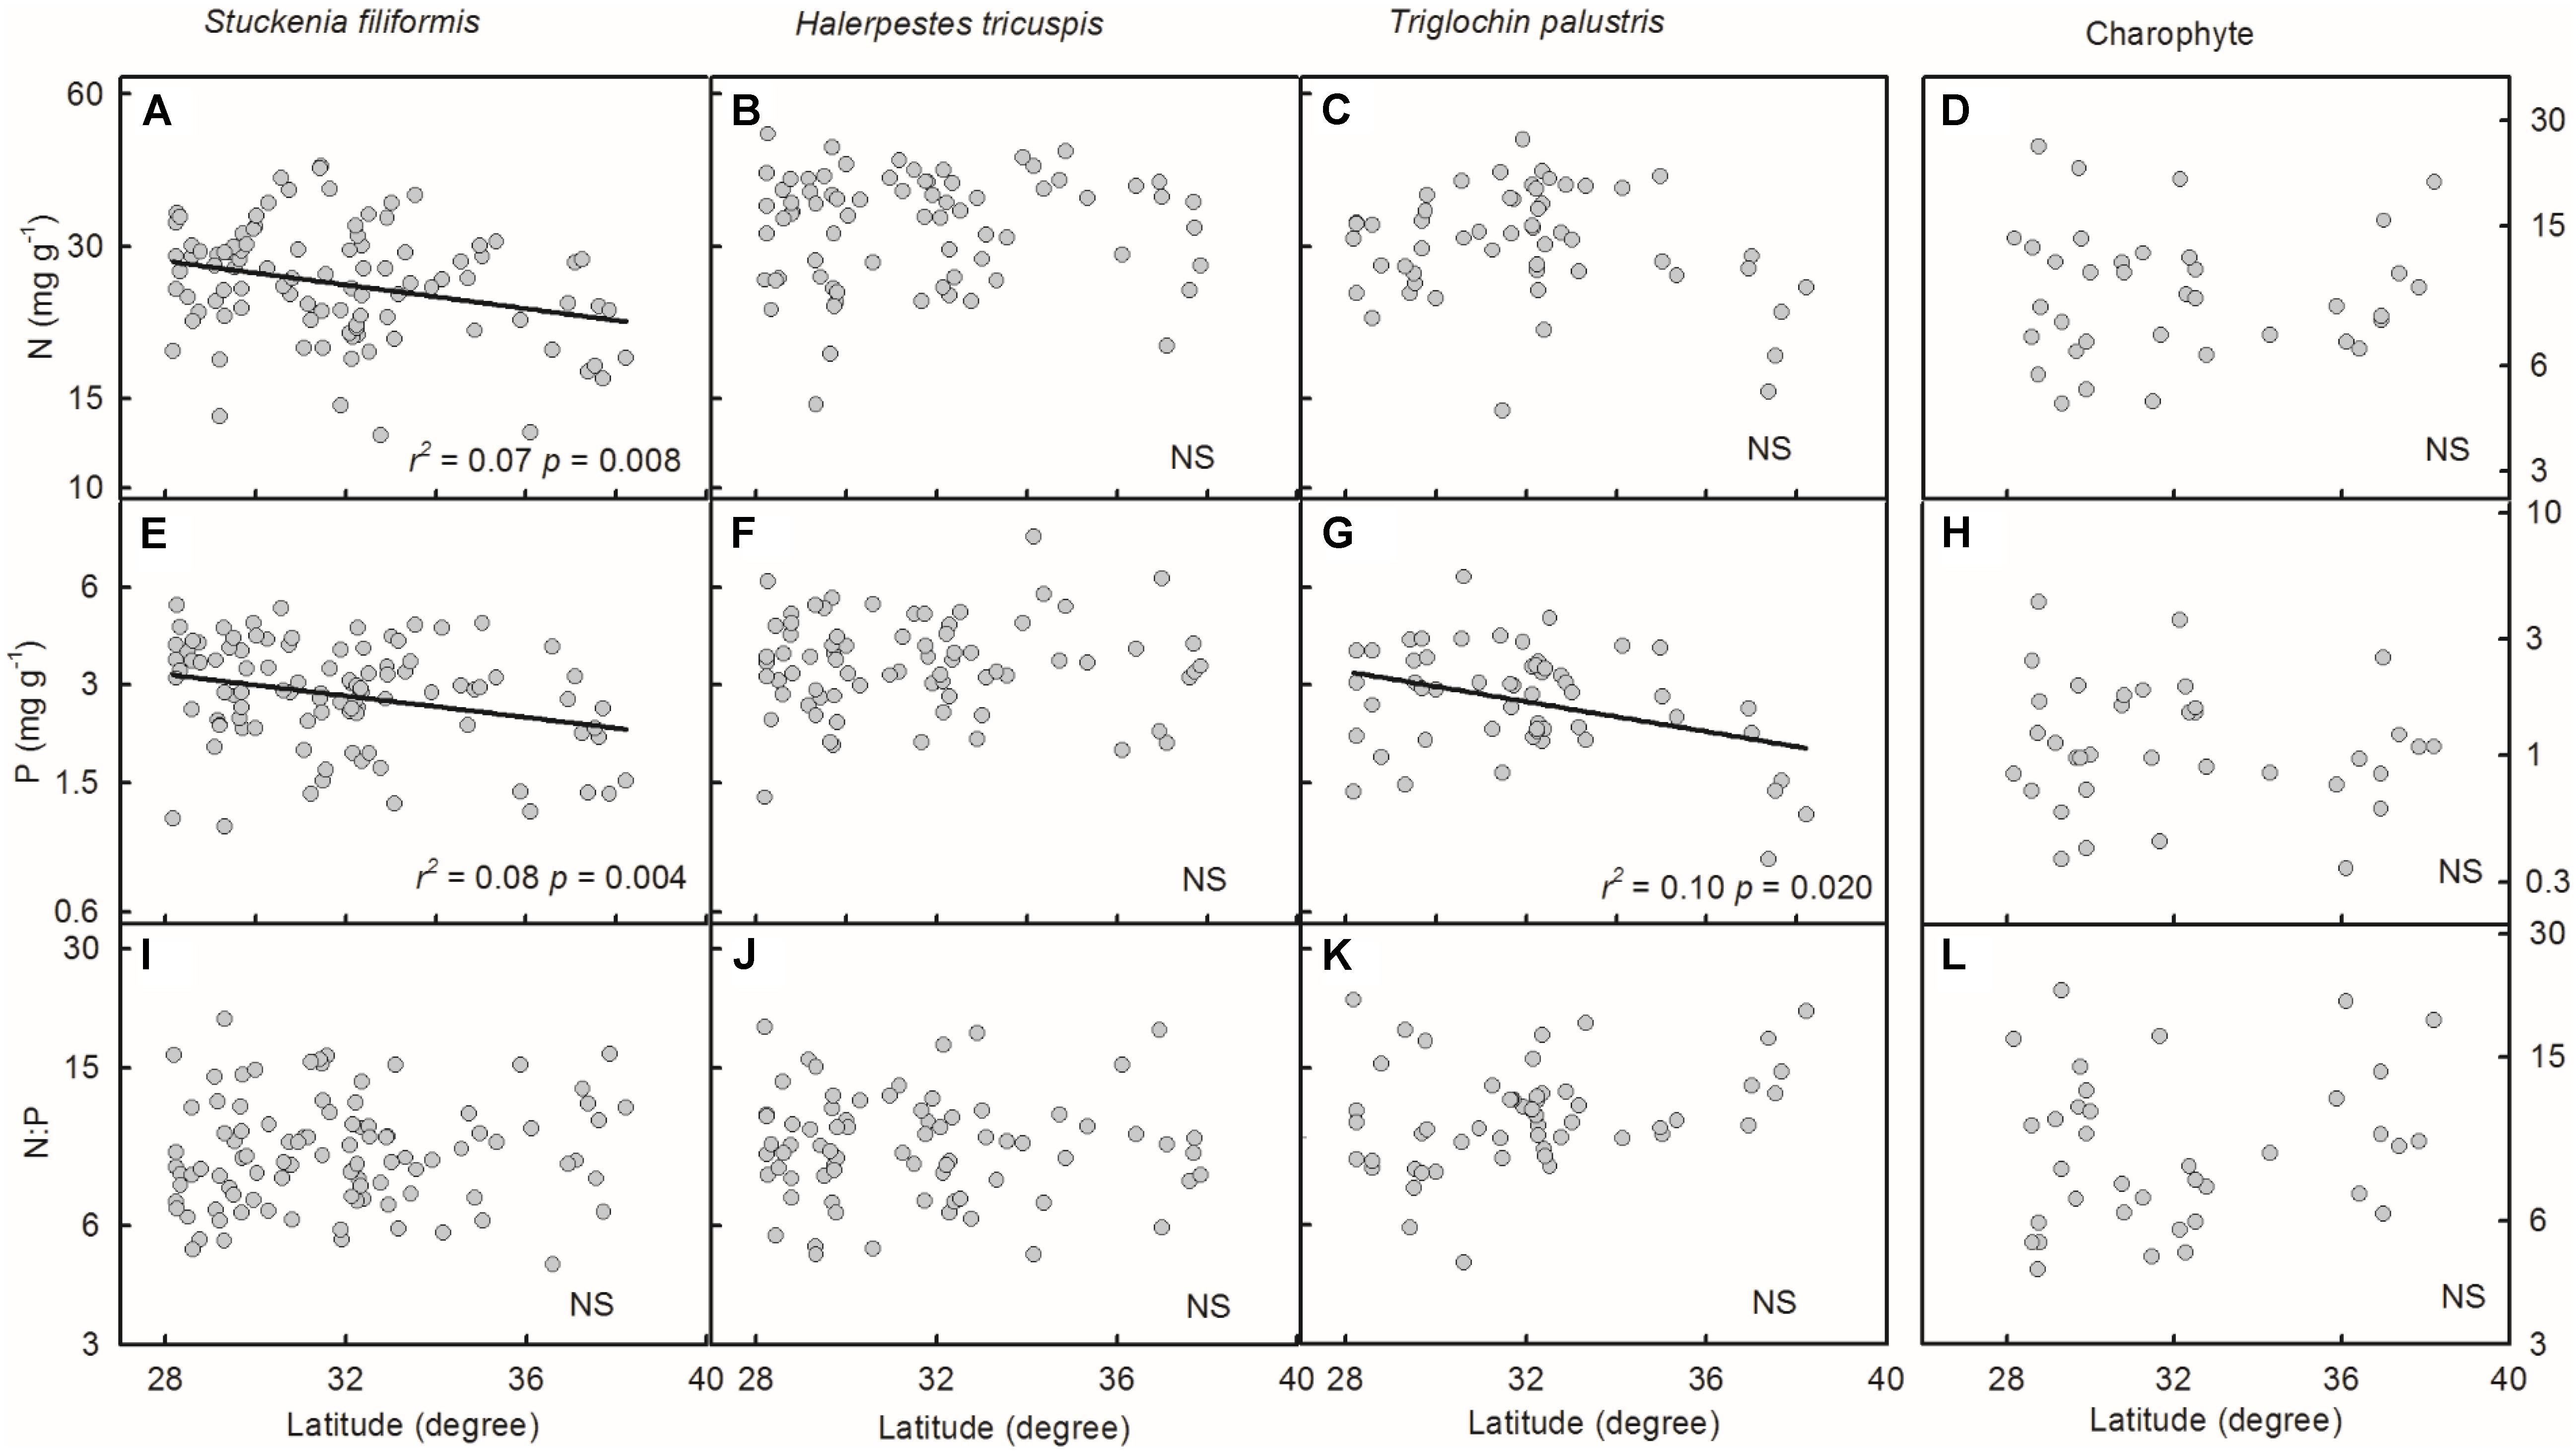
FIGURE 4. Trends of plant N and P concentrations and N:P ratios along latitudinal gradients (A–L). The p-value in each panel was the original one of each test if it was smaller than the corrected one obtained by Holm’s Sequential Bonferroni Procedure. If not, the test was non-significant (NS).
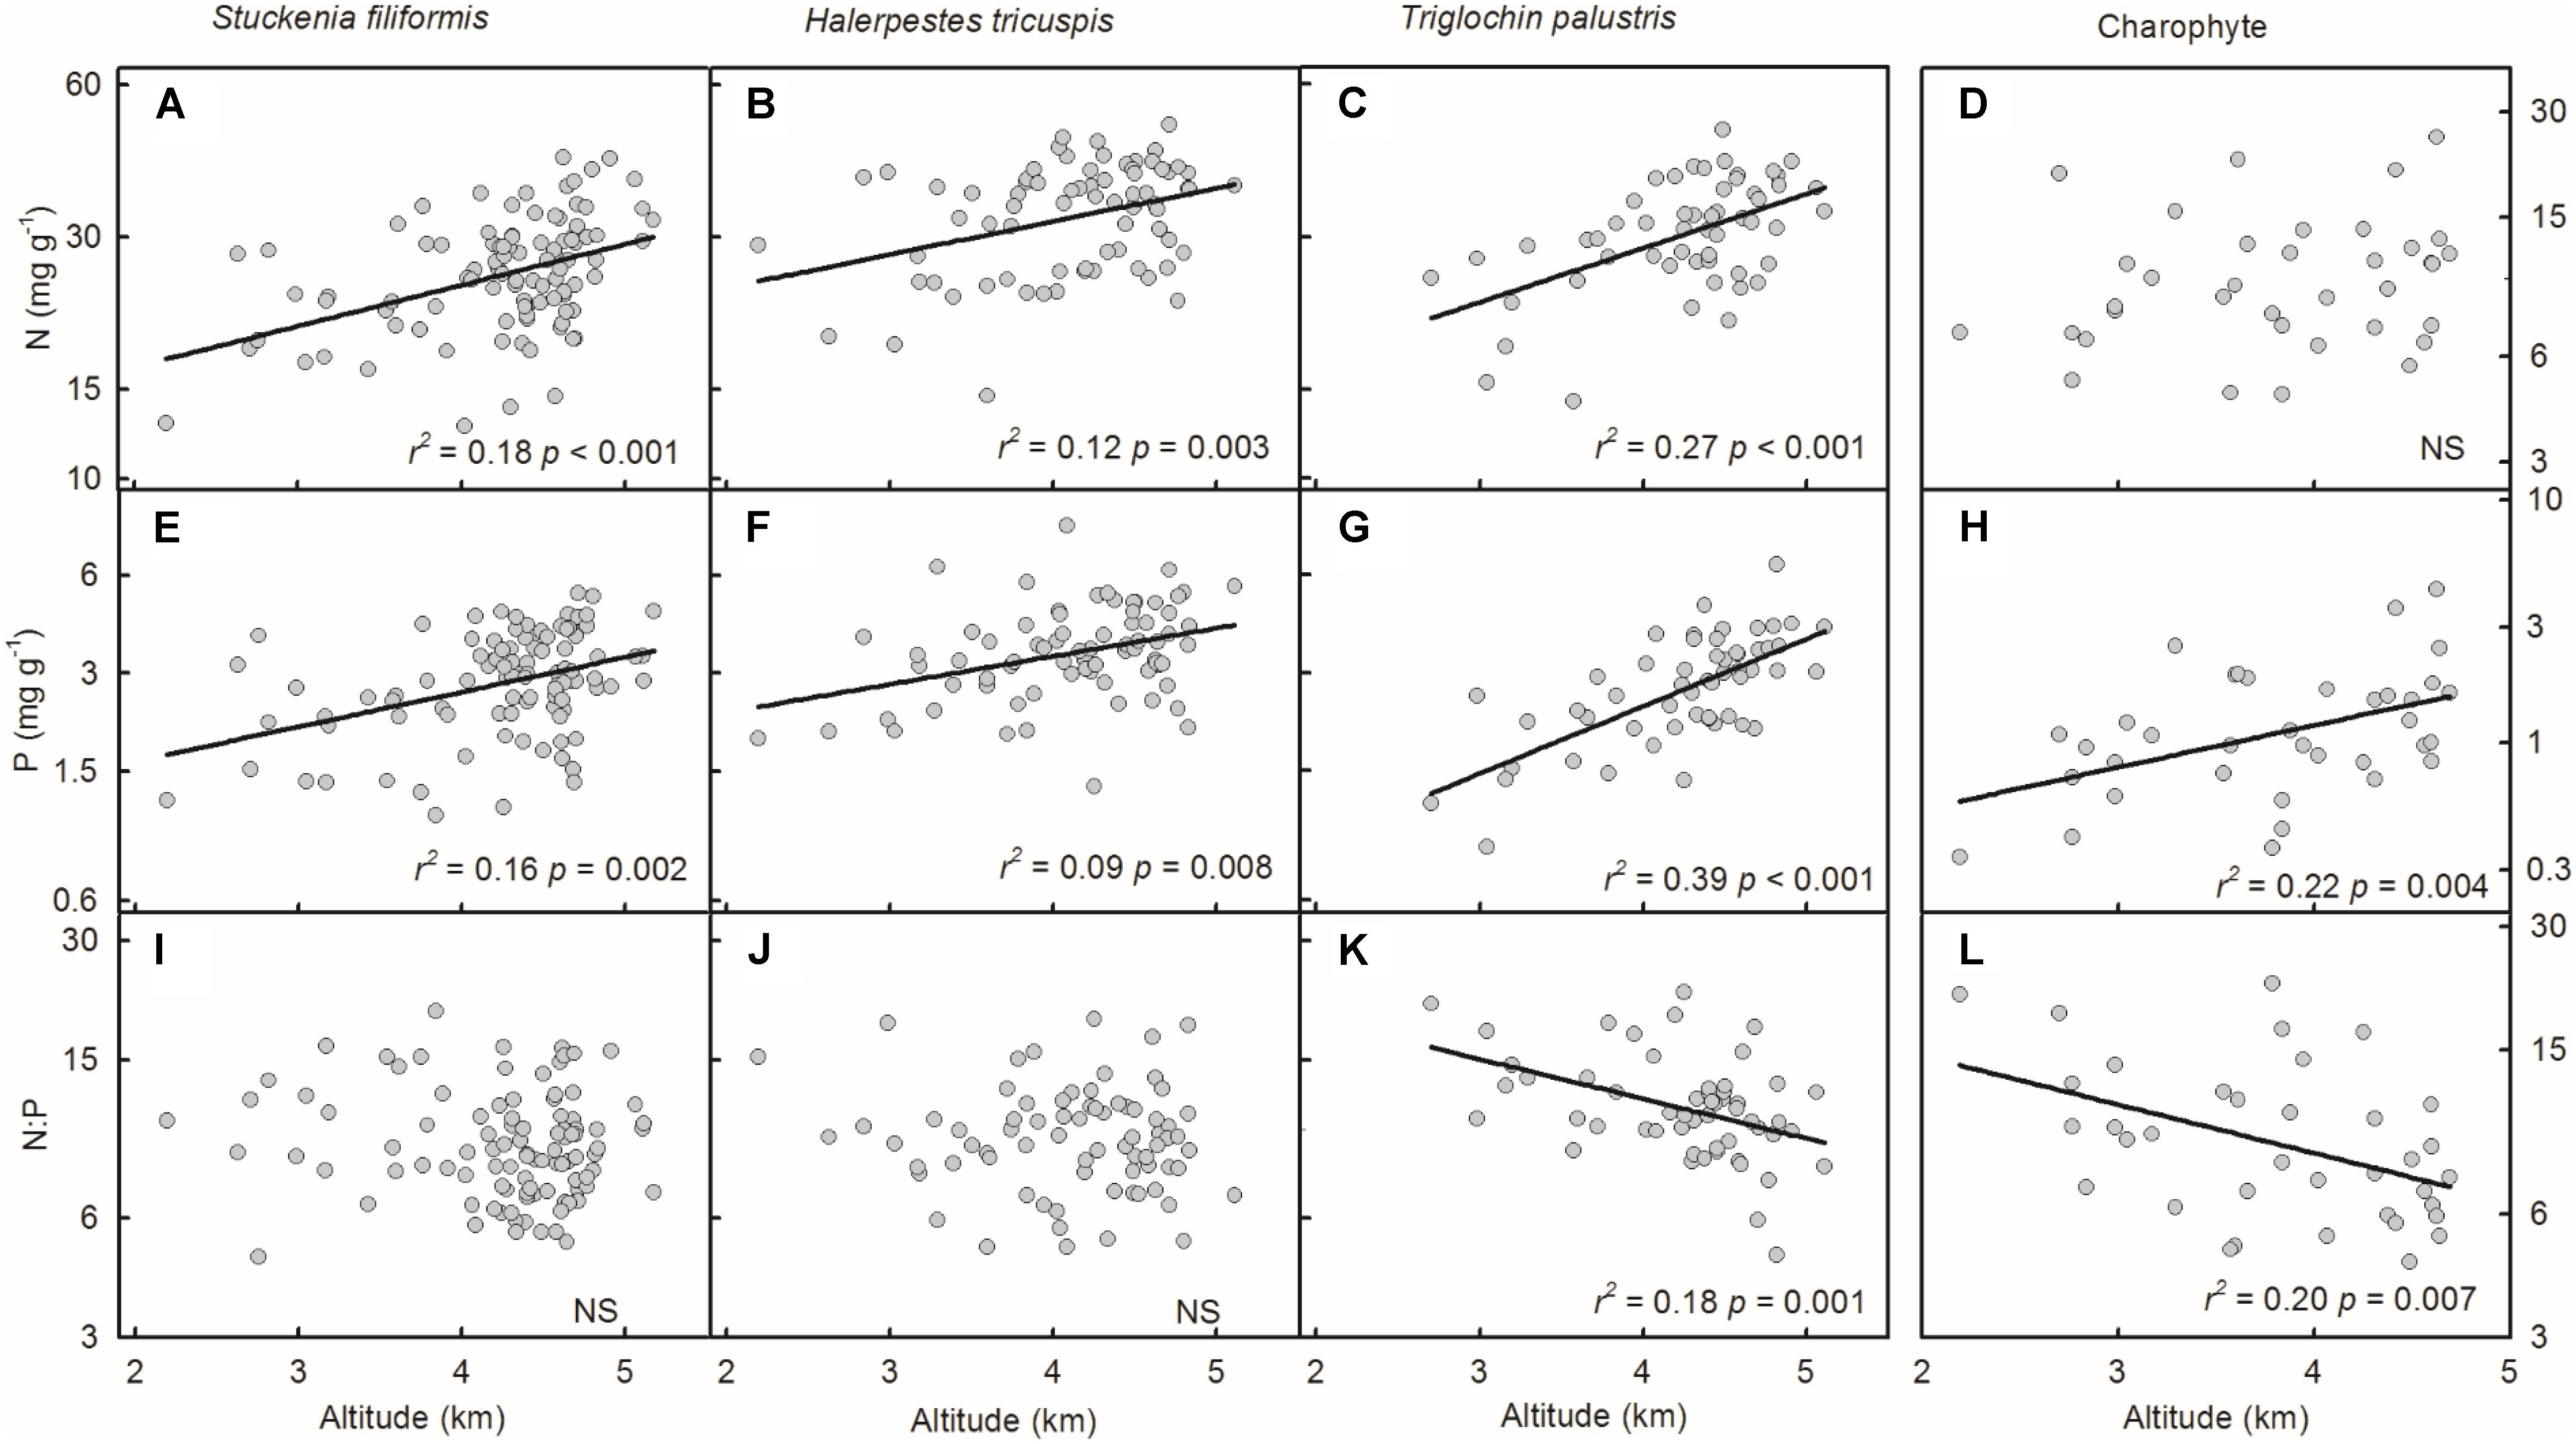
FIGURE 5. Trends of plant N and P concentrations and N:P ratios along altitudinal gradients (A–L). The p-value in each panel was the original one of each test if it was smaller than the corrected one obtained by Holm’s Sequential Bonferroni Procedure. If not, the test was non-significant (NS).
Discussion
Stoichiometric Homeostasis of Aquatic Plants on the Tibetan Plateau
Stoichiometric homeostasis refers that organisms maintain specific element composition by adjusting the organismic physiological processes when faced with variations in nutrient availability in their surroundings (Sterner and Elser, 2002; Elser et al., 2010; Yu et al., 2010). In this study, three patterns were observed. The first was that the plant nutrient concentrations were different among species, especially between angiosperms and charophytes. These results are consistent with Blindow (1992), who stated that charophytes species (Chara tomentosa and Nitellopsis obtusa) contain less N (10.5 – 14.0 mg g-1) and P (0.63 – 0.88 mg g-1) than their angiosperm counterparts (N, 24.2 – 24.5 mg g-1; P, 2.11 – 2.51 mg g-1 in Myriophyllum spicatum and Potamogeton pectinatus) from shallow lakes in Sweden. Furthermore, several independent studies demonstrated the same patterns when charophytes and angiosperms were taken into account simultaneously (reviewed in Kufel and Kufel, 2002). However, charophytes may not differ so much from angiosperm species as the data shows. Charophytes always build calcite encrustation, which is composed mainly of calcium carbonate, tightly bound to their thalli, and precipitate much more calcium than vascular aquatic plants (Kufel et al., 2016). The encrustation occupies a large proportion (may exceed 70% in extreme situations) of dry plant mass and explains the lower N and P concentrations of charophytes (Blindow, 1992; Kufel and Kufel, 2002; Kufel et al., 2016). In addition, the proportions of encrustation in dry plant mass of charophytes are species-specific (Kufel et al., 2016), inducing a higher value of the coefficient of variation (CV) when charophytes are treated as a group of species, as done in this study (Table 1). In further studies, identifying the species, removing the calcite encrustation, and calculating N and P concentrations on an ash-free dry weight basis of charophytes might lead to more accurate conclusions when comparing the nutrient concentrations of charophytes with those of vascular aquatic plants. In the case of the three angiosperm species in this study, mean nutrient concentrations differed from each other at the species levels. As the samples were collected from the same region, such variations were likely attributed to taxonomic differences, rather than the ambient environments (Demars and Edwards, 2007).
Although significant differences observed between the nutrient concentrations of charophytes and their angiosperm counterparts, the N:P ratios of the two plant groups remained within a similar range, and not differ from each other on species mean levels. This was the second principal trend detected in this study. The N:P ratios rather than N and P concentrations are considered to reflect the nutrient limitation of plants (Güsewell and Koerselman, 2002). The similarity of N:P ratios between charophytes and angiosperm species suggests that the lower nutrient concentrations of charophytes did not result from lower ambient nutrient availability since the sampling area for each species were overlapping. On the contrary, innately low nutrient concentrations of charophytes imbue the species with competitive superiority in oligotrophic habitats (Blindow et al., 2014).
The third principal pattern detected here was the positive N-P relationships, which were well documented in previous studies at the species level (Li et al., 2014; Wu et al., 2014) or on community level (Duarte, 1992; Demars and Edwards, 2007; He et al., 2008; Reich et al., 2010). In this study, both charophytes and angiosperms showed coincident positive N-P relationships. Functionally, P is primarily allocated to ribosomal RNA, which is used to synthesize N-rich proteins, indicating that N and P concentrations might co-vary relative to each other to maintain optimal tissue N:P ratios (Sterner and Elser, 2002; Ågren, 2008).
Each species contained specific nutrient concentrations and maintained relatively stable ratios and correlations between elements. The stoichiometric nutrient composition was species-specific, and the plants could control stoichiometric homeostasis in fluctuating environments.
Stoichiometric Variability of Aquatic Plants and the Effects of the Environment
Empirically, stoichiometric homeostasis is an approximation rather than a strict value, as the organisms always need to respond to the fluctuations of resources availability (Wang et al., 2012). This study revealed that the nutrient concentrations varied considerably within the same species. The N concentrations varied 4-fold and P varied 10-fold within species, indicating the significant influences of the ambient environments. Among all of the environmental factors, temperature played the primary role in determining the patterns of plant N and P concentrations along environmental gradients. Plant N and P concentrations increased with decreasing temperature. Such patterns supported the temperature-plant physiological hypothesis, which suggested that plants invested more N and P in enzyme systems to compensate the depressed efficiency in cold regions (Reich and Oleksyn, 2004). Habitat properties had weak effects on plant N and P stoichiometry (Sardans et al., 2012). Similar results were also reported at the species level for Ranunculus natans (Ranunculaceae) in the arid zone of northwest China (Li et al., 2015). Regarding life forms, emergent plants, T. palustris and H. tricuspis, which leaves were exposed to air directly, had a higher explanatory degree by GST than those of submerged species, S. filiformis and charophytes. These results indicate that water buffered the drastic variation of air temperature, and alleviated the stress of low temperature for submerged plants. In all, temperature determined the patterns of plant N and P stoichiometry at the community level (Wang et al., 2015), as well as species level (Li et al., 2015 and this study) across large environmental gradients.
Geographically, temperature decreases with increasing latitude and altitude. Latitudinal patterns of plant element stoichiometry at regional and global scales have been well documented (Reich and Oleksyn, 2004; Han et al., 2005; Xia et al., 2014), whereas altitudinal trends are often neglected. However, altitudinal gradients are known to dramatically alter environmental factors (e.g., temperature) in relatively small areas (Lacoul and Freedman, 2006; Wang et al., 2013; De Long et al., 2015). In this study, the latitude range extended approximately 10 degrees, from 28.18 to 38.21°N, but the altitude range spanned nearly 3000 m, from 2194 to 5176 m, which introduces more drastic variations in temperature than does the latitude range. Leaf N and P had no or weakly significant relationships with latitude, but significantly increased with increasing altitude. The results were consistent with Körner’s (1989) finding that herbaceous plants from high elevation regions contained more nutrients. Therefore, on the Tibetan Plateau, we suggest that the patterns of plant N and P stoichiometry at the species level are determined by the stresses of low temperature, which were induced by altitude rather than latitude.
Author Contributions
ZWa and DY designed the study. ZWa and ZWu performed the field investigation. ZWa, ZWu, and YW analyzed the data and wrote the manuscript. All authors worked together to produce the final version of the text.
Funding
ZWa was supported by the National Natural Science Foundation of China (Grants 31300296).
Conflict of Interest Statement
The authors declare that the research was conducted in the absence of any commercial or financial relationships that could be construed as a potential conflict of interest.
Acknowledgments
We thank the reviewers for comments on the manuscript. We thank Zhenjie Ding and Xiaolong Huang for help with the fieldwork. We also thank Dr. Heyun Wang for her valuable suggestions of revised manuscript.
Abbreviations
GST, growing season mean air temperature; STN, soil total nitrogen concentration; STP, soil total phosphorus concentration; WTN, water total nitrogen content; WTP, water total phosphorus content.
References
Abdi, H. (2010). “Holm’s sequential bonferroni procedure,” in Encyclopedia of Research Design, ed. N. Salkind (Thousand Oaks, CA: SAGE Publications, Inc.), 1–8.
Ågren, G. I. (2008). Stoichiometry and nutrition of plant growth in natural communities. Annu. Rev. Ecol. Evol. Syst. 39, 153–170. doi: 10.1146/annurev.ecolsys.39.110707.173515
Blindow, I. (1992). Long- and short-term dynamics of submerged macrophytes in two shallow eutrophic lakes. Freshw. Biol. 28, 15–27. doi: 10.1111/j.1365-2427.1992.tb00558.x
Blindow, I., Hargeby, A., and Hilt, S. (2014). Facilitation of clear-water conditions in shallow lakes by macrophytes: differences between charophyte and angiosperm dominance. Hydrobiologia 737, 99–110. doi: 10.1007/s10750-013-1687-2
Bornette, G., and Puijalon, S. (2011). Response of aquatic plants to abiotic factors: a review. Aquat. Sci. 73, 1–14. doi: 10.1007/s00027-010-0162-7
Brothers, S. M., Hilt, S., Meyer, S., and Köhler, J. (2013). Plant community structure determines primary productivity in shallow, eutrophic lakes. Freshw. Biol. 58, 2264–2276. doi: 10.1111/fwb.12207
De Long, J. R., Kardol, P., Sundqvist, M. K., Veen, G. F., and Wardle, D. A. (2015). Plant growth response to direct and indirect temperature effects varies by vegetation type and elevation in a subarctic tundra. Oikos 124, 772–783. doi: 10.1111/oik.01764
Demars, B. O. L., and Edwards, A. C. (2007). Tissue nutrient concentrations in freshwater aquatic macrophytes: high inter-taxon differences and low phenotypic response to nutrient supply. Freshw. Biol. 52, 2073–2086. doi: 10.1111/j.1365-2427.2007.01817.x
Demars, B. O. L., and Edwards, A. C. (2008). Tissue nutrient concentrations in aquatic macrophytes: comparison across biophysical zones, surface water habitats and plant life forms. Chem. Ecol. 24, 413–422. doi: 10.1080/02757540802534533
Duarte, C. M. (1992). Nutrient concentration of aquatic plants: patterns across species. Limnol. Oceanogr. 37, 882–889. doi: 10.4319/lo.1992.37.4.0882
Elser, J. J., Fagan, W. F., Kerkhoff, A. J., Swenson, N. G., and Enquist, B. J. (2010). Biological stoichiometry of plant production: metabolism, scaling and ecological response to global change. New Phytol. 186, 593–608. doi: 10.1111/j.1469-8137.2010.03214.x
Forsberg, C. (1964). Phosphorus, a maximum factor in the growth of Characeae. Nature 201, 517–518. doi: 10.1038/201517a0
Frost, P. C., and Hicks, A. L. (2012). Human shoreline development and the nutrient stoichiometry of aquatic plant communities in Canadian Shield lakes. Can. J. Fish. Aquat. Sci. 69, 1642–1650. doi: 10.1139/F2012-080
Guo, Y., Haynes, R. R., and Hellquist, C. B. (2010a). “Juncaginaceae,” in Flora of China, eds Z. Wu and P. H. Raven (Beijing: Science Press), 105.
Guo, Y., Haynes, R. R., Hellquist, C. B., and Kaplan, Z. (2010b). “Potamogetonaceae,” in Flora of China, eds Z. Wu and P. H. Raven (Beijing: Science Press), 114–115.
Güsewell, S., and Koerselman, M. (2002). Variation in nitrogen and phosphorus concentrations of wetland plants. Perspect. Plant Ecol. Evol. Syst. 5, 37–61. doi: 10.1078/1433-8319-0000022
Han, F. S., and Li, Y. Y.(eds). (1994). “Charophyte,” in Flora Algarum Sinicarum Aquae Dulcis. Consilio Florarum Cryptogamarum Sinicarum Academiae Sinicae Edita (Beijing: Science Press).
Han, W. X., Fang, J. Y., Guo, D. L., and Zhang, Y. (2005). Leaf nitrogen and phosphorus stoichiometry across 753 terrestrial plant species in China. New Phytol. 168, 377–385. doi: 10.1111/j.1469-8137.2005.01530.x
He, J. S., Wang, L., Flynn, D. F. B., Wang, X. P., Ma, W. H., and Fang, J. Y. (2008). Leaf nitrogen:phosphorus stoichiometry across Chinese grassland biomes. Oecologia 155, 301–310. doi: 10.1007/s00442-007-0912-y
Körner, C. (1989). The nutritional status of plants from high altitudes - a worldwide comparison. Oecologia 81, 379–391. doi: 10.1007/BF00377088
Kufel, L., and Kufel, I. (2002). Chara beds acting as nutrient sinks in shallow lakes - a review. Aquat. Bot. 72, 249–260. doi: 10.1016/S0304-3770(01)00204-2
Kufel, L., Strzalek, M., and Biardzka, E. (2016). Site- and species-specific contribution of charophytes to calcium and phosphorus cycling in lakes. Hydrobiologia 767, 185–195. doi: 10.1007/s10750-015-2498-4
Kuo, S. (1996). “Phosphorus,” in Methods of Soil Analysis. Chemical Methods, Part 3, ed. J. M. Bigham (Madison, WI: Soil Science Society of America).
Lacoul, P., and Freedman, B. (2006). Relationships between aquatic plants and environmental factors along a steep Himalayan altitudinal gradient. Aquat. Bot. 84, 3–16. doi: 10.1016/j.aquabot.2005.06.011
Li, L. P., Zerbe, S., Han, W. X., Thevs, N., Li, W. P., He, P., et al. (2014). Nitrogen and phosphorus stoichiometry of common reed (Phragmites australis) and its relationship to nutrient availability in northern China. Aquat. Bot. 112, 84–90. doi: 10.1016/j.aquabot.2013.08.002
Li, Z. Q., Yang, L., Lu, W., Guo, W., Gong, X. S., Xu, J., et al. (2015). Spatial patterns of leaf carbon, nitrogen stoichiometry and stable carbon isotope composition of Ranunculus natans C.A. Mey. (Ranunculaceae) in the arid zone of northwest China. Ecol. Eng. 77, 9–17. doi: 10.1016/j.ecoleng.2015.01.010
R Development Core Team (2007). R: A Language and Environment for Statistical Computing. Vienna: R Foundation for Statistical Computing. Available at: http://www.R-project.org
Reich, P. B., and Oleksyn, J. (2004). Global patterns of plant leaf N and P in relation to temperature and latitude. Proc. Natl. Acad. Sci. U.S.A. 101, 11001–11006. doi: 10.1073/pnas.0403588101
Reich, P. B., Oleksyn, J., Wright, I. J., Niklas, K. J., Hedin, L., and Elser, J. J. (2010). Evidence of a general 2/3-power law of scaling leaf nitrogen to phosphorus among major plant groups and biomes. Proc. R. Soc. B Biol. Sci. 277, 877–883. doi: 10.1098/rspb.2009.1818
Santamaría, L. (2002). Why are most aquatic plants widely distributed? Dispersal, clonal growth and small-scale heterogeneity in a stressful environment. Acta Oecol. 23, 137–154. doi: 10.1016/S1146-609X(02)01146-3
Sardans, J., Rivas-Ubach, A., and Peñuelas, J. (2012). The elemental stoichiometry of aquatic and terrestrial ecosystems and its relationships with organismic lifestyle and ecosystem structure and function: a review and perspectives. Biogeochemistry 111, 1–39. doi: 10.1007/s10533-011-9640-9
Sterner, R. W., and Elser, J. J. (2002). Ecological Stoichiometry: The Biology of Elements from Molecules to the Biosphere. Princeton, NJ: Princeton University Press.
Wang, H., Sterner, R. W., and Elser, J. J. (2012). On the “strict homeostasis” assumption in ecological stoichiometry. Ecol. Model. 243, 81–88. doi: 10.1007/s00442-009-1489-4
Wang, W., and Michio, T. (2001). “Ranunculaceae,” in Flora of China, eds Z. Wu and P. H. Raven (Beijing: Science Press), 435–437.
Wang, Z., Luo, T. X., Li, R. C., Tang, Y. H., and Du, M. Y. (2013). Causes for the unimodal pattern of biomass and productivity in alpine grasslands along a large altitudinal gradient in semi-arid regions. J. Veg. Sci. 24, 189–201. doi: 10.1111/j.1654-1103.2012.01442.x
Wang, Z., Xia, C. X., Yu, D., and Wu, Z. G. (2015). Low-temperature induced leaf elements accumulation in aquatic macrophytes across Tibetan Plateau. Ecol. Eng. 75, 1–8. doi: 10.1016/j.ecoleng.2014.11.015
Wiik, E., Bennion, H., Sayer, C. D., Davidson, T. A., Mcgowan, S., Patmore, I. R., et al. (2015). Ecological sensitivity of marl lakes to nutrient enrichment: evidence from Hawes Water, UK. Freshw. Biol. 60, 2226–2247. doi: 10.1111/fwb.12650
Wu, T. G., Wang, G. G., Wu, Q. T., Cheng, X. R., Yu, M. K., Wang, W., et al. (2014). Patterns of leaf nitrogen and phosphorus stoichiometry among Quercus acutissima provenances across China. Ecol. Complex. 17, 32–39. doi: 10.1016/j.ecocom.2013.07.003
Xia, C., Yu, D., Wang, Z., and Xie, D. (2014). Stoichiometry patterns of leaf carbon, nitrogen and phosphorous in aquatic macrophytes in eastern China. Ecol. Eng. 70, 406–413. doi: 10.1016/j.ecoleng.2014.06.018
Yu, Q., Chen, Q. S., Elser, J. J., He, N. P., Wu, H. H., Zhang, G. M., et al. (2010). Linking stoichiometric homoeostasis with ecosystem structure, functioning and stability. Ecol. Lett. 13, 1390–1399. doi: 10.1111/j.1461-0248.2010.01532.x
Keywords: alpine wetland, aquatic plants, freshwater ecosystems, stoichiometric homeostasis, temperature
Citation: Wang Z, Wu Z, Wang Y and Yu D (2018) Variations in Species-Level N:P Stoichiometry of Charophytes and Aquatic Angiosperms on the Tibetan Plateau. Front. Plant Sci. 9:870. doi: 10.3389/fpls.2018.00870
Received: 12 January 2018; Accepted: 04 June 2018;
Published: 22 June 2018.
Edited by:
Katya E. Kovalenko, University of Minnesota Duluth, United StatesReviewed by:
Emily Palm, Università degli Studi di Firenze, ItalyMartina Pollastrini, Università degli Studi di Firenze, Italy
Copyright © 2018 Wang, Wu, Wang and Yu. This is an open-access article distributed under the terms of the Creative Commons Attribution License (CC BY). The use, distribution or reproduction in other forums is permitted, provided the original author(s) and the copyright owner are credited and that the original publication in this journal is cited, in accordance with accepted academic practice. No use, distribution or reproduction is permitted which does not comply with these terms.
*Correspondence: Zhong Wang, d2FuZ3pob25nQHdodS5lZHUuY24= Dan Yu, bGFrZXlkQDE2My5jb20=