 Jing Jiang
 Fei Xing
 Chunyu Wang
 Xiangxiang Zeng
- 1School of Aerospace Engineering, Xiamen University, Xiamen, China
- 2School of Computer Science and Technology, Harbin Institute of Technology, Harbin, China
- 3School of Information Science and Engineering, Xiamen University, Xiamen, China
Rice (Oryza sativa L.) is one of the most important staple foods in the world. It is possible to identify candidate genes associated with rice yield using the model of random walk with restart on a functional similarity network. We demonstrated the high performance of this approach by a five-fold cross-validation experiment, as well as the robustness of the parameter r. We also assessed the strength of associations between known seeds and candidate genes in the light of the results scores. The candidates ranking at the top of the results list were considered to be the most relevant rice yield-related genes. This study provides a valuable alternative for rice breeding and biology research. The relevant dataset and script can be downloaded at the website: http://lab.malab.cn/jj/rice.htm.
Introduction
Rice (Oryza sativa L.) is one of the most important food crops worldwide, being used as the main food source by more than half of the global population (Mahender et al., 2016; Li et al., 2017). In the developing world, rice provides 27% of dietary energy and 20% of dietary protein (Huang et al., 2013). However, despite genetic improvements in grain yield delivered by the exploitation of semi-dwarfism and heterosis over the past 50 years, a substantial increase in grain productivity of the major crops is still required to feed a growing world population (Abe et al., 2018). The prime breeding target is to increase both grain size and grain number, because they impact both on yield potential and its end-use quality (Okada et al., 2018). However, the simultaneous improvement of grain quality and grain yield is a major challenge because of the well-established negative correlation between these two traits which is controlled by quantitative trait loci and influenced by environmental changes. Additionally, determining which genes in quantitative trait loci regulate grain size and number has not been clarified (Borzee et al., 2018; Li et al., 2018). Therefore, the identification genetic variants associated with improvements in grain yield would facilitate the breeding of new high-yielding rice varieties and may also be applicable to other crops (You et al., 2017).
Vast numbers of genetic variants have been detected by traditional genome-wide association studies and recent sequencing studies, and connecting the functional implications of these results to known genes has become a standard task (Li et al., 2015; Dehury et al., 2017; Torres and Henry, 2018; Wu et al., 2018). We previously developed a database, RicyerDB, to collect all known rice yield-related genes by integrating multiple omics data, information from the literature, and associated databases (Jiang et al., 2018). This work also established a search tool to query a particular gene, and to provide insights into gene functions and locations. Any rice yield-related gene can therefore be easily queried and the findings downloaded through the webpage, while candidate genes can be screened and prioritized to identify those most likely to be associated with known genes.
To achieve this goal, several approaches have been proposed from the perspective of computational systems biology (Behroozi-Khazaei and Nasirahmadi, 2017; He et al., 2017; Liu E. et al., 2017; Liu Y. et al., 2017; Xiong et al., 2017; Maione and Barbosa, 2018; Zhang M. et al., 2018; Zhou et al., 2018). For example, the Endeavor tool uses the guilt-by-association principle to rank candidate genes according to their functional similarities to a set of predefined seed genes (Aerts et al., 2006; Tranchevent et al., 2008, 2016). In recent years, a protein–protein interaction (PPI) network has been developed to achieve a global inference of entire genes (Liu et al., 2010; Lee, 2011; Rezadoost et al., 2016; Wang et al., 2016; Zeng et al., 2016; Luo and Liu, 2017; Holland and Johnson, 2018; Vlaic et al., 2018). PPI networks have also been used to provide a simplified yet systematic measure of functional similarities between genes (Chen et al., 2017a, 2018a).
Some methods for identifying yield-related genes have linked profile and sequence technology to facilitate the prediction of related genes. For example, Odilbekov et al. (2018) used machine learning and integrated this analysis with data obtained from spectroradiometer, infrared thermometer, and chlorophyll fluorescence measurements to identify the most predictive proxy measurements for studying Septoria tritici blotch disease of wheat.
Hybrid breeding is an effective tool to improve yield in rice, although parental selection remains a difficult issue. Xu et al. (2018) compared six genomic selection methods, such as least absolute shrinkage and selection operation and support vector machine, to evaluate predictabilities for different methods, and demonstrated their implementation to predict the hybrid performance of rice. Although good results have been achieved by these studies, the techniques of microarray and sequencing are nevertheless expensive.
The main target of this research was to use current knowledge to identify rice yield-related genes with network prediction methods. We proposed a computational systems biology approach for the identification of candidate genes via a random walk model on a PPI network with functional similarities (Kohler et al., 2008). Starting from known nodes, our method simulates the process in which a random walker travels to its neighbors or jumps to itself in the network, scores a gene using the probability that the walker stays in the gene at a steady state, and then ranks candidate genes according to their scores. Using a series of cross-validation experiments, we systematically demonstrated the robustness of our method, and applied our approach to predict a landscape of associations between known genes and candidates.
Materials and Methods
Flowchart Overview
We modeled the problem of identifying candidate genes associated with a set of known genes as a prioritization problem, and proposed to solve this problem using a three-step approach. As shown in Figure 1, taking the set of known genes as input, we first standardized the genes between STRING (Szklarczyk et al., 2015) and RicyerDB (Jiang et al., 2018). Then, we constructed a protein–protein network that scores the edges through functional similarities. This procedure applied a RWR algorithm to the network to calculate a score for each candidate gene, and then ranked the candidates to obtain a ranking list as the output (Chen et al., 2012a,b; Chen, 2016; Chen X. et al., 2016; Li et al., 2016; Peng et al., 2016; Zhu et al., 2018). Finally, the top candidate gene was verified according to its function and by the published literature.
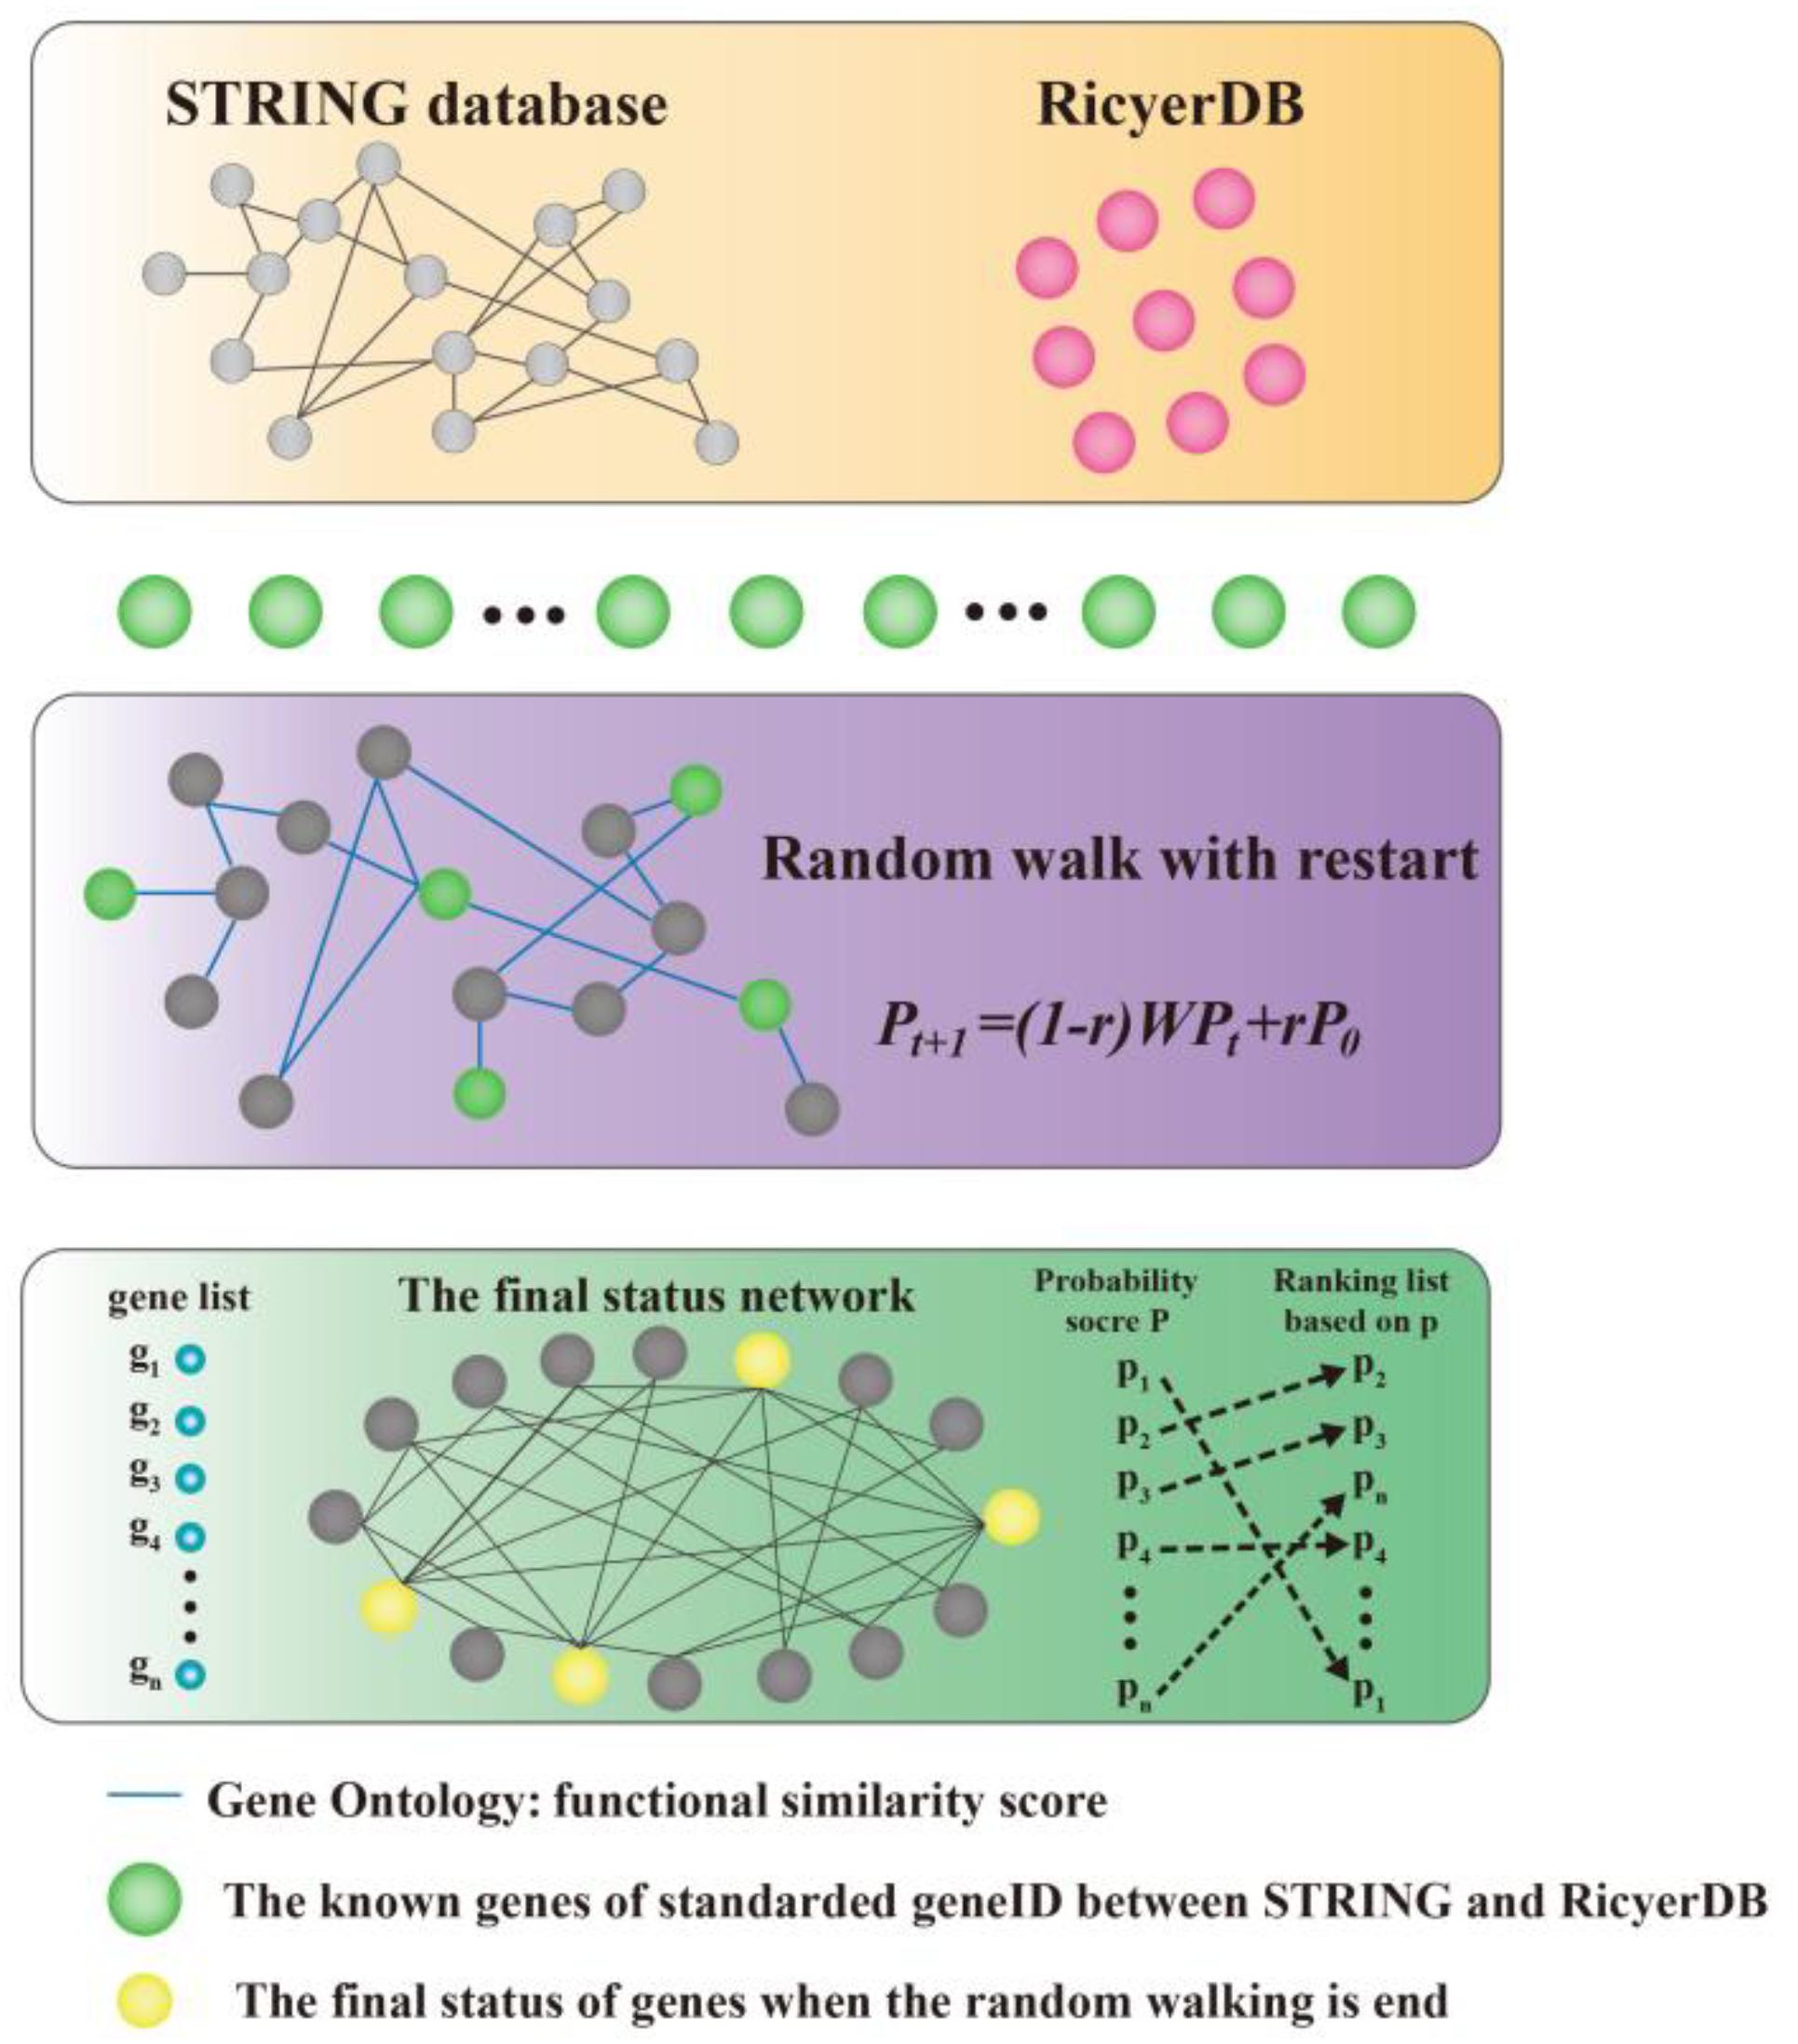
FIGURE 1. Illustration of the proposed method. Our method takes a set of seed genes as the input, and gives a ranking list of the candidates as the output. A functional similarity network was constructed by applying a random walk with restart algorithm to the network to obtain scores for candidate genes, and then the candidates were ranked according to their scores.
Construction of the Functional Similarity Network
The functional similarity network is described as a graph G = (V, E), where V represents the nodes of the network and E stands for the edges of the network. The background network comes from the STRING database because of existing potential associated interactions among the proteins. The known rice yield-related genes were identified from our previous work with RicyerDB (Jiang et al., 2018). To standardize gene names between STRING and RicyerDB, genes were retrieved by reference to National Center for Biotechnology Information gene names. Functional similarities among genes in the background network were considered by scoring E for GO annotations. Using the latest release of the GO database (Ashburner et al., 2000; Chen L. et al., 2016; Raza, 2016; The Gene Ontology, 2017), edges were scored for a shared functional significance score of genes in the network that were annotated with GO terms.
The shared functional significance score F(i,j) between gene i and j was measured by the Weighted Shared Functions approach, which considered a gene’s functions as a set of functional categories in GO. The functions shared by a small number of genes are taken to be far more significant than ones shared by a large number of genes. Each function had its own significance, which was defined as the inverse number of genes sharing the function. When two genes, i and j, have m functions in common, i.e., F(i)∩F(j) = (f1, f2, …, fm), F(i,j) was given as the total sum of the significance of the functions shared between them as follows:
Here sig(fn) denotes the significance of a function fn(n = 1,2,..., m) shared between genes i and j, | Genes (fn)| is the number of genes sharing a function fn. We calculated the ranking score, p, for each gene in the disease-related network and ranked these genes in the descending order of p.
Random Walking on the Functional Similarity Network
We achieved the goal of identifying candidates related to known seeds by calculating a score for each candidate and then ranking the candidates to obtain a ranking list. The higher the rank, the more likely the gene was to be related to the given source nodes. For this purpose, we adapted the RWR method in the functional similarity network.
At the beginning, the walker chooses the seeds as the starting point. In each step of the walking process, the walker may start on a new journey with probability r or move on with probability 1−r. When moving on, the walker may move at random to one of its direct neighbors.
In our application, the initial probability vector P0 was constructed such that equal probabilities were assigned to the nodes representing members of the disease, with the sum of the probabilities equal to 1. This is equivalent to letting the random walker begin from each of the known disease genes with equal probability. The transition matrix W is the column-normalized adjacency matrix of the graph, and Pt is a vector in which the ith element holds the probability of being at node i at time step t. Formally, the RWR is defined as:
Candidate genes were ranked according to the values in the steady-state probability vector P. P vector changes with time t, while it is possible to obtain it by explicitly calculating Equation (1) until convergence. The iteration is finished when the change between Pt and Pt+1 falls below 10−10. In this paper, we set default values for parameters r = 0.3 (see Results section for details).
Validation Method
We adopted a five-fold cross-validation experiment to assess the capability of RWR to identify the left seeds. All seed genes were divided equally into five parts, then one part was removed as a test set, and added to the candidate genes. All candidate genes were ranked by RWR to determine the ranking of the test gene. This procedure was repeated until all seed genes were used up as test genes.
In the context of the functional similarity network, the above validation procedure was equivalent to removing one part of the seed genes to candidate genes and determining whether candidates containing these seeds could receive a high rank. The r parameter of RWR ranged from [0,1] and was used to identify the ranking of the five parts. ROC curves were plotted, and areas under the ROC curve (AUC) values were used to evaluate the performance of r.
Results
Data Sources
We obtained the rice background protein–protein network from the STRING database. In the network, protein associations were either directly derived from physical interactions or functional links from experimental evidence and computational methods (Jensen et al., 2009). The network composes of 6561 nodes and 567034 edges, which represent proteins and interactions between them, respectively. In our study, 136 known genes were selected as seed genes and other genes as candidate genes. We downloaded O. sativa Japonica protein network data through STRING version 10.5 (Szklarczyk et al., 2015).
Proteins with accurate functional annotations are vital to biological research. We obtained functional annotation information from the GO Consortium (Ashburner et al., 2000), and downloaded GO annotations of O. sativa from the most recent GO version. GO enrichment analysis is used to interpret high-throughput molecular data. GO annotation is the list of all annotated genes linked to ontological terms describing those genes.
The RicyerDB database integrates publicly available resources to construct a public platform for browsing and the interactive visualization of yield-related genes. The first release of RicyerDB contained more than 400 manually curated gene information entries which were all associated with rice yield.
Performance of the Proposed Method
The score vector P (the probability of being at the current node) for all genes in the network was calculated based on the ranking of corresponding r coefficients. Candidate genes were then ranked in the descending order of P score.
For optimal parameters, genes were also ranked according to the calculated p scores with nine different r-values (r = 0.1, 0.2, 0.3, 0.4, 0.5, 0.6, 0.7, 0.8, and 0.9). The matching numbers of the five-part seed genes were applied to assess the effectiveness of RWR. In Figure 2 listed the five cases of all, the number of matched seeds among the top 500 (every 100 is a measurement cutoff) in the ranking list of r = 0.3 was higher than other r-values in most cases.
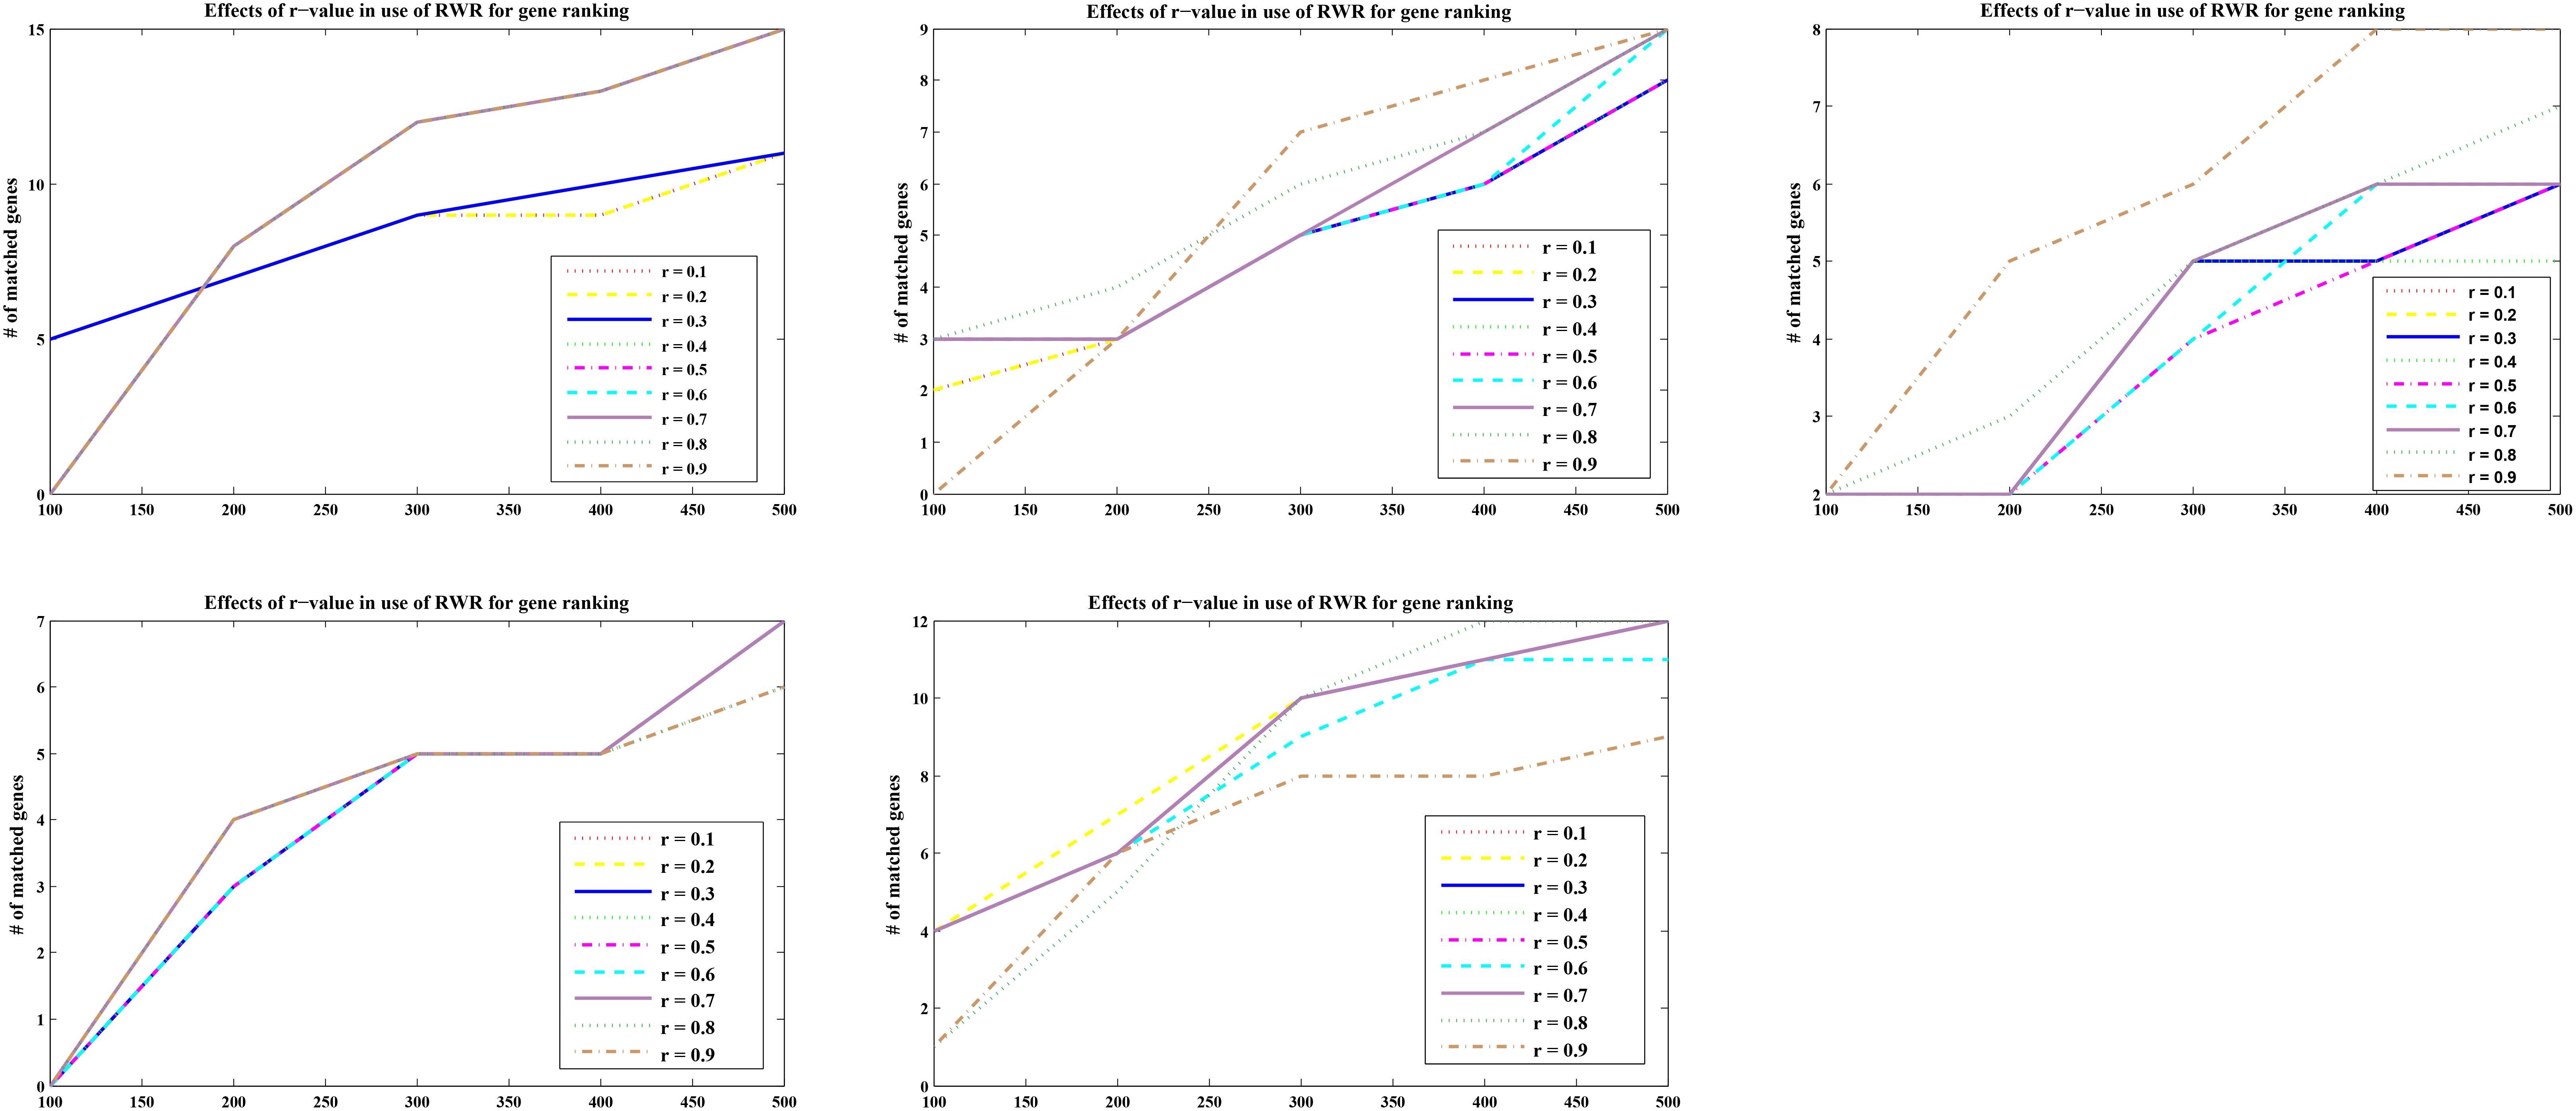
FIGURE 2. Five-fold cross validation of the parameter r in RWR. The abscissa represents the top 500 ranking positions, and the ordinate represents the number of matching seed nodes.
The sum of the numbers of matched seed nodes in all ranking results was determined, and r = 0.3 was shown to have the maximum match in general. Finally, the parameter r = 0.3 was selected to calculate vector P to obtain the ranking results. Further to detect the robustness of parameter r, we repeated the five-fold cross validation 100 times. Then we applying statistical analysis to compare the ranking of all seeds at different r-values in our model, the results were shown as Figure 3.
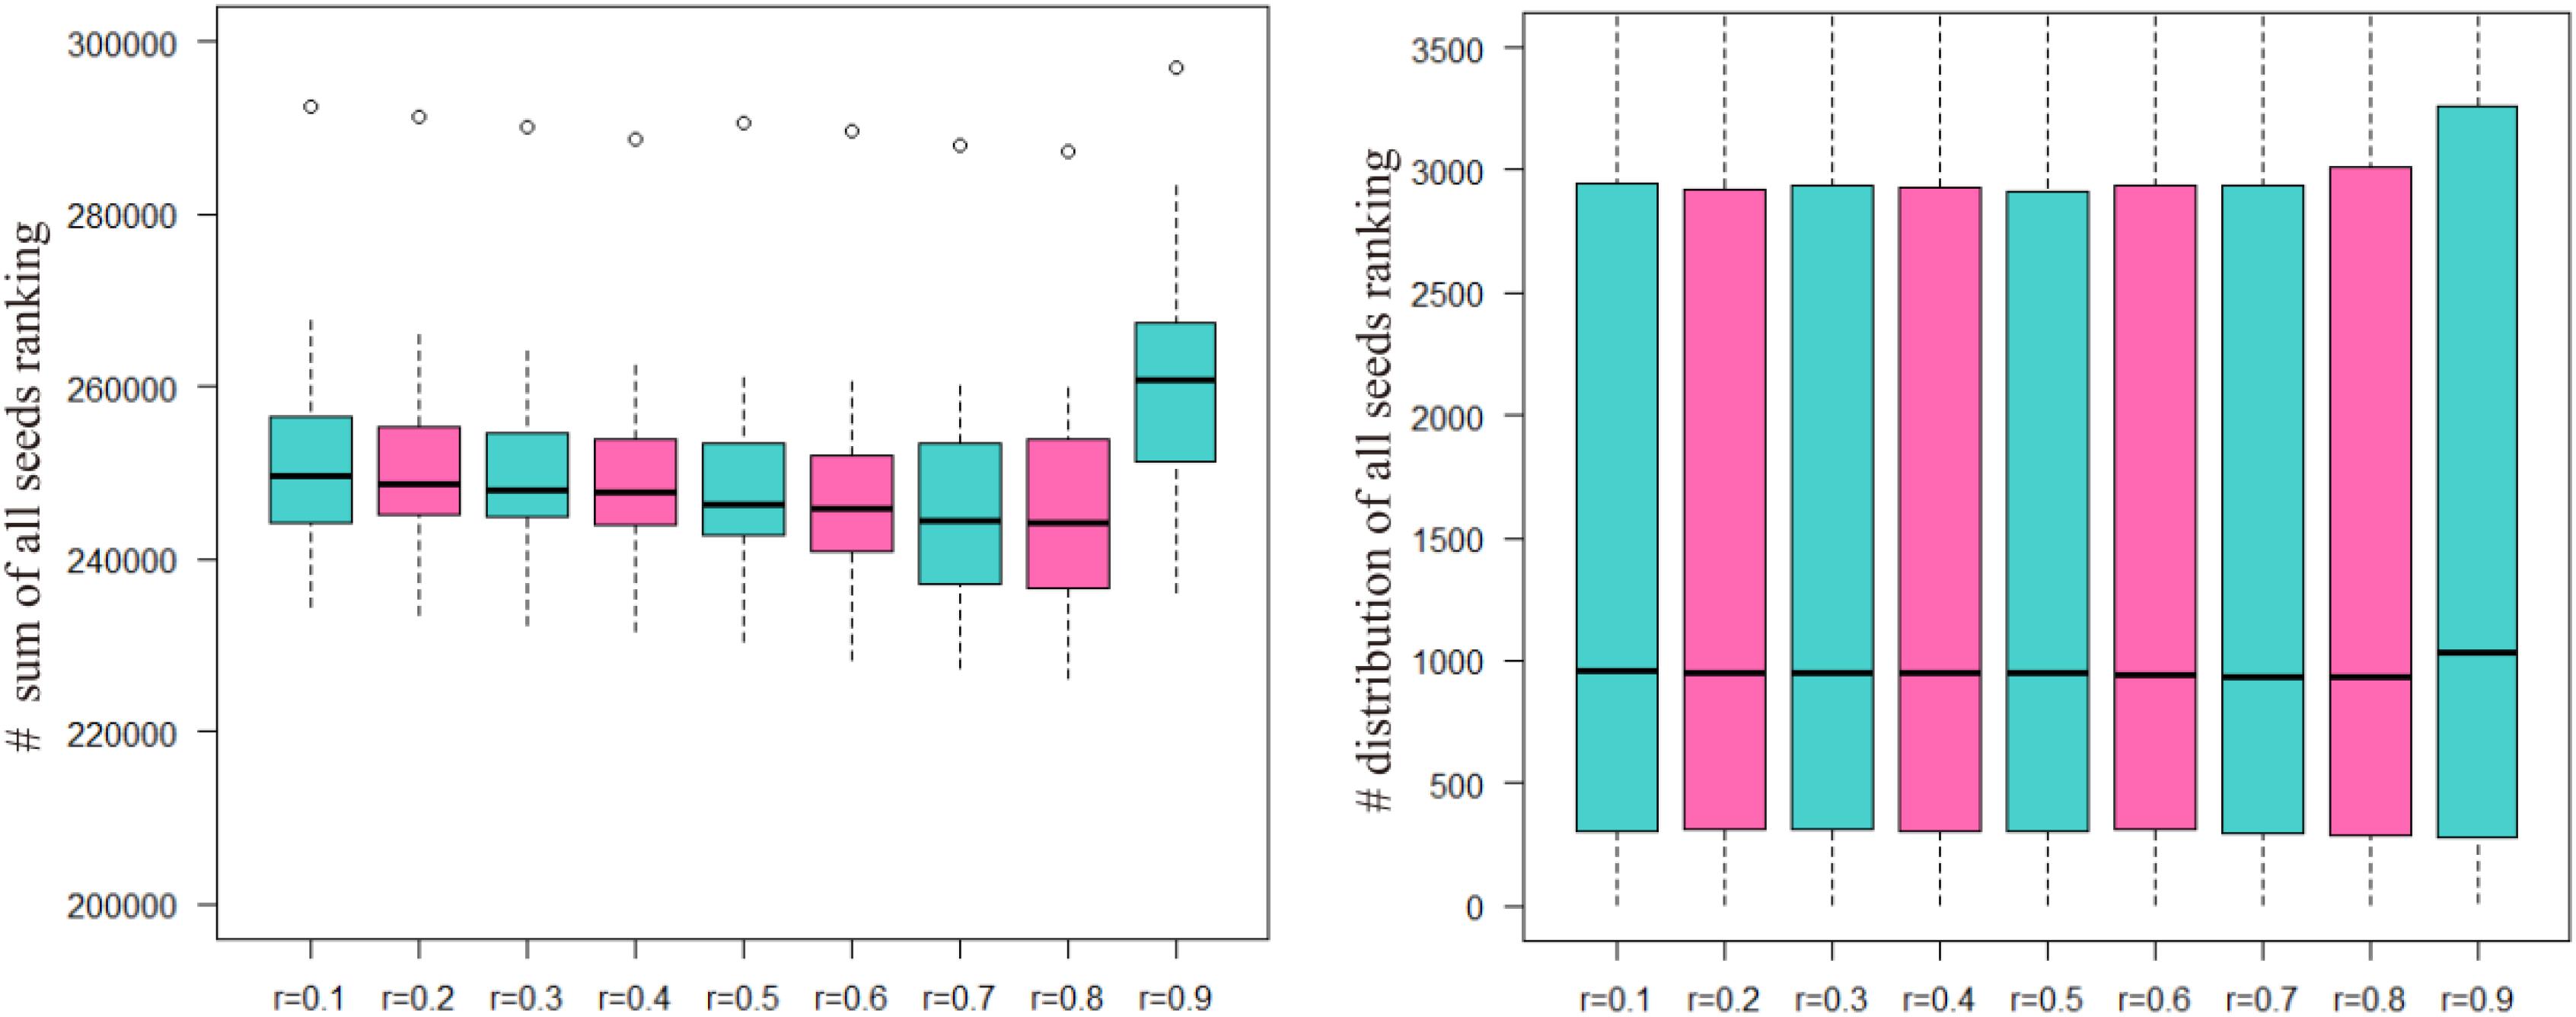
FIGURE 3. The ranking of all seeds in different r-values after 100 times fivefold cross validation. The number of ordinate in left part presents the sum of all seeds ranking and in right part presents the ranking position of all seeds.
Prioritization of Candidate Genes and Validation by Literature Review
In the functional similarity network, all candidate genes were prioritized by RWR according to vector P at the final status. We manually searched the 100 top candidate genes (Table 1) in PubMed1 for their association with yield. This verified eight candidate genes associated with rice production. The LOC_Os11g40150 (rank 39) alias is OsRad51A1, which is a key component of homologous recombination in DNA repair. Direct interaction with OsNAC14 recruits factors involved in DNA damage repair and defense response, resulting in an improved tolerance to drought (Shim et al., 2018). LOC_Os04g37619 (rank 11) named ZEP, which is one of the key genes that involved hormone abscisic acid biosynthesis in rice by ion beam. Irritation can enhance the expression of genes involved in ABA biosynthesis, resulting in increasing content of endogenous plant hormone abscisic acid in rice (Chen et al., 2014).
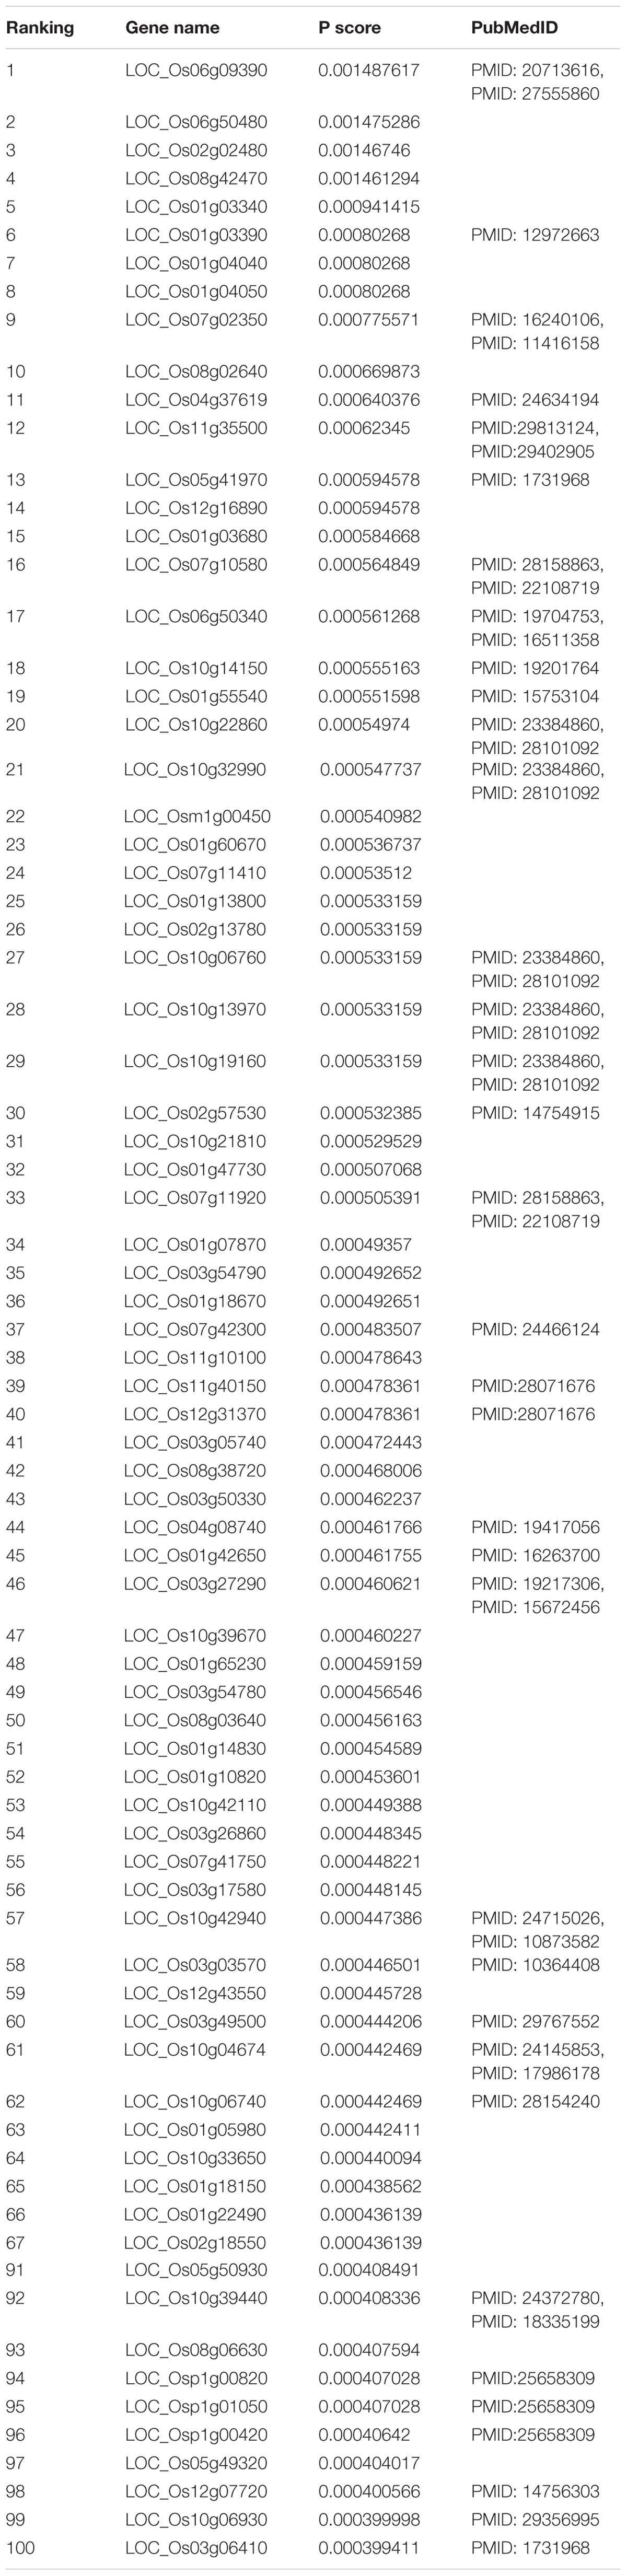
TABLE 1. The top 100 candidate genes in the ranking list.
Taken together, of the top 100 candidate genes in the ranking list, 46 candidate genes predicted by our method had been confirmed to be correlated with rice yield in PubMed literature (Table 1). Top-ranked candidates were found to have a high confirmation rate in terms of their association with rice yield, especially top 20 candidates (Table 2).
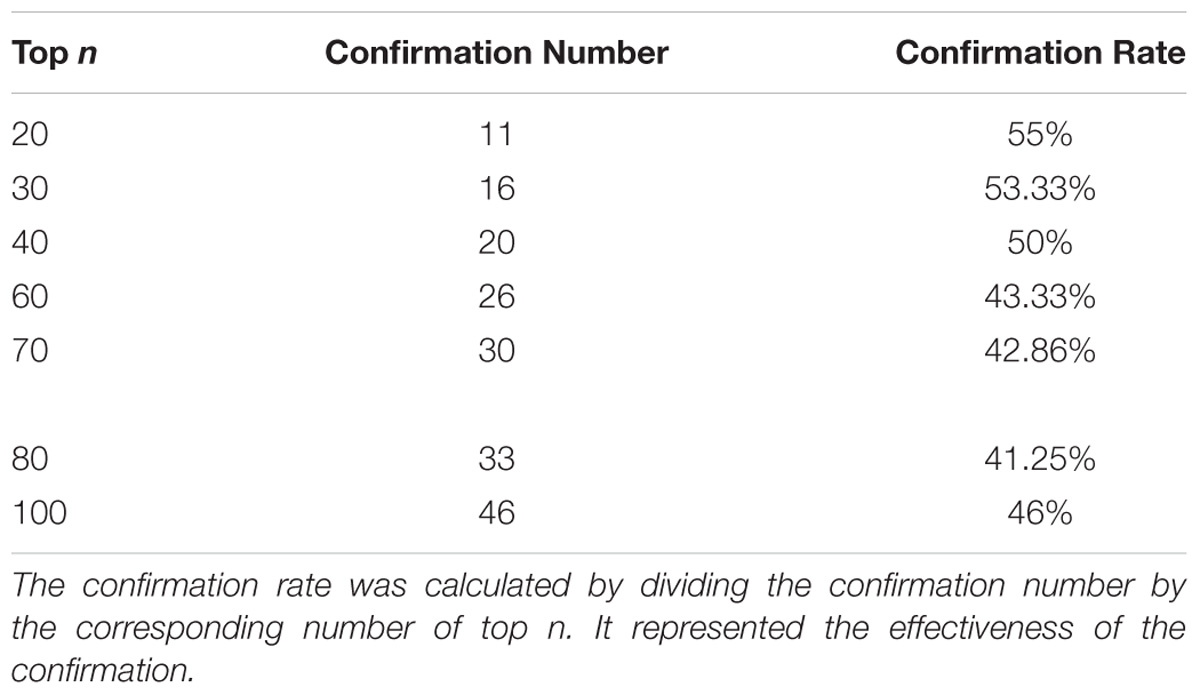
TABLE 2. The confirmation rate of top 100 candidate genes in the ranking list.
We conducted GO analysis to assess the functional enrichment of the top 100 candidate genes (Figure 4). The GO term having the most candidates annotated to was GO: 0005524 ∼ ATP binding, which is a binding motif within the primary structure of an ATP binding protein. A recently identified rice ATP binding cassette plays multiple roles in plant growth, development and environmental stress responses (Zhang X.D. et al., 2018). ATP binding has also been shown to play an important role in rice development (Coneva et al., 2014; Zhao et al., 2015; Chang et al., 2016; Lei et al., 2018).
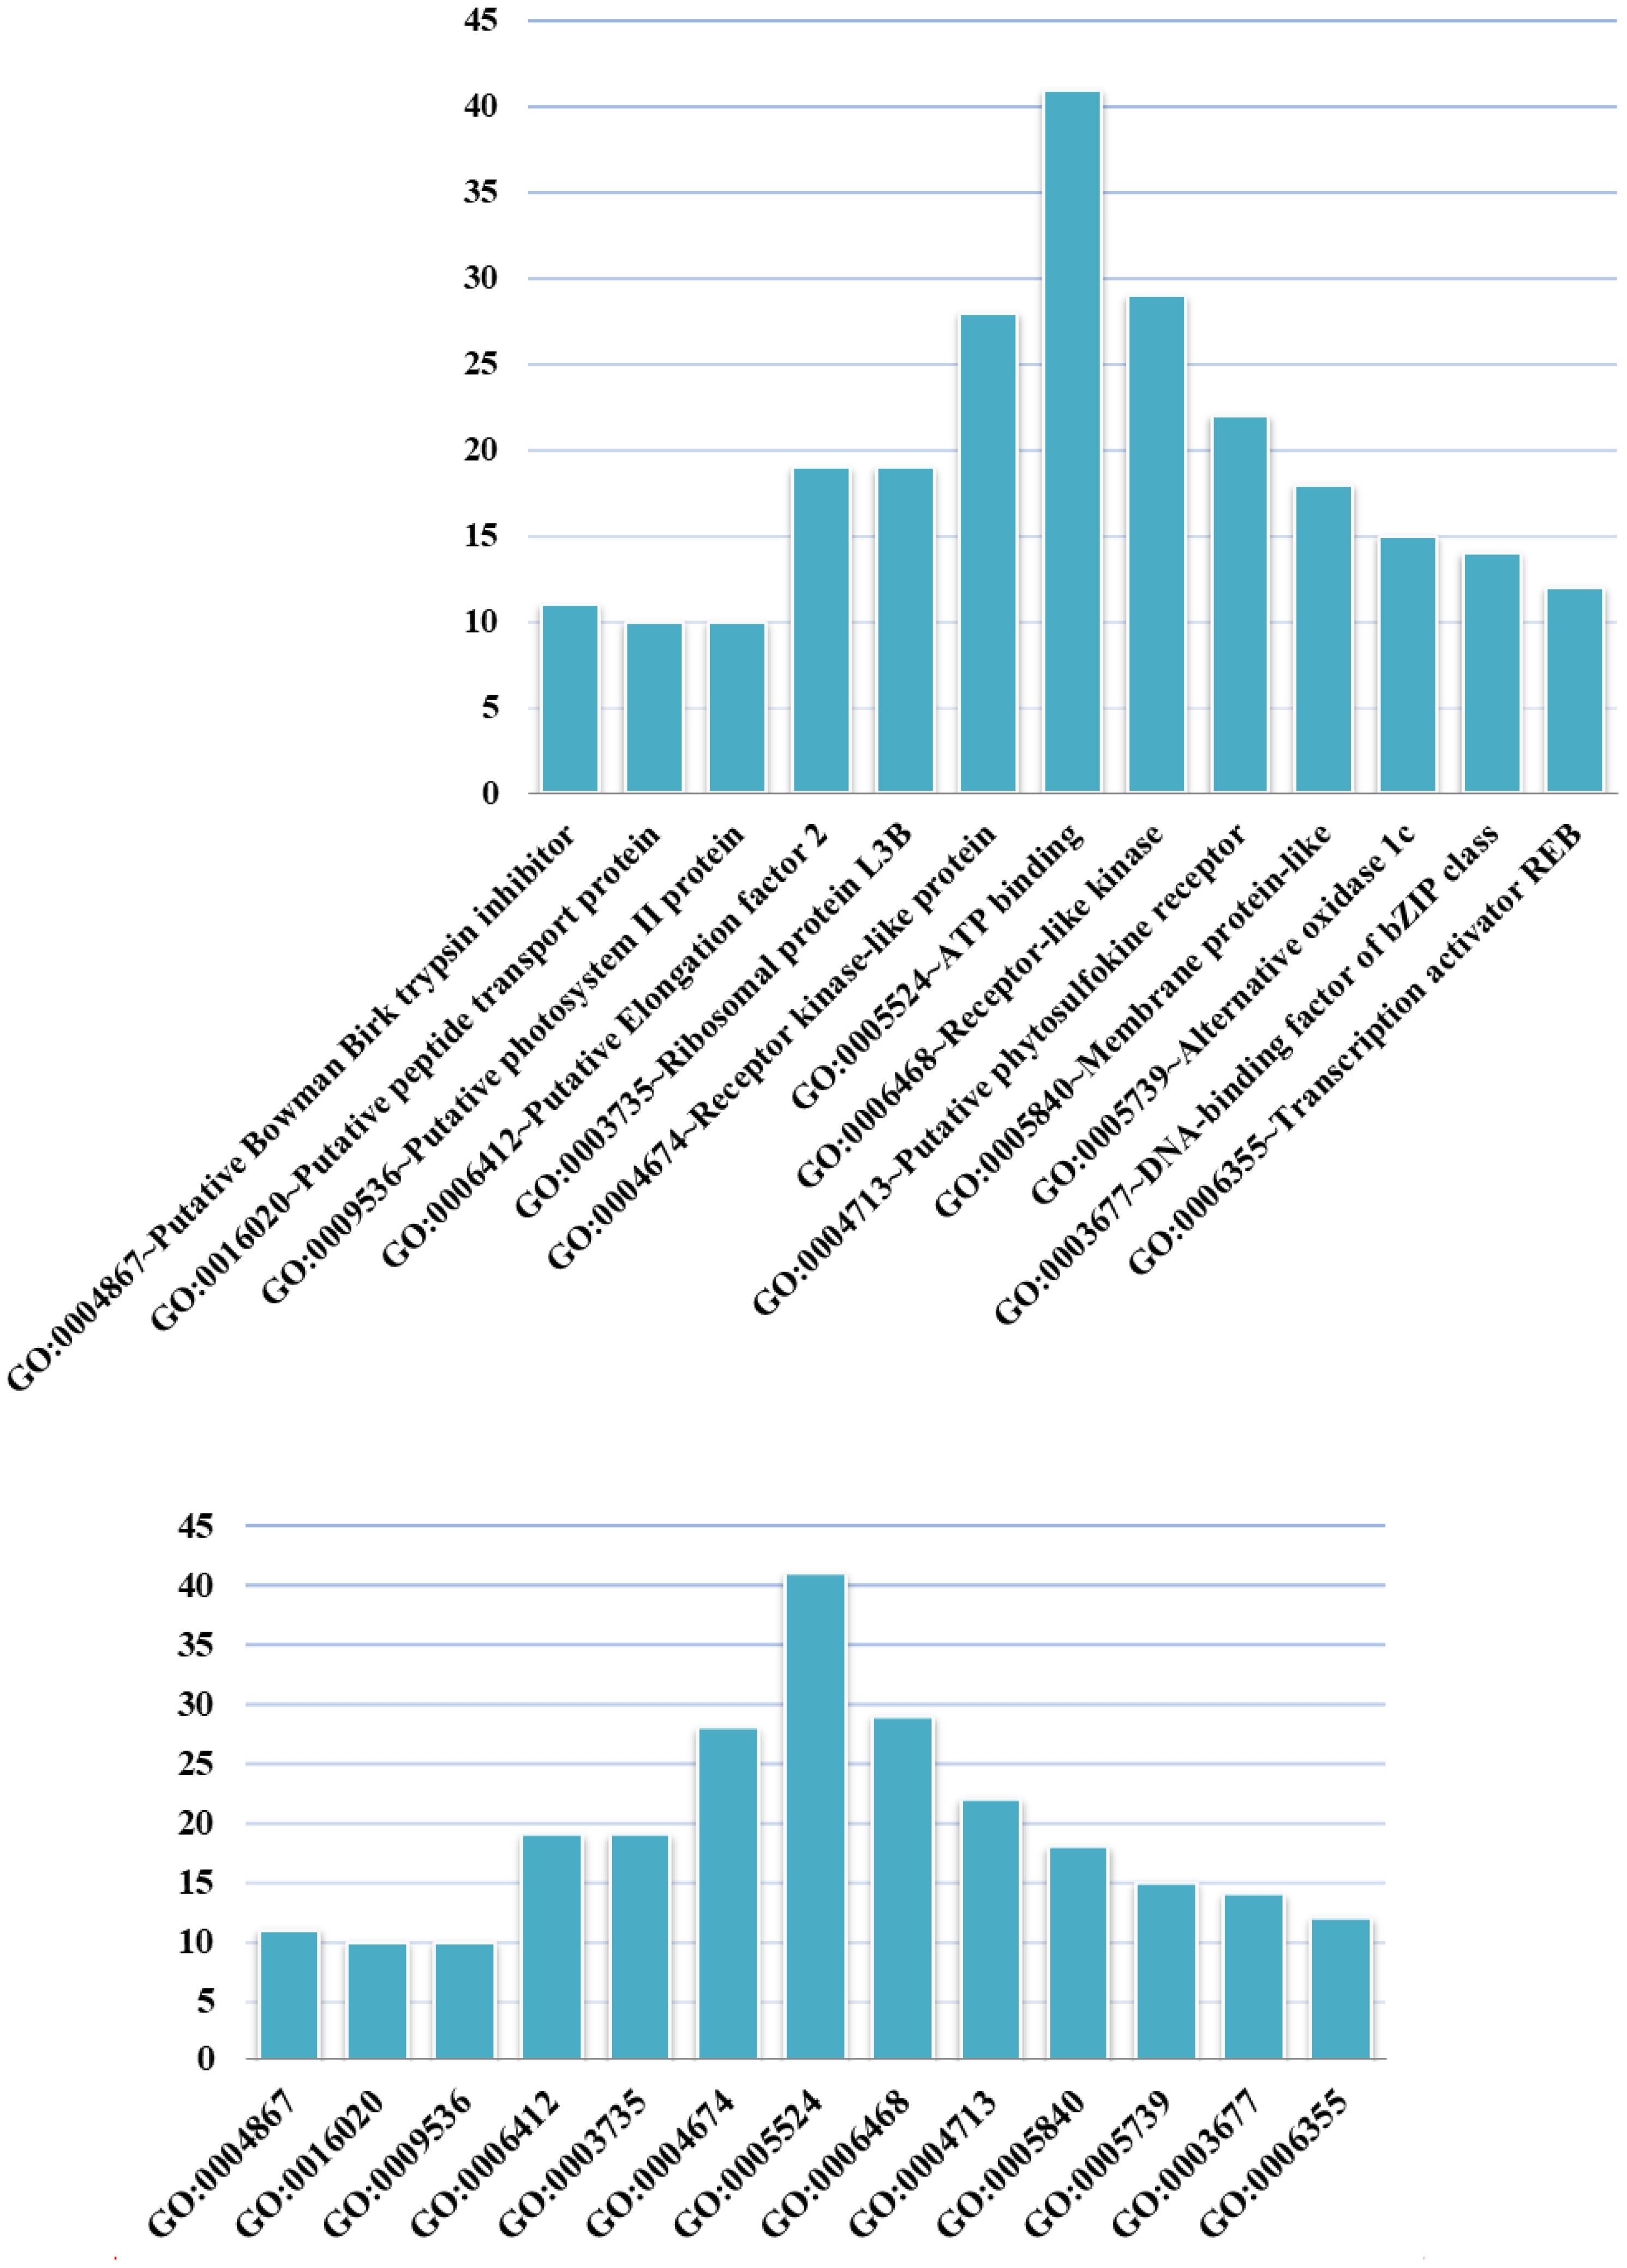
FIGURE 4. GO terms in which the top 100 candidate genes are enriched. The abscissa shows GO terms, and the ordinate represents the number of GO terms.
Discussion
In the present study, we identified genes associated with rice yield using the RWR method on a functional similarity network. We demonstrated the high performance of the RWR approach via a five-fold cross-validation experiment and showed the robustness of the parameter r. As an application of the RWR approach, we predicted a landscape of associations between known seeds and candidate genes.
Our work has the following advantages. First, the RWR method can predict associations among known seed genes and candidate genes with the ability to spread the information that known seeds carried via their neighbors. Second, the interaction network provides a systematic view of functional similarities between genes by calculating GO terms. Finally, the robustness of the parameter r leads to a high level of accuracy in making predictions, and the method that achieving parameter can be adapted to other dataset.
Rice is the most important food crop worldwide. Use of the RWR method in the function similarity network can identify candidate genes associated with known rice yield-related genes, while gene ranking saves experimental time in the exploitation of rice as a major crop. Future development of our research will include the collection of more rice yield-related genes via online databases and the analysis of literature. Subsequent accurate analysis involving an effective prediction algorithm will enable the prediction of novel genes that can boost rice yield. In the future, we would further develop computational models for the identification and analysis of rice yield-related microRNAs/Long non-coding RNAs based on Chen et al.’s researches (Chen and Yan, 2013; Chen and Huang, 2017; Chen et al., 2017b, 2018b).
Author Contributions
CW designed the research. XZ performed the research. FX analyzed the data. JJ wrote the manuscript. All authors read and approved the manuscript.
Funding
The work was supported by the Natural Science Foundation of China (Nos. 91735306, 61872114, and 61872309).
Conflict of Interest Statement
The authors declare that the research was conducted in the absence of any commercial or financial relationships that could be construed as a potential conflict of interest.
Acknowledgments
We thank Sarah Williams, Ph.D., from Liwen Bianji, Edanz Group China (www.liwenbianji.cn), for editing the English text of a draft of this manuscript.
Abbreviations
AUC, area under the ROC curve; GO, gene ontology; ROC, receiver operating characteristic; RWR, random walk with restart.
Footnotes
References
Abe, K., Oshima, M., Akasaka, M., Konagaya, K. I., Nanasato, Y., Okuzaki, A., et al. (2018). Development and characterization of transgenic dominant male sterile rice toward an outcross-based breeding system. Breed. Sci. 68, 248–257. doi: 10.1270/jsbbs.17090
Aerts, S., Lambrechts, D., Maity, S., Van Loo, P., Coessens, B., De Smet, F., et al. (2006). Gene prioritization through genomic data fusion. Nat. Biotechnol. 24, 537–544. doi: 10.1038/nbt1203
Ashburner, M., Ball, C. A., Blake, J. A., Botstein, D., Butler, H., Cherry, J. M., et al. (2000). Gene ontology: tool for the unification of biology. Gene Ontology Consortium. Nat. Genet. 25, 25–29. doi: 10.1038/75556
Behroozi-Khazaei, N., and Nasirahmadi, A. (2017). A neural network based model to analyze rice parboiling process with small dataset. J. Food Sci. Technol. 54, 2562–2569. doi: 10.1007/s13197-017-2701-x
Borzee, A., Heo, K., and Jang, Y. (2018). Relationship between agro-environmental variables and breeding Hylids in rice paddies. Sci. Rep. 8:8049. doi: 10.1038/s41598-018-26222-w
Chang, Z., Chen, Z., Yan, W., Xie, G., Lu, J., Wang, N., et al. (2016). An ABC transporter, OsABCG26, is required for anther cuticle and pollen exine formation and pollen-pistil interactions in rice. Plant Sci. 253, 21–30. doi: 10.1016/j.plantsci.2016.09.006
Chen, L., Zhang, Y.-H., Zou, Q., placeChu, C., and Ji, Z. (2016). Analysis of the chemical toxicity effects using the enrichment of Gene Ontology terms and KEGG pathways. Biochim. Biophys. Acta Gen. Sub. 1860, 2619–2626. doi: 10.1016/j.bbagen.2016.05.015
Chen, X., You, Z. H., Yan, G. Y., and Gong, D. W. (2016). IRWRLDA: improved random walk with restart for lncRNA-disease association prediction. Oncotarget 7, 57919–57931. doi: 10.18632/oncotarget.11141
Chen, Q. F., Ya, H. Y., Feng, Y. R., and Jiao, Z. (2014). Expression of the key genes involved in ABA biosynthesis in rice implanted by ion beam. Appl. Biochem. Biotechnol. 173, 239–247. doi: 10.1007/s12010-014-0837-y
Chen, X. (2016). miREFRWR: a novel disease-related microRNA-environmental factor interactions prediction method. Mol. Biosyst. 12, 624–633. doi: 10.1039/c5mb00697j
Chen, X., and Huang, L. (2017). LRSSLMDA: laplacian regularized sparse subspace learning for MiRNA-disease association prediction. PLoS Comput. Biol. 13:e1005912. doi: 10.1371/journal.pcbi.1005912
Chen, X., Huang, L., Xie, D., and Zhao, Q. (2018a). EGBMMDA: extreme gradient boosting machine for MiRNA-disease association prediction. Cell Death Dis. 9:3. doi: 10.1038/s41419-017-0003-x
Chen, X., Xie, D., Wang, L., Zhao, Q., You, Z. H., and Liu, H. (2018b). BNPMDA: bipartite network projection for MiRNA-disease association prediction. Bioinformatics 34, 3178–3186. doi: 10.1093/bioinformatics/bty333
Chen, X., Liu, M. X., and Yan, G. Y. (2012a). Drug-target interaction prediction by random walk on the heterogeneous network. Mol. Biosyst. 8, 1970–1978. doi: 10.1039/c2mb00002d
Chen, X., Liu, M. X., and Yan, G. Y. (2012b). RWRMDA: predicting novel human microRNA-disease associations. Mol. Biosyst. 8, 2792–2798. doi: 10.1039/c2mb25180a
Chen, X., Xie, D., Zhao, Q., and You, Z. H. (2017a). MicroRNAs and complex diseases: from experimental results to computational models. Brief Bioinform. doi: 10.1093/bib/bbx130 [Epub ahead of print].
Chen, X., Yan, C. C., Zhang, X., and You, Z. H. (2017b). Long non-coding RNAs and complex diseases: from experimental results to computational models. Brief Bioinform. 18, 558–576. doi: 10.1093/bib/bbw060
Chen, X., and Yan, G. Y. (2013). Novel human lncRNA-disease association inference based on lncRNA expression profiles. Bioinformatics 29, 2617–2624. doi: 10.1093/bioinformatics/btt426
Coneva, V., Simopoulos, C., Casaretto, J. A., El-Kereamy, A., Guevara, D. R., Cohn, J., et al. (2014). Metabolic and co-expression network-based analyses associated with nitrate response in rice. BMC Genomics 15:1056. doi: 10.1186/1471-2164-15-1056
Dehury, B., Behera, S. K., and Negi, S. (2017). Overcoming the limitation of GWAS platforms using systems biology approach. Curr. Bioinform. 12, 156–170. doi: 10.2174/15748936116661604261708
He, Y. H., Liang, X. F., He, S., Yuan, X. C., Wang, Q. C., Cai, W. J., et al. (2017). Circadian clock gene of grass carp (Ctenopharyngodon idellus): genomic structure and tissue expression pattern of period1 gene. Curr. Bioinform. 12, 312–319. doi: 10.2174/1574893611666160527101628
Holland, D. O., and Johnson, M. E. (2018). Stoichiometric balance of protein copy numbers is measurable and functionally significant in a protein-protein interaction network for yeast endocytosis. PLoS Comput. Biol. 14:e1006022. doi: 10.1371/journal.pcbi.1006022
Huang, R., Jiang, L., Zheng, J., Wang, T., Wang, H., Huang, Y., et al. (2013). Genetic bases of rice grain shape: so many genes, so little known. Trends Plant Sci. 18, 218–226. doi: 10.1016/j.tplants.2012.11.001
Jensen, L. J., Kuhn, M., Stark, M., Chaffron, S., Creevey, C., Muller, J., et al. (2009). STRING 8–a global view on proteins and their functional interactions in 630 organisms. Nucleic Acids Res. 37, D412–D416. doi: 10.1093/nar/gkn760
Jiang, J., Xing, F., Zeng, X. X., and Zou, Q. (2018). RicyerDB: a database for collecting rice yield-related genes with biological analysis int. J. Biol. Sci. 14, 965–970. doi: 10.7150/ijbs.23328
Kohler, S., Bauer, S., Horn, D., and Robinson, P. N. (2008). Walking the interactome for prioritization of candidate disease genes. Am. J. Hum. Genet. 82, 949–958. doi: 10.1016/j.ajhg.2008.02.013
Lee, I. (2011). Probabilistic functional gene societies. Prog. Biophys. Mol. Biol. 106, 435–442. doi: 10.1016/j.pbiomolbio.2011.01.003
Lei, L., Chen, J., Liu, Y., Wang, L., Zhao, G., and Chen, Z. Y. (2018). Dietary wheat bran oil is equally as effective as rice bran oil in reducing plasma cholesterol. J. Agric. Food Chem. 66, 2765–2774. doi: 10.1021/acs.jafc.7b06093
Li, F., Xie, J., Zhu, X., Wang, X., Zhao, Y., Ma, X., et al. (2018). Genetic basis underlying correlations among growth duration and yield traits revealed by GWAS in rice (Oryza sativa L.). Front. Plant Sci. 9:650. doi: 10.3389/fpls.2018.00650
Li, J., Li, H. Y., Zhi, J. K., Shen, C. Z., Yang, X. S., and Xu, J. C. (2017). Codon usage of expansin genes in Populus trichocarpa. Curr. Bioinform. 12, 452–461. doi: 10.2174/1574893611666161008195145
Li, M., Zheng, R. Q., Li, Q., Wang, J. X., Wu, F. X., and Zhang, Z. H. (2016). Prioritizing disease genes by using search engine algorithm. Curr. Bioinform. 11, 195–202. doi: 10.2174/1574893611666160125220905
Li, P., Guo, M., Wang, C., Liu, X., and Zou, Q. (2015). An overview of SNP interactions in genome-wide association studies. Brief. Funct. Genomics 14, 143–155. doi: 10.1093/bfgp/elu036
Liu, E., Zeng, S., Chen, X., Dang, X., Liang, L., Wang, H., et al. (2017). Identification of putative markers linked to grain plumpness in rice (Oryza sativa L.) via association mapping. BMC Genet. 18:89. doi: 10.1186/s12863-017-0559-6
Liu, Y., Zeng, X., He, Z., and Zou, Q. (2017). Inferring MicroRNA-disease associations by random walk on a heterogeneous network with multiple data sources. Ieee Acm Trans. Comput. Biol. Bioinform. 14, 905–915. doi: 10.1109/tcbb.2016.2550432
Liu, X., Tang, W. H., Zhao, X. M., and Chen, L. (2010). A network approach to predict pathogenic genes for Fusarium graminearum. PLoS One 5:e13021. doi: 10.1371/journal.pone.0013021
Luo, J. W., and Liu, C. C. (2017). An effective method for identifying functional modules in dynamic PPI networks. Curr. Bioinform. 12, 66–79. doi: 10.2174/1574893611666160831113726
Mahender, A., Anandan, A., Pradhan, S. K., and Pandit, E. (2016). Rice grain nutritional traits and their enhancement using relevant genes and QTLs through advanced approaches. Springerplus 5:2086. doi: 10.1186/s40064-016-3744-6
Maione, C., and Barbosa, R. M. (2018). Recent applications of multivariate data analysis methods in the authentication of rice and the most analyzed parameters: a review. Crit. Rev. Food Sci. Nutr. doi: 10.1080/10408398.2018.1431763 [Epub ahead of print]. doi: 10.1080/10408398.2018.1431763
Odilbekov, F., Armoniene, R., Henriksson, T., and Chawade, A. (2018). Proximal phenotyping and machine learning methods to identify Septoria Tritici blotch disease symptoms in wheat. Front. Plant Sci. 9:685. doi: 10.3389/fpls.2018.00685
Okada, S., Onogi, A., Iijima, K., Hori, K., Iwata, H., Yokoyama, W., et al. (2018). Identification of QTLs for rice grain size using a novel set of chromosomal segment substitution lines derived from Yamadanishiki in the genetic background of Koshihikari. Breed. Sci. 68, 210–218. doi: 10.1270/jsbbs.17112
Peng, W., Wang, J. X., Zhang, Z., and Wu, F. X. (2016). Applications of random walk model on biological networks. Curr. Bioinform. 11, 211–220. doi: 10.2174/1574893611666160223200823
Raza, K. (2016). Reconstruction, topological and gene ontology enrichment analysis of cancerous gene regulatory network modules. Curr. Bioinform. 11, 243–258. doi: 10.2174/1574893611666160115212806
Rezadoost, H., Karimi, M., and Jafari, M. (2016). Proteomics of hot-wet and cold-dry temperaments proposed in Iranian traditional medicine: a network-based Study. Sci. Rep. 6:30133. doi: 10.1038/srep30133
Shim, J. S., Oh, N., Chung, P. J., Kim, Y. S., Choi, Y. D., and Kim, J. K. (2018). Overexpression of OsNAC14 improves drought tolerance in rice. Front. Plant Sci. 9:310. doi: 10.3389/fpls.2018.00310
Szklarczyk, D., Franceschini, A., Wyder, S., Forslund, K., Heller, D., Huerta-Cepas, J., et al. (2015). STRING v10: protein-protein interaction networks, integrated over the tree of life. Nucleic Acids Res. 43, D447–D452. doi: 10.1093/nar/gku1003
The Gene Ontology, C. (2017). Expansion of the gene ontology knowledgebase and resources. Nucleic Acids Res. 45, D331–D338. doi: 10.1093/nar/gkw1108
Torres, R. O., and Henry, A. (2018). Yield stability of selected rice breeding lines and donors across conditions of mild to moderately severe drought stress. Field Crops Res. 220, 37–45. doi: 10.1016/j.fcr.2016.09.011
Tranchevent, L. C., Ardeshirdavani, A., ElShal, S., Alcaide, D., Aerts, J., Auboeuf, D., et al. (2016). Candidate gene prioritization with endeavour. Nucleic Acids Res. 44, W117–W121. doi: 10.1093/nar/gkw365
Tranchevent, L. C., Barriot, R., Yu, S., Van Vooren, S., Van Loo, P., Coessens, B., et al. (2008). ENDEAVOUR update: a web resource for gene prioritization in multiple species. Nucleic Acids Res. 36, W377–W384. doi: 10.1093/nar/gkn325
Vlaic, S., Conrad, T., Tokarski-Schnelle, C., Gustafsson, M., Dahmen, U., Guthke, R., et al. (2018). ModuleDiscoverer: identification of regulatory modules in protein-protein interaction networks. Sci. Rep. 8:433. doi: 10.1038/s41598-017-18370-2
Wang, F., Song, B. X., Zhao, X., Miao, Y. T., Li, D. Y., Zhou, N., et al. (2016). Prediction and analysis of the protein-protein interaction networks for chickens, cattle, dogs, horses and rabbits. Curr. Bioinform. 11, 131–142. doi: 10.2174/1574893611666151203221255
Wu, T. Y., Gruissem, W., and Bhullar, N. K. (2018). Targeting intra-cellular transport combined with efficient uptake and storage significantly increases grain iron and zinc levels in rice. Plant Biotechnol. J. doi: 10.1111/pbi.12943 [Epub ahead of print].
Xiong, X., Duan, L., Liu, L., Tu, H., Yang, P., Wu, D., et al. (2017). Panicle-SEG: a robust image segmentation method for rice panicles in the field based on deep learning and superpixel optimization. Plant Methods 13:104. doi: 10.1186/s13007-017-0254-7
Xu, Y., Wang, X., Ding, X., Zheng, X., Yang, Z., Xu, C., et al. (2018). Genomic selection of agronomic traits in hybrid rice using an NCII population. Rice 11:32. doi: 10.1186/s12284-018-0223-4
You, Z. H., Huang, Z. A., Zhu, Z., Yan, G. Y., Li, Z. W., Wen, Z., et al. (2017). PBMDA: a novel and effective path-based computational model for miRNA-disease association prediction. PLoS Comput. Biol. 13:e1005455. doi: 10.1371/journal.pcbi.1005455
Zeng, J., Li, D., Wu, Y., Zou, Q., and Liu, X. (2016). An empirical study of features fusion techniques for protein-protein interaction prediction. Curr. Bioinform. 11, 4–12. doi: 10.2174/1574893611666151119221435
Zhang, M., Li, J., Chen, F., and Kong, Q. (2018). Unary non-structural fertilizer response model for rice crops and its field experimental verification. Sci. Rep. 8:2792. doi: 10.1038/s41598-018-21163-w
Zhang, X. D., Zhao, K. X., and Yang, Z. M. (2018). Identification of genomic ATP binding cassette (ABC) transporter genes and Cd-responsive ABCs in Brassica napus. Gene 664, 139–151. doi: 10.1016/j.gene.2018.04.060
Zhao, G., Shi, J., Liang, W., Xue, F., Luo, Q., Zhu, L., et al. (2015). Two ATP binding cassette G transporters, rice ATP binding cassette G26 and ATP Binding cassette G15, collaboratively regulate rice male reproduction. Plant Physiol. 169, 2064–2079. doi: 10.1104/pp.15.00262
Zhou, X., Bai, X., and Xing, Y. (2018). A rice genetic improvement boom by next generation sequencing. Curr. Issues Mol. Biol. 27, 109–126. doi: 10.21775/cimb.027.109
Keywords: rice, yield, random walking, function, network
Citation: Jiang J, Xing F, Wang C and Zeng X (2018) Identification and Analysis of Rice Yield-Related Candidate Genes by Walking on the Functional Network. Front. Plant Sci. 9:1685. doi: 10.3389/fpls.2018.01685
Received: 28 June 2018; Accepted: 30 October 2018;
Published: 20 November 2018.
Edited by:
Arun Kumar Sangaiah, VIT University, IndiaCopyright © 2018 Jiang, Xing, Wang and Zeng. This is an open-access article distributed under the terms of the Creative Commons Attribution License (CC BY). The use, distribution or reproduction in other forums is permitted, provided the original author(s) and the copyright owner(s) are credited and that the original publication in this journal is cited, in accordance with accepted academic practice. No use, distribution or reproduction is permitted which does not comply with these terms.
*Correspondence: Chunyu Wang, Y2h1bnl1QGhpdC5lZHUuY24= Xiangxiang Zeng, eHplbmdAeG11LmVkdS5jbg==