 George Vandemark
 Samadhi Thavarajah
 Niroshan Siva
 Dil Thavarajah
- 1Grain Legume Genetics and Physiology Research Unit, Washington State University, Pullman, WA, United States
- 2Plant and Environmental Sciences, Clemson University, Clemson, SC, United States
- 3Revelle College, University of California UC San Diego, La Jolla, CA, United States
Prebiotic carbohydrates are compounds that include simple sugars, sugar alcohols, and raffinose family oligosaccharides, which are fermented by gut bacteria and can influence the species profile of the gut microbiome to reduce obesity and weight gain. Prebiotic carbohydrates are also associated with several health benefits including reduced insulin dependence and incidence of colorectal cancer. Although pulse crops such as chickpea have been important sources of nutrition for human diets for thousands of years, relatively little is known about the profiles of prebiotic carbohydrates in pulse crops. The objectives of this study were to characterize the type and concentration of seed prebiotic carbohydrates in 18 kabuli chickpea genotypes grown in 2017 and 2018 in Idaho and Washington, and partition variance components conditioning these nutritional quality traits in chickpea. Genotype effects were significant for fructose, sucrose, raffinose, and kestose. Environment effects were also significant for several carbohydrates. However, year effects were the greatest sources of variance for all carbohydrates. Concentrations of most carbohydrates were significantly greater in 2017, when there was less precipitation during the growing season coupled with greater heat stress during grain filling than in 2018. This may reflect the role of many of these carbohydrates as osmoprotectants produced in response to heat and water stress. Overall, our results suggest that a survey of more genetically diverse plant materials, such as a chickpea ‘mini-core' collection, may reveal genotypes that produce significantly greater concentrations of selected prebiotic carbohydrates and could be used to introduce desirable nutritional traits into adapted chickpea cultivars.
Introduction
Chickpea (Cicer arietinum L.) was one of eight ‘founder crops' domesticated 9,000–11,000 years ago by Neolithic communities in riparian zones along the Tigris and Euphrates rivers in what is now Turkey and Syria (Lev-Yadun et al., 2000). Currently chickpea is the third most important pulse crop in terms of global production, after dry bean (Phaseolus vulgaris L.) and dry pea (Pisum sativum L.), with over 14.7 million Mt produced in 2017 (FAOSTAT, 2019). India is responsible of more than 80% of annual global production with Myanmar, Ethiopia, Turkey, and Pakistan being other major producers (FAOSTAT, 2019).
Chickpeas can be divided into two major classes, ‘kabuli' and ‘desi', based on seed characteristics. Desi chickpeas have a ‘teardrop' shape and tend to be smaller in size and have thicker and darker seed coats than kabuli chickpeas, which have a rounder shape and tend to be larger and lighter in color (Toker, 2009). Desi chickpeas are typically dehulled to remove seed coats and then split and cooked to produce dhal, or are ground to make flour, whereas kabuli chickpeas are usually cooked whole without removing seed coats and then used for salads, canned, or for making edible spreads such as hummus (Yadav et al., 2007).
The first chickpeas grown commercially in the U.S. were large, light colored kabuli chickpeas known as ‘Spanish White', which were grown in the San Joaquin Valley of southern California (Muehlbauer et al., 1982). Chickpea production began to expand in the 1980s to areas of Idaho and Washington where the predominate cropping system was dryland wheat and barley grown in rotation with lentil and pea. Commercial chickpea production in the U.S. consists almost entirely of kabuli chickpeas (Vandemark et al., 2014a). Currently chickpea is an important component of dryland production systems throughout the U.S. Pacific Northwest and Northern Plains. In 2017 more than 240,000 ha of chickpeas were harvested in the U.S. with a production value greater than $200 million (NASS, 2019). In 2017, Washington and Idaho together accounted for approximately 51% of total U.S. chickpea production, while Montana and North Dakota together accounted for approximately 43% of total production (NASS, 2019).
Biofortification, a process by which crop plants have higher concentrations of nutritional factors such as proteins, carbohydrates, or minerals, has been proposed as a way of improving human and animal nutrition (White and Broadley, 2005). Biofortification may be accomplished through management practices, the development of new cultivars with improved nutritional qualities through plant breeding, or a combination of management and genetic approaches (de Benoist et al., 2008). At least three billion people globally suffer from malnutrition caused from dietary deficiencies in iron (Fe) or zinc (Zn) (de Benoist et al., 2008; Wessells and Brown, 2012). Nutritional characterization of chickpea has largely been limited to determining seed concentrations of minerals (Bueckert et al., 2011; Ray et al., 2014; Vandemark et al., 2018) and dietary fiber (Chen et al., 2016). Non-genetic sources of variance including environment, year and their interactions have been found to have greater magnitudes of effect than genetic variance for several important minerals of global concern, including Fe, Mg, and Zn (Ray et al., 2014; Vandemark et al., 2018).
In contrast to health consequences associated with dietary deficiencies, excesses in food consumption, coupled with genetic and environmental factors, have resulted in increases in the global incidence of obesity, coronary artery disease (CAD), and diabetes. Prebiotic carbohydrates are compounds found in many food sources that have been associated with diverse health benefits (Carlson et al., 2018). The definition of ‘prebiotic' in the scientific community has evolved over more than 20 years of discussion and research and is most currently ‘A nondigestible compound that, through its metabolism by microorganisms in the gut, modulates the composition and/or activity of the gut microbiota, thus conferring a beneficial physiologic effect on the host' (Bindels et al., 2015). Prebiotic carbohydrates include the simple sugars glucose and sucrose, several sugar alcohols (SA) including sorbitol and mannitol, fructooligosaccharides (FOS) such as kestose and nystose, and raffinose family oligosaccharides (RFOs), which include raffinose, stachyose, and verbacose (Peterbauer and Richter, 2001). Prebiotic carbohydrates are fermented by gut bacteria and can influence the species profile of the gut microbiome, including increasing concentration of Bifidobacteria sp. that are associated with reduced obesity and weight gain (Schwiertz et al., 2010). Fermentation of prebiotic carbohydrates produces short chain fatty acids (SCFA) that are associated with several health benefits including reduced obesity and insulin dependence (Gao et al., 2009) and protection against development of colorectal cancer (Keku et al., 2015).
Significant genotype, location, and year effects have been detected for seed concentrations of several prebiotic carbohydrates in lentil (Lens culinaris L.), including sorbitol, mannitol, and verbacose (Johnson et al., 2013). However, the effects of genetic and non-genetic sources of variance on seed prebiotic carbohydrate concentrations have not been estimated for chickpea. Understanding these effects is essential for developing new chickpea cultivars that produce seed with higher concentrations of selected prebiotic carbohydrates across different environments. The objectives of this study were to characterize concentrations of seed prebiotic carbohydrates in 18 kabuli chickpea genotypes grown in Washington and Idaho and partition variance components conditioning these nutritional quality traits in chickpea.
Materials and Methods
Plant Materials and Field Trials
This study examined 18 cafe kabuli chickpea entries (Table 1), which included five cultivars, Billy Beans, CDC Frontier, CDC Orion, Royal, and Sierra, and 12 breeding lines. All entries were planted at two locations: Genesee, ID, (46.55° N, 116.92° W), and Pullman, WA (46.73° N, 117.18° W) in both 2017 and 2018. All seeds were treated before planting with fludioxonil (0.56 g kg−1, Syngenta, Greensboro, NC, USA), mefenoxam (0.38 g kg−1, Syngenta) and thiabendazole (1.87 g kg−1, Syngenta) to control fungal diseases, thiamethoxam (0.66 ml kg−1, Syngenta) for insect control, and molybdenum (0.35 g kg−1). Approximately 0.5 g Mesorhizobium ciceri inoculant (1 × 10⁸ CFU g−1; Exceed, Cambridge, MA, USA) was applied to each seed packet one day before planting. Chickpeas were planted at a density of 43 seeds m−2 in a 1.5 m × 6.1 m block (~430,000 seeds ha−1). All yield trials used a randomized complete block design with three replications. Weeds were controlled by a single post-plant/pre-emergence application of metribuzin (0.42 kg ha−1, Bayer Crop Science, Raleigh, NC) and linuron (1.34 kg ha−1, NovaSource, Phoenix, AZ, USA). All plots were exclusively rainfed and no supplemental irrigation was applied. Plots at Pullman were evaluated during the growing season for field traits including days to harvest maturity. Plots were mechanically harvested and seed yield (kg ha−1) determined. Hundred seed weight (HSW) was determined for each entry at Pullman by taking the average weight (g) of 100 seeds from each of three replicate plots.
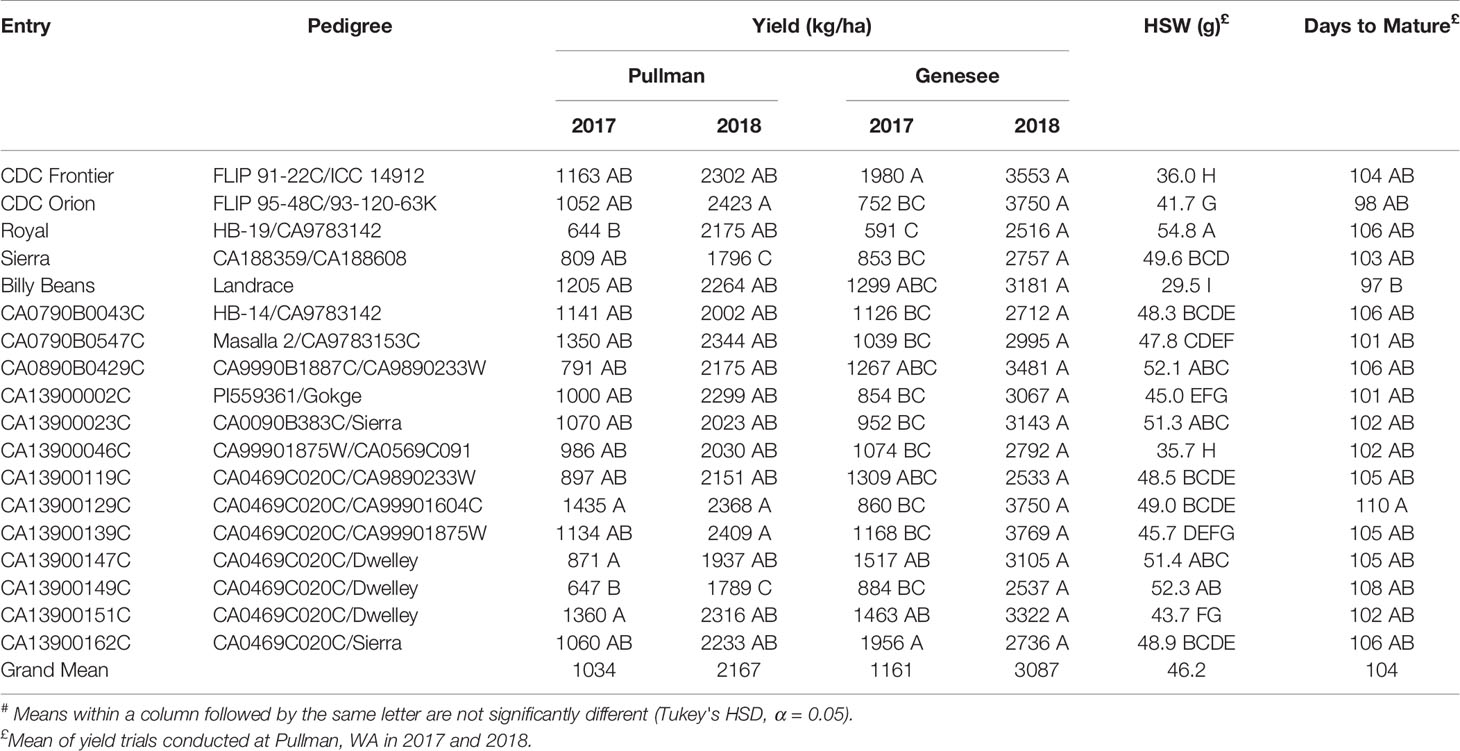
Table 1 Mean# yield, hundred seed weight (HSW) and days to mature for chickpea cultivars and breeding lines grown at Pullman, WA and Genesee, ID in both 2017 and 2018.
Prebiotic Carbohydrates
Ground seed samples (500 mg) were placed in 15-ml polypropylene conical tubes and 10 mL ddH2O was added to each tube, which were incubated for 1 h at 80°C (Muir et al., 2009). Samples were centrifuged at 3,000×g for 10 min. An aliquot (1 ml) of the supernatant was diluted with 9 ml ddH2O, and the diluted supernatant was filtered through a 13 mm × 0.45 µm nylon syringe filter (Fisher Scientific, Waltham, MA, USA) prior to analysis. Prebiotic carbohydrate concentrations (SA, RFO, and FOS) were measured using high performance anion exchange chromatography (HPAE) (Dionex, ICS-5000, Sunnyvale, CA, USA) as previously described (Feinberg et al., 2009; Johnson et al., 2013). SA (sorbitol and mannitol), RFO (raffinose, stachyose, and verbascose), and FOS (kestose) were identified and quantified using pure standards (> 99%), and concentrations were detected within a linear range of 3 to 1,000 μg g−1 with a minimum detection limit of 0.2 μg g−1. A lab reference (CDC Redberry lentil) was used to ensure the accuracy and reproducibility of detection. The peak areas of the external reference, glucose (100 ppm), SA (3–1,000 ppm), RFO (3–1,000 ppm), and FOS (3–1,000 ppm) were routinely analyzed for method consistency and detector sensitivity, with an error of less than 5%.
Resistant Starch
RS concentrations were determined as previously described (McCleary and Monaghan, 2002) using a commercial assay (Megazyme, 2012). Ground samples (500 mg) were incubated with 4 ml of 100 mM sodium malate (pH 6) containing α-amylase (10 mg ml−1) and amyloglucosidase (3 U ml−1) for 16 h in a water bath (37°C) with 200 strokes/min vertical shaking (Orbit shaker bath, Lab Line Instruments Inc., Melrose Park, IL, USA). After incubation, 4 ml of 95% ethanol were added, and the samples were centrifuged at 1,500×g for 10 min at room temperature. The pellets were re-suspended with 6 ml of ethanol (50% v/v), centrifuged, and decanted. The resuspension and centrifugation processes were done twice. Supernatants from the three centrifugations were pooled and brought to a volume of 100 ml in ddH2O. The pellets were dissolved in 2 ml of potassium hydroxide (2 M) in an ice bath (~0°C) while stirring with a magnetic stirrer for 20 min. The suspensions were diluted with 8 ml of sodium acetate buffer (1.2 M, pH 3.8), with 0.1 ml of 3,300 U ml−1 amyloglucosidase then immediately added followed by incubation at 50°C for 30 min. The suspension was then centrifuged at 1,500×g for 10 min at room temperature. Aliquots (0.1 ml) of both the supernatant containing the RS fractions and the diluted washings containing the soluble starch (SS) fractions were transferred separately to 10-ml glass tubes. A reagent blank was prepared using 0.1 ml sodium acetate buffer (pH 4.5). An aliquot (3 ml) of GOPOD reagent was added to each tube, which were incubated in a water bath at 50°C for 20 min. Absorption was measured using a spectrophotometer (Genesys 20, Thermo Scientific, NC, USA) at 510 nm. Starch fractions were calculated as follows:
where Abssample and Absglucose are the absorbance value of sample and glucose corrected against reagent blank, respectively; Wsample is the moisture corrected weight of sample; and X and Y are the dilutions factors for RS and SS, respectively. Regular corn starch (RS concentration 1.0 ± 0.1% (w/w)) was used to verify the data, and batches were checked regularly to ensure an analytical error of less than 10%.
Chemicals
Solvents and standards used for high performance anion exchange chromatography (HPAE) and enzymatic assays were purchased from Fisher Scientific (Asheville, NC, USA), Sigma-Aldrich (St. Louis, MO, USA), and VWR International (Satellite Blvd, Suwanee, GA, USA). Distilled and deionized water (ddH2O; NANO-pure Diamond, Barnstead, IA, USA) was used in these analyses.
Statistical Analysis
Entries (genotypes) were considered fixed factors and locations (environments), replications (blocks) within locations, and years were considered random factors. Combined ANOVA was conducted across both locations and years to detect effects of genotypes, environments, and their interactions. Entry means were compared between all pairs using Tukey's HSD test (α = 0.05). Pairwise correlations were determined between seed carbohydrate concentrations and yield from data combined across both locations and years, and correlations were also determined between carbohydrate concentrations, HSW and days to mature for data obtained at Pullman, WA in 2017 and 2018. All statistical analyses were performed with JMP software (SAS, Cary, NC, USA).
Results
Chickpea Seed Carbohydrate Concentrations
Mean squares of combined analysis of variance for chickpea seed carbohydrate concentrations are presented in Table 2. Genotype effects were significant for fructose, sucrose, raffinose, and kestose. Genotype effects were greatest for the simple sugars fructose and sucrose. Environment effects were also significant for several carbohydrates including sorbitol, glucose, fructose, kestose, and soluble starch. Environment effects were greatest for fructose, soluble starch, and glucose. Year effects were significant for all carbohydrates. Year effects were the greatest sources of variance for all carbohydrates. A significant genotype × environment effect was only observed for fructose. Significant genotype × year effects were observed for fructose and raffinose, however, the magnitudes of these effects were minor in comparison with year effects. Environment × year effects were significant for all carbohydrates except sucrose, verbacose, and soluble starch. The greatest interaction effect for all carbohydrates was the environment × year effect. A significant genotype × environment × year effect was only observed for fructose.
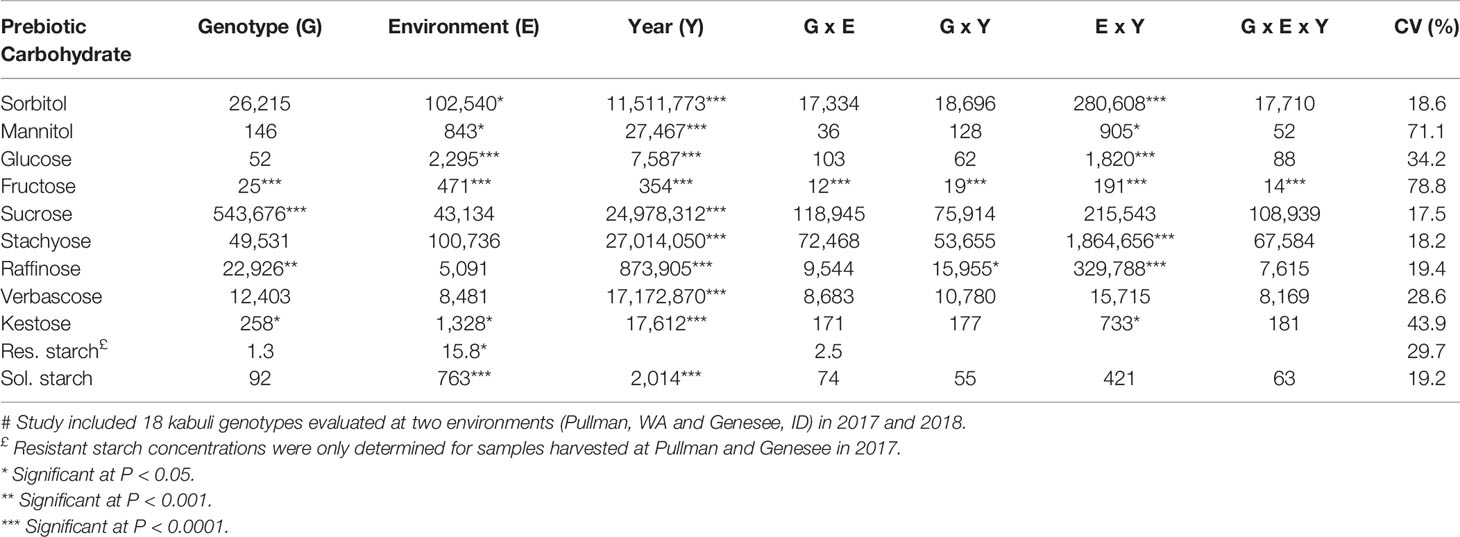
Table 2 Mean squares of combined ANOVA, and coefficient of variation (CV) for concentrations of prebiotic carbohydrates in chickpea cultivars and breeding lines grown in Idaho and Washington#.
The most abundant carbohydrate in chickpea seed was sucrose, which on average constituted greater than 1.6% of total seed weight, followed by stachyose and sorbitol (Table 3). Sucrose represented greater than 95% of total simple sugars (sucrose + fructose + glucose). Stachyose represented greater than 50% of total RFO (stachyose + raffinose + verbacose), which was the most abundant class of prebiotic carbohydrates. The least abundant carbohydrates in chickpea seed were fructose and mannitol. Concentrations of glucose and kestose were similar in chickpea seeds. Significant differences between means of chickpea entries were detected only for seed concentrations of sucrose. CA13900023C had a significantly higher sucrose concentration than CA13900046C, but no other significant differences were detected. Soluble starch on average constituted 41% of total seed weight and was approximately 10× more abundant than resistant starch.
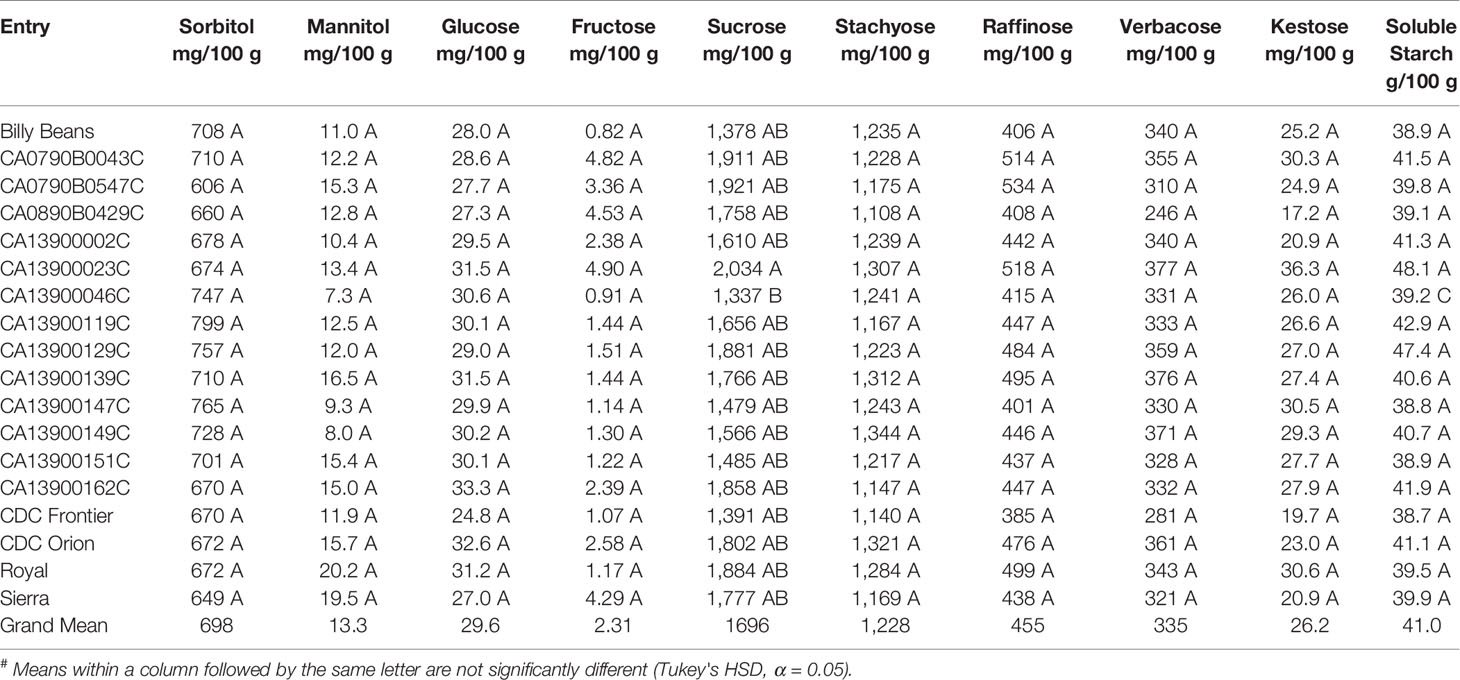
Table 3 Mean# concentrations of prebiotic carbohydrates for chickpea cultivars and breeding lines grown at Pullman, WA and Genesee, ID in both 2017 and 2018.
Mean concentrations of carbohydrates across locations and years are presented in Table 4. For the majority of carbohydrates, including sorbitol, mannitol, glucose, sucrose, stachyose, raffinose, verbacose, and kestose, mean concentrations at both locations in 2017 were significantly greater than both locations in 2018. Significant differences in mean concentrations of carbohydrates between Pullman-2017 and Genesee-2017 were only observed for mannitol and raffinose. Significant differences in mean concentrations between Pullman-2018 and Genesee-2018 were observed for several carbohydrates including sorbitol, glucose, fructose, raffinose, kestose, and soluble starch.

Table 4 Mean# concentrations by location and year of prebiotic carbohydrates for chickpea cultivars and breeding lines grown at Pullman, WA and Genesee, ID in both 2017 and 2018.
Correlations Between Carbohydrate Concentrations, Yield, HSW, and Days to Mature
Significant correlations (P <0.05) between carbohydrate concentrations were observed for the majority of pairwise combinations and only correlations with r ≥0.80 will be noted. The highest positive correlations between carbohydrate concentrations were observed between verbacose and sorbitol (r = 0.93), verbacose and stachyose (r = 0.92), stachyose and sorbitol (r = 0.88), stachyose and sucrose (r = 0.85), and verbacose and sucrose (r = 0.82).
Correlations between seed carbohydrate concentrations and agronomic traits tended to be less than those observed between different carbohydrate concentrations. Correlations between carbohydrate concentrations and HSW or days to flower had relatively low magnitude (r <0.40) or not significant. Correlations between carbohydrate concentrations and days to mature tended to positive for most carbohydrates and were highest for sorbitol (r = 0.67) and verbacose (r = 0.65). However, significant negative correlations of appreciable magnitude were observed between several carbohydrate concentrations and plot yield. The highest negative correlations with yield were observed for the RFOs verbacose (r = −0.80) and stachyose (r = −0.77), followed by simple sugars sorbitol (r = −0.66) and mannitol (r = −0.65).
Discussion
Significant genotype effects were detected for several prebiotic carbohydrates (Table 2). However, non-genetic sources of variance including year effects and environment × year interaction effects were the greatest sources of variance for all carbohydrates (Table 2). These results suggest that only limited gains may be made in these traits using adapted parental materials. Minor genotype effects, or in many cases a lack of significant genotype effects are likely due in part to the relatively narrow genetic base present in the examined chickpea cultivars and breeding lines (Table 1). Three breeding lines are full-sibs derived from CA0469C020C/Dwelley and seven breeding lines share as a parent CA0469C020C, which has resistance to Ascochyta blight and is a full-sib line to CA0469C025C, a germplasm with improved disease resistance and high yield (Vandemark et al., 2014b).
Significant environment effects were detected for several prebiotic carbohydrates (Table 2). Although only two environments were examined, these results suggest improved understanding of factors contributing to environmental and management sources of variance may promote reliable production of more nutritious chickpeas. The absence of significant genotype × environment interaction effects observed in this study for all carbohydrates except fructose (Table 2) can likely be attributed to limited genetic variation between plant materials and similarities between the two test locations.
Year effects were the greatest source of variance for all carbohydrate concentrations (Table 2). For the majority of carbohydrates, mean concentrations in 2017 were significantly greater than in 2018 (Table 4). Monthly average temperatures and total monthly precipitation are presented in Table 5 for Pullman, WA and Genesee, ID during 2017 and 2018. Average temperatures early in the growing season (April and May) were warmer in 2018 than 2017 at Pullman and Genesee. However, average temperatures later in the growing season (July and August) were cooler in 2018 than 2017 at both locations. Both locations received more precipitation early in the growing season (April and May) in 2018 than 2017. These data suggest that the higher concentrations of many carbohydrates observed in 2017 may be the result of lower precipitation during the growing season coupled with greater heat stress later in the season (July and August) during grain filling. This may reflect the role of many of these compounds as osmoprotectants produced in response to heat and water stress.
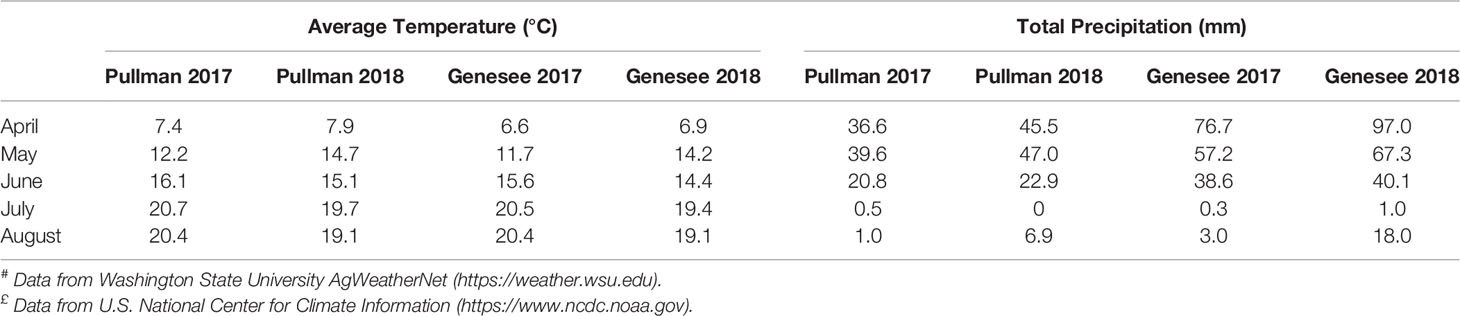
Table 5 Average monthly temperature and precipitation during growing season in Pullman#, WA and Genesee£, ID in 2017 and 2018.
Total RFO content in chickpea seed averaged 2.0% of dry weight, which is consistent with reports for other seeds ranging from 2 to 10% (Peterbauer and Richter, 2001). The most abundant RFO in chickpea seed was stachyose (Table 2). This is consistent with previous reports for other legume seeds, including dry bean (P. vulgaris L.) (McPhee et al., 2002) and soybean (Glycine max L.) (Kumar et al., 2010) for which stachyose was more abundant than raffinose.
A positive correlation with r >0.80 was observed between seed concentrations of verbacose and stachyose. This likely reflects their shared RFO biosynthetic pathway in seeds, in which galactosylation of raffinose leads to production of stachyose, to which an additional galactosyl residue is transferred to produce verbacose (Peterbauer and Richter, 2001). Similarly high correlations were also observed between these two RFOs, sucrose, and sorbitol. The high correlations between sucrose, stachyose, and verbacose can also be explained by the role of sucrose as the first galactosyl residue acceptor in the RFO biosynthetic pathway. High correlations between sorbitol, stachyose and verbacose likely reflect that along with sucrose, SA such as sorbitol are primary products of photosynthesis and a major source of translocated carbohydrate to seed (Slewinski and Braun, 2010).
Only minor or non-significant correlations were observed between seed carbohydrate concentrations and seed size (HSW). However, high negative correlations were observed between yield and concentrations of RFOs verbacose and stachyose, and between yield and SAs sorbitol and mannitol. Although RFOs primarily function to store carbon in seeds, they are also known to accumulate in response to abiotic stress factors including heat (Panikulangara et al., 2004) and drought (Downie et al., 2003). Sorbitol has been shown to accumulate in several plant species in response to various abiotic factors including osmotic (Pommerrenig et al., 2007) and drought stress (Li et al., 2012). Similarly, accumulation of mannitol has been shown to increase tolerance to drought stress in several plant species (Patonnier et al., 1999; Abebe et al., 2003). Climatic conditions that contributed to lower yields in 2017, including higher temperatures during grain filling and lower precipitation (Table 5), also likely resulted in higher seed concentrations of carbohydrates associated with drought and heat stress.
Identifying sources of genetic variation in chickpea for seed concentrations of prebiotic carbohydrates and understanding the magnitude of genotype, environment, and their interaction effects on these traits are important for accelerating progress in breeding more nutritious chickpea cultivars. In this study non-genetic effects contributed more than genetic effects to total variation in carbohydrate concentrations, suggesting there is very limited genetic variation for these traits in the elite chickpea breeding lines and cultivars examined in this study. However, a survey of more genetically diverse plant materials, such as a chickpea ‘mini-core' collection (Upadhyaya and Ortiz, 2001) may reveal chickpea genotypes that produce exceptionally high concentrations of selected prebiotic carbohydrates and could be used to introduce desirable nutritional traits into adapted chickpea cultivars.
Data Availability Statement
The datasets generated for this study are available on request to the corresponding author.
Author Contributions
GV and DT conceived this work. GV planned and carried out field experiments including data collection, harvesting and cleaning seed samples. DT directed laboratory work to determine prebiotic carbohydrate profiles, maintained equipment for high performance anion exchange chromatography (HPAE), and analyzed data. ST and NS performed laboratory work and collected data. GV performed statistical analysis. GV and DT drafted the manuscript. All authors read and approved the manuscript.
Funding
This work was funded by a U.S. Department of Agriculture, Agricultural Research Service Pulse Crop Health Initiative competitive grant (‘Improving the nutritional value of chickpeas’).
Conflict of Interest
The authors declare that the research was conducted in the absence of any commercial or financial relationships that could be construed as a potential conflict of interest.
References
Abebe, T., Guenzi, A., Martin, B., Cushman, J. (2003). Tolerance of mannitol-accumulating transgenic wheat to water stress and salinity. Plant Physiol. 131, 1748–1755. doi: 10.1104/pp.102.003616
Bindels, L. B., Delzenne, N. M., Cani, P. D., Walter, J. (2015). Towards a more comprehensive concept for prebiotics. Nat. Rev. Gasteroenterol. Hepatol. 12, 303–310. doi: 10.1038/nrgastro.2015.47
Bueckert, R. A., Thavarajah, P., Pritchard, J. (2011). Phytic acid and mineral micronutrients in field-grown chickpea (Cicer arietinum L.) cultivars from western Canada. Eur. Food Res. Technol. 233, 203–212. doi: 10.1007/s00217-011-1495-8
Carlson, J. L., Erickson, J. E., Lloyd, B. B., Slavin, J. L. (2018). Health effects and sources of prebiotic dietary fiber. Curr. Dev. Nutr. 2, nzy005. doi: 10.1093/cdn/nzy005
Chen, Y., McGee, R., Vandemark, G., Brick, M., Thompson, H. J. (2016). Dietary fiber analysis of four pulses using AOAC 2011.25: Implications for human health. Nutrients 8, 829. doi: 10.3390/nu8120829
de Benoist, B., McLean, E., Egll, I., Cogswell, M. (2008). “Worldwide prevalence of anaemia 1993-2005,” in WHO global database on anaemia (Geneva, Switzerland: WHO Press). 2008.
Downie, B., Gurusinghe, S., Dahal, P., Thacker, R., Smyder, J. C., Nonogaki, H., et al. (2003). Expression of a galactinol synthase gene in tomato seed is up-regulated before maturation desiccation and again after imbibition whenever radicle protrusion is prevented. Plant Physiol. 131, 1347–1359. doi: 10.1104/pp.016386
FAOSTAT (Food and Agricultural Organization Corporate Statistical Database) (2019). http://www.fao.org/faostat/en/#data/QC (Accessed 19 April 2019).
Feinberg, M., San-Redon, J., Assie, A. (2009). Determination of complex polysaccharides by HPAE-PAD in foods: validation using accuracy profile. J. Chromatogr. B 877, 2388–2395. doi: 10.1016/j.chromb.2008.10.004
Gao, Z., Ying, J., Zhang, J., Ward, R. E., Martin, R. J., Lefevre, M., et al. (2009). Butyrate improves insulin sensitivity and increases energy expenditure in mice. Diabetes 58, 1509–1517. doi: 10.2337/db08-1637
Johnson, C. R., Thavarajah, D., Combs, G. F., Thavarajah, P. (2013). Lentil (Lens culinaris L.): a prebiotic rich whole food legume. Food Res. Intl. 51, 107–113. doi: 10.1016/j.foodres.2012.11.025
Keku, T. O., Dulal, S., Deveaux, A., Jovov, B., Han, X. (2015). The gasterointestinal microbiota and colorectal cancer. Am. J. Physiol. Gasterointest. Liver Physiol. 308, G351–G363. doi: 10.1152/ajpgi.00360.2012
Kumar, V., Rani, A., Goyal, L., Dixit, A. K., Manjaya, J. G., Dev, J., et al. (2010). Sucrose and raffinose family oligosaccharides (RFOs) in soybean seeds as influenced by genotype and growing location. J. Agr. Food Chem. 58, 5081–5085. doi: 10.1021/jf903041s
Lev-Yadun, S., Gopher, A., Abbo, S. (2000). The cradle of agriculture. Science 288, 5471–1602. doi: 10.1126/science.288.5471.1602
Li, F., Lei, H., Zhao, X., Tain, R., Li., T. (2012). Characterization of three sorbitol transporter genes in micropropagated apple plants grown under drought stress. Plant Mol. Biol. Rep. 30, 123–130. doi: 10.1007/s11105-011-0323-4
McCleary, B. V., Monaghan, D. A. (2002). Measurement of resistant starch. J. AOAC Intl. 85, 665–675.
McPhee, K. E., Zemetra, R. S., Brown, J., Myers, J. R. (2002). Genetic analysis of the raffinose family oligosaccharides in common bean. J. Amer. Soc Hortic. Sci. 127, 376–382. doi: 10.21273/JASHS.127.3.376
Muehlbauer, F. J., Kaiser, W. J., Bezdicek, D. F., Morrison, K. J., Swan, D. G. (1982). Description and culture of chickpeas. Washington State University Ext. Bull. 1112 (Pullman, WA, USA: WSU Press).
Muir, J. G., Rose, R., Rosella, O., Liels, K., Barrett, J. S., Shepherd, S. J., et al. (2009). Measurement of short-chain carbohydrates in common Australian vegetables and fruits by high-performance liquid chromatography (HPLC). J. Agr. Food Chem. 57, 554–565. doi: 10.1021/jf802700e
NASS (National Agricultural Statistics Service) (2019). https://www.nass.usda.gov/Statistics_by_Subject/result.php?3E8E3F30-6430-3270-982E-4B9E18640793§or=CROPS&group=FIELD%20CROPS&comm=BEANS. (Accessed 19 April 2019).
Panikulangara, T., Eggers-Shumacher, G., Wunderlich, M., Stransky, H., Schoffl, E. (2004). Galactinol synthase 1. a novel heat shock factor target gene responsible for heat-induced synthesis of raffinose family oligosaccharides in Arabadopsis. Plant Physiol. 136, 3148–5158. doi: 10.1104/pp.104.042606
Patonnier, M. P., Peltier, J., Marigo, G. (1999). Drought-induced increase in xylem malate and mannitol concentration and closure of Fraxinus excelsior L. stomata. J. Exp. Bot. 50, 1223–1229. doi: 10.1093/jxb/50.336.1223
Peterbauer, T., Richter, A. (2001). Biochemistry and physiology of raffinose family oligosaccharides and galactosyl cyclitols in seeds. Seed Sci. Res. 11, 185–197. doi: 10.1079/SSR200175
Pommerrenig, B., Papini-Terzi, F., Sauer, N. (2007). Differential regulation of sorbitol and sucrose loading in the phloem of Plantago major in response to salt stress. Plant Physiol. 144, 1029–1038. doi: 10.1104/pp.106.089151
Ray, H., Bett, K., Tar'an, B., Vandenberg, A., Thavarajah, D., Warkentin, T. (2014). Mineral micronutrient content of cultivars of field pea, chickpea, common bean, and lentil grown in Saskatchewan, Canada. Crop Sci. 54, 1698–1708. doi: 10.2135/cropsci2013.11.0744
Schwiertz, A., Taras, D., Schafer, K., Beijer, S., Bos, N. A., Donus, C., et al. (2010). Microbiota and SCFA in lean and overweight healthy subjects. Obesity 18, 190–195. doi: 10.1038/oby.2009.167
Slewinski, T. L., Braun, D. M. (2010). Current perspectives on the regulation of whole-plant carbohydrate partitioning. Plant Sci. 178, 341–349. doi: 10.1016/j.plantsci.2010.01.010
Toker, C. (2009). A note on the evolution of kabuli chickpeas as shown by induced mutations in Cicer reticulatum Ladizinsky. Genet. Resour. Crop Evol. 56, 7–12. doi: 10.1007/s10722-008-9336-8
Upadhyaya, H. D., Ortiz, R. (2001). A mini core subset for capturing diversity and promoting utilization of chickpea genetic resources in crop improvement. Theor. Appl. Genet. 102, 1292–1298. doi: 10.1007/s00122-001-0556-y
Vandemark, G., Brick, M., Osorno, J., Kelly, J., Urrea, C. (2014a). Edible grain legumes. Eds. Smith, S., Diers, B., Specht, J., Carver, B. (Madison, WI, USA: Yield Gains Major U.S. Field Crops, American Society of Agronomy, Inc., Crop Science Society of America, Inc., and Soil Science Society of America, Inc.), 87–124. doi: 10.2135/cssaspecpub33.c5
Vandemark, G., Muehlbauer, F. J., Mihov, M., Chen, W., McPhee, K., Chen, C. (2014b). Registration of ‘CA0469C025C' chickpea. J. Plant Regist. 8, 303–307. doi: 10.3198/jpr2013.09.0057crg
Vandemark, G. J., Grusak, M. A., McGee, R. J. (2018). Mineral concentrations of chickpea and lentil cultivars and breeding lines grown in the U.S. Pacific Northwest. Crop J. 6, 253–262. doi: 10.1016/j.cj.2017.12.003
Wessells, K. R., Brown, K. H. (2012). Estimating the global prevalence of zinc deficiency: results based on zinc availability in national food supplies and the prevalence of stunting. PloS One 7, e50568. doi: 10.1371/journalpone.0050568
White, P. J., Broadley, M. R. (2005). Biofortifying crops with essential mineral elements. Trends Plant Sci. 10, 586–593. doi: 10.1016/j.plants.2005.10.001
Keywords: biofortification, breeding, chickpea, gut microbiome, nutrition
Citation: Vandemark G, Thavarajah S, Siva N and Thavarajah D (2020) Genotype and Environment Effects on Prebiotic Carbohydrate Concentrations in Kabuli Chickpea Cultivars and Breeding Lines Grown in the U.S. Pacific Northwest. Front. Plant Sci. 11:112. doi: 10.3389/fpls.2020.00112
Received: 24 April 2019; Accepted: 24 January 2020;
Published: 21 February 2020.
Edited by:
Jose C. Jimenez-Lopez, Experimental Station of Zaidín (EEZ), SpainReviewed by:
Damián Maestri, National University of Cordoba, ArgentinaPaola Leonetti, Italian National Research Council, Italy
Copyright © 2020 Vandemark, Thavarajah, Siva and Thavarajah. This is an open-access article distributed under the terms of the Creative Commons Attribution License (CC BY). The use, distribution or reproduction in other forums is permitted, provided the original author(s) and the copyright owner(s) are credited and that the original publication in this journal is cited, in accordance with accepted academic practice. No use, distribution or reproduction is permitted which does not comply with these terms.
*Correspondence: George Vandemark, Z2VvcmdlLnZhbmRlbWFya0BhcnMudXNkYS5nb3Y=