 Jiaming Liu
 Chengyao Jiang
 Lu Kang1
 Yu Song
 Zhirong Zou
 Weijun Zheng
- 1State Key Laboratory of Crop Stress Biology for Arid Areas and College of Life Sciences, Northwest A&F University, Yangling, China
- 2College of Horticulture, Northwest A&F University, Yangling, China
- 3Institute of Germplasm Resources, Xinjiang Academy of Agricultural Sciences, Urumqi, China
- 4College of Agronomy, Northwest A&F University, Yangling, China
In plants, 14-3-3 proteins are recognized as mediators of signal transduction and function in both development and stress response. However, there are only a few preliminary functional researches in the C4 crop foxtail millet. Here, phylogenetic analysis categorized foxtail millet 14-3-3s (SiGRFs) into 10 discrete groups (Clusters I to X). Transcriptome and qPCR analyses showed that all the SiGRFs responded to at least one abiotic stress. All but one SiGRF-overexpressing (OE) Arabidopsis thaliana line (SiGRF1) exhibited insensitivity to abiotic stresses during seed germination and seedling growth. Compared with the Col-0 wild-type, SiGRF1-OEs had slightly lower germination rates and smaller leaves. However, flowering time of SiGRF1-OEs occurred earlier than that of Col-0 under high-salt stress. Interaction of SiGRF1 with a foxtail millet E3 ubiquitin-protein ligase (SiRNF1/2) indicates that the proteinase system might hydrolyze SiGRF1. Further investigation showed that SiGRF1 localized in the cytoplasm, and its gene was ubiquitously expressed in various tissues throughout various developmental stages. Additionally, flowering-related genes, WRKY71, FLOWERING LOCUS T, LEAFY, and FRUITFULL, in SiGRF1-OEs exhibited considerably higher expression levels than those in Col-0 under salinity-stressed conditions. Results suggest that SiGRF1 hastens flowering, thereby providing a means for foxtail millet to complete its life cycle and avoid further salt stress.
Introduction
Foxtail millet (Setaria italica) has been regarded as an important dietary staple in China for many millennia (Zhang et al., 2012; Liu et al., 2016a). As a C4 cereal crop, it not only possesses excellent drought tolerance, but also possesses an extensive germplasm collection available for research (Doust et al., 2009; Lata et al., 2013). These features accentuate this crop as a prominent genetic model for use in the study of the evolution and physiology of C4 photosynthesis and abiotic stress-tolerance mechanisms, particularly in response to salinity and dehydration stress (Lata et al., 2013; Liu et al., 2016a).
The 14-3-3 proteins make up a large multigenic family of regulatory proteins that are ubiquitously present in all eukaryotes (Kumar et al., 2015). They usually regulate plant development and defense from stress through protein-protein interactions by binding to target proteins containing well-defined phosphothreonine (pThr) or phosphoserine (pSer) motifs (Muslin et al., 1996; Yaffe et al., 1997; Li and Dhaubhadel, 2011). These 14-3-3 proteins interact as a dimer with a native dimeric size of ∼60 kDa where each monomer in the dimer can interact with separate target proteins (Li and Dhaubhadel, 2011). This facilitates a 14-3-3 dimer to act as a scaffolding protein to induce a variety of physiological changes in the target protein (Gokirmak et al., 2010). Published research show that 14-3-3s play crucial regulatory roles in abiotic stress response pathways and ABA signaling in plants (Chen et al., 2006, 2017; Xu and Shi, 2006; Viso et al., 2007; Yohei et al., 2007; Caroline et al., 2010; Schoonheim et al., 2010; Denison et al., 2011; Vysotskii et al., 2013; Sun et al., 2015). In response to abiotic stress, four rice 14-3-3 genes, GF14b, GF14c, GF14e, and Gf14f, were induced by the defense compounds, benzothiadiazole, methyl jasmonate, ethephon, and hydrogen peroxide. They were also differentially regulated after exposure to salinity, drought, wounding and ABA (Chen et al., 2006). The 14-3-3 proteins 14-3-3κ and 14-3-3χ can undergo self-phosphorylation by stress-activated kinases, such as SnRK2.8 in A. thaliana. In relation to ABA signaling, 14-3-3 proteins have been shown to be present at the promoters of two A. thaliana late-embryogenesis genes, AtEm1 and AtEm6, which are induced by ABI3, an ABA-regulated transcription factor (Viso et al., 2007). Five 14-3-3 isoforms interact with the ABA-regulated transcription factors and are involved in ABA signal transduction during barley seed germination (Schoonheim et al., 2010). A soybean 14-3-3 protein can regulate transgenic A. thaliana ABA sensitivity (Sun et al., 2015). Rice OsCPK21 phosphorylates 14-3-3 proteins in response to ABA signaling and salt stress (Chen et al., 2017).
Salt stress is a major abiotic stress in the production of foxtail millet. The 14-3-3 proteins described above are involved in salt-stress response in C3 plants, but there is no comprehensive genome-wide research of 14-3-3 proteins and abiotic stress in foxtail millet. In this study, a comprehensive in silico expression analysis of the 14-3-3 genes, hereafter called SiGRF (GENERAL REGULATORY FACTOR) genes for simplicity, at several development stages of foxtail millet were performed using available microarray data. The expression patterns under stress conditions showed that all the SiGRFs were responsive to at least one abiotic stress. Phenotypic identification of overexpression of SiGRFs in A. thaliana further confirmed the stress resistant functions of the SiGRFs. In addition, we studied the function of SiGRF1 in detail, including gene expression pattern, protein subcellular localization, candidate interaction protein screening, protein-protein interaction verification, and phenotypic characteristics of SiGRF1-OEs under salt stress. Results imply that SiGRF1 hastens transgenic A. thaliana flowering in the presence of salt stress to achieve reproduction despite the harsh environment.
Materials and Methods
Plant Materials and Stress Treatments of Foxtail Millet
Foxtail millet Yugu 1, known for its tolerance to abiotic stress (Zhang et al., 2014), was used to amplify cDNA sequences of SiGRFs, the SiGRF1 gene promoter, and SiRNF1/2 (Si021868m) (Supplementary Table S1). Arabidopsis thaliana Columbia-0 (WT) was used as the background for overexpressing SiGRFs. Foxtail millet seeds were germinated and grown in a growth chamber at 28 ± 1°C day and 23 ± 1°C night temperatures with 70 ± 5% relative humidity and a photoperiod of 14 h. A. thaliana seeds were vernalized on wet filter paper at 4°C for 3 days and then sown in soil. They were kept in a greenhouse at 20–22°C with 45% relative humidity under long-day (LD) conditions (16 h light/8 h dark). The stress treatments were performed as previously described (Liu et al., 2016a). In short, 4-week-old plants were exposed to solutions containing, variously, 120 mM NaCl, 6% (w/v) PEG 6000, and 5 μM ABA. Unstressed plants were maintained as controls. All plant materials were harvested and stored at −80°C.
Identification of 14-3-3 Genes and Evolutionary Analyses
The hidden Markov model (HMM) profile of the 14-3-3 domain (PF00244) downloaded from Pfam v27.01 was used to identify 14-3-3 proteins in A. thaliana (GRF), Brachypodium distachyon, Oryza sativa, Triticum aestivum, Sorghum bicolor, maize, and foxtail millet as described in a previous report (Liu et al., 2016a; Supplementary Table S2). The amino acid sequences of the seven species 14-3-3 proteins were obtained using BLASTP (cut-off E-value of 1E-10) in the protein database of the National Center for Biotechnology Information2. Sequence alignment was performed by ClustalX (Thompson et al., 1997). The complete amino acid sequences of 14-3-3 proteins were used and the neighbor-joining method was adopted to construct a phylogenetic tree by the MEGA5.1 program, and the confidence levels of monophyletic groups were estimated using a bootstrap analysis of 500 replicates (Tamura et al., 2011). The full-length open reading frames of SiGRFs and SiRNF1/2 were obtained from foxtail millet cDNA. The primers for cloning are listed in Supplementary Table S3. The PCR products were cloned into pLB vectors (TianGen, China) and sequenced with an ABI 3730XL 96-capillary DNA analyzer (Lifetech, United States).
Transcriptome Analysis
The gene transcriptome data for foxtail millet were obtained from Phytozome v.12.13. Data from the following foxtail millet tissue/organs and developmental stages (for some tissues) were analyzed: etiolated seedling, root, shoot, leaves (1–6 from bottom to top of the shoot), and panicles (collected from the 5th and 10th day after heading)4. Tissues samples were collected from plants exposed to various light- or nitrogen-source treatments according to a foxtail millet study (B100) described in Phytozome v.12.1. For the light experiments, plants were grown under continuous monochromatic light (blue: 6 μmol m–2 s–1, red: 50 μmol m–2 s–1, or far-red: 80 μmol m–2 s–1), and watered with RO water every 3 days. Total aerial tissues were collected (at 9:30 am) from 8-day-old seedlings. For the nitrogen treatments, plants were grown for 30 days under differing nitrogen source regimes, 10 mM KNO3 (NO3– plants), 10 mM (NH4)3PO4 (NH4+ plants) or 10 mM urea (urea plants). Root tissue was harvested from the nitrogen-treated plants.
DNA Isolation, RNA Extraction, RT-PCR, and q-PCR
Genomic DNA for each sample was isolated from 0.2 g foxtail millet leaves using the CTAB method (Saghai-Maroof et al., 1984). Isolation of total RNA from 0.2 g whole plant materials was performed using an RNA extraction kit (Takara, Japan) according to the manufacturer’s recommendations. Synthesis of cDNA and RT-PCR were conducted as previously described (Liu et al., 2016a). Analysis by qPCR was carried out with TransScript II Probe One-Step qPCR SuperMix (TransGen, China) on an ABI 7500 system. The foxtail millet SiActin gene (Si036655m) was used as an internal control to normalize all data. The 2–ΔΔCT method (Livak and Schmittgen, 2001) was used to evaluate the relative expression of each gene. All RT-PCR reactions were repeated three times.
Subcellular Localization
The coding region of SiGRF1 without the termination codon was inserted at the BamHI site of the subcellular localization vector p16318, which contained the 35S promoter and C-terminal green fluorescent protein (GFP) (Liu et al., 2016a, b). The transient expression assays were performed as previously described (Liu et al., 2016a), and then samples were observed at 488 and 543 nm illumination using a Zeiss LSM700 microscope.
GUS Histochemical Assay
A 2.5-kb SiGRF1 promoter region was inserted into the vector pCAMBIA1305 at the EcoRI site. The construct was introduced into A. thaliana Columbia-0 by Agrobacterium tumefaciens-mediated transformation as described previously (Jeon et al., 2000). Tissues, including the root apical meristem (RAM), root cap columella, the stele, lateral root primordium, and hypocotyl of 5-day-old seedlings, and the ripening siliques, sepals, pollen grains, petiole, mesophyll and stoma of 35-day-old plants, from individuals of the homozygous T3 generation of transgenic pSiGRF1:GUS A. thaliana were sampled and stained in a GUS staining solution as previously described (Ma et al., 2015). Samples were destained in 50, 70, and 100% ethanol for 5 min, consecutively, and then bleached by immersion in 100% ethanol. The decolorized tissues were observed by bright field microscopy (LEICA M165FC, Germany) and photographed using a digital camera (LEICA DFC420C, Germany).
Generation of Transgenic A. thaliana
The coding sequences of SiGRF genes were amplified and cloned into pCAMBIA1305-GFP under the control of the cauliflower mosaic virus (CaMV) 35S promoter, resulting in a 35S:SiGRF construct. The constructs were confirmed by sequencing and then transformed into WT A. thaliana of the ecotype Col-0. 10 independent lines of the 35S:SiGRF transgenics, with various expression levels of the SiGRFs gene, were obtained for further analysis.
Seed Germination and Root Growth Assays
For the germination assay, seeds were subjected to 120 mM NaCl, 6% (w/v) polyethylene glycol (PEG) 6000 (to simulate osmotic stress), or 0.5 μM ABA treatments. For the root growth assays, 5-day-old seedlings were grown on vertical agar plates in the presence or absence of 120 mM NaCl, 6% (w/v) PEG 6000, and 0.5 μM ABA. Root lengths were measured after 5 days of treatment. At least 30 plants were counted and averaged for the data statistics. For the germination assay of SiGRF genes in transgenic plants, at least 100 seeds of each line were counted for the measurement, and the seed number was recorded every 12 h post-incubation for visible radical emergence as a proxy for seed germination. Each treatment contained three independent replicates.
Yeast Two-Hybrid Assay
SiGRF1 protein interactions were investigated by screening a foxtail millet cDNA library in yeast with the Matchmaker Two-Hybrid System 3 (Clontech). SiGRF1 and SiRNF1/2 cDNA without the termination codon was cloned into pGBKT7 and pGADT7 to create SiGRF1-BD and SiRNF1/2-AD, respectively, using an In-Fusion HD Cloning Kit (Clontech, United States) (for primer sequences, see Supplementary Table S3). Four groups, AD + BD, SiRNF1/2-AD + BD, AD + SiGRF1-BD, and SiRNF1/2-AD + SiGRF1-BD, were transformed into the yeast strain AH109 and selected by growing on SD/-Trp-Leu medium at 30°C for 4 days. Surviving clones were retransferred to SD/-Trp-Leu-His-Ade medium, according to the manufacturer instructions (Clontech, United States).
Bimolecular Fluorescence Complementation (BiFC)
The coding sequences of SiGRF1 and TaPI4KIIγ were inserted into the pSPYNE vector and that of SiRNF1/2 and TaUFD1 were inserted into pSPYCE vectors (Walter et al., 2004) to create SiGRF1-YNE, TaPI4KIIγ-YNE, SiRNF1/2-YCE, and TaUFD1-YCE, respectively, using an In-Fusion HD Cloning Kit (Clontech, United States) (for primer sequences, see Supplementary Table S3). These plasmids, including empty GFP vector, were extracted by QIAGEN Plasmid Maxi Kit and transformed into wheat leaf protoplasts. Four groups, GFP, TaPI4KIIγ-YNE/TaUFD1-YCE, SiGRF1-YNE/SiRNF1/2-YCE, and SiRNF1/2-YCE + YNE were co-transformed into foxtail millet leaf protoplasts. The YFP fluorescence of protoplasts was assayed under a Zeiss LSM 700 confocal microscope 8 h after transformation.
Co-immunoprecipitation (Co-IP) Assays
To evaluate the interaction between SiGRF1 and SiRNF1/2 in vivo, Co-IP assays were carried out as previously described (Zheng et al., 2013). Agrobacterium strain GV3101 carrying the pCAMBIA1305-SiGRF1-GFP, pCAMBIA1305-SiRNF1/2-FLAG, or 35S:p19 construct was co-infiltrated into a Nicotiana benthamiana leaf. After growing in the dark for 3 days, the leaf was harvested and native extraction buffer (50 mM Tris-MES [pH 8.0], 0.5 M sucrose, 1 mM MgCl2, 10 mM EDTA, 5 mM DTT, and 1 × protease inhibitor cocktail) was used to lyse the sample. Then, 250 μL of extract was incubated with 20 μL anti-GFP conjugated agarose (Sigma-Aldrich) for 8 h at 4°C. The agarose was washed twice with 200 μL native extraction buffer. The pellet was detected by immunoblot analysis for anti-FLAG and anti-GFP.
RNA-Seq Analysis
At least 30 leaves from 2-week-old Col-0 and transgenic line SiGRF1-OE line 1 plants were collected for RNA-seq analysis. RNA-seq experiment was completed by Beijing Genomics Institute (BGI) company. The mRNA was isolated using poly-(T)-oligonucleotide-attached magnetic beads and fragmented to 100–200 bases. The double-strand cDNA was synthetized from mRNA using reverse transcriptase and random hexamer primers. Then, the cDNA fragments were purified using AMPure XP beads. Through an end-repair process, the addition of a single A base, and the ligation of the adapters, cDNA libraries were created via PCR enrichment. The libraries were sequenced using the HiSeqTM2500 sequencing system according to the manufacturer instructions (Illumina, United States). Sequencing reads were mapped to the TAIR 10 A. thaliana reference genome using TopHat1 with default parameters. The abundance of assembled transcripts was calculated in fragments per kilobase of exon model per million mapped fragments (FPKM). The TopHat and Cufflink software packages were used for the mRNA seq data analysis to identify differentially expressed genes (DEGs), and the threshold value of DEGs was | log2 (FoldChange)| >1 and P-Adjusted <0.05. The hierarchical clustering analysis was generated via the RPKM of DEGs of SiGRF1-OE line 1 VS Col-0. The GO terms enrichment of DEGs was conducted using the GOseq software based on the Wallenius non-central hypergeometric distribution. The KEGG enrichment analysis used a hypergeometric examination to find the enriched pathways in DEGs compared with the transcriptome background. RNA-seq data was download from SRA database (accession number: PRJNA611515). Finally, manually identified DEGs (log2 value ≥ 1.5-fold difference, p < 0.05) (Supplementary Table S6).
Results
Phylogenetic Analysis
The foxtail millet genome contains eight SiGRFs, and the predicted polypeptide lengths of SiGRF proteins ranged from 429 to 731. These protein sequences have small variations in both isoelectric point (pI) values (ranging from 4.71 to 5.19) and molecular weights (ranging from 26.188 to 29.690 kDa; Supplementary Table S1).
To evaluate the phylogenetic relationships among the SiGRFs in foxtail millet and six other species, predicted 14-3-3 sequences of 15 A. thaliana, 8 B. distachyon, 10 O. sativa, 24 T. aestivum, 6 S. bicolor, 13 Solanum lycopersicum and 8 foxtail millet were used to generate a neighbor-joining phylogenetic tree (Figure 1 and Supplementary Table S2). The phylogenetic analysis categorized the 14-3-3s into 10 discrete groups (Clusters I to X), containing, respectively, 16, 8, 5, 15, 7, 7, 4, 8, 3, and 7 predicted proteins (Figure 1). Many of the internal branches had high bootstrap values, indicating statistically reliable pairs of possible homologous proteins.
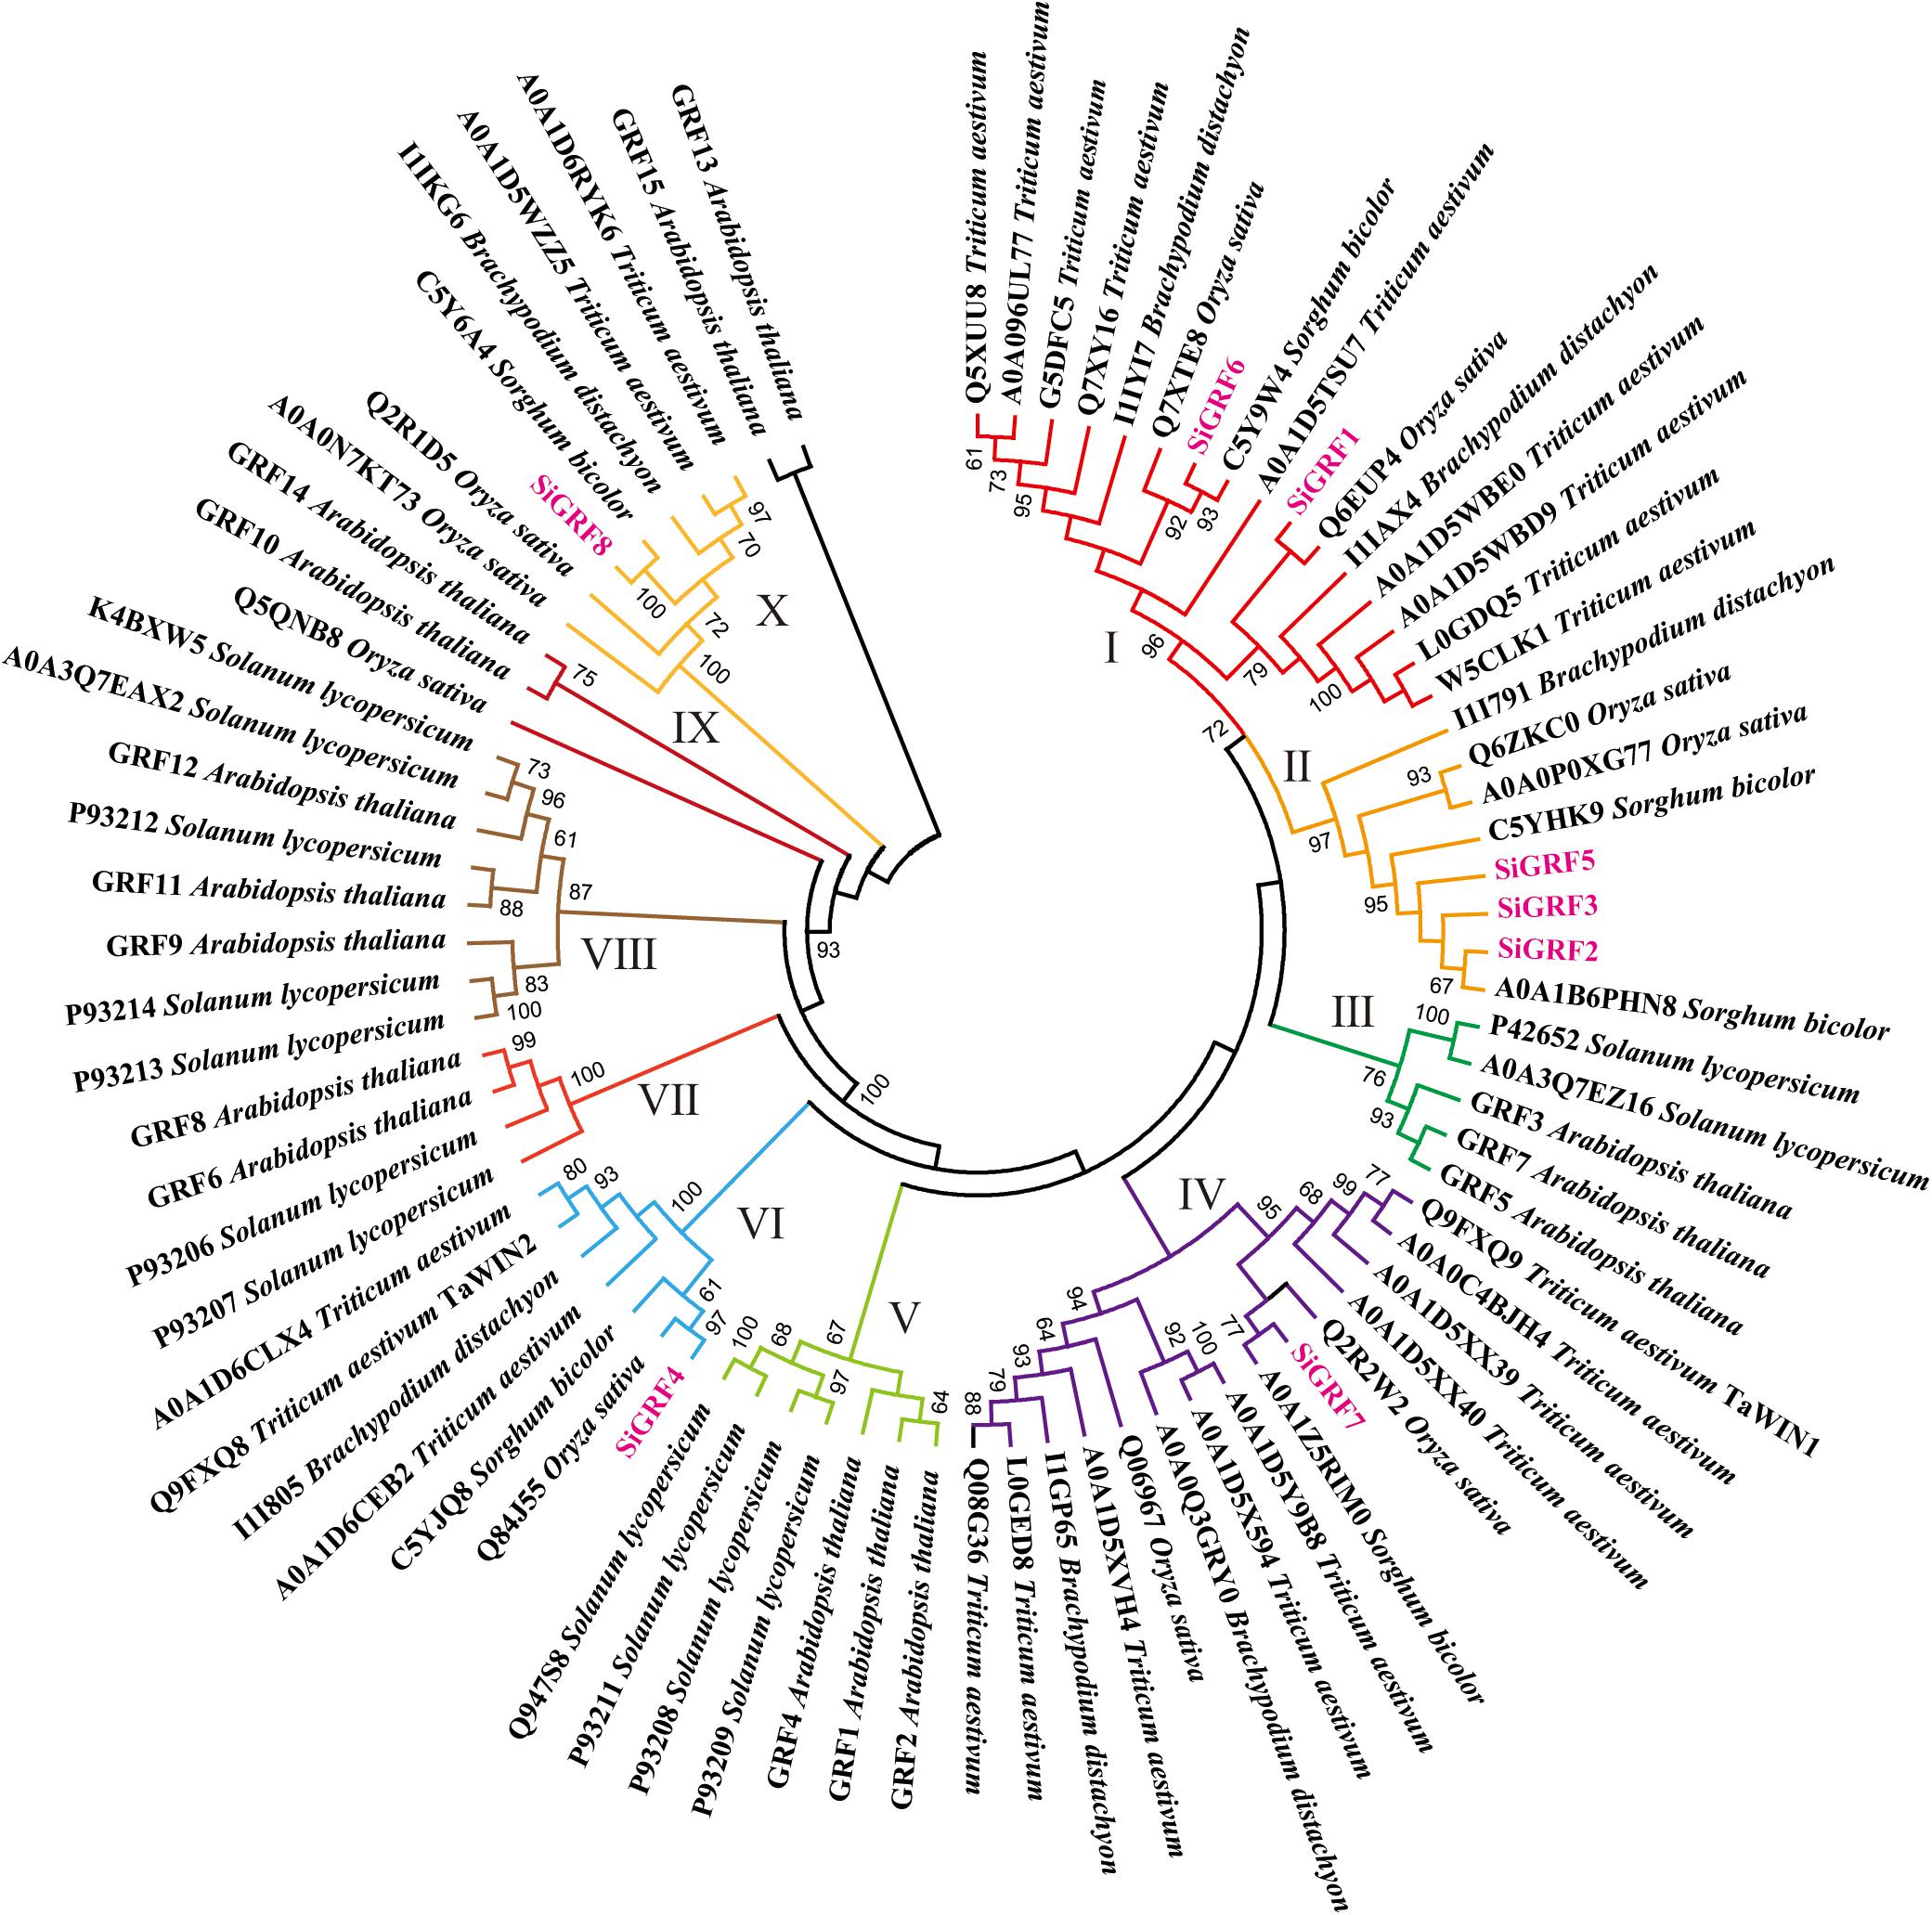
Figure 1. Neighbor-joining distance tree of 14-3-3 proteins in seven species. The tree is presented radially so that distances from the center represent cumulative branch lengths. Terminal branches and labels are colored to indicate different groups and foxtail millet (pink).
In silico Tissue-Specific Expression Profiling of SiGRFs
A heat map generated for examining tissue-specific expression showed differential transcript abundances of eight SiGRF genes in four major tissues, namely shoot (control), germ shoot, leaf, and panicle (Figure 2). The average log signal values for all of the SiGRF genes from three biological replicates of each sample are given in Supplementary Table S4. The results showed greater levels of expression in all the plant tissues compared to that of the shoot. Greater expression of SiGRF1 and SiGRF2 were only observed in the germ shoot. Lower levels of SiGRF5, SiGRF7, and SiGRF8 resulted in the leaf (Figure 2). SiGRF8 was stronger in both panicle stages than in the shoot (Figure 2).
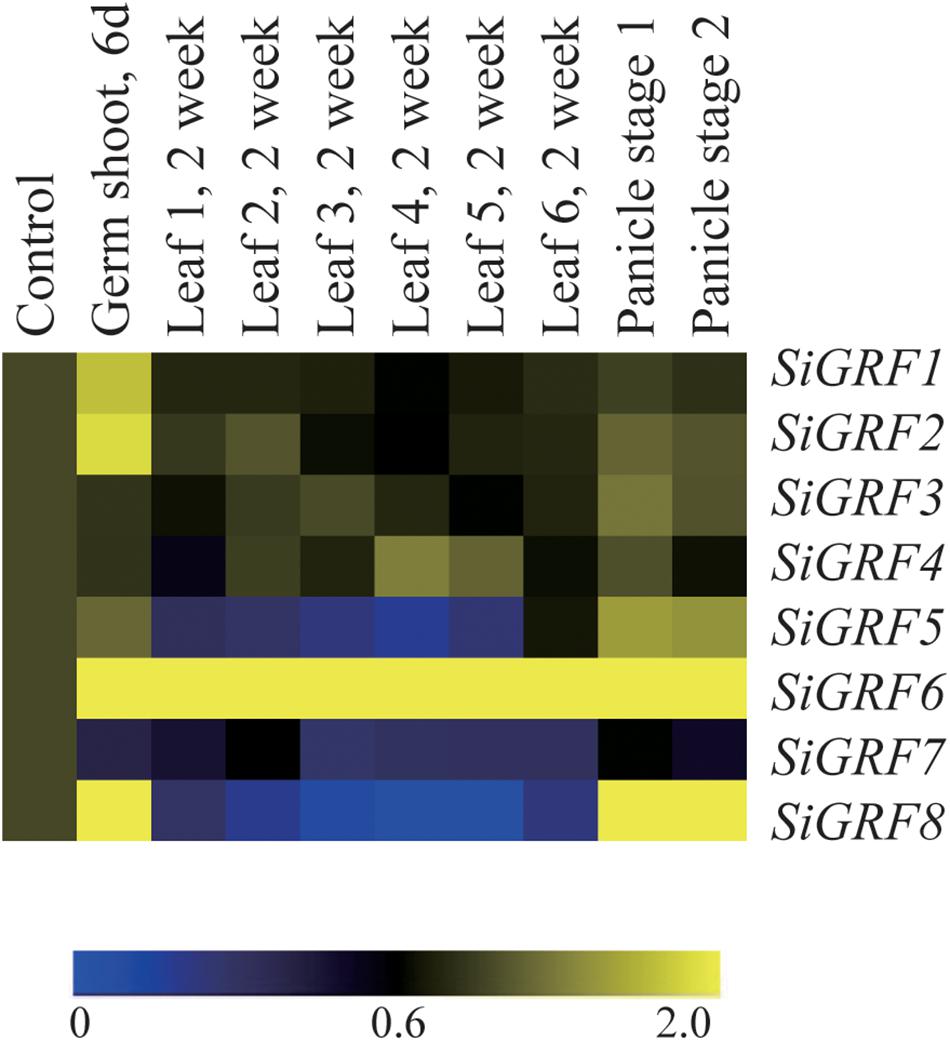
Figure 2. Tissue-specific expression of foxtail millet SiGRF genes in four major tissues: shoot (control), germ shoot, leaf, and panicle (two stages). The color scale representing the log of signal values is shown below the expression profiles.
Expression Analysis of SiGRFs Under Abiotic Stress and Light Conditions
To explore the potential functions of SiGRF genes under different stress and light treatments in foxtail millet, microarray analysis was performed using available GeneATLAS data5 for RNA from foxtail millet roots subjected to ammonia, drought, nitrate, or urea and shoots exposed to dark, blue, red, or far red light treatments. Results showed that all of the SiGRF genes varied in their expression levels in response to one or more stress or light relative to their expression in untreated control samples (Figure 3 and Supplementary Table S5). Expression levels of SiGRF4 and SiGRF8 were stronger than that of their respective controls across most treatments. Compared with the respective control, SiGRF2, SiGRF3, SiGRF5, and SiGRF7 in aerial tissues were lower in expression under blue light and far red light treatments (Figure 3).
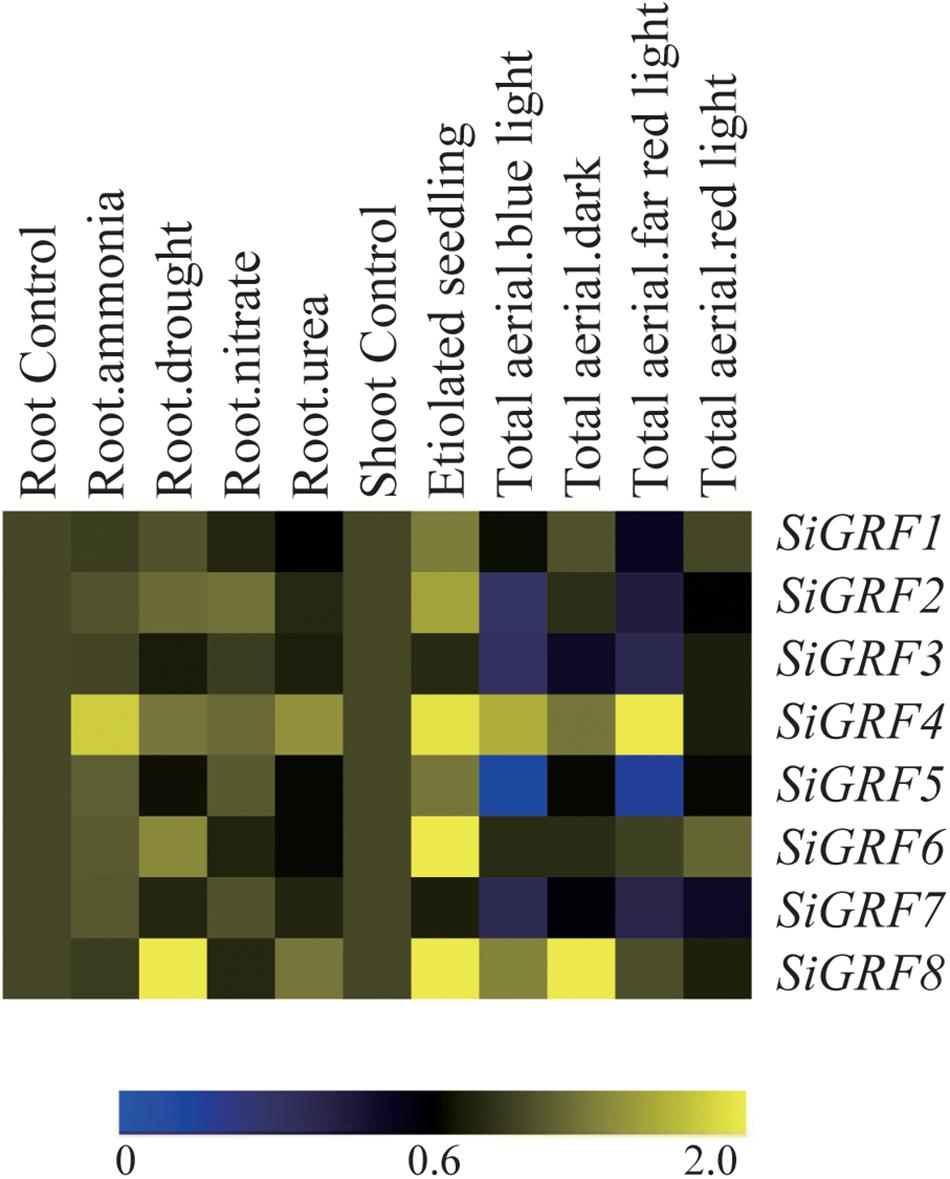
Figure 3. Expression profiles of SiGRF genes differentially expressed under stress and light conditions. The values of SiGRF genes under the control (untreated) and various stress conditions (labeled at the top of each lane) are presented by cluster display. The color scale representing signal values is shown at the bottom.
Verification of Microarray Data Using qPCR
We used qPCR to further verify the expression levels of SiGRF genes under abiotic stress or exogenous ABA (Figure 4). The results show that the expression levels of four genes were up-regulated (>2-fold) by salt stress, four were up-regulated by 6% PEG, and five were up-regulated by ABA. The expression of SiGRF1 was up-regulated under both salt and ABA stress treatments. SiGRF6 and SiGRF8 expression levels were up-regulated under ABA and 6% PEG stress conditions, respectively. Notably, the expression of SiGRF2, SiGRF4, and SiGRF7 were up-regulated under salt, 6% PEG, and ABA stress conditions. The expression levels of two SiGRF genes (SiGRF3 and SiGRF5) were unchanged by any treatment.
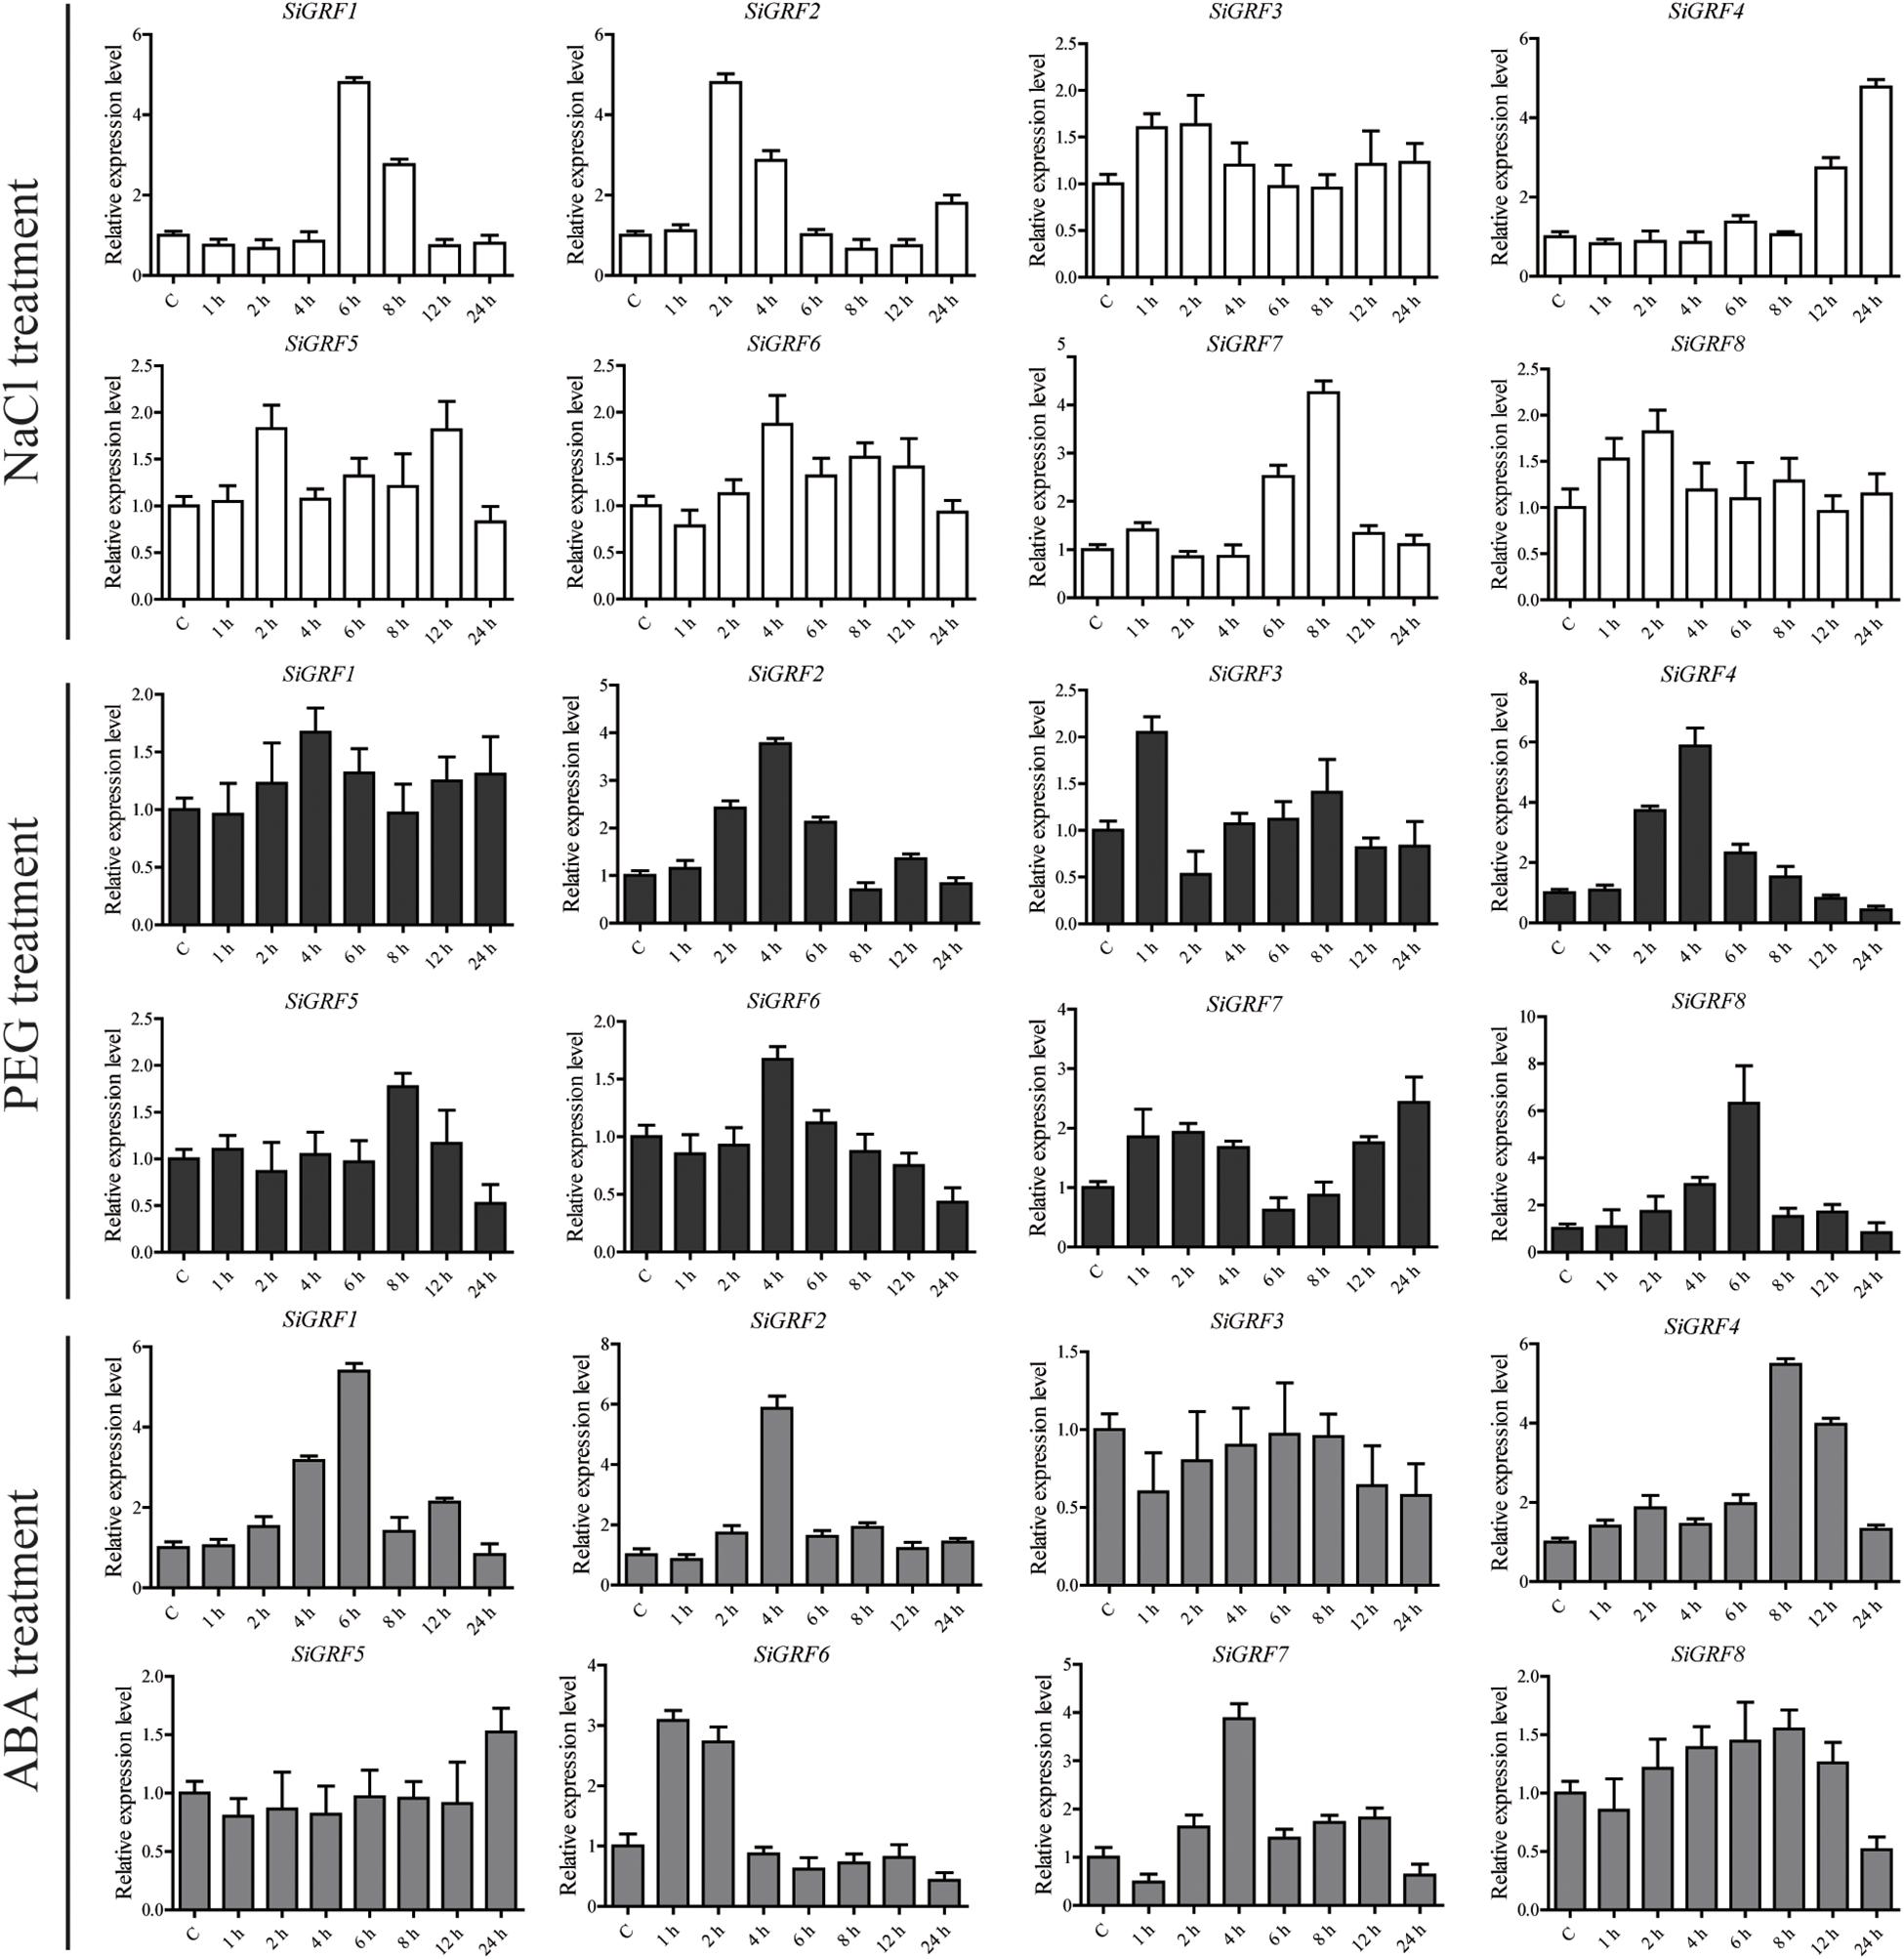
Figure 4. Relative expression levels of SiGRF genes analyzed using qPCR under treatment of salinity stress, 6% PEG, or ABA for 1, 2, 4, 6, 8, 12, or 24 h. The relative expression level of each gene was calculated relative to the expression in the respective untreated control samples (0 h). Foxtail millet SiActin (Si036655m) was used as an internal control to normalize the expression data. The error bars represent the standard deviation calculated based on three biological replicates.
Phenotypic Analysis of SiGRF-Transgenic A. thaliana
The full-length open reading frames of eight SiGRFs were obtained from foxtail millet cDNA and introduced into A. thaliana Col-0 to generate several 35S:SiGRF lines for each gene. Four overexpression lines of each SiGRF gene were selected for stress tolerance assays. Due to space limitations, we only show two lines (Supplementary Figures S1–S4). Under the control conditions, we observed no significant differences in the growth or morphology between SiGRF-OEs and Col-0 plants, with the exception of SiGRF1-OEs. The seed germination of SiGRF2-OEs to SiGRF7-OEs displayed a phenotype indistinguishable from that of Col-0 under the control condition (Supplementary Figures S1, S2). However, the germination of SiGRF5-OE, SiGRF6-OE, and SiGRF8-OE lines was faster than that of Col-0 under 0.5 μM ABA by ∼9, 5, and 11% on average in the third day after seed imbibition, respectively, and reached an extremely significant differences (P < 0.01) (Supplementary Figure S2). In the presence of 120 mM NaCl, the main roots of SiGRF4-OE and SiGRF5-OE lines were longer than Col-0 by ∼27 and 14% on average, respectively, and reached an extremely significant differences (P < 0.01) (Supplementary Figure S3, S4). When grown on 6% PEG medium, the numbers of lateral roots SiGRF2-OEs and SiGRF8-OEs were not significantly different from Col-0 plants, but their lateral roots lengths were significantly longer than that of the Col-0 plants by ∼34 and 26% on average, respectively (Supplementary Figure S3, S4). The main roots of SiGRF2-OE, SiGRF4-OE, SiGRF6-OE, and SiGRF8-OE lines were longer than that of the Col-0 plants by ∼26, 35, 22, and 17% on average under 0.5 μM ABA (Supplementary Figure S3, S4), and the lateral roots lengths SiGRF7-OE lines were longer than that of the Col-0 plants by ∼41% on average under 0.5 μM ABA (Supplementary Figure S3, S4).
SiGRF1-OEs had slightly lower germination rates and smaller leaves compared to Col-0 under the control condition (Supplementary Figure S1, S3 and Figures 5A,B). In the presence of 120 mM NaCl, 6% PEG or 0.5 μM ABA, the germination of SiGRF1-OEs was slower than that of Col-0 by ∼28, 26, and 34% on average in the second day after seed imbibition, respectively (Supplementary Figure S1). Their seedlings main root lengths were shorter compared to that of Col-0 by ∼52% on average, but the lateral roots of SiGRF1-OEs were longer than lateral roots of Col-0 by ∼15% under the 120 mM NaCl treatment (Supplementary Figure S1).
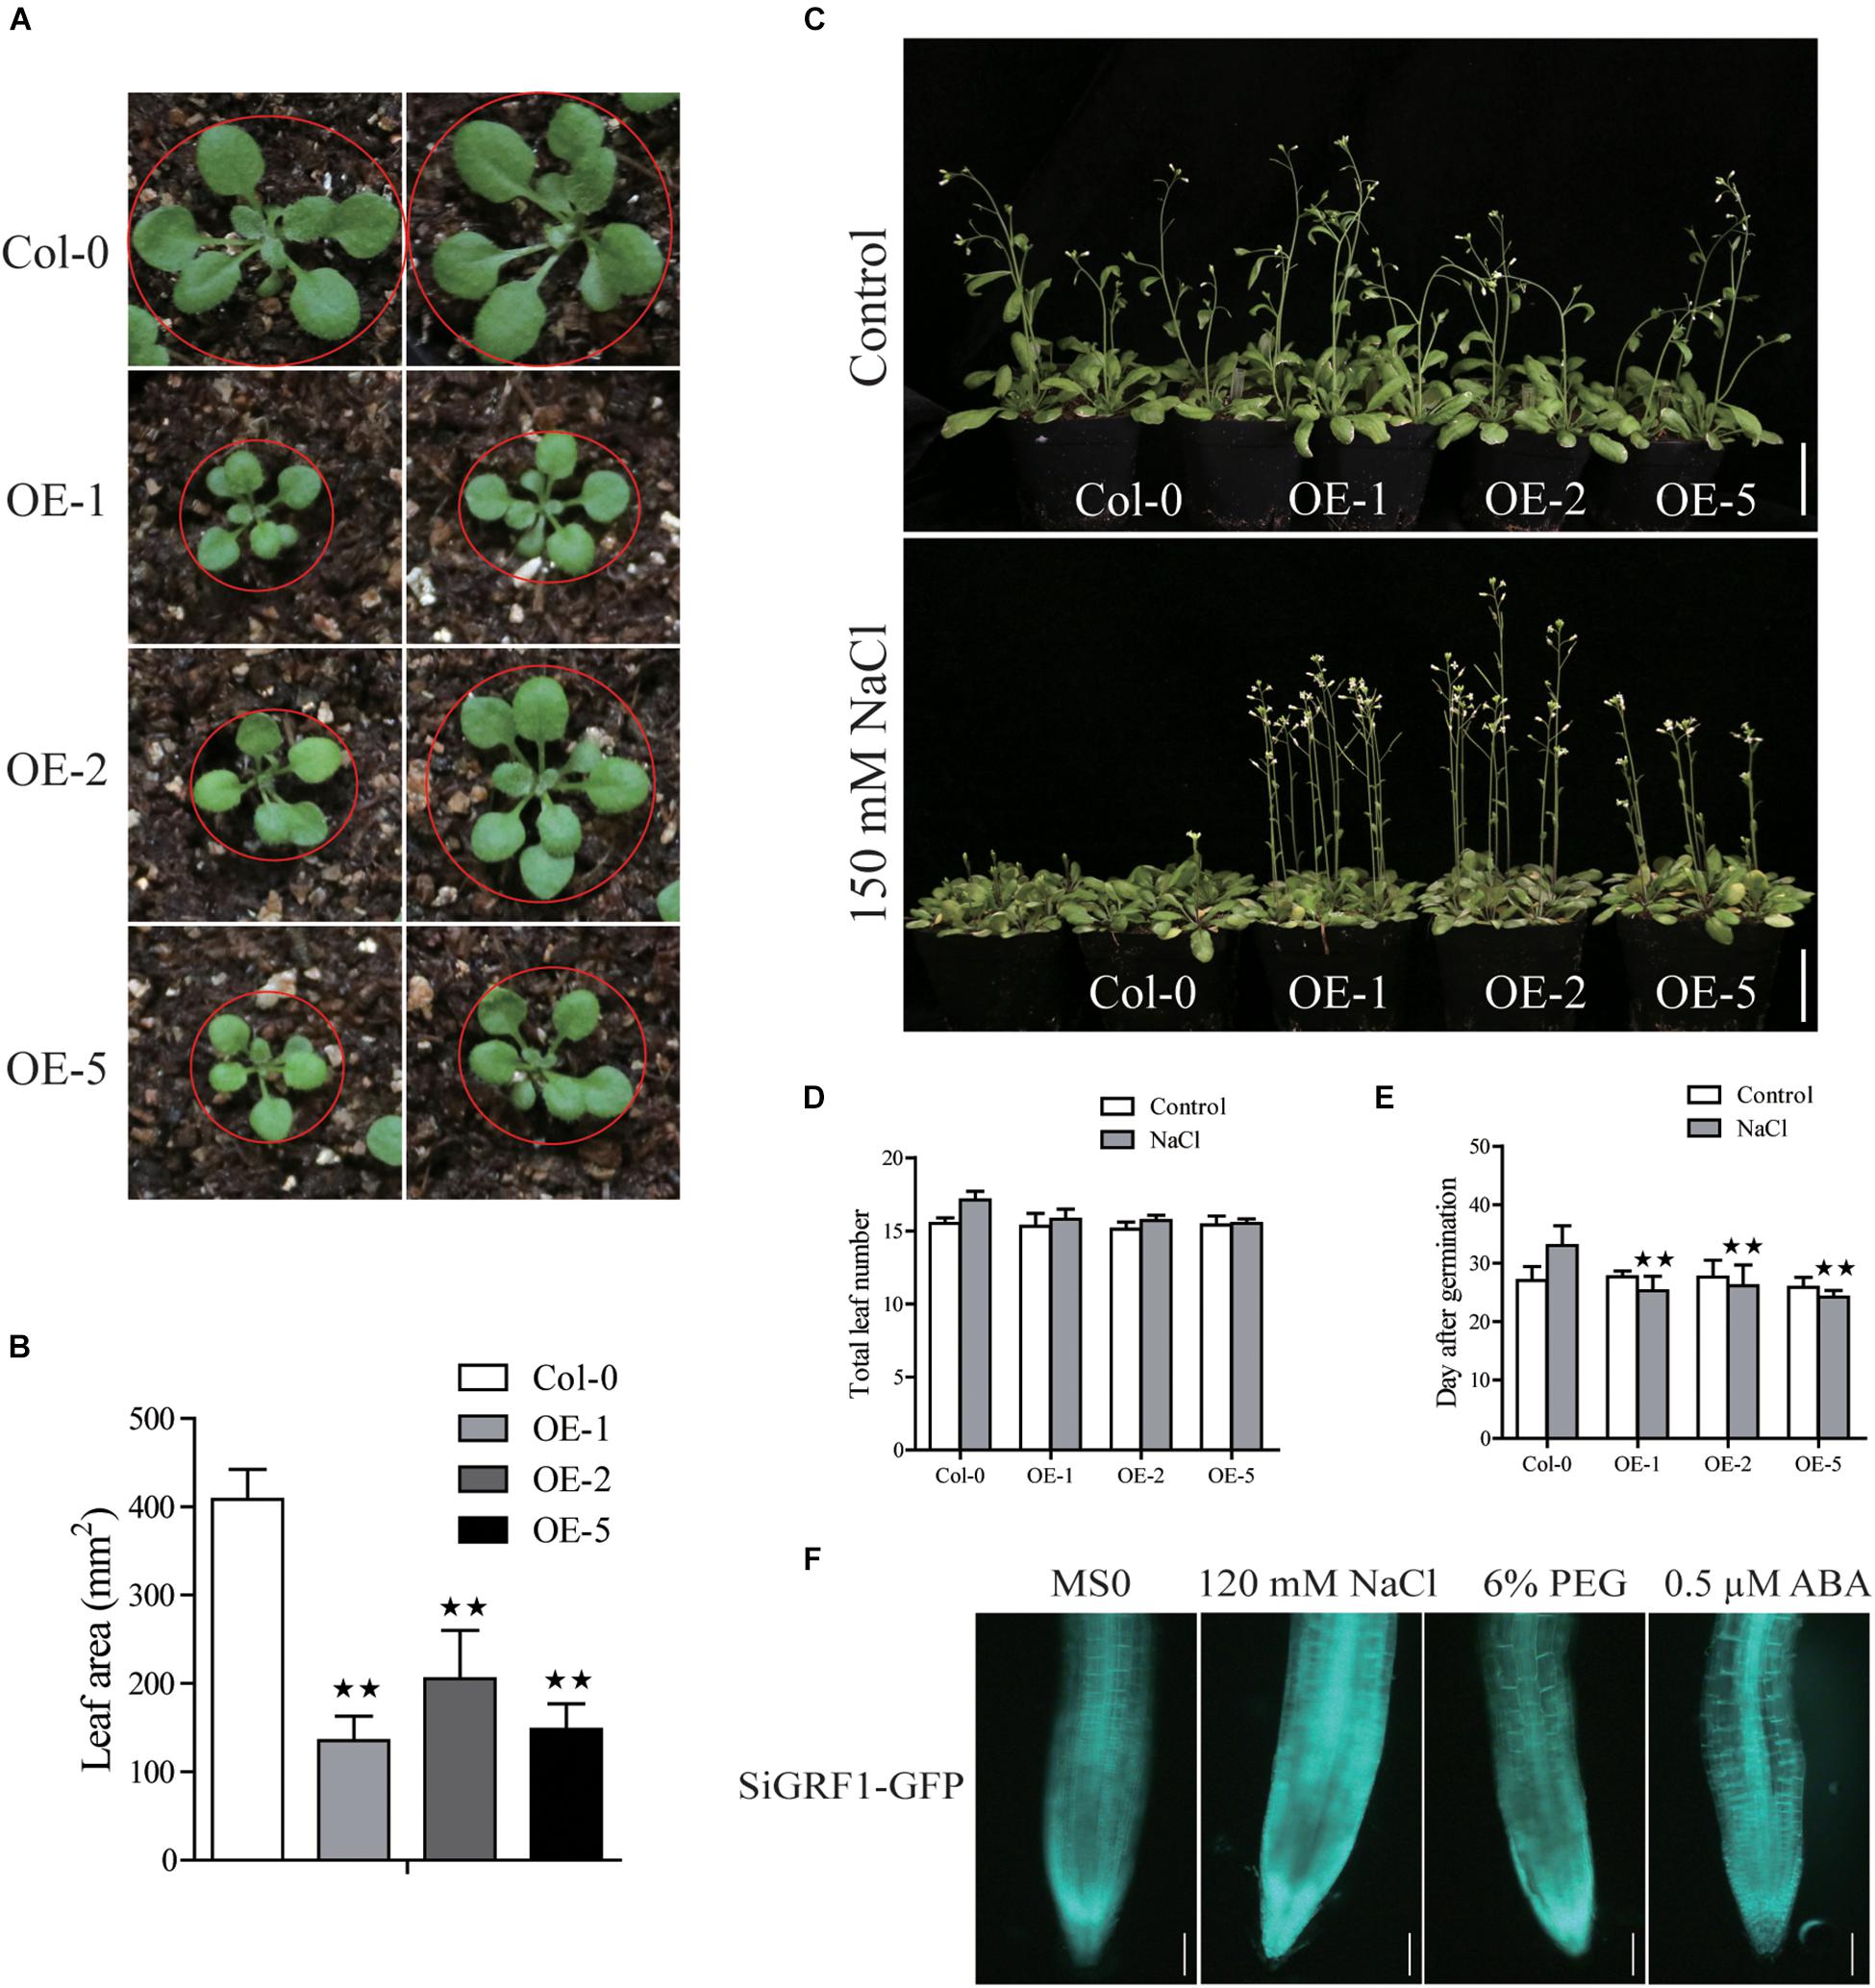
Figure 5. Phenotype analysis of SiGRF1-OEs. (A,B) SiGRF1-OEs have a smaller leaf size compared to that of the wild-type (Col-0) under the non-stressed condition. Bars = 1 cm. (C) The flowering time of SiGRF1-OEs under no stress and high salt stress. Bars = 5 cm. (D,E) Flowering days and number of leaves at flowering of SiGRF1-OEs under no stress and high salt stress. Data represent means ± SD (n = 100). (F) The GFP fluorescence signal of SiGRF1-OEs when plants were grown on MS medium with or without treatment of 120 mM NaCl, 6% PEG, or 0.5 μM ABA for 1 h. Bars = 0.1 cm. Asterisks (* and **) indicate significant differences (*P < 0.05 and **P < 0.01) compared with Col-0 (Student’s t-test).
Flowering of SiGRF1-OEs Was Relatively Insensitive to Salt Stress
Assays were performed to further characterize the function of SiGRF1. Under standard growth conditions, we observed no significant differences in the flowering initiation means dates and total leaf means numbers between SiGRF1-OEs and Col-0 plants (Figures 5C–E). The flowering time of SiGRF1-OEs occurred earlier than that of Col-0 by 6 days on average under high salt stress and earlier than that of untreated SiGRF1-OEs for 2 days on average (Figures 5C–E). We also observed that GFP fluorescence signals of SiGRF1-OEs increased significantly under the salt treatment compared to under the control condition (Figure 5F).
RNA-Seq Analysis of Gene Expression Associated With SiGRF1 Action
To identify changes in gene expression associated with SiGRF1 action, we performed an RNA-seq analysis of total RNA isolated from 2-week-old seedlings, comparing SiGRF1-OE line 1 plants to Col-0 plants. We identified 174 genes that were differentially expressed (log2 value ≥ 1.5-fold difference, p < 0.05), which comprised of 156 up-regulated genes and 18 down-regulated genes (Supplementary Table S6). DEGs were categorized into functional groups using Gene Ontology (GO) analyses. The top key GO terms were cellular process, response to stimulus, metabolic process, and development process (Figure 6A). Notably, the genes related to seed germination and flower development, suggesting that the phenotypes of SiGRF1-OE lines under normal and salt stress condition may be caused by abnormal expression of these genes (Supplementary Figure S3 and Figures 5, 6B). We used qPCR to further determine the expression level of these genes, including OLEOSIN1 (OLEO1), OLEOSIN2 (OLEO2), OLEOSIN4 (OLEO4), AT3G01570, EARLY LIGHT-INDUCABLE PROTEIN (ELIP1), WRKY71, CRUCIFERIN 3 (CRU3), AGAMOUS-like 67 (AGL67), MADS AFFECTING FLOWERING 4 (MAF4), and LIPID-TRANSFER PROTEIN (AT4G22460), to verify the accuracy of the RNA-seq analysis. The results show that the expression levels of these genes were roughly consistent with the RNA-seq analysis (Figure 6C). It is worth noting that the expression level of WRKY71 was significantly greater in SiGRF1-OE line 1 plants than the expression level of Col-0 plants under salt stress (Figures 6B,C), and Yu et al. (2018) has shown that WRKY71 acts antagonistically to salt-delayed flowering in A. thaliana. Furthermore, because flower initiation days of SiGRF1-OEs noticeably occurred earlier than that of Col-0 under high salt stress (Figure 5C), we suspect that the SiGRF1 gene may regulate expression of WRKY71 to induce the earlier flowering time in transgenic plants under salt stress.
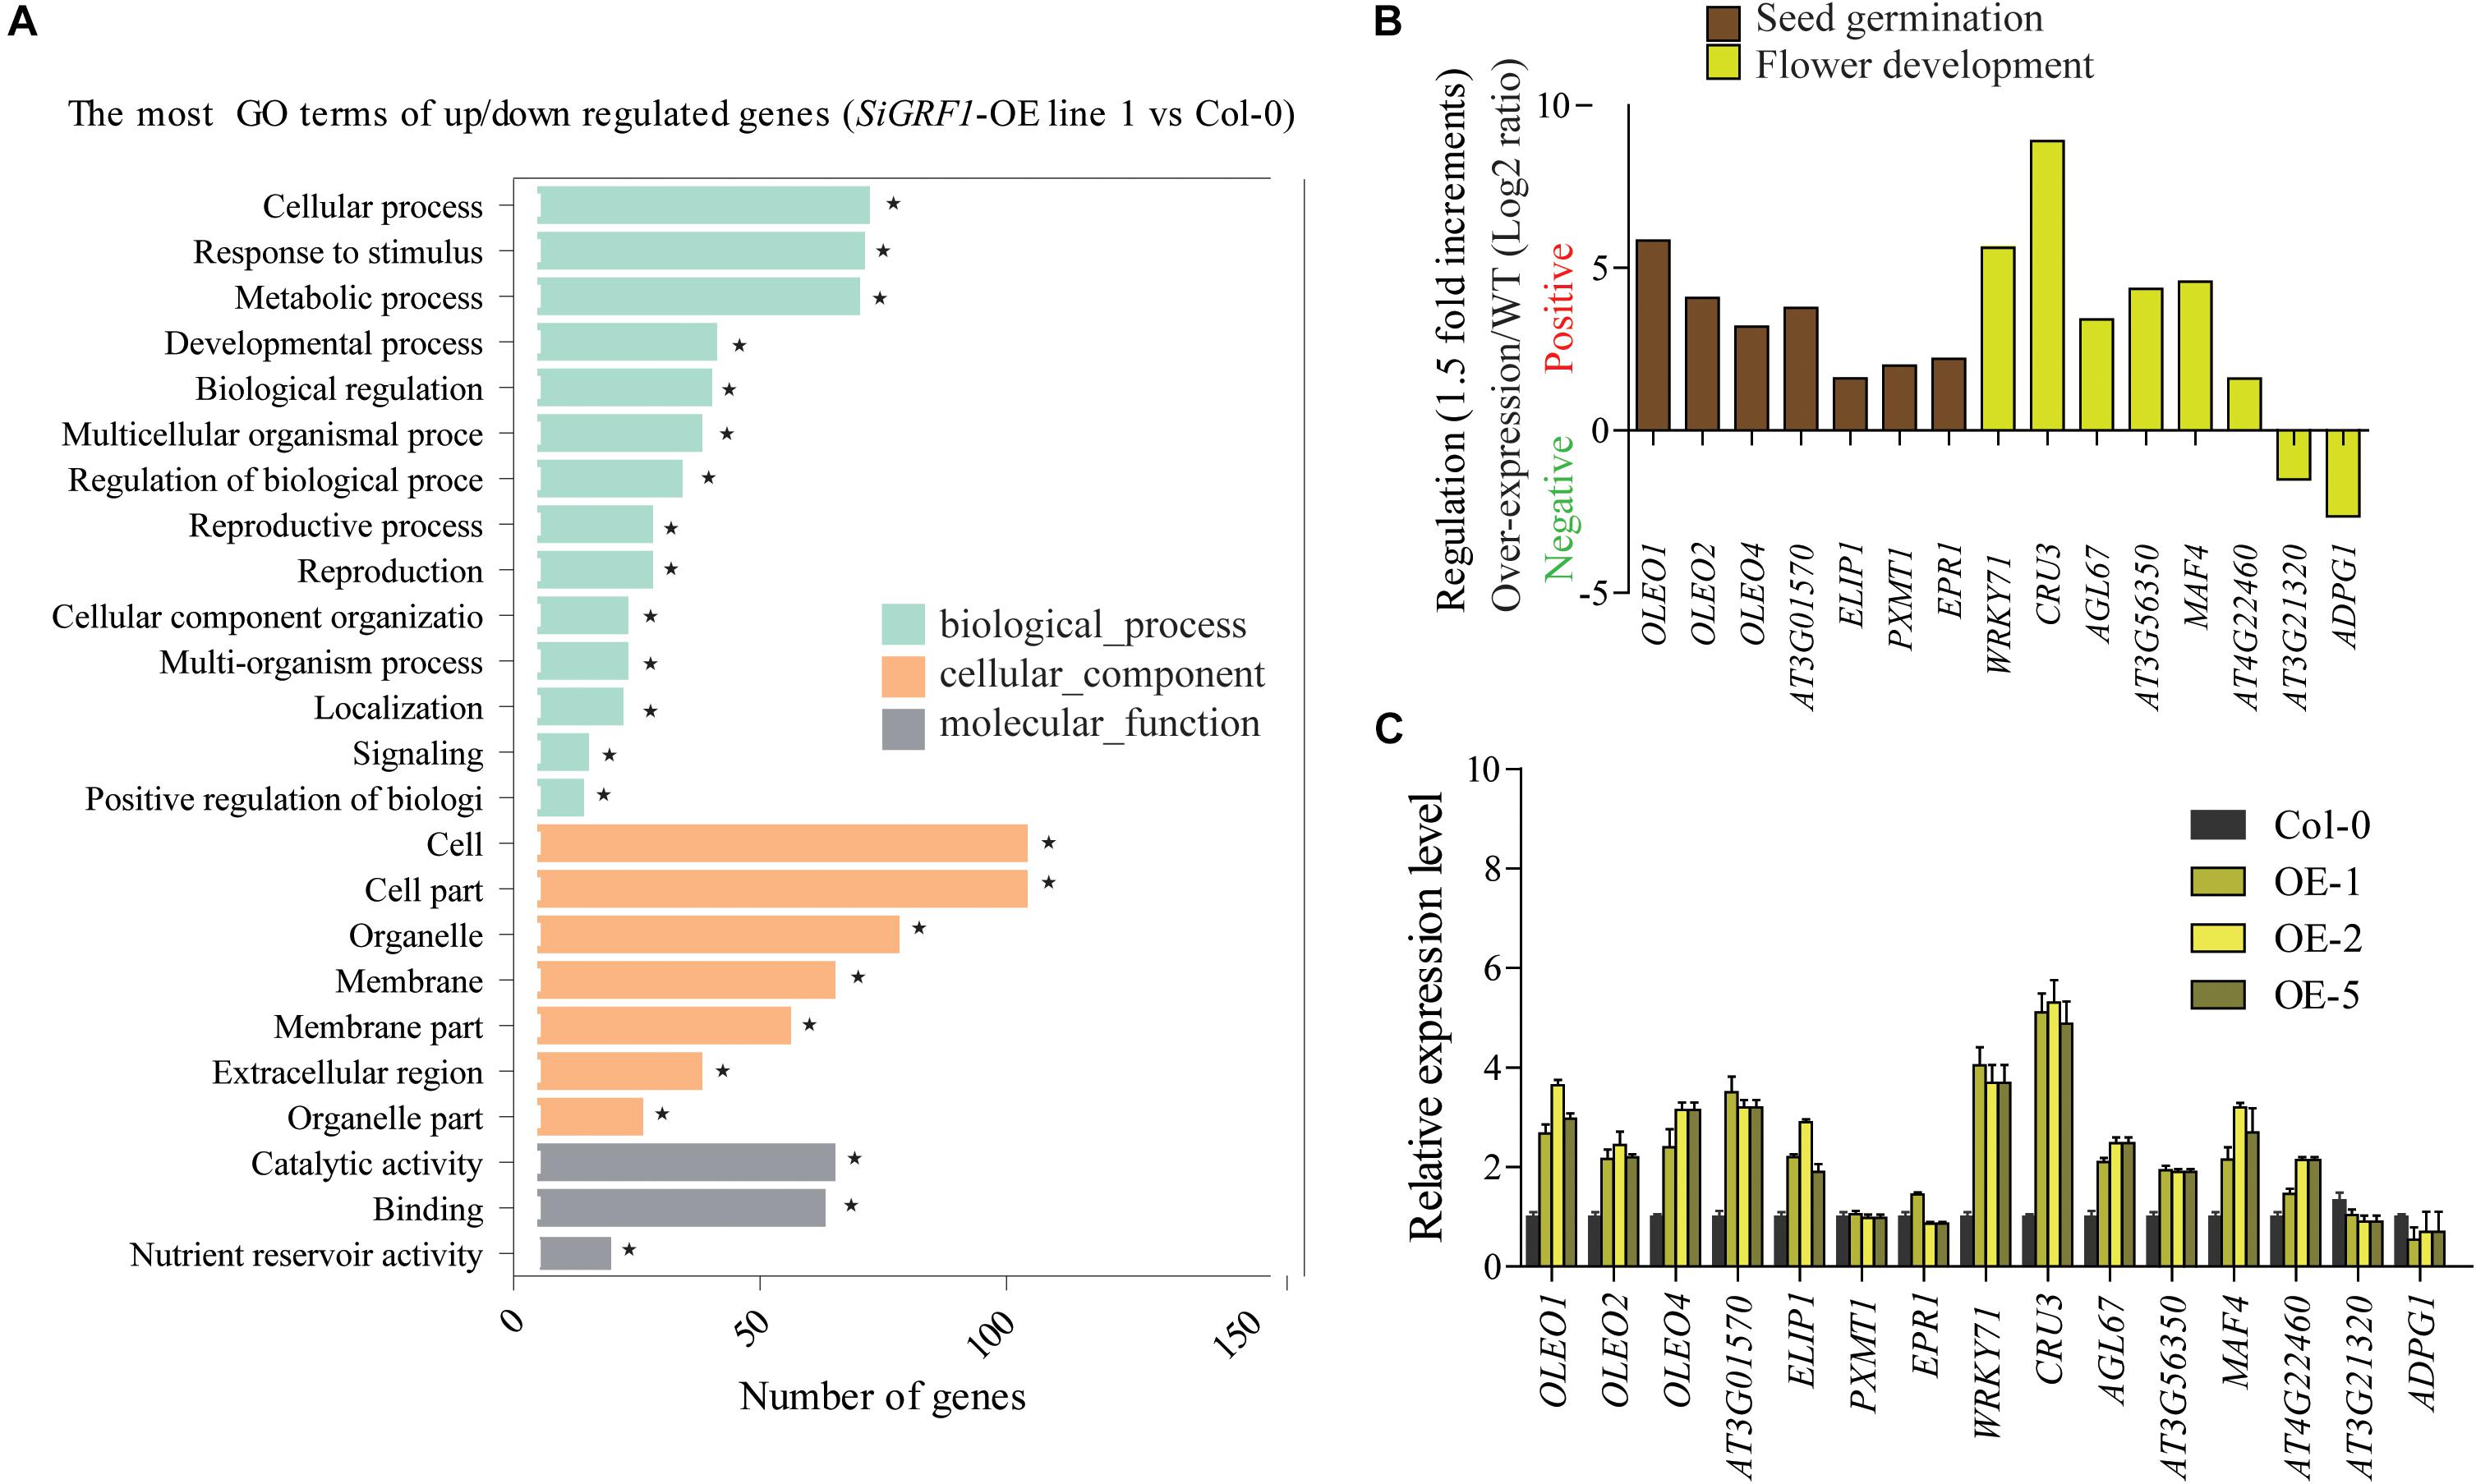
Figure 6. SiGRF1 activity can change the expression of genes related to seed germination, stress response, and flower development. (A) The enrichment of GO terms for genes that were differentially expressed between SiGRF1-OE line 1 and Col-0 was analyzed using RNA-seq. Vertical coordinates represent enriched GO terms, and horizontal coordinates represent the numbers of DEGs for these GO terms. The light green columns represent the GO terms for biological processes, orange columns represent the GO terms for cellular components, and gray columns represent the GO terms for molecular functions. Asterisks indicate significantly enriched GO terms. (B) Expression levels of genes related to seed germination and flower development from RNA-seq data. The brown columns represent seed germination, and the yellow columns represent flower development. (C) qPCR verified the accuracy of the RNA-seq data. Vertical coordinates represent fold changes, and horizontal coordinates represent different genes. The relative expression levels of those genes in Col-0 were set to “1.” Arabidopsis actin2 (AT3g18780) was used as a reference. Error bars indicate the SDs. The data represent the means ± SD of three biological replications. Asterisks (* and **) indicate significant differences (*P < 0.05 and **P < 0.01) compared with Col-0 (Student’s t-test).
We also observed that the expression of several flower-related marker genes in SiGRF1-OEs (Yu et al., 2018), including FLOWERING LOCUS T (FT), LEAFY (LFY), and FRUITFULL (FUL), were indistinguishable from those of Col-0 under the control condition (Figure 7). However, transcript levels of these genes in SiGRF1-OEs plants were significantly greater due to salt stress (Figure 7).
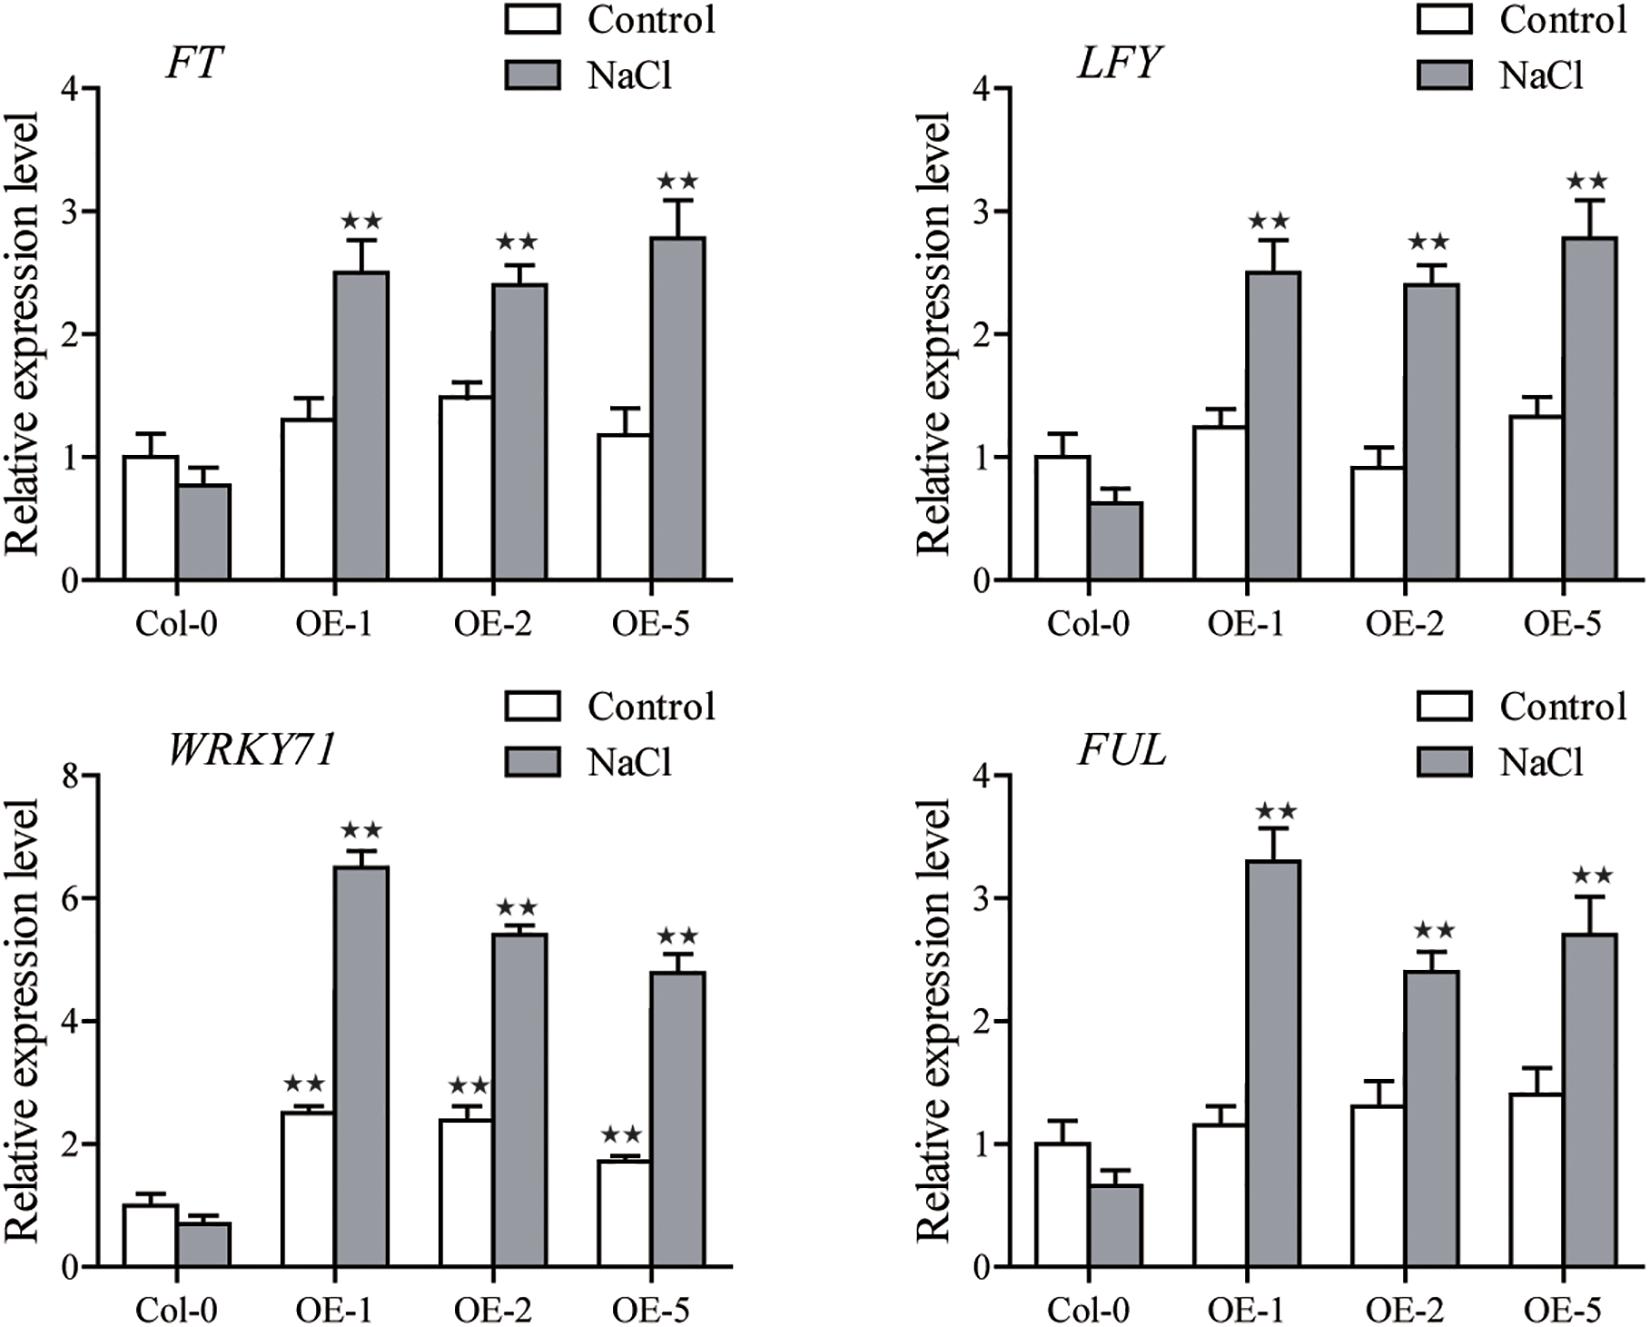
Figure 7. The expression levels of FLOWERING LOCUS T (FT), LEAFY (LFY), and FRUITFULL (FUL) in Col-0 and SiGRF1-OEs under no stress or salt stress conditions. Values obtained by qPCR represent means ± SD from three biological replicates. Asterisks (* and **) indicate significant differences (*P < 0.05 and **P < 0.01) compared with Col-0 (Student’s t-test).
Identification of SiGRF1 Target Proteins Using the Yeast Two-Hybrid System
The identification of protein partners should provide clues to understanding the function(s) of SiGRF1. To this end, we sought to identify possible SiGRF1 target proteins using a yeast two-hybrid approach. SiGRF1, as bait protein, was used to screen the foxtail millet cDNA library. Of ∼9 × 10⁷ primary transformants, 200 HIS-selected clones that showed LacZ activity were obtained. From these, 60 clones were randomly chosen and further analyzed by DNA sequencing. Twelve different cDNA clones contained sequences of SiRNF1/2 (Si021868m), a member of the ubiquitin–proteasome system encoding a E3 ubiquitin-protein ligase. Sadanandom et al. (2012) reported that cells can respond quickly to intracellular signals and varying environmental conditions because the ubiquitin–proteasome system was involved in many cell physiological processes in the removal of abnormal peptides and short-lived cytokines. The results prompted us to speculate whether or not SiGRF1 interacts physically with SiRNF1/2 and SiGRF1 might be hydrolyzed by the proteinase system.
SiGRF1 Interacted With SiRNF1/2
We next investigated the protein interactions between SiGRF1 and SiRNF1/2; the protein interactions observed in yeast were further investigated in planta (Figure 8A). For this, we used the BiFC analysis to confirm whether SiGRF1 associates with SiRNF1/2 in vivo. Constructs for expression of the fusion proteins SiGRF1-YNE and SiRNF1/2-YCE were transiently expressed in the protoplasts from foxtail millet seedlings. Different combinations of TaPI4KIIγ-YNE/TaUFD1 -YCE were used as positive controls because they have been shown to interact with each other in the plasma membrane (Liu et al., 2013), and GFP alone was the blank control. SiGRF1-YNE/SiRNF1/2-YCE and YNE/SiRNF1/2-YCE were co-transformed and the protoplasts were observed under a confocal microscope to detect yellow fluorescent protein (YFP) signals. The results showed that GFP alone was expressed throughout the cell, and TaPI4KIIγ-YNE interacted with TaUFD1-YCE in the plasma membrane (Figures 8B,C), which are consistent with results of previous research (Liu et al., 2013). A strong YFP signal was observed in the cytoplasm of the protoplast co-transformed with SiGRF1-YNE/SiRNF1/2-YCE plasmids (Figure 8D), whereas no YFP signal was detected in the absence of SiGRF1 or SiRNF1/2 (Figures 8E,F). These results suggest that the interactions between SiGRF1 and SiRNF1/2 occurred in the cytoplasm (Figure 8D). Subsequently, we performed co-immunoprecipitation assays in N. benthamiana leaf to further investigate whether SiGRF1 interacts with SiRNF1/2 in vivo. Green fluorescent protein and FLAG tags were translationally fused to the C-terminus of SiGRF1 and SiRNF1/2, respectively. Agrobacterium strain GV3101 carrying the 35S:SiGRF1-GFP, 35S:SiRNF1/2-FLAG, or 35S:p19 construct was co-infiltrated into a N. benthamiana leaf. Total protein was used for immunoblot analysis with anti-GFP and anti-FLAG antibodies (Figure 8G). Anti-GFP affinity gels were used to perform immunoprecipitation. After washing, immunoblots were probed with an anti-FLAG antibody. SiRNF1/2-FLAG was pulled-down using SiGRF1-GFP. These results showed that SiGRF1 interacts physically with SiRNF1/2 in the cytoplasm.
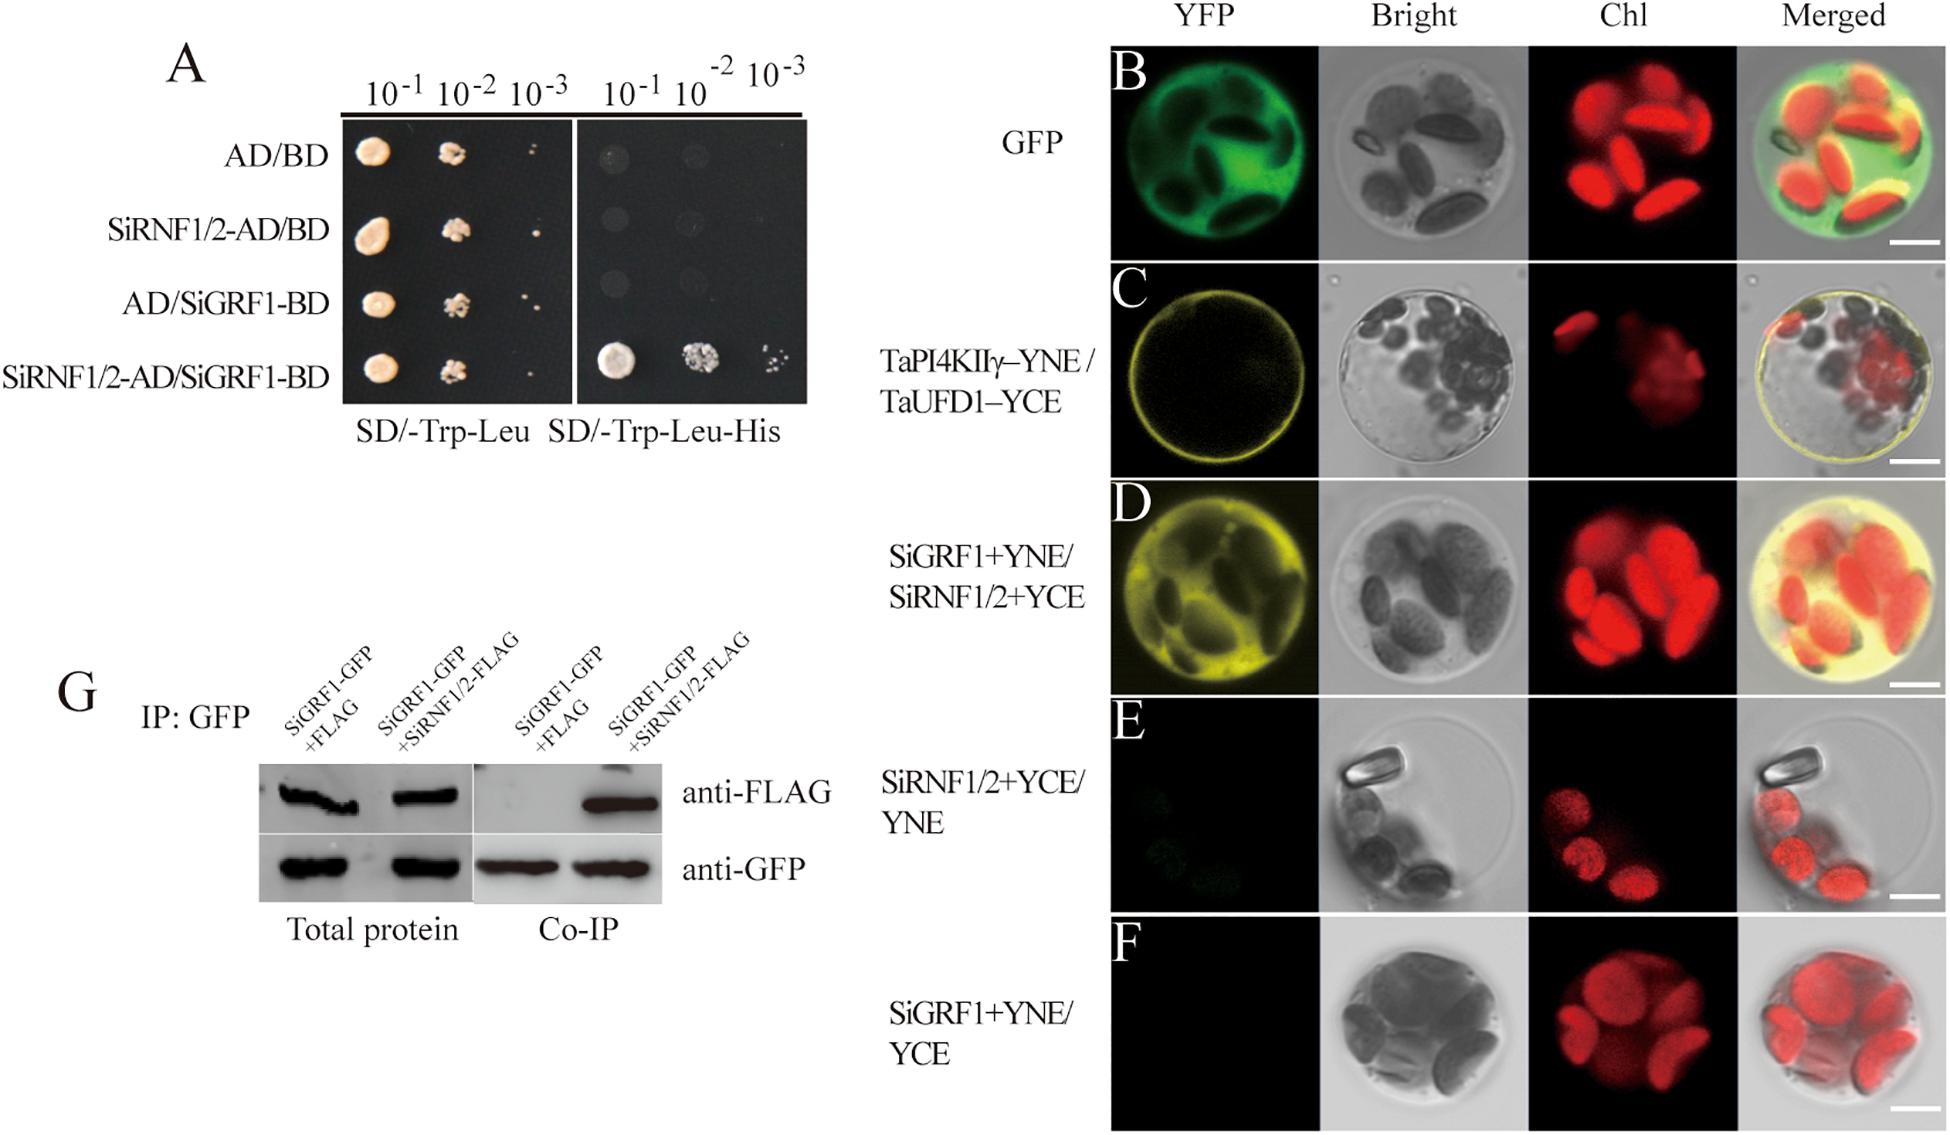
Figure 8. SiGRF1 interacted with SiRNF1/2 in vivo. (A) SiGRF1 interacted with SiRNF1/2 in yeast. Yeast strains expressing construct combinations of AD/BD, SiRNF1/2-AD/BD, AD/BD-SiGRF1, and SiRNF1/2-AD/BD-SiGRF1 were grown on media minus tryptophan and leucine (left panel) or minus tryptophan, leucine and histidine (right panel). (B) Green fluorescent protein localized throughout foxtail millet leaf protoplasts. (C) TaPI4KIIγ-YNE/TaUFD1-YCE was a positive control, TaPI4KIIγ and TaUFD1 can interact with each other in the plasma membrane. (D) Combinations of SiGRF1-YNE and SiRNF1/2-YCE were transiently co-expressed in foxtail millet leaf protoplasts. The YFP fluorescence indicates BiFC signals. Individual and merged images of YFP and Chl autofluorescence (Chl), as well as bright-field images of protoplasts are shown. Scale bars = 5 μm. (E) SiRNF1/2-YCE and YNE transiently co-expressed in foxtail millet leaf protoplasts. (F) SiGRF1-YNE and YCE transiently co-expressed in foxtail millet leaf protoplasts. (G) SiGRF1-SiRNF1/2 interaction analysis using Co-IP. Anti-GFP affinity gels were used for immunoprecipitation and an anti-FLAG antibody was used to detect SiRNF1/2.
Expression Analysis of SiGRF1
The SiGRF1 gene has four introns and five exons with an open reading frame of 789 bp and putatively encodes a 31.4 kD 14-3-3 protein. To evaluate the expression pattern of SiGRF1, we performed qPCR using mRNA from different organs of foxtail millet, including root, culm, leaf, panicle, sheath and node (Figure 9A). The results showed that SiGRF1 was expressed in different tissues, and the expression of SiGRF1 in panicles, leaves and node were higher than that in roots, culm, and leaf sheaths (Figure 9A). To further characterize the expression pattern of SiGRF1, the GUS (β-glucuronidase) reporter gene driven by the 2.5 kb promoter region of the SiGRF1 gene was introduced into A. thaliana. These transgenic lines were used for histochemical assays at different developmental stages (Figures 9B–K). We observed strong GUS activity in the root apical meristem (RAM) and root cap columella (Figure 9B), as well as the stele, lateral root primordium, and hypocotyl (Figures 9C–E). With the growth of plants, the SiGRF1 gene was expressed in the ripening siliques, sepals, pollen grains, petiole, mesophyll and stoma (Figures 9F–K).
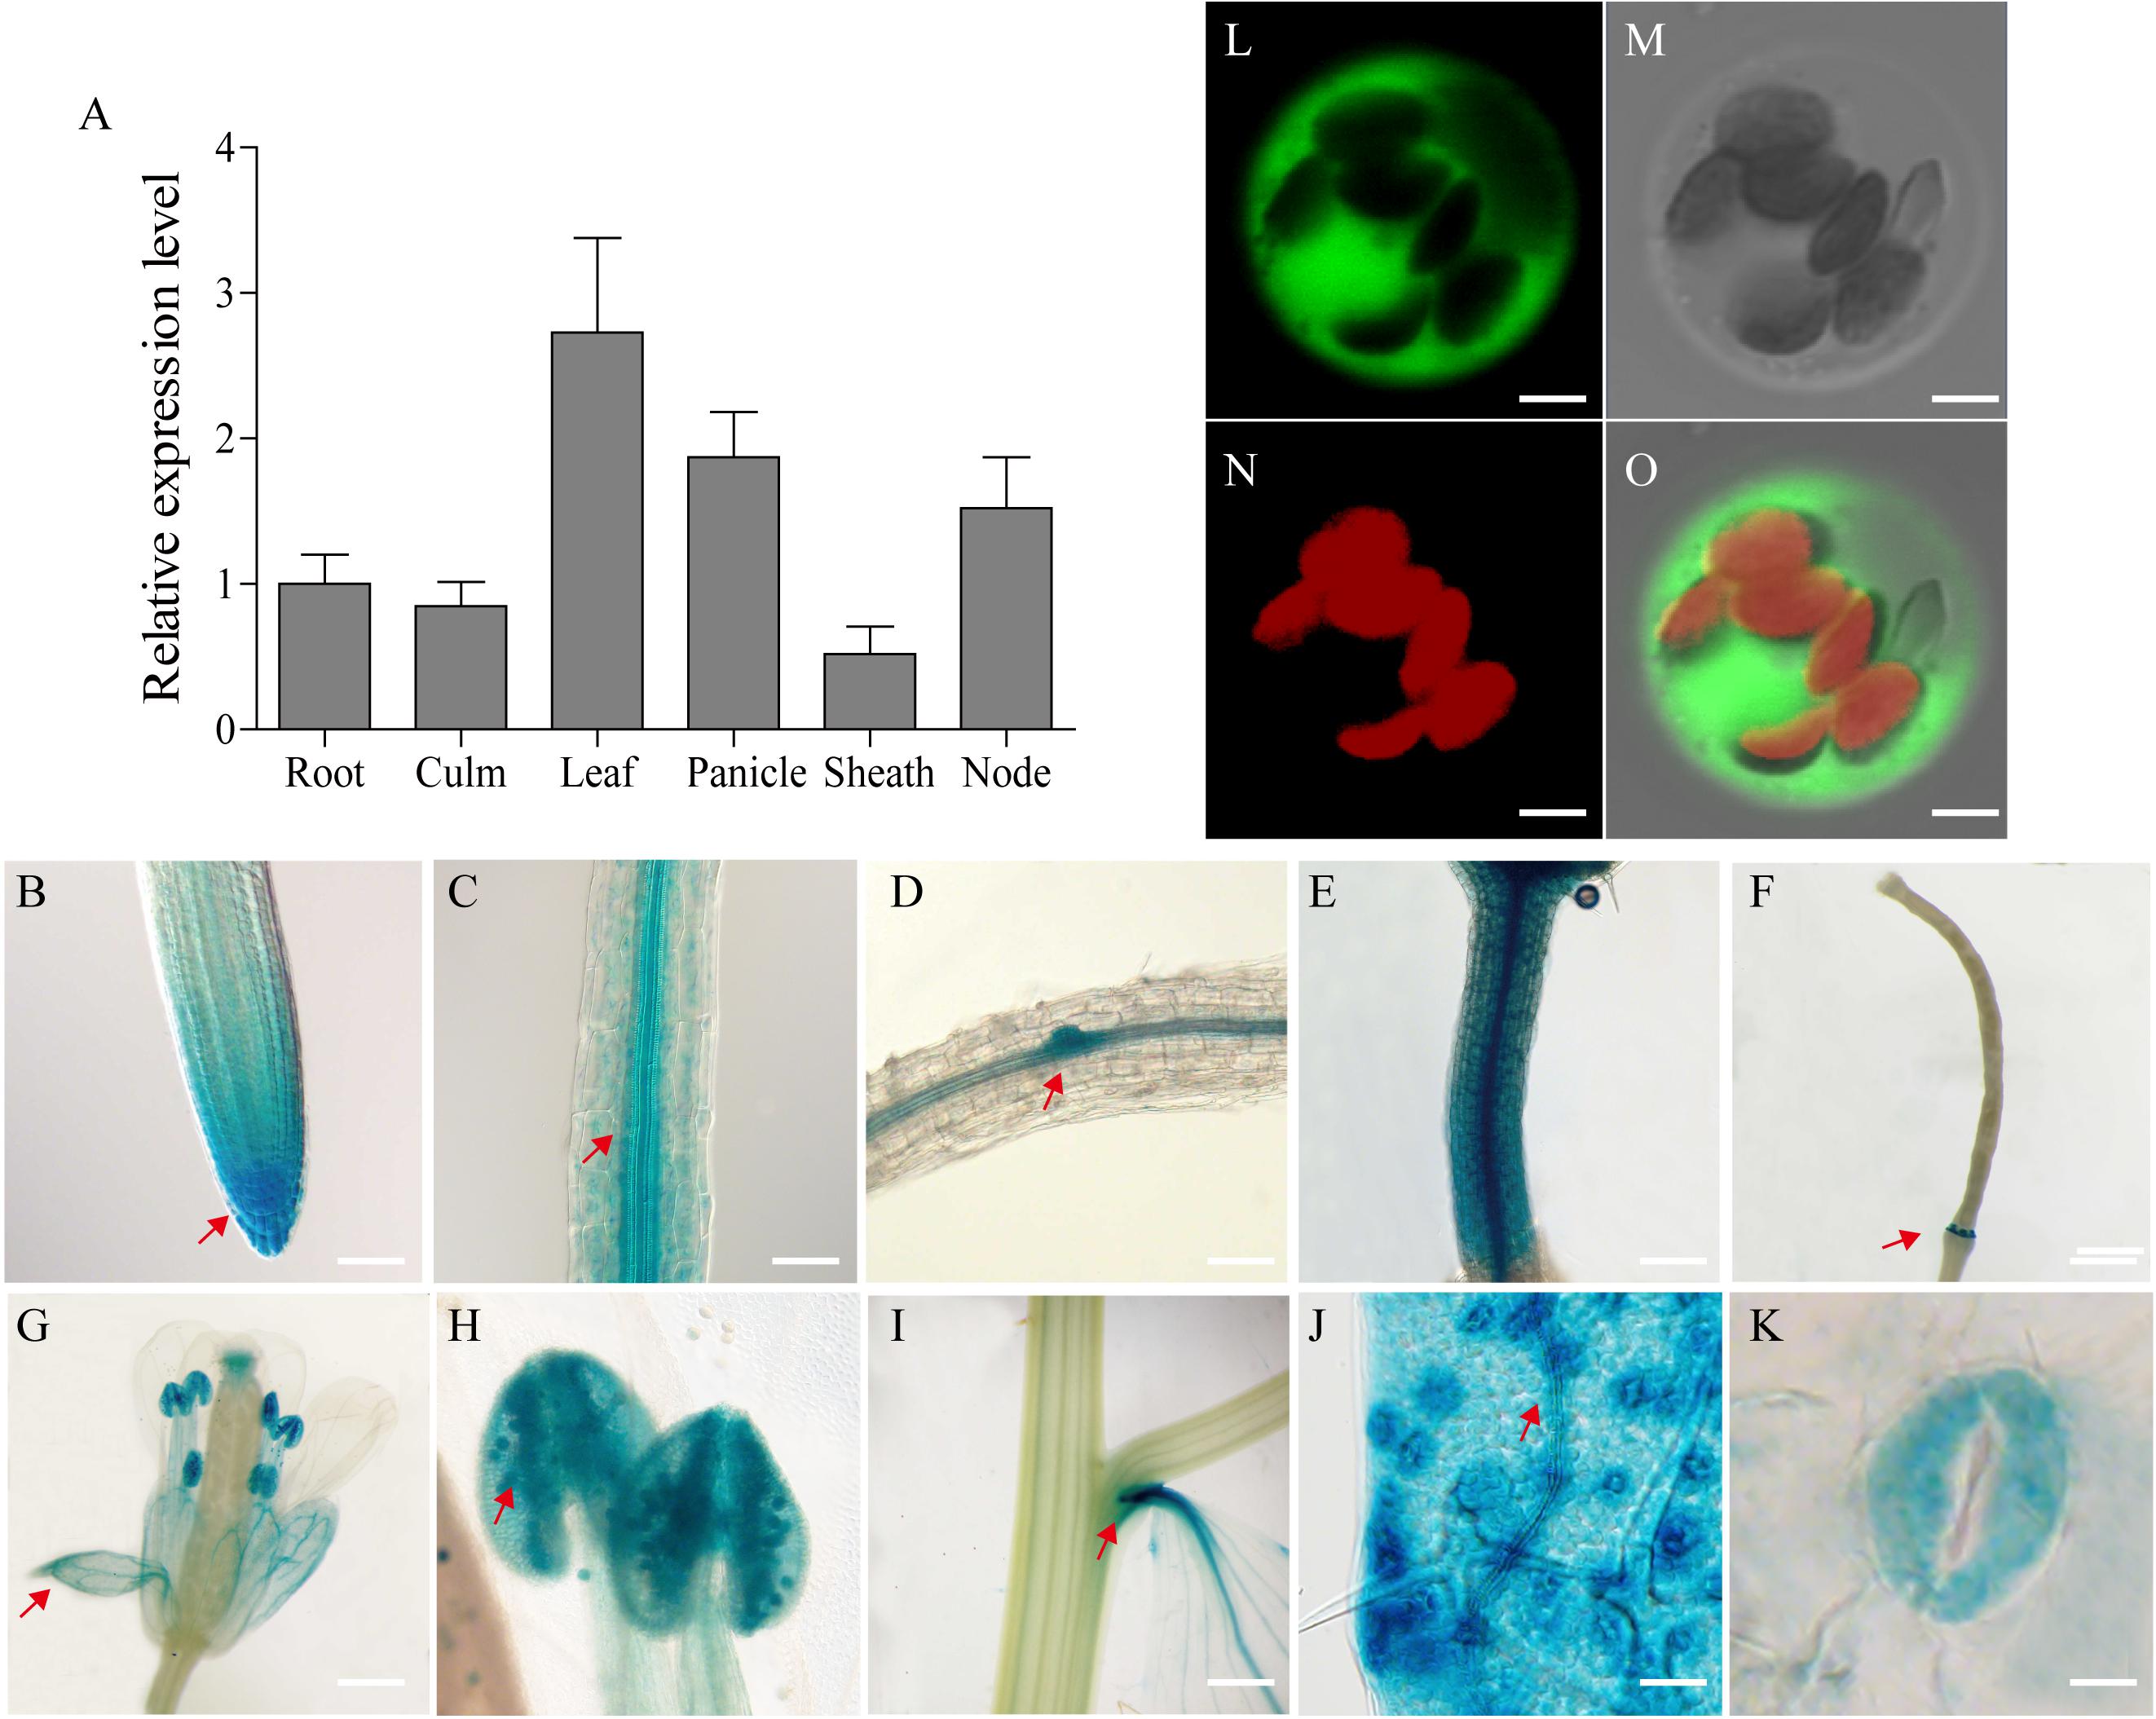
Figure 9. Tissue-specific expression of the SiGRF1 gene and subcellular localization of its coding protein. (A) Analysis by RT-PCR of SiGRF1 expression patterns. SiActin was used as the control. (B–K) Root apical meristem (RAM), root cap columella, stele, lateral root primordium, hypocotyl, ripening siliques, sepals, pollen grains, petiole, mesophyll, and stoma. Scale bars = 500 μm. (L–O) SiGRF1 localized to the cytoplasm. Green fluorescence indicates GFP and red fluorescence indicates stained protoplasts. Bars = 5 μm.
Subcellular Localization of SiGRF1 Protein
To explore the subcellular localization of the SiGRF1 protein, we transiently expressed the SiGRF1-GFP fusion gene in foxtail millet leaf protoplast. After an overnight incubation, the protoplasts were analyzed using a confocal microscope. We found that SiGRF1-GFP was localized only in the cytoplasm in foxtail millet protoplasts (Figures 9L–O).
Discussion
Phylogenetic Analysis and Functional Speculation of SiGRF Proteins
Highly conserved in all eukaryotes, 14-3-3 proteins are phosphopeptide-binding proteins (Aitken et al., 1992). In this study, we identified eight 14-3-3 proteins in the foxtail millet genome. Our results agree with the research of Kumar et al. (2015). The phylogenetic analysis of the 14-3-3s from seven species, including the eudicot A. thaliana and the monocots B. distachyon, O. sativa, T. aestivum, S. bicolor, Solanum lycopersicum, and foxtail millet, revealed that all of the 14-3-3 proteins can be categorized into 10 discrete groups (Clusters I to X). Furthermore, there appeared to be a species-specific aggregation of genes in the seven species, as exhibited by groups III, V, and IX (Figure 1), which suggests that gene function may have species specificity, and these genes may have expanded after the separation of monocots and dicots.
The sequences of SiGRF2, SiGRF3, and SiGRF5 have high similarity and were categorized into Cluster II. The three genes were also found to be weakly expressed in total aerial tissues under blue light and far red light treatments (Figure 3). Together, the data suggest that these genes may have functional redundancy in regulating plant light response. In addition, the homologous genes of SiGRF4 and SiGRF7 were T. aestivum TaWIN2 and TaWIN1, respectively. TaWIN1 and TaWIN2 can directly interact with WPK4, which is responsible for controlling the nitrogen metabolic pathway (Ikeda et al., 2000). We speculate that SiGRF4 and SiGRF7 may have similar functions to TaWIN2 and TaWIN1.
Expression Profiling of SiGRFs
Microarray analysis of the expression of the SiGRF genes in the four major foxtail millet tissues revealed that six of these genes were differentially expressed in at least one tissue. The tissue-specific expression profiling of SiGRFs could facilitate the combinatorial usage of SiGRFs in transcriptional regulation of different tissues, whereas ubiquitously expressed SiGRFs might regulate the transcription of a broad set of genes. Notably, SiGRF1 and SiGRF2 were strongly expressed only in the germ shoot but further investigation is needed to elucidate their potential functions. The low expression of SiGRF5, SiGRF7, and SiGRF8 observed in the leaf suggests that these three genes might be involved in the regulation of plant leaf development. Strong expression of SiGRF6 in all plant tissues suggest that this gene may be involved in many physiological processes (Figure 2). In addition, overexpression of the SiGRF gene likely reduced sensitivity of transgenic plants to abiotic stress and exogenous ABA during seed germination and seedling growth. However, the stress response mechanisms of SiGRF need further study.
14-3-3 Proteins Respond to Light
Current data clearly show plant 14-3-3 proteins are involved in many key physiological processes, ranging from metabolism to transport, biotic and abiotic stress responses, hormone signaling pathways (brassinosteroids, auxin, ABA, gibberellins, ethylene, cytokinins), plant growth and development, and flowering (Chen et al., 2006; Yuan et al., 2007; Barjaktaroviæ et al., 2009; Yekti Asih et al., 2009; Xiaohua et al., 2010; Denison et al., 2011; Sun et al., 2015; Camoni et al., 2018). For example, two A. thaliana proteins, 14-3-3μ and 14-3-3υ, influence transition to flowering and early phytochrome response; loss of function of 14-3-3μ and 14-3-3υ showed a delay in flowering of 3–5 days under LD conditions (Mayfield et al., 2007). In contrast, rice GF14c causes earlier flowering by 12–17 days, whereas overexpression of GF14C causes a 5–20 day delay in flowering under short day conditions (Yekti Asih et al., 2009). Additional protein interactions with 14-3-3s have been shown with CONSTANS, FT, PHOTOTROPIN1, and PHOTOTROPIN2 in Arabidopsis; FT orthologs of Heading Date 3A in rice (Mayfield et al., 2007); and SELF-PRUNING in tomato (Pnueli et al., 2001). These protein interactions function in floral photoperiodism, blue light signaling and the switching between determinate and indeterminate plants.
14-3-3 Proteins Respond to Salt Stress
Plants cannot move, so them has to face various environmental stresses during their life span, and flowering is crucial to successful reproduction in flowering plants. Therefore, in order to survive, plants have evolved a series of mechanisms to avoid, tolerate, or even resist hostile-environment stress signals to ensure reproduction (Levy and Dean, 1998). Previous studies have shown that pathogen infection, drought, and abnormal temperatures are able to accelerate flowering time (Korves, 2003; Meyre et al., 2004; Kumar et al., 2012; Xu et al., 2014). Salt stress is also considered as a negative factor on flowering time in most plants (Apse et al., 1999; Yu et al., 2017). Current research shows that salinity-delayed flowering is caused by a DELLA-dependent pathway. Salinity elevates the stability of DELLA proteins, which can restrain plant growth (Achard et al., 2006). In the quadruple-DELLA mutant, the response of salt-delayed flowering disappeared in plants under salt stress, and the expression level of LFY did not change under salt stress (Achard et al., 2006). Research shows NTM1-LIKE 8 mediates salinity-delayed flowering initiation via suppression of FT expression (Kim et al., 2007).
In addition, BROTHER OF FT AND TFL1 (BFT) overexpression in transgenic A. thaliana resulted in a delayed flowering phenotype when compared with that of the WT under normal or saline conditions. However, deletion of the BFT gene resulted in a normal flowering time in bft-1 mutants exposed to high salinity (Ryu et al., 2011). The constitutive high level of expression of WRKY71 can induce earlier flowering by promoting FT and LFY expression to act against the inhibition by DELLAs, BFT, etc. Overexpressing WRKY71 plants showed an early-flowering phenotype under high salinity conditions (Yu et al., 2017).
In this paper, we found a foxtail millet 14-3-3 protein (SiGRF1) involved in flowering in plants under salt stress. The flowering initiation time of SiGRF1-OEs occurred earlier than that of Col-0 under high salinity conditions. Similarly, the expression of WRKY71, FT, LFY, and FUL in SiGRF1-OEs was considerably higher than those in Col-0 under salinity-stressed conditions. Previous studies have shown that FT and LFY were the direct targets of WRKY71; FUL was also up-regulated by WRKY71 (Yu et al., 2017). The results suggest that the SiGRF1 gene may regulate the initiation date of flowering in plants exposed to salt stress by up-regulating the transcription level of WRKY71 to promote FT and LFY expression to act against the inhibition by DELLAs, BFT, etc. (Figure 10). Overall our findings suggest that SiGRF1 activity hastens flowering time, thereby providing a means for the plant to complete its life cycle and avoid further exposure to salt stress. Thus, we reveal a potential mechanism of plants to avoid environmental stresses.
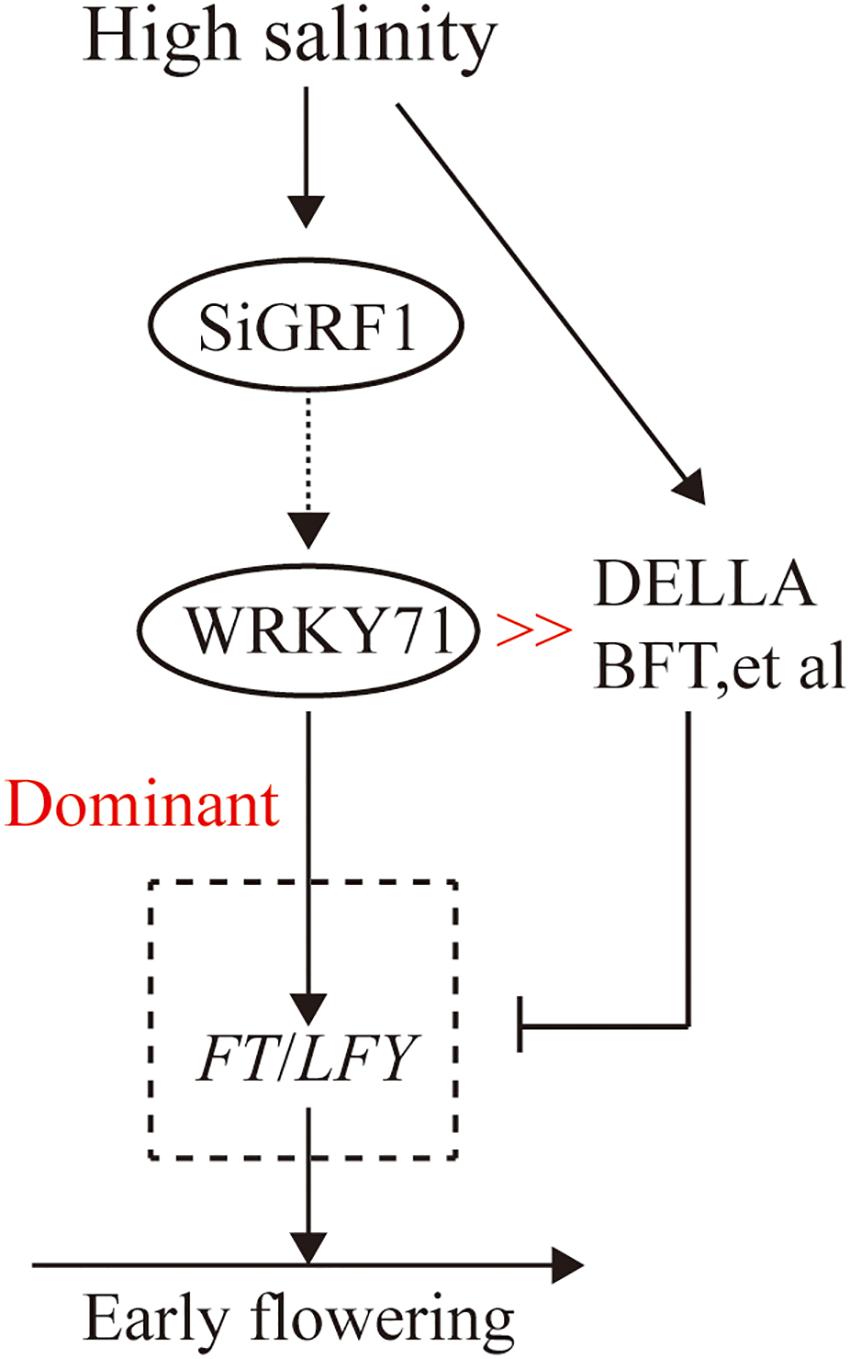
Figure 10. Proposed model of SiGRF1 function in flowering plants exposed to salinity treatment. High salinity promotes DELLAs, BFT, etc., and thereby inhibits FT and LFY expression. SiGRF1 is induced by high salinity, which induces WRKY71 to promote FT and LFY expression to act against their inhibition by DELLAs, BFT, etc. In the SiGRF1-OE plants under high salinity conditions, the highly elevated levels of gene expression of FT and LFY likely resulted in high levels of transcription. Thus SiGRF1-OE showed an early-flowering phenotype under high salinity conditions.
Data Availability Statement
The datasets generated for this study can be found in the NCBI SRA accession PRJNA611515.
Author ConTributions
WZ conceived and coordinated the project. JL designed experiments, edited the manuscript, analyzed data, and wrote the first draft of the manuscript. CJ analyzed data and performed experiments. LK and HZ provided analytical tools and managed reagents. YS and ZZ contributed valuable discussions. All authors have read and approved the final version of the manuscript.
Funding
This research was financially supported by the National Natural Science Foundation of China (31871611 and 31960622) and China Postdoctoral Science Foundation (2018M643751).
Conflict of Interest
The authors declare that the research was conducted in the absence of any commercial or financial relationships that could be construed as a potential conflict of interest.
Acknowledgments
This manuscript has been released as a pre-print at (bioRXiv, https://submit.biorxiv.org/) (Liu et al., 2019).
Supplementary Material
The Supplementary Material for this article can be found online at: https://www.frontiersin.org/articles/10.3389/fpls.2020.00449/full#supplementary-material
FIGURE S1 | The seed germination rates of SiGRF1-OEs, SiGRF2-OEs, SiGRF3-OEs, and SiGRF4-OEs under the no-stress and stress treatments. (A–E) Germination rates of seeds after 6 days in the presence or absence of 120 mM NaCl, 6% (w/v) PEG 6000, and 0.5 μM ABA. At least 100 seeds of each line were counted for the measurement, and the seed number was recorded every 12 h post-incubation for visible radical emergence as a proxy for seed germination. Each treatment contained three independent replicates.
FIGURE S2 | The seed germination rates of SiGRF5-OEs, SiGRF6-OEs, SiGRF7-OEs, and SiGRF8-OEs under the no-stress and stress treatments. (A–E) Germination rates of seeds after 6 days in the presence or absence of 120 mM NaCl, 6% (w/v) PEG 6000, and 0.5 μM ABA. At least 100 seeds of each line were counted for the measurement, and the seed number was recorded every 12 h post-incubation for visible radical emergence as a proxy for seed germination. Each treatment contained three independent replicates.
FIGURE S3 | Phenotypic comparison of root lengths of SiGRF1-OE, SiGRF2-OE, SiGRF3-OE, and SiGRF4-OE plants grown on MS medium with or without treatment of 120 mM NaCl, 6% PEG, or 0.5 μM ABA. (A) Images were recorded on day 5 after the transfer of 5-day-old seedlings from 1/2 MS medium to plates containing 120 mM NaCl, 6% PEG, or 0.5 μM ABA, White solid line indicates that plants promote root growth. Bars = 1 cm. (B,C) Effect of different stress treatments on root growth in Col-0 and transgenic plants. Data represent means ± SD (n = 30). Students t-tests were used to generate the P-values. *P < 0.05; **P < 0.01.
FIGURE S4 | Phenotypic comparison of root lengths of SiGRF5-OEs, SiGRF6-OEs, SiGRF7-OEs, and SiGRF8-OEs plants grown on MS medium with or without treatment of 120 mM NaCl, 6% PEG, or 0.5 μM ABA. (A) Images were recorded on day 5 after the transfer of 5-day-old seedlings from 1/2 MS medium to plates containing 120 mM NaCl, 6% PEG, or 0.5 μM ABA, White solid line indicates that plants promote root growth. Bars = 1 cm. (B,C) Effect of different stress treatments on root growth in Col-0 and transgenic plants. Data represent means ± SD (n = 30). Students t-tests were used to generate the P-values. *P < 0.05; **P < 0.01.
TABLE S1 | SiGRFs and SiRNF1/2 in foxtail millet. Detailed genomic information including domain/class, alias, ORF length, protein length, genomic locus (chromosomal location), number of introns within ORF, subcellular localization, isoelectric point, and molecular weight (kDa).
TABLE S2 | Characteristic features of 14-3-3 gene family members identified in seven species.
TABLE S3 | The sequences of primers used in the study. The sequences shown in lower case were added to generate a restriction enzyme site.
TABLE S4 | Average log signal values of SiGRF protein-encoding genes from three biological replicates of each sample.
TABLE S5 | Average log signal values of SiGRF genes subjected to ammonia, drought, nitrate, urea, dark, blue, red, and far red light treatments.
TABLE S6 | RNA-Seq analysis of gene expression associated with SiGRF1 action. Total RNA isolated from 2-week-old seedlings, comparing SiGRF1-OE line 1 plants to Col-0 plants.
Footnotes
- ^ http://Pfam.sanger.ac.uk/
- ^ http://blast.ncbi.nlm.nih.gov/Blast.cgi
- ^ https://phytozome.jgi.doe.gov/pz/portal.html
- ^ https://phytozome.jgi.doe.gov/pz/portal.html
- ^ https://phytozome.jgi.doe.gov/pz/portal.html
References
Achard, P., Cheng, H., De Grauwe, L., Decat, J., Schoutteten, H., and Moritz, T. (2006). Integration of plant responses to environmentally activated phytohormonal signals. Science 311, 91–94. doi: 10.1126/science.1118642
Aitken, A., Collinge, D. B., Heusden, B. P. H. V., Isobe, T., Roseboom, P. H., Rosenfeld, G., et al. (1992). 14-3-3 proteins: a highly conserved, widespread family of eukaryotic proteins. Trends Biochem. Sci. 17, 498–501. doi: 10.1016/0968-0004(92)90339-b
Apse, M. P., Aharon, G. S., Snedden, W. A., and Blumwald, E. (1999). Salt tolerance conferred by overexpression of a vacuolar Na+/H+ Antiport in Arabidopsis. Science 285, 1256–1258. doi: 10.1126/science.285.5431.1256
Barjaktaroviæ, Z., Schütz, W., Madlung, J., Fladerer, C., Nordheim, A., and Hampp, R. (2009). Changes in the effective gravitational field strength affect the state of phosphorylation of stress-related proteins in callus cultures of Arabidopsis thaliana. J. Exp. Bot. 60, 779–789. doi: 10.1093/jxb/ern324
Camoni, L., Visconti, S., Aducci, P., and Marra, M. (2018). 14-3-3 proteins in plant hormone signaling: doing several things at once. Front. Plant Sci. 9:297. doi: 10.3389/fpls.2018.00297
Caroline, S., Marlène, D., Turk, B. E., Michel, Z., BenoT, V., Jeffrey, L., et al. (2010). The Arabidopsis ABA-activated kinase OST1 phosphorylates the bZIP transcription factor ABF3 and creates a 14-3-3 binding site involved in its turnover. PLoS One 5:e13935. doi: 10.1371/journal.pone.0013935
Chen, F., Li, Q., Sun, L., and He, Z. (2006). The rice 14-3-3 gene family and its involvement in responses to biotic and abiotic stress. DNA Res. 13:53. doi: 10.1093/dnares/dsl001
Chen, Y., Zhou, X., Chang, S., Chu, Z., Wang, H., Han, S., et al. (2017). Calcium-dependent protein kinase 21 phosphorylates 14-3-3 proteins in response to ABA signaling and salt stress in rice. Biochem. Biophys. Res. Commun. 493, 1450–1456. doi: 10.1016/j.bbrc.2017.09.166
Denison, F. C., Paul, A.-L., Zupanska, A. K., and Ferl, R. J. (2011). 14-3-3 proteins in plant physiology. Semin. Cell Dev. Biol. 22, 720–727.
Doust, A. N., Kellogg, E. A., Devos, K. M., and Bennetzen, J. L. (2009). Foxtail millet: a sequence-driven grass model system. Plant Physiol. 149, 137–141. doi: 10.1104/pp.108.129627
Gokirmak, T., Paul, A. L., and Ferl, R. J. (2010). Plant phosphopeptide-binding proteins as signaling mediators. Curr. Opin. Plant Biol. 13, 527–532. doi: 10.1016/j.pbi.2010.06.001
Ikeda, Y., Koizumi, N., Kusano, T., and Sano, H. (2000). Specific binding of a 14-3-3 protein to autophosphorylated WPK4, an SNF1-related wheat protein kinase, and to WPK4-phosphorylated nitrate reductase. J. Biol. Chem. 275:31695. doi: 10.1074/jbc.m004892200
Jeon, J. S., Lee, S., Jung, K. H., Jun, S. H., Jeong, D. H., Lee, J., et al. (2000). T-DNA insertional mutagenesis for functional genomics in rice. Plant J. 22, 561–570.
Kim, S. G., Kim, S.-Y., and Park, C.-M. (2007). A membrane-associated NAC transcription factor regulates salt-responsive flowering via FLOWERING LOCUS T in Arabidopsis. Planta 226, 647–654. doi: 10.1007/s00425-007-0513-3
Korves, M. T. (2003). A developmental response to pathogen infection in Arabidopsis. Plant Physiol. 133, 339–347. doi: 10.1104/pp.103.027094
Kumar, K., Muthamilarasan, M., Bonthala, V. S., Roy, R., and Prasad, M. (2015). Unraveling 14-3-3 proteins in C4 panicoids with emphasis on model plant Setaria italica reveals phosphorylation-dependent subcellular localization of RS splicing factor. PLoS One 10:e0123236. doi: 10.1371/journal.pone.0123236
Kumar, S. V., Lucyshyn, D., Jaeger, K. E., Alós, E., Alvey, E., Harberd, N. P., et al. (2012). Transcription factor PIF4 controls the thermosensory activation of flowering. Nature 484, 242–245. doi: 10.1038/nature10928
Lata, C., Gupta, S., and Prasad, M. (2013). Foxtail millet: a model crop for genetic and genomic studies in bioenergy grasses. Crit. Rev. Biotechnol 33, 328–343. doi: 10.3109/07388551.2012.716809
Li, X., and Dhaubhadel, S. (2011). Soybean 14-3-3 gene family: identification and molecular characterization. Planta 233, 569–582. doi: 10.1007/s00425-010-1315-6
Liu, J., Jiang, C., Kang, L., Zhang, C., Song, Y., and Zheng, W. J. (2019). Over-expression of a 14-3-3 protein from Foxtail Millet improves plant tolerance to salinity stress in Arabidopsis thaliana. bioRxiv [Preprint].
Liu, J. M., Xu, Z. S., Lu, P. P., Li, W. W., Chen, M., Guo, C. H., et al. (2016a). Genome-wide investigation and expression analyses of the pentatricopeptide repeat protein gene family in foxtail millet. BMC Genomics 17:840. doi: 10.1186/s12864-016-3184-2
Liu, J. M., Zhao, J. Y., Lu, P. P., Chen, M., Guo, C. H., Xu, Z. S., et al. (2016b). The E-subgroup pentatricopeptide repeat protein family in Arabidopsis thaliana and confirmation of the responsiveness ppr96 to abiotic stresses. Front. Plant Sci. 7:1825. doi: 10.3389/fpls.2016.01825
Liu, P., Xu, Z. S., Pan-Pan, L., Hu, D., Chen, M., Li, L. C., et al. (2013). A wheat PI4K gene whose product possesses threonine autophophorylation activity confers tolerance to drought and salt in Arabidopsis. J. Exp. Bot. 64, 2915–2927. doi: 10.1093/jxb/ert133
Livak, K. J., and Schmittgen, T. D. (2001). Analysis of relative gene expression data using real-time quantitative PCR and the 2-ΔΔCT method. Methods 25, 402–408. doi: 10.1006/meth.2001.1262
Ma, X., Qiao, Z., Chen, D., Yang, W., Zhou, R., Zhang, W., et al. (2015). CYCLIN-DEPENDENT KINASE G2 regulates salinity stress response and salt mediated flowering in Arabidopsis thaliana. Plant Mol. Biol. 88, 287–299. doi: 10.1007/s11103-015-0324-z
Mayfield, J. D., Folta, K. M., Paul, A. L., and Ferl, R. J. (2007). The 14-3-3 proteins μ and v Influence transition to flowering and early phytochrome response. Plant Physiol. 145, 1692–1702. doi: 10.1104/pp.107.108654
Meyre, D., Leonardi, A., Brisson, G., and Vartanian, N. (2004). Drought-adaptive mechanisms involved in the escape/tolerance strategies of Arabidopsis Landsberg erecta and Columbia ecotypes and their F1 reciprocal progeny. J. Plant Physiol. 158, 0–1152.
Muslin, A. J., Tanner, J. W., Allen, P. M., and Shaw, A. S. (1996). Interaction of 14-3-3 with signaling proteins is mediated by the recognition of phosphoserine. Cell 84, 889–897. doi: 10.1016/s0092-8674(00)81067-3
Pnueli, L., Gutfinger, T., Hareven, D., Ben-Naim, O., Ron, N., Adir, N., et al. (2001). Tomato SP-interacting proteins define a conserved signaling system that regulates shoot architecture and flowering. Plant Cell 13, 2687–2702. doi: 10.1105/tpc.13.12.2687
Ryu, J. Y., Park, C.-M., and Seo, P. J. (2011). The floral repressor BROTHER OF FT AND TFL1 (BFT) modulates flowering initiation under high salinity in Arabidopsis. Mol. Cells 32, 295–303. doi: 10.1007/s10059-011-0112-9
Sadanandom, A., Bailey, M., Ewan, R., Lee, J., and Nelis, S. (2012). The ubiquitin-proteasome system: central modifier of plant signalling. N. Phytol. 196, 13–28. doi: 10.1111/j.1469-8137.2012.04266.x
Saghai-Maroof, M. A., Soliman, K. M., Jorgensen, R. A., and Allard, R. (1984). Ribosomal DNA spacer-length polymorphisms in barley: mendelian inheritance, chromosomal location, and population dynamics. Proc. Natl. Acad. Sci. U.S.A. 81, 8014–8018. doi: 10.1073/pnas.81.24.8014
Schoonheim, P., Sinnige, M., Casaretto, J., Veiga, H., Bunney, T., Quatrano, R., et al. (2010). 14-3-3 adaptor proteins are intermediates in ABA signal transduction during barley seed germination. Plant J. 49, 289–301. doi: 10.1111/j.1365-313x.2006.02955.x
Sun, X., Sun, M., Jia, B., Chen, C., Qin, Z., Yang, K., et al. (2015). A 14-3-3 family protein from wild soybean (Glycine Soja) regulates ABA sensitivity in Arabidopsis. PLoS One 10:e0146163. doi: 10.1371/journal.pone.0146163
Tamura, K., Peterson, D., Peterson, N., Stecher, G., Nei, M., and Kumar, S. (2011). MEGA5: molecular evolutionary genetics analysis using maximum likelihood, evolutionary distance, and maximum parsimony methods. Mol. Biol. Evol. 28, 2731–2739. doi: 10.1093/molbev/msr121
Thompson, J. D., Gibson, T. J., Plewniak, F., Jeanmougin, F., and Higgins, D. G. (1997). The CLUSTAL_X windows interface: flexible strategies for multiple sequence alignment aided by quality analysis tools. Nucleic Acids Res. 25, 4876–4882. doi: 10.1093/nar/25.24.4876
Viso, F. D., Casaretto, J. A., and Quatrano, R. S. (2007). 14-3-3 Proteins are components of the transcription complex of the ATEM1 promoter in Arabidopsis. Planta 227, 167–175. doi: 10.1007/s00425-007-0604-1
Vysotskii, D. A., Leeuwen, V. V., Erik, S., Babakov, A. V., et al. (2013). ABF transcription factors of Thellungiella salsuginea: structure, expression profiles and interaction with 14-3-3 regulatory proteins. Plant Signal. Behav. 8:e22672. doi: 10.4161/psb.22672
Walter, M., Chaban, C., Schütze, K., Batistic, O., Weckermann, K., Näke, C., et al. (2004). Visualization of protein interactions in living plant cells using bimolecular fluorescence complementation. Plant J. 40, 428–438.
Xiaohua, Y., Wenming, W., Mark, C., Undral, O., Jiayue, F., Xianfeng, M., et al. (2010). Arabidopsis 14-3-3 lambda is a positive regulator of RPW8-mediated disease resistance. Plant J. 60, 539–550. doi: 10.1111/j.1365-313X.2009.03978.x
Xu, M. Y., Zhang, L., Li, W. W., Hu, X. L., Wang, M.-B., Fan, Y. L., et al. (2014). Stress-induced early flowering is mediated by miR169 in Arabidopsis thaliana. J. Exp. Bot. 65, 89–101. doi: 10.1093/jxb/ert353
Xu, W., and Shi, W. (2006). Expression profiling of the 14-3-3 gene family in response to salt stress and potassium and iron deficiencies in young tomato (Solanum lycopersicum) roots: analysis by real-time RT-PCR. Ann. Bot. 98, 965–974. doi: 10.1093/aob/mcl189
Yaffe, M. B., Rittinger, K., Volinia, S., Caron, P. R., Aitken, A., Leffers, H., et al. (1997). The structural basis for 14-3-3:phosphopeptide binding specificity. Cell 91:961. doi: 10.1016/s0092-8674(00)80487-0
Yekti Asih, P., Yuka, O., Shojiro, T., Hiroyuki, T., and Ko, S. (2009). The 14-3-3 protein GF14c acts as a negative regulator of flowering in rice by interacting with the florigen Hd3a. Plant Cell Physiol. 50:429. doi: 10.1093/pcp/pcp012
Yohei, T., Toshinori, K., and Ken-Ichiro, S. (2007). Protein phosphorylation and binding of a 14-3-3 protein in Vicia guard cells in response to ABA. Plant Cell Physiol. 48:1182. doi: 10.1093/pcp/pcm093
Yu, Y., Liu, Z., Wang, L., Kim, S. G., Seo, P. J., Qiao, M., et al. (2017). WRKY71 accelerates flowering via the direct activation of FLOWERING LOCUS T and LEAFY in Arabidopsis thaliana. Plant J. 85, 96–106. doi: 10.1111/tpj.13092
Yu, Y., Wang, L., Chen, J., Liu, Z., Park, C. M., and Xiang, F. (2018). WRKY71 acts antagonistically against salt-delayed flowering in Arabidopsis thaliana. Plant Cell Physiol. 59, 414–422. doi: 10.1093/pcp/pcx201
Yuan, Y., Ying, D., Lin, J., and Jin-Yuan, L. (2007). Molecular analysis and expression patterns of the 14-3-3 gene family from Oryza sativa. J. Biochem. Mol. Biol. 40, 349–357. doi: 10.5483/bmbrep.2007.40.3.349
Zhang, G., Liu, X., Quan, Z., Cheng, S., Xu, X., Pan, S., et al. (2012). Genome sequence of foxtail millet (Setaria italica) provides insights into grass evolution and biofuel potential. Nat. Biotechnol. 30, 549–554. doi: 10.1038/nbt.2195
Zhang, W. Y., Zhi, H., Liu, B. H., Wang, X. Z., and Diao, X. M. J. A. A. S. (2014). Phenotype variation and vertical distribution of foxtail millet root system in RIL from a Cross of Yugu 1×Wild Green Foxtail W53. Acta Agronom. Sin. 40: 1717. doi: 10.3724/sp.j.1006.2014.01717
Keywords: foxtail millet, SiGRF, overexpression, protein interaction, flowering, salt stress
Citation: Liu J, Jiang C, Kang L, Zhang H, Song Y, Zou Z and Zheng W (2020) Over-Expression of a 14-3-3 Protein From Foxtail Millet Improves Plant Tolerance to Salinity Stress in Arabidopsis thaliana. Front. Plant Sci. 11:449. doi: 10.3389/fpls.2020.00449
Received: 29 November 2019; Accepted: 26 March 2020;
Published: 15 April 2020.
Edited by:
Camilla Hill, Murdoch University, AustraliaReviewed by:
Mehanathan Muthamilarasan, University of Hyderabad, IndiaZhengjun Xia, Chinese Academy of Sciences (CAS), China
Copyright © 2020 Liu, Jiang, Kang, Zhang, Song, Zou and Zheng. This is an open-access article distributed under the terms of the Creative Commons Attribution License (CC BY). The use, distribution or reproduction in other forums is permitted, provided the original author(s) and the copyright owner(s) are credited and that the original publication in this journal is cited, in accordance with accepted academic practice. No use, distribution or reproduction is permitted which does not comply with these terms.
*Correspondence: Zhirong Zou, em91emhpcm9uZzIwMDVAaG90bWFpbC5jb20=; Weijun Zheng, emhlbmd3ZWlqdW5AbndhZnUuZWR1LmNu
†These authors have contributed equally to this work