 Da-Yong Fan1*
 Qing-Lai Dang2
 Cheng-Yang Xu1Chuang-Dao Jiang3
 Wang-Feng Zhang4Xin-Wu Xu3,5Xiao-Fang Yang3Shou-Ren Zhang3*
- 1College of Forestry, Beijing Forestry University, Beijing, China
- 2Faculty of Natural Resources Management, Lakehead University, Thunder Bay, ON, Canada
- 3State Key Laboratory of Vegetation and Environmental Change, Institute of Botany, The Chinese Academy of Sciences, Beijing, China
- 4The Key Laboratory of Oasis Eco-agriculture, Xinjiang Production and Construction Corps, Shihezi University, Shihezi, China
- 5China Meteorological Administration, Beijing, China
There are considerable variations in the percentage loss of hydraulic conductivity (PLC) at mid-day minimum water potential among and within species, but the underpinning mechanism(s) are poorly understood. This study tested the hypothesis that plants can regulate leaf specific hydraulic conductance (Kl) via precise control over PLC under variable ΔΨ (water potential differential between soil and leaf) conditions to maintain the −m/b constant (−m: the sensitivity of stomatal conductance to VPD; b: reference stomatal conductance at 1.0 kPa VPD), where VPD is vapor pressure deficit. We used Populus euphratica, a phreatophyte species distributed in the desert of Northwestern China, to test the hypothesis. Field measurements of VPD, stomatal conductance (gs), gs responses to VPD, mid-day minimum leaf water potential (Ψlmin), and branch hydraulic architecture were taken in late June at four sites along the downstream of Tarim River at the north edge of the Taklamakan desert. We have found that: 1) the −m/b ratio was almost constant (=0.6) across all the sites; 2) the average Ψ50 (the xylem water potential with 50% loss of hydraulic conductivity) was −1.63 MPa, and mid-day PLC ranged from 62 to 83%; 3) there were tight correlations between Ψ50 and wood density/leaf specific hydraulic conductivity (kl) and between specific hydraulic conductance sensitivity to water potential [d(ks)/dln(−Ψ)] and specific hydraulic conductivity (ks). A modified hydraulic model was applied to investigate the relationship between gs and VPD under variable ΔΨ and Kl conditions. It was concluded that P. euphratica was able to control PLC in order to maintain a relatively constant −m/b under different site conditions. This study demonstrated that branchlet hydraulic architecture and stomatal response to VPD were well coordinated in order to maintain relatively water homeostasis of P. euphratica in the desert. Model simulations could explain the wide variations of PLC across and within woody species that are often observed in the field.
Introduction
A global convergence has been demonstrated in the relationship between drought-induced embolism and daily minimum xylem water potential (Choat et al., 2012; Choat et al., 2018). The safety margin of the plant hydrautic system refers to the difference between the daily minimum xylem water potential and the xylem water potential at which 50% of the hydraulic conductance is lost due to the cavitation of xylem vessels. Plants are generally able to maintain the integrity of their hydraulic system within the safety margin by the stomatal regulation of water loss to maximize the carbon gain without the risk of catastrophic hydraulic failure. However, the functional association between minimum xylem water potential and hydraulic safety does not prove that all the plants can control embolisms to the same extent because PLC is a function of water potential, Ψ50, and the slope of the cavitation vulnerability curve. As such, there are considerable inter- and intra-specific variations in PLC at the daily minimum xylem water potential (Pockman and Sperry, 2000; Johnson et al., 2009b; Fan et al., 2018). However, the underpinning mechanism(s) are not fully understood.
The stomatal regulation of xylem pressure is a function of vapor pressure deficit (VPD), leaf specific hydraulic conductance (Kl), soil water potential (Ψs), and leaf water potential (Ψl) (see Table 1 for the definitions of major acronyms/symbols in the present study) according to the following simplified hydraulic model (Oren et al., 1999; Landsberg et al., 2017):
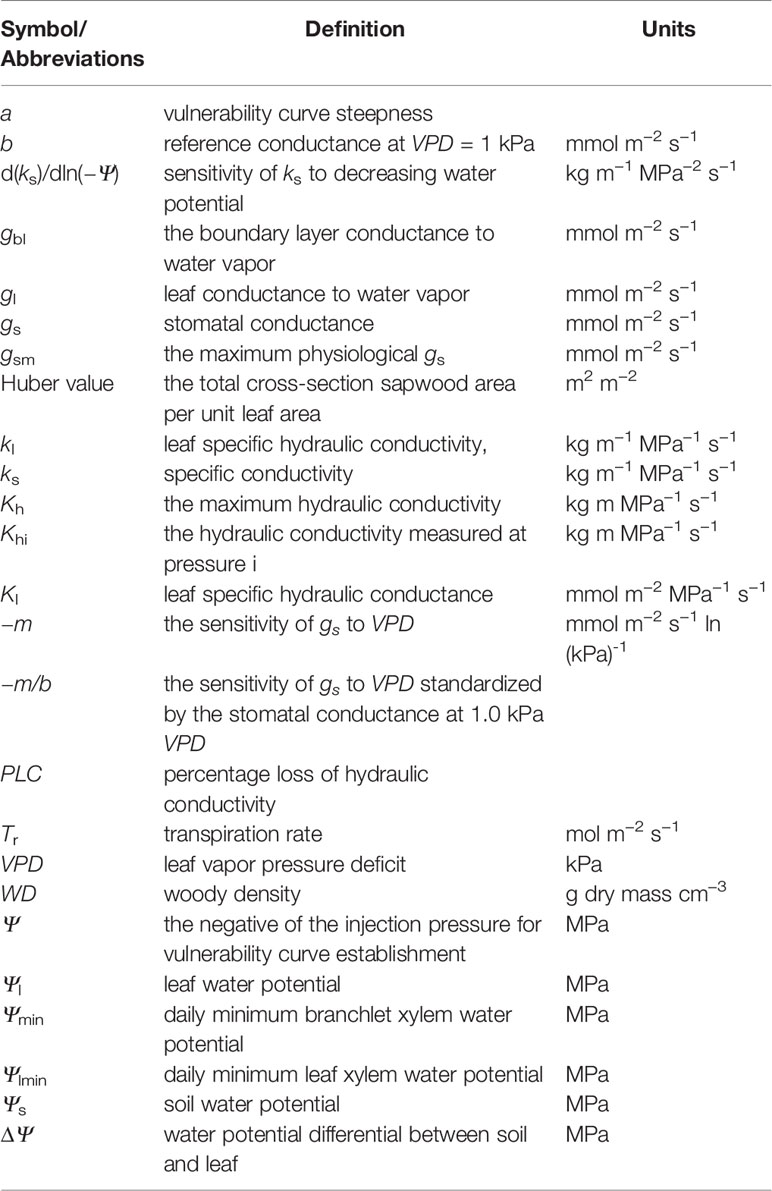
Table 1 List of symbols, abbreviations and their units.
Where gl is leaf conductance to water vapor, which is a function of boundary layer conductance to water vapor (gbl) and stomatal conductance (gs). It has been demonstrated that the sensitivity of stomatal conductance to VPD (−m) has a close relationship with the stomatal conductance at 1 kPa VPD (b) and the −m/b ratio is found to be 0.6 for various mesic species across a variety of growth forms and habitats (Dang et al., 1997; Oren et al., 1999; Bucci et al., 2005; Landsberg et al., 2017) and the relationship is described as follows:
The above models predict that if Kl decreases due to xylem cavitation, the −m/b ratio will need to increase because a more sensitive stomatal response is required to keep transpiration and ΔΨ (=ΨS – Ψl, i.e., water potential difference between soil and leaf) relatively constant (Oren et al., 1999; Landsberg et al., 2017). Furthermore, the large variations in PLC (which regulates Kl) will likely lead to variations in the −m/b ratio. However, it is unlikely in nature that ΔΨ remains constant when Kl varies even in isohydric species (Mcdowell, 2011). Therefore, the assumption of constant ΔΨ needs to be relaxed. In this study, we simultaneously examined stomatal conductance to water vapor pressure deficit, the response of branch and leaf hydraulic conductance to water potential differential between leaf and soil, and xylem vulnerability to cavitation. We conducted the study on four populations of a desert phreatophyte tree species, Populus euphratica, along a gradient of water table depths. We test the hypothesis that if stomata are perfectly efficient in regulating leaf water status as indicated by a constant −m/b both within and between species (Oren et al., 1999; Ewers et al., 2000), plants would fine-tune Kl via precise control over PLC (control the embolism degree) under variable ΔΨ and Kl conditions. The results can provide an explanation for the considerable inter- and intra-specific variations in PLC at the daily minimum xylem water potential in the field.
From Equation 1, gl can be obtained with the input of Kl, VPD, Ψl, and Ψs, while Kl is the product of maximum Kl and PLC. gs can be obtained provided gbl is known. Then −m/b can be calculated based on Equation 2. Among all parameters required by the model, Kl, VPD, Ψl, and PLC can be measured/calculated in the field. In desert environment, gbl is large and has minor impact on the model simulation (Comstock and Mencuccini, 1998; Oren et al., 1999). As such, the only obstacle to verify the above hypothesis for trees with a deep root system is that it is difficult to know the water availability in the entire rhizosphere because of the difficulty in obtaining a reliable Ψs, mainly due to the temporal–spatial soil moisture heterogeneity and nocturnal transpiration (Kavanagh et al., 2007; Landsberg et al., 2017). In this study, we used Populus euphratica, an obligate phreatophyte species, to test the hypothesis. Because the root system of phreatophytes can reach and access the groundwater to avoid drought stress (Pockman and Sperry, 2000; Choat et al., 2012; Volaire, 2018), the ΔΨ is largely determined by Ψl because Ψs is close to zero and the gravitational potential (−0.01MPa m−1) is ignorable for groundwater tables of a few meters (Scholander et al., 1965). P. euphratica mainly grows along the riverside of Tarim River at the north edge of the Taklimakan Desert, NW China. Previous greenhouse studies have found that stems of P. euphratica seedlings are highly vulnerable to cavitation (high Ψ50) and considerable PLC occurs at noon (Hukin et al., 2005), but there are no such field studies on this species. Thomas et al. (2008) and Gries et al. (2003) have found associations between gs, VPD, kl, and Ψl, but the relationship between stomatal sensitivity to VPD and hydraulic traits is still poorly understood. We hypothesize that the stomatal response to VPD and xylem response to water potential are functionally converged to maintain a functional coherence and integrity of the hydraulic system of the tree.
Materials and Methods
Study Site
The study was carried out at four sites along the downstream of Tarim River (elevation of 931 m) in the Xinjiang Uighur Autonomous Region, NW China (Figure 1). The four sites are located at least 138 km east of Korla, at the northern fringe of the Taklamakan desert. Korla has a warm temperate continental arid climate; the average length of the frost-free season is 210 days. The annual average temperature is about 11°C, the average annual precipitation is less than 60 mm, and the annual maximum evaporation is about 2,800 mm. The average maximum temperature and average minimum relative humidity in June are 30.9°C and 9.9% respectively.
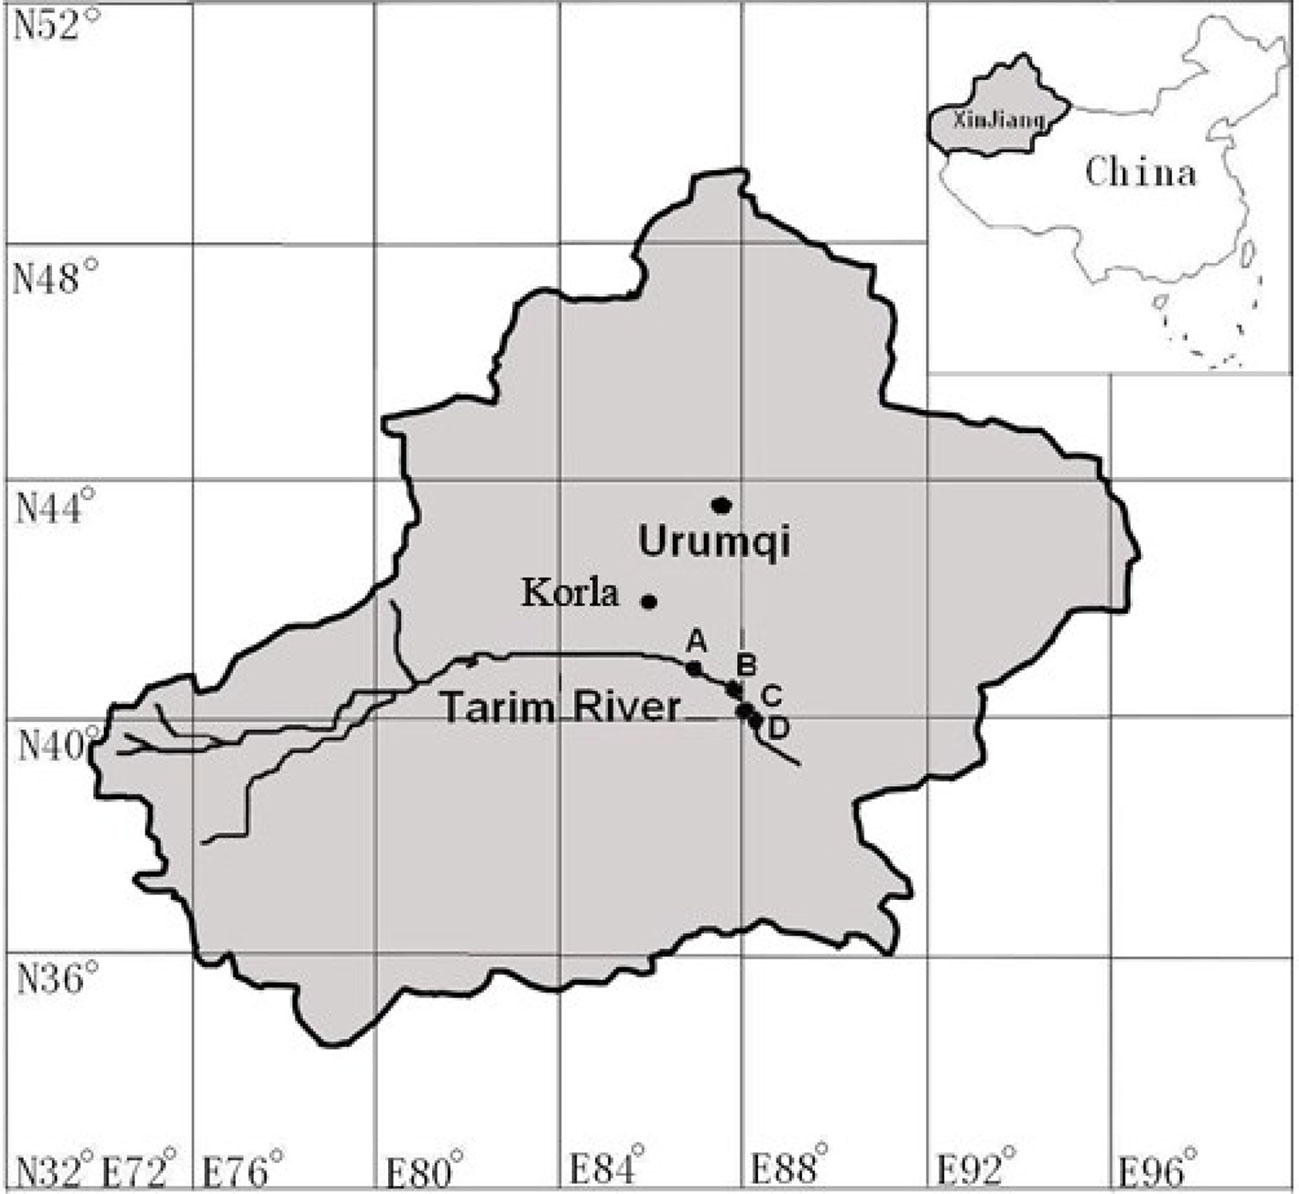
Figure 1 Geological locations of the four studied sites. Site name: A = 31 Tuan, B = 33 Tuan, C = Yingsu, D = Alagan.
The four sites had natural P. euphratica stands with relatively uniformly distributed trees. The stand density was 100–300 stems per hectare. Four to five trees with diameter at breast height of 30–40 cm were selected from each site and south-facing sunlit branchlets, and leaves at 1.3–1.5 m height from the outermost part of the lower canopy were selected for measuring in situ gs and hydraulic characteristics. Two branches per tree were selected for the branch architecture measurement and one to two leaves per tree were used to measure in situ gs response to VPD. The groundwater tables of the four sites measured at local wells within 1 km from the sites were 2.49, 3.49, 4.46, and 7.92 m, respectively, for site 31 Tuan (site A), 33 Tuan (site B), Yingsu (site C) and Alagan (site D).
Measurements of gs Response to VPD
gs responses to VPD were measured on clear days in the field around noon (12:00 to 14:00 h) in late June under two sets of conditions: (1) controlled VPD and (2) un-controlled natural VPD, using a Li 6400 open gas exchange system (Li-Cor Cooperate, Lincoln, NE, USA). In the controlled-VPD measurements, a range of VPD from 0.8 to 3.5 kPa was achieved by using the apparatus on the equipment to vary the mixing ratio of water-vapor saturated air and dry air (after passing through desiccant). When the relative humidity in the leaf chamber exceeded 80% (VPD was about 0.8 kPa), the instrument displayed a warning sign of “High humidity alert”, gs and intercellular carbon dioxide concentration (Ci) readings fluctuated (e.g., Ci fluctuated from negative to very large values), indicating the gs measurement was not reliable. Therefore, data points with VPD values less than 1 kPa were discarded. Other environmental conditions in the leave cuvette were set as follows: Leaf temperature 31°C, Photosynthetically active radiation (PAR) 1,200 µmol m−2 s−1, CO2 concentration 390 µmol mol−1. Only steady-state gs readings at each VPD were recorded (Dang et al., 1997; Dang, 2013). Measurements under un-controlled natural VPD were taken in June and again in July. The conditions in the leaf chamber were set the same in in the two measurements (Leaf temperature 31°C, PAR 1,200 µmol m−2 s−1, CO2 concentration 390 µmol mol−1). The −m and b were estimated using Equation 2 and the non-linear regression model with gnls () function of the R software (R Development Core, 2017).
Leaf Water Potential and Branchlet Xylem Water Potential Measurements
The daily minimum leaf xylem water potential (Ψlmin) was measured in the field between 12:00 and 14:00 using a Scholander pressure chamber (PMS Instrument, Corvallis, Oregon, USA). The measurements were taken on the same trees on which the VPD responses were measured. The daily minimum branchlet xylem water potential (Ψmin) was estimated according to the method of Pockman and Sperry (2000): a branchlet of similar size to that used in subsequent cavitation vulnerability measurements was selected and sealed in a plastic bag containing a moist paper towel for 30 min in darkness to allow the equilibration of water potential between leaves and the subtending branchlet before a leaf was sampled and the petiole water potential was measured.
Cavitation Vulnerability Curve Measurement
A branchlet (50–70 cm long, 2–4 year-old) near that used for the gs–VPD response measurement was cut from each sample tree before sunrise (before 8:00 AM) to measure kl and the cavitation vulnerability curve. The branchlet was wrapped in moist paper towels immediately after being cut and transported to the laboratory. The maximum vessel length was measured from six samples randomly chosen from all the four sites together, based on the method (pressurized gas bubble under water) of Jacobsen et al. (2007). Since the maximum measured vessel length was less than 21 cm, all the samples (7–10 per site) were re-cut to 22–24 cm under water, and all the measurements were carried out in an air-conditioned laboratory (26°C). The maximum flow rate was measured under 8 kPa hydrostatic pressure after air emboli were flushed out by perfusion with 110 kPa distilled water (flowing through 0.2 μm filter) for 30 min. Measurements were initiated after ~2 min when the flow rate stabilized. The weight of the collected efflux was measured every 30 s with a precision balance (Sartorius, BP221S, Göttingen, Germany) to obtain the flow rate. Maximum kl was calculated by dividing the maximum flow rate by the total leaf area distal to the measured segment and by the pressure gradient. The leaf area was determined using a WinFOLIA system (Regent Instruments, Quebec City, Canada). ks was calculated by dividing the maximum flow rate by the segment’s cross-section sapwood area. The total acropetal-end cross-section area of the branch segment was determined from its maximum and minimum diameter. The area of the pith was determined from its dimensions measured under a dissecting microscope equipped with a stage micrometer and subtracted from the above acropetal-end cross-section area to determine the cross-section sapwood area. The Huber value was calculated as the total cross-section sapwood area per unit leaf area (Tyree and Sperry, 1988).
The vulnerability of xylem to cavitation was characterized using a vulnerability curve which was measured using a Cavitation pressure chamber (PMS Instrument, Corvallis, Oregon, USA) according to Sperry and Saliendra (1994). A branch segment was inserted into a collar and sealed with both ends protruding. Air was injected into the collar at a set pressure, which was maintained for 15 min and then slowly decreased to 0.1 MPa. The hydraulic conductivity was then re-measured at a higher pressure. This procedure was repeated until at least 85% loss of hydraulic conductivity was reached. The PLC following each pressurization was calculated as PLC = 100 × (Kh − Khi)/Kh, where Khi is the hydraulic conductivity measured at pressure i. The vulnerability curve for each sample was fitted with an exponential sigmoidal equation (Pammenter and Vander Willigen, 1998):
where Ψ is the negative of the injection air pressure and coefficients a and Ψ50 are estimated using a non-linear regression model with gnls() function of R software (R Development Core, 2017). Ψ50 represents the xylem water potential at which 50% of the hydraulic conductance is lost, a represents the steepness of vulnerability curve. kl at noon was estimated from Ψmin, the vulnerability curve, and maximum kl (Pockman and Sperry, 2000; Johnson et al., 2009b).
Wood Density and ks Sensitivity to Water Potential
Wood density (WD) was measured on stem segments used in the measurement of vulnerability curves after the removal of pith and bark, and the fresh volume was measured by the Archimedes principle of water displacement. The dry mass was determined after drying at 104°C for 24 h. WD is expressed as dry mass per unit fresh volume (g cm−3).
Specific hydraulic conductance sensitivity to water potential [d(ks)/dln(−Ψ)] was calculated based on the method by Ewers et al. (2000): we related maximum ks, obtained at −Ψ = 0, to the branchlet ks sensitivity to decreasing Ψ from −0.5 to −3.0 MPa. The slope of the −Ψ–ks relationship was linearized by using the natural logarithm of –Ψ, and the logarithm transformation resulted in a good fit (R2 = 0.91 to 0.95).
The Hydraulic Model
We used Equation 1 and the following equation:
to model the response of gs to VPD at noon. We set constraints for gsm (the maximum physiological gs for P. euphratica), gbl, Kl, and ΔΨ according to the corresponding measured physiological range for P. euphratica. It is assumed that gs had an upper limit of gsm which was set as 1,000 mmol m−2 s−1, based on our field measurements and the reported values for poplars (Hacke, 2015). The gbl for desert environment was set as 2,000 mmol m−2 s−1 (Comstock and Mencuccini, 1998). Kl at noon was set between 0.5 and 4.0 mmol MPa−1 m−2 s−1. ΔΨ at noon (Ψs − Ψlmin) was set at 2.0 to 3.2 MPa according to the measured range of Ψlmin in the field. VPD was allowed to vary between 1 and 4 kPa, similar to the range observed in the field (Gries et al., 2003). Before running the simulation, we calculated Kl at noon from the estimated kl at noon, assuming hydraulic path length = underground water table + sample height + branch length, and hydraulic conductance was uniformly distributed along the flow path from soil to branchlet (Pockman and Sperry, 2000). Note the unit of kl is kg m−1 MPa−1 s−1, and the unit of Kl is mmol m−2 MPa−1 s−1. We converted the unit VPD into the unit of mol mol−1 as required by the model. We relaxed the assumption of constant ΔΨ when exploring the relationship between Kl and −m/b. By allowing Kl and ΔΨ to vary simultaneously, the gs responses to VPD (−m/b) under all the combinations of Kl and ΔΨ were solved. The simulation procedure was as follows (Oren et al., 1999): 1) the Kl and ΔΨ were assigned to specific values; 2) gl as the function of VPD was calculated from Equation 1; 3) gs was solved from Equation 4; 4) when gs > gsm (occurred occasionally), we set gs = gsm and re-solved the equation for ΔΨ; 5) the calculated gs and assigned VPD were fitted by a non-linear regression model with the gnls () function of R software (R Development Core, 2017) to obtain −m/b from Equation 2; 6) a semi-contour plot −m/b versus ΔΨ and Kl was constructed.
Statistical Analyses
The distribution normality of branchlet xylem hydraulic traits and leaf water status data were tested by calculating the Shapiro–Wilk W statistics for each sample (n = 4–5 for leaf water status variables, n = 7–10 for branchlet xylem hydraulic traits). Differences between sites were tested using Kruskl–Wallis H test if P(W) < 0.05. The Spearman rank correlation analysis was applied to investigate correlations among branchlet xylem hydraulic traits. ANOVA and Pearson correlation analysis were subsequently conducted if P(W) > 0.05. We conducted all the statistical analyses using R version 3.4.0 (R Development Core, 2017).
Results
gs, Ψlmin, b were significantly lower, and VPD was significant higher at Alagan than other sites (Table 2). Transpiration rate (Tr), −m, and −m/b (0.57–0.61) were not significantly different among the four sites (Table 2). Differences in all the traits were smallest between 31 Tuan site and Yingsu site than among all the sites.

Table 2 Means and standard error of the mean for gs, Tr, VPD, Ψlmin, −m, b and −m/b at the four sites.
The branchlet hydraulic architecture of P. euphratica also varied with site (Table 3). Yingsu had significantly greater ks, kl, and d(ks)/dln(−Ψ) than the other three sites (Table 3). Huber value was lowest at Alagan and highest at 33 Tuan among the four sites although their differences from 31 Tuan and Yingsu were not statistically significant (Table 3). WD was lowest at 31 Tuan and highest at Alagan, but their differences from 33 Tuan and Yingsu were not statistically significant (Table 3). Ψmin had the same trend as Ψlmin, i.e., significantly more negative at Alagan than at all other sites, while there was no significant difference among the other sites (Tables 2 and 3). Ψ50 was most negative at Alagan (−2.22 MPa) and the least negative at Yingsu (−1.22 MPa) among the four sites, but the trend for a was the opposite (Table 3).

Table 3 Means and the standard error of the mean for ks, kl, WD, Ψmin, Huber value, Ψ50, d(ks)/dln(−Ψ), and a at the four sites.
As there was no significant difference in −m/b among the sites, we pooled all the VPD response data from the four sites and evaluated the general relationship between gs and VPD for the species. We fit Equation 1 separately for the two sets of VPD response data. The estimated −m/b was 0.607 for the controlled-VPD data set and 0.615 for the natural VPD field measurement (Figures 2A, B). −m was positively correlated with b across the individuals of the four sites (Figure 2C).
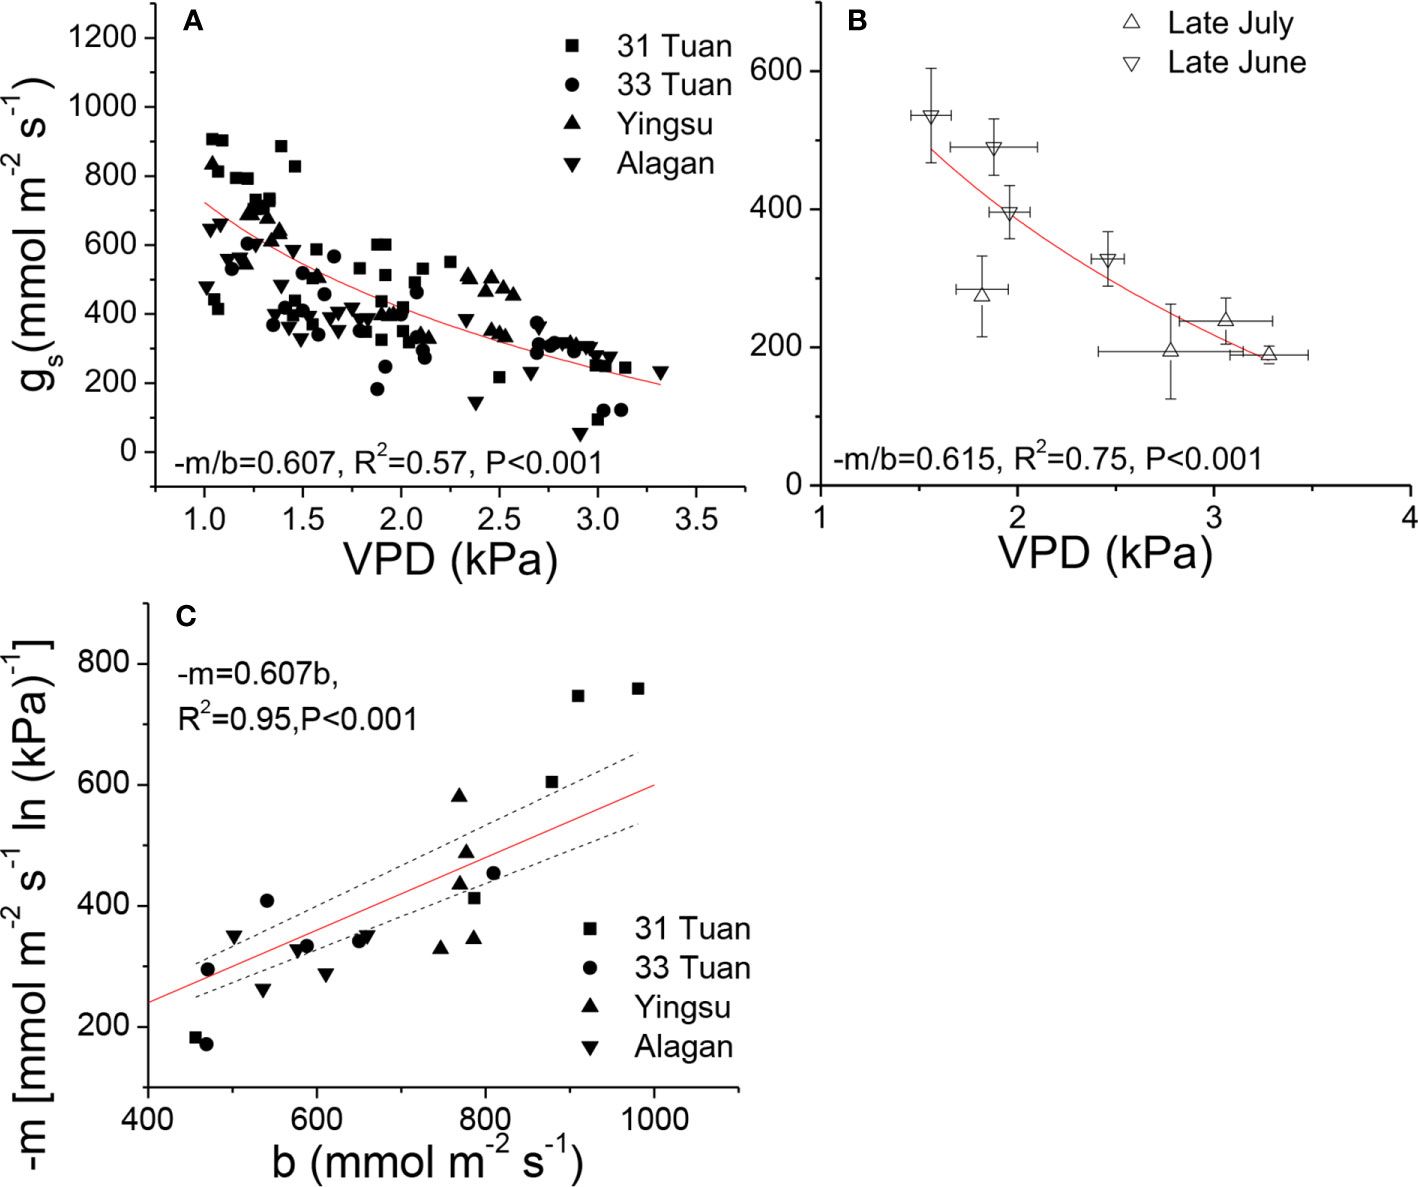
Figure 2 Relationships between gs and VPD (A, B), and the relationship between −m and b (C) of Populus euphratica among the four sites. The measurements were taken by manipulating VPD in late June (A, C), and natural VPD in late June and late July (B). The curves were generated by using the hydraulic model (Equation 1). In (C), red line represents the theoretical line of the expected relationship (−m = 0.6b), black dash lines represent 95% confidence intervals of linear regression between observed −m and b.
The estimated PLC ranged from 62% at Alagan site to 83% at Yingsu site (Figure 3). The corresponding estimated kl at noon for 31 Tuan, 33 Tuan, Yingsu, and Alagan sites was 1.11 × 10⁻⁴, 1.09 × 10⁻⁴, 1.12 × 10⁻⁴, and 1.16 × 10⁻⁴ kg m−1 MPa−1 s−1, respectively.
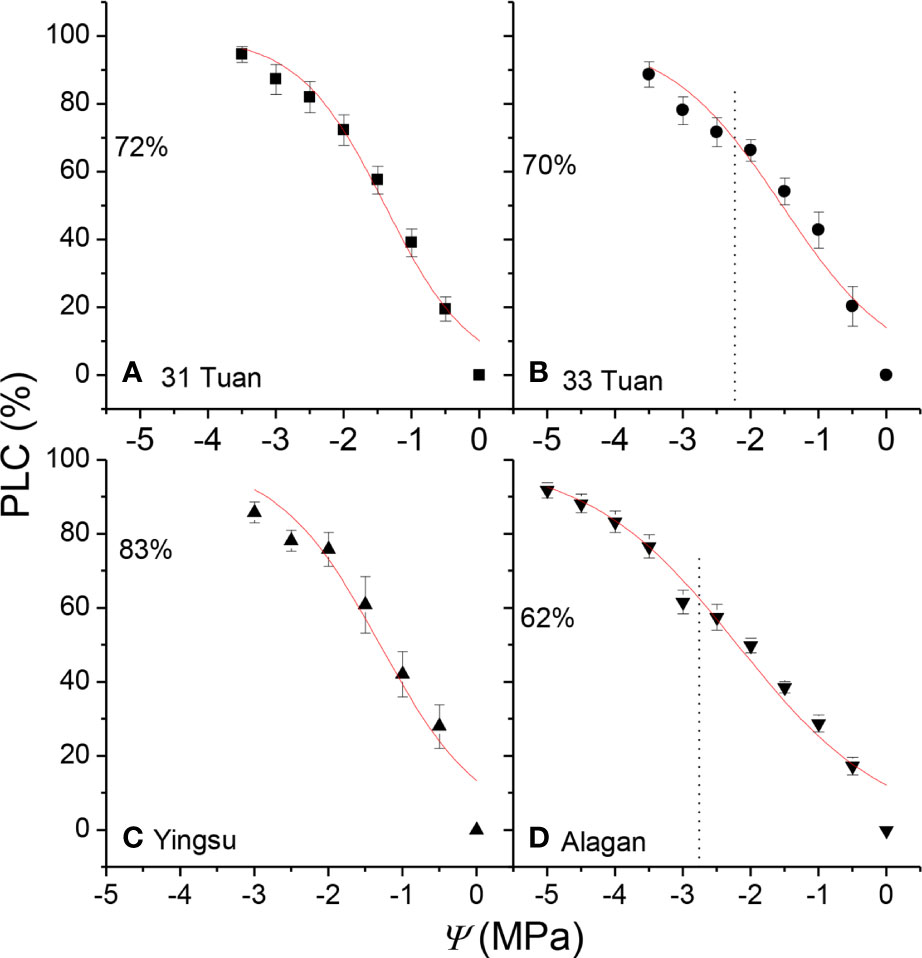
Figure 3 PLC as a function of Ψ for the four populations of Populus euphratica (means ± 1 se). The curves were fitted using all data points. The vertical dotted line indicates the position of measured Ψmin; the horizontal dotted line indicates the percentage loss of hydraulic conductivity at Ψmin. The number under the horizontal dotted line is the PLC at noon. See Table 1 for the definition of symbols.
ks was positively correlated with kl (F = 6.637, P = 0.014), negatively correlated with Huber value (F = 19.407, P < 0.001) (Table 4). However, ks showed no significant relationship with safety (Ψ50) (F = 1.917, P = 0.175) (Table 4). There was a negative association between Ψ50 and WD (F = 8.566, P = 0.006) across the four sites (Table 4, Figure 4A). There was a positive correlation between Ψ50 and kl (F = 5.937, P = 0.017) (Table 4, Figure 4B); kl also showed a positive correlation with the reference stomatal conductance at 1.0 kPa (F = 37.274, P = 0.009) at the population scale (Figure 4C). d(ks)/dln(−Ψ) was positively correlated with ks (F = 680.782, P < 0.001) (Figure 4D) across the individuals, and b at the population scale (F = 33.249, P = 0.01) (Figure 4F), but had no relationship with Ψ50 (F = 0.438, P = 0.51) (Figure 4E). There was no association between gs and Ψlmin at the population scale (F = 12.047, P = 0.071) (Figure 4H). There was no significant relationship between gs and Tr (F = 0.99, P = 0.33) (Figure 4G). There was also a marginally positive association (F = 13.048, P = 0.061) between Ψ50 and Ψmin across the four sites, and the slope of this relationship is similar to the slope for other angiosperm species in the world (Figure 5). The safety margin (Ψmin − Ψ50) was negative (i.e., below the 1:1 line in Figure 5) because the actual measured Ψmin was more negative than Ψ50 and the actual PLC was greater than 50%. gs increased with increasing (i.e., becoming less negative) Ψmin, and the rate of increase was greater at sites with less negative Ψmin (Figure 4H).
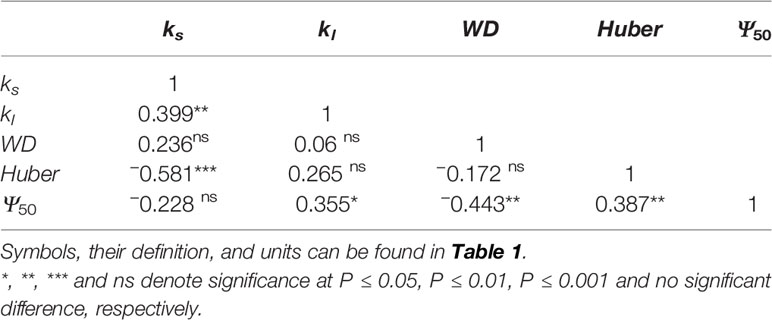
Table 4 Pearson correlations between branchlet hydraulic traits of Populus euphratica.
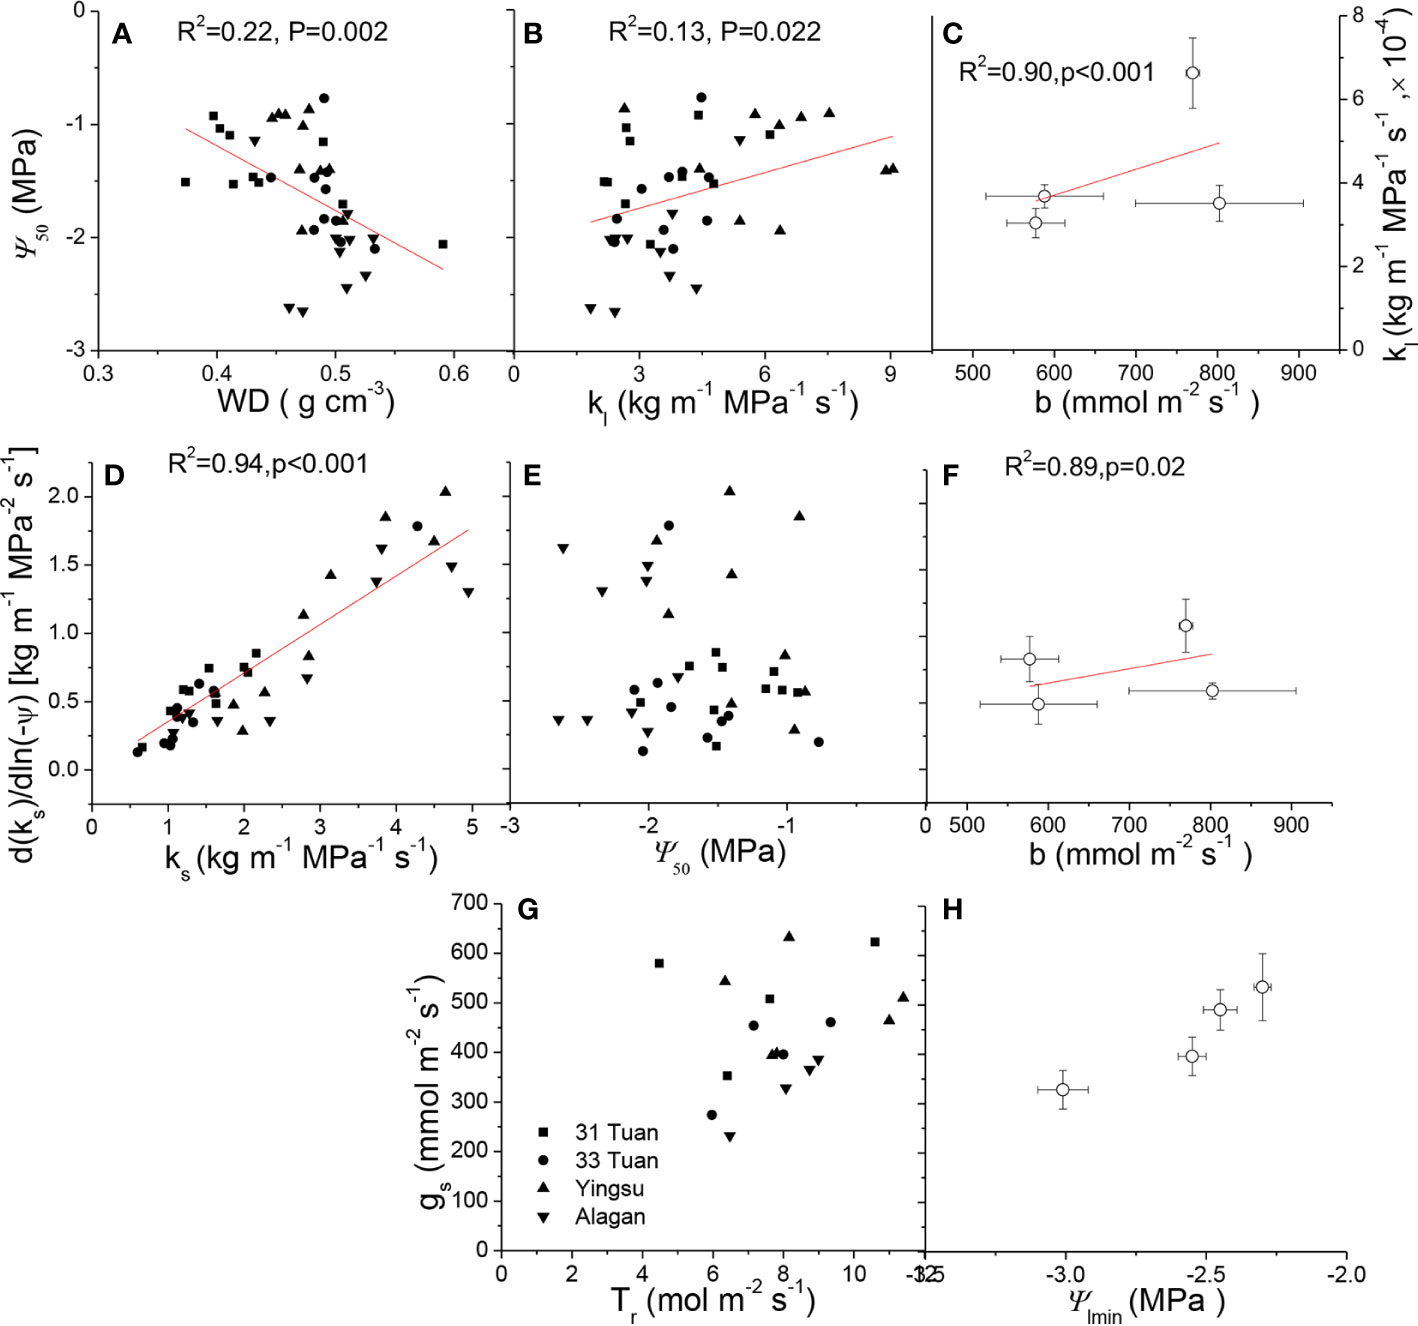
Figure 4 Ψ50 as a function of: (A) WD and (B) kl. kl as a function of b at the population scale (C). d(ks)/dln(−Ψ) as a function of: (D) ks, (E) Ψ50, and (F) b at the population scale of Populus euphratica at the four sites. gs as a function of: (G) Tr, and (H) Ψmin at the population scale of Populus euphratica at the four sites. In Figures 4C, F and H , data were shown as mean ± 1 se. For relationships at the population scale, the four points are the means of the four sites.
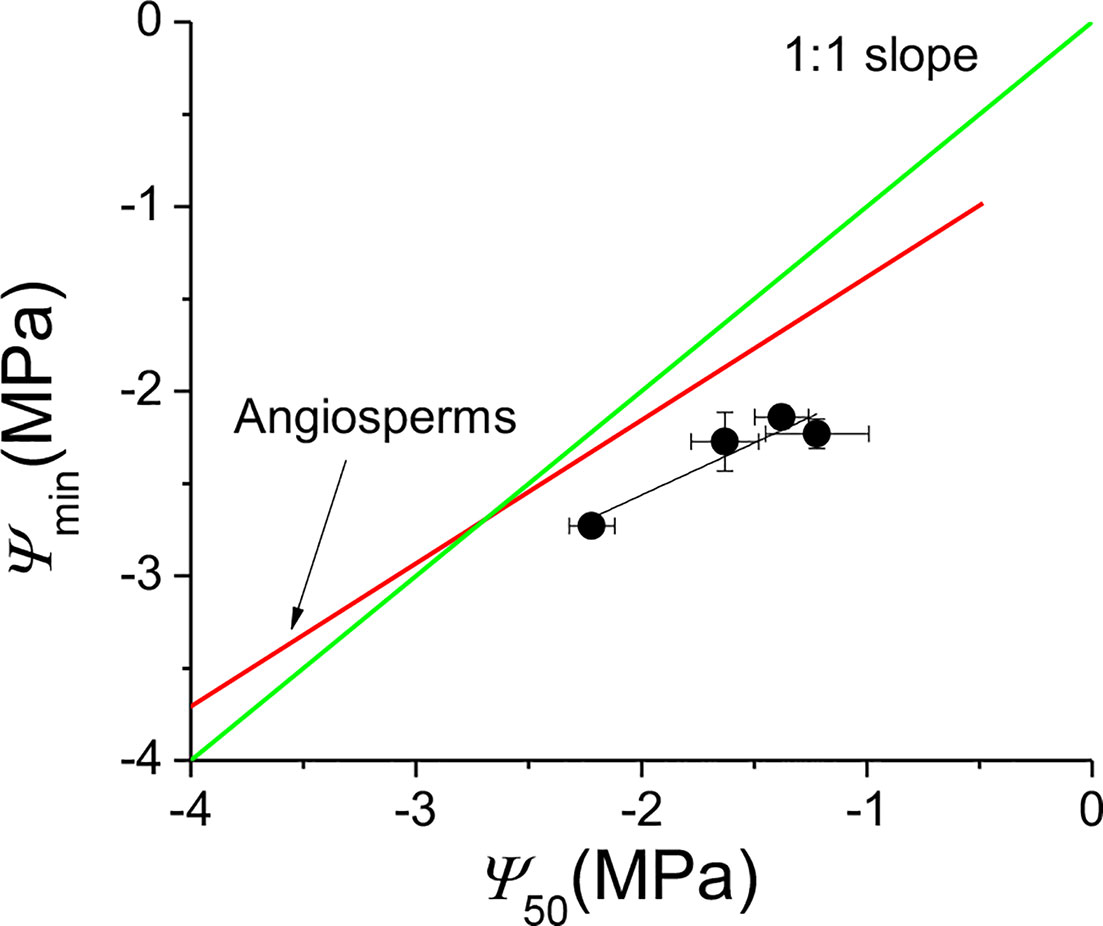
Figure 5 Ψmin as a function of Ψ50 for Populus euphratica at the four sites. The four black points are the means of the four sites. The red line is the regression line fitted using measurements for angiosperm species in the world (Choat et al., 2012). The F value and probability for the regression black line of Populus euphratica at the four sites are 14.76 and 0.061, respectively. The green line is the 1:1 regression line between Ψmin and Ψ50. Errors bars represent ± se.
Figure 6 demonstrated the effect of −m/b on the relationship between Kl and ΔΨ. The average values of Kl and ΔΨ around noon for the four sites all fell well within the range of 0.58–0.60 −m/b. Belt A and belt B in Figure 6 were within the same −m/b range (0.58–0.60) but different Kl at noon. Belt C had a −m/b range of 0.62–0.64, but its Kl at noon was higher than belt A but lower than belt B.
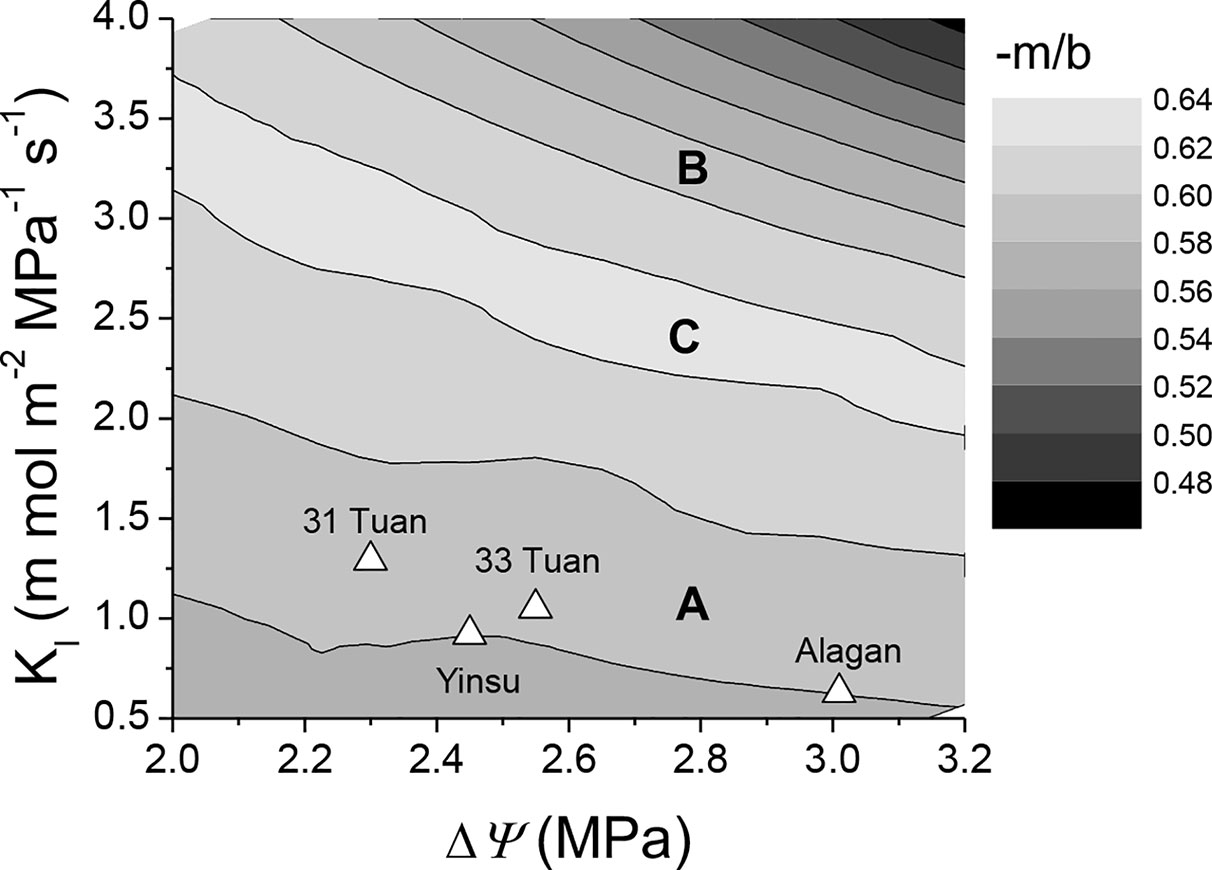
Figure 6 Semi-contour plots of −m/b as dependent on ΔΨ and Kl. Plots are derived from the hydraulic model (Equation 1). The simulated −m/b at the four studied sites are shown as (Δ). A and B in the figure represent belts with same −m/b but different Kl at noon, C represents belt with higher −m/b than A and B, but its Kl at noon is between those of A and B. Note the unit of Kl is mmol m−2 MPa−1 s−1.
Discussion
The Ψ50 values measured in this study are within the range of values reported for poplar trees around the world, e.g., −1.30 MPa for P. tremula, −2.95 MPa for P. nigra (Choat et al., 2012), −0.69 MPa for P. deltoids, and −2.75 MPa for P. tremuloides (Fichot et al., 2015). Hukin et al. (2005) have reported that P. euphratica seedlings have a Ψ50 for xylem cavitation of only −0.7 MPa, while the field-grown P. euphratica trees in our study had an average Ψ50 of −1.63 MPa across the four sites. These results suggest that the seedlings of P. euphratica may be much more vulnerable to xylem cavitation than trees at a later developmental stage. Although the seedlings of P. euphratica were measured at a different location in a different study (Hukin et al., 2005) from the larger trees, the response trend is consistent with that of another poplar species, P. tremuloides, the field grown trees which have a Ψ50 of −2.75 MPa (Sperry and Sullivan, 1992) while its seedlings only −0.68 to −0.84 MPa (Way et al., 2013). Furthermore, the value of Ψ50 that we measured on P. euphratica in this study (−1.63 MPa) is much less negative than the reported values for other drought resistant tree species, e.g., −2.75 MPa for P. tremuloides (Sperry and Sullivan, 1992), −8.42 MPa for Pistacia terebinthus (Maherali et al., 2004), suggesting that P. euphratica may be more vulnerable to cavitation than other drought tolerant desert species. Our measurement of PLC was in line with the mid-day PLC of 76% reported by Zhou et al. (2013).
The results of this study suggest that P. euphratica is a mesic-adapted species. In a mesic-adapted species, gs generally has a much tighter relationship with VPD (Figures 2A, C) than with ks (F = 0.02, P = 0.89 at the population scale) or Tr (Figure 4G) (Thomas et al., 2008; Yu et al., 2019), and −m is generally converged at 0.6 when standardized by b (Oren et al., 1999). The −m/b value of 0.6 is consistent with the prediction of the hydraulic model (Equation 1) that assumes that stomatal conductance controls the leaf water potential and transpiration rate under full irradiance. Both our controlled-VPD experiment and the measurements of gs response to natural VPD measured under field conditions across all four sites confirmed that the −m/b value was approximately 0.6 for P. euphratica. The results also support the hypothesis that the hydraulic homeostasis of phreatophyte species is restricted by transpiration water demand (VPD) but not by the water supply in the soil because their root system can uptake water directly from the groundwater, and thus their water supply remains largely stable throughout the year (Thomas et al., 2000; Bruelheide et al., 2003). The nearly isohydric behavior could also be demonstrated by the close association between −m and b across the individuals from the four populations (Figure 2C). The high xylem vulnerability and the pattern of gs response to VPD found this study provide physiological explanations for some of the ecological phenomena that are often observed in the field, e.g., very little sexual reproduction (Hukin et al., 2005), extensive clonal growth (Bruelheide and Jandt, 2004). We observed that there were very few seedlings at the four sites of this study. The limited number of seedlings on the sites may have been a result of the inability of seedlings to access the ground water, particularly during the dry season. The groundwater table generally deepens as a result of the management of the river system (Chen et al., 2015). In order to survive a drought spell, the root system of the seedlings must be able to reach and access the groundwater because of the high vulnerability to xylem cavitation and the inability of the species to effectively control water loss when the transpirational demand is high (i.e., mesic gs response to VPD). Because the root system of seedlings generally cannot penetrate deep enough to tap the groundwater as the ground table deepens or if they grow far away from the river bank, the mortality rate of tree seedlings is very high (Chen et al., 2015), leading to a lower rate of successful sexual regeneration. Consequently, the proportion of vegetative regeneration from suckering generally increases with increasing distance from the river bank. Similar phenomena on P. euphratica have been reported by other studies (e.g., Wu et al., 2010). These results suggest that the distribution of this species in the desert primarily depends on its access to groundwater (Gries et al., 2003).
The “safety margin” (Ψmin − Ψ50) of P. euphratica ranged from −0.5 to −1.01 MPa across the four sites in this study. While these values are within the general range of values reported for other tree species in the world that grow under comparable environmental conditions to those of our study sites (Choat et al., 2012), P. euphratica tended to have a more negative Ψmin than other species with the same Ψ50 (Figure 5). The linear regression line between Ψmin and Ψ50 (marginally significant) had a similar slope to that of angiosperm species in the literature (Choat et al., 2012). suggesting that the species tended to regulate stomatal aperture to maintain water homeostasis but was less able to do so. However, the negative value of the safety margin suggests that P. euphratica operated beyond the hydraulic safety margin and thus suffered more than 50% loss of hydraulic conductivity around noon. Indeed, the PLC at noon ranged from 62% at Alagan to 83% at Yingsu site. Since it is generally believed that plants can fine-tune PLC to avoid catastrophic hydraulic dysfunction (Tyree and Sperry, 1988; Macinnis-Ng et al., 2004), it is puzzling why such large differences in PLC occurred in P. euphratica at different sites. We thus proposed that plants can fine-tune Kl via precise control over PLC to maintain a constant −m/b, according to the prediction of Equation 1 and Equation 2 (Oren et al., 1999; Ewers et al., 2000), which can provide insight into the mechanism underpinning the large variation of PLC in P. euphratica. The results further suggest that P. euphratica had a greater ability to restore cavitated xylem vessels daily than most angiosperm species. However, the factor or factors responsible for such a high ability are not clear and warrant investigations.
The results of this study suggest that the hydraulic model (Equation 1) and/or its assumptions may need to be modified when used to examine the relationship between Kl and −m/b. The model predicts that if Kl decreases due to xylem cavitation, the −m/b will increase because a greater stomatal response is required to keep transpiration and ΔΨ (Soil water potential minus leaf water potential) constant (Oren et al., 1999; Landsberg et al., 2017). However, the −m/b in the current study was relatively constant (close to 0.6) across the four sites despite the large declines in Kl at noon. Furthermore, the model assumes that ΔΨ remains constant when Kl varies, which unlikely occurs in nature. In this study, we allowed Kl and ΔΨ to vary concurrently to relax the assumptions and set values for Kl, ΔΨ, gsm, and gbl based on the measured physiological ranges for P. euphratica in our investigation of the relationship between Kl and −m/b.
The output of the hydraulic model with our modifications was supported by our field measurements. The modeled relationship between Kl and ΔΨ at noon for our four sites was within the band of 0.58–0.60 −m/b (Figure 6), and the −m/b range calculated from our field measurements was 0.57–0.61. The in situ native midday PLC for P. euphratica (76%) measured by Zhou et al. (2013) along the Arim River is also consistent with our modeled value. A 1:1 correspondence between native embolism and the embolism predicted from vulnerability curves for desert plants is also reported by Pockman and Sperry (2000). These results suggest that correctly constructed VC curves (Wheeler et al., 2013) and hydraulic models can reliably predict native embolism in the field. It is also reported that xylem embolism is likely a critical element for the decrease of leaf hydraulic conductance during the daytime (Kikuta et al., 1997; Woodruff et al., 2007; Johnson et al., 2009a; Zhang et al., 2016), particularly for poplar species (Laur and Hacke, 2014; Scoffoni et al., 2017). P. euphratica could tolerate more than 50% xylem cavitation around noon and that it regulated PLCs based on the different conditions of the four sites in order to achieve a similar stomatal sensitivity under the condition where water supply and irradiance were not limited. This hydraulic strategy might be critical for P. euphratica to maximize its carbon gain and facilitate its growth in an arid environment. It can be inferred that P. euphratica trees may have the capacity of refilling the embolized xylem vessels or producing new vessels to restore the hydraulic capacity quickly (Gleason et al., 2016; Choat et al., 2018). However, the literature indicates that not all the species have the capacity to refill caviated vessels (Charrier et al., 2016; Torres-Ruiz, 2020). Further research in this area is warranted.
There are generally considerable variations in PLC at mid-day minimum xylem water potential among and within species (Pockman and Sperry, 2000; Johnson et al., 2009b; Fan et al., 2018), and based on the PLC at the mid-day water potential, a species can be classified into one of the two strategic groups: the conservative group (PLC < 50%) or the radical group (50% <PLC < 100%). Interestingly, the results of model simulation in the present study indicate that the two strategy groups could have similar stomatal sensitivity (e.g., belt A for the radical strategy and belt B for the conservative strategy in Figure 6 had the same range of stomatal sensitivity), suggesting that maintaining the theoretical threshold stomatal sensitivity (−m/b = 0.6) is probably critical for the fitness of mesic species regardless of which strategy they adopt. A −m/b above 0.62 (Belt C in Figure 6, with smaller PLC than the radical strategy and greater PLC than the conservative strategy) might be detrimental to photosynthesis because a small increase in VPD would induce a large decline in stomatal conductance and thus CO2 supply for photosynthesis even when water supply and irradiance are not limited, possibly reducing the competitiveness of the species. However, the reason why P. euphratica has adopted the radical strategy (belt A in Figure 6) instead of the conservative strategy (belt B in Figure 6) remains unknown. It is possible that xylem cavitation may help plants to survive drought stress by rationing water use (Sperry, 1995) and temporally releasing the effects of water stress for a portion of the tree (Hölttä et al., 2011). It is also worth noting that P. fremontii (a riparian species in Sonoran desert), a comparable species to P. euphratica, has 16.5–31.97% embolism at noon (Pockman and Sperry, 2000) and is likely located in belt B of Figure 6 and has adopted a conservative strategy.
The result that increased cavitation resistance was linked to increased wood density (Figure 4A) is expected because denser wood tends to be better able to sustain the compressive forces generated by lower negative pressures and to minimize air permeability that might cause xylem cavitation (Pockman and Sperry, 2000; Hacke et al., 2001; Bucci et al., 2013). Further, the positive relationship between kl and Ψ50 (Figure 4B) suggests there was a functional trade-off between efficiency and safety at the leaf level. The positive relationship between ks and d(ks)/dln(−Ψ) (Figure 4E) is coherent with the positive relationships between stomatal sensitivity to VPD and stomatal conductance at low VPD (i.e., 1.0 kPa) and between leaf hydraulic conductance and stomatal conductance at low VPD, providing evidence to support the functional convergence between xylem and leaves. Furthermore, faster growing species or populations tend to have lower wood density, higher stomatal and xylem conductance but lower drought resistance. The curvilinear relationship between gs and Ψmin suggests that trees with less negative Ψmin had higher but more sensitive gs, which also coincided with lower wood density and higher hydraulic conductance as well as sites with shallower water tables. The results of this study provide physiological evidence for the mechanisms governing the tradeoff between growth rate, anatomy, physiological functioning, and stress resistance.
Transpiration is controlled by both vapor pressure deficit and leaf conductance. Therefore, it is not surprising that gs was not significantly correlated to Tr (Figure 4G). The leaf conductance in turn is controlled by VPD and the internal water status as demonstrated by Equations 1 and 2. Equation 1 demonstrates that leaf conductance is the linkage between the internal water relations in the tree and the moisture conditions of the ambient air. This conclusion can further enforced the coherent functional relationships discussed in the previous paragraph, such as the significant, linear relationship between d(ks)/dln(−Ψ) and ks (Figure 4D). This relationship could facilitate the fine-tuning of PLC to sustain transpiration (Ewers et al., 2000) across the individuals (Table 2, Figure 2). More importantly, the lack of significant relationship between gs and Tr/Ψlmin (Figures 4G, H) indicates that the hydraulic behavior of P. euphratica resembled that of an isohydric species, which is in consistence with the observation on P. euramericana (Tardieu and Simonneau, 1998) and several poplar genotypes (Navarro et al., 2018). The nearly isohydric behavior also indicates higher b (same meaning as −m, Oren et al., 1999) is functionally associated with higher d(ks)/dln(−Ψ) and higher kl (at the population scale) (Figures 4C, F), consistent with the observation that stomata respond to changes in branchlet hydraulic conductance in a manner of feedback response to leaf water status (Saliendra et al., 1995). The results can be explained solely by hydraulic signaling or by an interaction between hydraulic and chemical signaling in the control of stomatal conductance (Tardieu and Simonneau, 1998; Comstock, 2002; Buckley, 2019; Qu et al., 2019).
In summary, this study demonstrates that the hydraulic architecture of branchlets and stomatal response to VPD were well coordinated with each other so that the water homeostasis of P. euphratica was maintained in the desert environment. The high xylem vulnerability to cavitation and the pattern of gs response to VPD measured in the field further corroborated previous conclusions that the distribution and growth of P. euphratica in the desert solely depend on its access to groundwater (Gries et al., 2003; Hukin et al., 2005; Thomas et al., 2008). Thus, the populations of this phreatophyte species may decline if and when the groundwater table deepens as a result of reduced precipitation induced by global climate change, river management, or dam constructions (Zhou, 1993; Gries et al., 2003; Chen et al., 2015). We also demonstrated that the observed −m/b of P. euphratica is consistent with the theoretical value derived from a simple hydraulic model when the assumption of constant ΔΨ was relaxed. Our results demonstrate that model simulations can potentially explain the wide range of variations in PLC across and within woody species that is often observed in the field but further research efforts in this area is warranted.
Data Availability Statement
The raw data supporting the conclusions of this article will be made available by the authors, without undue reservation.
Author Contributions
D-YF and S-RZ designed the experiment. D-YF, C-DJ, X-WX, and X-FY carried out the experiment. D-YF, S-RZ, C-YX, and Q-LD performed the statistical analyses and drafted the manuscript. W-FZ assisted in the experiment. All authors commented on the manuscript. All authors contributed to the article and approved the submitted version.
Funding
This study was financially supported by the National Key Research and Development Program of China (2016YFA0600802), State Key Project of Research and Development Plan (2016YFC0502104) and the Science and Technology Project of Beijing (Z171100004417019).
Conflict of Interest
The authors declare that the research was conducted in the absence of any commercial or financial relationships that could be construed as a potential conflict of interest.
Acknowledgments
We thank Dr. Ram Oren and two reviewers for their constructive comments and suggestions on the previous version of this manuscript, which have contributed substantially toward enhancing the quality of the manuscript.
References
Bruelheide, H., Jandt, U. (2004). “Vegetation types in the foreland of the Qira Oasis: present distribution and changes during the last decades,” in Ecophysiology and Habitat Requirements of Perennial Species in the Taklimakan Desert. Eds. Runge, M., Zhang, X. (Aachen, Germany: Shaker), 27–34.
Bruelheide, H., Jandt, U., Gries, D., Thomas, F. M., Foetzki, A., Buerkert, A., et al. (2003). Vegetation changes in a river oasis on the southern rim of the Taklamakan Desert in China between 1956 and 2000. Phytocoenologia 33, 801–818. doi: 10.1127/0340-269X/2003/0033-0801
Bucci, S. J., Goldstein, G., Meinzer, F. C., Franco, A. C., Campanello, P., Scholz, F. G. (2005). Mechanisms contributing to seasonal homeostasis of minimum leaf water potential and predawn disequilibrium between soil and plant water potential in Neotropical savanna trees. Trees 19, 296–304. doi: 10.1007/s00468-004-0391-2
Bucci, S. J., Scholz, F. G., Peschiutta, M. L., Arias, N. S., Meinzer, F. C., Goldstein, G. (2013). The stem xylem of P atagonian shrubs operates far from the point of catastrophic dysfunction and is additionally protected from drought-induced embolism by leaves and roots. Plant Cell Environ. 36, 2163–2174. doi: 10.1111/pce.12126
Buckley, T. N. (2019). How do stomata respond to water status? New Phytol. 224, 21–36. doi: 10.1111/nph.15899
Charrier, G., Torres-Ruiz, J. M., Badel, E., Burlett, R., Choat, B., Cochard, H., et al. (2016). Evidence for hydraulic vulnerability segmentation and lack of xylem refilling under tension. Plant Physiol. 172, 1657–1668. doi: 10.1104/pp.16.01079
Chen, Y., Li, W., Xu, C., Ye, Z., Chen, Y. (2015). Desert riparian vegetation and groundwater in the lower reaches of the Tarim River basin. Environ. Earth Sci. 73, 547–558. doi: 10.1007/s12665-013-3002-y
Choat, B., Jansen, S., Brodribb, T. J., Cochard, H., Delzon, S., Bhaskar, R., et al. (2012). Global convergence in the vulnerability of forests to drought. Nature 491, 752–755. doi: 10.1038/nature11688
Choat, B., Brodribb, T. J., Brodersen, C. R., Duursma, R. A., Lopez, R., Medlyn, B. E. (2018). Triggers of tree mortality under drought. Nature 558, 531–539. doi: 10.1038/s41586-018-0240-x
Comstock, J., Mencuccini, M. (1998). Control of stomatal conductance by leaf water potential in Hymenoclea salsola (T. & G.), a desert subshrub. Plant Cell Environ. 21, 1029–1038. doi: 10.1046/j.1365-3040.1998.00353.x
Comstock, J. (2002). Hydraulic and chemical signalling in the control of stomatal conductance and transpiration. J. Exp. Bot. 53, 195–200. doi: 10.1093/jexbot/53.367.195
Dang, Q. L., Margolis, H. A., Coyea, M. R., Sy, M., Collatz, G. J. (1997). Regulation of branch-level gas exchange of boreal trees: roles of shoot water potential and vapor pressure difference. Tree Physiol. 17, 521–535. doi: 10.1093/treephys/17.8-9.521
Dang, Q. (2013). Improving the quality and reliability of gas exchange measurements. J. Plant Physiol. Pathol. 1, 2. doi: 10.4172/jppp.1000e101
Ewers, B., Oren, R., Sperry, J. (2000). Influence of nutrient versus water supply on hydraulic architecture and water balance in Pinus taeda. Plant Cell Environ. 23, 1055–1066. doi: 10.1046/j.1365-3040.2000.00625.x
Fan, D. Y., Zhang, S. R., Yan, H., Wu, Q., Xu, X. W., Wang, X. P. (2018). Do karst woody plants control xylem tension to avoid substantial xylem cavitation in the wet season? For. Ecosyst 5, 40–50. doi: 10.1186/s40663-018-0158-7
Fichot, R., Brignolas, F., Cochard, H., Ceulemans, R. (2015). Vulnerability to drought-induced cavitation in poplars: synthesis and future opportunities. Plant Cell Environ. 38, 1233–1251. doi: 10.1111/pce.12491
Gleason, S. M., Westoby, M., Jansen, S., Choat, B., Hacke, U. G., Pratt, R. B., et al. (2016). Weak tradeoff between xylem safety and xylem-specific hydraulic efficiency across the world’s woody plant species. New Phytol. 209, 123–136. doi: 10.1111/nph.13646
Gries, D., Zeng, F., Foetzki, A., Arndt, S. K., Bruelheide, H., Thomas, F. M., et al. (2003). Growth and water relations of Tamarix ramosissima and Populus euphratica on Taklamakan desert dunes in relation to depth to a permanent water table. Plant Cell Environ. 26, 725–736. doi: 10.1046/j.1365-3040.2003.01009.x
Hacke, U. G., Sperry, J. S., Pockman, W. T., Davis, S. D., Mcculloh, K. A. (2001). Trends in wood density and structure are linked to prevention of xylem implosion by negative pressure. Oecologia. 126, 457–461. doi: 10.1007/s004420100628
Hacke, U. G. (2015). “The hydraulic architecture of Populus,” in Functional and ecological xylem anatomy (Cham: Springer), 103–131.
Hölttä, T., Juurola, E., Lindfors, L., Porcar-Castell, A. (2011). Cavitation induced by a surfactant leads to a transient release of water stress and subsequent ‘run away’embolism in Scots pine (Pinus sylvestris) seedlings. J. Exp. Bot. 63, 1057–1067. doi: 10.1093/jxb/err349
Hukin, D., Cochard, H., Dreyer, E., Le Thiec, D., Bogeat-Triboulot, M. B. (2005). Cavitation vulnerability in roots and shoots: does Populus euphratica Oliv., a poplar from arid areas of Central Asia, differ from other poplar species? J. Exp. Bot. 56, 2003–2010. doi: 10.1093/jxb/eri198
Jacobsen, A. L., Pratt, R. B., Davis, S. D., Ewers, F. W. (2007). Cavitation resistance and seasonal hydraulics differ among three arid Californian plant communities. Plant Cell Environ. 30, 1599–1609. doi: 10.1111/j.1365-3040.2007.01729.x
Johnson, D. M., Meinzer, F. C., Woodruff, D. R., Mcculloh, K. A. (2009a). Leaf xylem embolism, detected acoustically and by cryo-SEM, corresponds to decreases in leaf hydraulic conductance in four evergreen species. Plant Cell Environ. 32, 828–836. doi: 10.1111/j.1365-3040.2009.01961.x
Johnson, D. M., Woodruff, D. R., Mcculloh, K. A., Meinzer, F. C. (2009b). Leaf hydraulic conductance, measured in situ, declines and recovers daily: leaf hydraulics, water potential and stomatal conductance in four temperate and three tropical tree species. Tree Physiol. 29, 879–887. doi: 10.1093/treephys/tpp031
Kavanagh, K. L., Pangle, R., Schotzko, A. D. (2007). Nocturnal transpiration causing disequilibrium between soil and stem predawn water potential in mixed conifer forests of Idaho. Tree Physiol. 27, 621–629. doi: 10.1093/treephys/27.4.621
Kikuta, S., Lo Gullo, M., Nardini, A., Richter, H., Salleo, S. (1997). Ultrasound acoustic emissions from dehydrating leaves of deciduous and evergreen trees. Plant Cell Environ. 20, 1381–1390. doi: 10.1046/j.1365-3040.1997.d01-34.x
Landsberg, J., Waring, R., Ryan, M. (2017). Water relations in tree physiology: where to from here? Tree Physiol. 37, 18–32. doi: 10.1093/treephys/tpw102
Laur, J., Hacke, U. G. (2014). The role of water channel proteins in facilitating recovery of leaf hydraulic conductance from water stress in Populus trichocarpa. PloS One 9, e111751. doi: 10.1371/journal.pone.0111751
Macinnis-Ng, C., Mcclenahan, K., Eamus, D. (2004). Convergence in hydraulic architecture, water relations and primary productivity amongst habitats and across seasons in Sydney. Funct. Plant Biol. 31, 429–439. doi: 10.1071/FP03194
Maherali, H., Pockman, W. T., Jackson, R. B. (2004). Adaptive variation in the vulnerability of woody plants to xylem cavitation. Ecology 85, 2184–2199. doi: 10.1890/02-0538
Mcdowell, N. G. (2011). Mechanisms Linking Drought, Hydraulics, Carbon Metabolism, and Vegetation Mortality. Plant Physiol. 155, 1051–1059. doi: 10.1104/pp.110.170704
Navarro, A., Portillo-Estrada, M., Arriga, N., Vanbeveren, S. P., Ceulemans, R. (2018). Genotypic variation in transpiration of coppiced poplar during the third rotation of a short-rotation bio-energy culture. Glob. Change Biol. Bioenergy. 10, 592–607. doi: 10.1111/gcbb.12526
Oren, R., Sperry, J., Katul, G., Pataki, D., Ewers, B., Phillips, N., et al. (1999). Survey and synthesis of intra-and interspecific variation in stomatal sensitivity to vapour pressure deficit. Plant Cell Environ. 22, 1515–1526. doi: 10.1046/j.1365-3040.1999.00513.x
Pammenter, N. W., Vander Willigen, C. (1998). A mathematical and statistical analysis of the curves illustrating vulnerability of xylem to cavitation. Tree Physiol. 18, 589–593. doi: 10.1093/treephys/18.8-9.589
Pockman, W. T., Sperry, J. S. (2000). Vulnerability to xylem cavitation and the distribution of Sonoran Desert vegetation. Am. J. Bot. 87, 1287–1299. doi: 10.2307/2656722
Qu, X., Cao, B., Kang, J., Wang, X., Han, X., Jiang, W., et al. (2019). Fine-tuning stomatal movement through small signaling peptides. Front. Plant Sci. 10, 69. doi: 10.3389/fpls.2019.00069
R Development Core, T (2017). A language and environment for statistical computing (Vienna: The R Foundation for Statistical Computing).
Saliendra, N. Z., Sperry, J. S., Comstock, J. P. (1995). Influence of leaf water status on stomatal response to humidity, hydraulic conductance, and soil drought in Betula occidentalis. Planta 196, 357–366. doi: 10.1007/BF00201396
Scholander, P. F., Bradstreet, E. D., Hemmingsen, E. A., Hammel, H. T. (1965). Sap Pressure in Vascular Plants: Negative hydrostatic pressure can be measured in plants. Science 148, 339–346. doi: 10.1126/science.148.3668.339
Scoffoni, C., Albuquerque, C., Brodersen, C. R., Townes, S. V., John, G. P., Bartlett, M. K., et al. (2017). Outside-Xylem Vulnerability, Not Xylem Embolism, Controls Leaf Hydraulic Decline during Dehydration. Plant Physiol. 173, 1197–1210. doi: 10.1104/pp.16.01643
Sperry, J., Saliendra, N. (1994). Intra-and inter-plant variation in xylem cavitation in Betula occidentalis. Plant Cell Environ. 17, 1233–1241. doi: 10.1111/j.1365-3040.1994.tb02021.x
Sperry, J. S., Sullivan, J. E. (1992). Xylem embolism in response to freeze-thaw cycles and water stress in ring-porous, diffuse-porous, and conifer species. Plant Physiol. 100, 605–613. doi: 10.1104/pp.100.2.605
Sperry, J. S. (1995). “Limitations on stem water transport and their consequences”, in Plant stems. Physiology and functional morphology. Ed. Gartner, B. L. (San Diego: Academic Press), pp. 105–121.
Tardieu, F., Simonneau, T. (1998). Variability among species of stomatal control under fluctuating soil water status and evaporative demand: modelling isohydric and anisohydric behaviours. J. Exp. Bot. 49, 419–432. doi: 10.1093/jxb/49.Special_Issue.419
Thomas, F. M., Arndt, S. K., Bruelheide, H., Foetzki, A., Gries, D., Huang, J., et al. (2000). Ecological basis for a sustainable management of the indigenous vegetation in a Central-Asian desert: presentation and first results. J. Appl. Bot. 74, 212–219.
Thomas, F. M., Foetzki, A., Gries, D., Bruelheide, H., Li, X. Y., Zeng, F. J., et al. (2008). Regulation of the water status in three co-occurring phreatophytes at the southern fringe of the Taklamakan Desert. J. Plant Ecol. 1, 227–235. doi: 10.1093/jpe/rtn023
Torres-Ruiz, J. M. (2020). Virtual issue on Plant hydraulics: update on the recent discoveries. Physiol. Plant. 168, 758–761. doi: 10.1111/ppl.13081
Tyree, M. T., Sperry, J. S. (1988). Do woody plants operate near the point of catastrophic xylem dysfunction caused by dynamic water stress? : answers from a model. Plant Physiol. 88, 574–580. doi: 10.1104/pp.88.3.574
Volaire, F. (2018). A unified framework of plant adaptive strategies to drought: Crossing scales and disciplines. Global Change Biol. 24, 2929–2938. doi: 10.1111/gcb.14062
Way, D. A., Domec, J. C., Jackson, R. B. (2013). Elevated growth temperatures alter hydraulic characteristics in trembling aspen (Populus tremuloides) seedlings: implications for tree drought tolerance. Plant Cell Environ. 36, 103–115. doi: 10.1111/j.1365-3040.2012.02557.x
Wheeler, J. K., Huggett, B. A., Tofte, A. N., Rockwell, F. E., Holbrook, N. M. (2013). Cutting xylem under tension or supersaturated with gas can generate PLC and the appearance of rapid recovery from embolism. Plant Cell Environ. 36, 1938–1949. doi: 10.1111/pce.12139
Woodruff, D. R., Mcculloh, K. A., Warren, J. M., Meinzer, F. C., Lachenbruch, B. (2007). Impacts of tree height on leaf hydraulic architecture and stomatal control in Douglas-fir. Plant Cell Environ. 30, 559–569. doi: 10.1111/j.1365-3040.2007.01652.x
Wu, J., Zhang, X., Deng, C., Liu, G., Li, H. (2010). Characteristics and dynamics analysis of Populus euphratica populations in the middle reaches of Tarim River. J. Arid. Land. 2, 250–256. doi: 10.3724/SP.J.1148.2010.00242
Yu, T., Feng, Q., Si, J., Pinkard, E. A. (2019). Coordination of stomatal control and stem water storage on plant water use in desert riparian trees. Trees 33, 1–15. doi: 10.1007/s00468-019-01816-7
Zhang, Y. J., Rockwell, F. E., Graham, A. C., Alexander, T., Holbrook, N. M. (2016). Reversible Leaf Xylem Collapse: A Potential “Circuit Breaker” against Cavitation. Plant Physiol. 172, 2261–2274. doi: 10.1104/pp.16.01191
Zhou, H., Chen, Y., Li, W., Ayup, M. (2013). Xylem hydraulic conductivity and embolism in riparian plants and their responses to drought stress in desert of Northwest China. Ecohydrology 6, 984–993. doi: 10.1002/eco.1412
Keywords: hydraulic model, xylem cavitation, leaf specific hydraulic conductance, stomatal conductance, water homeostasis
Citation: Fan D-Y, Dang Q-L, Xu C-Y, Jiang C-D, Zhang W-F, Xu X-W, Yang X-F and Zhang S-R (2020) Stomatal Sensitivity to Vapor Pressure Deficit and the Loss of Hydraulic Conductivity Are Coordinated in Populus euphratica, a Desert Phreatophyte Species. Front. Plant Sci. 11:1248. doi: 10.3389/fpls.2020.01248
Received: 23 April 2020; Accepted: 29 July 2020;
Published: 14 August 2020.
Edited by:
Virginia Hernandez-Santana, Institute of Natural Resources and Agrobiology of Seville (CSIC), SpainReviewed by:
Alejandra Navarro, Council for Agricultural and Economics Research (CREA), ItalyDirk Vanderklein, Montclair State University, United States
Copyright © 2020 Fan, Dang, Xu, Jiang, Zhang, Xu, Yang and Zhang. This is an open-access article distributed under the terms of the Creative Commons Attribution License (CC BY). The use, distribution or reproduction in other forums is permitted, provided the original author(s) and the copyright owner(s) are credited and that the original publication in this journal is cited, in accordance with accepted academic practice. No use, distribution or reproduction is permitted which does not comply with these terms.
*Correspondence: Da-Yong Fan, ZGF5b25nLmZhbkBhbnUuZWR1LmF1; Shou-Ren Zhang, enNyQGliY2FzLmFjLmNu