 Mariela R. Escobar
 Ivo Feussner
 Estela M. Valle
- 1Instituto de Biología Molecular y Celular de Rosario (IBR-CONICET-UNR), Rosario, Argentina
- 2Department of Plant Biochemistry, Albrecht-von-Haller-Institute for Plant Sciences, Göttingen Center for Molecular Biosciences (GZMB), University of Göttingen, Göttingen, Germany
Mitochondria play important roles in the plant stress responses and the detoxification of the reactive oxygen species generated in the electron transport chain. Expression of genes encoding stress-related proteins such as the mitochondrial small heat shock proteins (M-sHSP) is upregulated in response to different abiotic stresses. In Arabidopsis thaliana, three M-sHSPs paralogous genes were identified, although their function under physiological conditions remains elusive. The aim of this work is to uncover the in vivo function of all three M-sHSPs at the whole plant level. To accomplish this goal, we analyzed the phenotype, proteomic, and metabolic profiles of Arabidopsis knock-down lines of M-sHSPs (single, double, and triple knock-down lines) during normal plant growth. The triple knock-down plants showed the most prominent altered phenotype at vegetative and reproductive stages without any externally applied stress. They displayed chlorotic leaves, growth arrest, and low seed production. Concomitantly, they exhibited increased levels of sugars, proline, and citric, malic, and ascorbic acid, among other metabolites. In contrast, single and double knock-down plants displayed a few changes in their phenotype. A redundant function among the three M-sHSPs is indicated by the impairment in vegetative and reproductive growth associated with the simultaneous loss of all three M-sHSPs genes. The triple knock-down lines showed alteration of proteins mainly involved in photosynthesis and antioxidant defense compared to the control plants. On the other hand, heat stress triggered a distinct cytosolic response pattern and the upregulation of other sHSP members, in the knock-down plants. Overall, depletion of all three M-sHSPs in Arabidopsis severely impacted fundamental metabolic processes, leading to alterations in the correct plant growth and development. These findings expand our knowledge about the contribution of organelle-specific M-sHSPs to healthy plant growth under non-stress conditions.
Introduction
In plants, reactions involved in regular metabolisms, such as photosynthesis and respiration, are sources of reactive oxygen species (ROS) in the cell as the unavoidable consequence of aerobic life (Halliwell and Gutteridge, 2015). Under heat stress, mitochondria generate much more ROS than other cell compartments (Zhang et al., 2009). To cope with heat stress, plants produce small heat shock proteins (sHSPs) as the most dominant proteins (Sun et al., 2002), representing the first lines of cellular defense against irreversible protein aggregation that arise during various stresses (Waters, 2013). sHSPs are also known to act in the acquired heat stress tolerance (Song et al., 2012).
Plant sHSPs respond to a wide range of environmental stresses (Wang et al., 2004; Jacob et al., 2017), and sHSP gene expression is mediated by the increase in cellular H2O2 accumulation in Arabidopsis thaliana (Vanderauwera et al., 2005; Scarpeci et al., 2008a). Nevertheless, sHSP genes are hardly expressed in vegetative tissue under non-stress conditions (Waters et al., 1996; Scarpeci et al., 2008b).
The protective function of sHSPs in stress responses is quite conserved among different plant species. Overexpression of tea (Camellia sinensis) sHSP genes confers tolerance to heat and cold stress in Arabidopsis (Wang et al., 2017). Also, sHSP21 is responsible for the development of chloroplasts during heat stress (Zhong et al., 2013).
The presence of organelle-targeted sHSPs appears to be unique to plants (Waters, 2013; Waters and Vierling, 2020), except for a mitochondrion-targeted sHSP found in Drosophila melanogaster (Morrow and Tanguay, 2015) and the parasite Toxoplasma gondii (de Miguel et al., 2005).
In Arabidopsis, two homologous genes encoding mitochondrial (M-) sHSPs, M-sHSP23.5 (At5g51440), and M-sHSP23.6 (At4g25200) (Scharf et al., 2001; Hooper et al., 2017) and a later identified gene (At1g52560) encoding an M-sHSP26.5, also of mitochondrial location (Siddique et al., 2008; Hooper et al., 2017), were found to be very highly co-expressed during stress conditions in more than 150 microarray experiments (Leister et al., 2011). In particular, At5g51440 was rapidly and highly upregulated in Arabidopsis seedlings by superoxide anions (O2⋅–) generated in the chloroplast during photosynthesis by the herbicide methyl viologen (Scarpeci et al., 2008a) and by application of 100 mM hydrogen peroxide (Hieno et al., 2019). It was recently reported that one of the six genes encoding cotton (Gossypium hirsutum) M-sHSP accelerates seed germination in response to increased temperature via ROS generation (Ma et al., 2019). The authors reported that the cotton M-sHSP could bind to cytochrome C maturation protein, blocking the cytochrome C in the mitochondrial electron transport chain. Previously, it was demonstrated that D. melanogaster DmHsp22 improves maximal mitochondrial oxygen consumption capacity and ATP content, providing a mechanistic link between DmHsp22 and mitochondrial functions (Dabbaghizadeh et al., 2018).
The function of M-sHSP in thermotolerance has been previously studied, focusing on the overexpression of sHSPs in different plants (Jiang et al., 2009). Transgenic plants were produced using orthologous M-sHSPs genes of Arabidopsis, maize (Zea mays), or tomato (Solanum lycopersicum). Tomato “Micro-Tom” plants transformed for high expression of M-sHSP23.6 from Arabidopsis participate in the heat tolerance mechanism, while the suppression of this protein resulted in more significant physiological damage during heat stress (Huther et al., 2013). Arabidopsis plants expressing a transgene encoding the maize ZmHSP22 showed increased thermotolerance and altered expression of nuclear genes encoding the endogenous M-sHSP23.6 and several HSPs, suggesting that the heat-induced mitochondrial retrograde regulation was altered (Rhoads et al., 2005). Tobacco (Nicotiana tabacum) plants expressing an M−sHSP gene from tomato exhibited thermotolerance, whereas the antisense plants in which the expression of the gene is suppressed exhibited susceptibility to heat stress (Sanmiya et al., 2004).
The set of stress-resistant phenotypes described above for M-sHSP overexpressing transgenic material suggests the importance of M-sHSPs for the plant to survive at high temperatures, although it is essential to recognize the limited nature of the heat tolerance demonstrated up to now. As proposed, sHSPs function as ATP-independent chaperones that capture stress-denaturing proteins to prevent irreversible denaturation (Waters and Vierling, 2020). Currently, there is a lack of knowledge about the in vivo function of sHSPs, particularly the organelle-specific sHSPs, during the plant growth cycle.
In this work, we aim to demonstrate the importance of each M-sHSP at the whole plant level. Accordingly, we generated Arabidopsis knock-down of all the three genes [single, double (At4g25200, At5g51440), and triple knock-down lines] using artificial microRNA (amiR) strategy, and proteomic and metabolomic approaches. Evidence is provided for the critical role of the three M-sHSPs in the overall cell homeostasis.
Materials and Methods
Plant Materials and Growth Conditions
The A. thaliana Col-0 ecotype was used in all the experiments. The plants were grown in a growth chamber at 22°C ± 2°C under 16 h light/8 h dark with fluorescent light at 120 μmol m–2 s–1 and 60% humidity.
Generation of Artificial microRNA Silenced Plants
The generation of knock-down Arabidopsis was performed by using a constitutive amiR approach, according to Schwab et al. (2006). For the single knock-down amiR lines, optimal amiR sequences to knock down the genes At5g51440, At4g25200, and At1g52560 were obtained from the WMD—Web Micro RNA designer tool1 and the miRNA∗ was designed to match the amiR in the same way as in the duplex miR–miR∗ of miRNA319 (Supplementary Table 1). Similarly, a specific amiR sequence for both At5g51440 and At4g25200 transcript was obtained for the double knock-down amiR23.5/23.6 lines (amiRD). NB147 plasmid containing the MIR319a precursor was used to engineer the amiRs before being subcloned into the binary vector pCHF3 under the control of the 35S promoter. The same amiR sequences designed for the double and amiR26.5 lines were in frame cloned under the control of a unique 355 promoter in the pCHF3 vector to obtain the triple amiR23.5/23.6/26.5 construct. Stable transformation of Arabidopsis plants was performed by flower dip with Agrobacterium tumefaciens (Clough and Bent, 1998), and the presence of the transgene was confirmed by PCR. A minimum of four independent transforming lines was isolated for each construct, including the Col-0 (empty vector controls).
Construction of Promoter–GUS Fusion Lines and GUS Staining
The 5′ sequence upstream of the translation initiation codon of the At5g51440 (446 bp), At4g25200 (1087 bp), and At1g52560 (1100 bp) genes was amplified by PCR using specific primers (Supplementary Table 1) and cloned in-frame fused to the GUS reporter gene (1812 bp) contained into the pCHF3 binary vector. The constructs were used to transform Arabidopsis plants by floral dip. Five independent lines were isolated for each promoter construct. GUS staining was performed as described (Weigel and Glazebrook, 2002) under normal or heat stress conditions (3 h at 37°C). The staining was repeated in at least 20 biological replicates of 7- and 15-day-old plants from every independent line.
Isolation of RNA From Tissues Plants
RNA from 7-day seedlings was isolated using TriPure Isolation Reagent (Sigma-Aldrich Co., St. Louis, United States) and following the manufacturer’s procedure. RNA concentrations were measured by using a NanoDrop 2000 spectrophotometer, and the quality was confirmed by loading 1 μg of the sample in a 1.5% (w/v) agarose gel. In all experiments, extractions were performed in four biological replicates of control or transgenic independent line. Twenty plants were pooled for one replicate.
Quantitative RT-PCR (RT-qPCR)
Contaminant DNA was digested and removed from RNA suspension by using DNase I following the manufacturer’s instructions. The RNA was then reverse transcribed into cDNA with the RevertAid transcriptase. RT-qPCR measurements were performed by using the Takyon No Rox SYBR Core Kit blue dTTP following the manufacturer’s instructions and the iQ5 qPCR cycler. Gene expression was normalized to the protein phosphatase 2A gene (PP2A) that was used as a reference gene. Four biological replicates were measured in each control and transgenic independent line, and two technical replicates were performed.
Root Length and Seed Germination Experiments
Sterilized Arabidopsis seeds were spread on petri dishes containing half-strength Murashige and Skoog medium and 0.8% (w/v) agar. After stratification for 3 days at 4°C in the dark, seeds were grown vertically under normal conditions, and the roots were photographed every day and measured for 15 days. Fourteen independent triple knock-down lines (amiRT) were evaluated, as well as three independent lines in the rest of the construct and controls. Eight biological replicates in each line were measured. For seed germination, approximately 80 sterilized seeds of each amiR line (four independent lines) and control lines were used. Nine days after stratification, the number of germinated seeds under normal conditions was counted.
Pigment Content
Twenty milligrams fresh weight of plant material was extracted two times with 80% ethanol (Merck)/10 mM MES (pH 5.9) (Sigma-Aldrich) and once with 50% Ethanol/10 mM MES (pH 5.9) for 30 min at 80°C; the supernatants were combined and used for pigment content determination in a polystyrene 96-deep well plate as in Scarpeci et al. (2017). Four independent lines of each amiR construct, and eight biological replicates in every control and transgenic independent line were measured.
Pulse Amplitude Modulation (PAM) Analyses
PSII photochemical response was evaluated through PAM fluorometric measurements by using a Dual-PAM-100 system (Heinz Walz, Effeltrich, Germany). Four independent lines and three biological replicates per line were measured for each amiR construct, as well as 12 control plants. Replicates consisted of individual plants. The experiment was repeated twice. Twenty-one-day-old control and amiR plants were used and dark adapted for 2 h before measurements. This allowed the complete inactivation of the Calvin-Benson cycle. A short induction protocol of 70 s was applied to the leaves consisting of illumination with actinic light of 166 μmol photons m–2 s –1 and saturating pulses every 5 s. The information of photosynthetic parameters was extracted from the Dual-PAM-100 software as described in Klughammer and Schreiber (2008). The parameters Fv/Fm, ΦPSII, qL, ETR (II), NPQ, ΦNPQ, and ΦNO were evaluated during the 70 s of induction.
ROS and Cell Death Detection
H2O2 and O2⋅– were detected in 28-day-old plants as described in Scarpeci et al. (2008a). For O2⋅– detection, leaves were vacuum-infiltrated with 50 mM sodium phosphate, pH 7.5, containing 0.2% (w/v) nitroblue tetrazolium (NBT) (N6876, Sigma-Aldrich) and incubated at room temperature for 2 h in the dark. For the detection of H2O2, leaves were infiltrated with a solution of 1 mg/ml 3,3′-diaminobenzidine (DAB). Trypan blue staining was performed following a modified protocol (Fernández-Bautista et al., 2016). Leaves were incubated in trypan blue staining solution (85% lactic acid 10 ml, phenol 10 ml, 99% glycerol 10 ml, distilled water 10 ml, and trypan blue 40 mg) for maximum 1 h. After all incubations, tissues were cleared with 70% ethanol before being photographed. Experiments were conducted in four independent lines of each amiR construct; eight biological replicates were measured in control and transgenic lines.
Cell Areas Determination
Leaves from 21-day-old plants were incubated with lactic acid (85%) at room temperature for 3 days, until tissues were completely cleared. Leaf cells were detected using differential interference contrast microscopy in an Olympus BH2 microscope. To determine the mean areas, six leaves and a minimum of 650 epidermal and parenchymal cells from each knock-down line or control plants were measured.
Electrolyte Leakage Measurement
Discs from 28-day-old Arabidopsis leaves were thoroughly rinsed with deionized water, covered with 0.4 M mannitol, and incubated at 25°C for 3 h. A conductance meter (Twin Compact Meter-Horiba, Northampton, United Kingdom) was used to measure the conductivity at 25°C after the incubation and again after autoclaving samples for 30 min at 120°C to release all the electrolytes. Electrolyte leakage was indicated as a percentage of total electrolytes. Three independent lines of each amiR and three biological replicates in each control and transgenic independent line were measured.
Metabolite Profiling by GC-MS
Metabolites were extracted from 100 mg of ground leaf material of 15-day-old Arabidopsis plants. According to an established GC-MS protocol (Lisec et al., 2006), extractions were done by using a methanol/chloroform protocol followed by samples derivatization and measurement of the metabolite levels. Metabolites were identified by comparing to databases of authentic standards (Schauer et al., 2005) and quantified based on the internal standard added. Values were expressed as fold changes of metabolites in each sample relative to control plants. Experiments were performed in three biological replicates of control and amiR lines; replicates consisted of a pool of 50 plants.
Proteomic Experiments
Proteins were isolated from 15-day-old Arabidopsis plants grown in half-strength Murashige and Skoog medium by using a phenol extraction protocol, according to Grimplet et al. (2009). Protein concentration was determined by using the protein quantitation assay kit BSA Thermo Scientific Pierce. Sixty micrograms of protein was loaded on a 10% SDS polyacrylamide gel and run until samples had migrated 1 cm into the running gel. The bands stained with Coomassie Brilliant Blue G-250 (Neuhoff et al., 1988) were excised from the gels and subjected to an in-gel tryptic digest as in Shevchenko et al. (2007). The peptides were analyzed with LC-combined tandem MS in the Service Unit LCMS Protein analytics at the University of Göttingen by the use of OrbitrapTM mass spectrometers coupled to UltiMate3000 RSLCnano systems. Data are available via ProteomeXchange with identifier PXD019603. Measurements were performed in three biological replicates of empty vector control and amiR lines; each replicate corresponds to one transgenic independent line and consisted of a pool of 50 plants. Two technical replicates were performed and combined in the data analysis.
Proteomic Data Analysis
Protein groups were identified and quantified by performing label-free quantification (LFQ) with the MaxQuant software 1.6.2.10 (Cox and Mann, 2008) following standard procedure. The Arabidopsis Proteome ID UP000078284 database downloaded from UniProt was used. The resulting protein groups file was loaded into Perseus 1.6.1.1 (Tyanova et al., 2016), and the matrix was filtered using default settings. Technical replicates were combined in a new matrix. The data were transformed into log2 for the statistical tests and imputation. For the hierarchical clustering, the data were filtered to have at least three valid values in one group. Missing values were imputed from a normal distribution (witch: 3, down shifted: 1.8). Samples in one group were combined and the average was calculated. Z score normalization was applied and a hierarchical cluster with Euclidean distance, average linkage, and maximum 30 clusters was performed. Protein abundance changes were discovered by performing pair-based comparisons of the LFQ intensities between control and each amiR group using two-side t-test analysis. For this, the LFQ matrix was filtered to have three valid values in at least one of the groups in each comparison. Proteins identified with at least two unique peptides and statistically significant changes (t-test, P < 0.05) were considered for further analysis. Unless otherwise stated, relative LFQ (rLFQ) was calculated as a percentage of the total LFQ in the sample and was used to show the relative abundance of proteins in the proteome.
Bioinformatics Analysis
Protein sequences were aligned using the Clustal2.1 program (EMBL-EBI), the percentage of identity was determined, and the CLC Sequence Viewer 7.0.2 was used to represent the conservation at a particular position in the alignment. The overrepresented Gene Ontology (GO) in the list of proteins was investigated by using STRING (Szklarczyk et al., 2019), and the subcellular localization was determined by SUBA 4 (Hooper et al., 2017). Venn diagrams were drawn on the Online Venn Diagram Tool.
Statistical Analyses
Statistical significance in the pair-based comparisons was estimated according to Student’s t-test by using Excel 2016. Only comparisons with a P-value < 0.05 were designated as statistically significant. Proteomic data were statistically analyzed by Perseus 1.6.1.1 and Excel 2016 software.
Results
All Three M-sHSP Genes Are Heat-Inducible
The protein sequence alignment of the M-sHSP23.5, M-sHSP23.6, and M-sHSP26.5 revealed that the three mitochondrial proteins share high sequence similarity (Supplementary Figure 1A). The highest sequence conservation is observed between sHSP23.5 and sHSP23.6 (68% identity) (Supplementary Figure 1B), reflecting that At5g51440 and At4g25200 may be paralogous genes and the product of a duplication event (Waters et al., 2008). The heat response of M-sHSPs was assayed by RT-qPCR in 7-day-old Arabidopsis seedlings (whole seedling) exposed to 37°C for 3 h. Compared to the expression under normal growth conditions, the three M-sHSP genes were significantly and highly upregulated by heat (Supplementary Figure 2). To further evaluate this heat stress response in different tissues, the promoter region of At5g51440 (446 bp), At4g25200 (1087 bp), and At1g52560 (1100 bp) was fused to the reporter gene GUS, and transgenic Arabidopsis seedlings were analyzed under normal growth conditions and heat stress (3 h at 37°C) (Figure 1). All three promoters were clearly responsive to heat stress and almost inactive under normal growth conditions in 7-day-old seedlings (Figure 1). At this stage, M-sHSP23.5 and M-sHSP23.6 promoters were active in all tissues after heat treatment, while M-sHSP26.5 promoter activity was only detectable in the root. In 15-day-old seedlings, M-sHSP23.5, M-sHSP23.6, and M-sHSP26.5 promoters were responsive to heat conditions in all tissues (Figure 1).
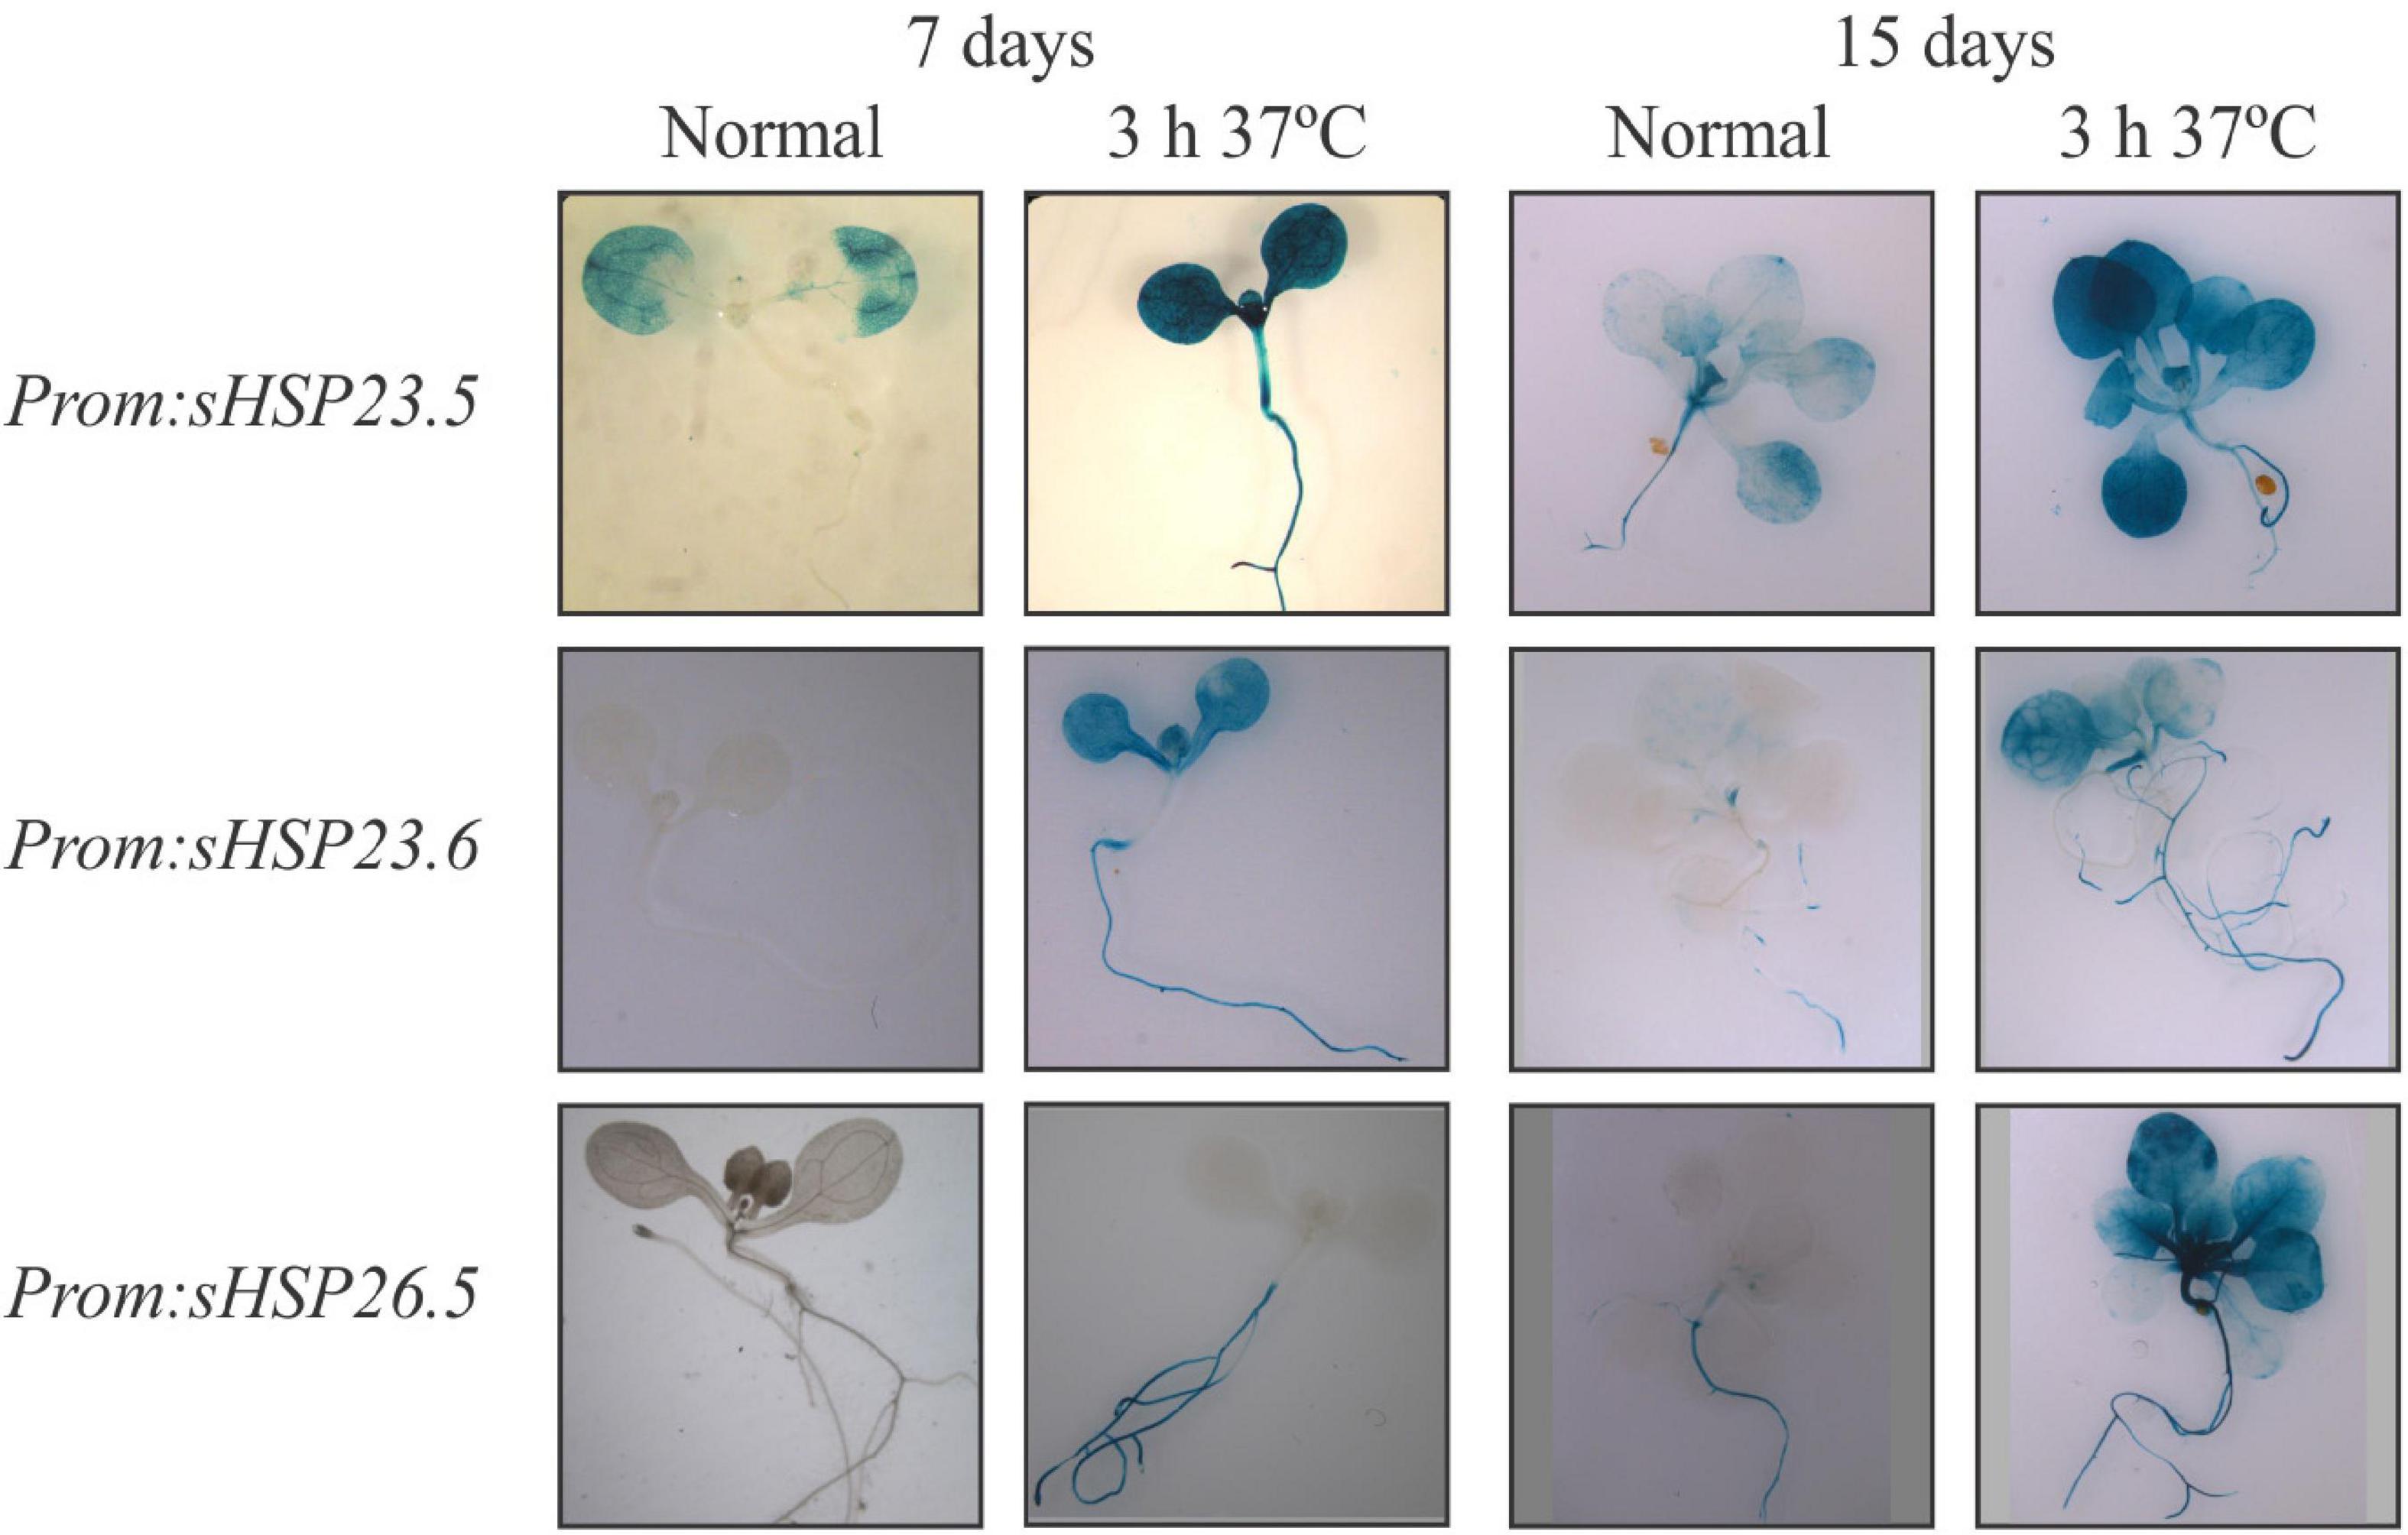
Figure 1. Histochemical analysis of M-sHSPs promoter activity in Arabidopsis seedlings. Transgenic plants carrying the promoter regions of At5g51440 (−446 bp), At4g25200 (−1087 bp), and At1g52560 (−1100 bp) fused to the GUS gene were grown for 7 or 15 days under normal condition (22°C) and then exposed for 3 h to a higher temperature (37°C). GUS staining was performed as stated in Materials and Methods. Five independent transformed lines and a minimum of 20 biological replicates per line were tested for each construct, stage, and condition. Experiments were performed twice. Representative pictures of plants before and after stress treatments are shown.
The M-sHSP amiR Plants Show Differences in the Vegetative Phenotype
To assess the function of the M-sHSPs, we knocked down the three M-sHSPs in transgenic Arabidopsis plants by using a constitutive amiR approach. Since transfer DNA insertion lines (knockout) were not available for all of the individual genes, to avoid problems due to potential redundancy, and in order to make them comparable to the double and triple lines, knock-down transgenic plants were in parallel obtained for each of the M-sHSP by using an identical artificial microRNA strategy (Supplementary Figure 3). Transgenic plants were accordingly named as amiR23.5, amiR23.6, and amiR26.5 for every single construct, amiR23.5/23.6 (or amiRD) for the double knock-down, and amiR23.5/23.6/26.5 (or amiRT) for the triple knock-down line. The posttranscriptional silencing of the target genes was confirmed by RT-qPCR in at least four independent transgenic lines obtained for each amiR construct (Figure 2). The single and amiRD lines, with downregulation of one or two of M-sHSP, responded with increased M-sHSPs expression of the others, indicating a transcriptional regulation and probable functional compensation of these proteins (Figure 2F). The phenotype of at least three independent transgenic lines of all amiR construct and empty vector control plants at different developmental stages was analyzed. Seven-day-old seedlings (not shown) and 15-day-old plants from amiR lines were equal in size to those of the control plants (Figure 3A). Soon after, 20-day-old plants of the single and double knock-down lines of sHSP23.5 and sHSP23.6 produced bigger rosettes than control plants (Figure 3B). Representative 25-day-old rosettes (Figure 3C) and 28- and 40-day-old plants (Figures 3D,E) show the apparent difference in the size of these plants. The single amiR26.5 lines, on the other hand, developed a control-like phenotype at this stage (Figure 3E). The most extreme phenotype was found in the amiR23.5/23.6/26.5, where the complete development was affected (Figures 3B–E). These plants showed tiny plants in the whole growth cycle. They were significantly smaller, only half-height of the control plants, with apparently fewer branches than control plants, and the leaves were chlorotic. Although amiRT plants developed fully expanded rosettes, they develop an entirely different phenotype from all other transgenic lines (Figure 3E).
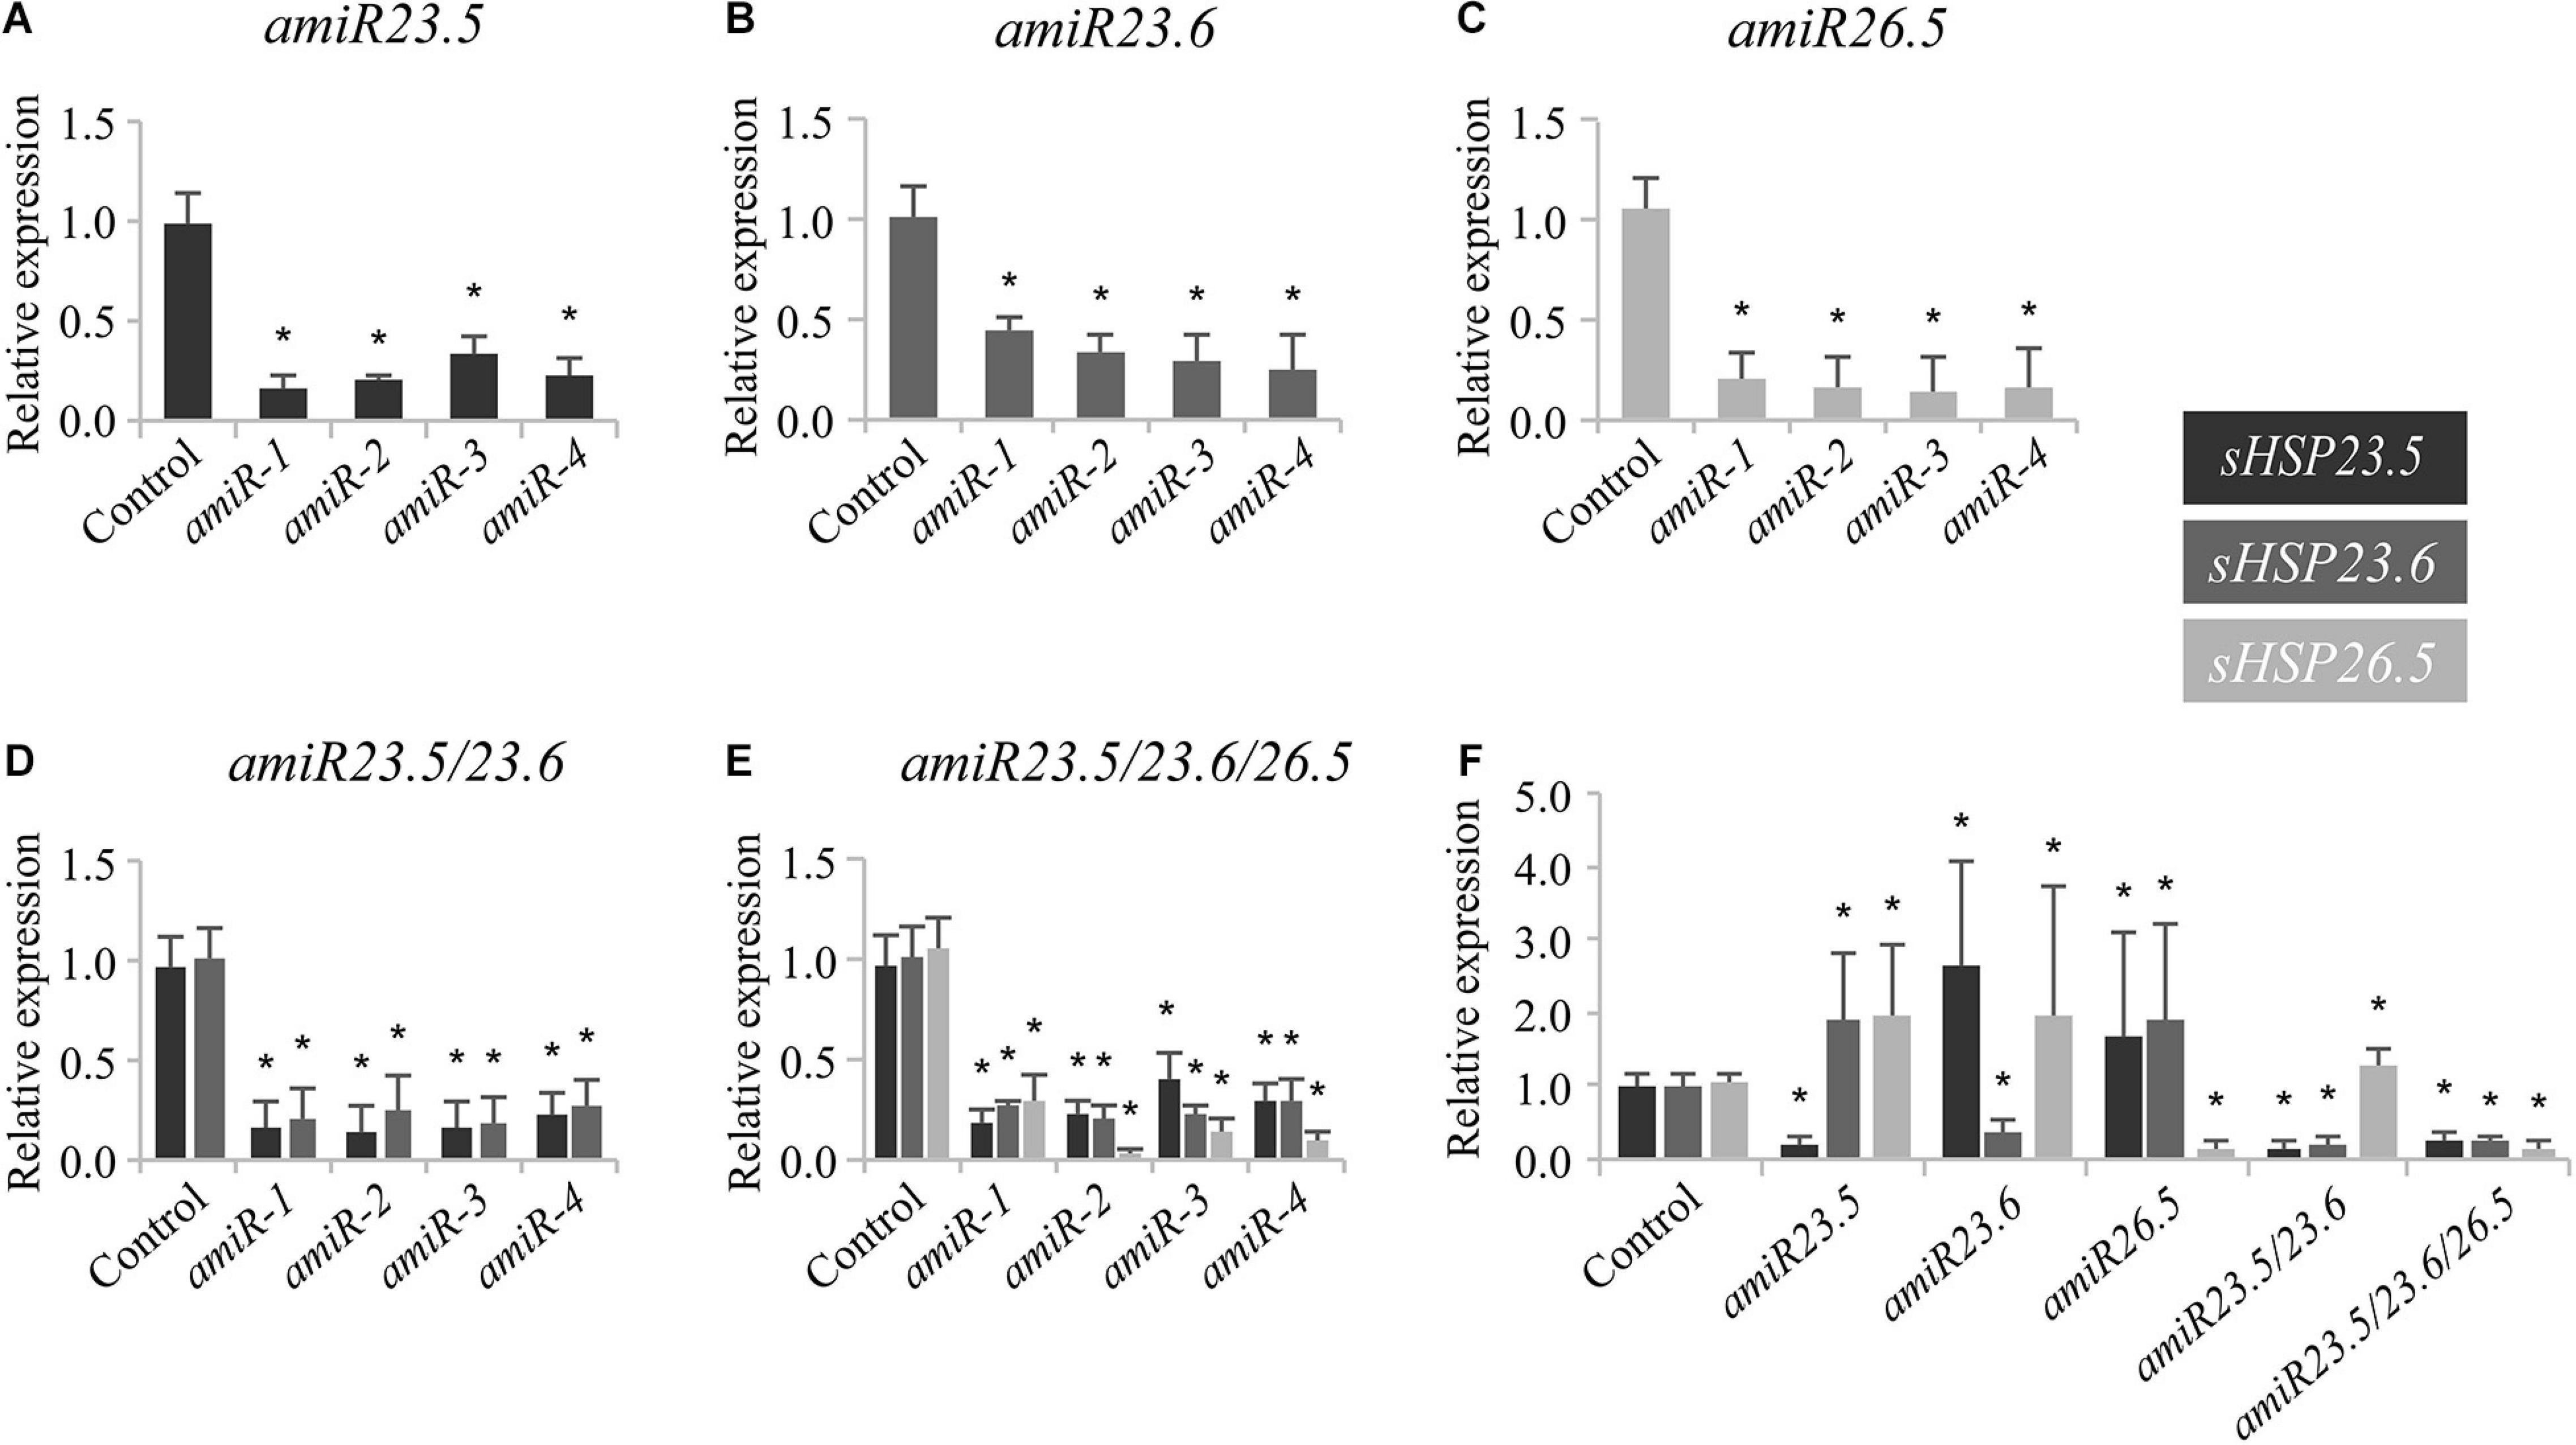
Figure 2. Expression of sHSP23.5, sHSP23.6, and sHSP26.5 in knock-down amiR lines. Seedlings of amiR23.5 (A), amiR23.6 (B), amiR26.5 (C), amiRD (D), and amiRT (E) were grown for 7 days at 22°C under long-day conditions and then exposed 3 h to 37°C for expression induction, before sampling. All expression values are normalized to the protein phosphatase 2A gene (PP2A) as a reference. Relative expression of the transcripts was normalized to their respective expression in control plants. In each construct, four independent transgenic lines were evaluated for the expression of the silenced gene. Experiments were performed twice; data shown correspond to one representative experiment. Each data point represents the mean value ± SD of four biological replicates in every independent line. Twenty plants were pooled for one replicate. One of these four replicates of each independent line in one construct was selected to measure the expression of the three genes (the amiR target and the others). These four samples were taken as representative of the four independent lines and combined in the last panel (F). Asterisks indicate significance by a two-sided t-test with *P < 0.05.
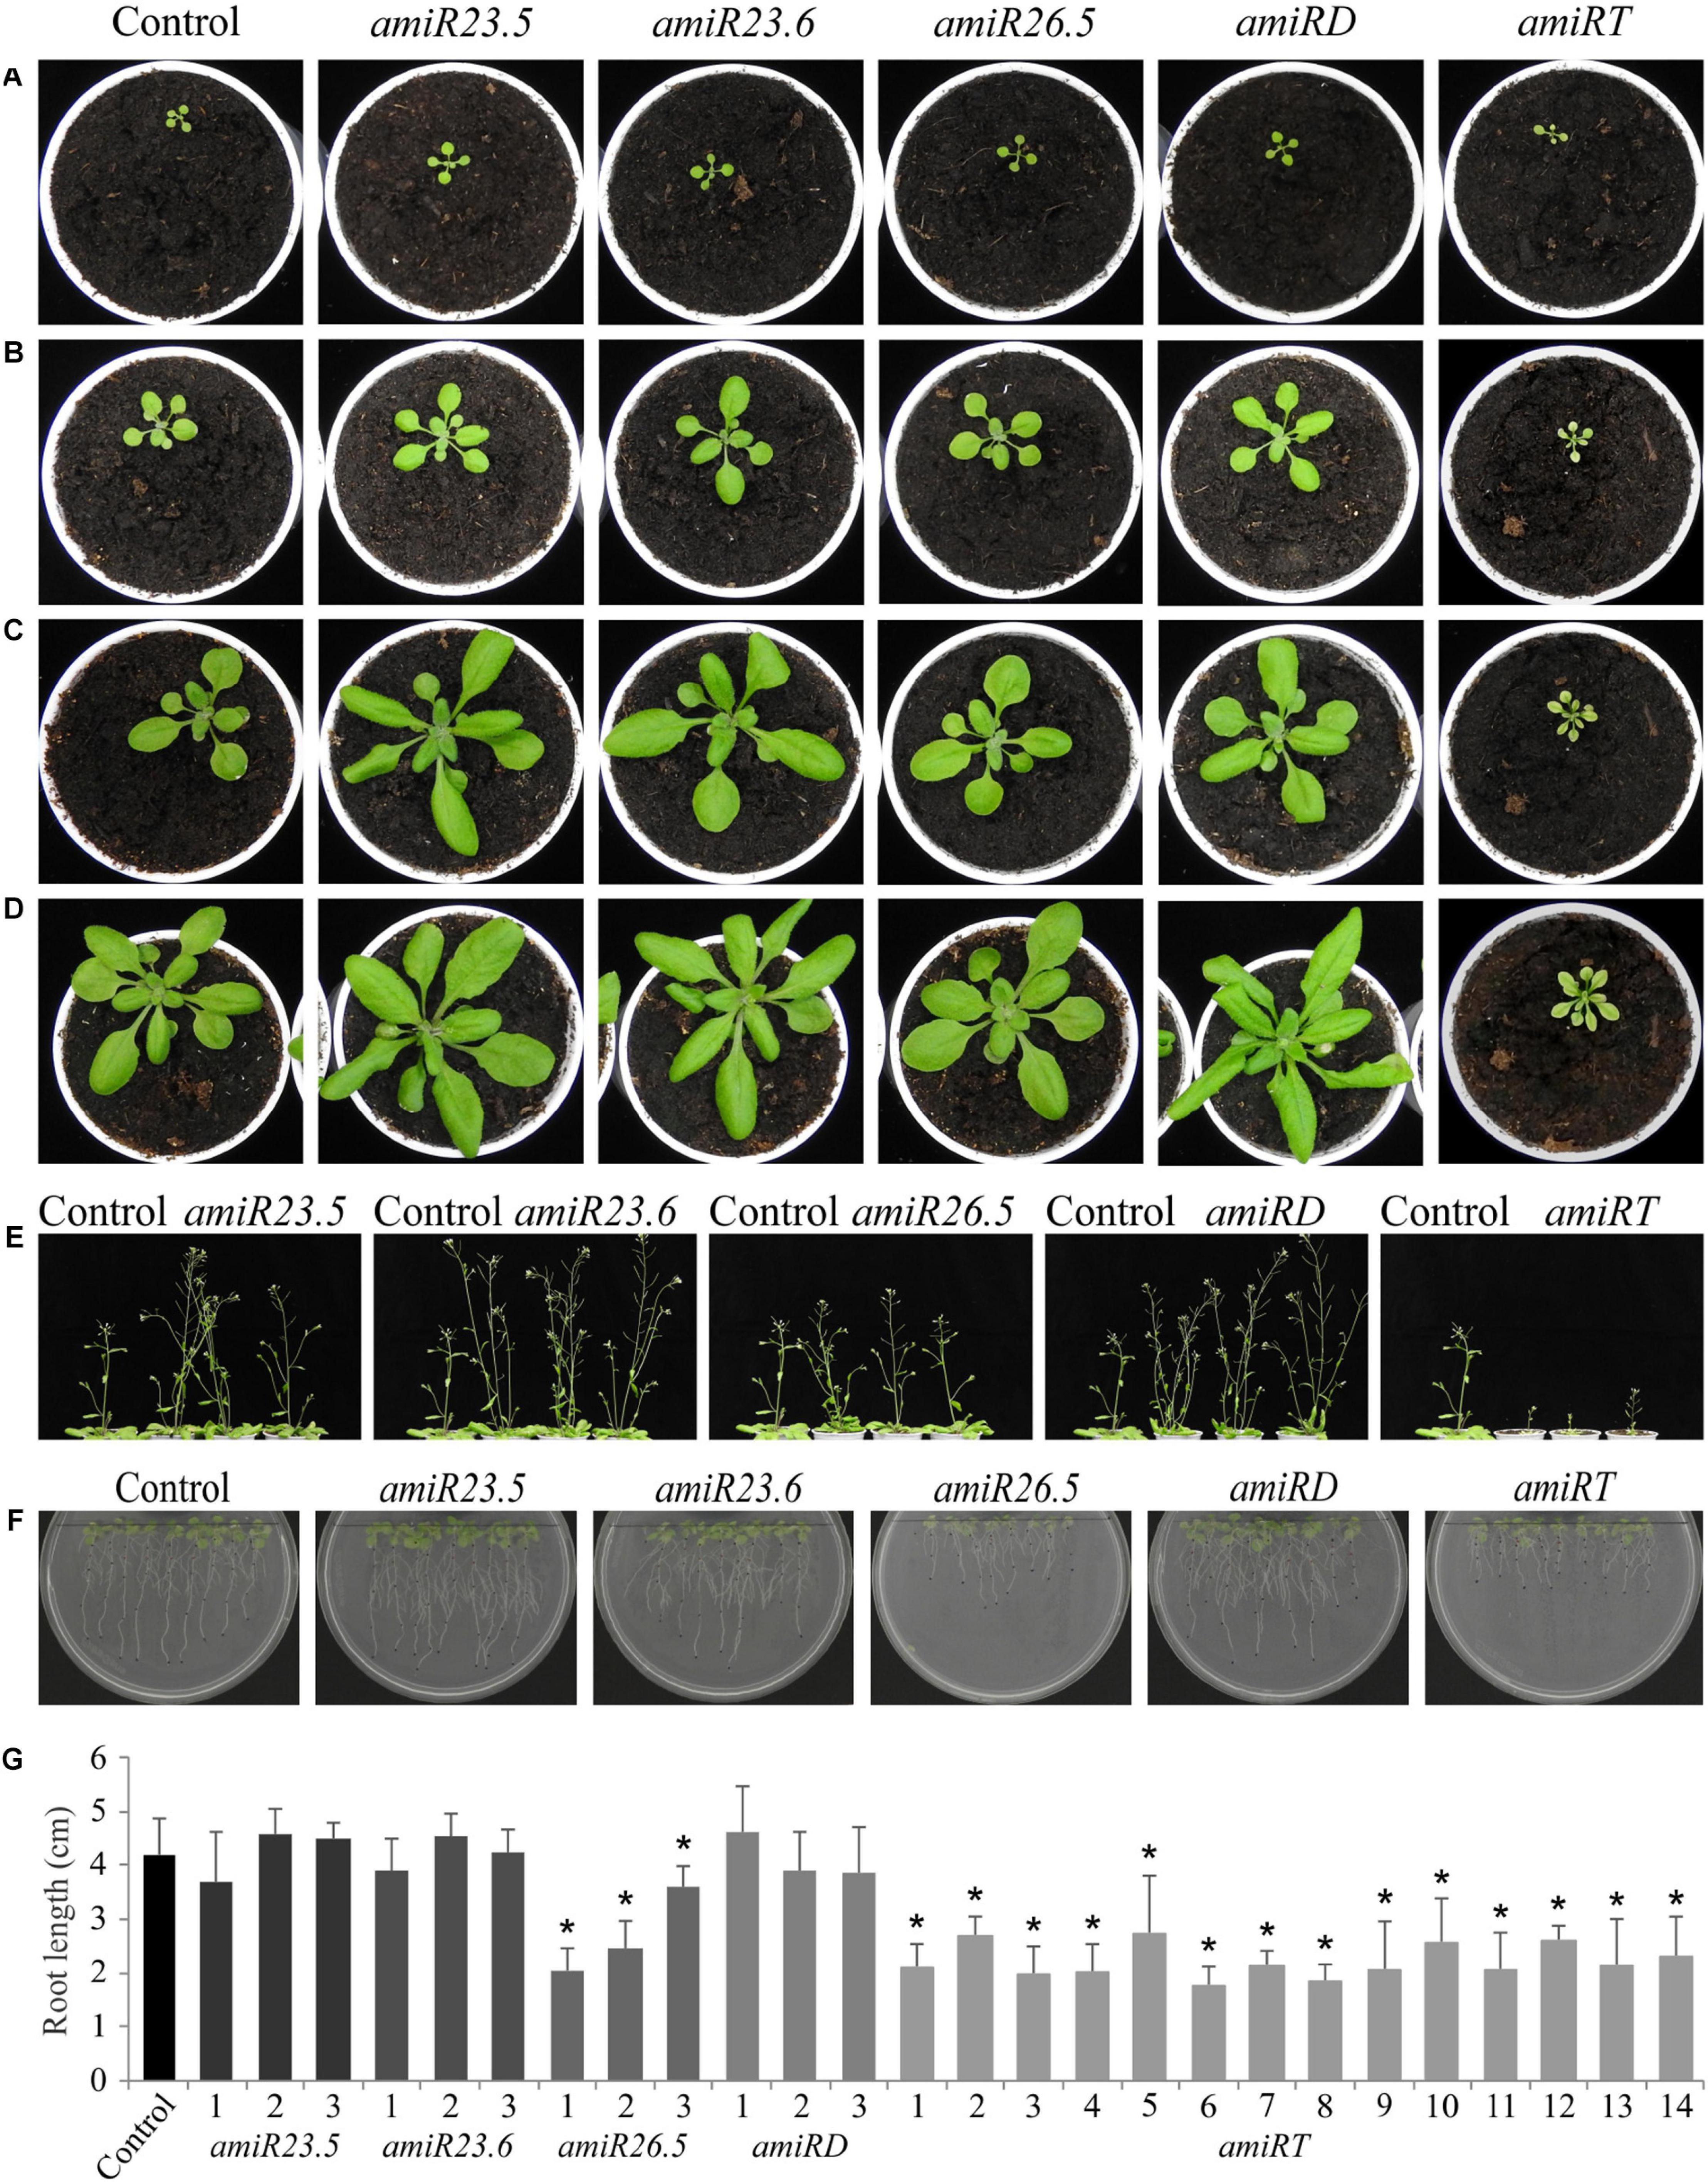
Figure 3. Phenotypes and root length of amiR plants. At least three independent transgenic lines of amiR constructs and control plants at different developmental stages were analyzed. Representative pictures of 15-day-old (A), 20-day-old (B), 25-day-old (C), 28-day-old (D), and 40-day-old (E) plants are shown. For the root length evaluation (F,G), plants were vertically grown, and roots were periodically photographed and measured. Pictures (F) and values (G) correspond to the root length after 15 days of growth. Three independent lines of each amiR construct were evaluated, except for the amiRT, where 14 independent lines were evaluated (G). Data points represent the mean value ± SD of eight biological replicates. Asterisks indicate significance by a two-sided t-test with *P < 0.01.
Concerning the roots, the phenotype and length in amiR23.5, amiR23.6, and amiR23.5/23.6 lines were similar to control plants (Figures 3F,G). Differently, amiR26.5 and amiR23.5/23.6/26.5 plants produced shorter roots than control in all the evaluated lines (Figures 3F,G).
Expanded rosettes of 28-day-old plants were dissected to better evaluate leaf phenotype in all knock-down lines (Figure 4A). Both single amiR23.5 and amiR23.6 and amiR23.5/23.6 produced curved down leaves, unlike control plants with flat and completely expanded leaves. Leaves of amiR26.5 did not display any difference to control leaves. On the contrary, the leaves of amiRT lines showed small size, indicating an alteration in the plants’ correct development and growth. Besides, the amiR23.5/23.6/26.5 plants produced chlorotic and reticulated leaves (Figure 4B) in all independent lines analyzed. Therefore, we determined the photosynthetic pigments in the leaf of these plants (Figure 4B). Among the quantified pigments, the levels of chlorophyll a showed a significant reduction in all amiRT lines (Figure 4B). Chlorophyll b and xanthophylls plus carotenoid contents, however, exhibited statistically significantly lower levels only in one line each (amiRT-3 and amiRT-1, respectively).
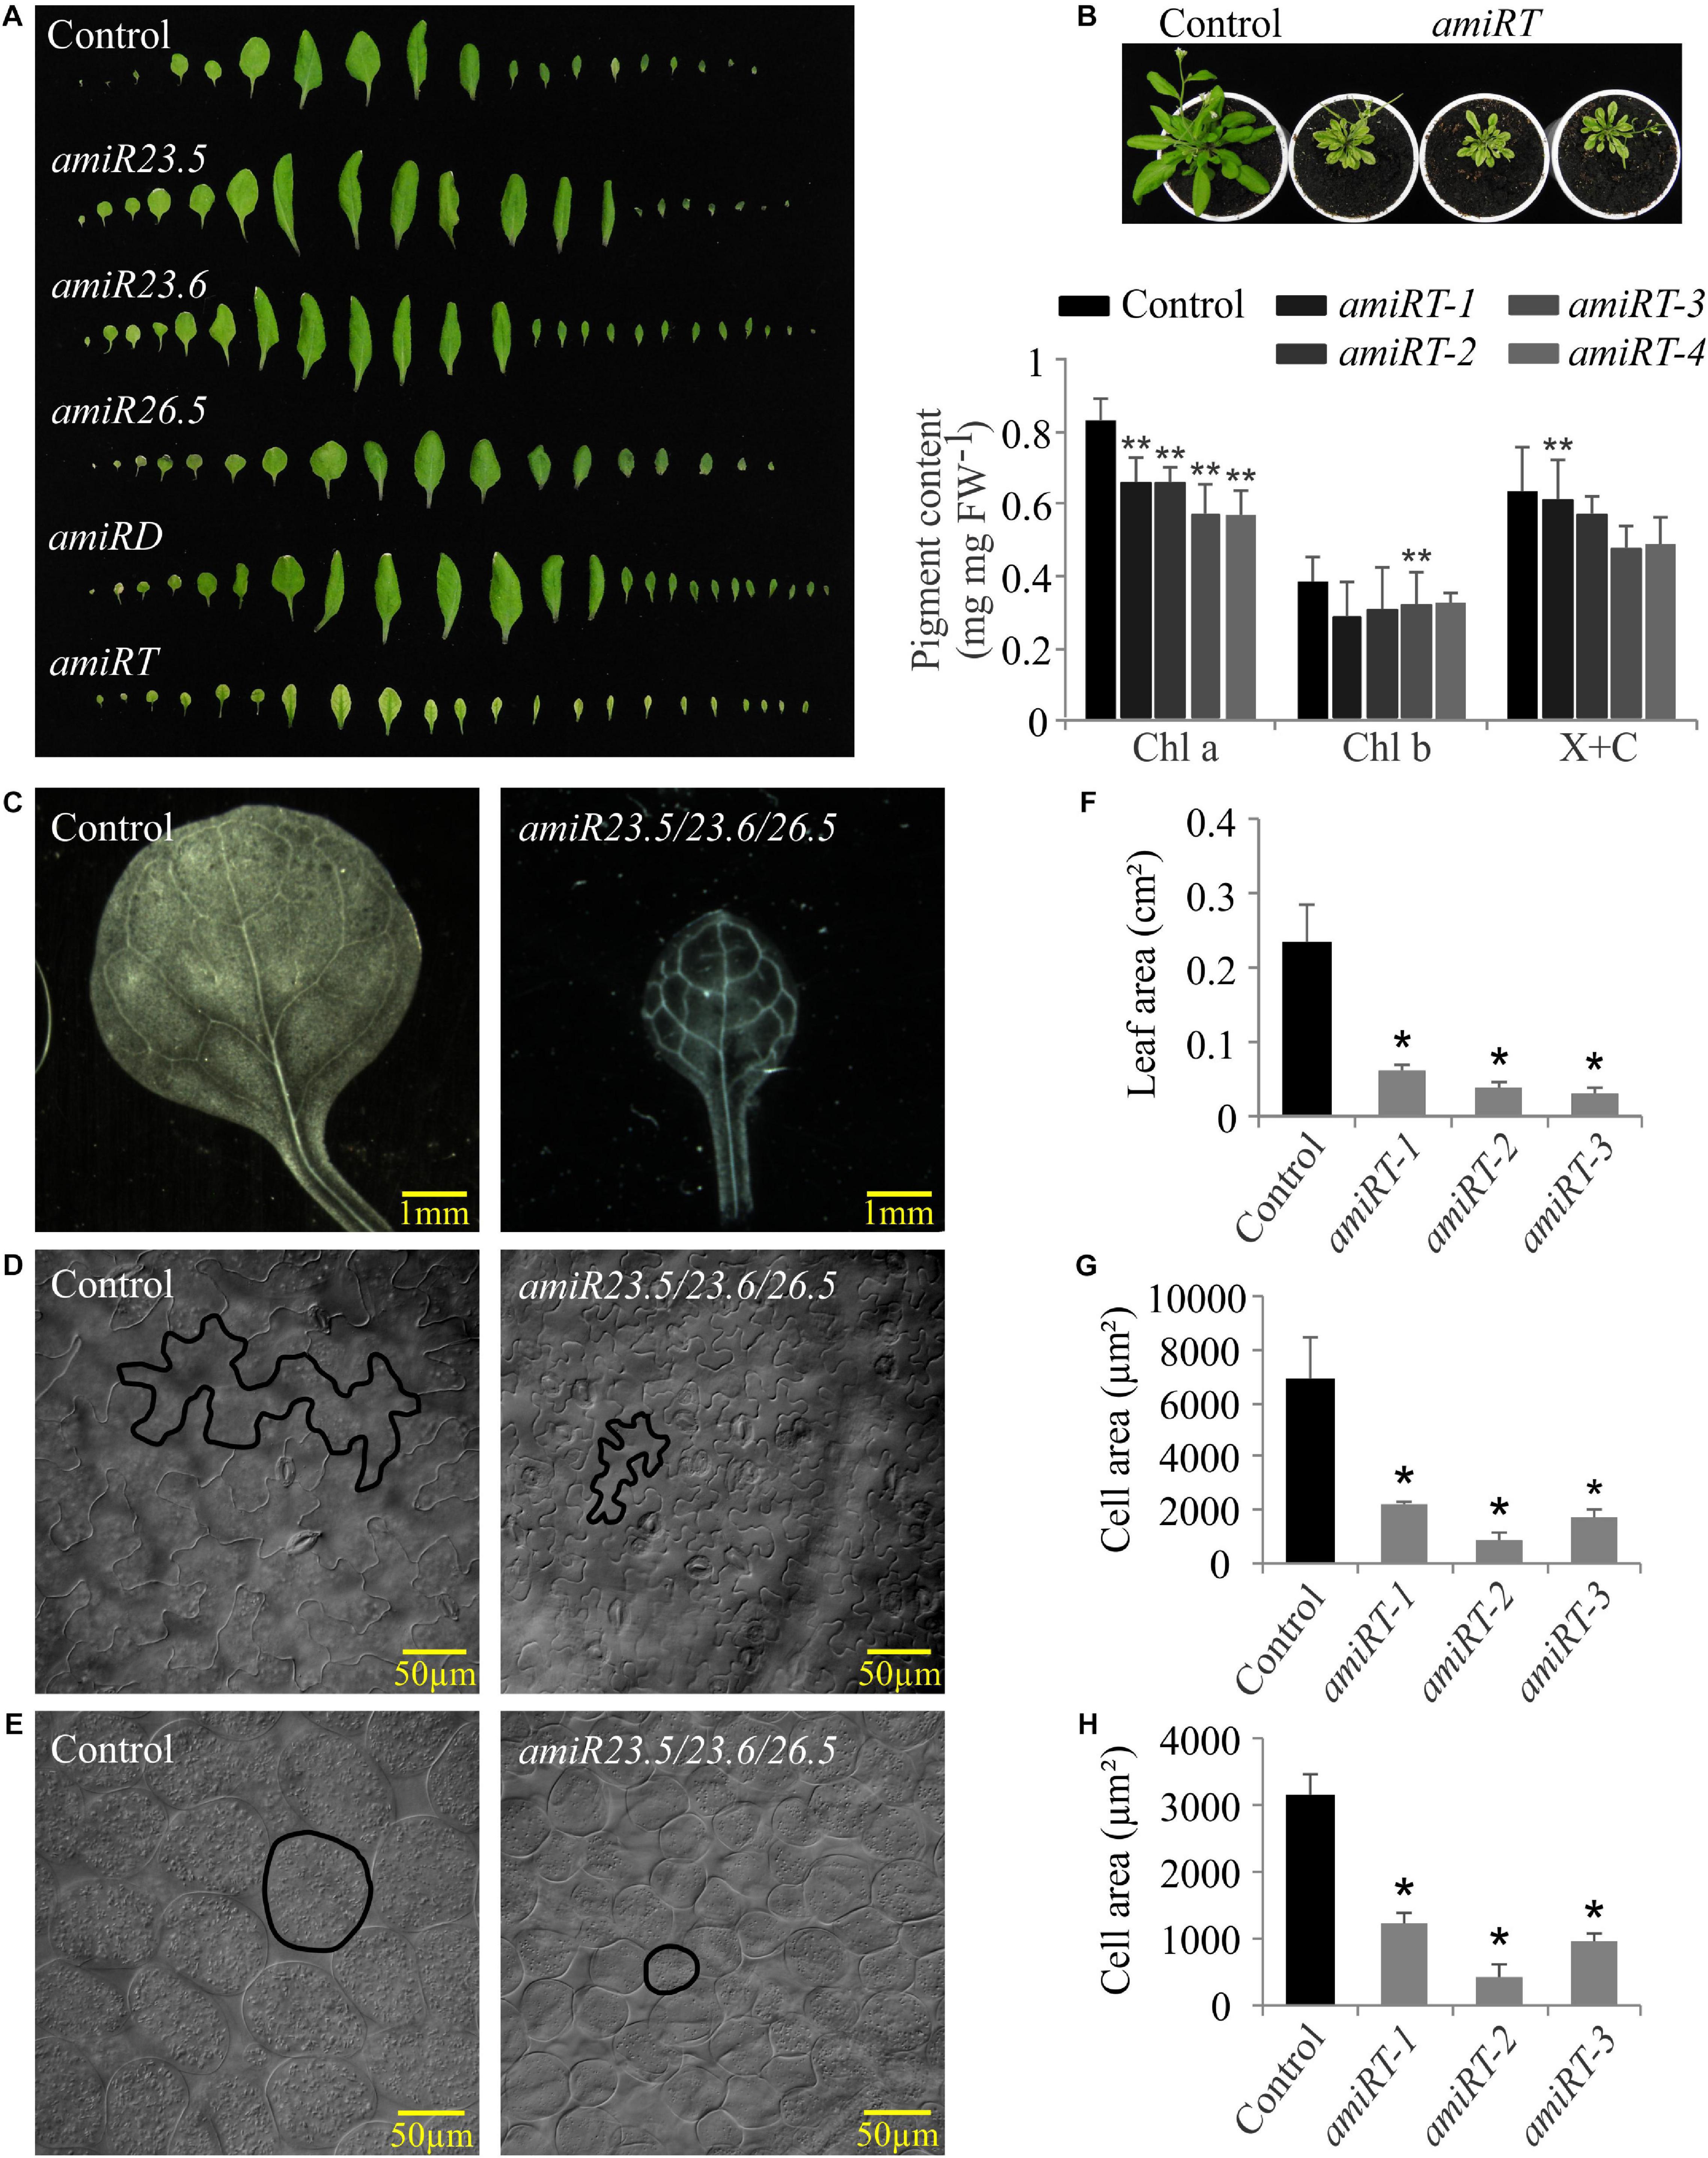
Figure 4. Leaf phenotypes of amiR plants. (A) Leaf series of the amiR knock-down lines. Series were created by dissecting 28-day-old rosettes and arranging the individual leaves. Four independent transgenic lines of amiR constructs and control plants were dissected; one representative line is shown. (B) Picture showing the chlorotic and dwarf phenotype and pigment content of amiRT compared to control lines. Chlorophyll a (Chl a), chlorophyll b (Chl b), and xanthophylls and carotenoids (X + C) were measured in four independent transgenic lines from 28-day-old plants. Each data point represents the mean value ± SD of eight biological replicates. For the leaf and cell area analyses, leaves from 21-day-old control and three independent lines of amiRT were incubated with lactic acid at room temperature until tissues were completely cleared and leaf epidermal and parenchymal cells were observed using differential interference contrast microscopy. Representative pictures and the measured areas of leaves (C,F), epidermal (D,G), and parenchymal (E,H) cells of the control and the triple amiR are shown. Data points represent mean areas of six leaves and a minimum of 650 epidermal and parenchymal cells per amiR or control lines. Asterisks indicate significance by two-sided t-test with *P < 0.01 and **P < 0.05.
In light of the small plant size observed in the amiRT lines, leaf cells from these amiRT and control lines were observed using differential interference contrast microscopy, and their areas were measured. Besides the reduced leaf areas (Figures 4C,F), epidermal (Figures 4D,G) and parenchymal (Figures 4E,H) cell areas were significantly smaller in the triple knock-down line. However, the estimated number of epidermal and parenchymal cells per leaf showed no significant differences between the amiRT and control plants (data not shown), suggesting that the leaves’ phenotype might be due to the smaller cell size but not to a less number of them.
amiR Lines Showed Reduced Photosynthetic Efficiency
To monitor the photosynthetic performance of the plants, we used a PAM fluorometer. Plants (21-day-old control and amiR lines) were previously dark adapted, and then illuminated and saturating pulses of illumination were applied every 5 s to measure the photosynthetic parameters. After 25 s of illumination, amiR lines showed clear alteration of all photosynthetic parameters. Maximal efficiency of PSII (Fv/Fm) was significantly lower in all amiR lines compared to control plants (Figure 5A), showing that amiRT has the lowest value. Two parameters related to the PSII efficiency, the quantum yield of PSII (ΦPSII) and the proportion of photochemically active PSII reaction centers (qL), were also evaluated after illumination. After 40 s, ΦPSII and qL values decreased in amiR lines compared to control plants, and amiRT exhibited significantly lower ΦPSII and qL levels during the complete induction measurement (Figures 5B,C). These results indicate a less efficient PSII in amiR lines with the exception of amiR23.6, which showed control like ΦPSII and qL values. Related to this, the electron transport rate, ETR(II), significantly decreased in amiR23.5, amiR26.5, amiRD, and amiRT (Figure 5E). It is worth mentioning that lower PSII efficiency and ETR in amiR lines could lead to alterations in the CO2 assimilation of the amiR plants. Another estimated parameter was the non-photochemical quenching (NPQ), the apparent rate constant for heat loss from PSII. NPQ significantly decreased in amiR23.5 and increased in amiR26.5 compared to control plants (Figure 5D). NPQ was higher in amiRT at the beginning of illumination but then reached control levels (Figure 5D). Although no significant differences were found in amiR23.6 and amiRD, NPQ exhibited a clear reduction in both lines, suggesting lower efficiency in the non-photochemical energy dissipation. In addition, other NPQ-related parameters, the light-induced NPQ (ΦNPQ), and the basal dissipative pathways (ΦNO) were estimated during light induction (Figures 5F,G). amiR26.5 and amiRT showed significantly higher ΦNPQ, while in amiR23.5, ΦNPQ decreased and ΦNO increased compared to control values. In amiR23.6 and amiRD, the values of these two parameters were similar to control plants (Figures 5F,G).
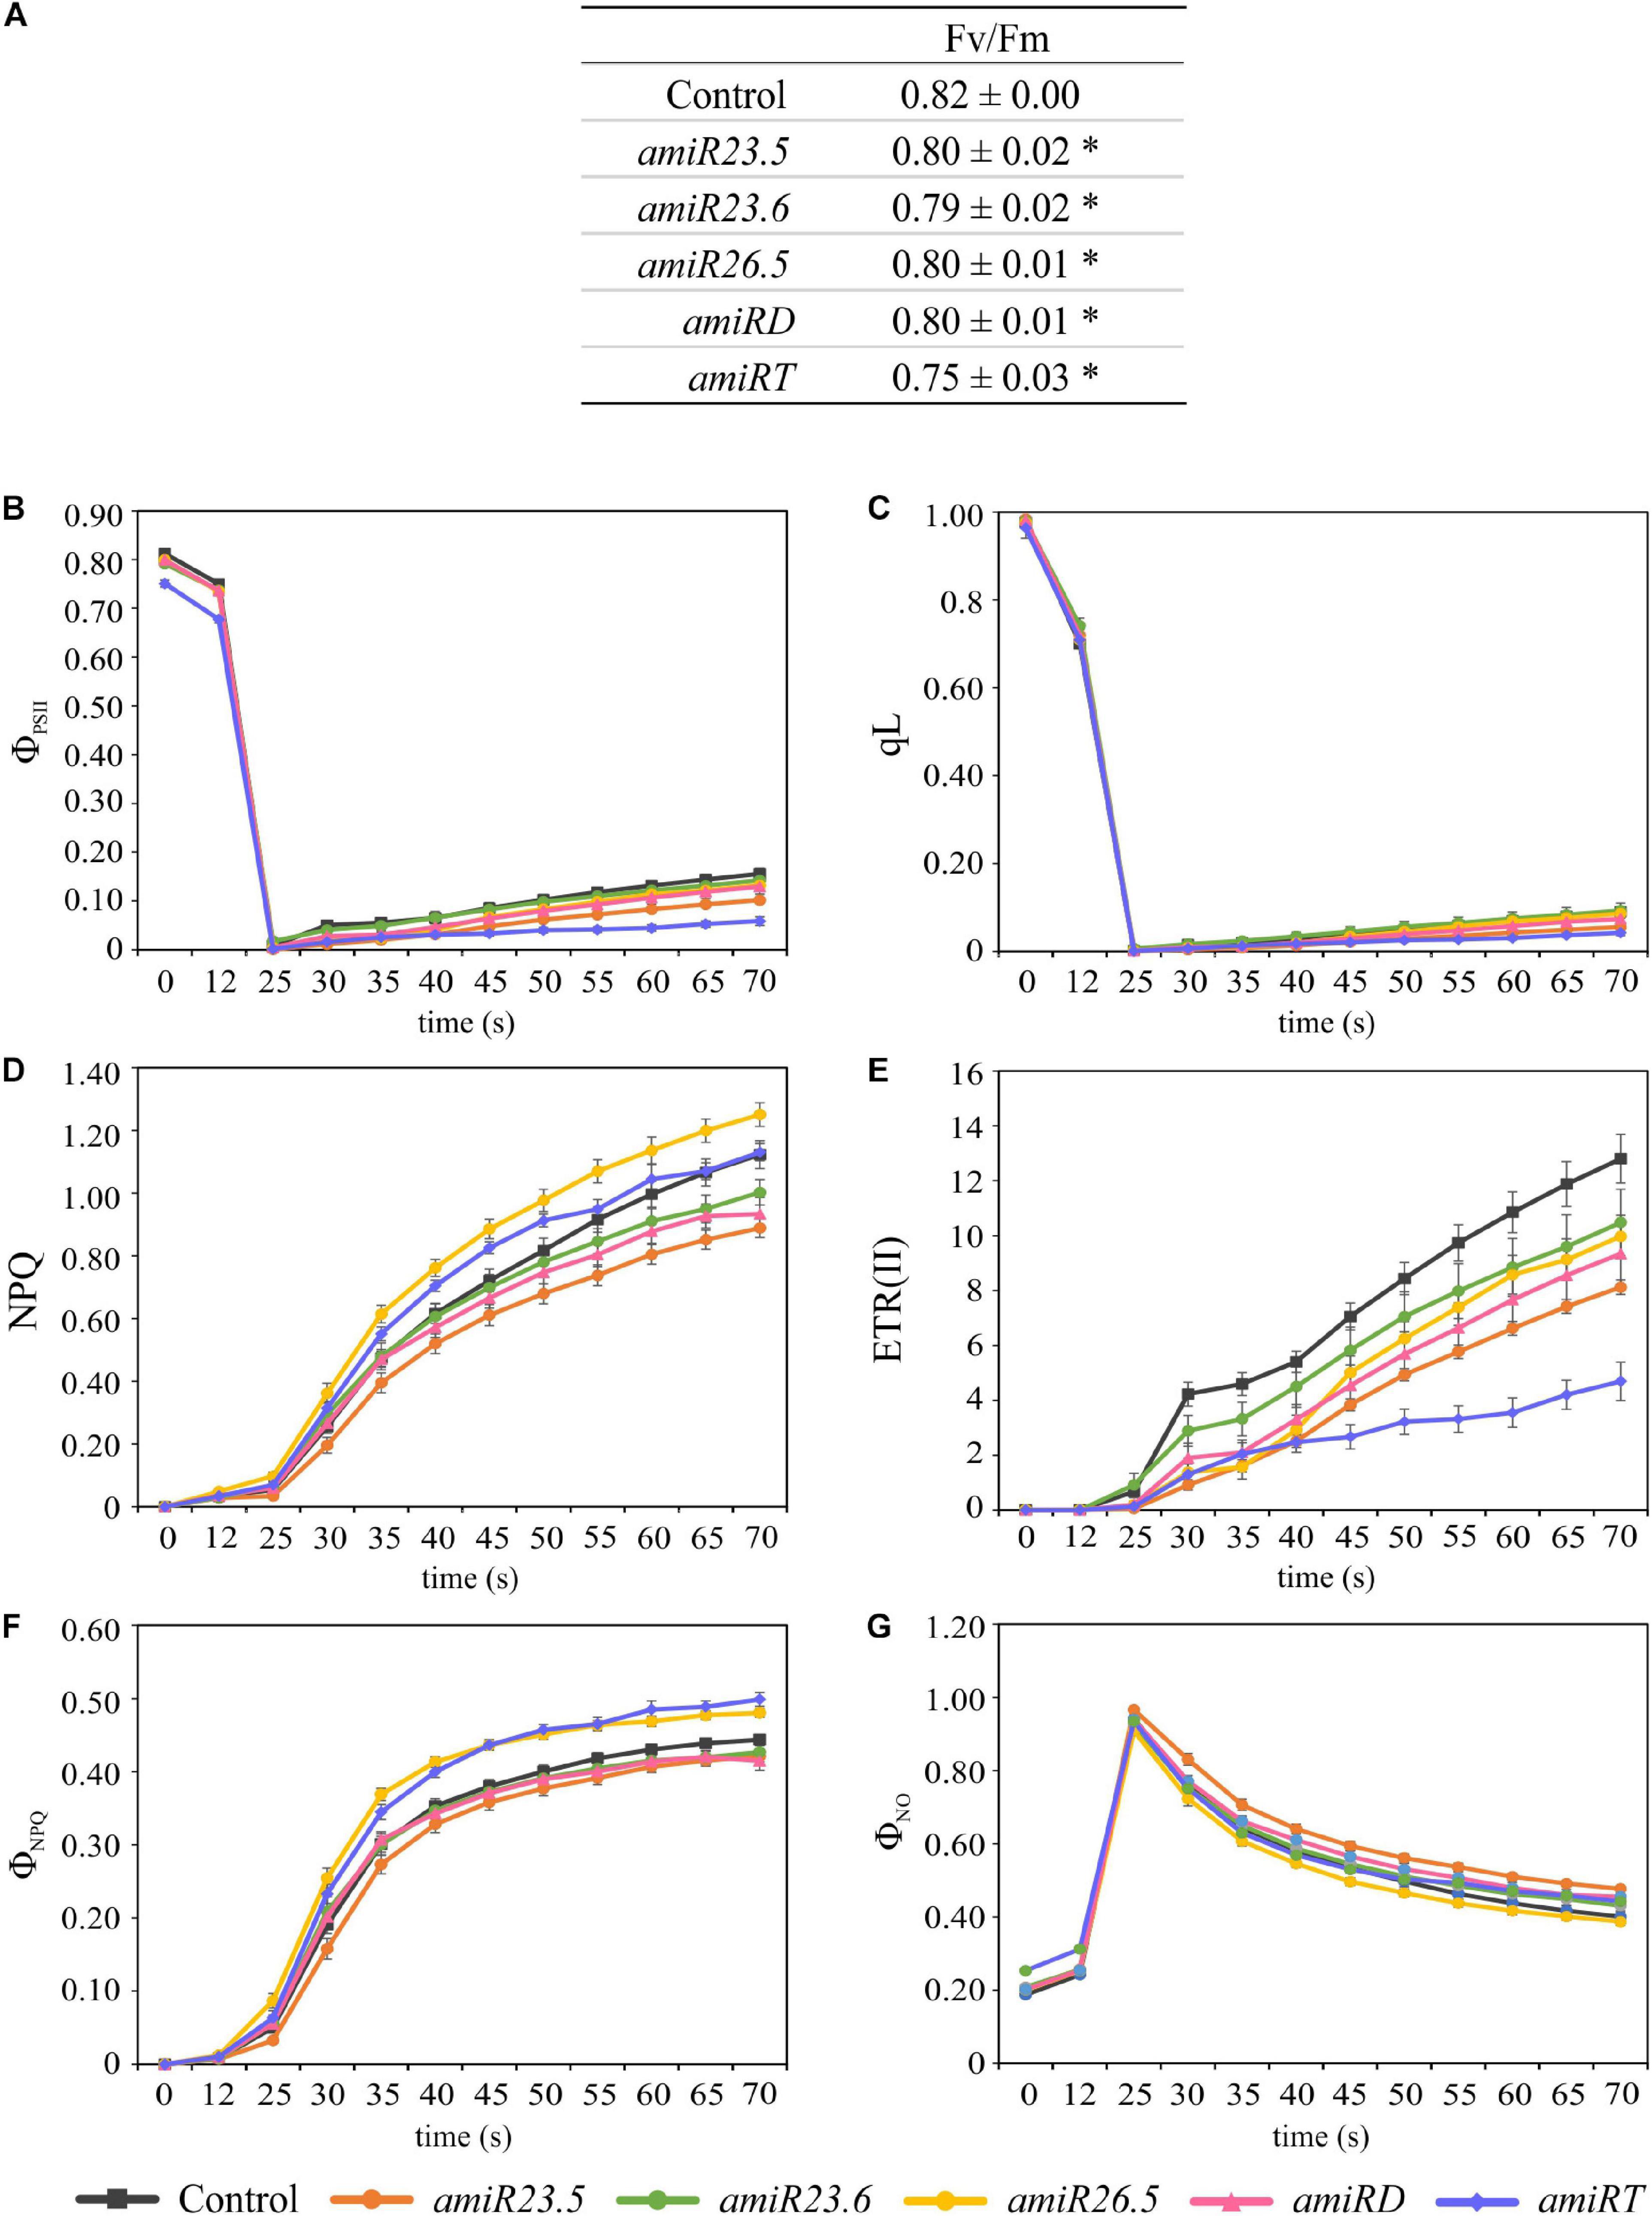
Figure 5. Photosynthetic response in control and amiR lines. Plants were grown for 21 days, dark adapted for 2 h and used for PAM fluorometric measurements. The Fv/Fm (A), ΦPSII (B), qL (C), NPQ (D), ETR(II) (E), ΦNPQ (F), and ΦNO (G) parameters were evaluated during 70 s. An induction protocol with actinic light of 166 μmol photons m–2 s–1 and saturating pulses every 5 s was applied to individual leaves. The data show variations of the different photosynthetic parameters over time after the first 25 s up to 70 s. In each construct, four independent transgenic lines and a minimum of three replicates per line were measured. Twelve control plants were also evaluated. The data were combined in each amiR line and used in paired comparisons with the control data. The experiment was repeated twice, data shown correspond to one representative experiment. The data represent the mean value ± SE of a minimum of 12 biological replicates in every line. Asterisks in panel (A) indicate significance by two-sided t-test with *P < 0.01.
M-sHSPs Impact on the Reproductive Growth
All amiR plants showed no evident differences in the aspect of flowers and siliques compared to control plants. Nevertheless, the seed area was significantly reduced in the single amiR23.6 and in the amiRD and amiRT lines (Supplementary Figure 4A), indicating that the presence of M-sHSP23.6 is necessary for the seed to acquire the proper size. The seed yield was similar to control in all amiR lines, except for the amiRT, where it was significantly reduced (Supplementary Figure 4B). Seed germination was also affected in the amiRT; it was highly reduced (more than 90%) in comparison with control seeds (Supplementary Figure 4C). In the amiRD and single amiR23.5 and amiR23.6 lines, seed germination was significantly reduced (ca. 20%), while in amiR26.5, it was not affected.
Almost All amiR Plants Accumulated ROS, and the Cell Membrane Permeability Increased
The level of ROS was examined in adult plants by standard histochemical detection. Accumulation of H2O2 was found in leaves of amiR23.5 and amiR23.6, and in the double amiR23.5/23.6 plants, which can be visualized as dark brown color by staining with DAB (Supplementary Figure 5A). On the other side, a reduced DAB staining was observed in the leaves of amiR26.5 and amiRT plants, indicating less H2O2 than in the control leaves. The level of O2.– in the leaves was detected by using NBT (Supplementary Figure 5B). Results show that amiRT lines seem to actively accumulate O2⋅–, leading to a deep blue coloration, while amiR26.5 has reduced O2.– levels (Supplementary Figure 5B). To visualize cell death in amiR lines, trypan blue staining was performed (Supplementary Figure 5C). While in all single and double knock-down lines, trypan blue staining did not show an accumulation, deep blue staining was detected in the amiRT leaves, considerably higher than in control leaves (Supplementary Figure 5C). These data suggest that the lower number of functioning cells in amiRT lines is related to the lower H2O2 level in amiRT leaves. Overall, these data indicate higher levels of O2.– and a greater degree of cell death in the amiRT leaves, while amiR26.5 leaves showed lower accumulation of ROS, H2O2, and O2.–.
High levels of ROS can be extremely harmful to cells by causing lipid peroxidation in cellular membranes, protein and carbohydrate oxidation, DNA damage, and cell death (Gill and Tuteja, 2010). The ion permeability of cell membranes, which is considered an indicator of cell damage induced by ROS, significantly increased in all amiR lines, showing higher electrolyte leakage than control plants (Supplementary Figure 6), indicating the loss of cell membrane stability and integrity. Nevertheless, the amiR26.5 plants showed higher electrolyte leakage, which was not related to their leaves’ ROS levels (Supplementary Figure 5).
Downregulation of M-sHSPs Produced Dramatic Changes in the Proteome
Protein extractions from amiR and empty vector control plants were performed in 15-day-old seedlings, the single vegetative stage where no phenotypic differences were observed (Figure 3A). Comparable protein yields were obtained in control and amiR samples, as revealed by the protein quantitation and SDS polyacrylamide gel of the samples indicating that the M-sHSPs downregulation did not affect the total protein content. Samples were further analyzed by comparative quantitative shotgun MS/MS. A total of 2414 protein groups with at least two unique peptides were identified in the complete dataset (Supplementary Tables 2, 3). The processed LFQ data were filtered to have three valid values in at least one sample group, and the resulting 1290 protein matrix was used to perform a hierarchical clustering (Supplementary Table 4). In total, 30 clusters were defined and presented as a heat map in Figure 6A. A visible and profound alteration in the overall proteome is observed in all amiR lines. Specific groups of proteins accumulated in the single amiR plants, such as in Cluster 1 (in amiR23.5), Clusters 4 and 18 (in amiR23.6), and Clusters 6, 29, and 30 (in amiR26.5). Cluster 28 and Cluster 5 grouped proteins abundant in amiRD and in amiRT, respectively. Specific clusters with a lower abundance of proteins compared to control are observed in the amiR26.5 (Clusters 3–5), amiRD (Clusters 12 and 17), and amiRT (Cluster 7).
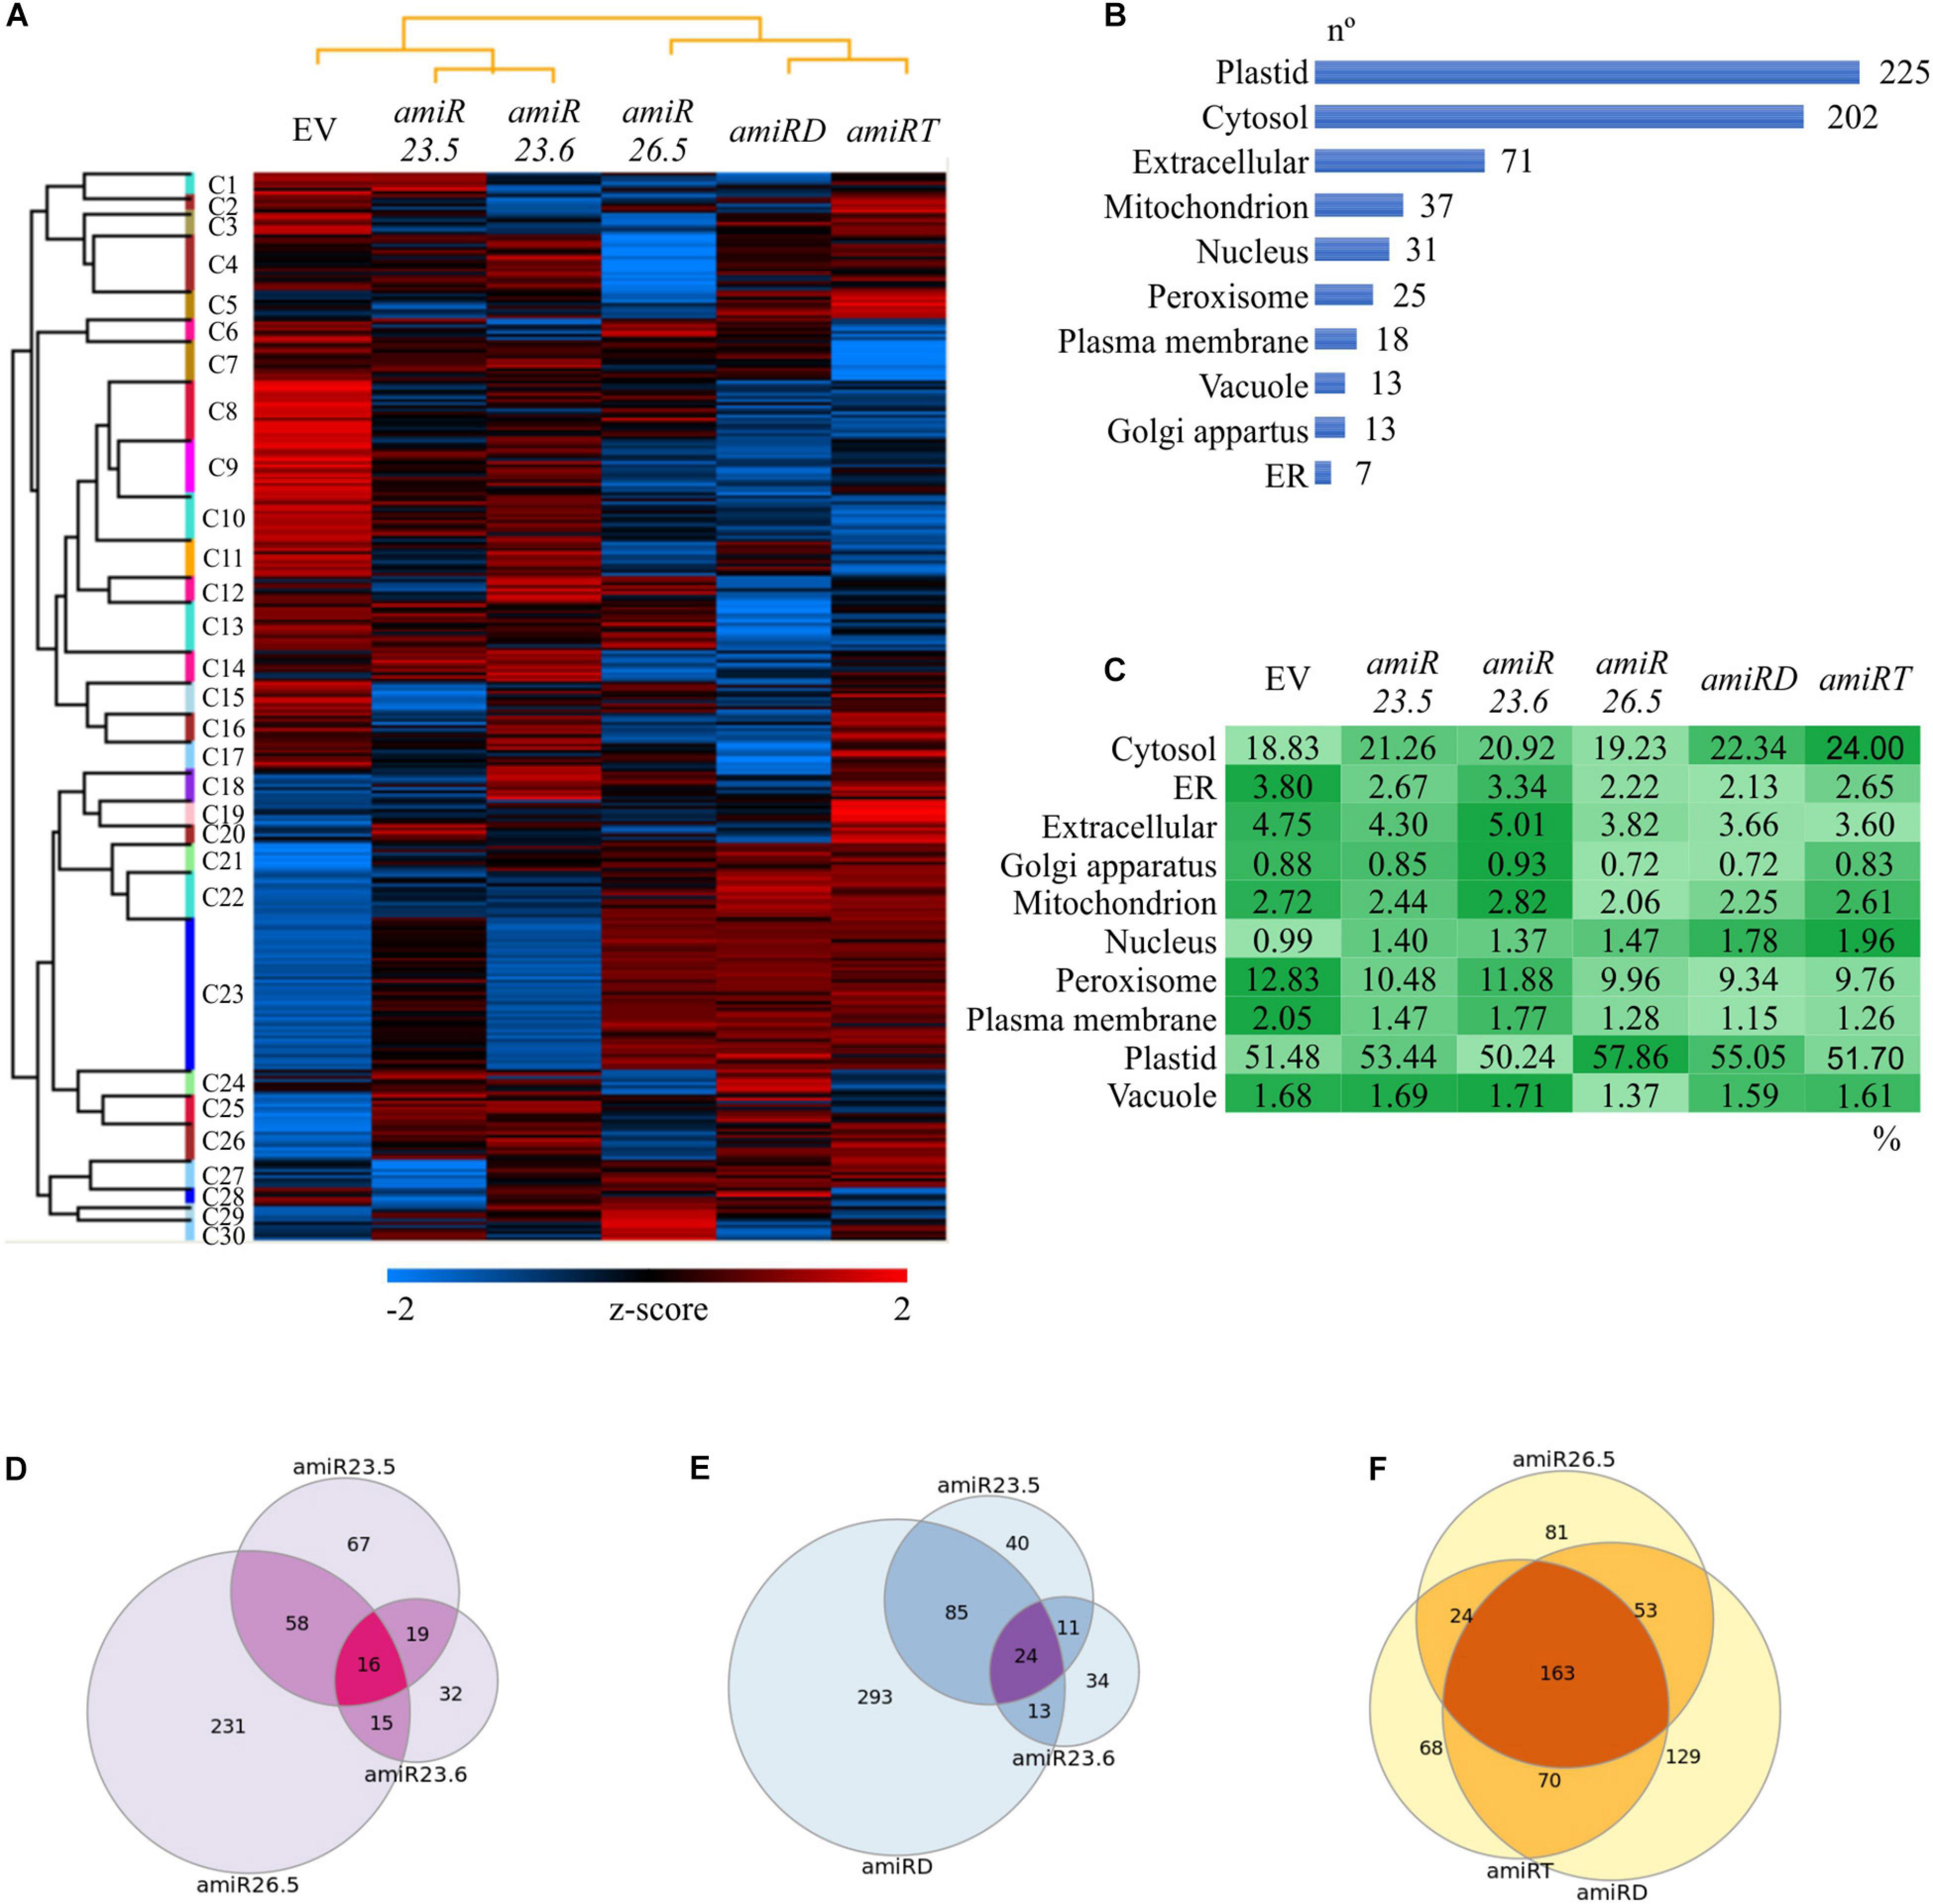
Figure 6. Proteome alterations in the amiR plants. (A) Hierarchical clustering of amiR and control (EV) proteomes. An average linkage clustering of proteins was performed using a Euclidian distance method for the z score normalized abundances (Supplementary Table 4). The data were filtered to have three valid values in at least one sample group. A raw tree for proteins and a column tree for samples were performed. Colors indicate intensities from the lowest (blue) to the highest (red). (B,C) Subcellular localization of differentially expressed proteins in the amiR lines. The list of statistically changed proteins in at least one amiR line (Supplementary Table 5) was analyzed by SUBA 4 (Hooper et al., 2017) and classified in 10 main subcellular categories; the number of proteins in each of them is shown (B). (C) The protein abundance in each subcellular localization was calculated (Supplementary Table 11) and shown as a comparative color gradient, from the highest (darker green) to the lowest (lightest green). (D–F) Venn diagrams showing common and unique altered proteins in the knock-down lines. The differentially expressed proteins in different amiR lines (Supplementary Tables 6–10) were imported into the Venndiagram.net website, and the intersections between proteomes were graphed. The common and exclusive proteins found in the three single amiR (D); amiR23.5, amiR23.6, and amiRD (E); and amiR26.5, amiRD, and amiRT (F) are shown. All proteins are listed in Supplementary Tables 12–14.
To identify changes in specific proteins, amiR samples were individually compared to the control proteome, and the proteins with statistically significant alterations in at least one amiR line (642) were filtered (Supplementary Table 5). The individual proteins changed in each amiR line are listed in Supplementary Tables 6–10. The lower number of proteins identified in the amiR23.6 proteome is related to detection issues. The 642 proteins were investigated for the subcellular localization by SUBA 4 (Hooper et al., 2017), classified in 10 categories (Figure 6B), and the relative protein abundance (percentage of the total LFQ of the 642 proteins) was calculated (Figure 6C and Supplementary Table 11). Interestingly, the highest number of changing proteins (225) are localized in the plastid, which are especially abundant in amiR26.5 (57.86%), followed by the cytosolic proteins (202), more abundant in amiRT (24%). The amiR23.6 and control plants exhibited the most similar protein abundances in each localization. The relative protein abundances of cytosol, nucleus, and plastid of the other amiR lines are higher than control lines, while compartments such as endoplasmic reticulum, extracellular, mitochondrion, and peroxisome showed lower abundances of proteins compared to the control proteome (Figure 6C). These ubiquitous changes indicate that mitochondria are not the only affected organelle when M-sHSPs are downregulated.
The lists of significantly changed proteins (Supplementary Tables 6–10) were further compared to found common and unique proteins in the knock-down lines. The single amiR lines have 16 proteins in common with members from almost all cell compartments (Figure 6D and Supplementary Table 12), but with a high number of unique proteins. The amiR26.5 proteome was notably different from those in the other single amiR lines with 231 unique proteins. Since amiR23.5 and amiR23.6 exhibited similar phenotypic alterations, which are also observed in the amiRD, their proteomes were compared. These three lines shared 24 proteins (Figure 6E and Supplementary Table 13), whereas 293 unique proteins differentiate the amiRD proteome from the single amiR. These data suggest that new cell alterations may occur when both sHSPs are simultaneously downregulated in amiRD. Finally, the triple amiRT, the double amiRD, and the amiR26.5 proteomes were analyzed (Figure 6F and Supplementary Table 14). The amiRT proteome showed most of its proteins in common with amiRD and amiR26.5 proteomes, and only 68 unique proteins, despite the distinct phenotype of the amiRT plants.
To analyze the functional enrichments of the 642 differentially expressed proteins along the amiR lines (Supplementary Table 5), we applied a GO term analysis (Figure 7). The results revealed several enriched GO terms (Supplementary Table 15); the relative protein abundances (rLFQ) of selected GO terms were calculated and analyzed (Supplementary Table 16). Again, similar patterns in the protein abundances are found for the amiR26.5, amiRD, and amiRT (Figures 6A, 7). The protein abundance of amiR23.6 showed the highest similarity to the control proteome. The abundances of proteins participating in cellular amide, protein binding, translation, protein degradation (proteasome complex), and metabolic processes are higher in the amiR than in control lines. Another point to highlight is the higher abundance of proteins involved in photorespiration found in the proteomes of amiR compared to control lines. In contrast, proteins related to sHSP functions such as response to stimulus and stress, including high temperature, and unfolding protein binding, are reduced in the amiR lines (Figure 7). The abundances of proteins from the mitochondrial matrix decreased in all amiR. Similarly, lower rLFQs were observed in stromule, plastid extensions probably involved in signaling and trafficking between plastids and other structures (Waters et al., 2004), whereas the abundance of proteins from the cell membrane and cell wall increased.
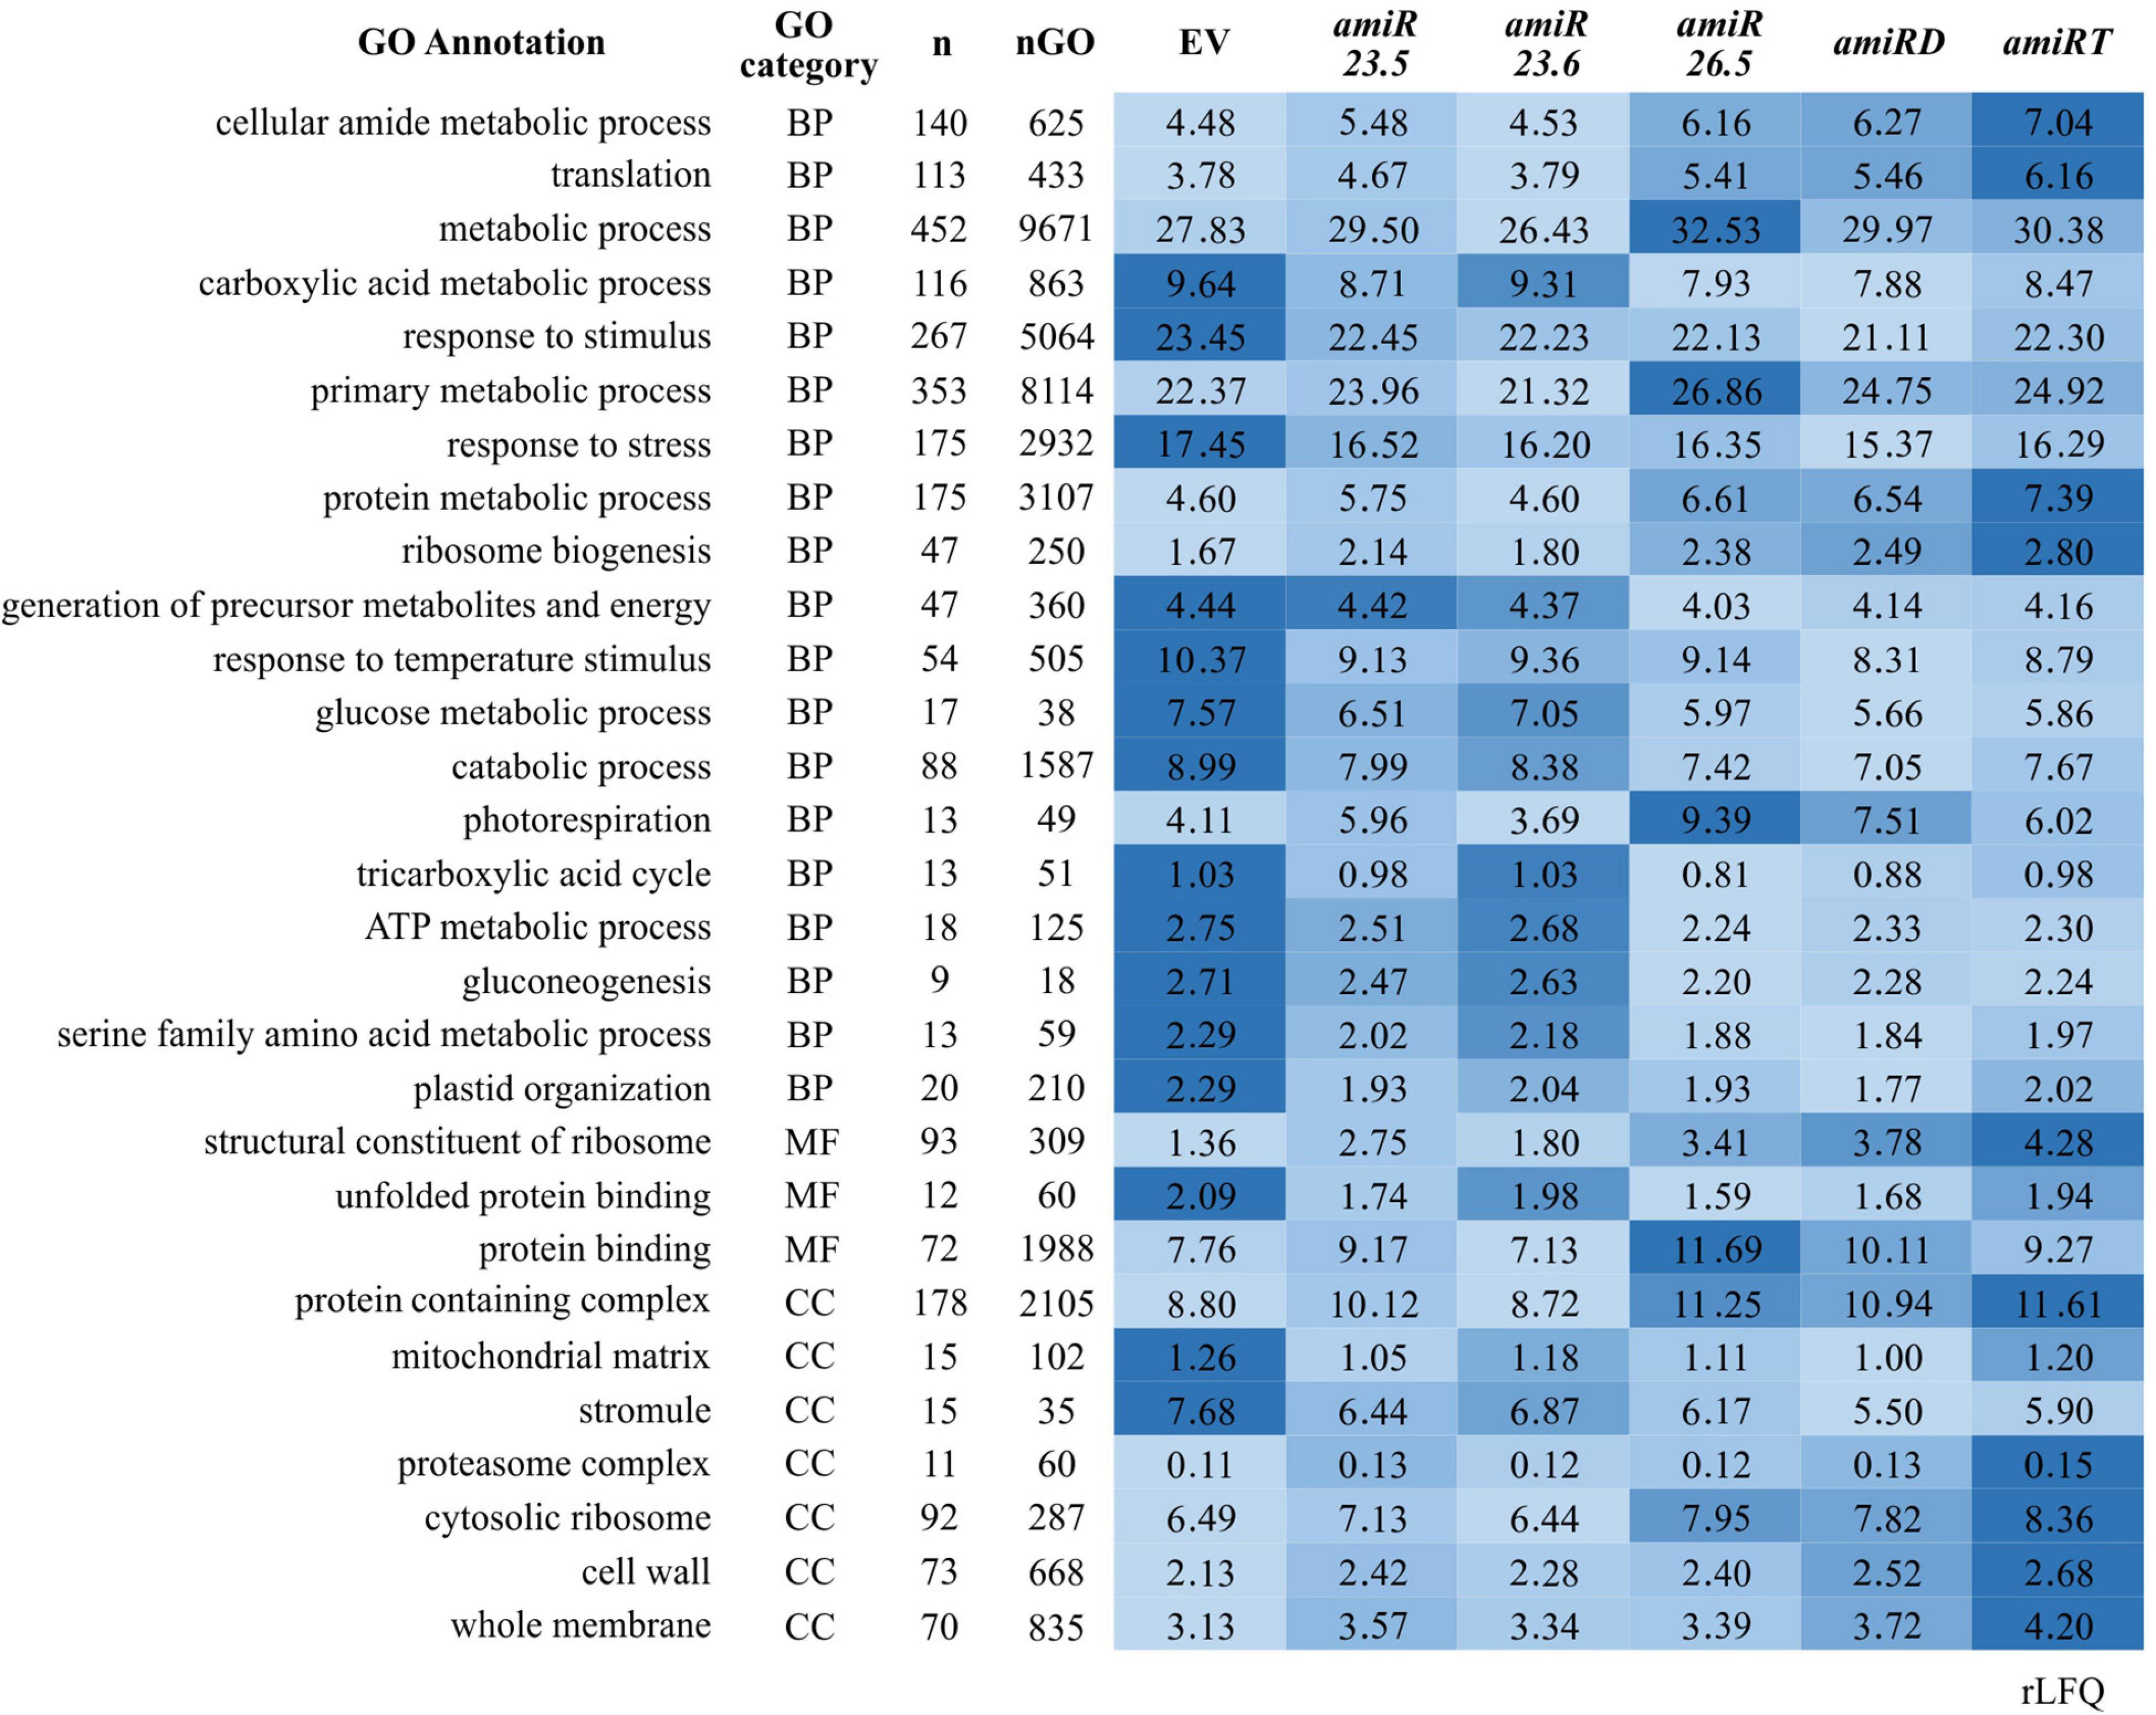
Figure 7. Comparative color gradient showing changes in the intensity of proteins involved in specific functions. Proteins that show statistical change relative to control (EV) plants in at least one amiR line (Supplementary Table 5) were analyzed by STRING (Szklarczyk et al., 2019) for the Gene Ontology (GO) classification. Selected GO terms in the biological process (BP), molecular function (MF), and cellular component (CC) categories are shown. n and nGO is the number of proteins found in the dataset and the total number of proteins in one GO, respectively. The relative abundance (rLFQ) of all proteins allocated to one GO was summed in each amiR. A color gradient from the highest rLFQ (darker blue) to the lowest (lightest blue) was used. Values correspond to the average of the total rLFQ for one GO in the three biological replicates.
amiR Plants Exhibited Alteration of Several Photosynthesis-Related Proteins
Due to the chlorotic phenotype of amiRT plants (Figure 4B) and the reduced photosynthetic efficiency of amiR plants (Figure 5A), the proteomes of these plants and single and double knock-down transgenic lines were analyzed for photosynthesis-related proteins (Table 1). The proteomes of amiR23.5, amiR26.5, amiRD, and amiRT showed enrichment of the GO photosynthesis (GO:0015979), but not the amiR23.6 (Supplementary Tables 17–21). These data are in line with the photosynthetic parameter measurements, where amiR23.6 line showed control like PSII efficiency (Figures 5B,C). Proteins involved in photosynthesis represent 7.49% and 9.31% of the total proteome in amiRT and amiRD, respectively (Supplementary Table 22). Proteins related to the stability of PSI and PSII, the efficiency of electron transfer, and oxygen evolution are highly accumulated in the amiR26.5, amiRD, and amiRT lines (Q9SA56, Q42029, Q9SHE8, Q9S714, and Q9XFT3) (Table 1). The Rubisco small subunit is also upregulated in the double and triple knock-down lines. The subunits A and B of the plastidial glyceraldehyde 3-phosphate dehydrogenase (Q9LPW0, P25857, and P25856) are significantly downregulated in the amiR lines compared to control plants as well as other two proteins involved in the carbon fixation (P25697 and O23404).
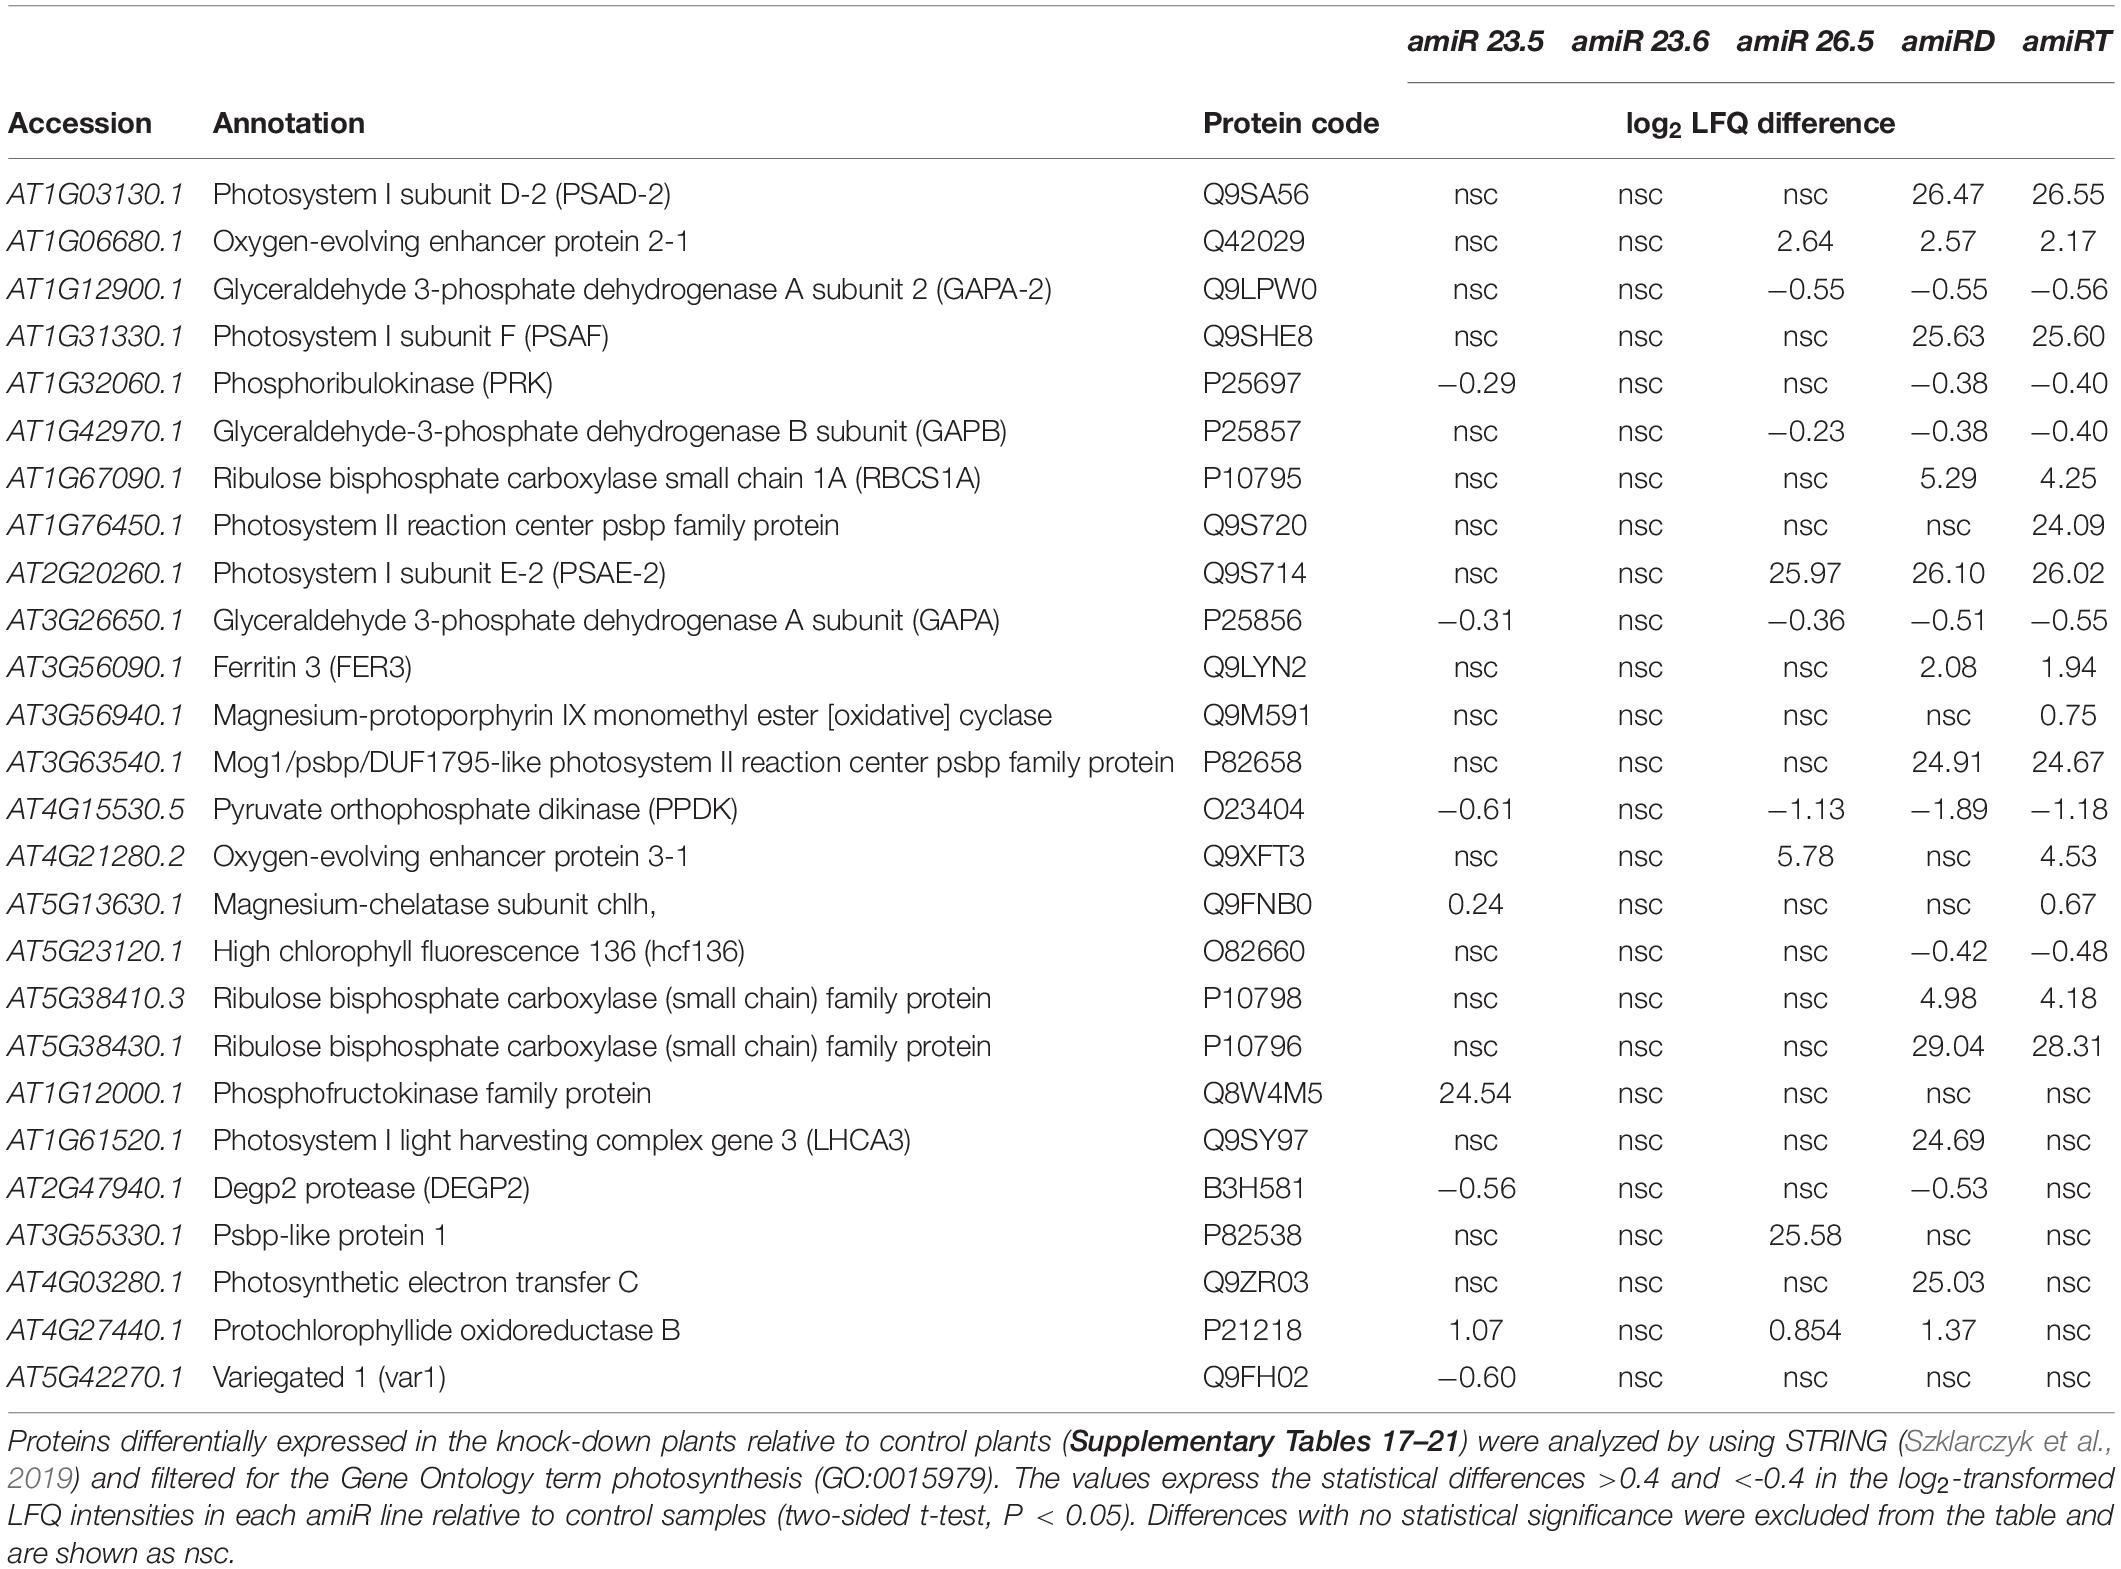
Table 1. Photosynthesis-related proteins in the amiR plants showing significant level change relative to control plants.
The amiR Plants Showed Significant Changes in Their ROS-Related Proteins
Several proteins with essential roles in ROS detoxification, including chloroplast thiol-specific peroxidases that catalyze the reduction of H2O2, were upregulated in the amiR26.5 plants (Table 2). The Fe-superoxide dismutase 1 (FSD1), which removes O2⋅–, also increases in amiR26.5 lines but not in others. Single knock-down amiR23.5 and amiR23.6 did not exhibit significant increases in these proteins, while catalase and the chloroplastic glutathione reductase (P42770) decreased in the amiR23.5 plants. Proteins related to oxidative stress were also upregulated in the proteome of amiRD plants such as the peroxiredoxins type 2, Q (PRXQ) and IIF, and the thioredoxin M type 4. In addition to the two downregulated proteins (catalase and glutathione reductase) in the amiR23.5, the amiRD showed a reduction of Fe-superoxide dismutase 2. The amiRT lines accumulate three chloroplastic peroxiredoxins (Q949U7, Q9LU86, and Q9C5R8) and a cytosolic glutathione transferase as in amiR26.5, whereas four secreted forms of peroxidases slightly decreased in these plants (Table 2). The statistically changed proteins in each amiR that are ROS-related (GO:0045454 and GO:0006979) represent, on average, 0.97%, 1.41%, 1.19%, and 1.34% of the total proteome of amiR23.5, amiR26.5, amiRD, and amiRT, respectively (Supplementary Table 23). None of these GO terms showed enrichment in the amiR23.6 (Supplementary Table 18). This increased antioxidant capacity in the single amiR26.5 and amiRT plants could alleviate, in part, the ROS accumulation (Supplementary Figure 5). Indeed, the histochemical ROS detection showed no accumulation of H2O2 and O2.– molecules in the amiR26.5 and H2O2 in the amiRT leaves.
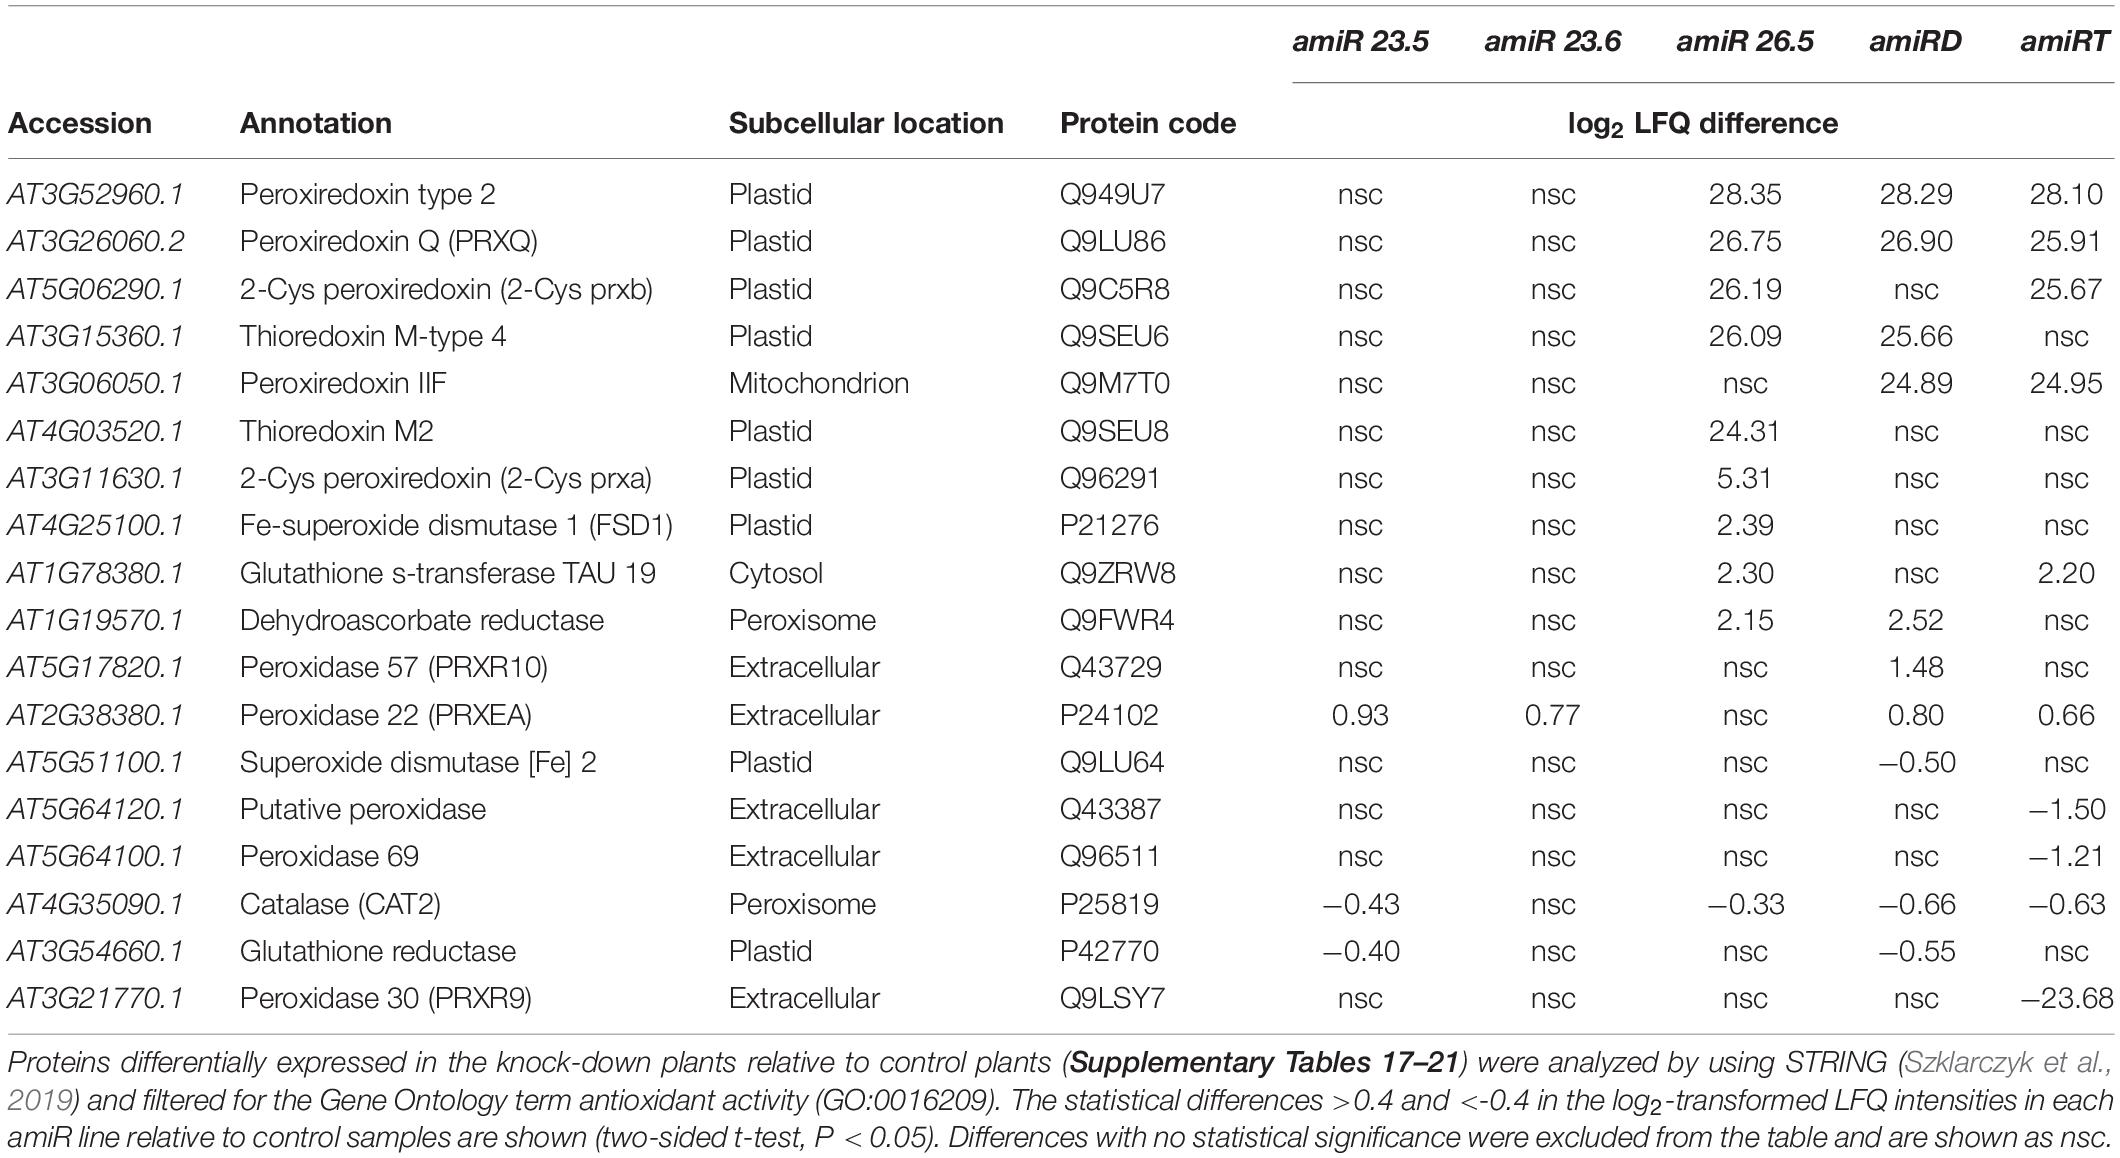
Table 2. Proteins with antioxidant activity in the amiR plants showing significant level change relative to control plants.
Silencing of M-sHSPs Leads to Profound Metabolic Alterations
The functional analysis of the changed proteins in the amiR plants (Supplementary Tables 6–10) showed the enrichment of various metabolic processes in the amiR26.5, amiRD, and amiRT (Supplementary Tables 19–21). These data were filtered to keep the first 20 most significant metabolism-GOs (Figure 8A). The highest overrepresentation was found in the double and triple knock-down lines in at least 16 GOs, indicating that a metabolic disruption may be more substantial in these lines (Figure 8A).
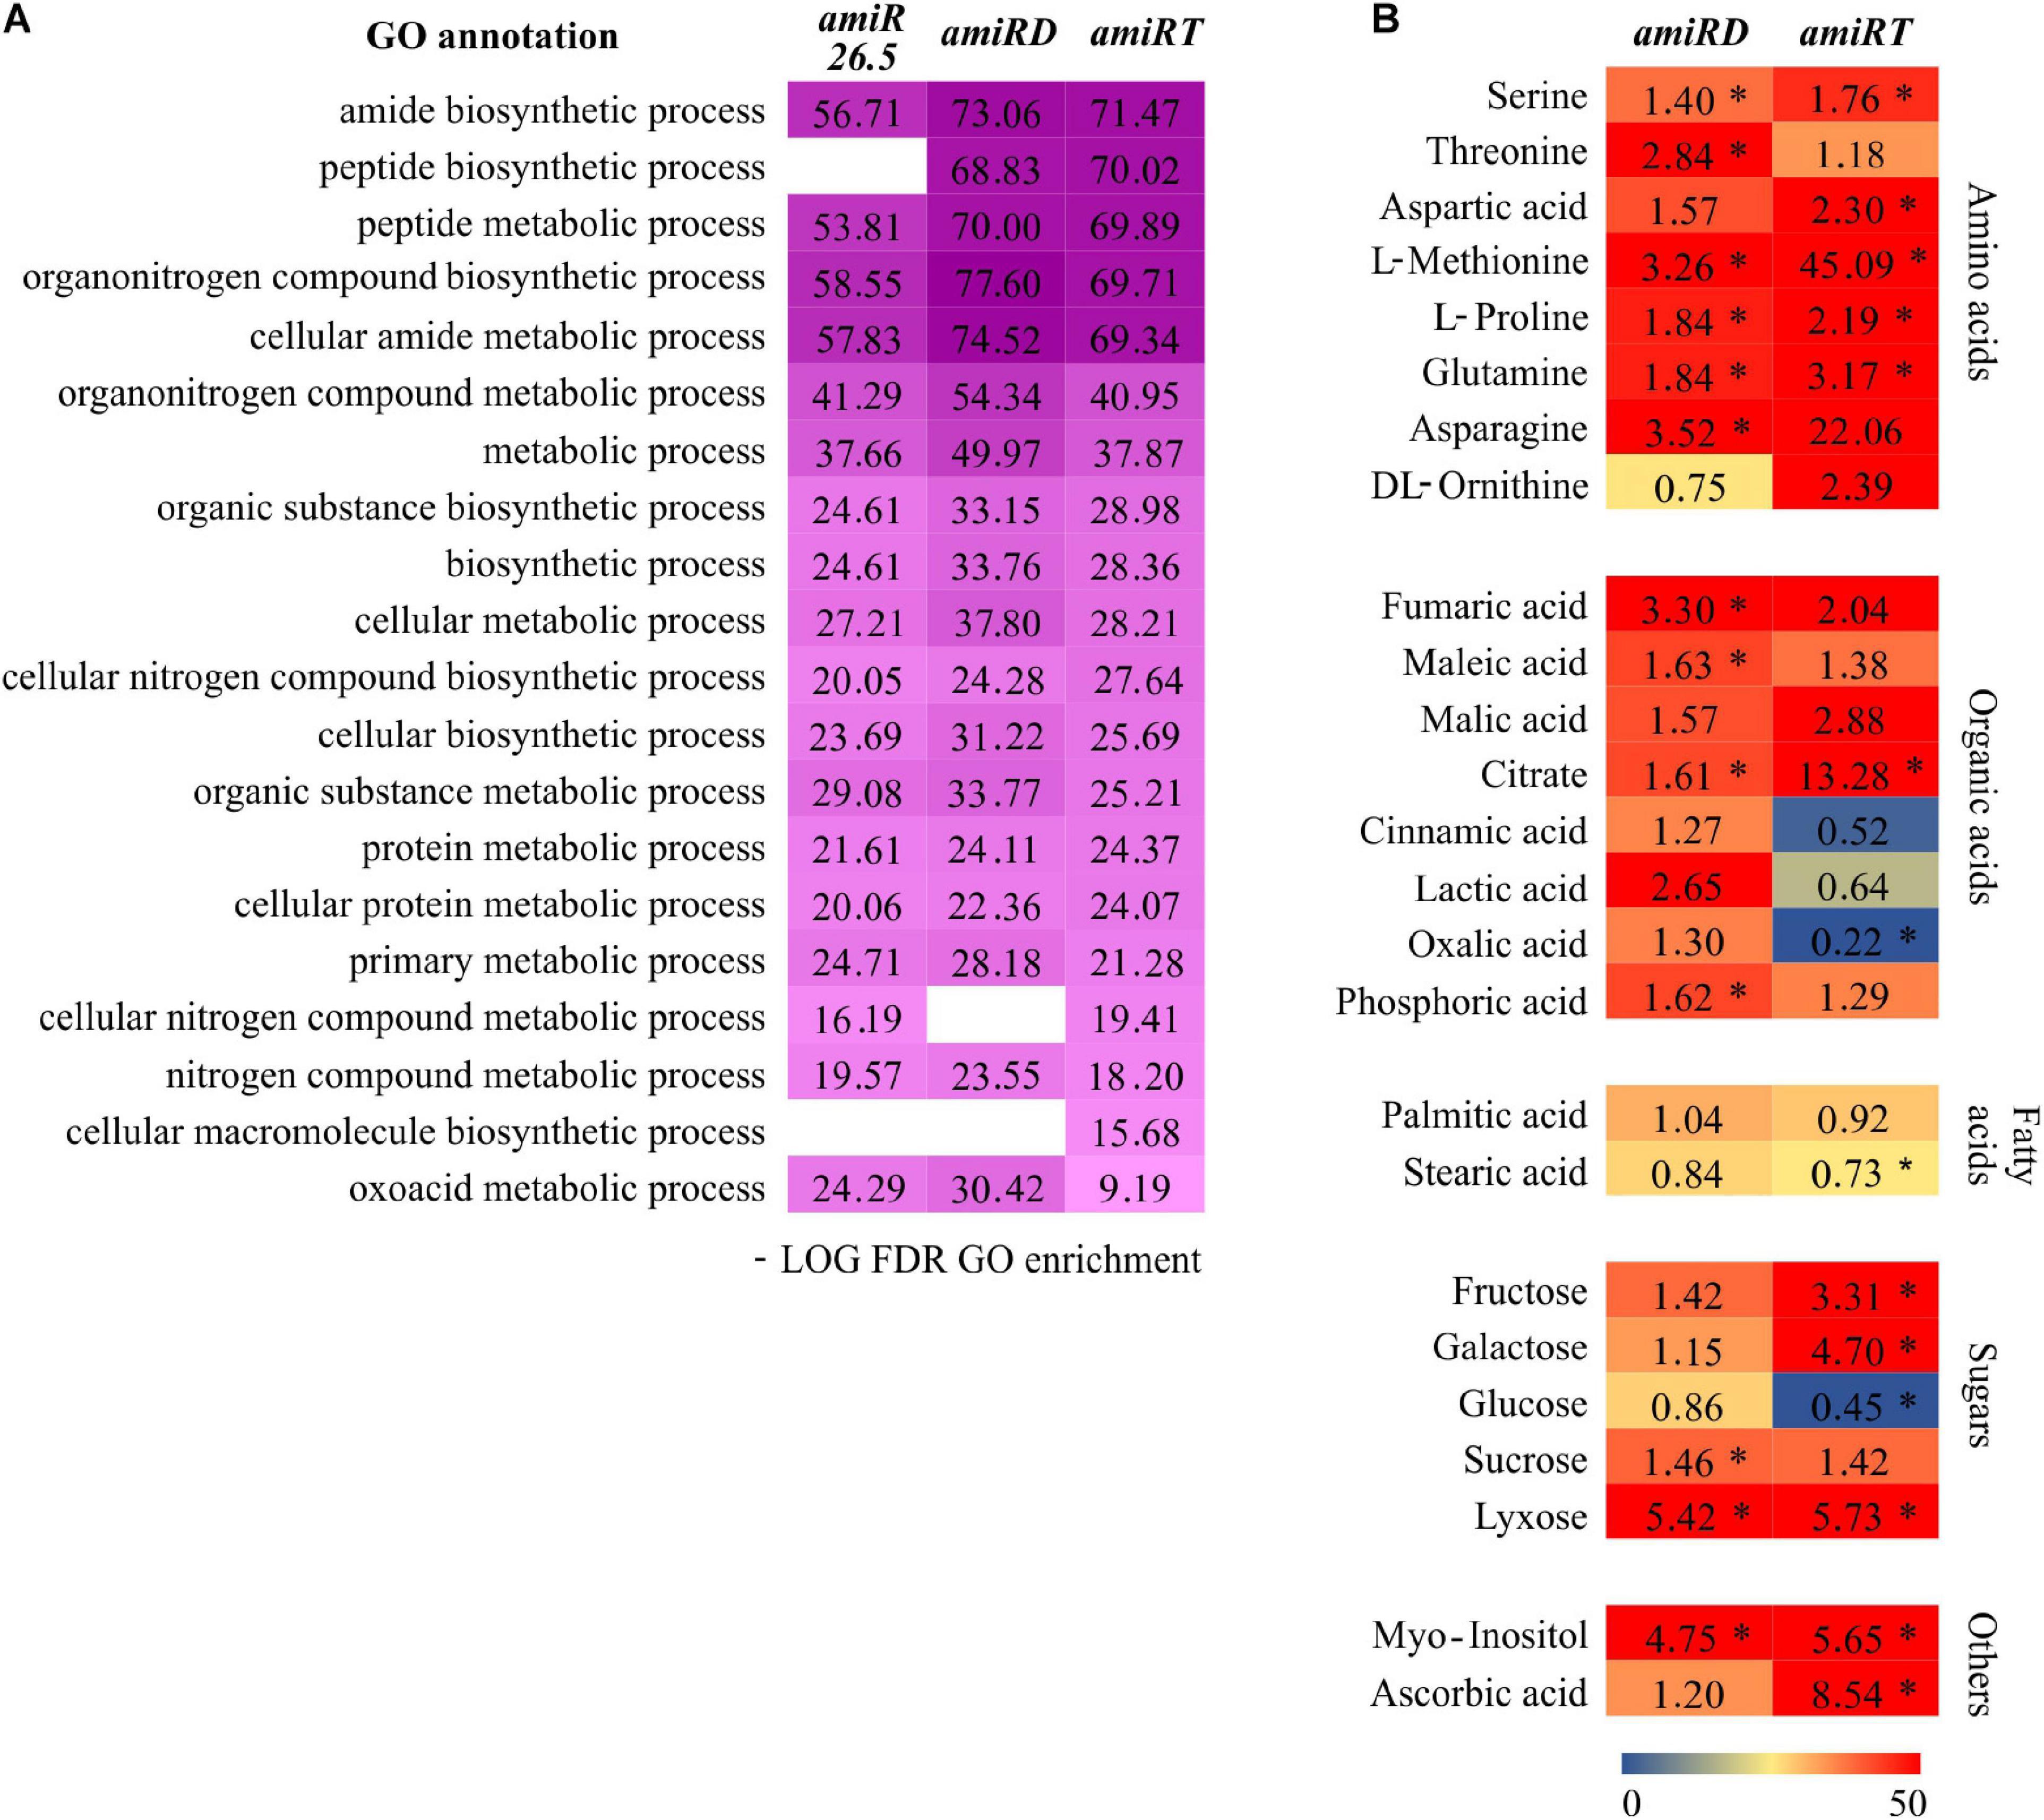
Figure 8. Metabolic changes in the amiRD and amiRT plants. (A) Color map showing top significant metabolism-related GOs in the differentially expressed proteins from amiR26.5, amiRD, and amiRT (Supplementary Tables 19–21). The -log10 of the calculated false discovery rate (FDR) is shown. (B) Metabolic profiling of amiRD and amiRT by GC-MS. The heat map shows the changes in the metabolome of amiRD and amiRT relative to control (EV) samples. Metabolites were extracted from 15-day-old plants and analyzed as described in Materials and Methods. Numbers indicate fold changes relative to control. Experiments were based on three biological replicates corresponding to three independent lines of each amiR; replicates consisted of a pool of 50 plants. Metabolites are represented by a color scale from blue (downregulated) to red (upregulated). Asterisks mean significance by a two-sided t-test with *P < 0.05.
To further test the primary metabolism of amiRD and amiRT plants, metabolic profiling by GC-MS was performed. At this stage (15-day-old plants), amiRD and amiRT lines accumulated several amino acids, such as serine, methionine, glutamine, and proline (Figure 8B). Among the pool of organic acids, the double amiR showed significantly increased levels of fumaric, maleic, phosphoric, and citric acid, which showed a significant accumulation in the amiRT. Fructose and galactose highly accumulated in the amiRT, while lyxose significantly increased in amiRD and amiRT lines. It is worth mentioning the increment in the amiRD and amiRT lines of myo-inositol, a small molecule that is crucial in the regulation of growth and development (Donahue et al., 2010) in the amiRT plants.
Downregulation of M-sHSPs Impacted the Mitochondrial Protein Profile in the amiR Lines
Several mitochondrial proteins (localization according to SUBA4 database) were differently affected in the amiR lines (Table 3). Also worth highlighting are the glycine cleavage system H protein 3 involved in glycine decarboxylation, associated with photorespiration in Arabidopsis (Eisenhut et al., 2019), and the ARM repeat superfamily protein, which was reported to interact with isocitrate dehydrogenase, an enzyme of the tricarboxylic acid cycle (Zhang et al., 2018), in amiR26.5, amiRD, and amiRT lines. The proteome of amiRD showed upregulation of several proteins related to the membrane respiratory chain NADH dehydrogenase (Complex I) and the 24-kDa subunit of the membrane ATP synthase; the peptidyl-prolyl cis-trans isomerase CYP19-3, which accelerates the folding of proteins; the haloacid dehalogenase-like hydrolase; and the peroxiredoxin-IIF, involved in the antioxidant activity (Table 2), also upregulated in amiRT.
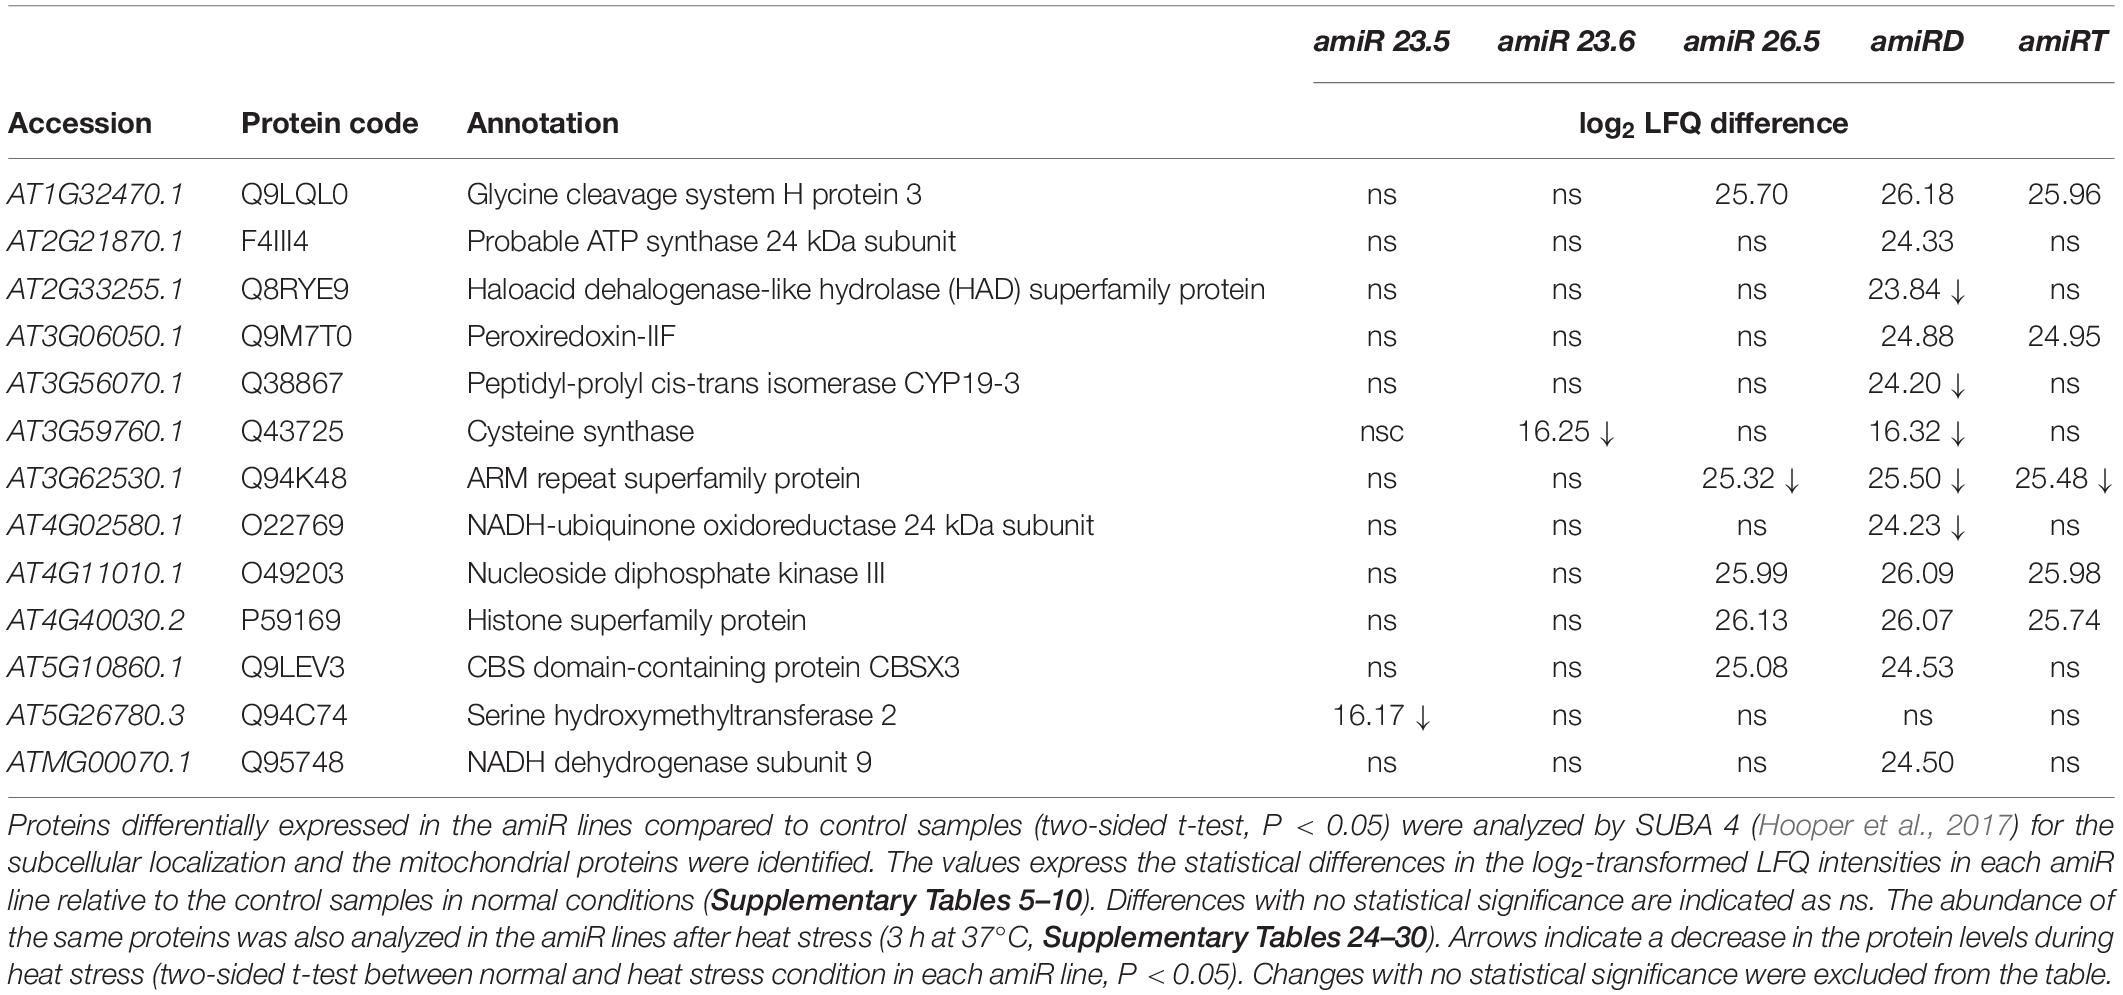
Table 3. Mitochondrial proteins of amiR lines showing significant changes relative to the control plants.
To test the effect of heat stress (3 h at 37°C) on the mitochondrial protein profile, the amiR lines’ proteome was also evaluated in 15-day-old plants. Most of the detected mitochondrial proteins decrease their level under heat stress (Table 3), while many cytosolic proteins related to heat response were upregulated; they are described below.
Heat Conditions Mainly Affected the Cytosolic Protein Profiles in the amiR Lines
The proteome of the amiR lines was evaluated in 15-day-old plants under heat conditions (3 h at 37°C). Comparisons were established in empty vector control or amiR line separately, between heat and normal conditions (Supplementary Tables 24–30). After heat stress, the proteome of all lines showed enrichment of GO terms related to stress response, and amiRD exhibited the highest overrepresentation among amiR lines (Table 4). Proteins of different subcellular compartments (localization according to SUBA4 database) were differently affected by the heat condition in empty vector control and each amiR line (Supplementary Table 31). Although mitochondrial proteins were reduced in all lines, they were particularly affected in the amiR23.5, amiR23.6, amiRD, and amiRT. Cytosolic proteins highly accumulated after heat stress, reaching the highest level in amiR23.6, amiRD, and amiRT, while proteins from the rest of the compartments decreased their abundances in all samples (Supplementary Table 31). These results indicate an utterly new adjustment in the proteome homeostasis under high temperature.
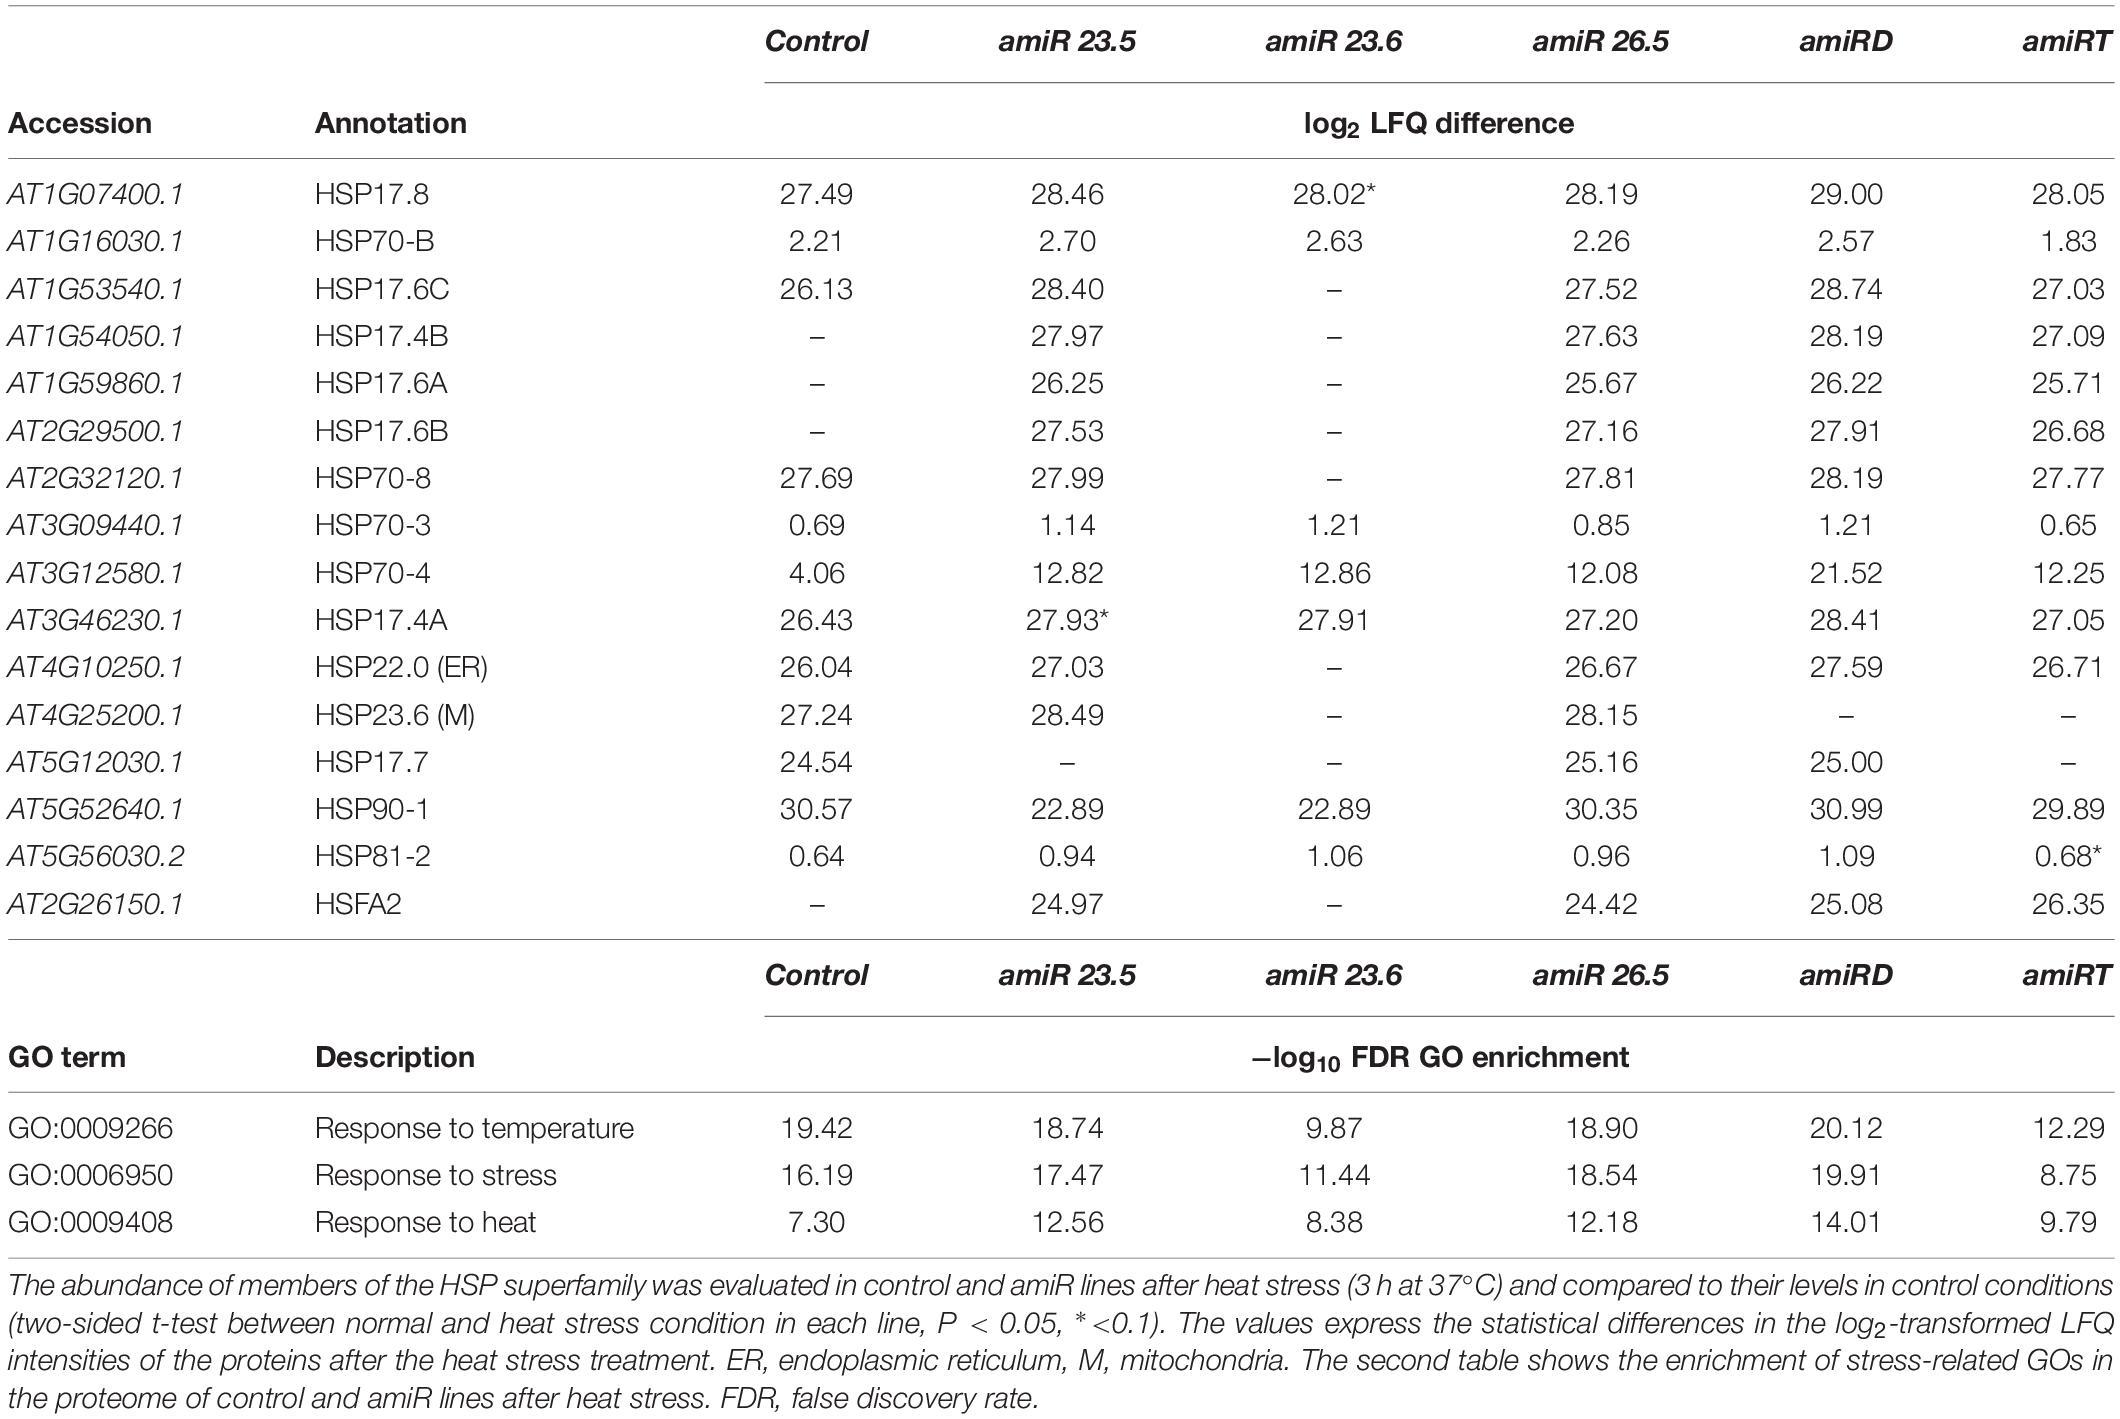
Table 4. HSP superfamily proteins and stress-related GOs showing significant changes after heat stress in control and amiR lines.
From the three M-sHSPs, M-sHSP23.6 is the only one that was well detected with the proteomic approach, while M-sHSP23.5 and M-sHSP26.5 showed no consistent intensities in the analysis (Supplementary Table 32). M-sHSP23.6 exhibited significant induction under heat treatment in the proteome of all samples of control, amiR23.5, and amiR26.5 plants, and in one or two samples of amiRD and amiRT, respectively. Under these conditions, all plants (control and all amiR lines) induced several cytosolic and one endoplasmic reticulum-localized HSPs in common (Table 4). However, a member of Heat Stress Transcription Factor (HsfA2, At2g26150) and members of cytosolic HSP20-like chaperone superfamily proteins (At1g54050, At1g59860.1, and At2g29500) were induced by heat in amiR23.5, amiR26.5, amiRD, and amiRT, but not in control plants (Table 4 and Supplementary Tables 25–30). Besides, the most substantial effect in the abundance of the detected HSP family members was observed in the amiR23.5, amiR26.5, and amiRD. These data indicate that the absence of any M-sHSPs triggered a distinct pattern of cytosolic response to heat stress.
Discussion
Our understanding of how plant sHSPs function comes from studies that use overexpression strategies. Most of these studies were focused to enhance the heat tolerance of crops. Recently, plants overexpressing the mitochondrion-targeted Hsp24.7 (an ortholog of Arabidopsis M-Hsp23.6) of G. hirsutum were shown to enhance germination in transgenic cotton, Arabidopsis, and tomato (Ma et al., 2019). The aim of this work was to uncover the function of M-sHSPs in Arabidopsis plants growing under normal conditions. We present evidence that the simultaneous downregulation of all three Arabidopsis M-sHSPs is essential for plant growth and development under normal growing conditions. This is based on the phenotypic and molecular analyses of the M-sHSPs knock-down plants. Downregulation of the three M-sHSPs leads to a drastic disruption in the vegetative and reproductive growth. Triple amiR23.5/23.6/26.5 plants are dwarf (Figures 3B–E) probably due to the small cell size (Figures 4C–H), with shorter roots (Figures 3F,G), have small pale and chlorotic leaves (Figures 4A,B), and produce a smaller and lower amount of seeds, with reduced germination rates (Supplementary Figure 4). The phenotype of the single and double knock-down lines contrast with the more prominent phenotype of the amiR23.5/23.6/26.5 plants (Figure 3). The single amiR23.5, amiR23.6, and the double amiRD developed synergistic phenotypes, with curved down leaves, bigger rosettes, and plants (Figures 3, 4), and lower seed area and germination rate (Supplementary Figure 4C). Previous reports showed that sHSP23.5 and sHSP23.6 appear to be dual targeted to mitochondria and chloroplasts and were highly co-expressed (Van Aken et al., 2009). The authors suggested that sHSP23.5 and sHSP23.6 form a functional pair and both are needed for stabilizing mitochondrial proteins, and possibly plastidic proteins during stress conditions. As said before, M-sHSP23.5 and M-sHSP23.6 protein sequences are highly similar (68%), while they share only 33% similarity with M-sHSP26.5 (Supplementary Figure 1B). It is important to remark that the seed germination of the amiR23.5 and amiR23.6 lines opposed to the phenotype of AtHSP23.6 overexpression lines that exhibited fast germination rates (Ma et al., 2019). Moreover, the seed phenotype of amiR26.5 plants is indistinguishable from the control lines, indicating that M-sHSP26.5 is not essential for seed development and germination, but the absence of all three M-sHSPs makes a drastic effect on seed viability. The transcriptional upregulation of the M-sHSPs in the single and double knock-down lines lacking one or two of them (Figure 2) denotes that these proteins are strictly regulated. These data suggest that any of the others could compensate for the absence of one M-sHSP, but the absence of the three M-sHSPs causes severe plant growth and reproduction impairment.
Under normal conditions, the promotor of M-sHSP26.5 was mainly active in the root of 15-day-old plants (Figure 1). At the same growth stage, the amiR26.5 and amiRT plants exhibited a disruption in the root growth (Figure 3). It was previously suggested that the cell size is relevant in determining root length (Aceves-García et al., 2016). Nevertheless, the single amiR26.5 showed reduced root length, without consequences in the plant growth or reproduction. Another thing to highlight is the lower protein abundance in amiR26.5 and amiRT compared to control plants, of three subunits of the plastid-located glyceraldehyde 3-phosphate dehydrogenase (Table 1), and the cytosolic actin 2 (Q96292, At3g18780.2) (Supplementary Tables 5, 8, 10), with both proteins related to root growth (Muñoz-Bertomeu et al., 2009; Vaškebová et al., 2018). In fact, the phenotype of all double mutants of gapc showed a severe arrest of root development after 10 to 12 days of growth (Muñoz-Bertomeu et al., 2009), similar to the phenotype of amiR26.5 and amiRT after 15 days of growth (Figures 3F,G). Additionally, amiRT showed downregulation of two putative peroxidases (Q43387 and Q96511) (Table 2) in coincidence with the downregulation of the expression of the genes (At5g64120 and At5g64100) in the double mutants of gapc. It was postulated that glyceraldehyde 3-phosphate dehydrogenase could act as a plastid redox sensor (Muñoz-Bertomeu et al., 2009).
Concerning ROS homeostasis, several proteins from intracellular and extracellular compartments that participate in the antioxidant response accumulated in the single amiR26.5, such as peroxiredoxin and thioredoxin superfamily proteins, Fe superoxide dismutases, and peroxidases (Table 2). The important role of these proteins in the redox regulation of chloroplast target proteins was known. In particular, 2-Cys peroxiredoxins were found to be associated with the [Fe] superoxide dismutase, which are essential for the maintenance of plastidial redox homeostasis, due to the dismutation of superoxide radicals produced at the level of photosystem I to hydrogen peroxide (Cerveau et al., 2016). The proportion of the total proteome involved in the oxidative stress response and redox homeostasis increased in the amiR26.5 when considering the protein abundances (Supplementary Table 23). The overrepresentation of proteins related to the antioxidant activity (GO:0016209) (Table 2) suggests that both mitochondrial and chloroplast ROS are detoxified, resulting in the lower level of ROS in the amiR26.5 plants (Supplementary Figure 5).
The photosynthetic performance of amiR was affected in all lines compared to control plants, although in different ways (Figure 5). amiRT lines, which presented a high chlorotic phenotype (Figure 4), showed the lowest PSII efficiency and ETR values (Figures 5B,E). Proteins related to photosynthesis were significantly overproduced in amiR26.5, amiRD, and amiRT (Table 1). Specifically, the photosystem II reaction center psbp family protein was overproduced exclusively in the amiRT, while other PSI and photosynthetic electron transport proteins were overproduced in amiR26.5 and amiRD. The alterations in the PSII efficiency and ETR values of amiR plants indicate that CO2 assimilation of the amiR plants is also affected. In fact, Rubisco small subunit family proteins were similarly upregulated in amiRD and amiRT plants (Table 1 and Supplementary Tables 9, 10). It is worth mentioning that a cpHsp70 (Q9STW6), involved in protein import into chloroplasts during early developmental stages (Su and Li, 2010), was significantly downregulated in amiRD and amiRT (Supplementary Tables 5, 9, 10), suggesting that the accumulation of the photosynthetic proteins could be due to an impairment of chloroplast protein import in these plants.
The amiRT significantly increased the production of primary metabolites in 15-day-old-plants (Figure 8B), indicating a metabolic reprogramming in these plants. Proline accumulation was reported to be detrimental for plant growth (Lv et al., 2011), which could contribute, in part, to the amiRT phenotype. Myo-inositol and galactose, precursors for the ascorbic acid biosynthesis (Lorence et al., 2004), and ascorbic acid (Figure 8B) are increased in 15-day-old amiRD and amiRT plants in comparison with the control lines, indicating a need to regulate the ROS production in mitochondria. Related to this, the malate content is highly increased in amiRT compared to control plants (Figure 8B). Malate could link the chloroplast metabolism with the mitochondrial ROS, as it was recently proposed (Zhao et al., 2020). Malate plays a key role as an effective readout of the chloroplast redox status leading to the mitochondrial ROS production (Zhao et al., 2020).
Another aspect to consider is the role of M-sHSPs in the stabilization of proteins and membranes (Wang et al., 2004). Several proteins at the cell membrane and cell wall were increased in the amiRT, indicating an alteration of these structures (Figure 7). The disruption of cell membranes in the knock-down plants, indicated by the higher electrolyte leakage (Supplementary Figure 6), supports the view that M-sHSPs may also function as membrane protectants as it was postulated in another system by regulating membrane fluidity and preserving membrane structure and integrity (Tsvetkova et al., 2002).
Except for vacuole and Golgi apparatus, proteins from all cell compartments changed their abundance (Figure 6C), indicating an alteration in the overall protein homeostasis of the amiR plants. Besides the photosynthetic and antioxidant proteins and the associated metabolites, results revealed a complete reprogramming of several crucial pathways and biological processes in response to the absence of M-sHSPs (Figures 7, 8). These new adjustments demonstrate that, although located and playing essential roles in mitochondria, M-sHSPs may have functional interconnections with other cellular processes and structures outside these organelles.
From the proteome of the amiR lines under heat conditions, the M-sHSP23.6 is the only one that was well detected in the single amiR23.5 and amiR26.5, although not in all samples of amiRD and amiRT (Supplementary Table 32). These data could be due to the detection limits of the LC/MS protein analysis. Some mitochondrial proteins were similarly upregulated in amiR26.5, amiRD, and amiRT (Table 3). Several of these mitochondrial proteins are involved in the mitochondrial electron transport, ATP synthesis, and photorespiration. None of them was affected by heat treatment. However, several proteins belonging to the cytosolic HSP chaperone superfamily and HSF2 (Table 4 and Supplementary Table 24) were markedly increased by the absence of any M-sHSPs, triggering a distinct pattern of cytosolic response to heat stress.
In conclusion, the simultaneous downregulation of the three M-sHSPs in Arabidopsis is critical for the proper development and growth of the plant. In response to M-sHSP deficiency, the plant regulates the photosynthetic efficiency, and the level of proteins involved in photosynthesis, the antioxidant system, and mitochondrial metabolism. The protein profile of subcellular compartments was altered, mainly the plastid, cytosol, and mitochondrion, affecting the whole plant cell. Most likely, M-sHSPs coordinate the function between these intracellular spaces to maintain the cellular homeostasis.
While the individual absence of one of the M-sHSP is not critical for the plant to grow and reproduce, possibly by partial compensation of the function by the other proteins, the amiRT is severely affected and unable to complete a healthy life cycle. The absence of M-sHSPs seems to affect the coordination of the cellular components for growth. This is the first demonstration that the three M-sHSPs, involved in stress responses, are essential for the normal vegetative and reproductive growth of Arabidopsis.
Data Availability Statement
The mass spectrometry proteomics data have been deposited to the ProteomeXchange Consortium via the PRIDE (Perez-Riverol et al., 2019) partner repository with the dataset identifier PXD019603.
Author Contributions
IF and EV conceived and designed the research and supervised the research work. ME designed and performed the experiments. EV wrote the research article. All authors interpreted the results, read, edited, and approved the manuscript.
Funding
This work was supported by grants from the National Research Council (CONICET) (PIP No. 11220120100349), Rosario National University (UNR) (No. BIO459), FONCYT (No. PIP2017-0978) to EV, and the German Academic Exchange Service (DAAD) for the Binational Ph.D. Program in Molecular Biosciences and Biomedicine (CUAA-DAHZ 007/2011); ME received fellowships from the DAAD and CONICET.
Conflict of Interest
The authors declare that the research was conducted in the absence of any commercial or financial relationships that could be construed as a potential conflict of interest.
Acknowledgments
The authors are grateful for the help of K. Kerstin Schmitt and Oliver Valerius of the service unit LCMS Protein Analytics DFG-GZ: INST 186/1230-1 FUGG.
Supplementary Material
The Supplementary Material for this article can be found online at: https://www.frontiersin.org/articles/10.3389/fpls.2021.600426/full#supplementary-material
Footnotes
References
Aceves-García, P., Álvarez-Buylla, E. R., Garay-Arroyo, A., García-Ponce, B., Muñoz, R., and Sánchez, M. P. (2016). Root architecture diversity and meristem dynamics in different populations of Arabidopsis thaliana. Front. Plant Sci. 7:858. doi: 10.3389/fpls.2016.00858
Cerveau, D., Kraut, A., Stotz, H. U., Mueller, M. J., Couté, Y., and Rey, P. (2016). Characterization of the Arabidopsis thaliana 2-Cys peroxiredoxin interactome. Plant Sci. 252, 30–41. doi: 10.1016/j.plantsci.2016.07.003
Clough, S. J., and Bent, A. (1998). Floral Dip: a simplified method for Agrobacterium-mediated transformation of Arabidopsis thaliana. Plant J. 16, 735–743. doi: 10.1046/j.1365-313x.1998.00343.x
Cox, J., and Mann, M. (2008). MaxQuant enables high peptide identification rates, individualized p.p.b.-range mass accuracies and proteome-wide protein quantification. Nat. Biotechnol. 26, 1367–1372. doi: 10.1038/nbt.1511
Dabbaghizadeh, A., Morrow, G., Amer, Y. O., Chatelain, E. H., Pichaud, N., and Tanguay, R. M. (2018). Identification of proteins interacting with the mitochondrial small heat shock protein Hsp22 of Drosophila melanogaster: implication in mitochondrial homeostasis. PLoS One 13:e0193771. doi: 10.1371/journal.pone.0193771
de Miguel, N., Echeverria, P., and Angel, S. (2005). Differential subcellular localization of members of the Toxoplasma gondii small heat shock protein family. Eukaryot. Cell 4, 1990–1997. doi: 10.1128/EC.4.12.1990-1997.2005
Donahue, J., Alford, S., Torabinejad, J., Kerwin, R. E., Nourbakhsh, A., Rayet, W. K., et al. (2010). The Arabidopsis thaliana Myo-inositol 1-phosphate synthase1 gene is required for Myo-inositol synthesis and suppression of cell death. Plant Cell 22, 888–903. doi: 10.1105/tpc.109.071779
Eisenhut, M., Roell, M. −S., and Weber, A. P. M. (2019). Mechanistic understanding of photorespiration paves the way to a new green revolution. New Phytol. 223, 1762–1769. doi: 10.1111/nph.15872
Fernández-Bautista, N., Domínguez-Núñez, J. A., Moreno, M. C., and Berrocal-Lobo, M. (2016). Plant tissue trypan blue staining during phytopathogen infection. Bio Protoc. 6:2078. doi: 10.21769/BioProtoc.2078
Gill, S., and Tuteja, N. (2010). Reactive oxygen species and antioxidant machinery in abiotic stress tolerance in crop plants. Plant Physiol. Biochem. 48, 909–930. doi: 10.1016/j.plaphy.2010.08.016
Grimplet, J., Wheatley, M. D., Jouira, H. B., Deluc, L. G., Cramer, G. R., and Cushman, J. C. (2009). Proteomic and selected metabolite analysis of grape berry tissues under well-watered and water-deficit stress conditions. Proteomics 9, 2503–2528. doi: 10.1002/pmic.200800158
Halliwell, B., and Gutteridge, J. M. C. (2015). Free Radicals in Biology and Medicine, 5th Edn. New York, NY: Oxford University Press.
Hieno, A., Naznin, H. A., Inaba-Hasegawa, K., Yokogawa, T., Hayami, N., Nomoto, M., et al. (2019). Transcriptome analysis and identification of a transcriptional regulatory network in the response to H2O2. Plant Physiol. 180, 1629–1646. doi: 10.1104/pp.18.01426
Hooper, C. M., Castleden, I., Tanz, S. K., Aryamanesh, N., and Millar, A. H. (2017). SUBA4: the interactive data analysis centre for Arabidopsis subcellular protein locations. Nucleic Acids Res. 45, D1064–D1074. doi: 10.1093/nar/gkw1041
Huther, C. M., Ramm, A., Rombaldi, C. V., and Bacarin, M. A. (2013). Physiological response to heat stress of tomato ‘Micro-Tom’ plants expressing high and low levels of mitochondrial sHSP23.6 protein. Plant Growth Regul. 70, 175–185. doi: 10.1007/s10725-013-9790-y
Jacob, P., Hirt, H., and Bendahmane, A. (2017). The heat-shock protein/chaperone network and multiple stress resistance. Plant Biotechnol. J. 15, 405–414. doi: 10.1111/pbi.12659
Jiang, C., Xu, J., Zhang, H., Zhang, X., Shi, J., Li, M., et al. (2009). A cytosolic class I small heat shock protein, RcHSP17.8, of Rosa chinensis confers resistance to a variety of stresses to Escherichia coli, yeast and Arabidopsis thaliana. Plant Cell Environ. 32, 1046–1059. doi: 10.1111/j.1365-3040.2009.01987.x
Klughammer, C., and Schreiber, U. (2008). Complementary PS II quantum yields calculated from simple fluorescence parameters measured by PAM fluorometry and the Saturation Pulse method. PAM Appl. Notes 1, 27–35.
Leister, D., Wang, X., Haberer, G., Mayer, K. F., and Kleine, T. (2011). Intracompartmental and intercompartmental transcriptional networks coordinate the expression of genes for organellar functions. Plant Physiol. 157, 386–404. doi: 10.1104/pp.111.177691
Lisec, J., Schauer, N., Kopka, J., Willmitzer, L., and Fernie, A. R. (2006). Gas chromatography mass spectrometry-based metabolite profiling in plants. Nat. Protoc. 1, 387–396. doi: 10.1038/nprot.2006.59
Lorence, A., Chevone, B. I., Mendes, P., Craig, L., and Nessler, C. L. (2004). Myo-Inositol oxygenase offers a possible entry point into plant ascorbate biosynthesis. Plant Physiol. 134, 1200–1205. doi: 10.1104/pp.103.033936
Lv, W. T., Lin, B., Zhang, M., and Hua, X. J. (2011). Proline accumulation is inhibitory to Arabidopsis seedlings during heat stress. Plant Physiol. 156, 1921–1933. doi: 10.1104/pp.111.175810
Ma, W., Guan, X., Li, J., Pan, R., Wang, L., Liu, F., et al. (2019). Mitochondrial small heat shock protein mediates seed germination via thermal sensing. Proc. Natl. Acad. Sci. U.S.A. 116, 4716–4721. doi: 10.1073/pnas.1815790116
Morrow, G., and Tanguay, R. M. (2015). Drosophila melanogaster Hsp22: a mitochondrial small heat shock protein influencing the aging process. Front. Genet. 6:103. doi: 10.3389/fgene.2015.00103
Muñoz-Bertomeu, J., Cascales-Miñana, B., Mulet, J. M., Baroja-Fernández, E., Pozueta-Romero, J., Kuhn, J. M., et al. (2009). Plastidial glyceraldehyde-3-phosphate dehydrogenase deficiency leads to altered root development and affects the sugar and amino acid balance in Arabidopsis. Plant Physiol. 151, 541–558. doi: 10.1104/pp.109.143701
Neuhoff, V., Arold, N., Taube, D., and Ehrhardt, W. (1988). Improved staining of proteins in polyacrylamide gels including isoelectric focusing gels with clear background at nanogram sensitivity using Coomassie Brilliant Blue G-250 and R-250. Electrophoresis 9, 255–262. doi: 10.1002/elps.1150090603
Perez-Riverol, Y., Csordas, A., Bai, J., Bernal-Llinares, M., Hewapathirana, S., Kundu, D. J., et al. (2019). The PRIDE database and related tools and resources in 2019: improving support for quantification data. Nucleic Acids Res. 47, D442–D450. doi: 10.1093/nar/gky1106
Rhoads, D. M., White, S. J., Zou, Y., Muralidharan, M., and Elthon, T. E. (2005). Altered gene expression in plants with constitutive expression of a mitochondrial small heat shock protein suggests the involvement of retrograde regulation in the heat stress response. Physiol. Plant. 123, 435–444. doi: 10.1111/j.1399-3054.2005.00473.x
Sanmiya, K., Suzuki, K., Egawa, Y., and Shono, M. (2004). Mitochondrial small heat-shock protein enhances thermotolerance in tobacco plants. FEBS Lett. 557, 265–268. doi: 10.1016/S0014-5793(03)01494-7
Scarpeci, T. E., Frea, V., Zanor, M. I., and Valle, E. M. (2017). Overexpression of AtERF019 delays plant growth and senescence, and improves drought tolerance in Arabidopsis. J. Exp. Bot. 68, 673–685. doi: 10.1093/jxb/erw429
Scarpeci, T. E., Zanor, M. I., and Valle, E. M. (2008b). Investigating the role of plant heat shock proteins during oxidative stress. Plant Signal. Behav. 3, 856–857. doi: 10.1007/s11103-007-9274-4
Scarpeci, T. E., Zanor, M. I., Carrillo, N., Mueller-Roeber, B., and Valle, E. M. (2008a). Generation of superoxide anion in chloroplasts of Arabidopsis thaliana during active photosynthesis: a focus on rapidly induced genes. Plant Mol. Biol. 66, 361–378.
Scharf, K. D., Siddique, M., and Vierling, E. (2001). The expanding family of Arabidopsis thaliana small heat stress proteins and a new family of proteins containing α-crystallin domains (Acd proteins). Cell Stress Chaperones 6, 225–237. doi: 10.1379/1466-12682001006<0225:tefoat<2.0.co;2
Schauer, N., Steinhauser, D., Strelkov, S., Schomburg, D., Allison, G., Moritz, T., et al. (2005). GCMS libraries for the rapid identification of metabolites in complex biological samples. FEBS Lett. 579, 1332–1337. doi: 10.1016/j.febslet.2005.01.029
Schwab, R., Ossowski, S., Riester, M., Warthmann, N., and Weigel, D. (2006). Highly specific gene silencing by artificial microRNAs in Arabidopsis. Plant Cell 18, 1121–1133. doi: 10.1105/tpc.105.039834
Shevchenko, A., Tomas, H., Havliš, J., Olsen, J. V., and Mann, M. (2007). In-gel digestion for mass spectrometric characterization of proteins and proteomes. Nat. Protoc. 1, 2856–2860. doi: 10.1038/nprot.2006.468
Siddique, M., Gernhard, S., von Koskull-Döring, P., Vierling, E., and Scharf, K. D. (2008). The plant sHSP superfamily: five new members in Arabidopsis thaliana with unexpected properties. Cell Stress Chaperones 13, 183–197. doi: 10.1007/s12192-008-0032-6
Song, L., Jiang, Y., Zhao, H., and Hou, M. (2012). Acquired thermotolerance in plants. Plant Cell Tiss. Org. Cult. 111, 265–276. doi: 10.1007/s11240-012-0198-6
Su, P. H., and Li, H. M. (2010). Stromal Hsp70 is important for protein translocation into pea and Arabidopsis chloroplasts. Plant Cell 22, 1516–1531. doi: 10.1105/tpc.109.071415
Sun, W., Van Montagu, M., and Verbruggen, N. (2002). Small heat shock proteins and stress tolerance in plants. Biochim. Biophys. Acta 1577, 1–9. doi: 10.1016/S0167-4781(02)00417-7
Szklarczyk, D., Gable, A. L., Lyon, D., Junge, A., Wyder, S., Huerta-Cepas, J., et al. (2019). STRING v11: protein-protein association networks with increased coverage, supporting functional discovery in genome-wide experimental datasets. Nucleic Acids Res. 47, D607–D613. doi: 10.1093/nar/gky1131
Tsvetkova, N. M., Horvath, I., Torok, Z., Wolkers, W. F., Balogi, Z., Shigapova, N., et al. (2002). Small heat-shock proteins regulate membrane lipid polymorphism. Proc. Natl. Acad. Sci. U.S.A. 99, 13504–13509. doi: 10.1073/pnas.192468399
Tyanova, S., Temu, T., Sinitcyn, P., Carlson, A., Hein, M. Y., Geiger, T., et al. (2016). The Perseus computational platform for comprehensive analysis of (prote)omics data. Nat. Methods 13, 731–740. doi: 10.1038/nmeth.3901
Van Aken, O., Zhang, B., Carrie, C., Uggalla, V., Paynter, E., Giraud, E., et al. (2009). Defining the mitochondrial stress response in Arabidopsis thaliana. Mol. Plant 2, 1310–1324. doi: 10.1093/mp/ssp053
Vanderauwera, S., Zimmermann, P., Rombauts, S., Vandenabeele, S., Langebartels, C., Gruissem, W., et al. (2005). Genome-wide analysis of hydrogen peroxide-regulated gene expression in Arabidopsis reveals a high light-induced transcriptional cluster involved in anthocyanin biosynthesis. Plant Physiol. 139, 806–821. doi: 10.1104/pp.105.065896
Vaškebová, L., Šamaj, J., and Ovecka, M. (2018). Single-point ACT2 gene mutation in the Arabidopsis root hair mutant der1-3 affects overall actin organization, root growth and plant development. Ann. Bot. 122, 889–901. doi: 10.1093/aob/mcx180
Wang, M., Zou, Z., Li, Q., Xin, H., Zhu, X., Chen, X., et al. (2017). Heterologous expression of three Camellia sinensis small heat shock protein genes confers temperature stress tolerance in yeast and Arabidopsis thaliana. Plant Cell Rep. 36, 1125–1135. doi: 10.1007/s00299-017-2143-y
Wang, W., Vinocur, B., Shoseyov, O., and Altman, A. (2004). Role of plant heat-shock proteins and molecular chaperones in the abiotic stress response. Trends Plant Sci. 9, 244–252. doi: 10.1016/j.tplants.2004.03.006
Waters, E. R. (2013). The evolution, function, structure, and expression of the plant sHSPs. J. Exp. Bot. 64, 391–403. doi: 10.1093/jxb/ers355
Waters, E. R., and Vierling, E. (2020). Plant small heat shock proteins – evolutionary and functional diversity. New Phytol. 227, 24–37. doi: 10.1111/nph.16536
Waters, E. R., Lee, G. J., and Vierling, E. (1996). Evolution, structure and function of the small heat shock proteins in plants. J. Exp. Bot. 47, 325–338. doi: 10.1093/jxb/47.3.325
Waters, E. R., Nguyen, S. L., Eskandar, R., Behan, J., and Sanders-Reed, Z. (2008). The recent evolution of a pseudogene: diversity and divergence of a mitochondria-localized small heat shock protein in Arabidopsis thaliana. Genome 51, 177–186. doi: 10.1139/G07-114
Waters, M. T., Fray, R. G., and Pyke, K. A. (2004). Stromule formation is dependent upon plastid size, plastid differentiation status and the density of plastids within the cell. Plant J. 39, 655–667. doi: 10.1111/j.1365-313X.2004.02164.x
Weigel, D., and Glazebrook, J. (2002). Arabidopsis: A Laboratory Manual. New York, NY: Cold Spring Harbor Laboratory Press.
Zhang, L., Li, Y., Xing, D., and Gao, C. (2009). Characterization of mitochondrial dynamics and subcellular localization of ROS reveal that HsfA2 alleviates oxidative damage caused by heat stress in Arabidopsis. J. Exp. Bot. 60, 2073–2091. doi: 10.1093/jxb/erp078
Zhang, Y., Swart, C., Alseekh, S., Scossa, F., Jiang, L., Obata, T., et al. (2018). The extra-pathway interactome of the TCA cycle: expected and unexpected metabolic interactions. Plant Physiol. 177, 966–979. doi: 10.1104/pp.17.01687
Zhao, Y., Yu, H., Zhou, J. M., Smith, S. M., and Li, J. (2020). Malate circulation: linking chloroplast metabolism to mitochondrial ROS. Trends Plant Sci. 25, 446–454. doi: 10.1016/j.tplants.2020.01.010
Keywords: growth arrest, heat stress, metabolism, proteomics, sHSP
Citation: Escobar MR, Feussner I and Valle EM (2021) Mitochondrial Small Heat Shock Proteins Are Essential for Normal Growth of Arabidopsis thaliana. Front. Plant Sci. 12:600426. doi: 10.3389/fpls.2021.600426
Received: 30 August 2020; Accepted: 04 January 2021;
Published: 10 February 2021.
Edited by:
László Szabados, Biological Research Centre, Hungarian Academy of Sciences (MTA), HungaryReviewed by:
Pierre Carol, UMR 7618 Institut d’écologie et des Sciences de l’environnement de Paris (IEES), FranceAndrás Szarka, Budapest University of Technology and Economics, Hungary
Copyright © 2021 Escobar, Feussner and Valle. This is an open-access article distributed under the terms of the Creative Commons Attribution License (CC BY). The use, distribution or reproduction in other forums is permitted, provided the original author(s) and the copyright owner(s) are credited and that the original publication in this journal is cited, in accordance with accepted academic practice. No use, distribution or reproduction is permitted which does not comply with these terms.
*Correspondence: Estela M. Valle, dmFsbGVAaWJyLWNvbmljZXQuZ292LmFy