 Luca Braglia1†
 Massimiliano Lauria1†
 Klaus J. Appenroth2
 Manuela Bog3
 Diego Breviario1
 Aldo Grasso1
 Floriana Gavazzi1
 Laura Morello1*
- 1Institute of Agricultural Biology and Biotechnology, National Research Council, Milan, Italy
- 2Institute of Plant Physiology, Friedrich Schiller University Jena, Jena, Germany
- 3Institute of Botany and Landscape Ecology, University of Greifswald, Greifswald, Germany
Duckweeds (Lemnaceae) are the smallest and fastest-growing angiosperms. This feature, together with high starch production and good nutritional properties, makes them suitable for several applications, including wastewater treatment, bioenergy production, or feed and food supplement. Due to their reduced morphology and great similarity between diverse species, taxonomic identification of duckweeds is a challenging issue even for experts. Among molecular genotyping methods, DNA barcoding is the most useful tool for species identification without a need for cluster analysis. The combination of two plastid barcoding loci is now considered the gold standard for duckweed classification. However, not all species can be defined with confidence by these markers, and a fast identification method able to solve doubtful cases is missing. Here we show the potential of tubulin-based polymorphism (TBP), a molecular marker based on the intron length polymorphisms of β-tubulin loci, in the genomic profiling of the genera Spirodela, Landoltia, and Lemna. Ninety-four clones were analyzed, including at least two representatives of each species of the three genera, with a special focus on the very heterogeneous species Lemna minor. We showed that a single PCR amplification with universal primers, followed by agarose gel analysis, was able to provide distinctive fingerprinting profiles for 10 out of 15 species. Cluster analysis of capillary electrophoresis–TBP data provided good separation for the remaining species, although the relationship between L. minor and Lemna japonica was not fully resolved. However, an accurate comparison of TBP profiles provided evidence for the unexpected existence of intraspecific hybrids between Lemna turionifera and L. minor, as further confirmed by amplified fragment length polymorphism and sequence analysis of a specific β-tubulin locus. Such hybrids could possibly correspond to L. japonica, as originally suggested by E. Landolt. The discovery of interspecific hybrids opens a new perspective to understand the speciation mechanisms in the family of duckweeds.
Introduction
Duckweeds (Lemnaceae) are the smallest and fastest-growing angiosperms. This feature, together with high starch production and good nutritional properties, makes them suitable for several applications, including wastewater treatment (Körner et al., 2003), bioenergy production (Cui and Cheng, 2015), or feed and food supplement (Appenroth et al., 2017). Duckweeds are a rather small but complex angiosperm group, including 36 species across five genera, monophyletic with Araceae (Nauheimer et al., 2012). These plants are spread in any continent, except the Antarctic, where they populate slow-moving or still freshwaters. Their extremely simplified body plan is the result of a neotenic adaptation to their freely floating aquatic lifestyle. A progressive reduction in size and complexity is observed across their evolution. The morphologically more differentiated Spirodela, also called giant duckweed, is endowed with larger fronds and several roots, whereas the more recently diverged genera Wolffia and Wolffiella show miniaturized, rootless fronds with a size of up to 1-mm small (Landolt, 1986; Bog et al., 2020a).
Although many duckweed species can rarely flower in nature, asexual propagation through budding from mother fronds is the usual proliferation mechanism.
Genetic variability solely provided by the slow accumulation of somatic mutations without recombination could hardly explain the evolutionary radiation of duckweeds, whose underlying speciation mechanisms are then of particular interest. A clear definition of duckweed taxonomy and the availability of effective tools for species delimitation are fundamental to this purpose. However, duckweed’s reduced morphology, together with the rare occurrence of flower and seed formation, and the similarity of many morphological characters (Cleland, 1985; Landolt and Kandeler, 1987) limit the number of morphological traits useful for taxonomy. This fact, together with the high intraspecific phenotypic variability observable under different environmental conditions, often makes unequivocal identification of some species a challenging issue even for expert taxonomists (Bog et al., 2020a).
Since the comprehensive work of Les et al. (2002), who first used plastid sequences as DNA markers, later followed by nuclear markers (Tippery et al., 2015), molecular taxonomic analysis was used to support the internal structure of the duckweed family, which was previously based only on morphological and biochemical data (Les et al., 1997; reviewed in Sree et al., 2016 and Bog et al., 2019). Different genotyping methods have been applied to the resolution of the phylogenetic relationships among duckweeds, gradually shaping the currently accepted evolutionary tree and allowing the identification of synonymous species. This refining work is still ongoing, as demonstrated by the most recent taxonomic revision that reduced the number of duckweed species from 37 to 36, by synonymizing Lemna valdiviana Phil. and Lemna yungensis Landolt (Bog et al., 2020b,c).
The work of Wang et al. (2010) proposed the plastid intergenic spacer atpF-atpH as the most promising barcoding marker for species-level identification in duckweeds by analyzing 31 species. By extending this analysis to a larger number of representative clones of all duckweed species, Borisjuk et al. (2015) proposed the use of this marker in combination with a second plastid spacer sequence, psbK-psbI, for higher resolution. A Bayesian tree-based classification was able to discriminate most, but not all, species by the combination of the two markers. Faster species recognition based on a PCR sequence–Basic Local Alignment Search Tool (BLAST) protocol allowed the unambiguous identification of 25 out of 37 (now 36) duckweed species, while for five species the need for further sequence data from more clones was highlighted in order to establish the effectiveness of the protocol. For instance, the high degree of nucleotide identity found among the spacer sequences of the two sister species Lemna japonica Landolt and Lemna minor L., resulting in the lack of difference between inter- and intraspecific genetic distances (barcoding gap), makes it unfeasible to distinguish one from the another by this method.
Fingerprinting by amplified fragment length polymorphism (AFLP) has also been successfully applied to duckweed taxonomy (Bog et al., 2019), allowing a good delineation of all Lemna species by cluster analysis, with the exception of Lemna gibba L. This species, representing a large subset of the analyzed clones, appeared split into four non-monophyletic clades (Bog et al., 2010), raising doubts about the classification of some of the clones.
Although different molecular markers support the current duckweed taxonomy and sequencing of one or two DNA barcoding regions seems the simplest method for the identification of most duckweed species, the previously mentioned limits highlight the lack of a reliable and fast tool to characterize newly identified clones. The unequivocal taxonomical identification of the different species and clones is strongly required for utilizing duckweeds in several applications, including wastewater treatment (Körner et al., 2003; Ceschin et al., 2020), bioenergy production (Cui and Cheng, 2015), feed and food supplement (Kaplan et al., 2019), and management of stock collections.
A correct identification becomes fundamental also for the management and conservation of native duckweeds, such as L. minor, which is more and more often replaced in nature by a similar invasive alien Lemna minuta Kunth (Ceschin et al., 2016a).
Tubulin-based polymorphism (TBP) is a PCR-based, multilocus, codominant nuclear marker, targeting β-tubulin introns (Bardini et al., 2004; Gavazzi et al., 2012), which has been widely tested for plant genotyping at the level of species and lower ranks, e.g., cultivar and ecotypes, in many different genera such as Vitis (Gavazzi et al., 2016), Olea (Braglia et al., 2017), Passiflora (Braglia et al., 2014), and Triticum (Silletti et al., 2019). Similar to AFLP and simple sequence repeats (SSR), polymorphic profiles are generated by amplicon length variation across clones, but differently to these markers, TBP is both fully transferable across species and a non-random marker, with defined genomic target loci that correspond to the members of the β-tubulin multigene family. This strategy is possible because all members of this gene family, without known exceptions, share a unique exon–intron organization across land plants, from bryophytes to angiosperms, with two introns of variable length at fixed positions (Breviario et al., 2013). Due to the strong structural constraints that limit amino acid variation in tubulin, nucleotide regions highly conserved across all plant species are found in the flanking regions of both introns, allowing the design of two degenerated universal primer pairs that can potentially cover all Embryophyta species.
The goal of this work was to explore the potential of the TBP marker, not yet tested on the duckweed family, as a possible reliable tool for discrimination among duckweed species and clones. Species of the genera Spirodela, Landoltia, and Lemna were selected for this first test. TBP was shown to provide distinctive fingerprinting profiles at the species and, in some cases, the clone level. It was also useful to unravel relationships between some closely related Lemna species, relying on interspecific hybridization.
Materials and Methods
Plant Material and DNA Extraction
The plant material consisted of 94 duckweed clones, distributed across three genera and 15 species, coming from stock collections (Table 1). The clones are named with the Landolt four-digit code or from the owner of the collection. At least two clones of each species and six Lemna clones not yet assigned to a species were selected. The duckweed plants were cultured aseptically on Schenk and Hildebrandt agar medium, supplied with 0.2% sucrose, in a growth chamber at 25°C, with a light-and-dark regime of 16 and 8 h, respectively (photon flux of 31–34 μmol m–2 s–). Total DNA was individually extracted from 100 mg of duckweed fronds. DNA isolation was performed according to the standard protocol of the DNeasy Plant Mini Kit (Qiagen, Valencia, CA, United States). Fresh tissue was ground in a 2-ml tube in extraction buffer, with three 3-mm stainless steel beads, using a TissueLyser II apparatus (Qiagen, Hilden, Germany) at a frequency of 30 Hz for 1 min. DNA quality and amount were determined by UV absorbance with the Nanodrop 2000C (Thermo Fisher Scientific, Inc., Waltham, MA, United States), and DNA was stored at −20°C until use.
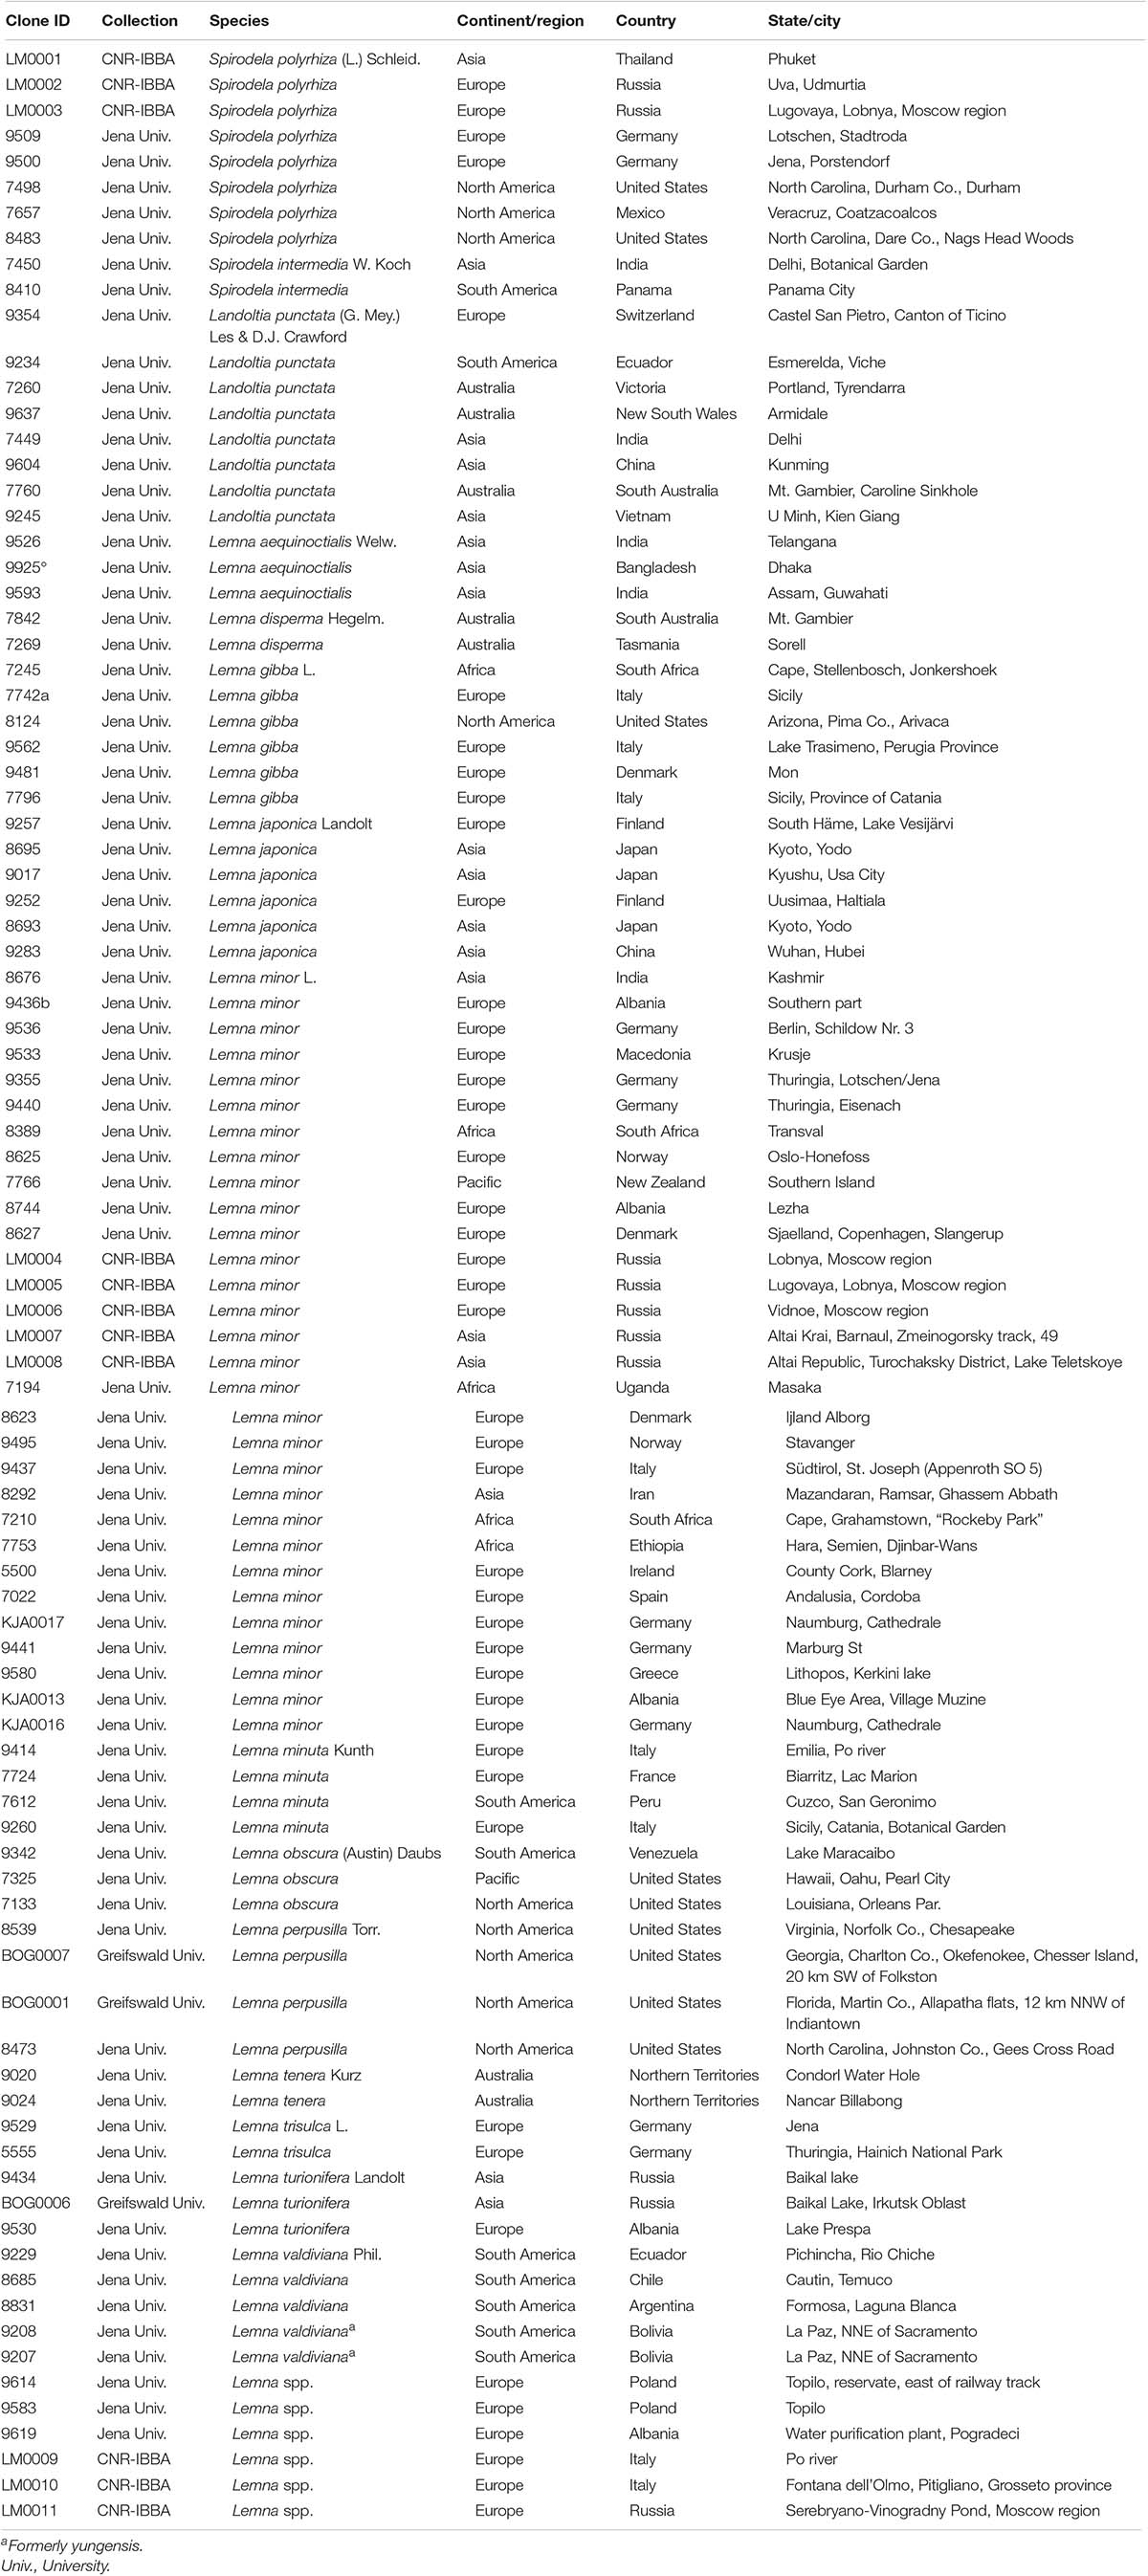
Table 1. List of tested clones, with indication of the original classification in the collection and the geographical origin.
TBP Amplification, Capillary Electrophoresis, and Data Analysis
Thirty nanograms of genomic DNA was used as a template for each TBP 1st and 2nd intron amplifications. The PCR reaction was performed in 30 μl according to Braglia et al. (2020), and control reactions without DNA template were included in any experiment. Each DNA sample was tested twice. The FAM-labeled amplicons were visualized on 2% agarose gel to check for amplification signal intensity and opportunely diluted in double-distilled water. The capillary electrophoresis–TBP (CE-TBP) separation samples were prepared using 2 μl of each diluted PCR product. Capillary electrophoresis and data collection were performed according to the parameters defined by Braglia et al. (2020) using the Gene Mapper Software v. 5.0 tools (Thermo Fisher Scientific, Inc., Waltham, MA, United States) independently for the two intron regions (1st and 2nd). Raw numerical data concerning the size (in base pairs) and the height (in relative florescence units, RFUs) of each CE-TBP profile peak were converted into Microsoft Office Excel files.
The comparison of the CE-TBP profiles of the analyzed clones and the sorting of the numerical data were performed according to the peak size. The peak size was considered as a marker, and its presence/absence was scored in a binary matrix (1/0, respectively). Both TBP 1st and 2nd intron were scored. The genetic dissimilarity values, among the analyzed genotypes, were estimated using the open source software R v. 3.6.2 (R Core Team, 2019), as implemented in the package “ecodist” v. 2.0.5 (Goslee and Urban, 2007) according to Jaccard’s index for binary data. Dendrograms were computed by the neighbor joining (NJ) algorithm using the R package “ape” v. 5.3 (Paradis and Schliep, 2018). The statistical confidence of a particular group of clones within the obtained tree was evaluated by a bootstrap test with 1,000 replicates.
To measure the correlation between the genetic distance matrices estimated by scoring the markers from the TBP 1st and 2nd intron regions, the Mantel test (Mantel, 1967) was carried out with the batch file of the NTSYS-pc2.10e software (Rohlf, 1998). The same test was also used to test TBP repeatability by comparison of the genetic distance matrices estimated for two independent TBP 1st intron amplifications of 32 duckweed clones selected within the L. minor group.
Single Tubulin Gene Amplification
Gene-specific primer pairs annealing to the first intron–exon borders of the two homoeologous β-tubulin loci TUBB 11-1 and TUBB 23-1 were manually designed on the alignment of the two sequences. Two base pair degenerations were included at polymorphic positions. Primers (forward I-Fw_11-23_1 5′-TTC AGG GTA TGC GAT CTA TTC-3′ and reverse I-Rv_11-23_1 5′-GGA ATC CTG CAM KTA AAT GAY G-3′) were used to perform endpoint PCR amplifications by a standard protocol, using 10 ng of gDNA template in a total reaction volume of 20 μl with 2X Taq DNA Polymerase Master Mix (VWR International srl, Milan, Italy). Four microliters of the PCR products was analyzed on 2% (w/v) agarose gel stained with Atlas ClearSight DNA stain (Bioatlas, OÜ, Tartu, Estonia). After PCR purification or band cutting from gel, if two amplicons were present, the PCR products of selected clones were sequenced on both strands by an external service (Microsynth, Balgach, Switzerland) using amplification primers. The obtained sequences were aligned with the corresponding L. minor genome sequences by the Align X tool of the Vector NTI Advance 11.5 suite (Thermo Fisher Scientific, Inc., Waltham, MA, United States).
In silico β-Tubulin Gene Sequence Analysis
The L. minor 8627 and the L. minor 5500 genome assemblies were retrieved from https://www.lemna.org and https://genomevolution.org/r/ik6h, respectively, and used for a stand-alone BLAST search, using a Spirodela polyrhiza β-tubulin gene sequence as a query. Then, on the basis of BLAST hit coordinates, β-tubulin sequences were extracted from the corresponding genome by using SAMtools (Li et al., 2009).
The whole genomic regions encompassing the open reading frame, including introns, were aligned by ClustalW2 software included in the MEGA X version 10.1.7 suite (Kumar et al., 2018). The evolutionary distances were computed using the p-distance method (Nei and Kumar, 2000), and all sequence positions containing gaps and missing data were eliminated (complete deletion option). The phylogenetic analysis was inferred through the UPGMA method (Sneath and Sokal, 1973), and the percentage of replicate trees in which the associated taxa clustered together was estimated by bootstrap test (1,000 replicates) (Felsenstein, 1985). DNA-seq reads of the L. minor 5500 clone, SRR2879345 and SRR2879346, were retrieved from the Genbank database1. For adapter trimming and quality control, Trim Galore wrapper script (version 0.6.6)2 was used. Then, the resulting quality-filtered reads were used for mapping against the L. minor 8627 genome with Bowtie2 (version 2.3.4.1; Langmead and Salzberg, 2012) using default parameters.
DNA Barcoding and Sequence Analysis
Twenty nanograms of total genomic DNA was used for amplification of the atpF-atpH spacer using 0.5 μM of each primer (Fw_Bar_atpF_atpH: ACTCGCACACACTCCCTTTCC; Rv_Bar_atpF_atpH: GCT TTTATGGAAGCTTTAACAAT) (Wang et al., 2010) in a final volume of 20 μl, with 1 unit Platinum Taq DNA Polymerase (Invitrogen, Thermo Fisher Scientific, Inc., Waltham, MA, United States). PCR products were checked on agarose gel and then purified using the QIAquick PCR Purification Kit according to the manufacturer’s instructions (Qiagen, Hilden, Germany). The amplified products were forward- and reverse-sequenced (Microsynth, Balgach, Switzerland). The NCBI BLASTn analysis of resulting contigs was performed for clone identification by best match analysis (see text footnote 1).
AFLP Analysis
A selection of clones of the L. minor group, including the nine used for sequencing of TUBB 11-23-1 introns, was analyzed by AFLP fingerprinting using a modification of a previous protocol (Lauria et al., 2004). Briefly, 100 ng of total genomic DNA was digested using the two restriction enzymes EcoRI and MseI, following ligation of proper adapters to the restricted DNA fragments. The ligation products, after enzyme inactivation (68°C for 15 min), were diluted threefold and used as a template for pre-selective amplification with the primer pair EcoRI −0/MseI + 2. Then, the pre-amplification products were diluted 10-fold, and 3 μl was used as a template for selective amplification with 10 EcoRI + 3/MseI + 4 selective primer combinations (PC). The EcoRI selective amplification primer was labeled with 6-FAM fluorescent dye at the 5′ end to allow fragment analysis by capillary electrophoresis on a 3500 Genetic Analyzer (Thermo Fisher Scientific, Inc., Waltham, MA, United States). For each clone, two independent AFLP restriction–ligation reactions were performed and tested with the primer combinations PC48 and PC51; once reproducible, the two restriction–ligation reactions of each sample were pooled and used for further analysis. The adaptor and primer sequences used in this study are reported in Supplementary Table 1.
The CE reaction was prepared in a volume of 20 μl by adding 2 μl of the amplified DNA, 0.22 μl of GeneScanTM 500LIZTM dye size standard (Thermo Fisher Scientific, Inc., Waltham, MA, United States), and 17.78 μl of Hi-DiTM Formamide (Thermo Fisher Scientific, Inc., Waltham, MA, United States). Gene Mapper Software v. 5.0 (Thermo Fisher Scientific, Inc., Waltham, MA, United States) elaborates and processes the data, allowing the sizing and the release of the AFLP peak pherogram output. We used the size range of 50 to 450 base pairs for scoring of all primer combinations. The lower signal threshold for peak detection was set at 150 RFU. The peak size (base pairs) and height (RFUs) of each electropherogram were converted into a Microsoft Office Excel file, and all the AFLP profiles were aligned according to the peak size. A binary matrix was generated for each PC by scoring for the presence/absence of the markers (1/0, respectively).
As measures of genetic divergence, the number of total markers and the fixed private markers in each group of species were calculated using FAMD v.1.31 software (Schlüter and Harris, 2006). The pairwise genetic distances (GDs) were estimated based on the Dice’s similarity coefficient by Past3 software (v3.25) for Windows (Hammer et al., 2001). To obtain a more detailed view of the distribution of genetic variation within and between different groups of clones, mean GD among clones belonging to the same and/or different groups was also calculated.
Results
Species Recognition at a Glance
To test the power of the TBP method for duckweed genotyping, we focused on the genera Spirodela, Landoltia, and Lemna by analyzing a large set of clones (Table 1) that are representative of all 15 species of these genera.
Both the 1st and the 2nd intronic β-tubulin target regions were amplified with 100% success rate. In the first instance, PCR products were analyzed by agarose gel electrophoresis, revealing distinctive band patterns for different species already at a glance. Figure 1 shows the comparison of the first intron fingerprinting of representative clones for each species.
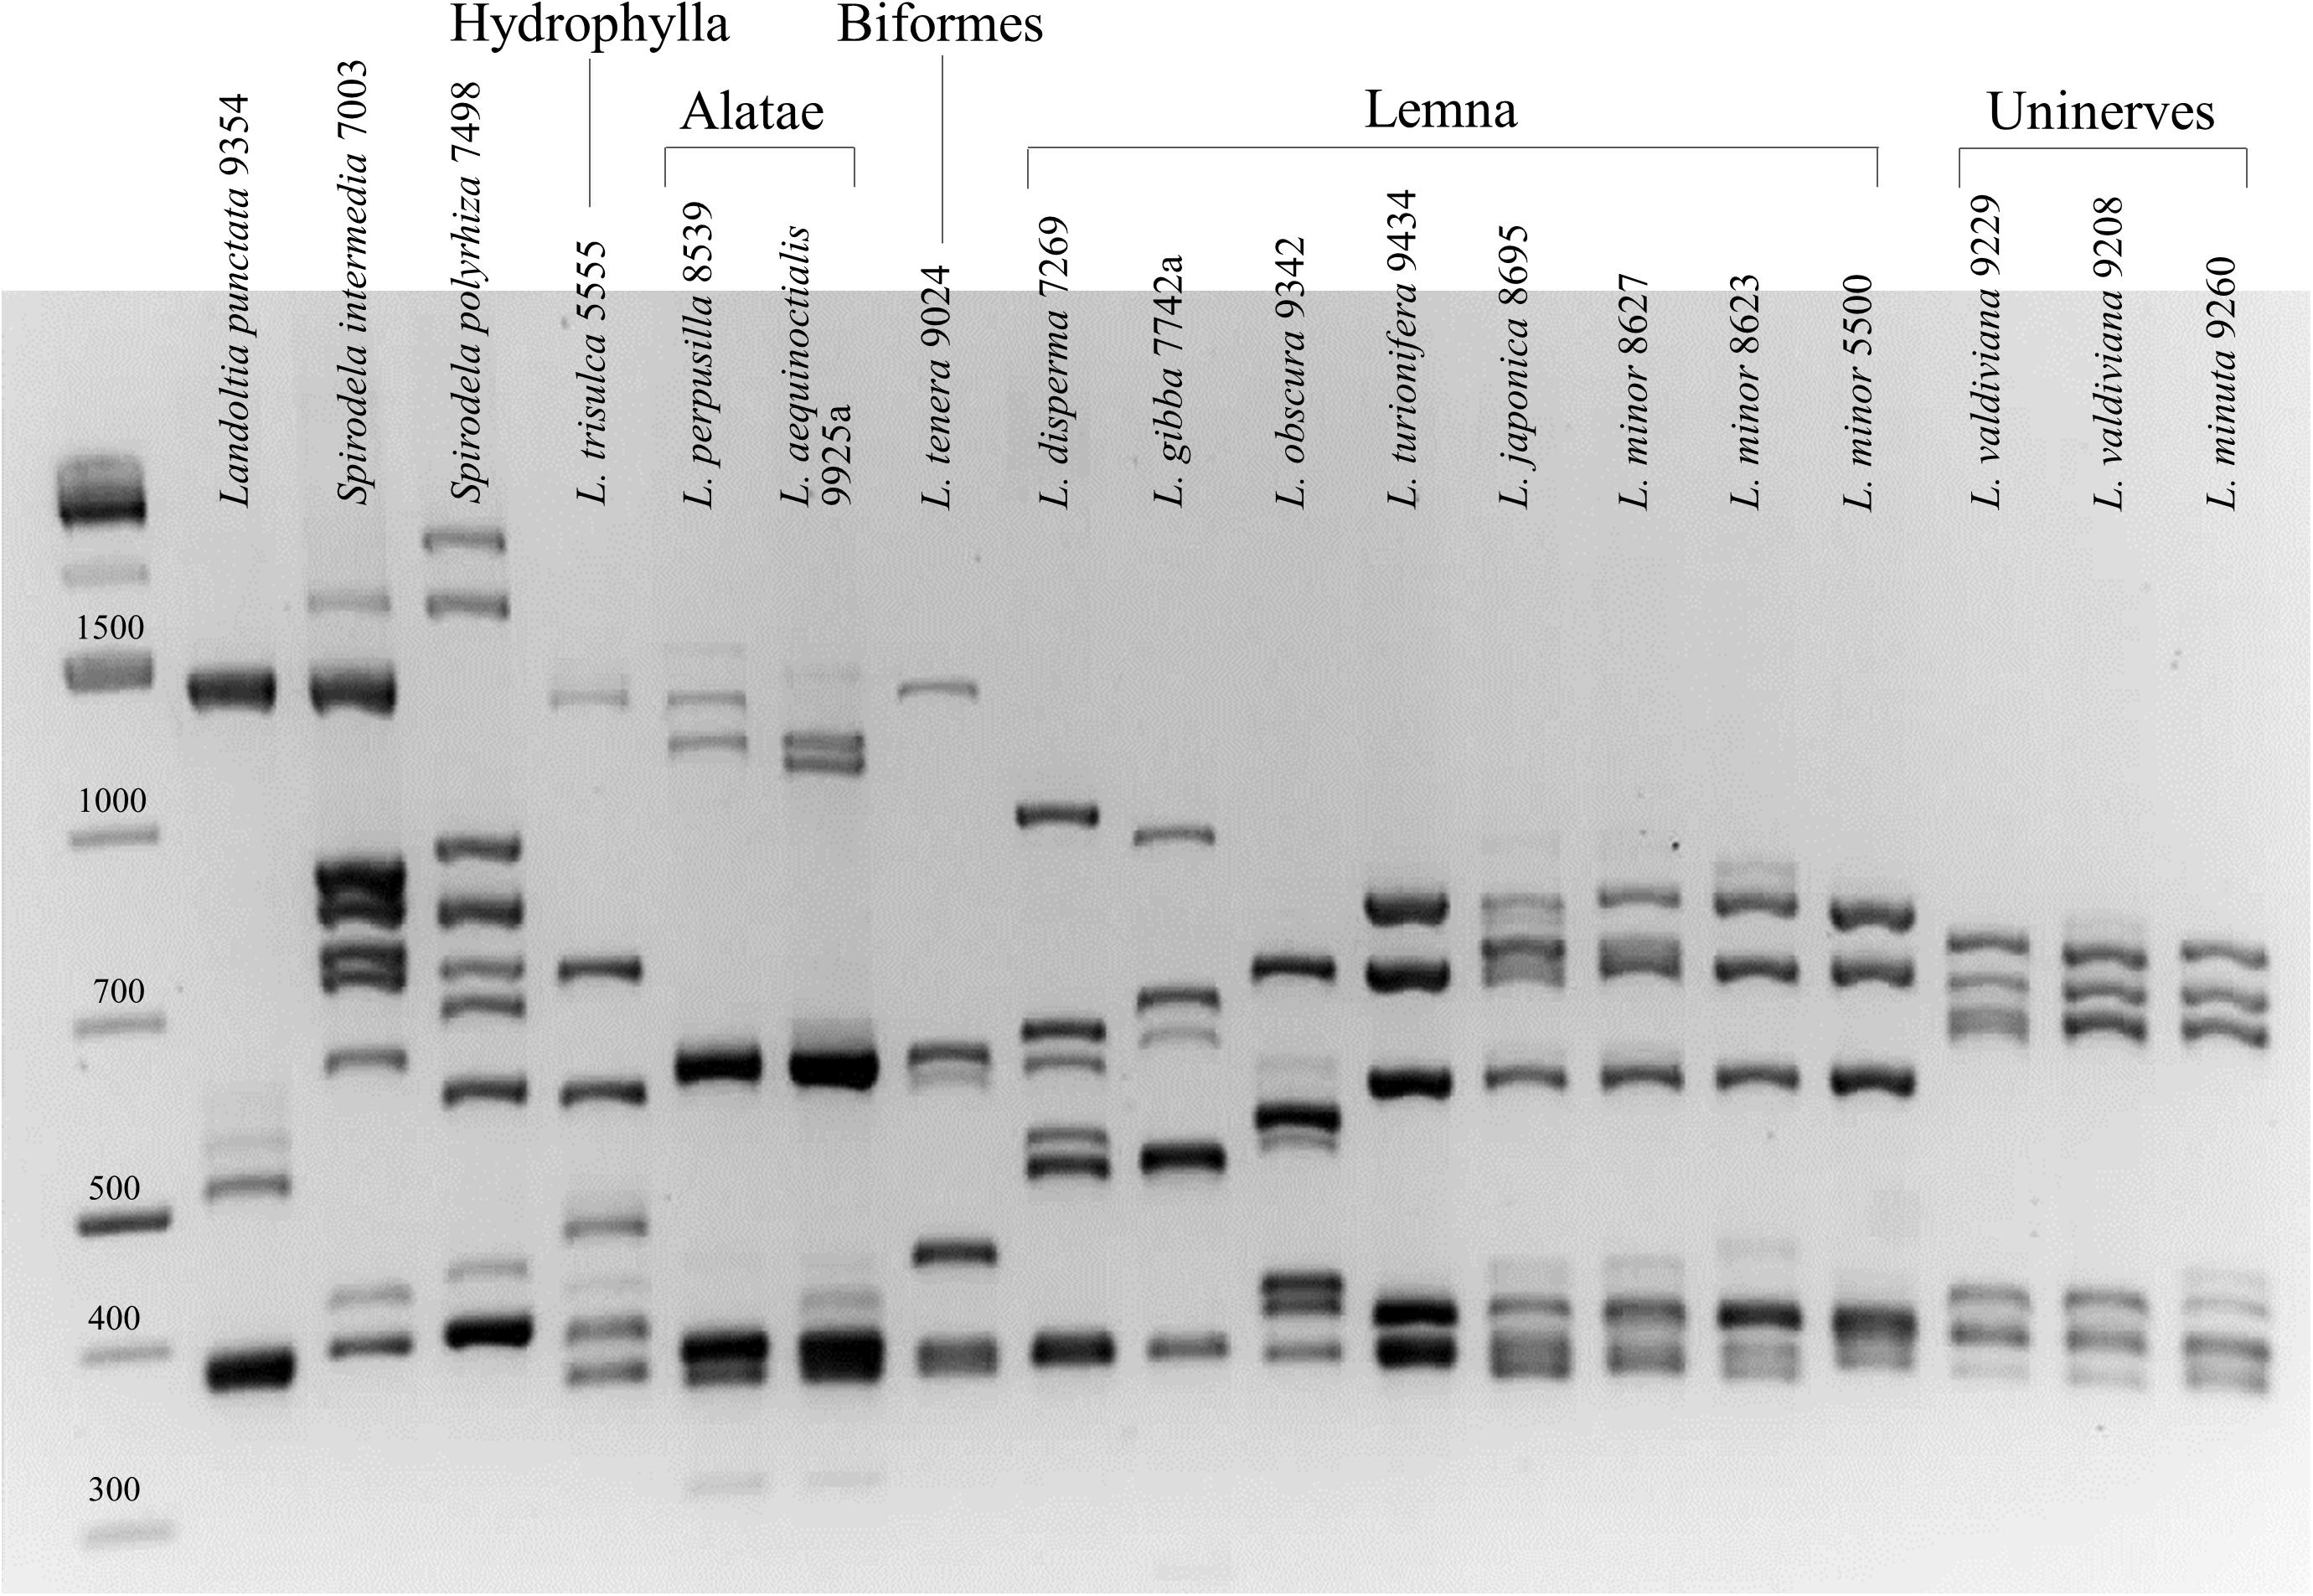
Figure 1. First intron tubulin-based polymorphism fingerprinting of representative clones of all 15 species of the genera Spirodela, Landoltia, and Lemna.
The number of discrete amplified bands in each DNA sample ranged from four [Landoltia punctata (G. Mey.) Les & D. J. Crawford] to nine [S. polyrhiza (L.) Schleid. and Spirodela intermedia W. Koch] for the first intron and from three to five for the second intron (not shown). Since each β-tubulin gene is expected to have two introns, the discordant number of bands is likely due to co-migration of similar-length amplicons. Distinctive species-specific profiles were clearly visible for 10 out of 15 of the investigated species, providing easy identification also in those cases in which the morphological criteria are not always straightforward. The two Spirodela species, S. polyrhiza and S. intermedia, were readily distinguished from one another and from L. punctata until, in 1999, considered a congeneric under the names S. oligorrhiza (Kurz) Hegelm. or S. punctata (Les and Crawford, 1999). The last species showed a very distinct profile on agarose gel, with fewer amplicons (Figure 1). L. gibba was clearly distinct from L. minor for which it is easily mistaken (Landolt, 1975). In the section Alatae, the two sister species Lemna perpusilla Torr. and Lemna aequinoctialis Welw. showed a similar pattern but can be distinguished by the size of their high-molecular-weight amplicon doublet. Two notable exceptions were represented by two groups of species showing hardly distinguishable band patterns. One was the section Uninerves, in which the sister species L. minuta and L. valdiviana (Crawford et al., 1996) showed nearly identical band patterns, also shared by those clones formerly classified as L. yungensis (clone 9208 in Figure 1), data that is consistent with the fact that the last two species are now considered as synonymous (Bog et al., 2020c). The second group of species showing highly similar profiles included L. minor and L. japonica, also known to be closely related and sharing most morphological traits (Landolt, 1986). More unexpected was their similarity with Lemna turionifera Landolt, which is more distantly related according to the most recent phylogenetic tree based on both nuclear and plastid nucleotide sequences (Tippery and Les, 2020). The band patterns of three different L. minor clones are shown in Figure 1, accounting for their similarity with the two other species. The relationships among L. minor, L. japonica, and L. turionifera, better investigated by capillary electrophoresis fragment separation, are described below in a specific chapter.
Intraspecific Polymorphism by TBP
The TBP-amplified DNA of all the clones was also analyzed by capillary electrophoresis that provides electropherogram peak profiles with single nucleotide resolution (CE-TBP, Figures 2A,B).
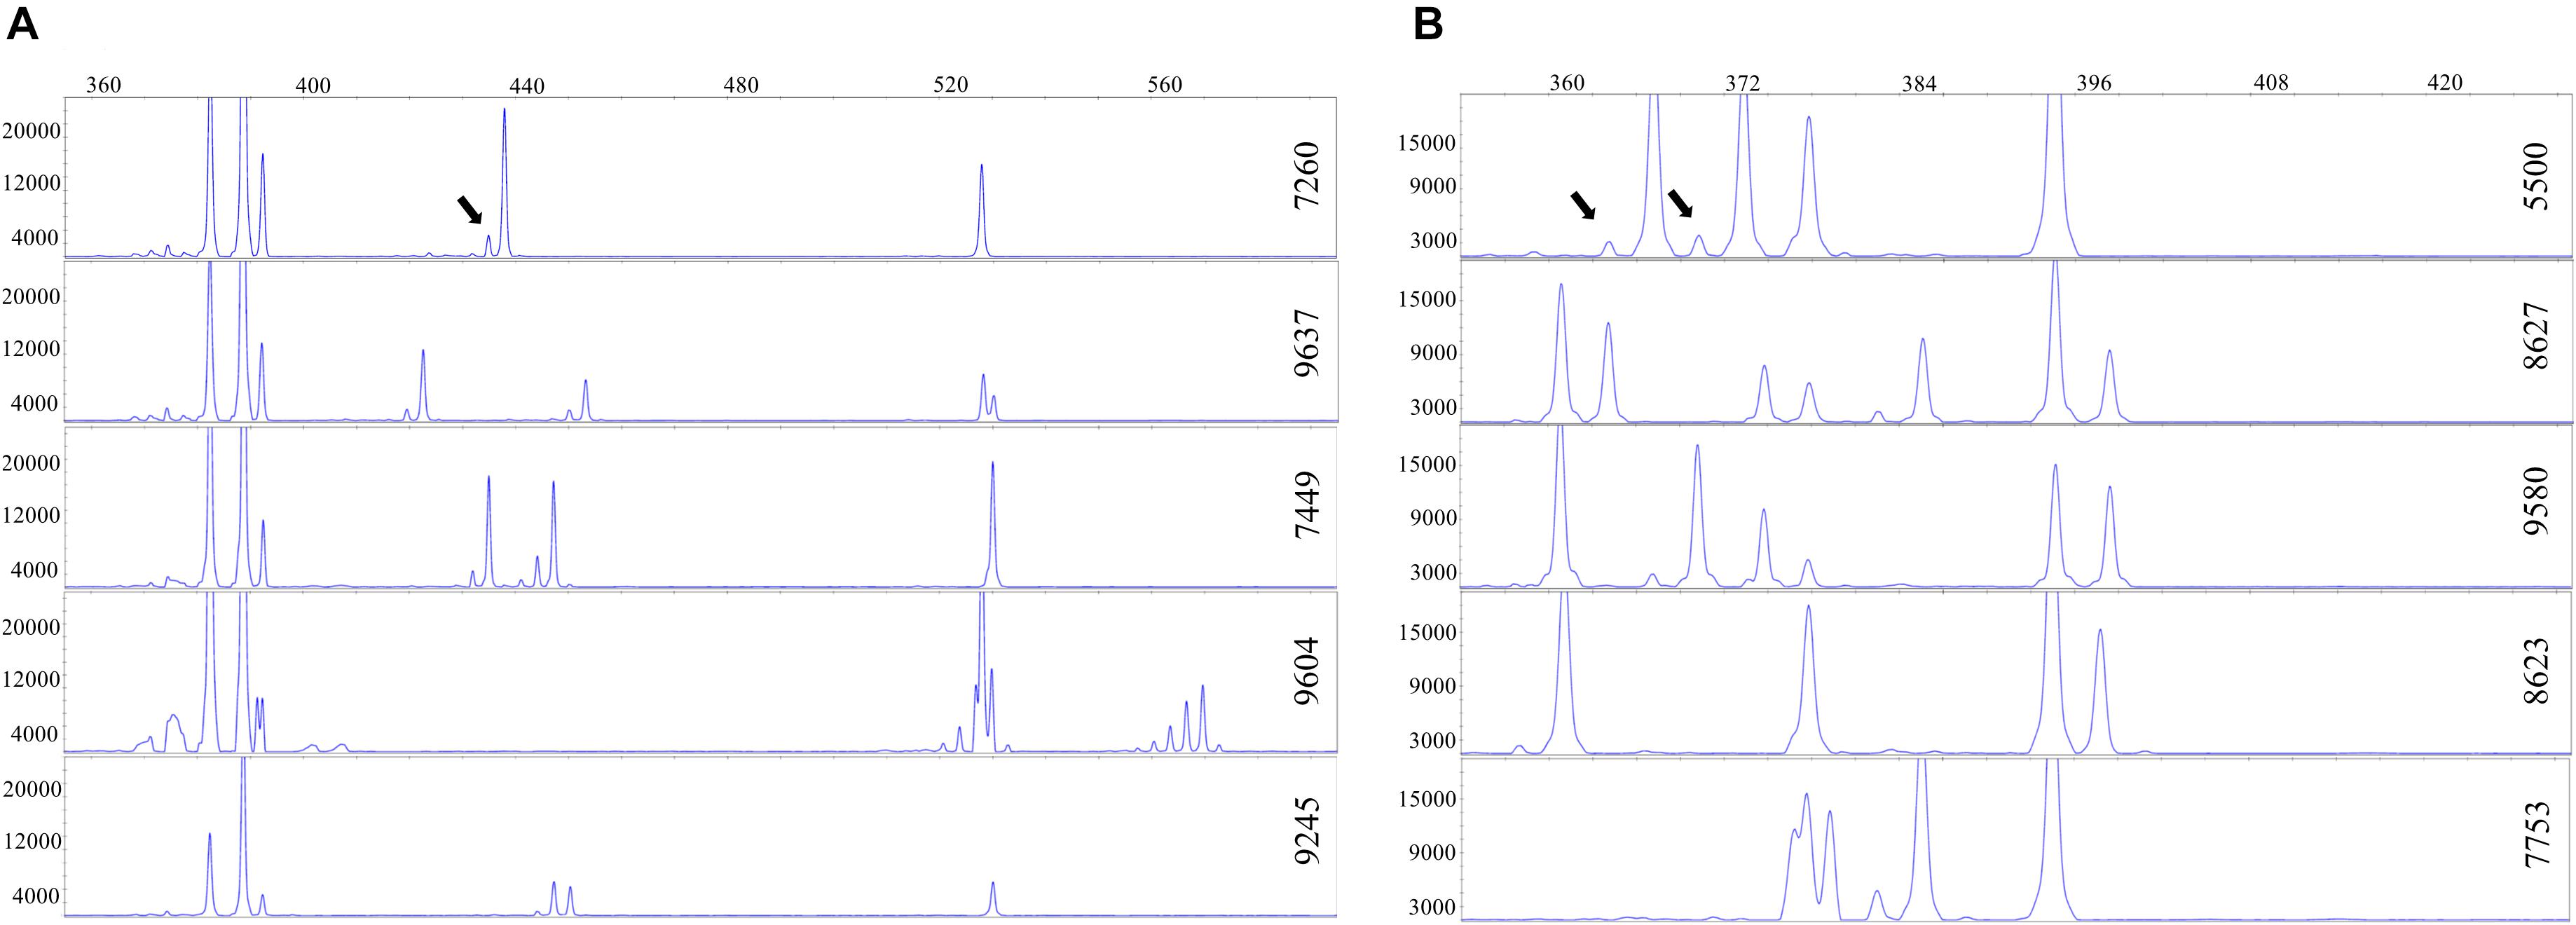
Figure 2. Intraspecific polymorphism in duckweeds, highlighted by capillary electrophoresis. A portion of the electropherogram is shown. The vertical and horizontal axes reflect peak intensity (relative fluorescence units) and peak size (base pairs), respectively. Arrows point to stutter peaks. (A) 1st intron tubulin-based polymorphism (TBP) profiles of five different Landoltia punctata clones. (B) 1st intron TBP profiles of five Lemna minor clones.
This allowed to uncover a certain range of intraspecific variability, particularly in the 1st intron, with small size differences ranging from one to few nucleotides. Such polymorphism likely represents allelic InDel intron variants as also found among cultivars of crop plants such as wheat or grape (Gavazzi et al., 2016; Silletti et al., 2019). The degree of intraspecific variability was, however, different between species. In L. punctata five different allele combinations were detected among eight clones investigated (Figure 2A), while in S. polyrhiza, intraspecific variability among eight analyzed clones of different geographic origin was sufficient to provide unique profiles for each clone. The two S. intermedia clones showed identical TBP profiles. The numerical data for these three species are available in Supplementary Table 2.
The presence of high-level intraspecific polymorphism in the genus Lemna was remarkably evident in L. minor, where all the investigated clones showed unique TBP profiles. For instance, Figure 2B shows the 1st intron CE-TBP profiles of five different representative L. minor clones, three of which (5500, 8623, and 8627) are previously shown in Figure 1. The highly polymorphic fragment region between 350 and 430 bp in Figure 2B, corresponding to the group of bands poorly resolved by the agarose gel in Figure 1, is here well resolved by capillary electrophoresis. Comparing the analyzed clones, both amplicon number and size were different, thus providing an unambiguous identification of each clone. The presence of stutter peaks (minor products that are one to four repeat units shorter than the main allele peak due to polymerase slipping during DNA synthesis) was strongly suggestive of the presence, within target sequences, of SSR contributing to intron length polymorphisms. Although SSR amplification patterns are known to be reproducible (Flores-Rentería and Krohn, 2013), we tested profile repeatability by two independent replicates of the 1st intron TBP amplification and data analysis of 32 clones of the L. minor group in order to exclude the possibility that such PCR artifacts might interfere with an unambiguous identification of clones. The correlation coefficient between the matrices generated by the scored marker for the two sample batches, estimated by the Mantel test, was r = 0.95, indicating high repeatability.
In most other Lemna species, intraspecific variation was detected by TBP, although to a different extent: for example, only two alternative TBP fingerprints were identified in four L. minuta clones. In some cases, the number of investigated clones was too low to address intraspecific variability.
Cluster Analysis of the Genus Lemna
All 76 clones representative of the 12 Lemna species, including six newly isolated Lemna clones not classified before by morphological or molecular markers (Lemna spp. in Table 1), were included in the cluster analysis to test TBP for its ability to assign clones to their respective species. S. polyrhiza clone 7498 was used as the outgroup species. The size range of the scored CE-TBP peaks was between 253 and 1,292 bp for the 1st intron and between 230 and 947 for the 2nd intron region, revealing 162 TBP polymorphic markers across the considered clones (104 and 58 from the 1st and the 2nd intron, respectively). Raw data of a complete set of CE-TBP analysis are provided in Supplementary Table 3. Since the Mantel test revealed a good correlation (r = 0.89) between the similarity matrices obtained from the marker scoring of the two TBP intron regions, the combination of the two was used to explore inter- and intraspecific variability.
Cluster analysis (Figure 3) supported the morphological classification of clones, demonstrating the overall reliability of the TBP approach. Some clones were reclassified or newly classified in this work, and their original classification is given in brackets (see below). A close clustering of clones of the same species was evident, with most species clearly separated. The sub-clusters grouping clones of the Lemna sections Uninerves and Alatae were supported by bootstrap values of 88 and 62%, respectively, while no support was given to the Lemna section Lemna, probably too divergent for the power of the marker.
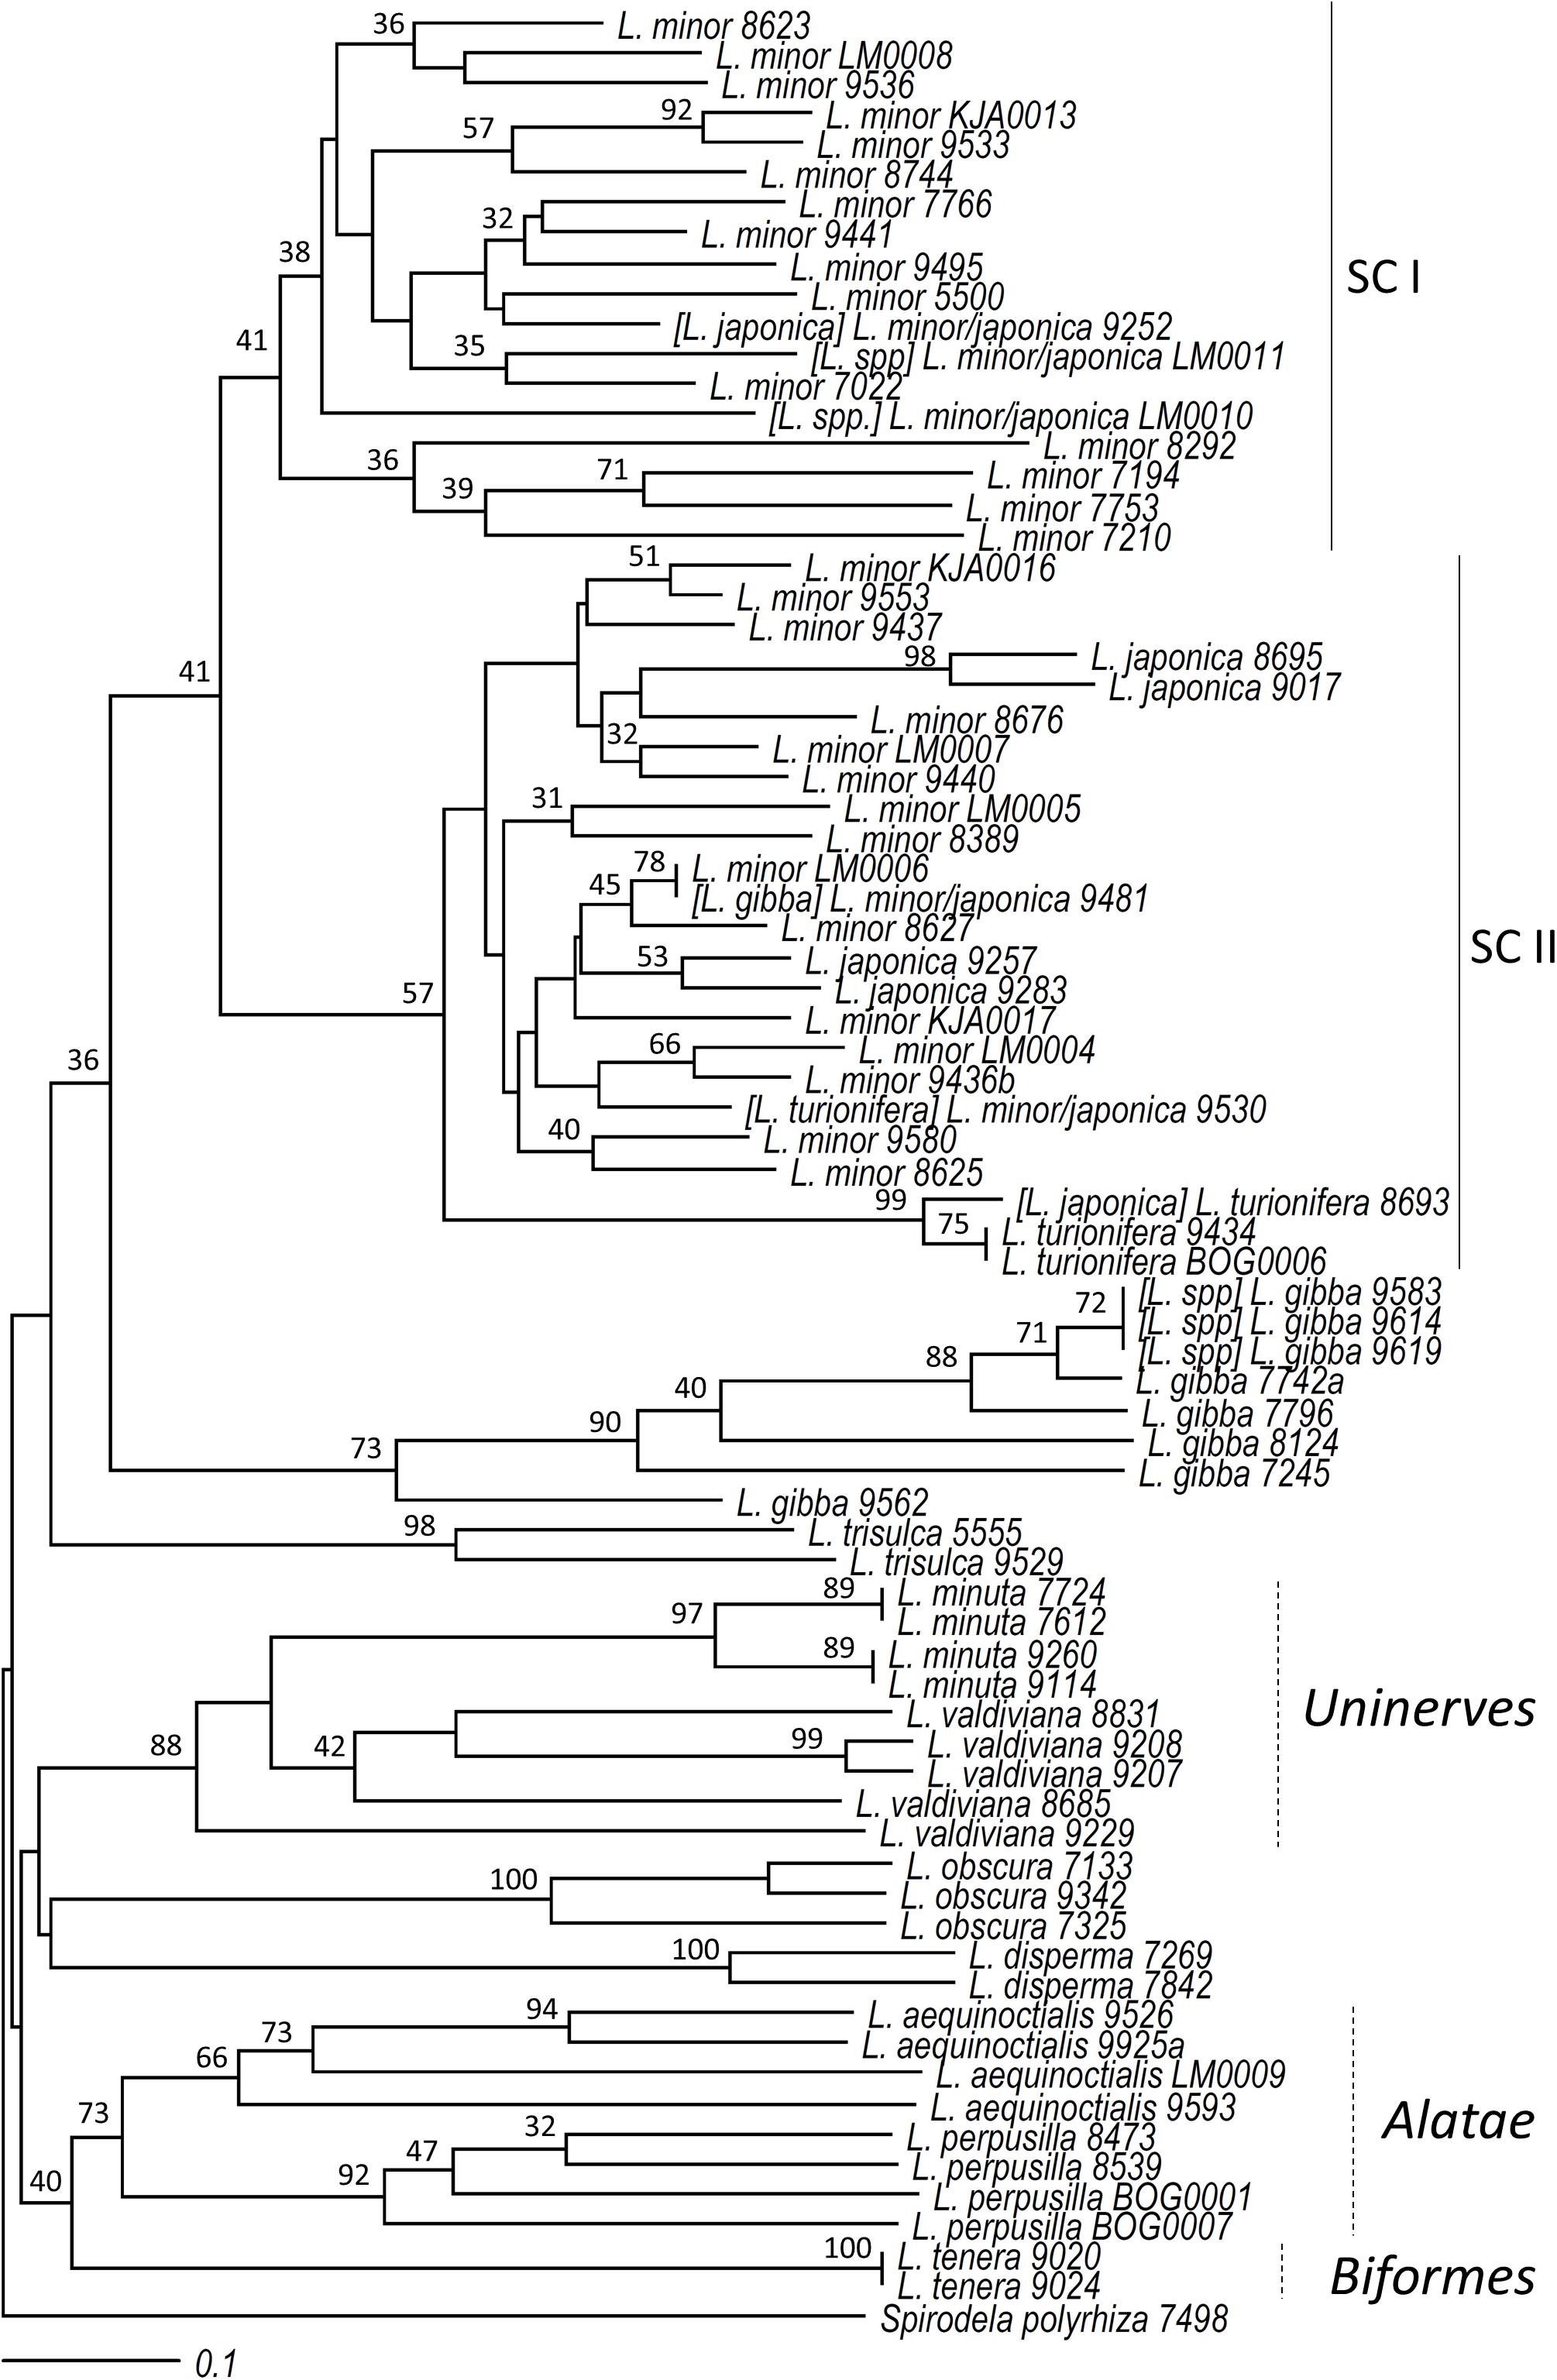
Figure 3. Neighbor joining cluster analysis of clones of the genus Lemna. Bootstrap values (≥30) are shown at the nodes of the tree. The names in brackets refer to the original classification in the stock collection, here revised according to tubulin-based polymorphism and atpF-atpH DNA barcoding.
Unlike agarose gel analysis, cluster analysis based on CE-TBP also separated L. minuta from the sister species L. valdiviana (Lemna section Uninerves), while the separation between clones of L. valdiviana and those formerly classified as L. yungensis (clones 9207 and 9208) was not supported, in accordance with their recent synonymization. The positioning of clone 9229 (L. valdiviana) outside the branch calls for further analysis to be performed on a larger number of clones in order to provide a better resolution of the cluster. The sister species L. perpusilla and L. aequinoctialis also formed two separated branches with a common origin (62% bootstrap value). Four L. gibba clones clustered in a clearly monophyletic group together with three previously unclassified Lemna clones 9583, 9614, and 9619. However, another L. gibba clone (9481) found an unexpected positioning in the NJ tree with respect to their morphological classification, clustering within the L. minor/L. japonica group. This largely represented group (42 clones) included clones of four different species: all clones of L. minor, L. japonica, and L. turionifera present in our study, the just mentioned L. gibba 9481, and two of the previously unclassified clones, LM0010 and LM0011. While the first three species are known to be related, the presence of this L. gibba clone, although unexpected, was consistent with its possible misclassification resulting from a previous AFLP-based cluster analysis which positioned it close to L. turionifera (Bog et al., 2010).
The L. minor cluster appeared to be clearly split in two major subclusters, indicated as subcluster I (SC I) and subcluster II (SC II) in Figure 3. Lemna minor-SC I included only clones classified as L. minor by morphology, with the only exception of clone 9252 registered as L. japonica. Conversely, SC II included clones of the four mentioned species: L. minor, L. japonica, L. turionifera, and L. gibba. While no species separation was evident for L. japonica, L. minor, and the L. gibba clone in this group, a separated and well-supported branch hosted three L. turionifera clones. Interestingly, one of these, clone 8693, was classified by E. Landolt originally as L. japonica but was later corrected to L. turionifera (personal communication to KJA). This change makes this branch homogeneous, although it does not include a fourth L. turionifera clone, 9530, which fell outside this branch, in SC II.
TBP Validation by atpF-atpH Barcoding and Morphological Analysis
The heterogeneous composition of L. minor-SC II, revealing some inconsistencies between morphological analysis and TBP profiling, called for a necessary validation of the latter. Such a validation was also needed for the six Lemna clones that were newly classified by the TBP method (Lemna spp. in Table 1 and Figure 3). In addition, 10 other clones of different species, with still missing molecular marker analysis, were included in the validation. We used the barcoding marker atpF-atpH, which is considered as the gold standard for species identification in duckweeds (Wang et al., 2010; Borisjuk et al., 2015), although ambiguity between the sister species L. aequinoctialis/L. perpusilla, L. minor/L. japonica, and L. minuta/L. valdiviana could not be unequivocally resolved by this marker alone (Borisjuk et al., 2015). The sequence similarity-based identification (best match; cfr. Borisjuk et al., 2015) of the 24 analyzed clones is shown in Table 2. Morphological inspection was also used, in some cases, to support the new classification. For instance, an accurate investigation of distinctive morphological markers such as the position of the papule and the number of nerves spoke in favor of the re-classification as L. minor of the only L. japonica clone (9252) clustering in L. minor-SC I. The TBP classification of clones 9583, 9614, and 9619 as L. gibba was clearly confirmed by atpF-atpH and by morphology. The sequences of the plastid marker of clones LM0010 and LM0011 showed high homology to both L. japonica and L. minor, supporting the TBP results. The classification of clone LM0009 as L. aequinoctialis was also confirmed by barcoding.
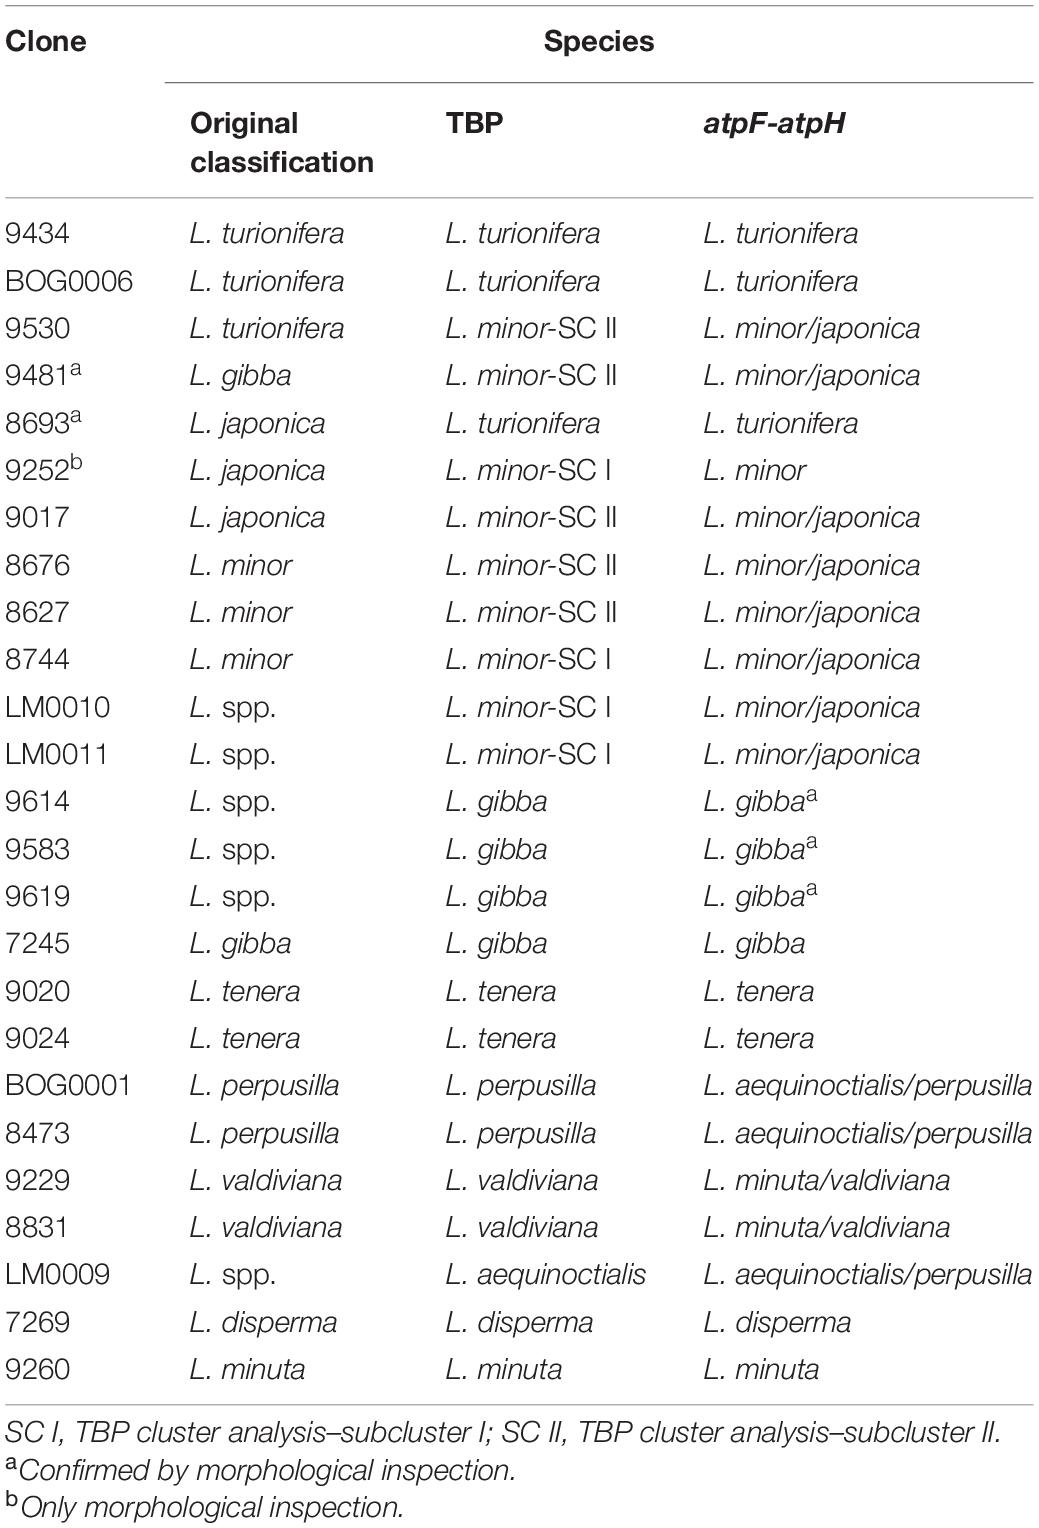
Table 2. Validation of tubulin-based polymorphism (TBP) data by atpF-atpH barcoding or morphological markers.
Validation of TBP results was also obtained for clone 9481, mistaken for L. gibba, and for clone 9530, classified as L. turionifera, thus resolving major inconsistencies in the L. minor group. The classification of these clones according to barcoding is reported in the NJ tree and in Table 1. Finally, clone 8693 was confirmed by barcoding to be L. turionifera, in agreement with the previously mentioned last revision by Landolt. The barcoding results were therefore in accordance with TBP analysis in all those cases in which TBP data were discordant with previous morphologic characterization, thus confirming the reliability of the marker. The TBP results were validated for all remaining clones.
Elucidating the Relationship Between Species in the L. minor Clade
Even with the corrections introduced by revised morphological inspections and plastid barcoding analysis, the separation of L. minor in two subclusters and the tight intertwining of L. japonica and L. minor clones in SC II remained open questions. The heterogeneity and complexity of the L. minor group has been widely reported (Kandeler, 1975). Large intraspecific variation in genome size, ranging from 323 to 769 Mbp/haploid genome, was found (Wang et al., 2011), suggesting differences in ploidy. For instance, the two fully sequenced L. minor clones 8627 (Ernst, 2016) and L. minor 5500 (Van Hoeck et al., 2015) have a haploid genome size of 635 and 481, respectively, as estimated by flow cytometry. This difference in size is in accordance with a higher TBP amplicon number found in L. minor 8627 if compared to L. minor 5500 (12 vs. seven), perhaps explaining the separation of these two clones in the two L. minor subclusters in our dendrogram.
We therefore investigated the composition of the β-tubulin gene family in these two fully sequenced clones. Twelve nearly complete β-tubulin gene sequences of L. minor 8627 and eight of L. minor 5500, retrieved from genome databases, were aligned. The p-distance tree based on nucleotide sequence similarity is shown in Figure 4. While the β-tubulin gene sequences of clone L. minor were associated to contigs, those of L. minor 8627 were assigned to eight out of 42 chromosomes due to their physical mapping during the ongoing WGS project, unpublished yet (Ernst et al., 2019). Chromosomes 11, 23, 26, and 39 hosted two independent β-tubulin loci each, whereas chromosomes 1, 4, 13, and 29 had a single β-tubulin gene.
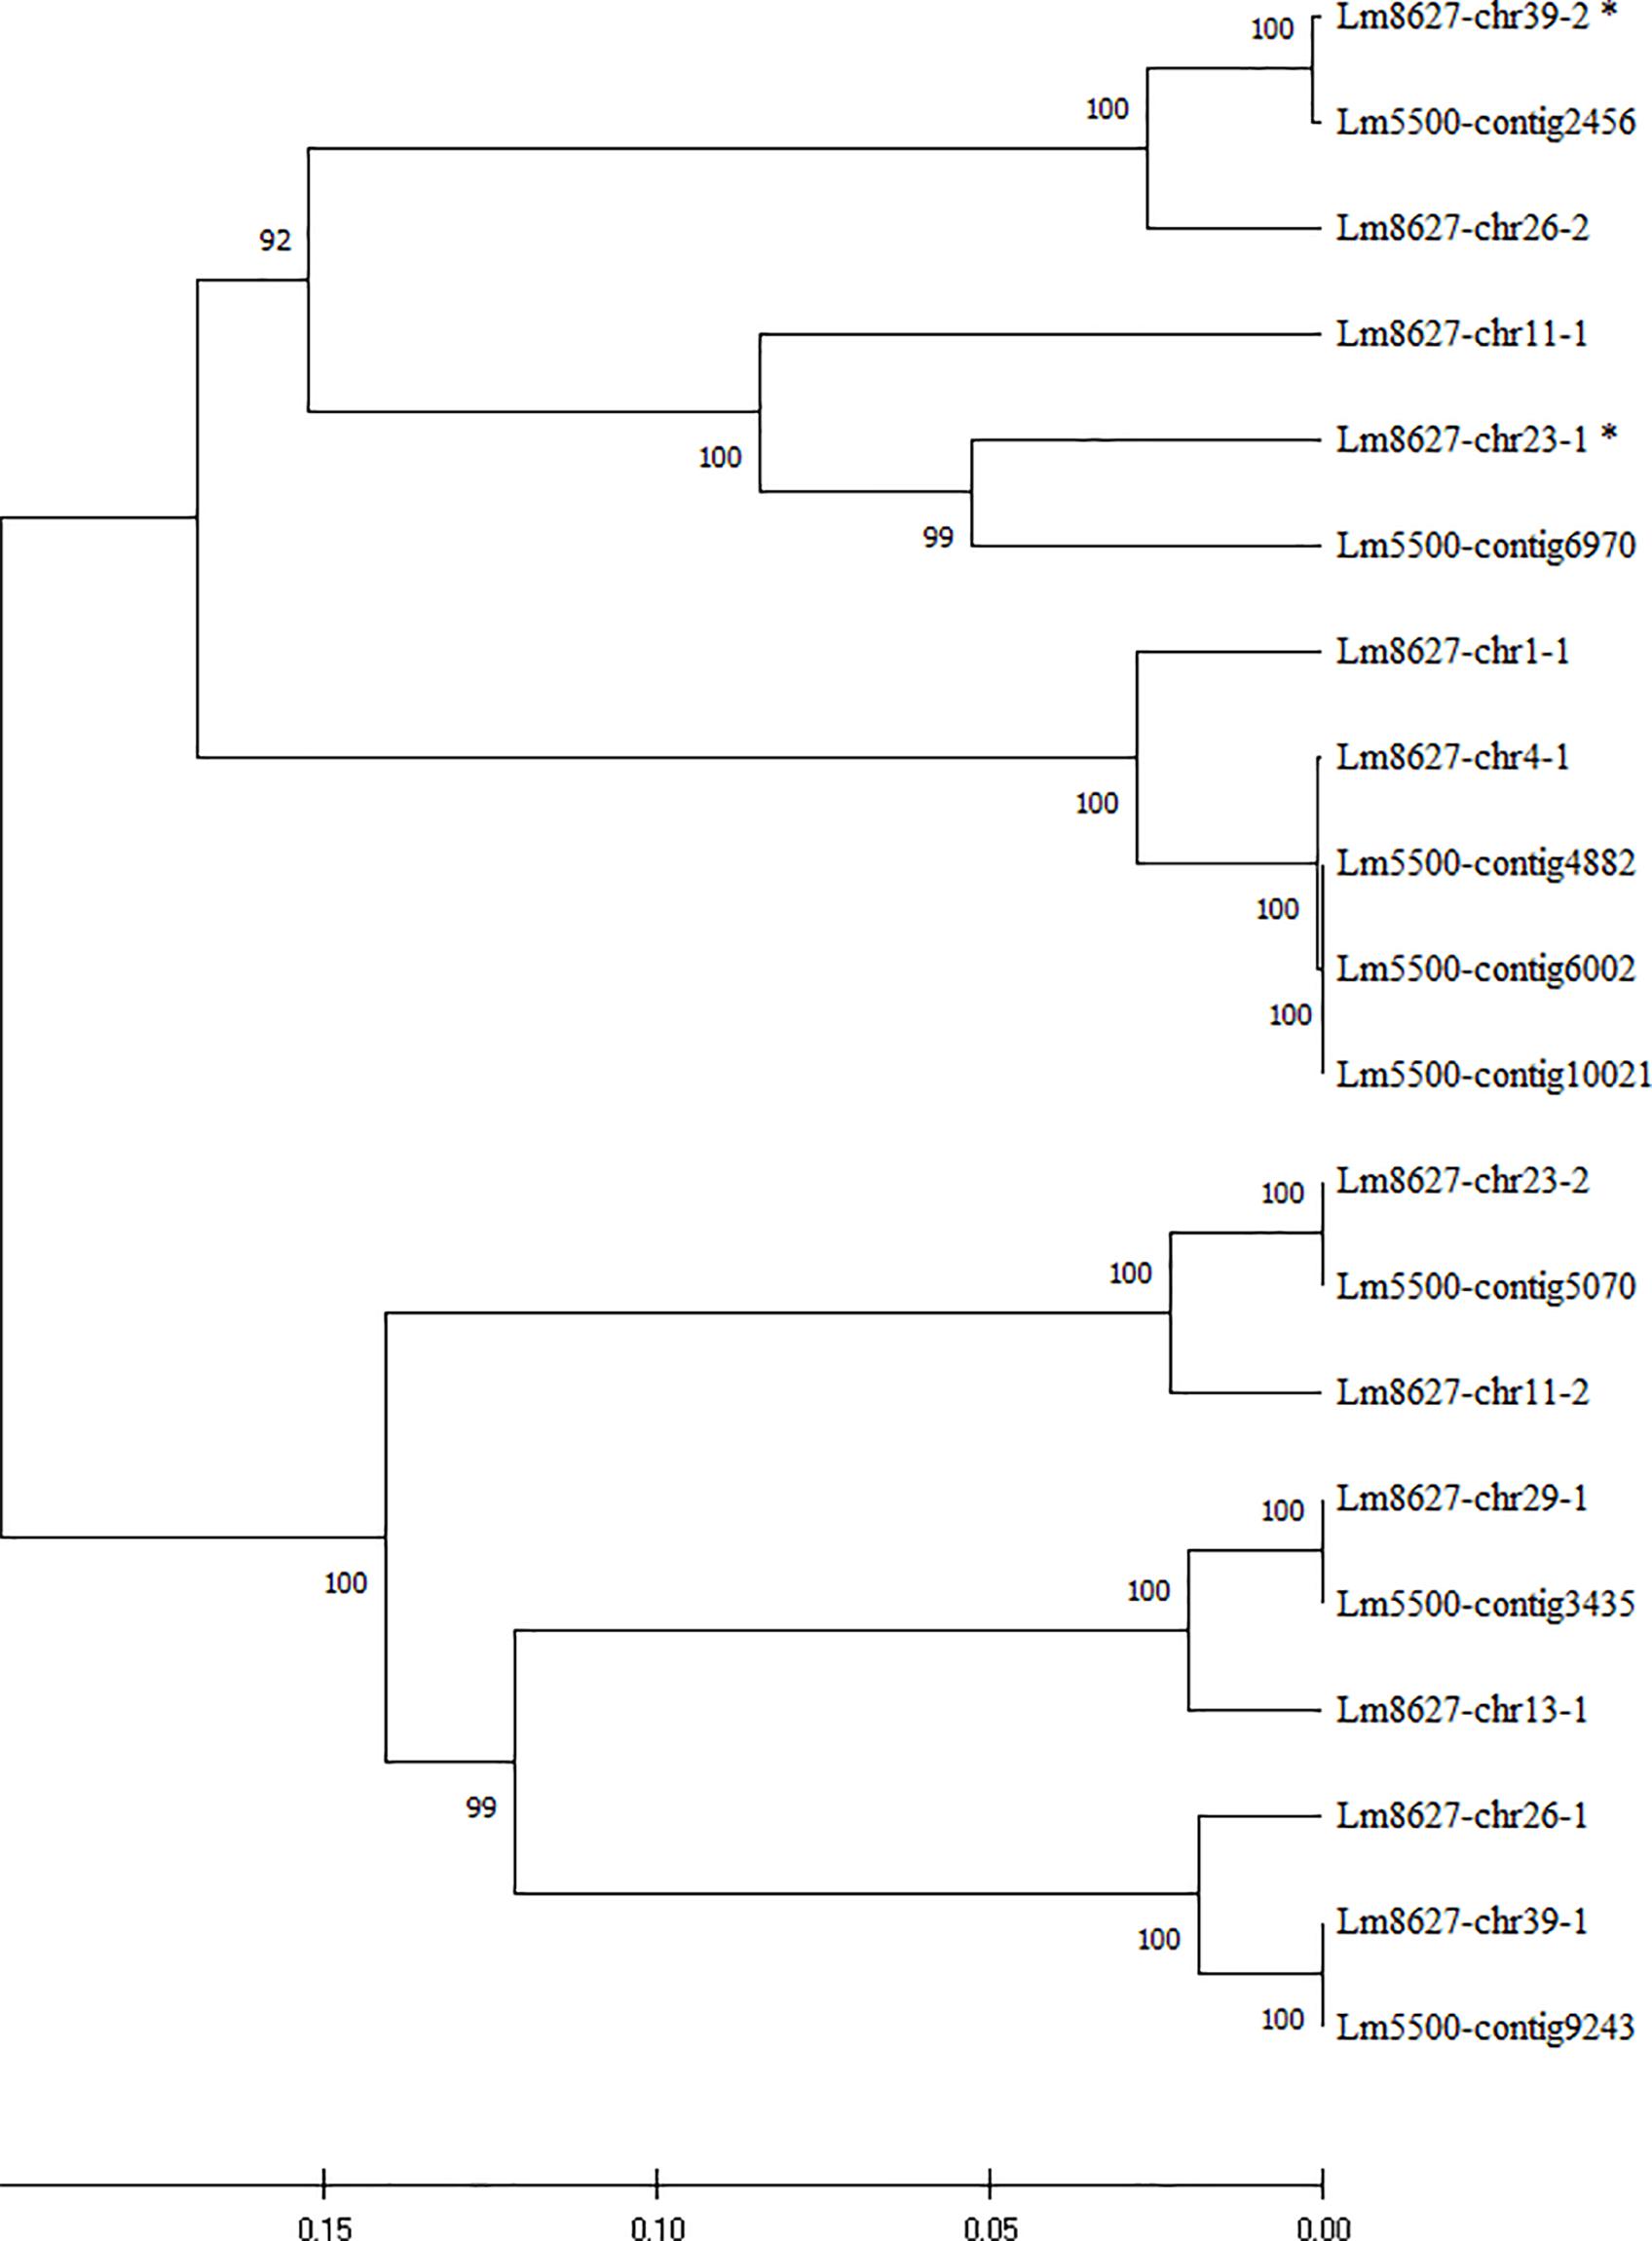
Figure 4. UPGMA tree of the sequence similarity among the β-tubulin genomic sequences of clones Lemna minor 8627 and L. minor 5500. Genes were named by the contig number in L. minor 5500 and by the chromosome location, followed by a serial number, for L. minor 8627. Bootstrap values are shown at the nodes of the tree. Asterisks indicate incomplete sequences.
Six gene clusters were identified (Figure 4), each including at least one β-tubulin gene sequence of L. minor 5500 and two sequences of L. minor 8627. Only in the cluster including sequences L. minor 8627-chr 4-1 and L. minor 8627-chr 1-1 were three corresponding identical sequences found in L. minor 5500 (contigs 4882, 6002, and 10021): this could be due either to a tandem duplication event in this clone or to a sequence misassembly. Interestingly, while a perfect pairwise matching was found between the six genes of L. minor 5500 (considering the three identical L. minor 5500 sequences as one) and a subset of six β-tubulin genes of L. minor 8627 (99–100% pairwise nucleotide identity), the remaining six genes were more distantly related (85.7–96% pairwise nucleotide identity). This finding suggests that two homoeologous genomic subsets are present in clone 8627, likely deriving from the hybridization of two closely related species, with L. minor as the donor of one of two subgenomes. This would also explain the positioning of clones 8627 and 5500 in two separate subclusters within the L. minor group.
This observation was extended to a genome-wide level by mapping the DNA sequencing data of L. minor 5500 against the two chromosome subsets identified in the L. minor 8627 genome. The rationale of this analysis was to detect mapping differences between chromosomes that are likely contributed by different parental species. On the basis of Figure 4, chromosomes 1, 11, 13, and 26 were assigned to one parent (subgenome A) and chromosomes 4, 23, 29, and 39 to the second parent, likely L. minor (subgenome B). The data presented in Table 3 clearly showed that, on average, the percentage of mapping of set B nearly doubled that of set A: i.e., 18.9 vs. 10.5%.
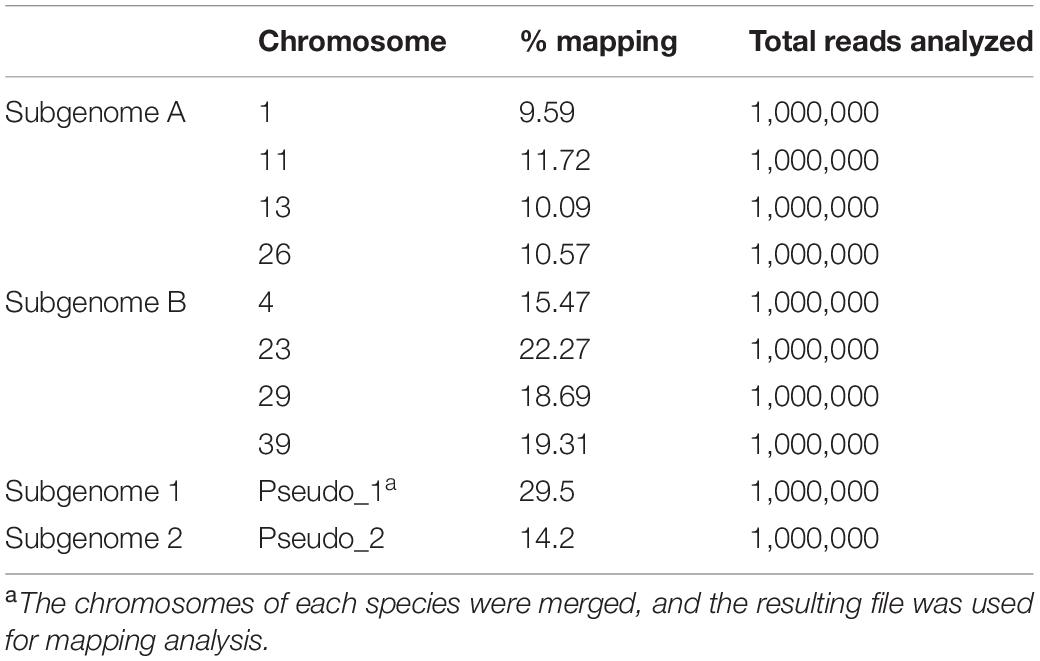
Table 3. Percentage of mapping of L. minor 5500 DNA sequencing data against the L. minor 8627 chromosomes.
The positioning of L. turionifera as a branch in L. minor-SC II by cluster analysis, indicative of a high number of CE-TBP common peaks, makes this species the most likely candidate as the donor of the complementary subgenome. In order to verify this possibility, we exploited TBP amplicons as chromosome markers once they were mapped to the chromosomes of L. minor 8627. We associated each CE-TBP peak to the corresponding β-tubulin locus by comparison of their size with the in silico size prediction. The same was done for clone L. minor 5500. As reported in Table 4, an almost precise correspondence was found for all TBP amplicons of both L. minor clones. Therefore, each peak could be assigned to the corresponding β-tubulin gene, and all predicted amplicons were identified in the TBP profiles.
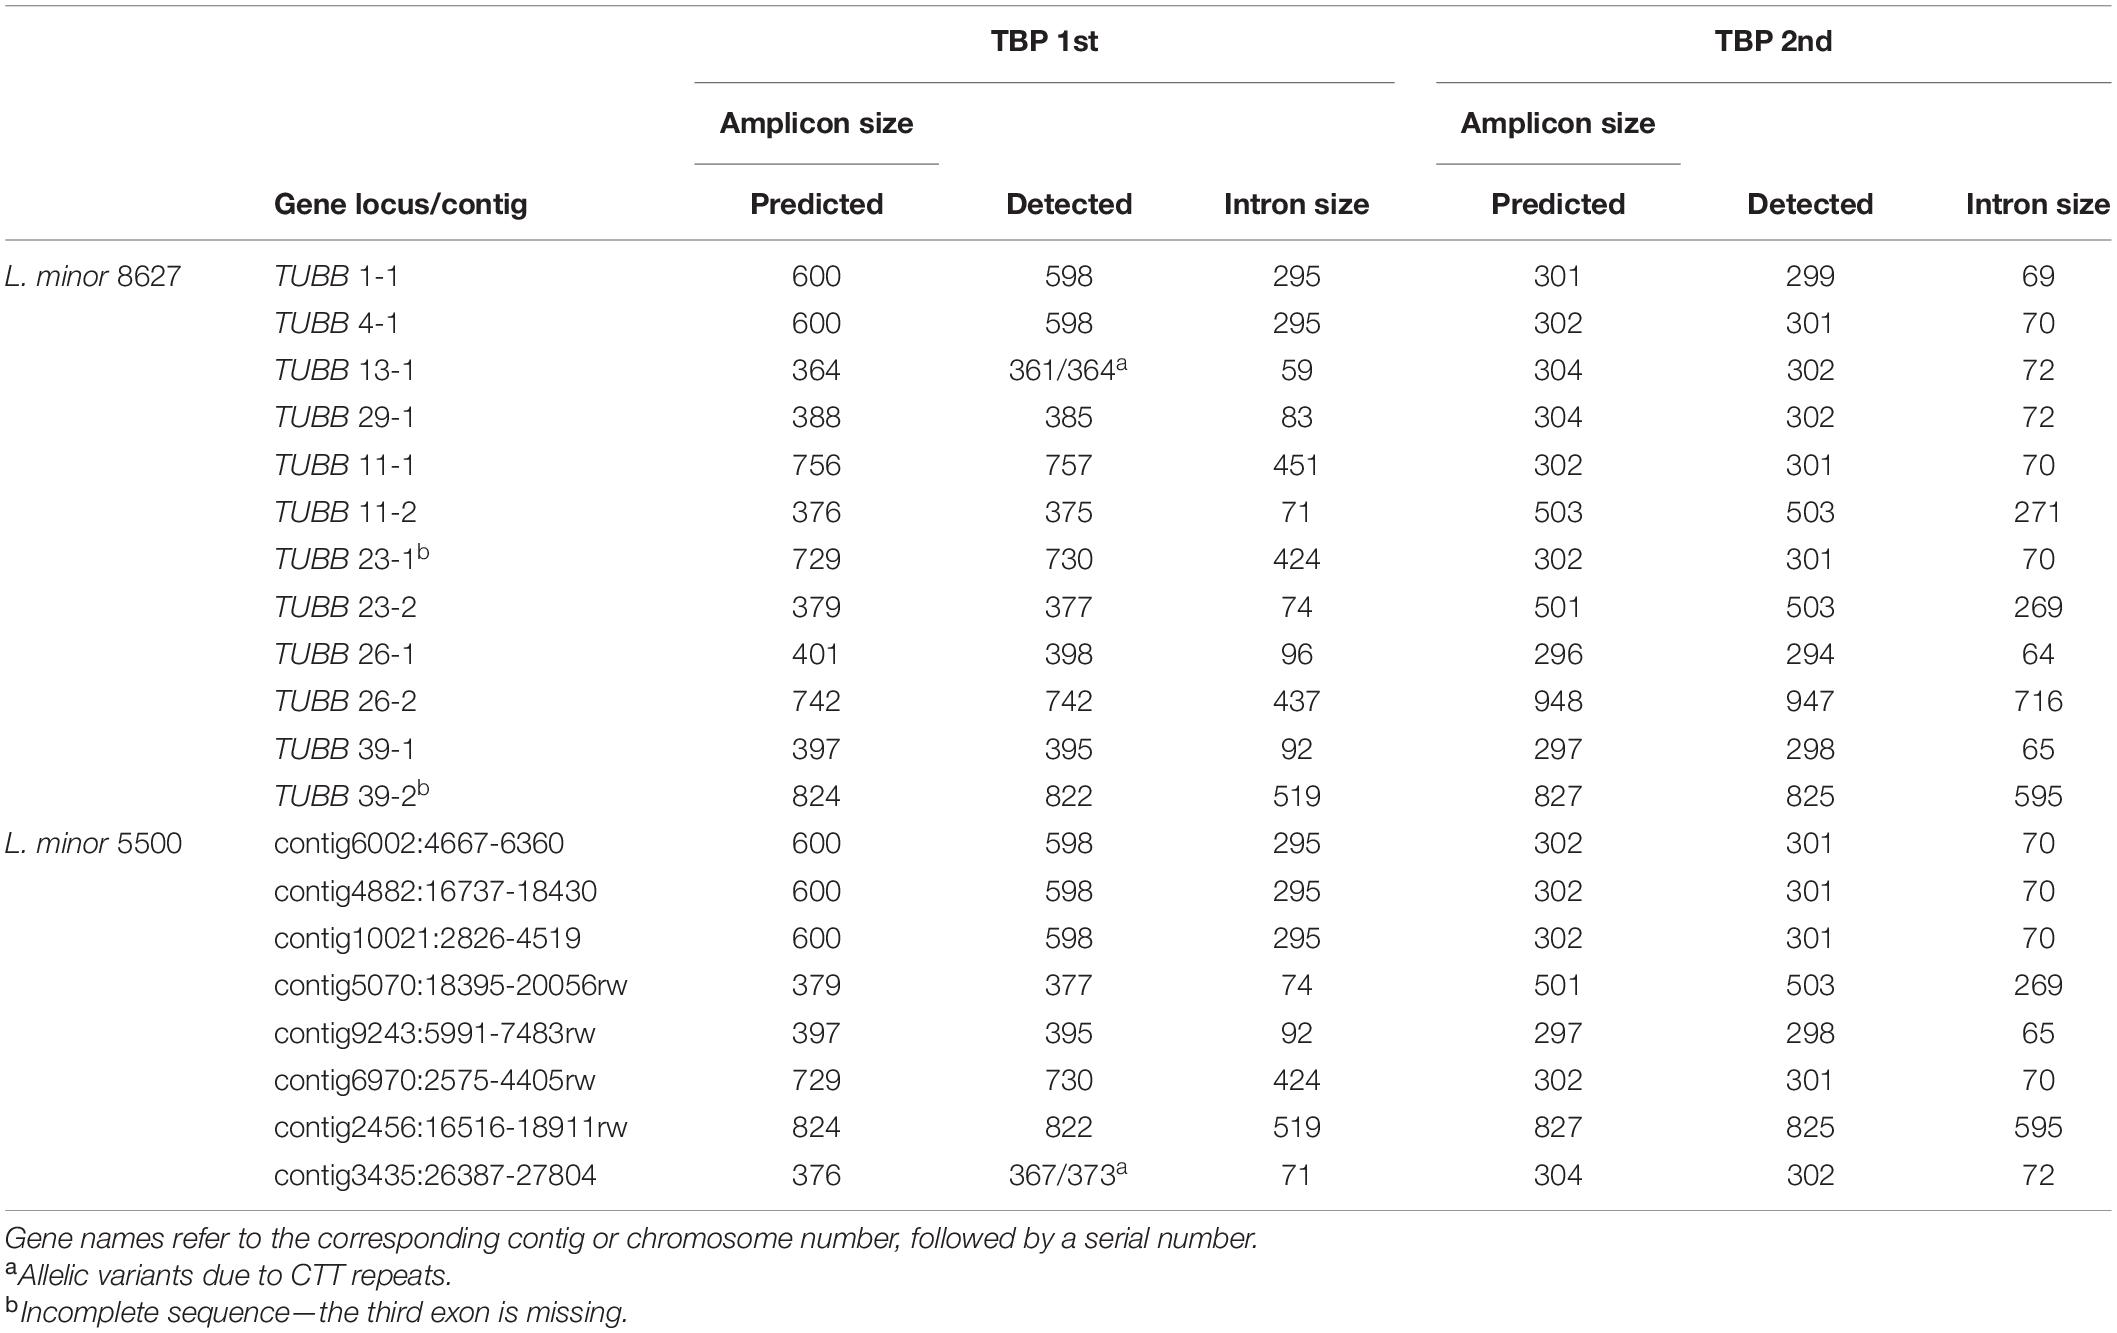
Table 4. Correspondence between capillary electrophoresis–tubulin-based polymorphism profiles and β-tubulin loci of L. minor clones 8627 and 5500.
Allelic TBP variants were only found for locus TUBB 13-1 and its ortholog in L. minor 5500. A comparison of the 1st intron TBP profile of L. minor 8627 with those of clones 9495 and 9434, taken as representatives for L. minor SC I and L. turionifera, respectively, showed that it was an almost perfect merge of the other two (Figure 5A), strongly supporting the hypothesis of interspecific hybridization. The subset of TBP amplicons mapping to L. minor 8627 chromosomes 23, 29, and 39 (subgenome B) was present in L. minor 9495, while markers of the complementary subset, chromosomes 11, 13, and 26 (subgenome A), were found in L. turionifera. The CE-TBP peak of 598 bp, which is monomorphic between the two subgenomes and could be assigned either to TUBB 4-1 or TUBB 1-1 (Table 4), was present in both putative parental genomes, indicated in the diagram near each TBP profile as AA (L. turionifera) and BB (L. minor-SC II). Peaks of 364 and 385 bp in L. minor 8627 and 367 bp in L. minor 9495 were interpreted as allelic variants of TUBB 29-1 but could also be assigned to the homoeologous locus TUBB 13-1. In fact, their highly similar intron sequence hosts a microsatellite sequence based on CTT tandem repeats as shown in the sequence alignment in Figure 5B. This did not allow the precise assignment of these TBP amplicons to one or the other locus. The 2nd intron TBP profile comparison was also in agreement with the above-mentioned conclusion (not shown).
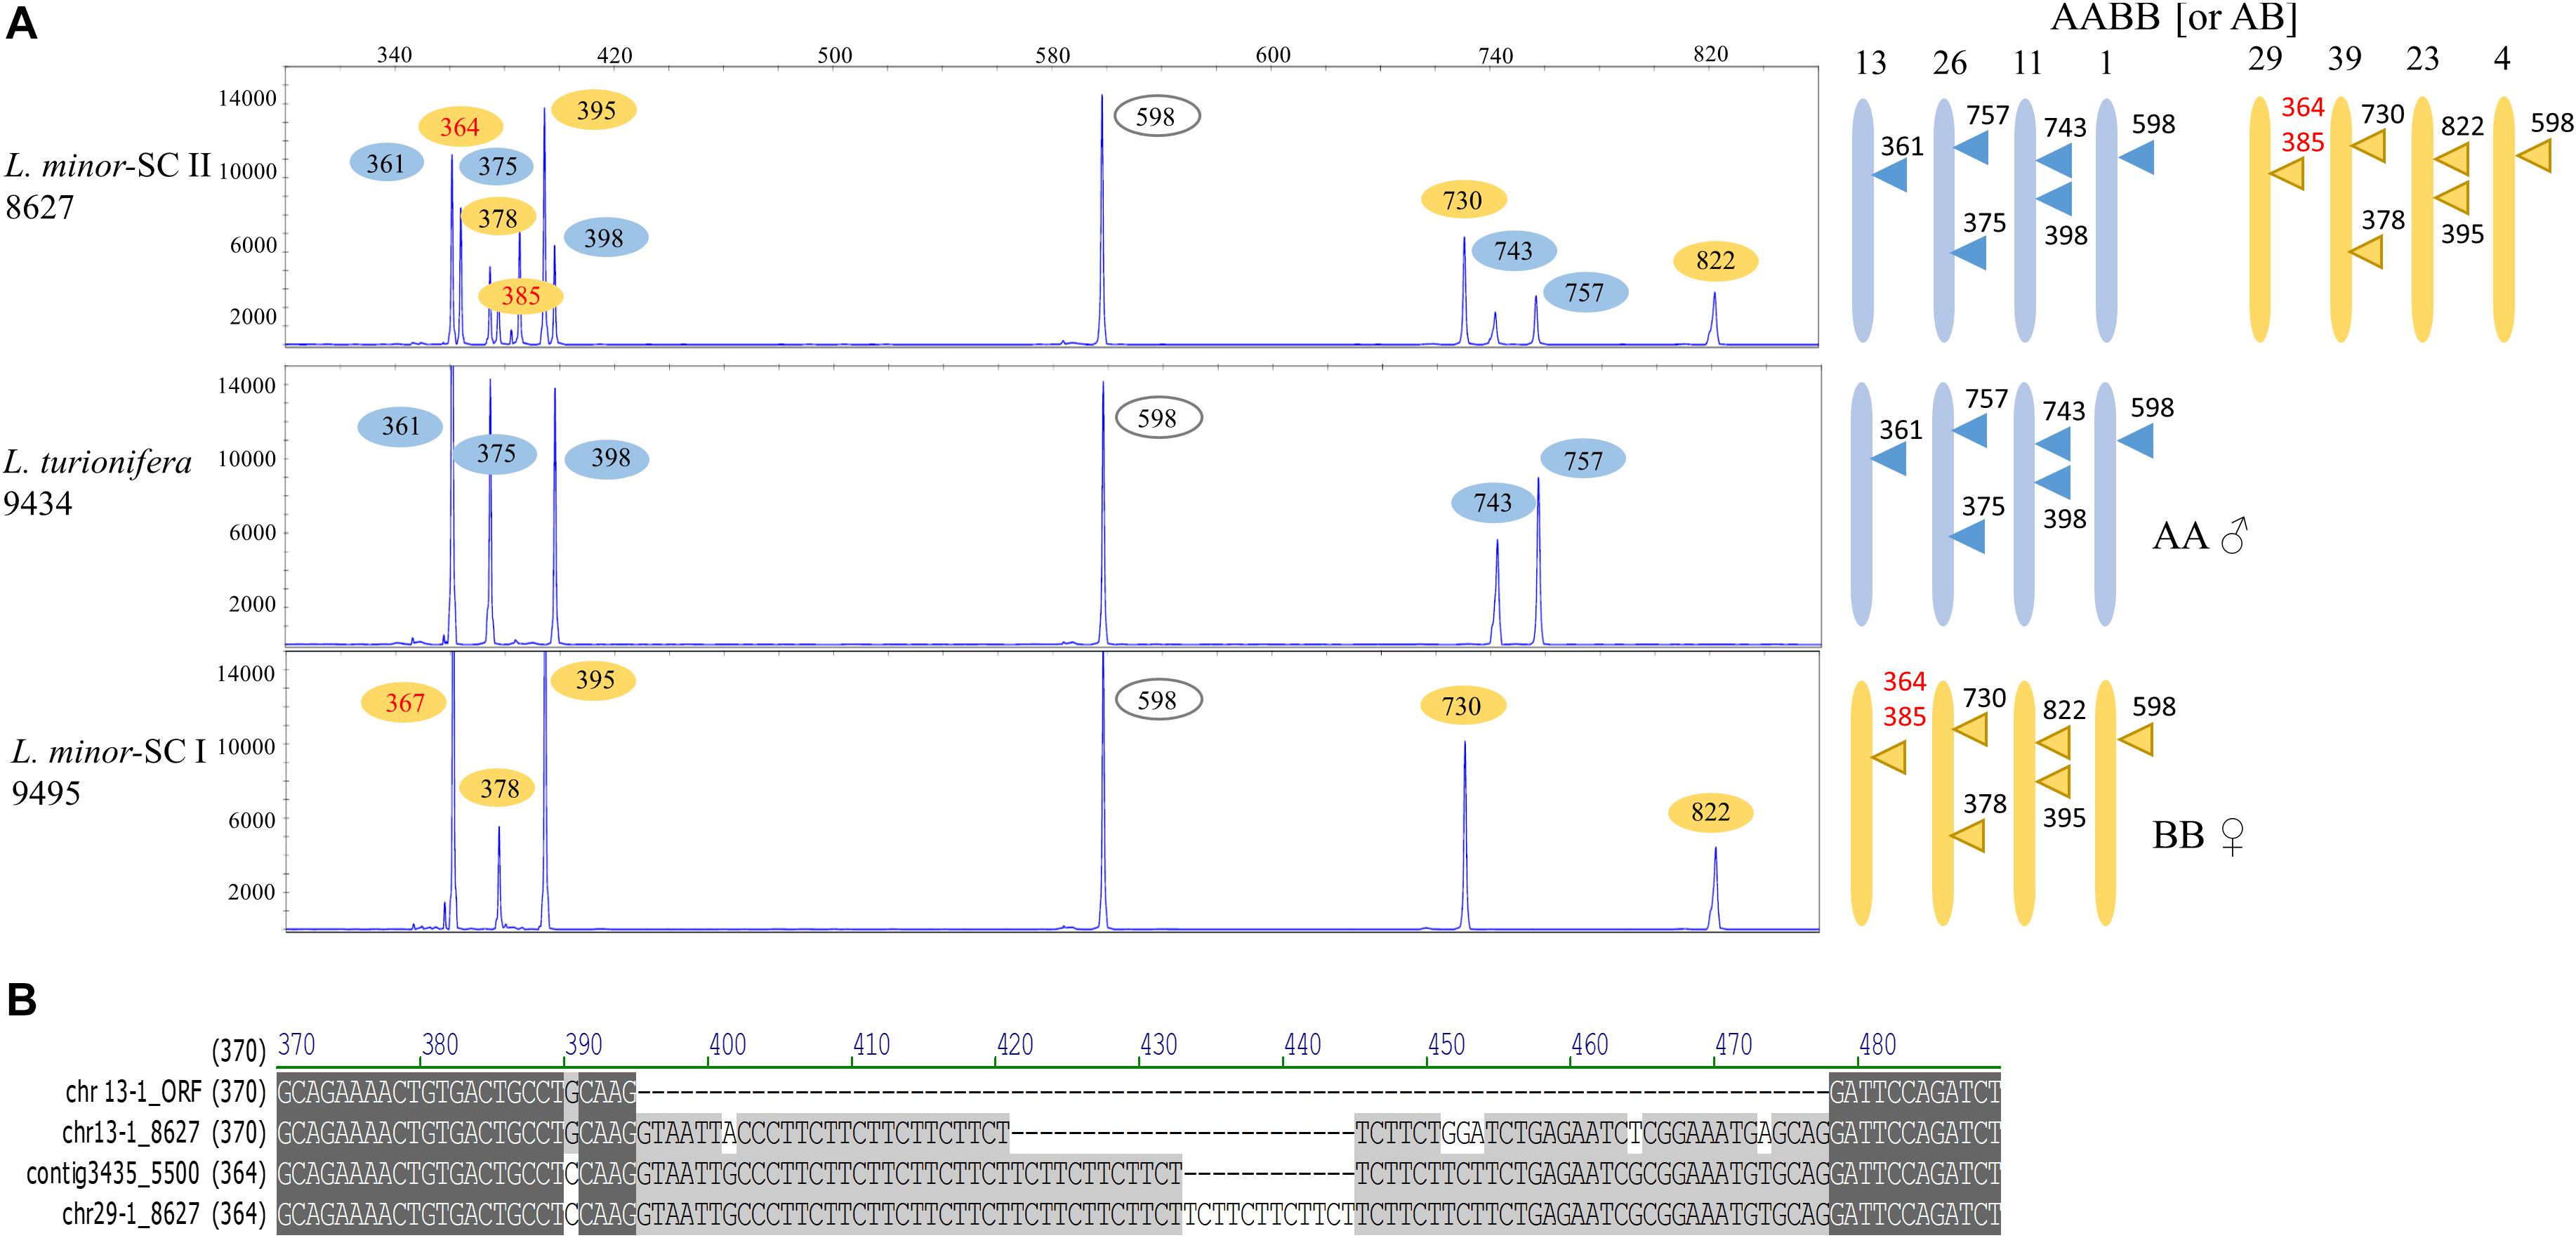
Figure 5. Reconstruction of the possible origin of Lemna minor 8627 by hybridization of Lemna turionifera and L. minor. (A) The 1st intron tubulin-based polymorphism (TBP) profiles of L. minor 8627 (SC II), L. turionifera 9434, and L. minor 9495 (SC I) are shown. The contribution of each putative donor genome is shown with different colors. In red, allelic variants of TUBB 4-1 and TUBB 1-1. Numbers on the chromosome diagrams indicate TBP amplicon length. (B) Sequence alignment of the β-tubulin TUBB 29-1 and TUBB 13-1 of L. minor 8627 with their L minor 5500 ortholog (contig Lm5500-3435), showing intron length variation due to simple sequence repeats. The TUBB 13-1 open reading frame is used for intron localization.
Since the sequence of the atpF-atpH plastid marker of L. minor 8627 matched those of L. minor/L. japonica rather than L. turionifera, L. minor was indicated as the maternal parent in the chromosome diagram. However, TBP analysis did not allow to conclude if L. minor 8627 could be an allotetraploid (AABB) or a homoploid hybrid (AB).
This result raised the question if the hybrid origin of L. minor 8627 from L. turionifera × L. minor breeding may also apply to all L. minor-SC II clones. Therefore, we used the TBP 1st intron profile of L. minor 8627 as a reference for the alignment of the TBP profiles of the 42 clones forming the L. minor cluster.
The raw numerical output of CE-TBP, indicating peak size and height, was converted into the simplified printout shown in Supplementary Table 4, in which each row corresponds to an accession, and each column corresponds to a specific amplicon size, whose presence is indicated by a symbol. Each amplicon was assigned to its putative locus based on fragment length calculation as reported in Table 4. Allelic length variants found among clones were tentatively assigned to the most probable locus by their length, also considering that one- to three-nucleotide-length variations were most likely due to the variable lengths of SSR that were present within intron sequences. Such SSR may produce a high number of allelic variants as in the case of TUBB 13-1 and TUBB 29-1, which showed a wide range of amplicons from 358 to 416 nucleotides in length, scattered by three nucleotides. Clones belonging to L. minor-SC II (excluding the L. turionifera subset) were characterized by a higher average number of amplicons than those of L. minor-SC I (10–13 vs. six to nine amplicons; last column in Supplementary Table 4). In fact, all clones showed amplicons corresponding to each of the β-tubulin loci of clone 8627 in accordance to their possible hybrid origin: those mapping at chromosomes 11 and 26 were shared with the three L. turionifera clones, 9434, 8693, and BOG0006, and those mapping at chromosomes 23 and 39 were shared with L. minor-SC I. Amplicons corresponding to loci on chromosomes 1 and 4, 13 and 29, could not be clearly assigned since they were either monomorphic across the three groups or highly polymorphic with overlapping length alleles.
Although not conclusive, these findings support the hypothesis that, similarly to clone 8627, all the clones in L. minor-SC II could be the result of interspecific hybridization between L. turionifera and L. minor.
Single Tubulin Amplification
In order to exclude that peak attribution to β-tubulin loci exclusively based on amplicon length was fortuitous, we designed a primer pair specific for the exon–intron borders of the two putative β-tubulin homoeologs TUBB 11-1 and TUBB 23-1 of L. minor 8627, producing amplified fragments of 463 and 436 nucleotides, respectively. As shown in Figure 6, PCR amplification of all clones of the L. minor cluster revealed the presence of two distinct amplicons of expected length. The larger in size (amplicon A) was observed in the three investigated clones of L. turionifera, whereas the lower in size (amplicon B) was detected in all L. minor-SC I clones. As expected from their possible hybrid nature, all L. minor-SC II clones possessed both amplicons visible as a doublet in Figure 6. No amplification was found in two L. gibba clones, used as a control, suggesting a lesser degree of homology in the primer region. The amplification products of the three L. turionifera clones and three clones of both L. minor-SC II (9017, 9481, and 9530) and L. minor-SC I (7753, KJA0013, and 7022) were sequenced. Sequence analysis confirmed that amplicon A in the putative hybrids and that in L. turionifera have the same sequence of TUBB 11-1 of L. minor 8627 (overall identity 99% identity), while amplicon B was identical in sequence to those of L. minor SC I clones, to L. minor 8627 TUBB 23-1, and to its ortholog in L. minor 5500. Tubulin intron sequences are reported in the Supplementary Data text file.

Figure 6. PCR amplification of all clones of the Lemna minor group with primers TUBB 23-11-1. From left to right: Lemna turionifera: 9434, BOG0006, 9530; L. minor-SC I: LM0010, LM0011, 8744, 5500, 7766, 9536, 8623, 7753, 7194, 8292, 7022, 9495, 9252, 9441, KJA0013, LM0008, 7210, 9533; L. minor-SC II: 8627, 8676, 8695, 9017, 9257, 9283, LM0005, LM0004, 9436b, 9580, LM0006, 9481, LM0007, 9437, KJA0017, KJA0016, 9355, 9440, 8389, 8625; Lemna gibba: 7796 and 7742a. The A and B arrows indicate the L. turionifera and L. minor bands, respectively. A molecular weight size marker (M) is reported on the left.
AFLP Analysis
To further confirm the hybrid nature of the L. minor-SC II group, an AFLP approach was used in order to provide genetic information at a genome-wide level rather than limited to a single gene family. Assuming that the L. minor-SC II group originated from hybridization between L. minor-SC I and L. turionifera, one would expect to detect a greater number of AFLP markers in the L. minor-SC II group when compared to the others and a low level of genetic diversity between the L. minor-SC II group and their putative parents.
Ten AFLP PCs were used to analyze the genomic DNA of the nine Lemna clones selected for sequencing of the TUBB 11-1/TUBB 23-1 loci and two L. gibba clones (7796 and 7742a). An average of 162 markers/PC was detected (Table 5). The estimated percentage of polymorphism of 99.98 highlighted the efficiency of the selected PCs for the fingerprinting of the selected group of species.
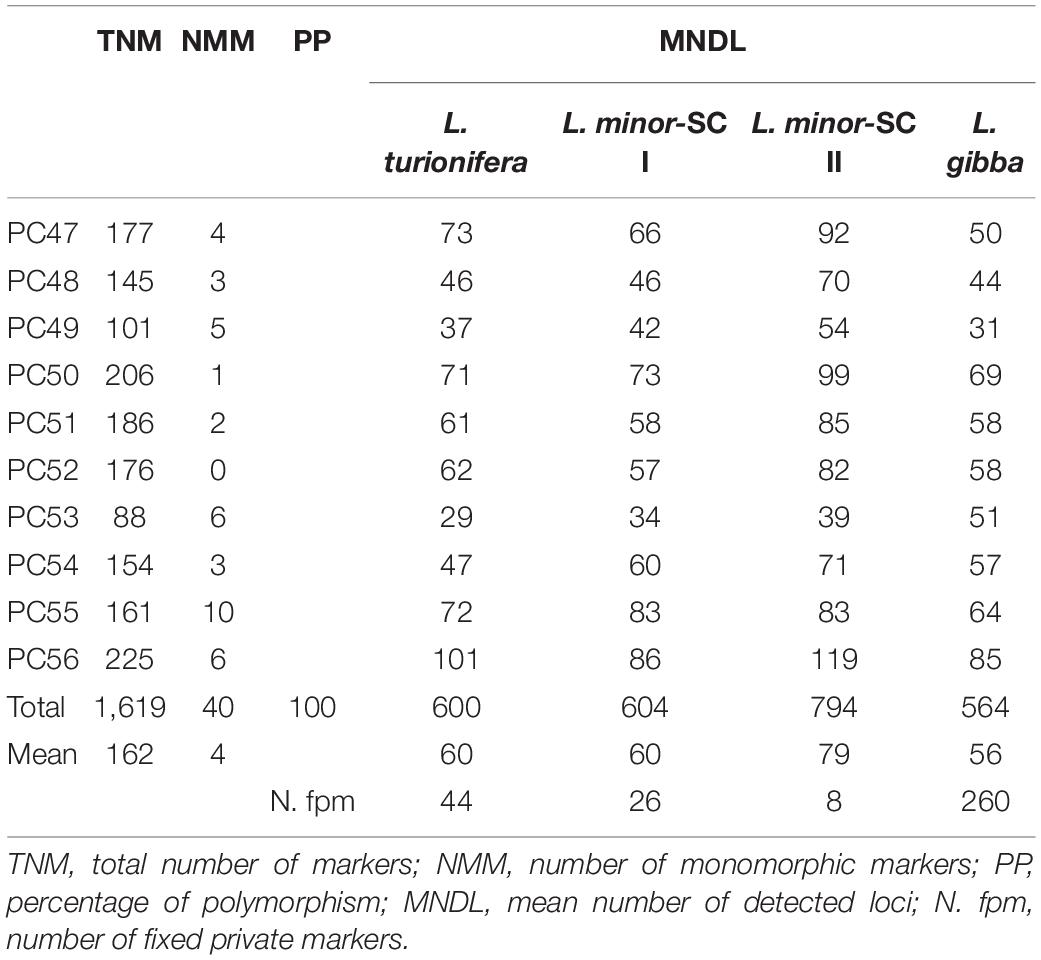
Table 5. Amplification and polymorphism information of 10 amplified fragment length polymorphism primer pairs.
In agreement with our hypothesis, referring to the mean number of detected loci for each group of clones (Table 5), the AFLP output revealed an increase of 31, 32, and 41% in the L. minor-SC II group when compared to the L. minor-SC I, L. turionifera, and L. gibba groups, respectively. In addition, the number of fixed private markers calculated for each group (Table 5) strongly supports the presence of a hybrid profile for the L. minor-SC II group. In this group, the limited number of exclusive markers recorded, only eight, is due to the high percentage of markers mutually shared with the groups L. minor-SC I and L. turionifera. Conversely, the highest number of exclusive markers was detected in the L. gibba group, as expected.
The estimation of the Dice’s pairwise genetic distance among groups provided a further element of comparison. As reported in Table 6, the highest average values of genetic similarity were recorded comparing L. minor-SC II to both L. minor-SC I (0.5867) and L. turionifera (0.6568) groups, suggesting the presence of shared AFLP patterns. These data further corroborate the hypothesis of a hybrid origin for the L. minor-SC II group, which exhibits AFLP patterns sharing markers almost exclusively with the aforementioned groups. Conversely, the lowest values were estimated by comparing L. gibba to the other species.
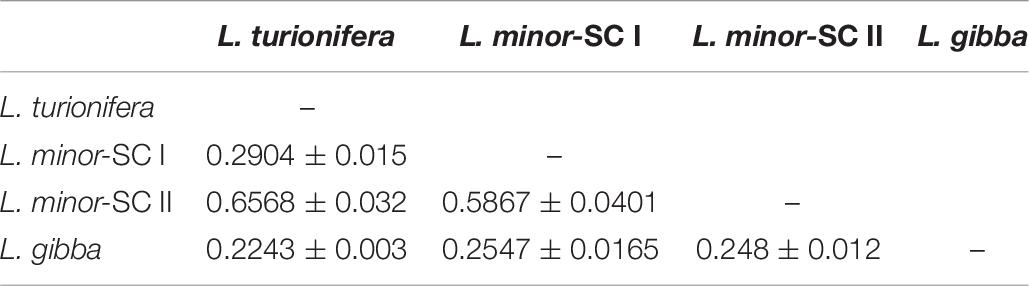
Table 6. Mean Dice’s pairwise genetic distances estimated by the comparison of the four groups of clones.
All our data are in perfect agreement with the conclusion that all clones in L. minor-SC II, also including L. japonica, are interspecific hybrids belonging to the larger group of L. minor sensu lato, while only clones in L. minor-SC I can be considered as L. minor sensu stricto. Re-classified and newly classified clones in stock collections were therefore renamed according to this conclusion.
Discussion
Species Delimitation by TBP
The successful testing of the molecular marker TBP for its capability of fingerprinting duckweed DNA for species discrimination was reported in the present study, conducted on a quite large number of duckweed clones of all species of the three genera Spirodela, Landoltia, and Lemna.
Tubulin-based polymorphism results, extensively validated by atpF-atpH barcoding, supported the classification of some new clones and the reclassification of some others from existing clone collections. Most species (10 out of 15) could be easily identified “at a glance” upon separation of PCR fragments on agarose gel, including L. gibba, easily mistaken for L. minor when gibbosity is not developed (De Lange and Westinga, 1979), or the invasive species L. minuta from the European native L. minor (Ceschin et al., 2016b). The use of a second primer pair (2nd intron TBP) provided an almost clear delineation of all species by cluster analysis, which was consistent with the morphological classification of clones and accepted relationships among closely related species as determined by AFLP fingerprinting or barcoding by sequence markers (Bog et al., 2010; Borisjuk et al., 2015; Tippery et al., 2015). Section delimitation was clear with the exception of Lemna that does not form a supported cluster and could not be separated from the other sections. Relationships between species within this section and between sections showed low bootstrap values, which were likely due to the limited number of shared markers and to the high number of intraspecific allelic variants.
Interspecific Hybrids
The main problem in species delimitation is that TBP, as is the case with plastid markers, also looks unable to distinguish clones of L. minor from L. japonica which are intermingled in the same cluster, unless a different paradigm is applied, namely, that the separation of L. minor s.l. in two subclusters reflects the actual separation of the two species. Such separation has also supported the evidence that Lemna minor-SC I is characterized by a reduced number of TBP and AFLP loci per clone and by homozygosis of the B allele at the TUBB 23-1/11-1 locus. More easily identified by morphological traits and almost homogeneous, this group likely corresponds to L. minor sensu stricto. In fact, just one spurious clone, L. japonica 9252, here reclassified as L. minor by morphology, was present in this group.
Conversely, all clones in L. minor-SC II, despite their mixed classification as L. japonica or L. minor, display a higher number of TBP and AFLP loci, sharing approximately half of them with both L. minor-SC-I and L. turionifera, and are also heterozygous at the TUBB 23-1/11-1 locus. Sequence analysis confirmed that the two TUBB 23-1/11-1 alleles originated from L. minor (allele B) and L. turionifera (allele A), respectively. The L. turionifera group, branching from cluster SC II, possesses TBP alleles that are not found in any of the SC-I clones (Supplementary Table 4 and Figure 5) and is homozygous for the A allele at the TUBB 23-1/11-1 locus (Figure 6).
All these data are in agreement with the interpretation that clones in L. minor-SC II (L. minor sensu lato) are interspecific hybrids of L. minor × L. turionifera, thus representing a genetically different population from L. minor sensu stricto. If interspecific hybridization is an unlike occurrence in plants rarely flowering as duckweeds, such an event has a high chance of originating a new species, thanks to the rapid fixation of the newly generated chromosome set by fast vegetative propagation.
This finding also poses a question about the true identity of L. japonica. A possible interesting explanation is that this species, whose discrimination from L. minor is known to be particularly challenging by morphology and even by plastid barcoding, is an interspecific hybrid coinciding with the SC II group. This was, in fact, the original suspect of E. Landolt, who first described L. japonica as a species in 1980, suggesting its possible origin through hybridization of L. minor and L. turionifera on the basis of some intermediate morphologic characteristics (Landolt, 1980). However, attempts to cross L. minor and L. turionifera have never been successful (Landolt, 1986). Later, the hybrid hypothesis found contrasting supports from allozyme studies (Hirahaya and Kadono, 1995; Les et al., 2002), leaving this as an open question. However, such interpretation could explain the variable and overlapping morphological traits of clones in SC-II, some of which have been alternatively classified as L. minor or L. japonica and also as L. turionifera (clone 9530) by Landolt himself. For instance, clone 8767, recorded as L. minor, was lately reclassified by Landolt into L. japonica (personal communication to KA). Therefore, it should not be surprising that many clones in this group could have been mistakenly classified as L. minor, including the fully sequenced clone 8627, and should now be re-classified as L. japonica. According to the hybrid hypothesis, the maternal inheritance of plastids clearly explains the impossibility to discriminate L. minor from L. japonica by plastid markers (Borisjuk et al., 2015), while nuclear DNA investigation by AFLP (Bog et al., 2010; present paper) and genotyping by sequencing (Bog et al., 2020b) provided separation for the two species.
The karyotype of such hybrids remains an open question, which cannot be answered by TBP analysis. Although codominant, this marker cannot distinguish between an interspecific homoploid hybrid and an allotetraploid, unless more than two alleles are identified for the same locus within one clone.
Whole genome duplication by unreduced gamete production is a quite common consequence of interspecific hybridization in plants and the main mechanism to produce fertile hybrids, eventually leading to sympatric speciation (Rodionov et al., 2019). However, the preferred vegetative propagation of duckweeds makes fertility not a compelling requirement for speciation. By citing Elias Landolt on the subject of interspecific Lemna hybrids (1975): “if hybrids occur, they might become stabilized through vegetative reproduction and contribute in this way to some intergradation between certain species.” Whether L. japonica is sterile is not proven, but while flowering is known to occur rarely in both L. minor and L. turionifera and also in L. japonica, fruit setting was never observed in the last species (Bog et al., 2020a), although further investigation is required. Clone sterility would speak in favor of homoploidy of the hybrid.
An alternative possibility is that SC II is a heterogeneous cluster, likely characterized by different karyotypes, and the species described by Landolt as L. japonica corresponds to a subpopulation of such hybrids. In fact, it is possible that an original hybridization event was followed by different genomic rearrangements/polyploidization events that became stabilized in different lineages, possibly followed by further crosses or backcrosses, thus originating a reticulate evolution network quite complex to unravel. The existence of more than one original hybridization events, although unlikely, is also conceivable. Although conducted on a limited number of clones, our AFLP data using 10 primer combinations also revealed heterogeneity in the number of markers among SC II clones (not shown), which warrants further investigation.
Further genetic analyses are therefore needed to definitely characterize the genetic diversity and the population structure of the complex L. minor/L. japonica group and answer the open questions that have arisen from this work. Karyotyping analysis, in combination with whole genome sequencing of L. turionifera and other clones of L. minor-SC II, including L. japonica, could provide a conclusive response about the identity of L. japonica, thus confirming the discriminating power of TBP. More generally, the existence of interspecific hybrids in duckweeds has been postulated several times to explain some intermediate phenotypes found in the genus Lemna (Kandeler, 1975) or unresolved species delimitation by molecular markers, as in the case of Wolffiella (Bog et al., 2018).
Clone Identification
Physiological and biochemical intraspecific variability, likely reflecting genetic diversity among clones of the same species, has been widely reported in duckweeds (Appenroth et al., 2013). However, most of the tested molecular markers seem to fail in providing an effective distinction at the clone level (Bog et al., 2019). One possible method capable of addressing this issue was recently presented by Chu et al. (2018), using the highly polymorphic regions of NBARC-related genes (nuclear-binding leucine-rich repeat protein) as markers. These authors were successful even in the case of S. polyrhiza, a species with very low genetic variations. However, this method, as well as inter-simple sequence repeat markers (ISSRs) or SSR markers, requires deep knowledge of the genome of each investigated species (Bog et al., 2019).
Thanks to the high resolution power of capillary electrophoresis, TBP was also able to highlight intraspecific variability in some species, mainly provided by the presence of SSR and short InDels in some β-tubulin introns. This was the case of the 18 L. minor clones in SC I, each showing a unique TBP profile. Analysis of higher numbers of clones is needed to ascertain the possibility of clone identification in other species, i.e., in largely heterogeneous species such as L. gibba or L. aequinoctialis.
Conclusion
In conclusion, we believe that TBP analysis can be a simple and promising approach for species delimitation in the genus Lemna and to investigate similar cases of suspect hybridization in the duckweed family, thus contributing to elucidating duckweed speciation mechanisms. In contrast to barcoding using plastid atpF-atpH and psbK-psbI (Borisjuk et al., 2015), TBP provided a 100% score of correct identification until now, without any limit of PCR efficiency and without need for sequencing. The TBP marker can be considered a valid support to morphological analysis in many of those cases in which any previous classification is doubtful and could only be solved by further time-consuming investigations including flowering induction, turion forming ability, or other physiological or metabolic analysis (Les et al., 1997). It could also be adopted as a routine analysis to prevent clone exchange or cross-contaminations in large collections or in open-air cultivations, at least for the three investigated genera. A further application of the method to the remaining genera of Lemnaceae, Wolffiella and Wolffia, is ongoing.
Data Availability Statement
The original contributions presented in the study are included in the article/Supplementary Material, further inquiries can be directed to the corresponding author/s.
Author Contributions
LM, LB, and ML contributed to the conception and design of the study. ML, MB, and KA provided the clones. AG propagated plant material and extracted DNA. LB, ML, FG, and MB performed the experiments. LB, ML, and MB analyzed the TBP data and performed bioinformatic and statistical analysis. LM, LB, and KA collected and interpreted the data. DB and ML provided financial support. DB provided effective supervision. LM wrote the first draft of the manuscript. All authors contributed to the article and approved the submitted version.
Funding
This study was funded by the CNR Project “Economia Circolare (Green and Circular Economy—GECE)”, Italian Ministry of Research and University (MIUR), and Project DUCKTECH, CARIPLO Foundation.
Conflict of Interest
The authors declare that the research was conducted in the absence of any commercial or financial relationships that could be construed as a potential conflict of interest.
Supplementary Material
The Supplementary Material for this article can be found online at: https://www.frontiersin.org/articles/10.3389/fpls.2021.625670/full#supplementary-material
Supplementary Table 1 | List of oligonucleotides used for amplified fragment length polymorphism analysis.
Supplementary Table 2 | Capillary electrophoresis–tubulin-based polymorphism data (1st and 2nd intron) from Spirodela polyrhiza, Spirodela intermedia, and Landoltia punctata clones.
Supplementary Table 3 | Capillary electrophoresis–tubulin-based polymorphism data (1st and 2nd intron) from 76 clones representative of the 12 Lemna species.
Supplementary Table 4 | Schematic representation of the first intron capillary electrophoresis–tubulin-based polymorphism profiles of all clones of the L. minor cluster.
Supplementary Data | Plastid barcoding sequences and genomic sequences of the TUBB 11-1 and TUBB 23-1 introns.
Footnotes
References
Appenroth, K. J., Borisjuk, N., and Lam, E. (2013). Telling duckweed apart: genotyping technologies for Lemnaceae. Chin. J. Appl. Environ. Biol. 19, 1–10. doi: 10.3724/SP.J.1145.2013.00001
Appenroth, K. J., Sree, K. S., Böhm, V., Hammann, S., Vetter, W., Leiterer, M., et al. (2017). Nutritional value of duckweeds (Lemnaceae) as human food. Food Chem. 217, 266–273. doi: 10.1016/j.foodchem.2016.08.116
Bardini, M., Lee, D., Donini, P., Mariani, A., Giani, S., Toschi, M., et al. (2004). Tubulin based polymorphism (TBP): a new tool, based on functionally relevant sequences, to assess genetic diversity in plant species. Genome 47, 281–291. doi: 10.1139/g03-132
Bog, M., Appenroth, K. J., and Sree, K. S. (2019). Duckweed (Lemnaceae): Its Molecular Taxonomy. Front. Sustain. Food Syst. 3:117. doi: 10.3389/fsufs.2019.00117
Bog, M., Baumbach, H., Schween, U., Hellwig, F., Landolt, E., and Appenroth, K. J. (2010). Genetic structure of the genus Lemna L. (Lemnaceae) as revealed by amplified fragment length polymorphism. Planta 232, 609–619. doi: 10.1007/s00425-010-1201-2
Bog, M., Appenroth, K. J., and Sree Sowjanya, K. (2020a). Key to the determination of taxa within the family of Lemnaceae: an update. Nord. J. Bot. 38, 1–12. doi: 10.1111/njb.02658
Bog, M., Himmelbach, A., Brandt, R., Wagner, F., and Appenroth, K. J. (2020b). “Genotyping-By-Sequencing for species delimitation in Lemna section Uninerves Hegelm. (Lemnaceae),” in The Duckweed Genomes, eds X. H. Cao, P. Fourounjian, and W. Wang (Berlin: Springer), 115–123. doi: 10.1007/978-3-030-11045-1_11
Bog, M., Sree, K. S., Fuchs, J., Hoang, P. T. N., Schubert, I., Kuever, J., et al. (2020c). A taxonomic revision of Lemna sect. Uninerves (Lemnaceae). Taxon 69, 56–66. doi: 10.1002/tax.12188
Bog, M., Landrock, M. F., Drefahl, D., Sree, K. S., and Appenroth, K. J. (2018). Fingerprinting by amplified fragment length polymorphism (AFLP) and barcoding by three plastidic markers in the genus Wolffiella Hegelm. Plant Syst. Evol. 304, 373–386. doi: 10.1007/s00606-017-1482-z
Borisjuk, N., Chu, P., Gutierrez, R., Zhang, H., Acosta, K., Friesen, N., et al. (2015). Assessment, validation and deployment strategy of a two barcode protocols for facile genotyping of duckweed species. Plant Biol. 17, 42–49. doi: 10.1111/plb.12229
Braglia, L., Gavazzi, F., Giovannini, A., Nicoletti, F., De Benedetti, L., and Breviario, D. (2014). TBP-assisted species and hybrid identification in the genus Passiflora. Mol. Breed. 33, 209–219. doi: 10.1007/s11032-013-9945-6
Braglia, L., Gavazzi, F., Morello, L., Gianì, S., Nick, P., and Breviario, D. (2020). On the applicability of the Tubulin-Based Polymorphism (TBP) genotyping method: a comprehensive guide illustrated through the application on different genetic resources in the legume family. Plant Methods 16, 86. doi: 10.1186/s13007-020-00627-z
Braglia, L., Manca, A., Gianì, S., Hatzopoulos, P., and Breviario, D. (2017). A simplified approach for olive (Olea europaea L.) genotyping and cultivars traceability. Am. J. Plant Sci. 8, 3475–3489. doi: 10.4236/ajps.2017.813234
Breviario, D., Gianì, S., and Morello, L. (2013). Multiple tubulins: evolutionary aspects and biological implications. Plant J. 75, 202–218. doi: 10.1111/tpj.12243
Ceschin, S., Abati, S., Leacche, I., Iamonico, D., Iberite, M., and Zuccarello, V. (2016a). Does the alien L. minuta show an invasive behaviour outside its original range? Evidence of antagonism with the native L. minor L. in Central Italy. Int. Rev. Hydrobiol. 101, 173–181. doi: 10.1002/iroh.201601841
Ceschin, S., Leacche, I., Pascucci, S., and Abati, S. (2016b). Morphological study of Lemna minuta Kunth, an alien species often mistaken for the native L. minor L. (Araceae). Aquat. Bot. 131, 51–56. doi: 10.1016/j.aquabot.2016.01.005
Ceschin, S., Crescenzi, M., and Iannelli, M. A. (2020). Phytoremediation potential of the duckweeds Lemna minuta and Lemna minor to remove nutrients from treated waters. Environ. Sci. Pollut. Res. 27, 15806–15814. doi: 10.1007/s11356-020-08045-3
Chu, P., Wilson, G. M., Michael, T. P., Vaiciunas, J., Honig, J., and Lam, E. (2018). Sequence-guided approach to genotyping plant clones and species using polymorphic NB-ARC-related genes. Plant Mol. Biol. 98, 219–231. doi: 10.1007/s11103-018-0774-1
Cleland, C. F. (1985). Chemical control of flowering in the long-day plant Lemna gibba G3. Biol. Plant. 27, 392–397. doi: 10.1007/BF02879884
Crawford, D. J., Landolt, E., and Les, D. H. (1996). An allozyme study of two sibling species of Lemna (Lemnaceae) with comments on their morphology, ecology and distribution. Bull. Torrey Bot. Club. 123, 1–6. doi: 10.2307/2996300
Cui, W., and Cheng, J. J. (2015). Growing duckweed for biofuel production: a review. Plant Biol. 17, 16–23. doi: 10.1111/plb.12216
De Lange, E., and Westinga, E. (1979). The distinction between Lemna gibba L. and Lemna minor L. on the basis of vegetative characters. Acta Bot. Nederland. 28, 169–176. doi: 10.1111/j.1438-8677.1979.tb00332.x
Ernst, E. (2016). “Status of the Lemna gibba 7742a and Lemna minor 8627 genomes,” in Proceedings of the Duckweed Forum, International Steering Committee on Duckweed Research and Applications, Cambridge.
Ernst, E., Michael, T., Shanklin, J., Lam, E., and Martienssen, R. (2019). “The genomics and epigenomics of Lemnaceae: genomics for biofuel applications,” in Proceedings of the 5th International Conference on Duckweed Research and Applications (ICDRA), Rehovot.
Felsenstein, J. (1985). Confidence limits on phylogenies: an approach using the bootstrap. Evolution 39, 783–791. doi: 10.1111/j.1558-5646.1985.tb00420.x
Flores-Rentería, L., and Krohn, A. (2013). “Scoring microsatellite loci,” in Microsatellites. Methods in Molecular Biology (Methods and Protocols), ed. S. Kantartzi (Totowa, NJ: Humana Press), 319–336. doi: 10.1007/978-1-62703-389-3_21
Gavazzi, F., Braglia, L., Mastromauro, F., Gianì, S., Morello, L., and Breviario, D. (2016). The Tubulin-Based-Polymorphism method provides a simple and effective alternative to the genomic profiling of grape. PLoS One 11:e0163335. doi: 10.1371/journal.pone.0163335
Gavazzi, F., Casazza, A., Depedro, C., Mastromauro, F., and Breviario, D. (2012). Technical improvement of the TBP (tubulin-based polymorphism) method for plant species detection, based on capillary electrophoresis. Electrophoresis 33, 2840–2851. doi: 10.1002/elps.201200144
Goslee, S. C., and Urban, D. L. (2007). The ecodist package for dissimilarity-based analysis of ecological data. J. Stat. Softw. 22, 1–19. doi: 10.18637/jss.v022.i07
Hammer, Ø, Harper, D. A. T., and Ryan, P. D. (2001). PAST: paleontological statistics software package for education and data analysis. Palaeontol. Electron. 4:9.
Hirahaya, M., and Kadono, Y. (1995). Biosystematic study of Lemna minor L. sensu lato (Lemnaceae) in Japan with special reference to allozyme variation. APG 46:117.
Kandeler, R. (1975). Species delimitation in the genus. Lemna. Aquat. Bot. 1, 365–376. doi: 10.1016/0304-3770(75)90037-6
Kaplan, A., Zelicha, H., Tsaban, G., Yaskolka Meir, A., Rinott, E., Kovsan, J., et al. (2019). Protein bioavailability of Wolffia globosa duckweed, a novel aquatic plant - A randomized controlled trial. Clin. Nutr. 38, 2576–2582. doi: 10.1016/j.clnu.2018.12.009
Körner, S., Sk, D., Veenstra, S., and Vermaat, J. E. (2003). The capacity of duckweed to treat wastewater: ecological consideration for a sound design. J. Environ. Qual. 32, 1583–1590. doi: 10.2134/jeq2003.1583
Kumar, S., Stecher, G., Li, M., Knyaz, C., and Tamura, K. (2018). MEGA X: Molecular evolutionary genetics analysis across computing platforms. Mol. Biol. Evol. 35, 1547–1554. doi: 10.1093/molbev/msy096
Landolt, E. (1975). Morphological differentiation and geographical distribution of the Lemna gibba-Lemna minor group. Aquat. Bot. 1, 345–363. doi: 10.1016/0304-3770(75)90036-4
Landolt, E. (1980). Description of six new species of Lemnaceae. Veröffentlichunge Geobot. Inst. ETH. Stiftung Ruebel Zurich 70, 22–29.
Landolt, E. (1986). “The family of Lemnaceae - A monographic study,” in Biosystematic Investigations in the Family of Duckweeds (Lemnaceae), Vol. 1, ed. E. Landolt (Zürich: Geobotanischen Institutes der Eidg. Techn. Hochschule, Stiftung Ruebel).
Landolt, E., and Kandeler, R. (1987). “The family of Lemnaceae - A monographic study,” in Biosystematic Investigations in the Family of Duckweeds (Lemnaceae), Vol. 4, eds E. Landolt and R. Kandeler (Zürich: Geobotanischen Institutes der Eidg. Techn. Hochschule, Stiftung Ruebel).
Langmead, B., and Salzberg, S. (2012). Fast gapped-read alignment with Bowtie 2. Nat. Methods 9, 357–359. doi: 10.1038/nmeth.1923
Lauria, M., Rupe, M., Guo, M., Kranz, E., Pirona, R., Viotti, A., et al. (2004). Extensive maternal DNA hypomethylation in the endosperm of Zea mays. Plant Cell 16, 510–522. doi: 10.1105/tpc.017780
Les, D. H., and Crawford, D. J. (1999). Landoltia (Lemnaceae) a new genus of duckweeds. Novon 9, 530–533. doi: 10.2307/3392157
Les, D. H., Crawford, D. J., Landolt, E., Gabel, J. D., and Kimball, R. T. (2002). Phylogeny and systematics of Lemnaceae, the duckweed family. Syst. Bot. 27, 221–240.
Les, D. H., Landolt, E., and Crawford, D. J. (1997). Systematics of the Lemnaceae (duckweeds): Inferences from micromolecular and morphological data. Plant. Syst. Evol. 204, 161–177. doi: 10.1007/BF00989203
Li, H., Handsaker, B., Wysoker, A., Fennell, T., Ruan, J., Homer, N., et al. (2009). The Sequence alignment/map (SAM) format and SAMtools. Bioinformatics 25, 2078–2079. doi: 10.1093/bioinformatics/btp352
Mantel, N. (1967). The detection of disease clustering and a generalized regression approach. Cancer Res. 27, 209–220.
Nauheimer, L., Metzler, D., and Renner, S. S. (2012). Global history of the ancient monocot family Araceae inferred with models accounting for past continental positions and previous ranges based on fossils. New Phytol. 195, 938–950. doi: 10.1111/j.1469-8137.2012.04220.x
Nei, M., and Kumar, S. (2000). Molecular Evolution and Phylogenetics. New York, NY: Oxford University Press.
Paradis, E., and Schliep, K. (2018). ape 5.0: an environment for modern phylogenetics and evolutionary analyses in R. Bioinformatics 35, 526–528. doi: 10.1093/bioinformatics/bty633
R Core Team (2019). R: A language and environment for statistical computing. Vienna: R Foundation for Statistical Computing.
Rodionov, A. V., Amosova, A. V., Belyakov, A. E., Zhurbenko, P. M., Mikhailova, Y. V., Punina, E. O., et al. (2019). Genetic consequences of interspecific hybridization, its role in speciation and phenotypic diversity of plants. Rus. J. Genet. 55, 278–294. doi: 10.1134/S1022795419030141
Rohlf, F. J. (1998). NTSYSpc Numerical Taxonomy and Multivariate Analysis System Version 2.0 User Guide. Setauket, NY: Applied Biostatistics Inc.
Schlüter, P. M., and Harris, S. A. (2006). Analysis of multilocus fingerprinting data sets containing missing data. Mol. Ecol. Notes 6, 569–572. doi: 10.1111/j.1471-8286.2006.01225.x
Silletti, S., Morello, L., Gavazzi, F., Gianì, S., Braglia, L., and Breviario, D. (2019). Untargeted DNA-based methods for the authentication of wheat species and related cereals in food products. Food Chem. 271, 410–418. doi: 10.1016/j.foodchem.2018.07.178
Sree, K. S., Bog, M., and Appenroth, K. J. (2016). Taxonomy of duckweeds (Lemnaceae), potential new crop plants. Emirate J. Food Agric. 28, 291–302. doi: 10.9755/ejfa.2016-01-038
Tippery, N. P., and Les, D. H. (2020). “Tiny plants with enormous potential: phylogeny and evolution of duckweeds,” in The Duckweed Genomes, eds X. H. Cao, P. Fourounjian, and W. Wang (Berlin: Springer), 19–38. doi: 10.1007/978-3-030-11045-1_2
Tippery, N. P., Les, D. H., and Crawford, D. J. (2015). Evaluation of phylogenetic relationships in Lemnaceae using nuclear ribosomal data. Plant Biol. 17, 50–58. doi: 10.1111/plb.12203
Van Hoeck, A., Horemans, N., Monsieurs, P., and Sokal, H. U. (2015). The first draft genome of the aquatic model plant Lemna minor opens the route for future stress physiology research and biotechnological applications. Biotechnol. Biofuels 8:188. doi: 10.1186/s13068-015-0381-1
Wang, W., Wu, Y., Yan, Y., Ermakova, M., Kerstetter, R., and Messing, J. (2010). DNA barcoding of the Lemnaceae, a family of aquatic monocots. BMC Plant Biol. 10:205. doi: 10.1186/1471-2229-10-205
Keywords: duckweeds, genotyping, interspecific hybrids, tubulin-based polymorphism, Lemna japonica, DNA barcoding, interspecific polymorphism
Citation: Braglia L, Lauria M, Appenroth KJ, Bog M, Breviario D, Grasso A, Gavazzi F and Morello L (2021) Duckweed Species Genotyping and Interspecific Hybrid Discovery by Tubulin-Based Polymorphism Fingerprinting. Front. Plant Sci. 12:625670. doi: 10.3389/fpls.2021.625670
Received: 03 November 2020; Accepted: 04 February 2021;
Published: 08 March 2021.
Edited by:
Ezio Portis, University of Turin, ItalyCopyright © 2021 Braglia, Lauria, Appenroth, Bog, Breviario, Grasso, Gavazzi and Morello. This is an open-access article distributed under the terms of the Creative Commons Attribution License (CC BY). The use, distribution or reproduction in other forums is permitted, provided the original author(s) and the copyright owner(s) are credited and that the original publication in this journal is cited, in accordance with accepted academic practice. No use, distribution or reproduction is permitted which does not comply with these terms.
*Correspondence: Laura Morello, bGF1cmEubW9yZWxsb0BpYmJhLmNuci5pdA==
†These authors have contributed equally to this work