 Mercedes Sánchez-Cabrera1*†‡
 Francisco Javier Jiménez-López1‡
 Eduardo Narbona2
 Montserrat Arista1
 Pedro L. Ortiz1
 Francisco J. Romero-Campero3,4
 Karolis Ramanauskas5
 Boris Igić5
 Amelia A. Fuller6
 Justen B. Whittall7
- 1Department of Plant Biology and Ecology, Faculty of Biology, University of Seville, Seville, Spain
- 2Department of Molecular Biology and Biochemical Engineering, Pablo de Olavide University, Seville, Spain
- 3Institute for Plant Biochemistry and Photosynthesis, University of Seville – Centro Superior de Investigación Científica, Seville, Spain
- 4Department of Computer Science and Artificial Intelligence, University of Seville, Seville, Spain
- 5Department of Biological Science, University of Illinois at Chicago, Chicago, IL, United States
- 6Department of Chemistry and Biochemistry, Santa Clara University, Santa Clara, CA, United States
- 7Department of Biology, College of Arts and Sciences, Santa Clara University, Santa Clara, CA, United States
Anthocyanins are the primary pigments contributing to the variety of flower colors among angiosperms and are considered essential for survival and reproduction. Anthocyanins are members of the flavonoids, a broader class of secondary metabolites, of which there are numerous structural genes and regulators thereof. In western European populations of Lysimachia arvensis, there are blue- and orange-petaled individuals. The proportion of blue-flowered plants increases with temperature and daylength yet decreases with precipitation. Here, we performed a transcriptome analysis to characterize the coding sequences of a large group of flavonoid biosynthetic genes, examine their expression and compare our results to flavonoid biochemical analysis for blue and orange petals. Among a set of 140 structural and regulatory genes broadly representing the flavonoid biosynthetic pathway, we found 39 genes with significant differential expression including some that have previously been reported to be involved in similar flower color transitions. In particular, F3′5′H and DFR, two genes at a critical branchpoint in the ABP for determining flower color, showed differential expression. The expression results were complemented by careful examination of the SNPs that differentiate the two color types for these two critical genes. The decreased expression of F3′5′H in orange petals and differential expression of two distinct copies of DFR, which also exhibit amino acid changes in the color-determining substrate specificity region, strongly correlate with the blue to orange transition. Our biochemical analysis was consistent with the transcriptome data indicating that the shift from blue to orange petals is caused by a change from primarily malvidin to largely pelargonidin forms of anthocyanins. Overall, we have identified several flavonoid biosynthetic pathway loci likely involved in the shift in flower color in L. arvensis and even more loci that may represent the complex network of genetic and physiological consequences of this flower color polymorphism.
Introduction
Flower color plays a fundamental role in pollinator attraction and plant reproduction (Fenster et al., 2004). Changes in flower color may produce pollinator shifts leading to speciation (Rausher, 2008; Ortiz-Barrientos, 2013; Van der Niet et al., 2014). Abiotic factors have received far less attention, but they may also impose selection on flower color (e.g., temperature, precipitation, solar radiation; Strauss and Whittall, 2006; Rausher, 2008; Van der Kooi et al., 2019; Dalrymple et al., 2020; Koski et al., 2020). The palette of flower color is diverse and there are a variety of mechanisms to control flower colors (cell shape, co-pigments, pH, etc.). However, large differences in flower color are mainly controlled by the underlying pigments such as chlorophylls, carotenoids, betalains and flavonoids (Tanaka et al., 2008). Anthocyanins are the most common group of flavonoid pigments present in flowers, and differences in the number of hydroxyl groups on their B-ring characterize the three main types: pelargonidin-derived anthocyanins (orange or red; one hydroxyl group), cyanidin-derived anthocyanins (magenta; two hydroxyl groups) and delphinidin-derived anthocyanins (including malvidin conferring blue or purple; three hydroxyl groups; Davies, 2009; Wessinger and Rausher, 2012, 2013; Ng et al., 2018).
Flower color variation exists both between and within species across angiosperms. Flower color transitions are common between related species (Zufall and Rausher, 2004; Tripp and Manos, 2008; Streisfeld and Rausher, 2009; Smith and Rausher, 2011; Wessinger and Rausher, 2013; Roberts and Roalson, 2017). However, some lineages exhibit striking flower color variation within species (Gigord et al., 2001; Schemske and Bierzychudek, 2007; Gómez et al., 2020). Flower color polymorphisms, the coexistence of two or more discrete flower color phenotypes within a population (Huxley, 1955; Schemske and Bierzychudek, 2007), is relatively common and concentrated in some families of angiosperms (Narbona et al., 2018). Flower color polymorphisms are frequently caused by the loss of anthocyanins (i.e., polymorphisms usually involving white-flowered plants) as in the cases of Ipomoea purpurea (purple and white; Rausher and Simms, 1989), Linanthus parryae (blue and white; Schemske and Bierzychudek, 2007), Ruellia simplex (purple, pink, and white; Freyre et al., 2015), Parrya nudicaulis (purple and white; Dick et al., 2011), Raphanus sativus (pink, bronze, yellow and white; Irwin and Strauss, 2005) and Primula vulgaris (purple, blue, pink, white, and yellow; Shipunov et al., 2011). Less commonly, flower color polymorphisms are caused by changes in anthocyanin composition as in Ipomoea nil (blue, magenta, purple, and red; Morita et al., 2005), Phlox drummondii (blue and red; Hopkins and Rausher, 2011) and Lysimachia arvensis (blue and orange; Arista et al., 2013). Streisfeld and Rausher (2011) predicted that evolutionary transitions in floral color are more likely caused by regulatory mutations in ABP genes instead of mutations in the coding sequence (CDS), because regulatory changes can be tissue-specific and are thus less likely to have deleterious pleiotropic effects. In this study, we focus on the flavonoid genes and compounds underlying the blue and orange flower color variation of Lysimachia arvensis.
Anthocyanins are synthesized by the anthocyanin biosynthetic pathway (ABP) – a highly conserved pathway among angiosperms and one of the best studied pathways for the production of secondary metabolites in plants (Holton and Cornish, 1995; Davies and Schwinn, 2006; Ho and Smith, 2016; Wheeler and Smith, 2019). The ABP is part of the flavonoid biosynthetic pathway, a broader metabolic pathway emerging from phenylpropanoid metabolism that includes flavone, flavonol, and anthocyanin synthesis plus the post-translational modifying steps like acylation and glycosylation (Clegg and Durbin, 2000; Sobel and Streisfeld, 2013; Chen et al., 2018; Gao et al., 2019). Approximately 100 structural genes (KEGG pathway database1) are involved in this broad flavonoid biosynthetic pathway. In addition, tissue-specific transcription factors play an important role in this pathway (Quattrocchio et al., 2006; Zhao et al., 2013), regulating those structural genes through the MYB-bHLH-WDR complex (MBW; Xu et al., 2015; Gao et al., 2019). This regulatory complex is conserved among vascular plants; however, the structural genes that they regulate varies among angiosperm lineages (Hichri et al., 2011; Lai et al., 2013; Albert et al., 2014; Xu et al., 2015). Regulatory complexity (e.g., tissue-specific regulation) is conferred by the large gene families for these proteins (e.g., R2R3 MYBs; Stracke et al., 2001; WD40; Xu et al., 2015). In particular, MYB regulators tend to be disproportionately involved in floral anthocyanin variation both within and between species.
The number of studies describing the causes of flower color variation in the wild is rapidly growing (e.g., Dick et al., 2011; Yuan et al., 2013; Casimiro-Soriguer et al., 2016; Kellenberger et al., 2019). Wheeler and Smith (2019) reviewed 15 studies involving natural evolutionary transitions between anthocyanin pigment types in which all 15 examples involved decreased expression in either F3′H or F3′5′H, or both genes (Wessinger and Rausher, 2012; Wheeler and Smith, 2019). Furthermore, two of these cases involved DFR mutations conferring substrate specificity, a secondary modification to redirect the flux directly down the pelargonidin branch of the ABP (Johnson et al., 2001; Zufall and Rausher, 2004; Smith and Rausher, 2011; Wheeler and Smith, 2019). According to Streisfeld and Rausher (2011), flower color variation associated with anthocyanin loss is more likely to be caused by regulatory genes mutations to avoid deleterious pleiotropic effects, while flower color variation associated with changes in anthocyanin type are more likely to be caused by mutations in structural genes, however Wheeler and Smith’s (2019) findings suggest both regulatory and structural changes are often correlated with the blue to red transition in natural flower color changes. Traditional approaches to finding the genes underlying flower color variation involve sequencing and determining expression in a relatively narrow group of candidate genes in the ABP (Le Maitre et al., 2019) which we will refer to as the narrow ABP. Alternatively, transcriptomic approaches using RNA-Seq allow a much broader investigation of the underlying causes of flower color variation (e.g., across the broader flavonoid biosynthetic pathway). For non-model species, de novo transcriptome assembly can be used to estimate genes with significant differential expression (DEGs; Wang et al., 2009; Martin and Wang, 2011; Grabherr et al., 2011; Anders et al., 2013; Haas et al., 2013; Butler et al., 2014; Casimiro-Soriguer et al., 2016; Chen et al., 2018; Duan et al., 2020). Even using a transcriptome approach, most studies of anthocyanin loss have focused on a narrow group of ABP candidate genes (Lulin et al., 2012; Lou et al., 2014; Casimiro-Soriguer et al., 2016; Gao et al., 2016; Lang et al., 2019; Li L. et al., 2019; Duan et al., 2020; Zhang et al., 2020). Herein, we describe the de novo assembled transcriptome for blue- and orange-flowered Lysimachia arvensis to determine differentially expressed genes among the broader flavonoid biosynthetic pathway.
Lysimachia arvensis (L.) Manns & Anderb. (Primulaceae), formerly Anagallis arvensis, is a self-incompatible (Gibbs and Talavera, 2001), tetraploid (2n = 40; Pujadas, 1997; Moneim et al., 2003) annual species displaying a petal color polymorphism. Blue- and orange-flowered plants, traditionally described as blue- and red-flowered plants (Ferguson, 1972), occur in monomorphic and polymorphic populations across its native range in Europe (Arista et al., 2013; Ortiz et al., 2015). The blue petals of L. arvensis contain malvidin derivatives, whereas orange petals contain pelargonidin derivatives (Lawrence et al., 1939; Harborne, 1968; Ishikura, 1981). Although both L. arvensis flower colors have long been described as different morphs, recent molecular phylogenetic studies indicate that these flower color phenotypes reflect very closely related, yet distinct, evolutionary lineages (Jiménez-López, 2019; Jiménez-López et al., in review) with some degree of reproductive isolation (Jiménez-López et al., 2020). Pollinators (mainly Halictus spp. bees; Ortiz et al., 2015; Jiménez-López et al., 2019) exhibit a preference for the blue individuals when given a choice. Across Europe, there is a latitudinal cline in flower color from north to south. Completely orange populations are common in the more mesic temperate latitudes of northern and central Europe whereas completely blue populations are most common in the more xeric Mediterranean environments of southern Europe with polymorphic populations in between (Arista et al., 2013). In combination with the ecological divergence of these two flower color variants across the species range, this case of incipient speciation provides an opportunity to investigate the role of the flavonoid biosynthetic pathway during speciation (Coyne and Orr, 1998; Widmer et al., 2009; Reiseberg and Blackman, 2010).
In this study, we aim to identify the underlying genetic and biochemical causes of flower color variation in L. arvensis. Previous studies have found that gene expression and/or gene structure at a critical branch-point in the anthocyanin biosynthetic pathway involving two genes, F3′5′H and DFR, are involved in most blue to red/orange flower color shifts (malvidin/cyanidin to pelargonidin; Davies, 2009; Streisfeld and Rausher, 2009, 2011; Smith et al., 2012; Ho and Smith, 2016; Wheeler and Smith, 2019). In order to identify the underlying genetic causes of petal color polymorphism in L. arvensis, we performed de novo transcriptome assembly from RNA-Seq data. We then tested for differential expression across a broad panel of 94 structural and 46 regulatory genes involved in the flavonoid biosynthetic pathway. We also examined these two candidate genes for non-synonymous single nucleotide polymorphisms (SNPs) fixed between blue and orange flowers in reference to the known functional domains as described for other species (Johnson et al., 2001; Seitz et al., 2007; Smith et al., 2012; Guo et al., 2019). Finally, we interpret our transcriptome results in light of the flavonoid biochemical profiles of both flower colors using Ultra-High Performance Liquid Chromatography (UHPLC-MS).
Materials and Methods
Plant Material
For transcriptomic analysis, we collected seeds from blue-flowered plants that belong to a primarily blue-flowered population (blue:orange ratio = 10:1; Spain, Andalusia, Hinojos; 37°17′37″ N, 6°25′15″ W) and orange-flowered plants that belong to a monomorphic orange population (France, Corsica, Solenzara; 41°51′19″ N, 9°21′16″ E). Voucher specimens were deposited in the University of Seville Herbarium (Herbarium Numbers: SEV286467 and SEV279123). Although there are benefits from studying a mixed population in order to control for differences in genetic background that can arise due to geographic separation and/or local adaptation in allopatry, we used these two populations because we previously obtained four generations of inbred lines that exhibit reduced heterozygosity, which facilitates transcriptome assembly and analysis. These seeds were sown in a glasshouse at Santa Clara University (CA, United States), where the RNA extractions of blue- and orange-flowered samples were performed on the same days, alternating the preparation of samples between flower colors, in relatively homogeneous environmental conditions. We sampled all five petals from ∼30 flowers per plant, from eight blue- and eight orange-flowered plants. We avoided the “bullseye” at the base of each petal because this study is focused on the blue and orange flower color polymorphism, and we have no evidence that the bullseye is different between morphs based on visible and UV digital images (Supplementary Figure 1). All samples were taken from first-day anthesis flowers. Immediately after excision, petals were placed in cryotubes that were immediately immersed in liquid nitrogen and stored at −80°C to avoid subsequent changes in gene expression and RNA degradation. For flavonoid profiling, we sampled one blue and one orange plant from Spain and confirmed with 13 blue and 10 orange glasshouse-grown introduced plants from California. Each sample was composed of between 10 and 15 petals without the central bullseye. Petal samples were stored in microtubes containing 200 μl of MeOH with 1% HCl.
RNA Extraction and de novo Assembly
Petals were homogenized using a mortar and pestle. Total RNA was then extracted following the Qiagen RNeasy®Plant Mini Kit protocol (Qiagen, Germany) with the addition of PEG 20,000 mol. wt. (550 μl, 2%; Gehrig et al., 2000) before the first filtering step. The addition of PEG was essential to achieve reasonable RNA concentrations for library preparation and sequencing. RNA samples were stored at −80°C until further analysis. RNA concentration and purity was initially assessed with a Nanodrop Nd-1000 (Thermo Fisher Scientific) and agarose gel, and then confirmed with a Bioanalyzer (Agilent, Santa Clara, CA, United States) before sequencing.
Individual libraries were barcoded, multiplexed and sequenced as 150 bp paired-end reads using two lanes on an Illumina Hi-Seq 2000 (Illumina, San Diego, CA, United States) through Novogene (Beijing, China). Raw paired-end Illumina reads were assessed for quality using FastQC (Andrews, 2010) and were processed using Rcorrector v1.0.4 (Song and Florea, 2015) to correct random sequencing errors. Then, reads were trimmed with Trimmomatic v0.39 (Bolger et al., 2014) to remove any read containing bases with Phred scores lower than 20, low quality reads less than 50 bp long, and any adapter or other Illumina-specific sequences that were still present. The remaining reads were filtered with Kraken 2 (Wood et al., 2019) to remove Small and Large Subunit ribosomal RNA (SILVA database; Quast et al., 2013) and contaminating reads (minikraken2_v2 database). Additionally, we used custom-built databases, derived from RefSeq libraries: UniVec_Core, viral, mitochondrion, plastid, plasmid, archaea, bacteria, protozoa, human and fungi. Filtered reads were combined across all samples into a single RNA-Seq data set. We conducted a de novo transcriptome assembly using Trinity v2.8.5 (Grabherr et al., 2011) to generate a single reference transcriptome assembly for L. arvensis. Statistical information on the assembly quality was obtained with the “TrinityStats.pl” commands in the Trinity package and Bowtie2 software (Langmead and Salzberg, 2012). Trinity produces assembled genes and isotigs (which may represent alleles, isoforms, and/or splice variants). We used the assembled genes for the DEGs in order to have a single locus per expression measure and isotigs for the SNP and phylogenetic analysis allowing a balance of certainty in the assembly quality while maximizing ortholog coverage for phylogenetic inference.
Identification of Differentially Expressed Genes (DEGs)
Since the de novo transcriptome assembly was done using the entire dataset as a single sample (blue- and orange-flowered plants combined), we then mapped the reads from each sample back onto the reference transcriptome. Trimmed mean of M-values (TMM, mean of log-expression ratios; Robinson and Oshlack, 2010), were calculated for each gene with RSEM software (Li and Dewey, 2011) using a Pearl script (align_and_estimate_abundance.pl) provided with the Trinity distribution. Then, we used EdgeR package (Robinson et al., 2009) in R v4.0.0 (R Core Team, 2020) to determine statistically significant differentially expressed genes (DEGs) between different colored samples. In order to be conservative in DEG identification, we set two thresholds for determining significant differential expression: the false discovery rate (FDR) was less than 10–5 and the expression difference threshold was greater than one log2 fold-change (log2FC). Wilcoxon rank-sum test for ABP and non-ABP gene comparisons were conducted in R v4.0.0 (R Core Team, 2020).
In order to focus on a broadly defined set of genes associated with the broader flavonoid biosynthetic pathway, we explored 94 structural loci (Supplementary Table 1). These genes start at the phenylpropanoid biosynthetic pathway and continue through the entire flavonoid biosynthetic pathway to include the ABP and three non-anthocyanin flavonoid side-branches: flavone, flavonol and isoflavonoid biosynthetic pathways (KEGG pathway database1). In addition, we selected 46 regulatory genes involved in flavonoid pathway regulation, including the gene families for R2R3-Myb, bHLH and WD40 loci (Li, 2014; Xu et al., 2015; Gates et al., 2017; Supplementary Table 2).
To identify and annotate the flavonoid biosynthetic pathway genes in our de novo transcriptome assembly, we used Kakapo2. As input, we specified a list of 140 Genbank accessions for the genes involved in flavonoid biosynthetic pathway, restricted to the Order Ericales (if the gene was not found within Ericales, we removed the Order restriction).
Phylogenetic Analysis of F3′5′H and DFR
Based on previous studies and our expression results, we carefully examined the RNA sequences of F3′5′H and DFR in relation to a set of Genbank reference sequences. In order to generate sequences of the coding region for these two enzymes, we mapped the Illumina reads of every sample to each F3′5′H or DFR isotig that arose from our Trinity de novo assembly. We used the “Map to Reference” function in Geneious v9.0.4 (Kearse et al., 2012), applying “highest sensitivity/slow” and “trim sequences” parameters. A subset of these isotigs, across orange- and blue-flowered samples for each gene, were used as queries in BLASTn tool from NCBI3 to locate homologous loci from a group of reference sequences (see results section). We selected a set of Genbank references that represented the top hits and some of the best-studied model systems in flower color research for our phylogenetic analysis. For each gene, the isotigs and Genbank reference sequences were aligned using the MUSCLE plug-in from within Geneious v9.0.4. Isotigs missing large portions of the coding sequence or containing >30% ambiguities were removed from the alignment, thus excluding some putative splice variants to improve accuracy. For DFR, we removed the 5′ and 3′ ends (24 and 52 bp, respectively) of the coding sequence (CDS) due to alignment ambiguities before conducting phylogenetic analysis. We reconstructed the relationships using the RAxML 7.2.8 plug-in from within Geneious v9.0.4, searching for the maximum likelihood tree with 100 bootstrap replicates. We then interpreted the phylogenetic tree in light of normalized expression values (TMM) in R v4.0.0 (R Core Team, 2020).
SNP Frequencies for F3′5′H and DFR
In addition, we examined the frequency of non-synonymous SNPs that showed some tendency to differentiate flower color types for F3′5′H and DFR-1 (DFR-2 was only present in orange-flowered individuals so no sequences were available from blue-samples for comparison). For each sample, every isotig was determined to be fixed or variable. Although L. arvensis is tetraploid, we treated these as either homozygotes or heterozygotes (respectively) for our frequency calculations. We calculated the frequency of each non-synonymous SNP that showed differences between the flower color types providing BLOSUM62 scores (Henikoff and Henikoff, 1992), an empirical measure that estimates the biological probability of an amino acid substitution based on an alignment, and noting the biochemical properties of the amino acids involved. Furthermore, we extended this survey to include synonymous color-differentiating SNPs in the CDS for F3′5′H and DFR-1, including SNPs in the 5′ and 3′ UTRs for F3′5′H. In addition, since there were two copies of DFR, we also examined all non-synonymous amino acid substitutions between DFR-1 and DFR-2 in light of the location of variation in known functional domains responsible for substrate specificity and binding (Johnson et al., 2001; Petit et al., 2007; Smith et al., 2012). For both genes the amino acid residue numbers are based on the L. arvensis alignment, which translates to Vitis vinifera plus two amino acids (Petit et al., 2007).
Identification of Flavonoid Compounds by UHPLC-MS
Flavonoids were extracted by placing 10–15 petals of blue and orange L. arvensis flowers in microtubes containing 200 μl of MeOH with 1% HCl. Homogenization was performed with a BeadBeater using 3 mm × 3.2 mm steel balls for 30 s. Samples were stored at −80°C until they could be loaded on a Dionex UltiMate 3000 ultra-high pressure liquid chromatography system equipped with a diode array detector and connected to a Thermo Fleet LCQ mass spectrometer (purchased from Thermo Fisher Scientific, Waltham, MA, United States). Data were analyzed using Xcalibur software (Thermo Fisher Scientific).
Crude extracts were eluted through a Phenomenex Gemini Column (50 mm × 2 mm, 3 micron; acquired from Phenomenex, Torrance, CA, United States) with a multi-step gradient of two solvents: 0.5% formic acid in water (solvent A) and 0.5% formic acid in methanol (solvent B) at a flow rate of 0.5 mL/min. The multi-step gradient involved an initial 2 min elution at 15% B, followed by a linear gradient over 5 min to 50% B, then isocratic elution at 50% B for 3 min, then flushing the column with 100% B for 3 min. The diode array detector collected UV-Vis spectra of eluted compounds from 190–700 nm. Mass spectra of eluted compounds were ionized using electrospray ionization and the mass detector was set to positive ion detection mode with a mass range of 150–800 Da.
Flavonoid identification was based on the compound’s retention time, UV-Vis spectra and whenever possible, chromatographic comparisons with authentic standards. We used flavonoid standards including quercetin, luteolin, kaempferol, isorhamnetin, malvidin, pelargonidin, cyanidin and delphinidin (purchased from Extrasynthese, Genay, France) that were previously reported for L. arvensis and other Lysimachia species (Supplementary Table 3). Putative identifications were also compared with published flavonoid data4.
Results
RNA Extraction and de novo Assembly
Bioanalyzer results confirmed we extracted high-quality RNA without substantial degradation. All RNA integrity numbers (RIN) were above the recommended RIN = 6.3 (Novogene, unpublished). The mean RIN value was 8.0 (6.7–9.0). The total number of filtered reads in the transcriptome analysis ranged from 21 million to 41 million in blue samples (mean of 26 million) and from 21 million to 26 million in orange samples (mean of 24 million). Approximately 98% of filtered reads of each sample mapped to the de novo assembled L. arvensis reference transcriptome. Isotig number per sample varied from 146 thousand to 193 thousand and the number of genes ranged from 37 thousand to 42 thousand (Supplementary Table 4). The GC percentage of the assembly was 38.27% and it had an N50 value of 1,635 bp. The average contig length was 973.5 bp and the total number of assembled bases equaled 389,888,932 bp. A total of 189,189 trinity genes and 400,523 trinity isotigs were obtained.
Identification of Differentially Expressed Genes (DEGs)
Initially, we identified 48,306 differentially expressed genes and 102,750 differentially expressed isotigs in the L. arvensis transcriptome with EdgeR. After applying the cut-off values for FDR and log2FC, we reduced the number of DEGs to 10,624 genes. There were 6,966 DEGs with higher expression in blue samples and 3,658 DEGs with higher expression in orange samples (Supplementary Figure 2). The average log2FC of DEGs for blue > orange (B > O) was 2.39 and for O > B was 3.16.
Restricting our analysis to the flavonoid biosynthetic pathway, our Kakapo results identified 60% (58/94) of the structural genes and 20% (10/46) of the regulatory genes in our 140 gene panel. Since some loci were found in multiple copies, a total of 153 structural gene copies and 13 regulatory gene copies were examined for differential expression (Supplementary Tables 5, 6; these tables contain the number of copies for each gene identified). Gene expression analysis showed 38 structural genes and one regulatory gene with significant differential expression between flower colors (Figure 1 and Table 1). Among the DEGs, 22 showed higher expression in blue-flowered plants, while 17 showed higher expression in orange-flowered plants (Figure 1). Structural DEGs from the early steps of the flavonoid biosynthetic pathway have lower expression levels (TMM) compared to DEGs from the narrow ABP (Wilcoxon rank-sum test, W = 46606, p = 2.2 × 10⁻¹⁶; Figure 2). These trend is also present within flower colors (orange ABP gene expression is 4.8× higher than orange non-ABP gene expression; Wilcoxon rank-sum test, W = 12111, p = 1.3 × 10⁻¹²; blue ABP gene expression is 6× higher than blue non-ABP gene expression; Wilcoxon rank-sum test, W = 11278, p = 8.5 × 10⁻⁹). In general, structural DEGs with higher expression in blue samples tended to have ∼2× higher overall expression than those genes with higher expression in orange samples (average TMMblue = 55 vs. average TMMorange = 29; Figure 2). Focusing on the narrow ABP, we obtained eight structural DEGs with higher expression in blue L. arvensis (Table 1 and Figure 2). On the contrary, we only found two with higher expression in orange L. arvensis (Table 1 and Figure 2). Two candidate genes involved in the blue to orange transition had significant differential expression (F3′5′H and two copies of DFR). F3′5′H and DFR-1 show 2.5× and 2× B > O, respectively, while DFR-2 has > 600× O > B (this locus is nearly undetectable in blue flowers). In regard to the regulatory genes, we found 13 trinity genes from four different gene families (Supplementary Figure 3 and Supplementary Table 6). Only MYB61 (MYB4-2) showed significant differential expression with 26× higher expression in orange- than in blue-flowered plants (Figure 1 and Table 1). This MYB was initially identified as a MYB4 from Hibiscus syriacus by Kakapo, but a BLASTn of this L. arvensis sequence showed that it is more similar to Camellia sinensis MYB61, and will be referred to as LaMYB61 from here onward.
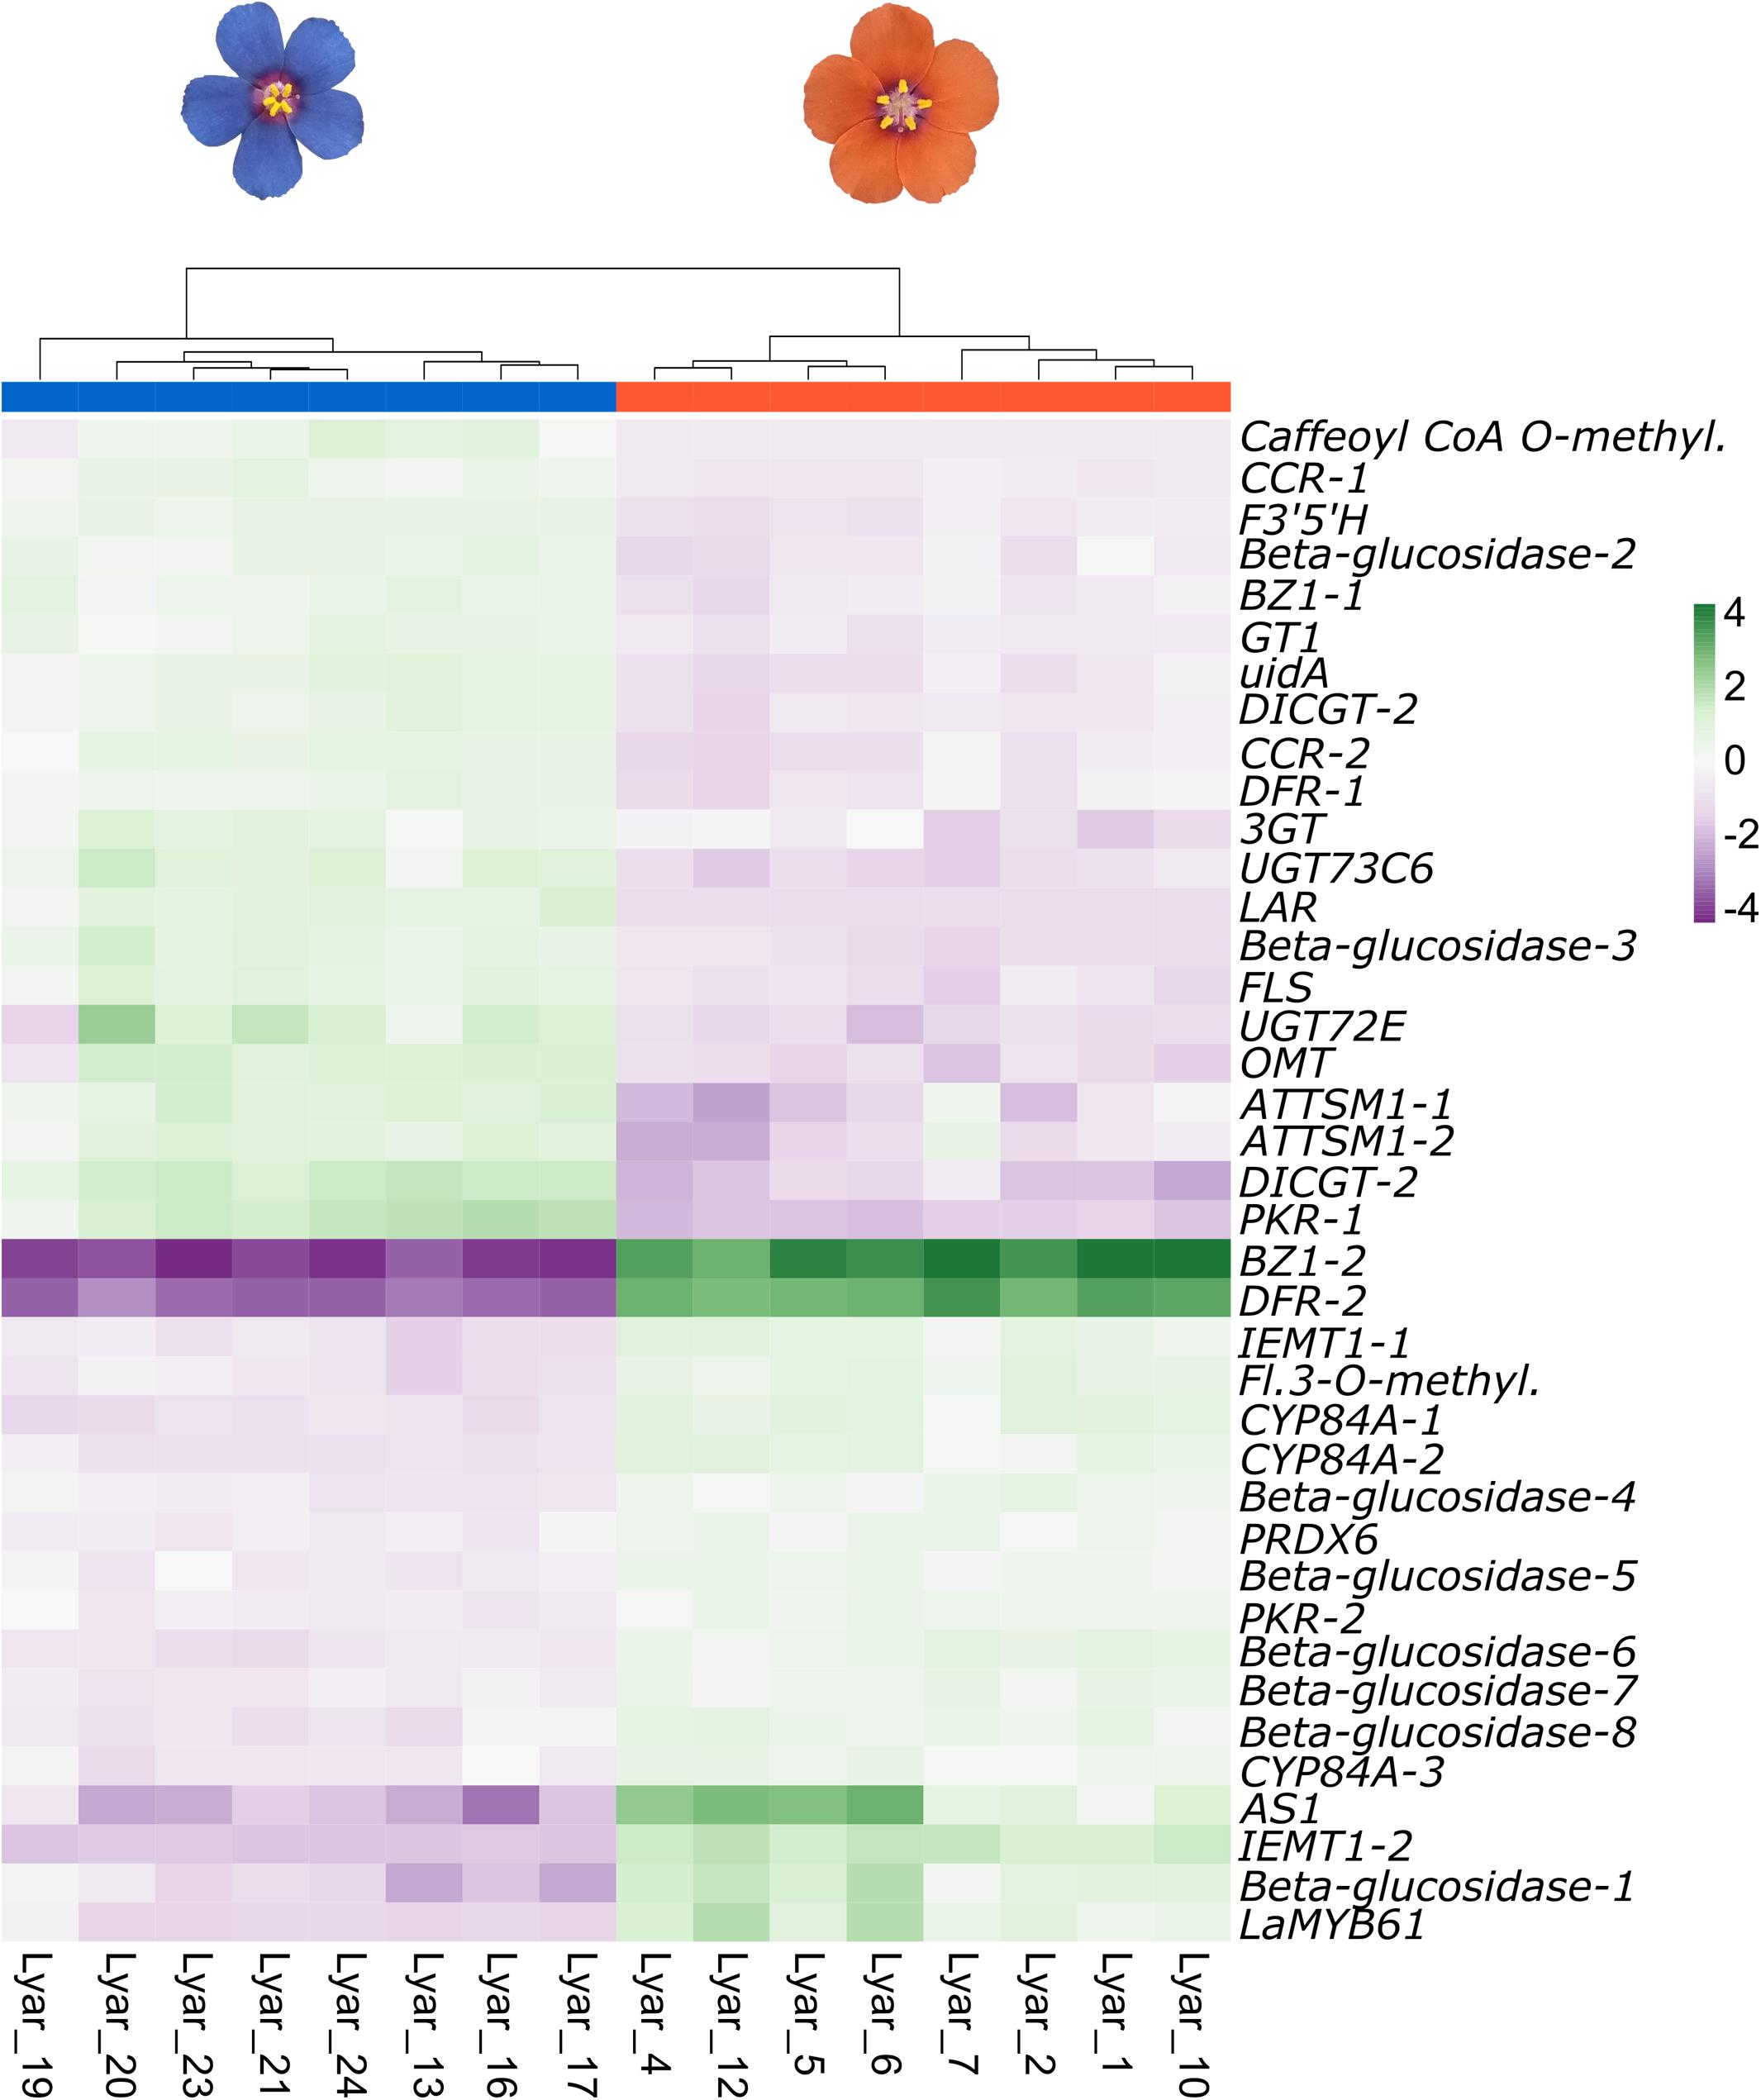
Figure 1. Clustering and heatmap of differentially expressed genes (DEGs) from the flavonoid biosynthesis pathway in blue- and orange-flowered plants of L. arvensis. The color scale represents the scaled TMM expression values (trimmed mean of M-values). Green represents high expression and purple represents low expression.
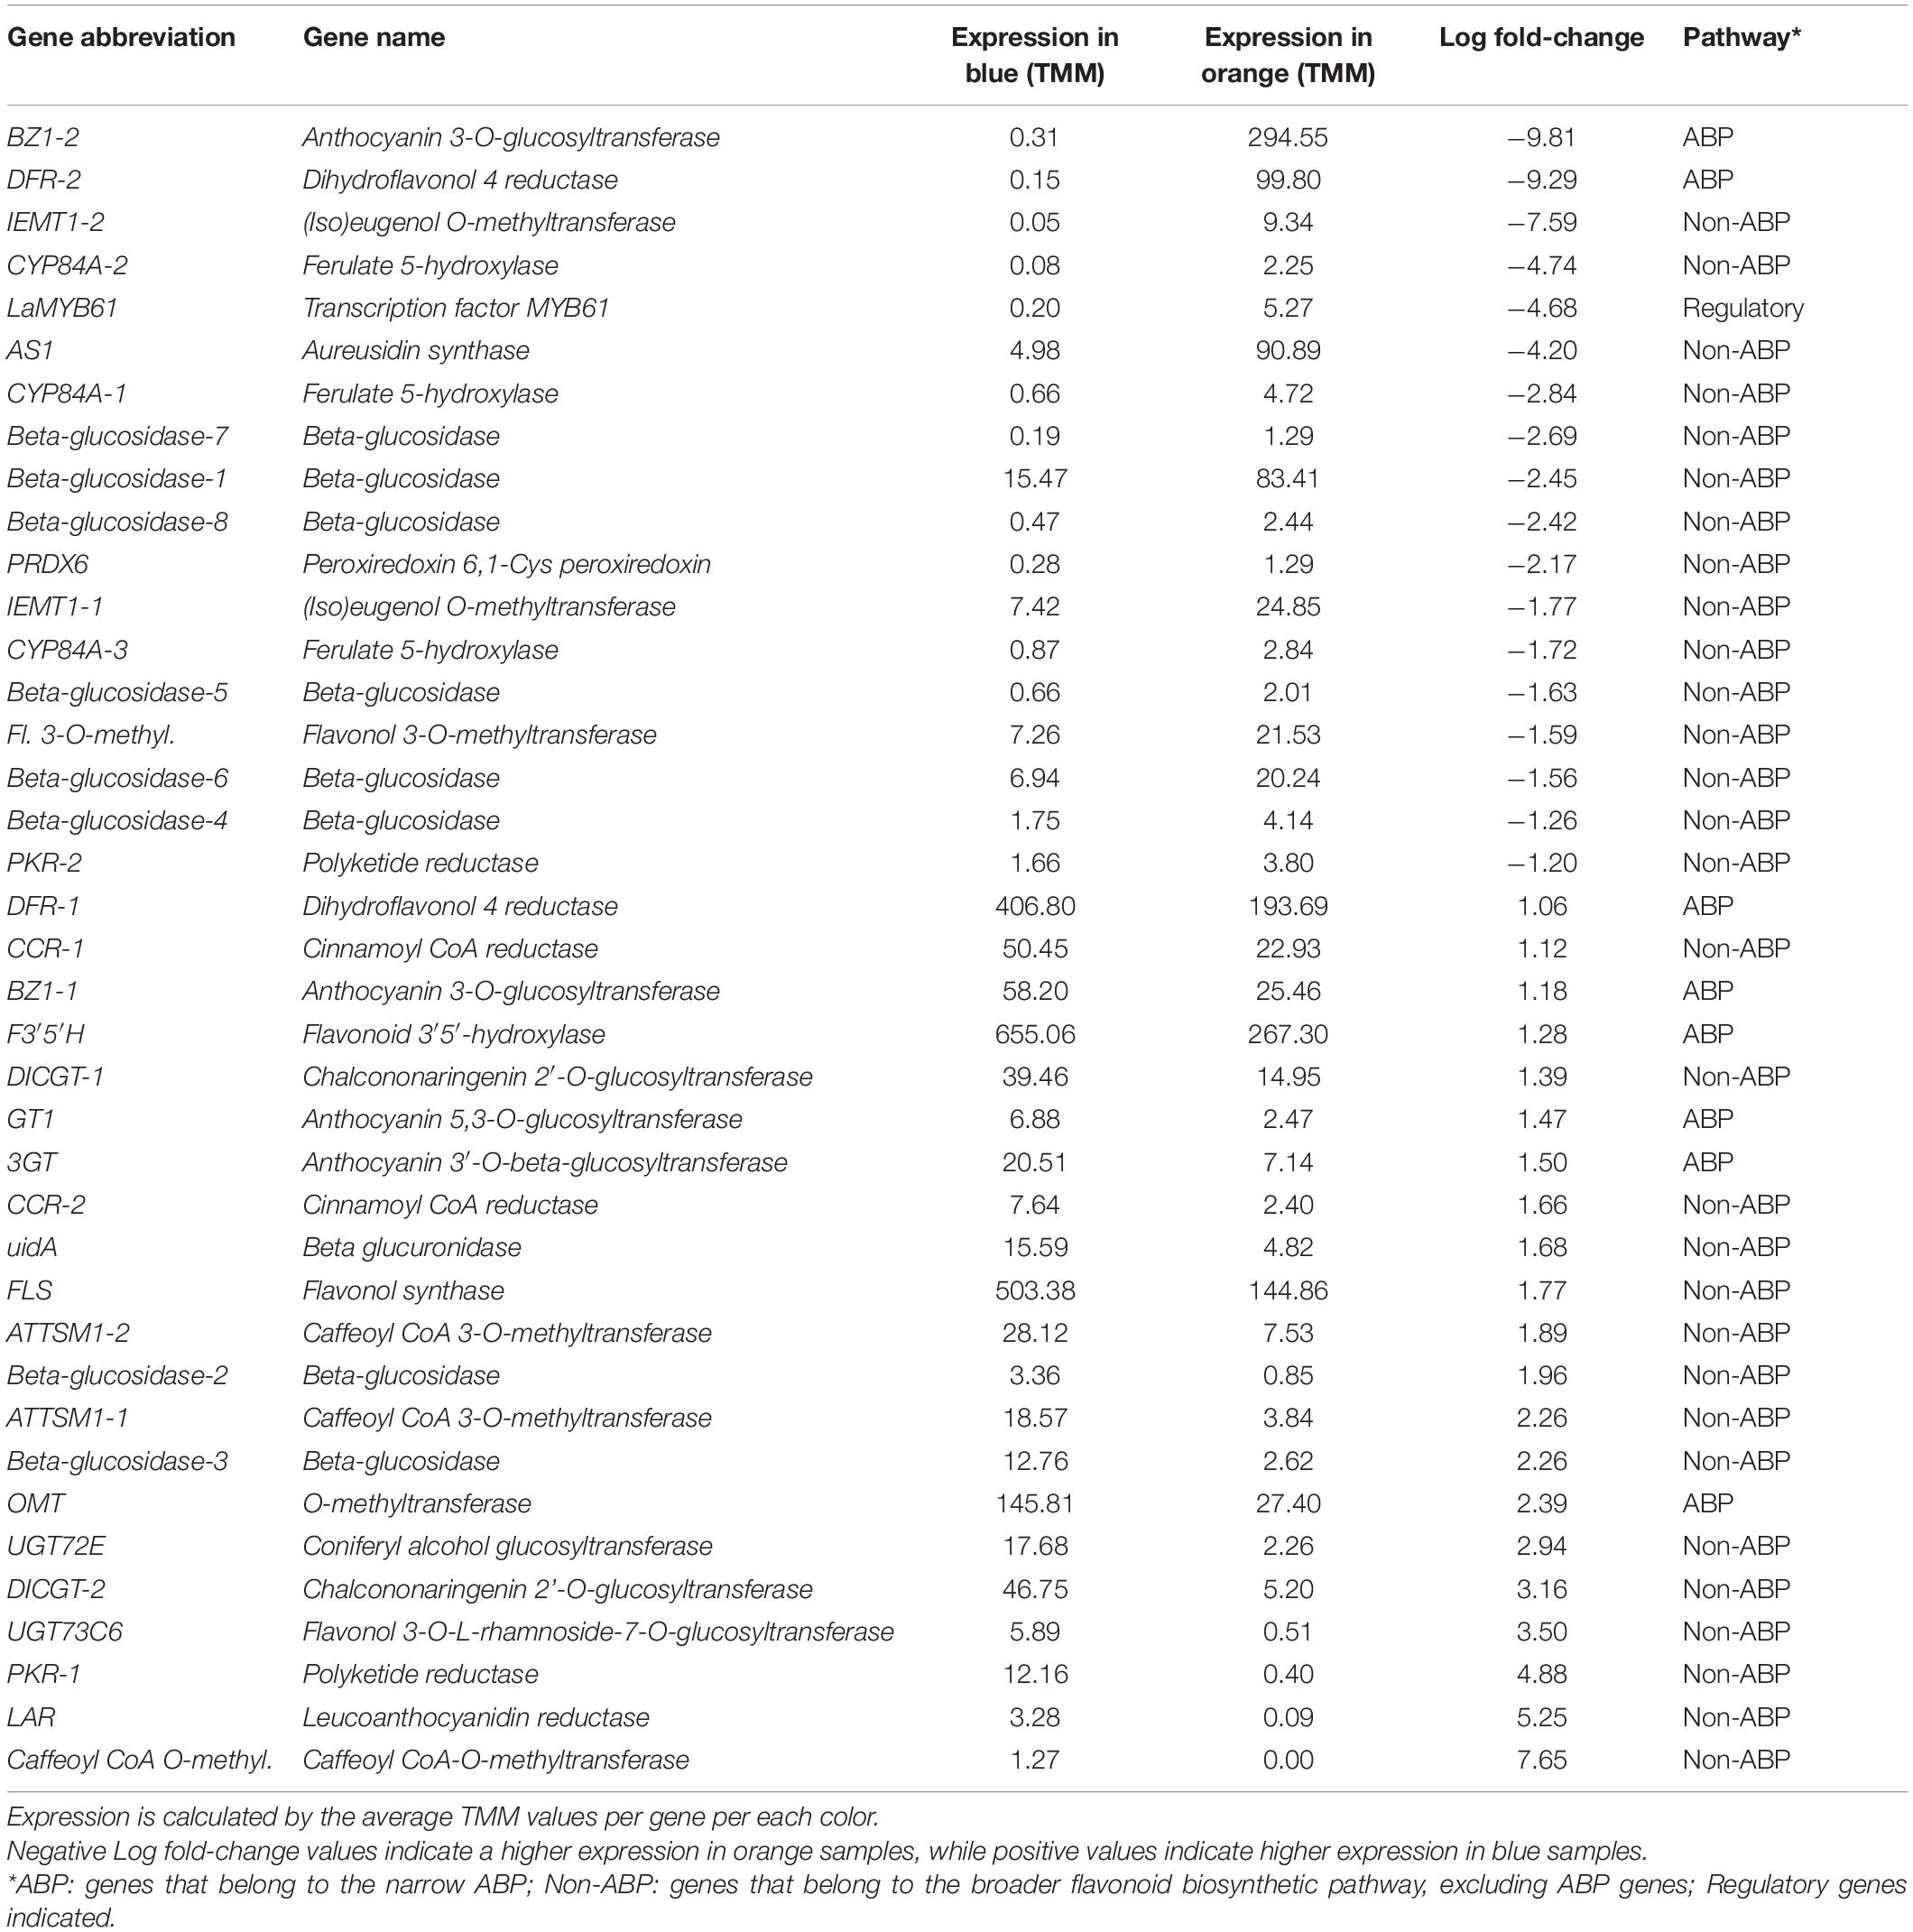
Table 1. Flavonoid biosynthetic pathway genes with significant differential expression between blue- and orange-flowered L. arvensis.
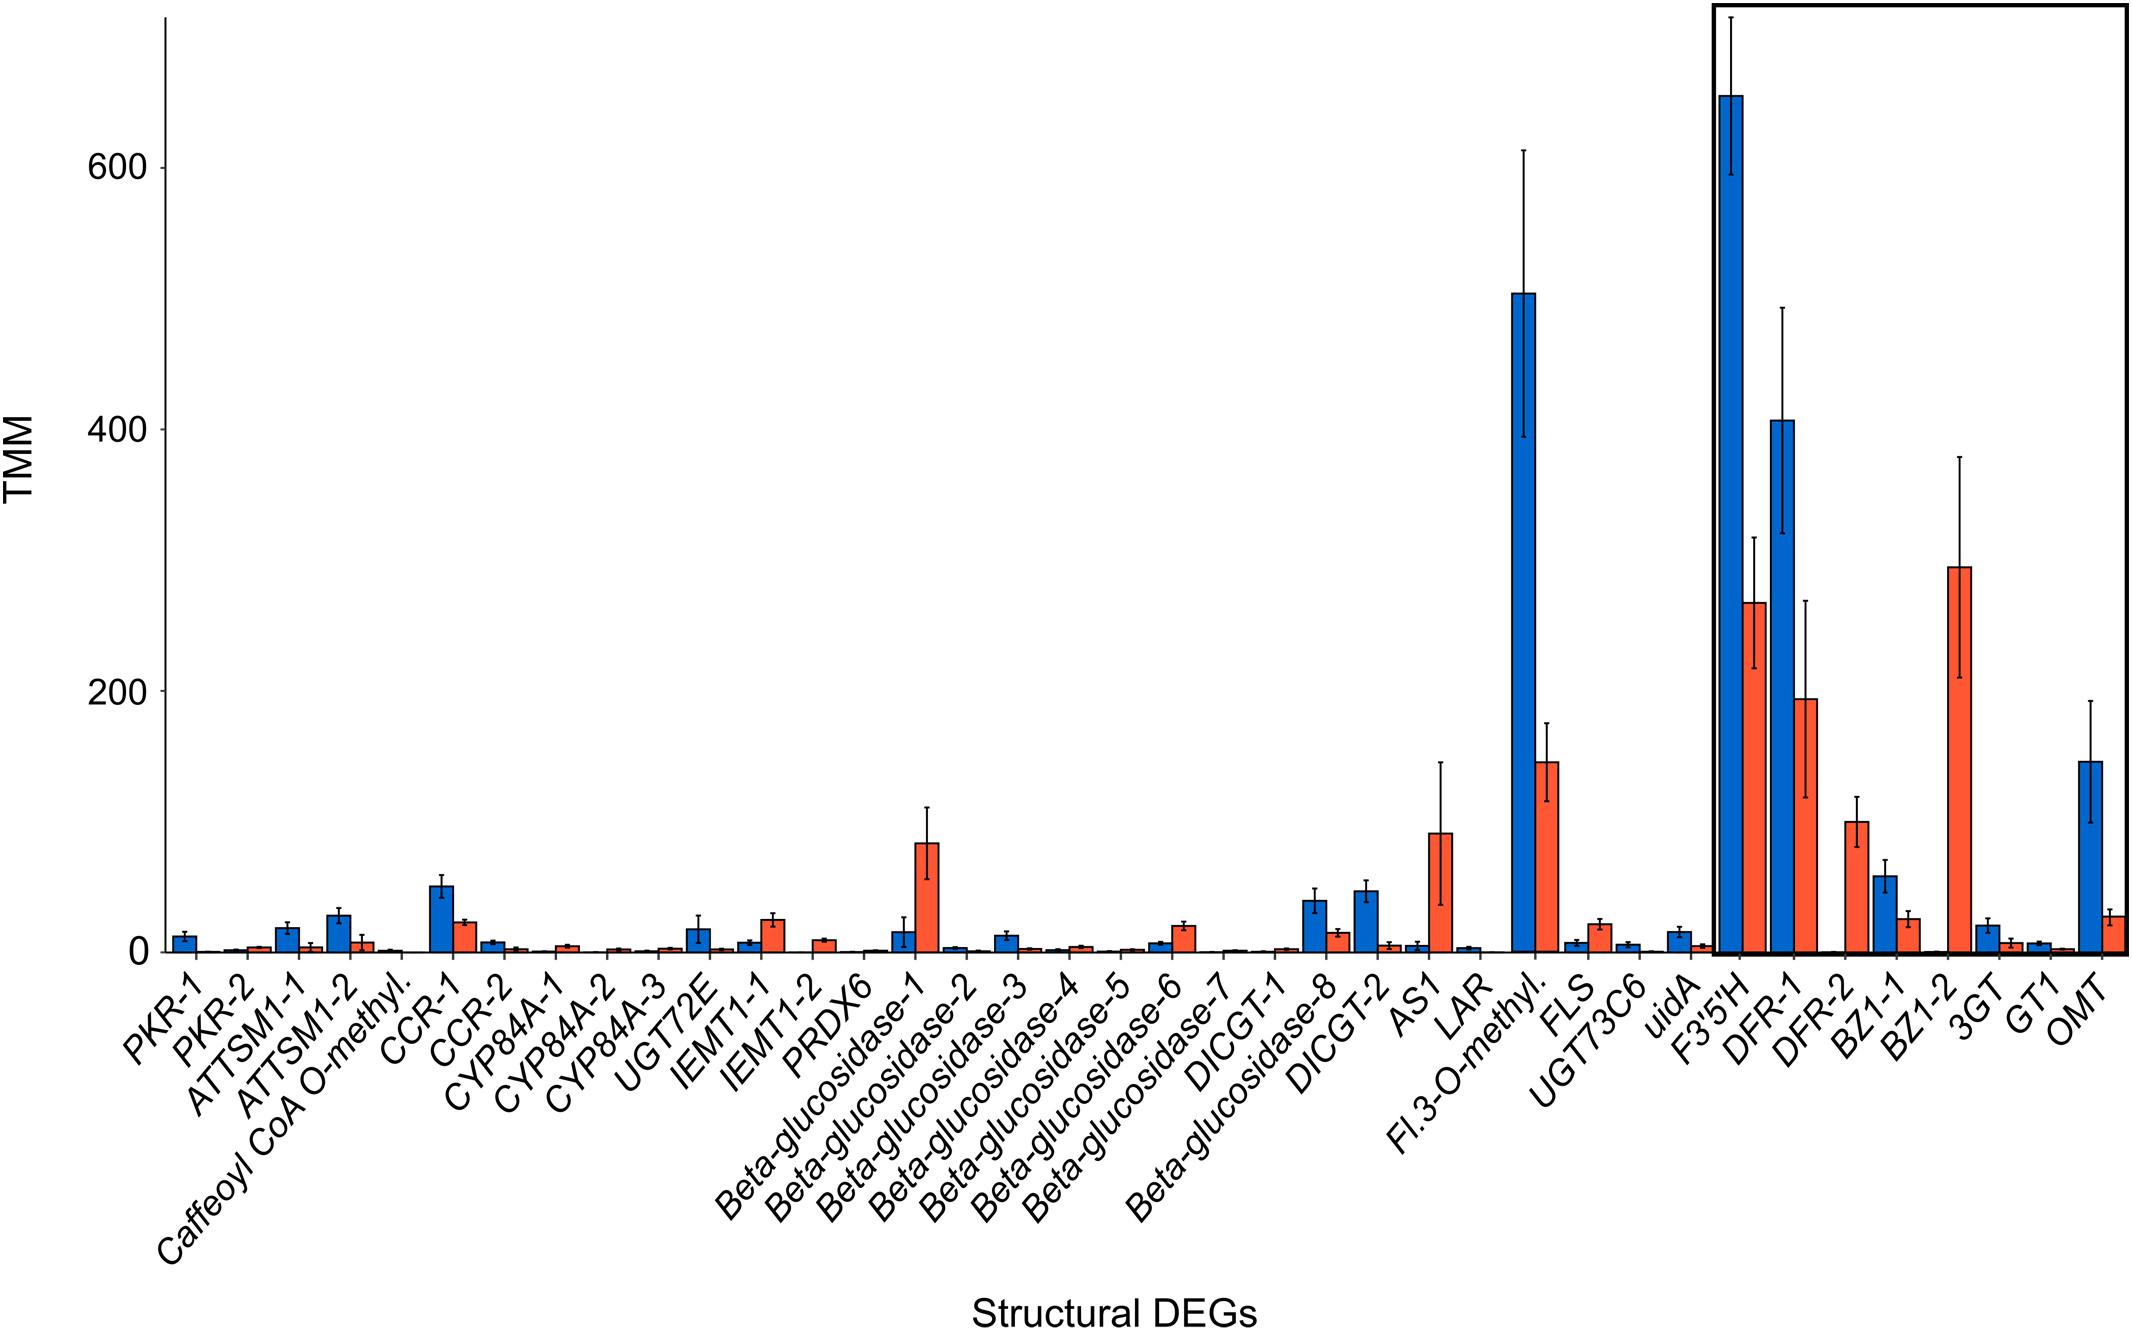
Figure 2. Expression of structural DEGs of the flavonoid biosynthesis pathway with significant differential expression between blue and orange L. arvensis. The colored bars represent the average expression level in TMM (trimmed mean of M-values) units and error bars show standard deviation. The black box indicates DEGs from the narrow ABP.
Phylogenetic Analysis of F3′5′H and DFR
Our reference-guided assembly produced complete CDS for the 67% of F3′5′H isotigs and 30% of DFR-1 isotigs, both in blue- and orange-flowered samples, while the 100% of DFR-2 isotigs were exclusively identified in orange-flowered samples. The phylogenetic analysis of F3′5′H produced a tree with monophyletic clade of L. arvensis samples sister to Cyclamen graecum (Accession QG891056) and closely related to several Camellia sinensis samples (Figure 3). Isotigs cluster in monophyletic or nearly monophyletic clades for each flower color (e.g., orange-i2 and orange-i10 form a clade; a large clade with nearly all blue samples). There are no signs of gene duplication within L. arvensis F3′5′H. Sample L19 (blue) may be a hybrid between blue and orange (even though these are inbred lines) since for some isotigs, L19 clusters with orange samples (i1, i4, i3) and for other isotigs, it arises from the base of a clade of blue-flowered samples (i2, i10).
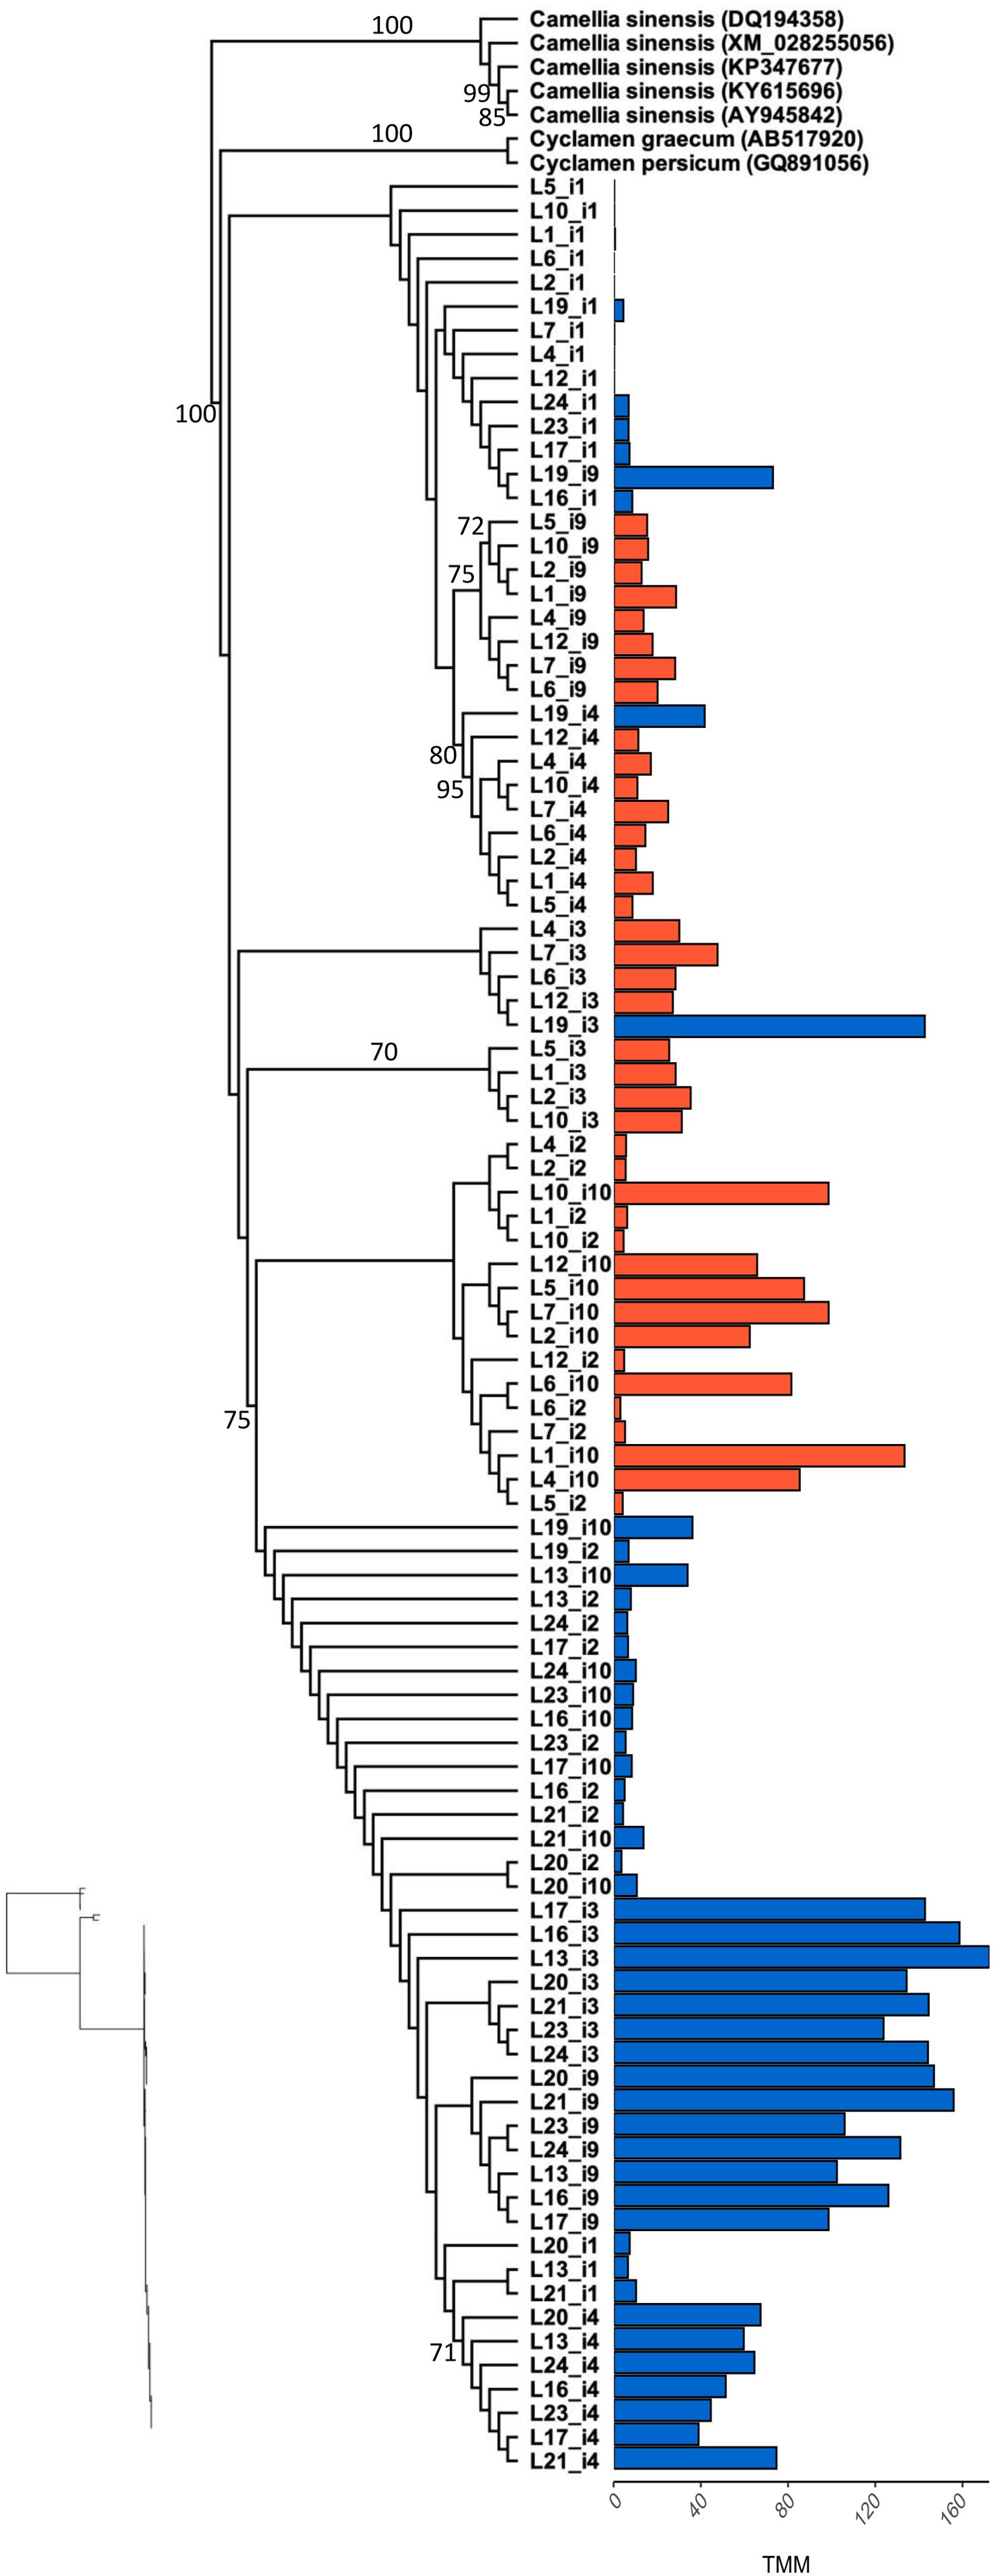
Figure 3. Maximum likelihood phylogenetic analysis of F3′5′H coding sequence for all L. arvensis isoforms (L1–12 = orange; L13–24 = blue). We included the top BLASTn hits for reference (scientific name followed by followed by Genbank Accession numbers). Bootstrap values are provided along the branch or at the node for values above 70%. The bar plot shows the expression value (TMM) per isotig for blue and orange flower colors. The isotigs with markedly shorter coding sequences than the Genbank references are F3′5′H-i1 and F3′5′H-i4. The maximum likelihood phylogram without tip labels (yet same order) is included to allow for relative branchlength comparisons.
The phylogenetic analyses of the two forms of DFR indicate that there are two distinct lineages of DFR (DFR-1 and DFR-2) and that L. arvensis samples of each are both reciprocally monophyletic yet the two DFRs are deeply diverged within angiosperms (i.e., DFR-1 and DFR-2 diverged long before the origin of Lysimachia) (Figure 4 and Supplementary Figure 4). The clade of orange-flowered DFR-2 samples is very strongly supported (100% bootstrap support). It is sister to several Genbank reference samples from the Asterids (members of the Asteraceae, Solanaceae, Convolvulaceae, Plantaginaceae). Alternatively, DFR-1 forms a very strongly supported clade (100% bootstrap) that is closely related to two samples from the Ericales (Cyclamen graecum and Camellia spp.). There is very strong support for a clade containing DFR-1 Camellia and Cyclamen to the exclusion of DFR-2 and the Asterid samples (100% bootstrap). There are 74 non-synonymous amino acid changes separating DFR-1 and DFR-2. Five of these are variable in DFR-1, but fixed in DFR-2 and one is variable in DFR-2, but fixed in DFR-1. This includes five amino acid replacements in known functional domains (see “SNP frequencies” subsection below). Since there were no blue DFR-2 sequences created during the reference-guided assembly, all further analyses comparing orange- and blue-flowered samples focus on DFR-1.
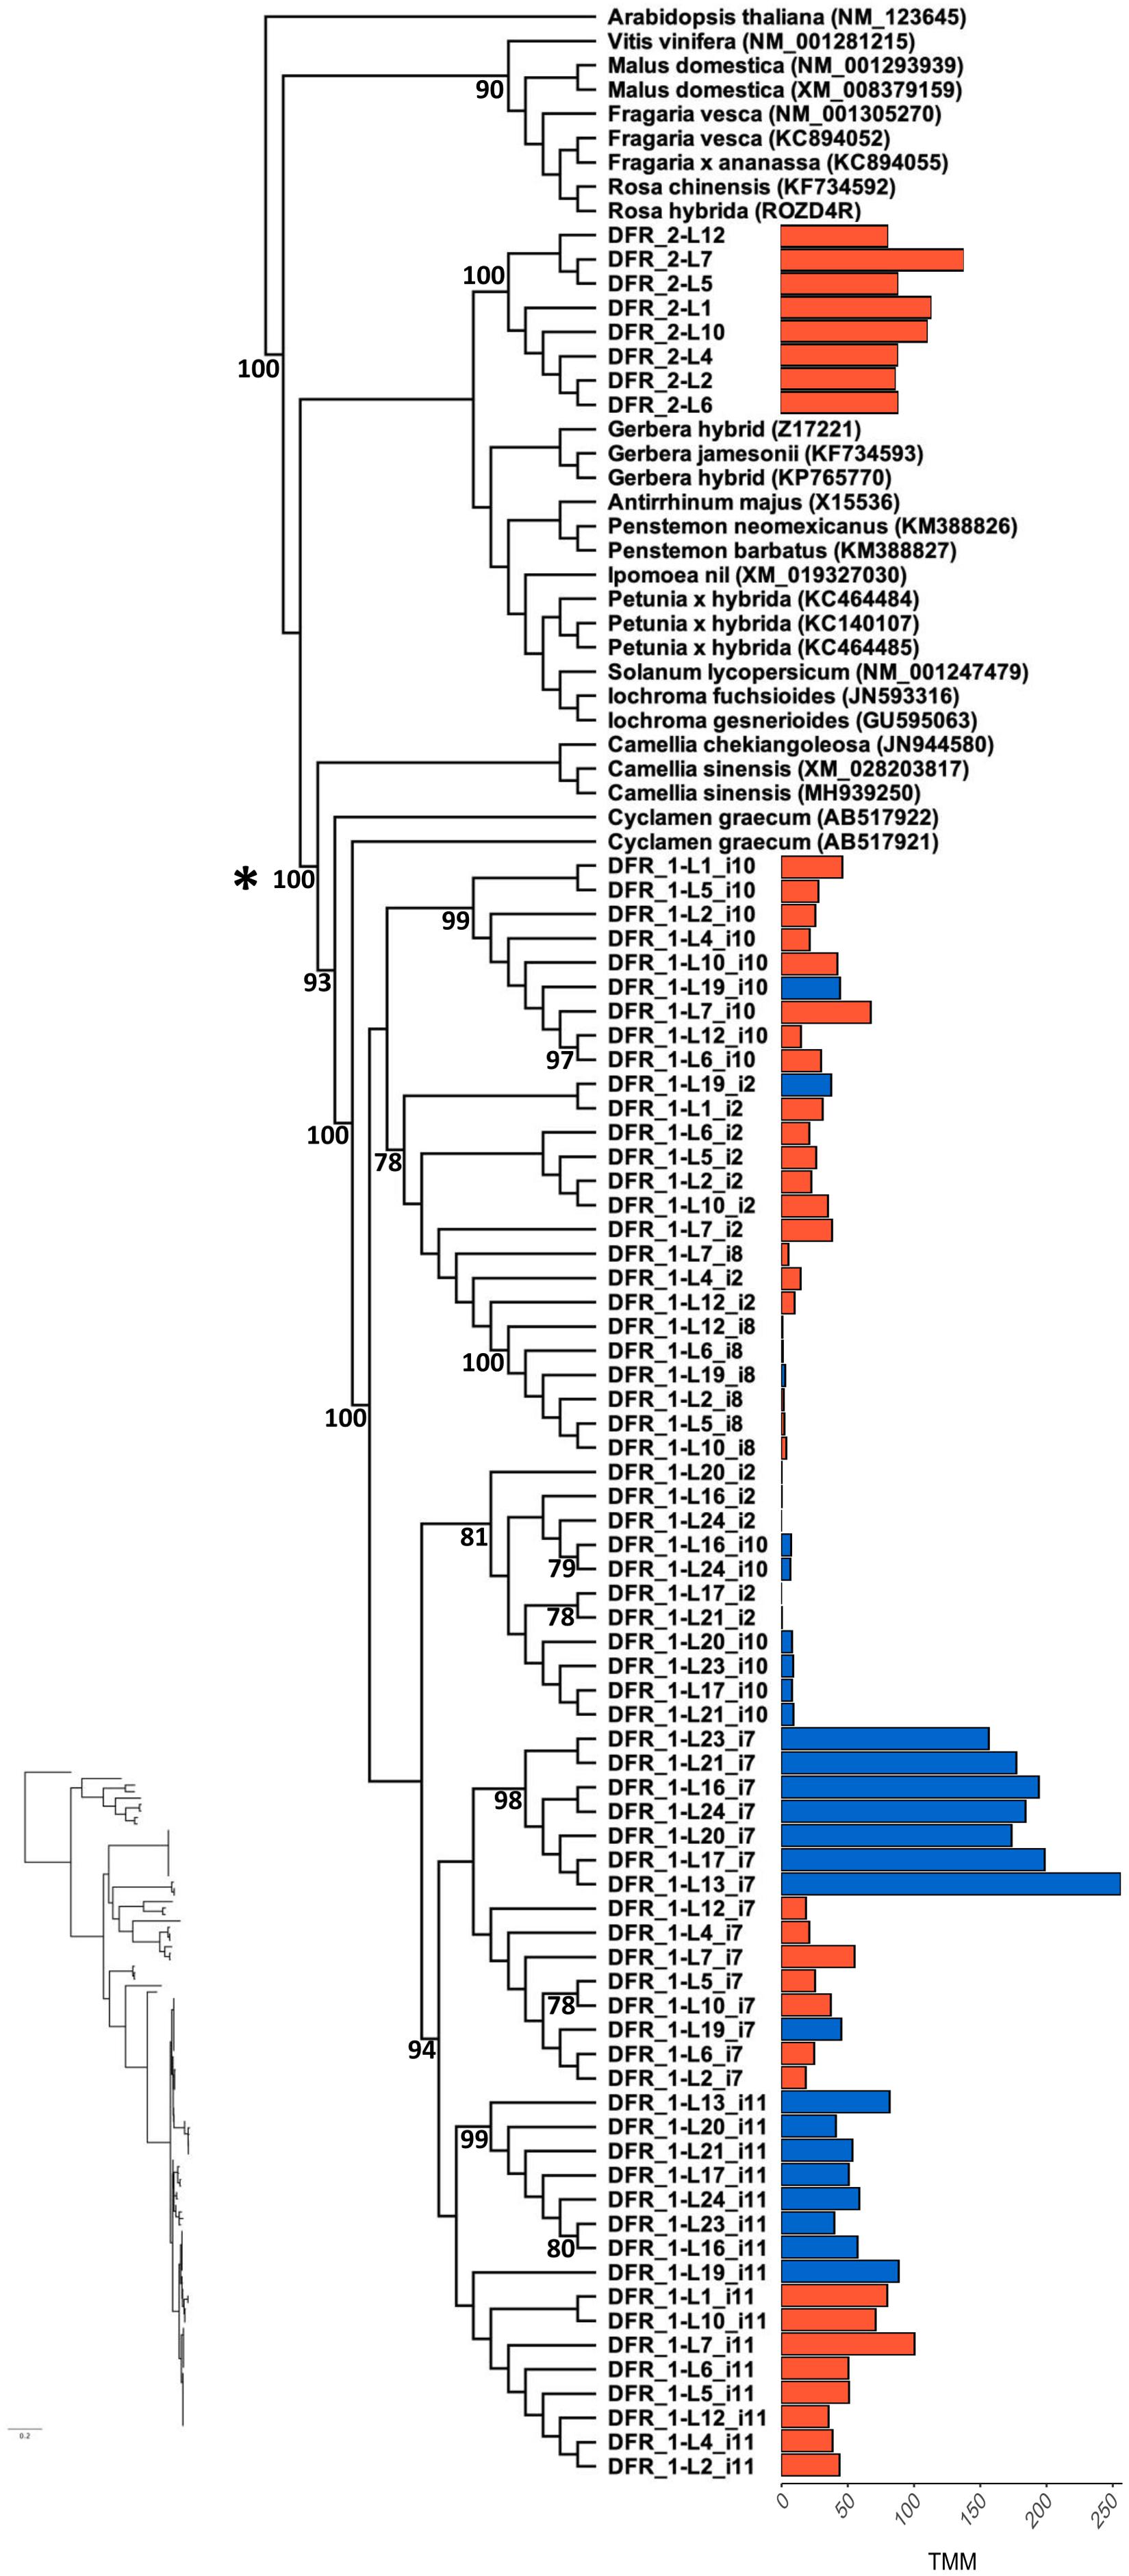
Figure 4. Maximum likelihood phylogenetic analysis of DFR-1 and DFR-2 coding sequence for all L. arvensis isoforms (L1–12 = orange; L13–24 = blue). We included the top BLASTn hits for reference (scientific name followed by followed by Genbank Accession numbers). Bootstrap values provided along the branch or at the node for values above 70%. We removed he 5′ and 3′ ends (24 and 52 bp, respectively) of the coding sequence because of alignments ambiguities. The bar plot shows the expression value (TMM) per isotig for blue and orange flower colors. The isotigs with markedly shorter coding sequences than the Genbank references are DFR-1-i7, DFR-1-i8, and DFR-1-i11. *Indicates the location of the putative gene duplication event. The maximum likelihood phylogram without tip labels (yet same order) is included to allow for relative branchlength comparisons.
For the DFR-1 clade, there are two patterns. The first pattern clusters isotigs into monophyletic clades with other isotigs of the same color (e.g., orange-i10, i2 and i8 form a strongly supported clade and blue-i10 and blue-i2 form a moderately supported clade; Figure 4). The second pattern consists of blue samples of one isotig which are sister to the orange samples from the same isotig (e.g., i7 and i11). Similar to the results for F3′5′H, the blue sample L19 falls within orange clades for all isotigs, sometimes with very strong bootstrap support, consistent with it being a hybrid.
SNP Frequencies for F3′5′H and DFR
We investigated SNP frequencies that correlate with flower color in two candidates within the narrowly defined ABP genes. For F3′5′H, there were four non-synonymous SNPs in the CDS (Figure 5A). Two of these were fixed for all orange samples in all isotigs and variable in all blue samples for all isotigs (bp472 and bp1426; Table 2). Both had BLOSUM62 scores of +1 (meaning relatively common amino acid replacements), yet each of them involved significant changes in the biochemistry of the amino acids involved (e.g., the SNP at bp472 changes from a positively charged H to a polar uncharged N and the SNP at bp1426 changes from a positively charged K to a negatively charged E). There were 18 additional synonymous SNPs in the F3′5′H CDS most of which were variable in blue samples, but not in orange samples (Supplementary Table 7). Over all 22 F3′5′H SNPs (synonymous and non-synonymous), the frequency differences between blue- and orange-flowered samples (across isotigs) ranged from 0.09 to 0.83 (mean 0.53). There were an additional five SNPs in the 5′-UTR and six SNPs in the 3′-UTR. The average difference between blue- and orange-flowered SNP frequencies in the UTRs was 0.57 (0.09–0.79). None of the non-synonymous SNPs for F3′5′H were located in any of the known functional domains (Figure 5A).
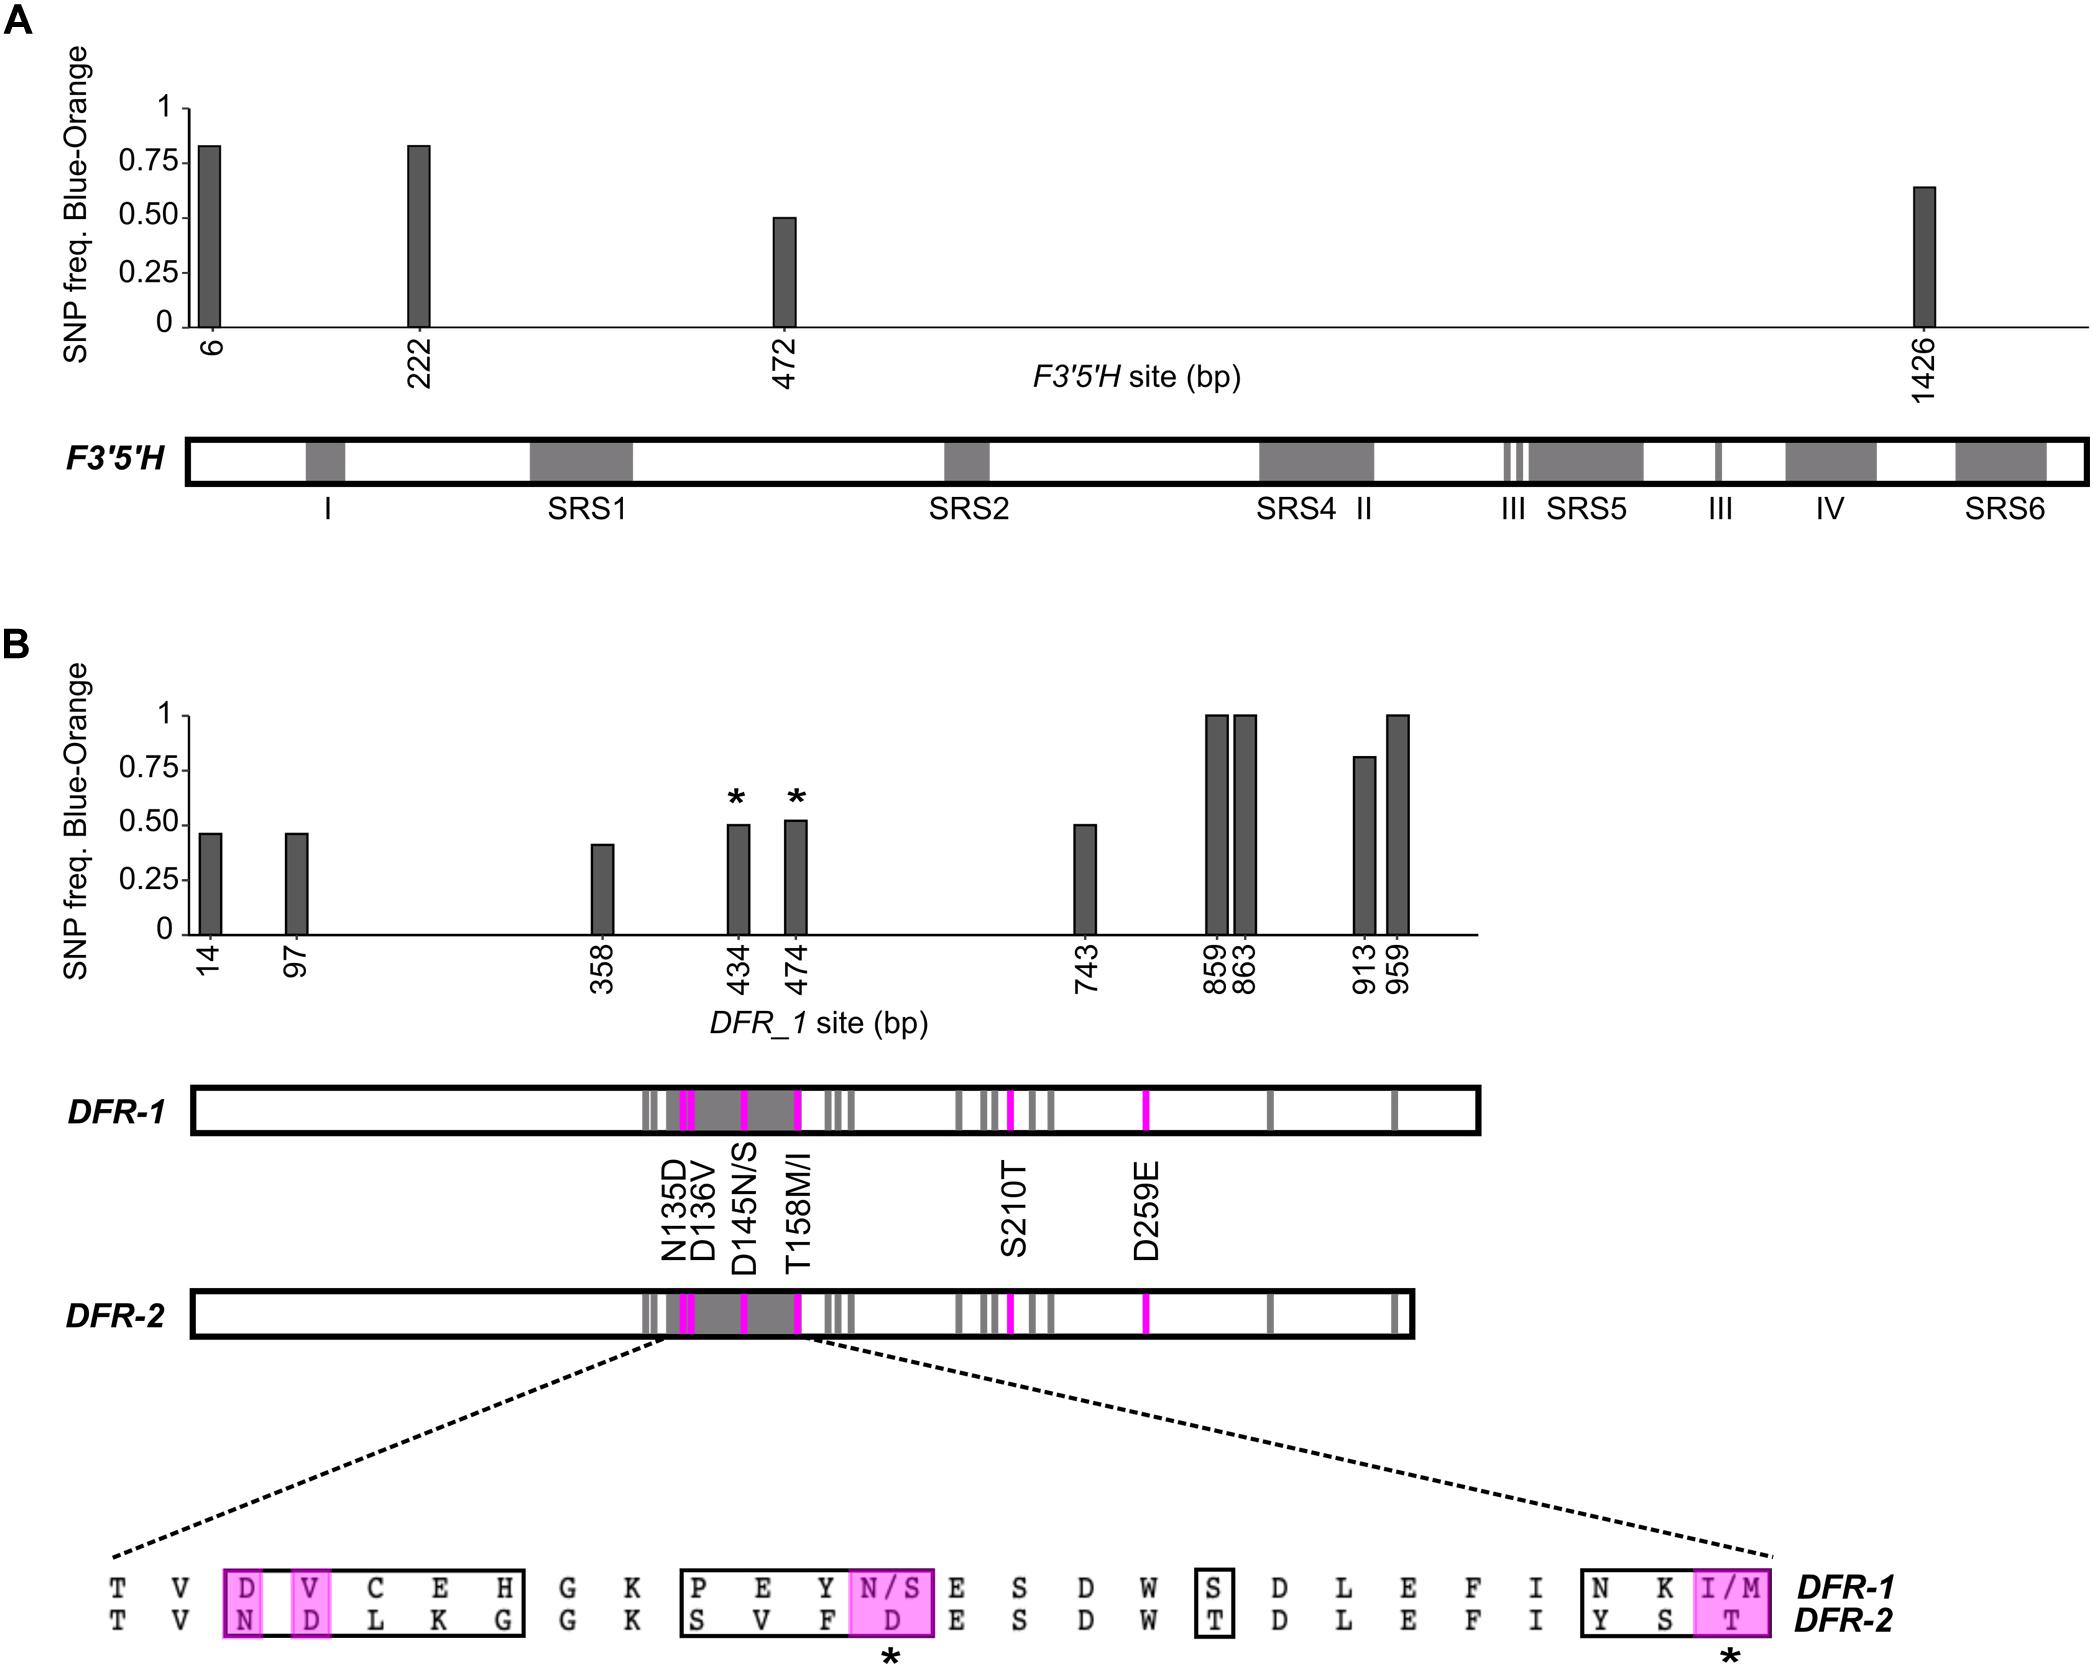
Figure 5. Non-synonymous SNP analysis of F3′5′H and DFR for L. arvensis. SNP frequency graphs are aligned with the gene diagram indicating known functional domains (gray). For F3′5′H (A) there are five binding regions (SRS; Seitz et al., 2007) and other known functional domains (I-IV; Guo et al., 2019). The DFR analysis (B) shows non-synonymous SNP frequencies in DFR-1 in the graph. Gene diagrams show the substrate specificity region (amino acid sites 133–158; Johnson et al., 2001) and other previously identified substrate binding sites (Petit et al., 2007; Smith et al., 2012) in gray. Amino acid changes between blue and orange DFR-1 located in a substrate binding region are marked with *. Amino acid changes between DFR-1 and DFR-2 identified in other works to be relevant to the substrate specificity differentiation between colors (Petit et al., 2007; Smith et al., 2012) are indicated in the diagram (pink) and their location and single letter abbreviation are shown between the DFR diagrams. An alignment of DFR-1 and DFR-2 consensus sequences of the 26 amino acids from the substrate specificity region is provided, highlighting all the amino acid changes in a black box (sites 133-158; relevant amino acid changes shown in the gene diagram are highlighted in pink).
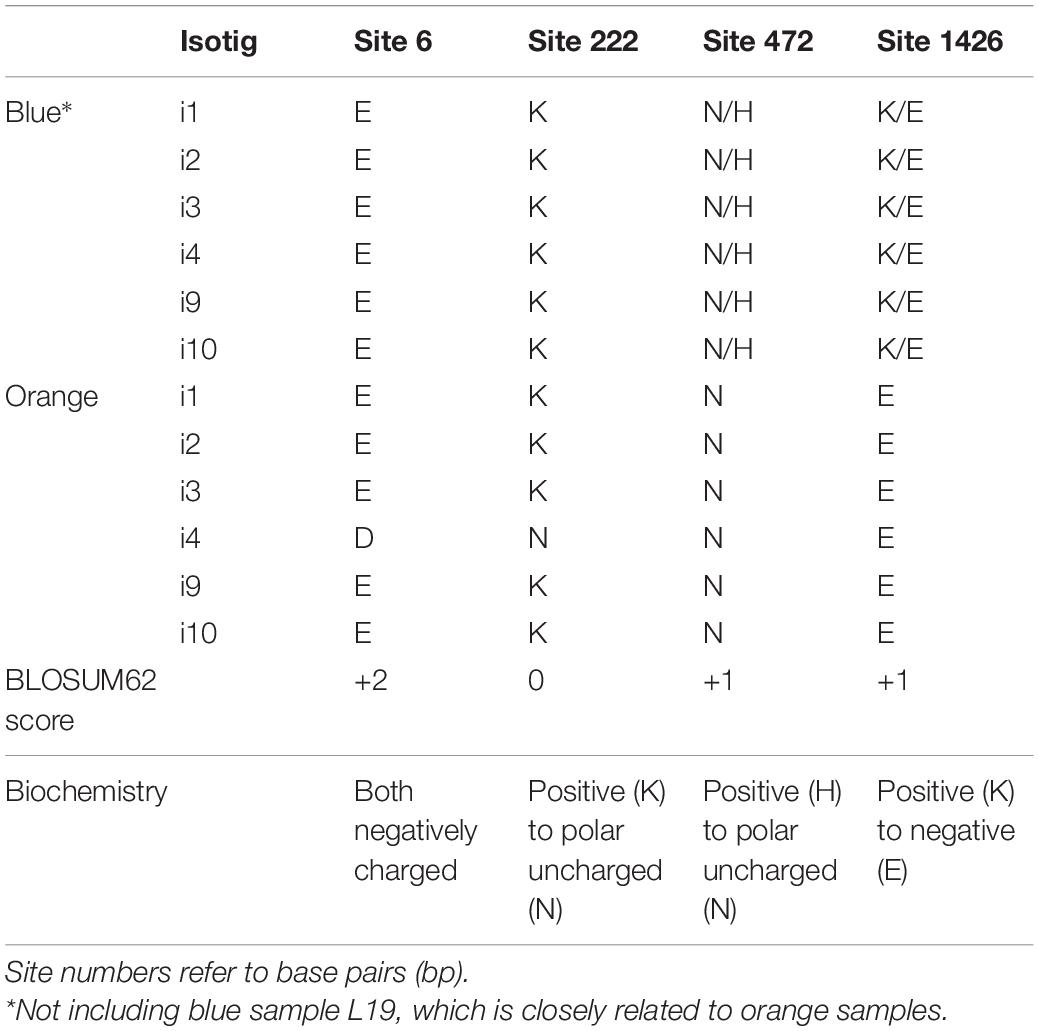
Table 2. Comparison of amino acid (AA) variation in the F3′5′H non-synonymous SNP sites of the coding sequences between blue and orange L. arvensis isotigs.
Since there are well-characterized functional domains in DFR that provide substrate specificity conferring blue-to-red shifts in other species (Johnson et al., 2001; Petit et al., 2007; Des Marais and Rausher, 2008; Smith et al., 2012), we compared DFR-1 and DFR-2 for fixed amino acid differences at these sites. For the 26 residue substrate specificity region identified by Johnson et al. (2001) (amino acids 133 to 158 in our alignment), the L. arvensis DFR-2 has fixed differences in 13 of them compared to DFR-1 (Figure 5B). For the additional 12 substrate binding sites identified by Petit et al. (2007), we found only one site (amino acid 210) where DFR-2 was fixed with a serine (S) compared to a threonine (T) in DFR-1 (BLOSUM62 score = +1; both polar uncharged amino acids). Two more color-differentiating sites identified by Smith et al. (2012) were fixed in both DFRs (Figure 5B). In addition to these five amino acid substitutions in known functional domains, we identified 63 more amino acid changes outside known functional domains that were fixed between DFR-1 and DFR-2 and another six that were variable in one copy of DFR, yet fixed in the other.
Since DFR-2 is only expressed at considerable levels in orange flowers, we focus our color-differentiating SNP analysis on DFR-1 where we have sequences of both blue- and orange-flowered individuals. Over all 54 DFR-1 SNPs (synonymous and non-synonymous), the frequency differences between blue- and orange-flowered samples (across isotigs) ranged from 0.12 to 1 (mean 0.46). There were ten non-synonymous SNPs with considerable differences in frequency between flower colors (Table 3). The non-synonymous SNPs located in the binding specificity region (bp434 and bp474; Figure 5B) showed clear patterns of color frequency differences between the two flower color types (bp434 = 0.50 SNP frequency difference; bp474 = 0.52 SNP frequency difference; Supplementary Table 8). Both have a BLOSUM62 score of +1 and are amino acid substitutions within the same general biochemical category (bp434 = both polar uncharged amino acids; bp474 = both hydrophobic amino acids). Three non-synonymous SNPs in the 3′ half of the DFR-1 coding sequence that (only present in i2 and i10) were completely differentiated between blue- and orange-flowered samples (bp859, bp863, and bp959). Their BLOSUM62 scores range from 0 to +2 and two of them represent biochemically distinct amino acid replacements (bp859 and bp913 = negatively charged to polar uncharged amino acids; Table 3). There were 44 additional synonymous SNPs in the DFR-1 CDS (Supplementary Table 8).
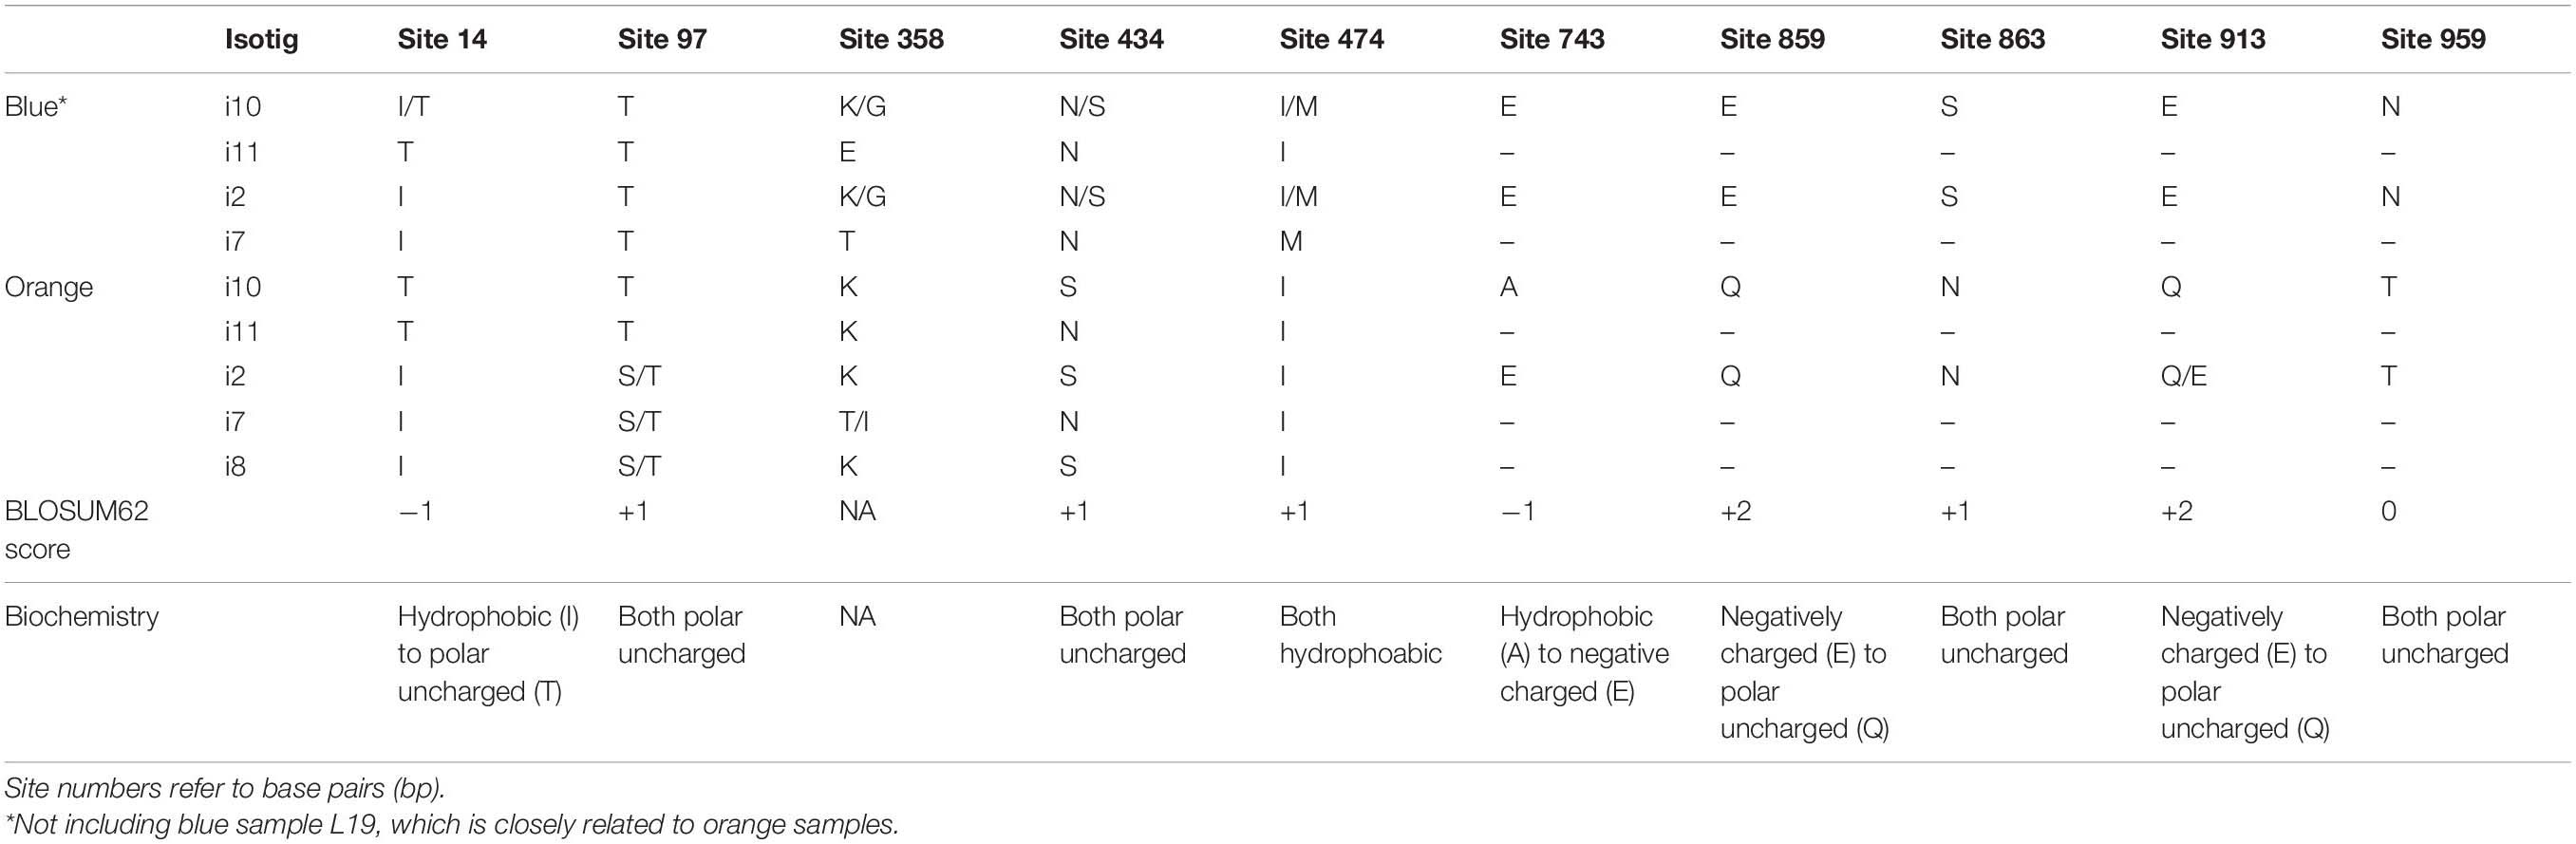
Table 3. Comparison of amino acid (AA) variation in the DFR_1 non-synonymous SNP sites of the coding sequences between blue and orange L. arvensis isotigs.
Identification of Flavonoid Compounds by UHPLC-MS
Ultra-High Performance Liquid Chromatography analysis confirmed that malvidin-3-rhamnoside is the main flavonoid that accumulates in the blue petals of L. arvensis (relative content = 98.4%; Table 4 and Figure 6). In addition, blue petals also contain traces of the aglycone malvidin and delphinidin derivatives. In contrast, orange petals contain four derivatives of pelargonidin with different glycosylation patterns: pelargonidin-3-glucoside (60.1% relative content), pelargonidin-3-glucoside-glucuronide (26.5%), pelargonidin-3-rhamnoside (11.6%), and pelargonidin-3-diglucoside (trace amounts; Table 4 and Figure 6). We also detected traces of the flavone luteolin-7-glucoside in the blue samples, and small amounts of two flavonols present in some orange samples – syringetin (trace) and kaempferol-3-glucoside (1.7%). The putative locations of these compounds in the flavonoid biosynthetic pathway are shown in Figure 7.
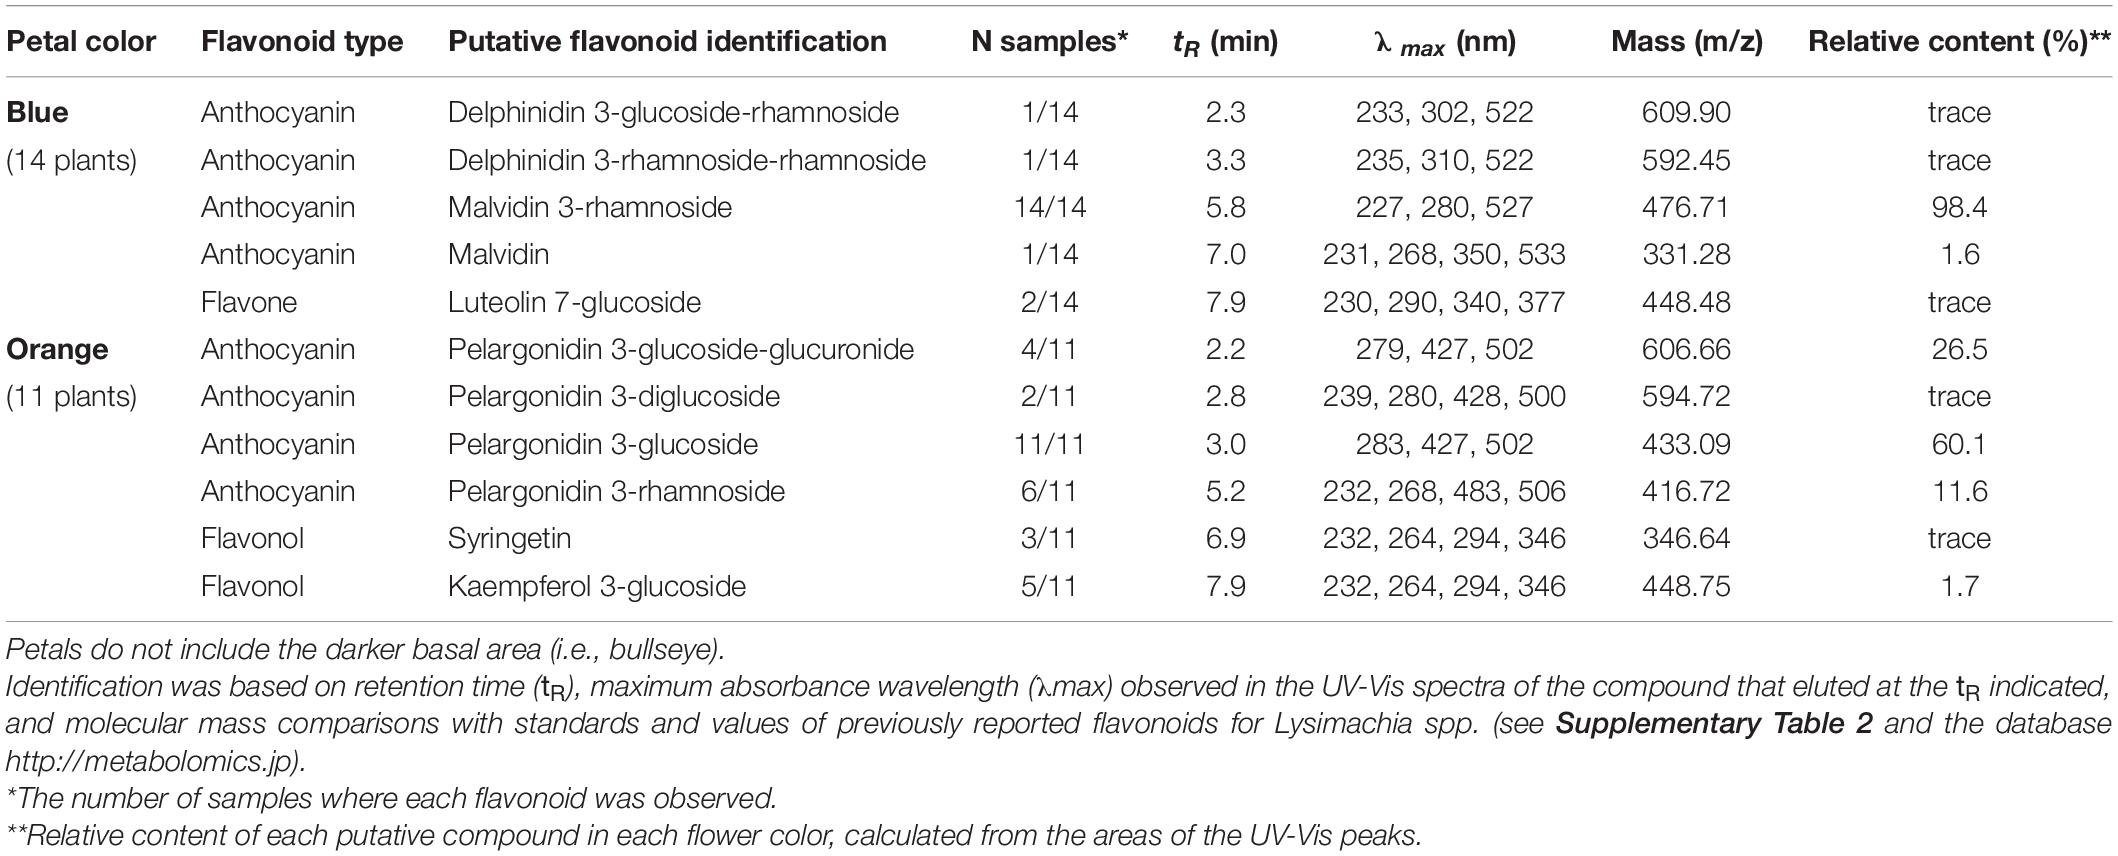
Table 4. Putative flavonoid identification in blue and orange petals of L. arvensis from the UHPLC–MS biochemical analysis (MS analysis was acquired in positive mode).
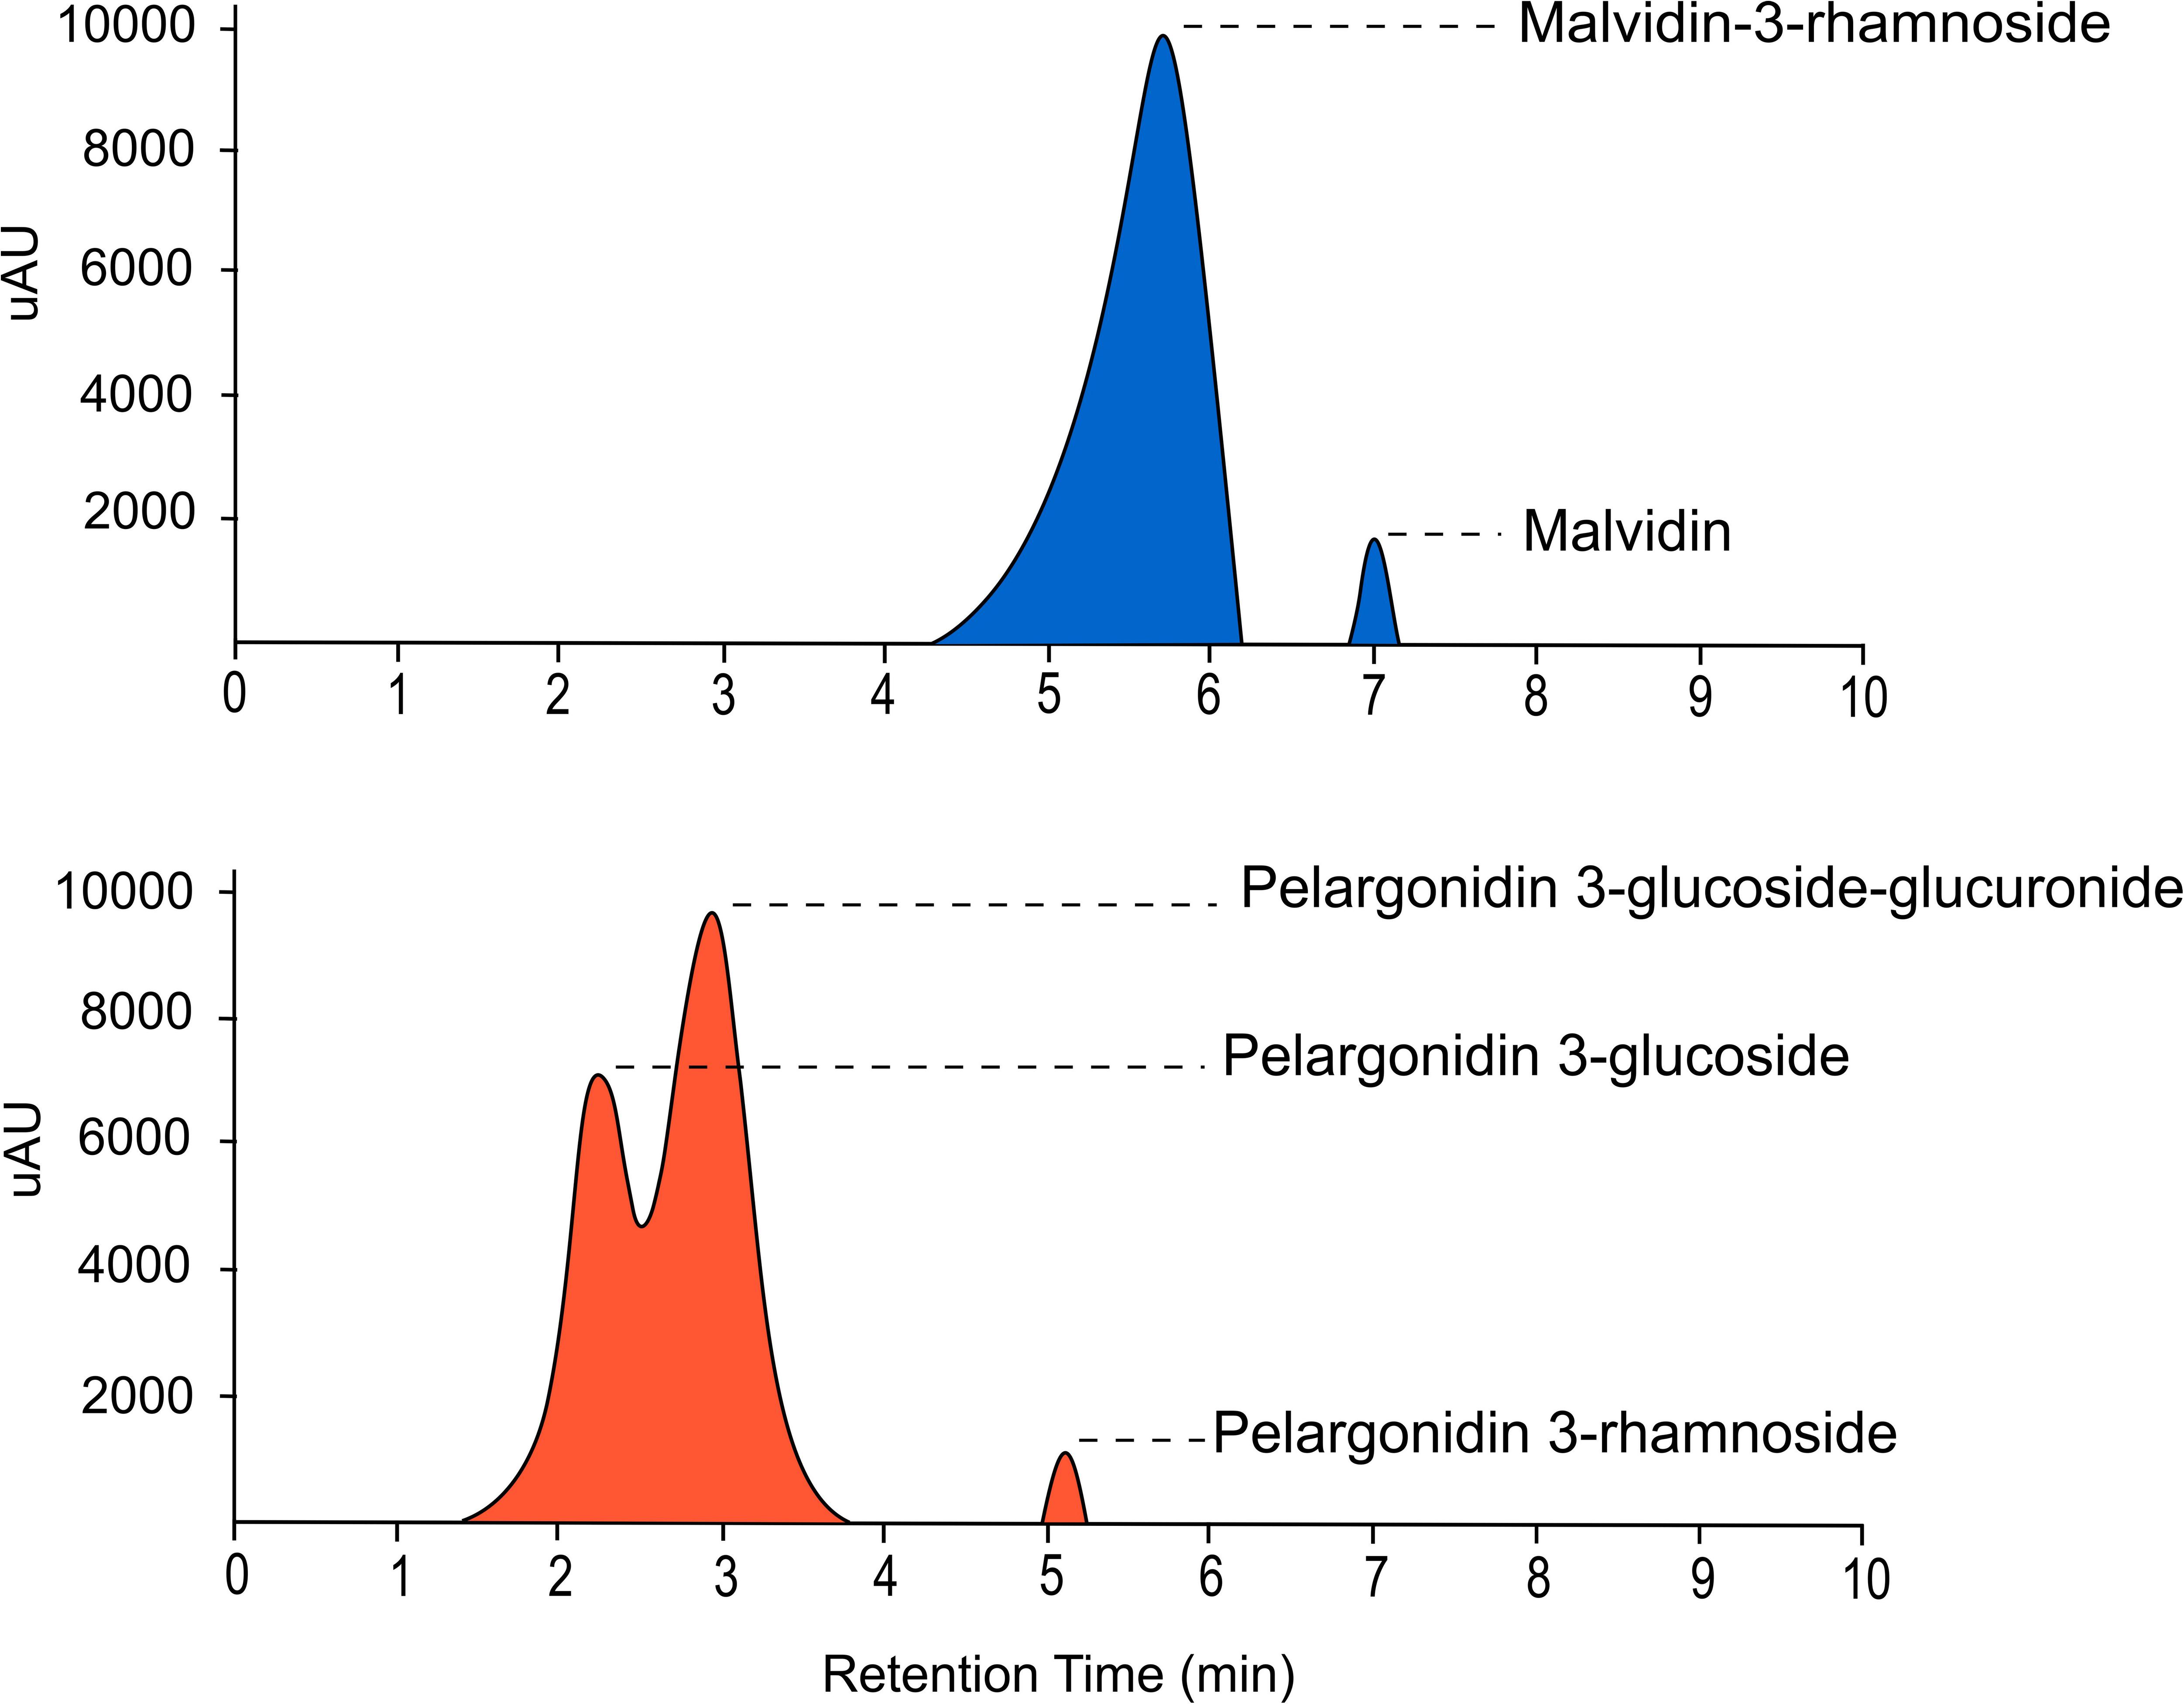
Figure 6. UHPLC-MS chromatograms of the main anthocyanins present in blue (above) and orange (below) petals of L. arvensis detected at 520 nm.
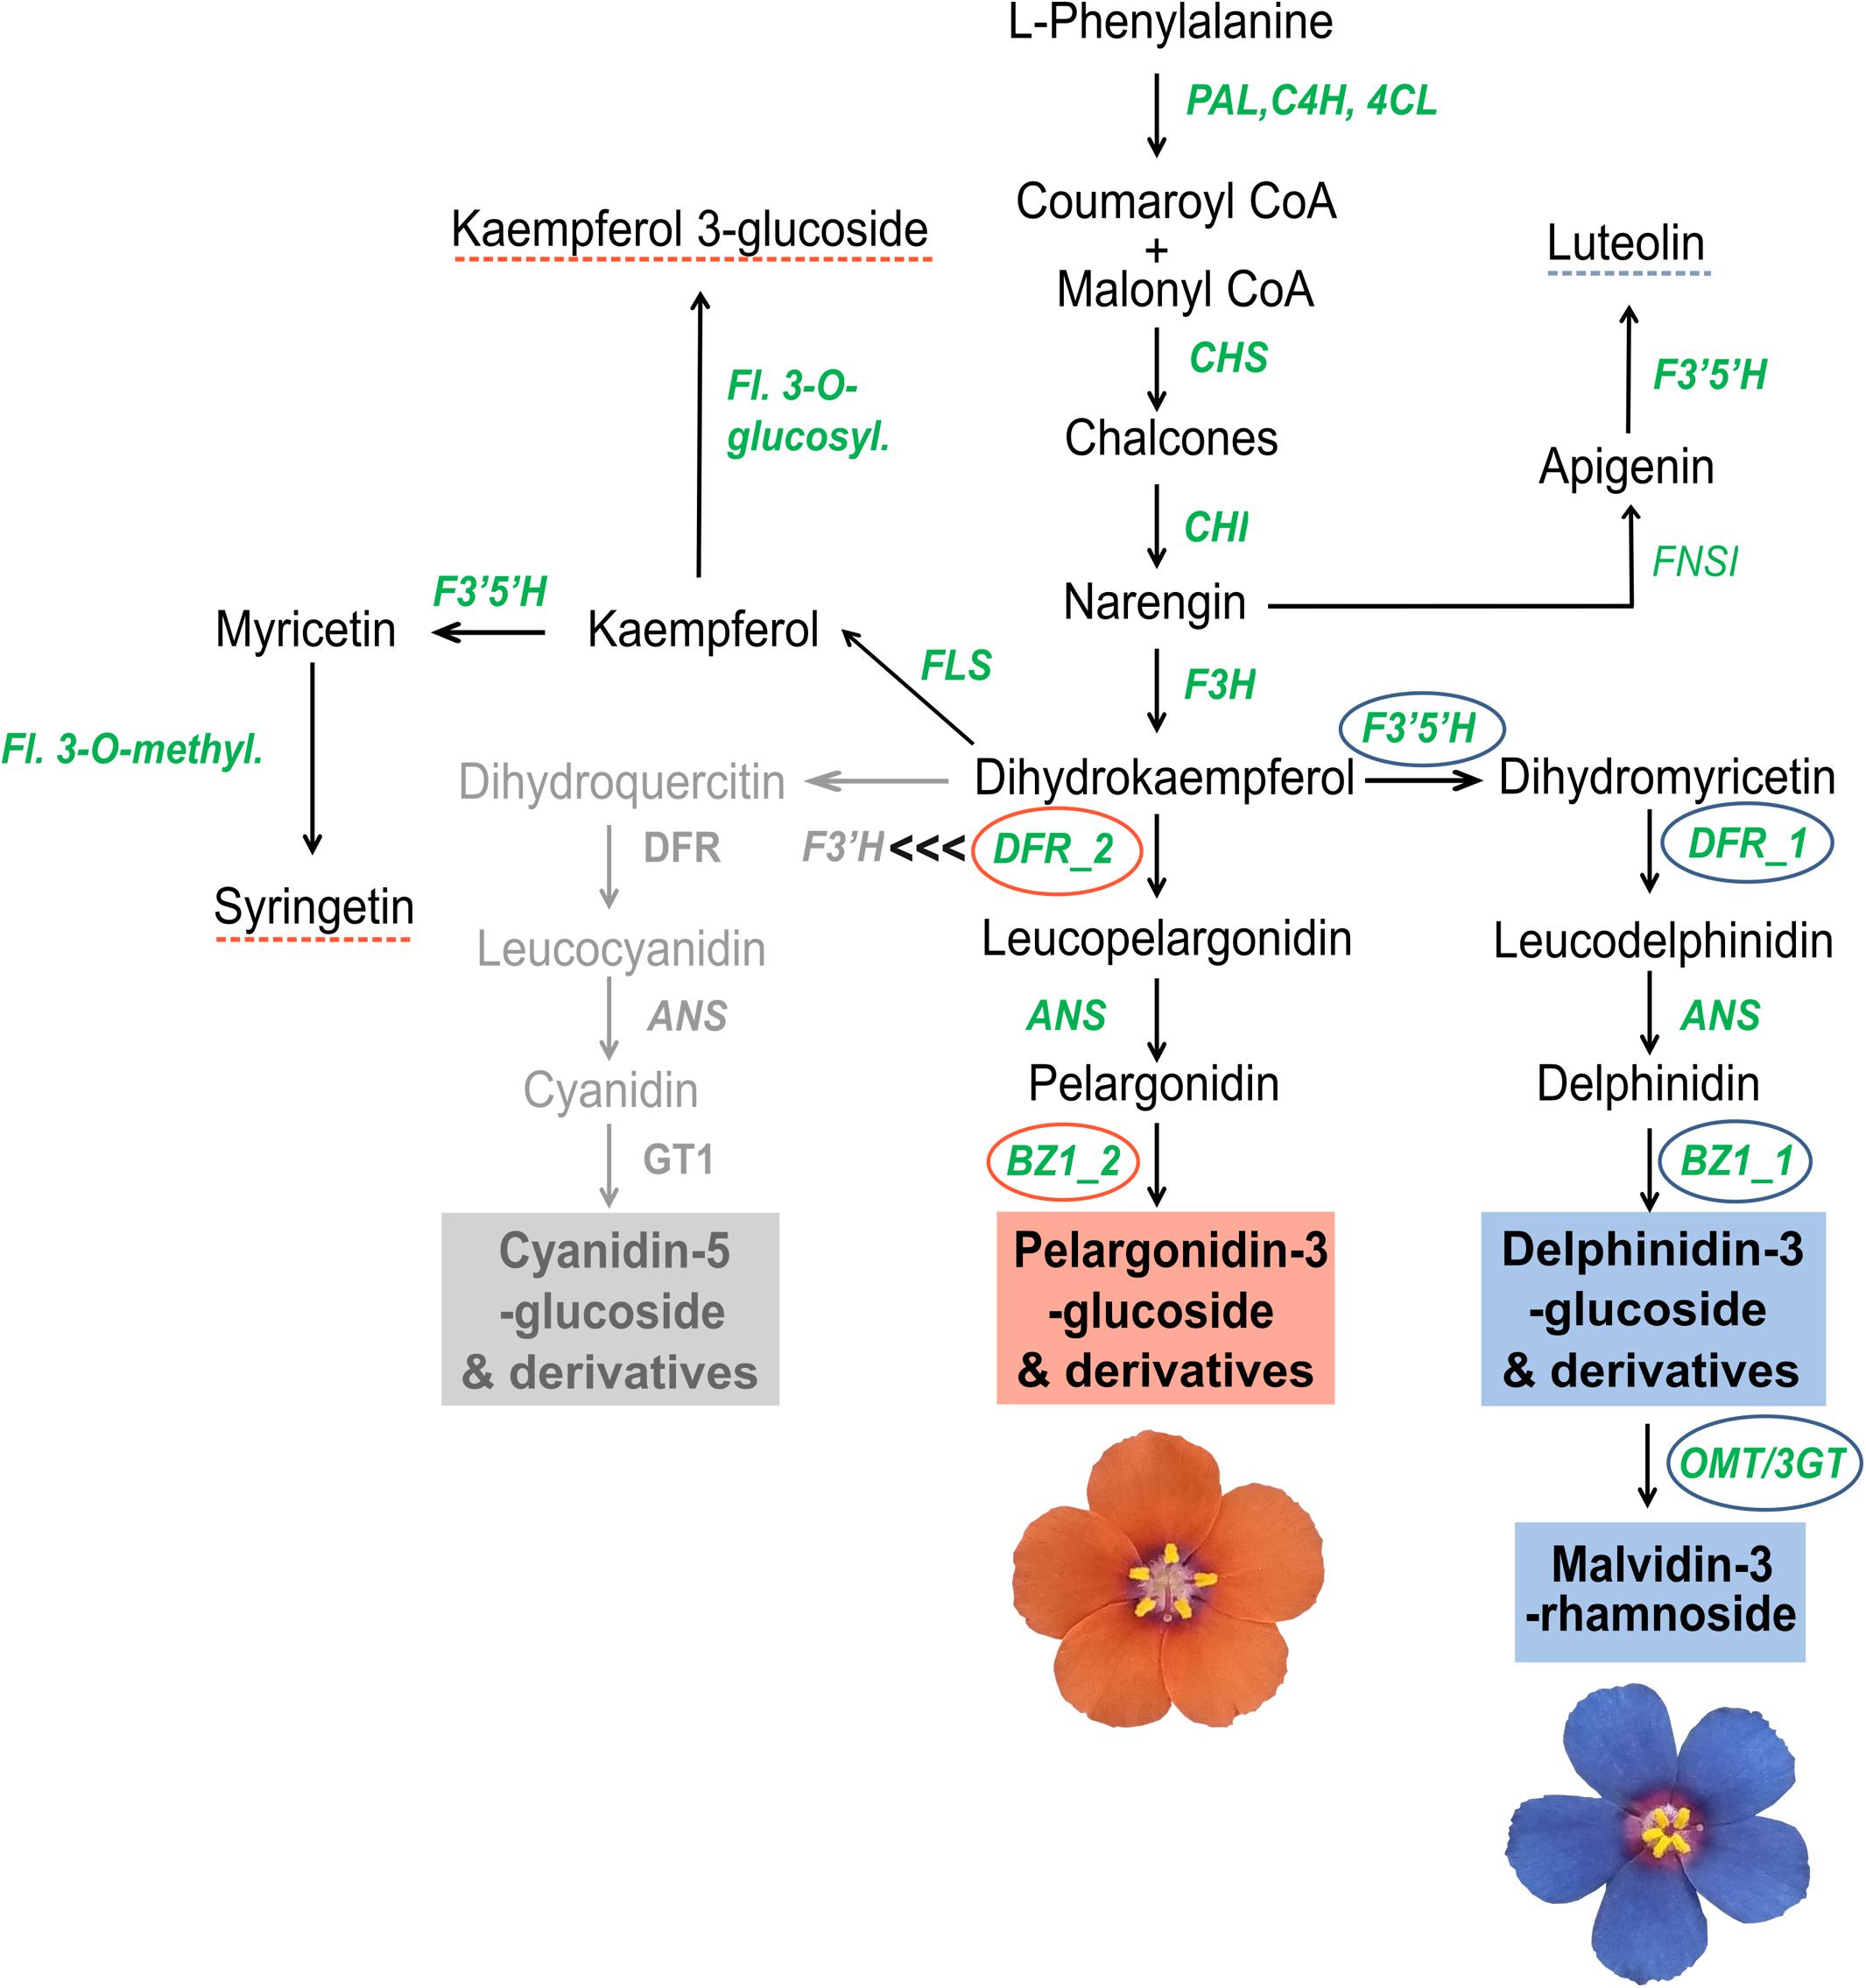
Figure 7. Tentative scheme of the anthocyanin biosynthetic pathway for L. arvensis petals. Structural genes involved in the broader flavonoid biosynthetic pathway are shown in green: Phenylalanine ammonia-lyase (PAL), Cinnamic 4-hydroxylase (C4H), 4-coumarate-CoA ligase (4CL), Chalcone synthase (CHS), Chalcone isomerase (CHI), Flavanone 3-hydroxylase (F3H), Flavonoid 3′,5′-hydroxylase (F3′5′H), Dihydroflavonol 4-reductase (DFR), Anthocyanin synthase (ANS), Anthocyanidin-3-o-glucosyltransferase (BZ1), Anthocyanin-3′-o-beta-glucosyltransferase (3GT), O-methyltransferase (OMT), Flavonol synthase (FLS), Flavonol-3-o-glucosyltransferase (Fl. 3-o-glucosyl.), Flavone synthase I (FNSI), and Flavonol 3-O-methyltransferase (Fl. 3-O-methyl.). Narrow ABP genes differentially expressed in orange and blue L. arvensis are marked with orange and blue circles, respectively. Blue and orange boxes mark the anthocyanin compounds found by UHPLC-MS in each flower color. Blue and orange dashed lines mark the non-anthocyanin compounds found by UHPLC-MS in each flower color. The gray portion indicates the location of the inactivated branch leading to cyanidin-derivatives that would exist if F3′H outcompeted DFR-2 for dihydrokaempferol. We hypothesize that DFR-2 outcompetes F3′H at this step suggested by the black “<<<” symbols.
Discussion
We found 38 genes with significant differential expression between flower colors of L. arvensis across 94 genes in the flavonoid biosynthetic pathway. Our two sampled populations are geographically separated and may represent incipient species based on recent phylogenetic results (Jiménez-López, 2019; Jiménez-López et al., in review), which may have introduced some differences between the populations not correlated with color. Nevertheless, we still detected patterns correlated with color that are consistent with known functions of the ABP loci and previous studies of comparable flower color transitions. First, we focus on the ABP genes including discussion about the expression differences, SNP detection and biochemical changes associated with two enzymes at a critical branchpoint in the ABP in order to shed light on the molecular underpinnings of the blue to orange shift in L. arvensis. Then, we expand the conversation to include additional genes in the flavonoid biosynthetic pathway not previously associated with such a color shift and discuss potential pleiotropic consequences not directly related to pollinator attraction. Finally, we mount evidence for a directional transition from blue to orange flowers in L. arvensis.
Within the narrow ABP, there were two DEGs in L. arvensis concentrated in the latter half of the pathway that are likely directly involved in the blue to orange shift in flower color (F3′5′H and DFR). These genes had the highest overall expression of all the narrowly defined ABP genes. This flower color transition could be caused by either of these or some combination of the two since these genes are responsible for the synthesis of two different types of anthocyanins: delphinidin-derivatives (in the case of L. arvensis this is malvidin that produces the blue color) and pelargonidin-derivatives (orange; Figure 7; Smith and Rausher, 2011; Smith et al., 2012; Wheeler and Smith, 2019). These biochemical results are consistent with previous findings in L. arvensis (Lawrence et al., 1939; Harborne, 1968; Ishikura, 1981; Kawashty et al., 1998). Several additional ABP genes with differential expression in blue- vs. orange-flowered plants were consistent with the post-translational modifications of these principle pigments. Here, we discuss three of these genes (Figure 2). BZ1-2 showed high levels of expression in orange petals (TMM > 290) compared to blue (expression 950× O > B). This enzyme introduces a glucose group to the 3-position of the anthocyanin precursor’s C-ring to stabilize the color (Koes et al., 2005). The high expression of BZ1-2 in orange-flowered L. arvensis plants correlates with the biochemical results showing that orange petals are composed of pelargonidin 3-glucoside derivatives whereas blue petals are malvidin glycosylated with rhamnoside. Similarly, enzymes OMT and 3GT showed higher levels of expression in blue than orange samples (5.3× and 2.9×, respectively). OMT methylates delphinidin to form malvidin, and 3GT introduces the rhamnoside (Saito et al., 2013) both of which are unique to blue flowered samples, likely involved in stabilization and protection of the pigment, but unlikely solely responsible for the color change.
Role of F3′5′H Expression and Amino Acid Substitutions
F3′5′H catalyzes the hydroxylation of dihydrokaempferol to produce a delphinidin precursor (Halbwirth, 2010). Our expression results indicate a 2.5× decrease in expression in orange petals consistent with several previous studies investigating the blue- to orange-flowered shift among a diversity of eudicots (Rausher, 2008; Wessinger and Rausher, 2014; Larter et al., 2018). For example, the loss of function of F3′5′H in Iochroma spp. (Smith and Rausher, 2011), Antirrhinum spp. (Ishiguro et al., 2012) and Penstemon barbatus (Wessinger and Rausher, 2013) or the decreased expression of F3′5′H in Phlox drummondii (Hopkins and Rausher, 2011), confers blue to red color shifts. Rausher (2008) suggests that unidirectional changes at this key step in the ABP play an important role in the repeated transitions from blue to red/orange flowers observed in many angiosperm lineages. In L. arvensis, F3′5′H activity is not completely lost since F3′5′H isotigs were detected (at low levels) in orange petals and we detected traces of a flavonol requiring F3′5′H activity (syringetin) in almost 30% of the orange petal samples. In addition to the decreased expression of F3′5′H, there are four flower color differentiating non-synonymous SNPs that may contribute to the blue to orange shift, but would require future enzyme activity assays to be determined.
Role of DFR in the Blue to Orange Transition
The transition from delphinidin-like precursors (malvidin in this case) to pelargonidin precursors caused by changes in F3′5′H, creates a new substrate which requires subsequent modifications in downstream enzymes like DFR. Several lines of evidence suggest that DFR in L. arvensis, which catalyzes the reduction of dihydroflavonols to leucoanthocyanins, may also be involved in the evolutionary transition from blue to orange flowers. Our transcriptome assembly identified two distinct copies of DFR. One copy, DFR-2, is expressed primarily in orange flowered individuals (nearly undetectable in blue samples). This copy presents an N residue in the third position of the substrate specificity region (residue 135 in L. arvensis), which is known to confer substrate affinity to dihydrokaempferol, the pelargonidin-like precursor, in a wide group of angiosperms (Johnson et al., 2001; Shimada et al., 2005). Alternatively, DFR-1 is primarily expressed in blue-flowered individuals and exhibits a D residue at this site, which confers less or no substrate affinity for dihydrokaempferol in other species (Johnson et al., 2001; Shimada et al., 2005). We propose that DFR-1 in L. arvensis is likely more efficient in processing dihydromyricetin, the delphinidin-like precursors to malvidin. Like F3′5′H, a combination of expression and changes in the amino acid composition of DFR likely contributes to the completion of the blue to orange color transition. In Petunia, alteration of the amino acids in the substrate specificity domain of DFR confers a flower color shift by increasing catalytic efficiency in metabolizing dihydrokaempferol, a pelargonidin precursor (Johnson et al., 2001). In addition, three more amino acid changes between DFR-1 and DFR-2 have been suggested to be involved in substrate specificity differentiation in other species. In Iochroma and Vitis (Petit et al., 2007; Smith et al., 2012), the number of sites responsible for substrate specificity is larger and more physically spread out along the DFR coding region than the 26 amino acid stretch suggested by Johnson et al. (2001). All these amino acid changes between the two copies of DFR present in L. arvensis are correlated with blue to orange flower color transition, yet causality would require further genetic manipulation.
Within the DFR-1 coding sequence of L. arvensis, there are many color differentiating SNPs. There are two amino acid changes nearly fixed between colors that also differ from DFR-2, and are located in the 26 amino acid substrate specificity region, suggesting interesting residue positions for future studies of differential substrate binding affinity. Overall, we suggest that DFR-1 may have had an original affinity for dihydromyricetin, which is maintained in blue flowers, while in orange-flowered individuals, a trans-regulatory change to DFR-2 expression (e.g., via LaMYB61 O > B) may confer dihydrokaempferol specificity to accommodate the new substrate being produced by the loss of F3′5′H activity. If DFR-2 outcompetes F3′ for dihydrokaempferol as described in other angiosperms producing pelargonidin (Des Marais and Rausher, 2008), then the flux would be directed to the pelargonidin pathway (even if F3′ enzymes are present as we have relatively equal expression in blue and orange-flowered samples for F3′). In order to produce orange flowers, there must be no (or very low) expression of DFR-2 in blue L. arvensis to allow F3′5′H to win the competition for dihydrokaempferol redirecting the flux down the delphinidin branch of the ABP.
The maintenance and detectable expression of both DFR-1 and DFR-2 in L. arvensis is somewhat enigmatic. A similar situation exists in the Convolvulaceae with three DFR copies of relatively recent origin in that family (Des Marais and Rausher, 2008). However, the duplication of DFR-1 and DFR-2 we report is likely independent of the gene duplications reported by Des Marais and Rausher (2008), because it appears to be much older, perhaps predating the split of Asterales and Ericales (see annotation in Figure 4). Next, we plan to investigate the petal transcriptomes of the closely related L. monelli, which exhibits phenotypically similar petal color polymorphism. We expect to find two copies of DFR in that case, as well, and will compare its color-specific expression differences to those we report for L. arvensis herein.
Broader Insights From the Flavonoid Biosynthetic Pathway and the Roles of Non-pollinator Agents of Selection
We hypothesized that there would be some flower-color specific differences in the transcriptome for genes outside the narrow ABP that might open the door for agents of selection not associated with pollinator attraction (Strauss and Whittall, 2006; Rausher, 2008; Ortiz-Barrientos, 2013). In this regard, we found 30 DEGs in the broader flavonoid pathway, outside the narrow ABP (15 DEGs with B > O with an average fold-change of 9.1 and 15 DEGs with O > B with an average fold-change of 18.8). Among these non-ABP DEGs, we looked for loci with potential functionality that may correlate with the ecological differences of the two color types (Arista et al., 2013). For example, Caffeoyl CoA O-methyl (only present in blue samples with TMM = 1.27) and Caffeoyl 3-O-methyl (ATTSM1-1 and ATTSM1-2, with B > O and an average fold-change of 4.8 and 3.7, respectively) both promote anthocyanin methylation following drought stress in Vitis vinifera (Giordano et al., 2016) and have been implicated in lignin biosynthesis, an important barrier against pathogens (Liu et al., 2018). Additionally, we found differential expression for three CYP84A genes with O > B fold-changes ranging from 3.3 to 28.1. These loci are involved in sinapate ester biosynthesis, a key flavonoid compound providing UV protection (Ruegger et al., 1999). Finally, in defense against herbivores and pathogens, we found differential expression of two IEMT (with O > B average fold-change of 3.3 and 186.8) involved in the synthesis of isomethyleugenol and methyleugenol for deterring herbivores (and/or attracting pollinators; Barkman, 2003) and two PKR (also known as CHR; one with B > O fold-change of 30.4, and the other with O > B fold-change of 2.3) which produces phytoalexins (isoflavonoids, coumestans, pterocarpans, and isoflavans) in response to herbivore or pathogen attack in legumes (Bomati et al., 2005).
The most dramatic expression differences we found between blue and orange L. arvensis petal transcriptomes are those in the ABP genes. The average fold-change of all significantly differentially expressed ABP genes is 204×, but only 14× for non-ABP flavonoid pathway genes. Furthermore, most ABP overall expression levels are much higher than all other flavonoid pathway genes combined. The relative importance of the ABP vs. non-ABP genes are consistent when correcting for color-type (orange ABP gene expression is 4.8× higher than orange non-ABP gene expression; Wilcoxon rank-sum test, p = 1.3 × 10⁻¹²; blue ABP gene expression is 6× higher than blue non-ABP gene expression; Wilcoxon rank-sum test, p = 8.5 × 10⁻⁹). A notable exception to the low expression of non-ABP flavonoid pathway genes is flavonol synthase (FLS). This side-branch in the ABP catalyzes the synthesis of flavonols from dihydroflavonols. In L. arvensis petals, FLS has very high expression in blue samples (TMM > 500) and has 3.5× higher expression in blue- vs. orange-flowered samples (Figure 2 and Table 1). In Arabidopsis, FLS has the highest expression in petals, and it can compete with DFR for flux down the anthocyanin portion of the ABP (Nguyen et al., 2016; McCarthy et al., 2017). It is often involved in plants’ abiotic stress response (Lee et al., 2016) neutralizing damaging reactive oxygen species (Li B. et al., 2019). In contrast, activation or inactivation of FLS is involved in pollinator shifts in Petunia species (Esfeld et al., 2018). Nevertheless, our UHPLC results lack any measurable levels of flavonols (over 98% of detected flavonoids were anthocyanins in both color types; Table 4). This suggests that either (a) DFR is such a good substrate competitor that, even with high expression of FLS, the flux continues toward anthocyanin production, or (b) the main activity of FLS is not for flavonol production, but may be involved in some other undescribed pathway.
The transcriptome results for the broader flavonoid biosynthetic pathway genes are largely confirmed by our biochemical survey. Although the predominant flavonoids extracted and detected in L. arvensis petals were blue and orange anthocyanins, we also found three additional flavonoids representing intermediates and side-branches to the ABP. The flavone luteolin 7-glucoside was previously found in blue petals of L. arvensis (Ishikura, 1981) and two flavonols were present in our orange samples: kaempferol 3-glucoside (also identified in Kawashty et al., 1998) and syringetin (this is the first record for compound in L. arvensis, although it was previously reported in L. congestiflora according to Guo et al., 1998). These compounds are known to have some functions outside of traditional pollinator attraction (Winkel-Shirley, 2002; Jiang et al., 2016). Despite their detection in our UHPLC analysis, they were rare (kaempferol = 1.7% of total flavonoids extracted and the other two were only detected in trace amounts). Beyond these steps, which are very close to the narrow ABP, our biochemical extraction technique and flavonoid references employed may have limited our ability to detect other flavonoid compounds that may respond to non-pollinator agents of selection.
Our results suggest that flavonoid biosynthetic pathway genes may play additional roles beyond pollinator attraction. The transcriptome and biochemical results clearly indicate that the vast majority of ABP enzymes and biochemicals in petals of L. arvensis are primarily focused on anthocyanin production. Whether the anthocyanin compounds in the petals have functions beyond pollinator attraction could not be directly discerned in this study. Previous work by Arista et al. (2013) found that natural populations of blue-flowered L. arvensis were more commonly found in the hotter and drier environments of southern Europe in contrast to orange-flowered populations that predominate in the north. Further, their manipulative experiments showed higher fitness for blue-flowered individuals when faced with water stress (Arista et al., 2013). Lysimachia arvensis has distinctive cyanidin pigment spots on the undersides of the leaves with unknown function (unpublished data). The predominance of cyanidin anthocyanins in angiosperm vegetative tissues (and lack of pelargonidin-based anthocyanins) regardless of flower color suggests an evolutionary constraint that filters for only tissue-specific changes in floral anthocyanins (Price and Sturgess, 1938; Streisfeld and Rausher, 2011). This correlates with known differences in antioxidant function between malvidin and pelargonidin (blue and orange petals, respectively). The most important determinant of antioxidant activity for anthocyanins is the hydroxylation level of the B-ring (Halbwirth, 2010). Malvidin has three hydroxyl groups whereas pelargonidin has only one and malvidin has much higher antioxidant activity than pelargonidin (Kähkönen and Heinonen, 2003). This may explain why blue-flowered individuals have higher fitness in xeric and high temperatures compared to orange-flowered individuals. Flower life-span is also longer in blue flowers, as every day they open earlier and close latter than orange flowers (Jiménez-López, 2019). Whether this is due to the different anthocyanins in the petals or pleiotropic effects in vegetative tissues is still unknown.
Directional Change in Color From Blue to Orange
The direction of the flower color change in L. arvensis remains uncertain although there are clear predictions (Rausher, 2008) and our findings are consistent with these predictions. The directional change from blue to red (and rarely the reverse) is often attributed to the loss of function at a key branchpoint in the ABP (F3′ and F3′5′H) responsible for the blue/purple pigment formation (delphinidin and cyanidin). Without these branches, the precursor, dihydrokaempferol, is shunted directly down the red pathway (pelargonidin; Zufall and Rausher, 2004; Rausher, 2008; Smith and Rausher, 2011). We find a 2.5× decrease in F3′5′H expression in orange- compared to blue-flowered samples (coupled with color-differentiating non-synonymous SNPs). In a recent review of the genetic bases for flower color transitions, F3′5′H or/and F3′ were implicated in all 10 blue to red transitions documented from natural systems (see Supplementary Table 3 in Wheeler and Smith, 2019). Following the inactivation of the delphinidin branch of the ABP and the redirection of flux down the pelargonidin branch, subsequent evolution of substrate specificity by recruiting DFR-2 (expression ∼600× O > B) instead of the delphinidin-targeted DFR-1, would compete for any remaining F3′ expression to metabolize dihydrokaempferol down the pelargonidin branch (Johnson et al., 2001; Zufall and Rausher, 2004; Smith and Rausher, 2011). Wheeler and Smith (2019) find only two of ten examples from blue to red transitions implicated changes in DFR, suggesting that this may be a secondary modification after the initial mutation of large effect (decreased activity of F3′5′H). Finally, subsequent changes, such as increased substrate specificity for BZ1 and other post-translational modifications (e.g., glycosylation) would eventually produce pelargonidin-3-glucoside (Figure 7). By coupling tissue-specific expression changes in F3′5′H and transitioning from DFR-1 to DFR-2, these evolutionary changes may arrive with very little pleiotropic cost to the organism (Streisfeld and Rausher, 2011), especially if expression changes are restricted to petals via trans-regulatory changes (e.g., LaMYB61).
In addition to the predictions based on gene expression and substrate specificity, we found additional evidence consistent with a blue-to-orange transition when examining the F3′5′H. In the SNP survey, blue samples were often variable (18/22 = ∼81%) whereas in orange samples, only five SNPs were variable (5/22 = 23%). This pattern is consistent with a selective sweep during the transition from blue to orange causing a reduction in variation in the orange samples (although there are other demographic patterns that could be responsible). Further evidence for a blue-to-orange transition in L. arvensis comes from the Lysimachia ITS phylogeny indicating that blue is the ancestral flower color for L. arvensis and the orange-flowered individuals are the derived state (Jiménez-López, 2019; Jiménez-López et al., in review).
Conclusion
The transcriptomic and biochemical analysis of the flavonoid biosynthetic pathway presented in this study provides an important foundation for understanding the molecular genetic basis of flower color polymorphism in L. arvensis. The differential expression between flower colors, particularly along the ABP branch, is consistent with the main anthocyanin compounds found in blue and orange petals. As we hypothesized, F3′5′H and DFR are the principal genes guiding dihydrokaempferol to the proper anthocyanin formation. Our study provides a valuable resource for future molecular studies of Lysimachia flowers and sheds light on more general evolutionary processes underlying the diversity of flower color variation.
Data Availability Statement
All raw sequence to the NCBI SRA database under BioProject accession number PRJNA701383. Phylogenetic analyses of F3’5’H and DFR have been placed on Figshare at doi: 10.6084/m9.figshare.13911287.v1.
Author Contributions
MA, PO, EN, JW, and FJ-L conceived and designed the experiments. JW and FJ-L carried out the sampling. FR-C, KR, and BI performed the assembly. KR, BI, and MS-C performed the differential expression analysis. AF developed the UHPLC-MS methods. EN and MS-C analyzed the UHPLC-MS data. MA, PO, EN, JW, FJ-L, and MS-C drafted the manuscript. All authors read and approved the final manuscript.
Funding
This work was supported by the European Regional Development Fund (ERDF) and grants from the Spanish MINECO (CGL2012-33270 and CGL2015-63827) to MA and PO; (BES-2013-062859 and EEBB-I-16-10716) to FJ-L; (BIO2017-84066-R) to FR-C; and (BES-C-2016-0023) to MS-C. This work was also supported by the National Science Foundation (NSF-DEB-1655692) to BI.
Conflict of Interest
The authors declare that the research was conducted in the absence of any commercial or financial relationships that could be construed as a potential conflict of interest.
Acknowledgments
The authors thank Servicios Generales de Herbario e Invernadero de la Universidad de Sevilla, and the DNA Bank Herb SEV. Furthermore, authors also thank Novogene staff for their advice in the sequencing process. The Department of Biology support staff provided essential computer support, instrument maintenance and space allocation. Two reviewers greatly helped to improve the manuscript.
Supplementary Material
The Supplementary Material for this article can be found online at: https://www.frontiersin.org/articles/10.3389/fpls.2021.633979/full#supplementary-material
Footnotes
- ^ https://www.genome.jp/kegg/pathway.html
- ^ https://github.com/karolisr/kakapo
- ^ https://blast.ncbi.nlm.nih.gov/Blast.cgi
- ^ http://metabolomics.jp/wiki/Index:FL
References
Albert, N. W., Davies, K. M., and Schwinn, K. E. (2014). Gene regulation networks generate diverse pigmentation patterns in plants. Plant Signal Behav. 9:e29526. doi: 10.4161/psb.29526
Anders, S., McCarthy, D. J., Chen, Y., Okoniewski, M., Smyth, G. K., Huber, W., et al. (2013). Count-based differential expression analysis of RNA sequencing data using R and bioconductor. Nat. Protoc. 8, 1765–1786. doi: 10.1038/nprot.2013.099
Andrews, S. (2010). FastQC: A Quality Control Tool for High Throughput Sequence Data. Available online at: http://www.bioinformatics.babraham.ac.uk/projects/fastqc (accessed October 20, 2020).
Arista, M., Talavera, M., Berjano, R., and Ortiz, P. L. (2013). Abiotic factors may explain the geographical distribution of flower colour morphs and the maintenance of colour polymorphism in the scarlet pimpernel. J. Ecol. 101, 1613–1622. doi: 10.1111/1365-2745.12151
Barkman, T. J. (2003). Evidence for positive selection on the floral scent gene isoeugenol-O-methyltransferase. Mol. Biol. Evol. 20, 168–172. doi: 10.1093/molbev/msg030
Bolger, A. M., Lohse, M., and Usadel, B. (2014). Trimmomatic: a flexible trimmer for Illumina sequence data. Bioinformatics 30, 2114–2120. doi: 10.1093/bioinformatics/btu170
Bomati, E. K., Austin, M. B., Bowman, M. E., Dixon, R. A., and Noel, J. P. (2005). Structural elucidation of Chalcone reductase and implications for deoxychalcone biosynthesis. Int. J. Biol. Chem. 280, 30496–30503. doi: 10.1074/jbc.m502239200
Butler, T., Dick, C., Carlson, M. L., and Whittall, J. B. (2014). Transcriptome analysis of a petal anthocyanin polymorphism in the arctic mustard, Parrya nudicaulis. PLoS One 9:e101338. doi: 10.1371/journal.pone.0101338
Casimiro-Soriguer, I., Narbona, E., Buide, M. L., del Valle, J. C., and Whittall, J. B. (2016). Transcriptome and biochemical analysis of a flower color polymorphism in Silene littorea (Caryophyllaceae). Front. Plant Sci. 7:204. doi: 10.3389/fpls.2016.00204
Chen, D., Liu, Y., Pan, Q., Li, F., Zhang, Q., Ge, X., et al. (2018). De novo transcriptome assembly, gene expressions and metabolites for flower color variation of two garden species in Brassicaceae. Sci Hortic. 240, 592–602. doi: 10.1016/j.scienta.2018.06.057
Clegg, M. T., and Durbin, M. L. (2000). Flower color variation: a model for the experimental study of evolution. Proc. Natl. Acad. Sci. U.S.A. 97, 7016–7023. doi: 10.1073/pnas.97.13.7016
Coyne, J. A., and Orr, H. A. (1998). The evolutionary genetics of speciation. Phil. Trans. Roy. Soc. Lond. B 353, 287–305. doi: 10.1098/rstb.1998.0210
Dalrymple, R. L., Kemp, D. J., Flores−Moreno, H., Laffan, S. W., White, T. E., Hemmings, F. A., et al. (2020). Macroecological patterns in flower colour are shaped by both biotic and abiotic factors. New Phytol. 228, 1972–1985. doi: 10.1111/nph.16737
Davies, K. M. (2009). “Modifying anthocyanin production in flowers,” in Anthocyanins. Biosynthesis, Functions, and Applications, eds C. Winefield, K. Davies, and K. Gould (New York, NY: Springer), 49–80. doi: 10.1007/978-0-387-77335-3
Davies, K. M., and Schwinn, K. E. (2006). “Molecular biology and biotechnology of flavonoid biosynthesis,” in Flavonoids. Chemistry, Biochemistry and Applications, eds ØM. Andersen and K. R. Markham (Boca Raton, FL: CRC Press), 143–218. doi: 10.1201/9781420039443.ch3
Des Marais, D. L., and Rausher, M. D. (2008). Escape from adaptive conflict after duplication in an anthocyanin pathway gene. Nature 454, 762–765. doi: 10.1038/nature07092
Dick, C. A., Buenrostro, J., Butler, T., Carlson, M. L., Kliebenstein, D. J., and Whittall, J. B. (2011). Arctic mustard flower color polymorphism controlled by petal-specific downregulation at the threshold of the anthocyanin biosynthetic pathway. PLoS One 6:e18230. doi: 10.1371/journal.pone.0018230
Duan, H. R., Wang, L. R., Cui, G. X., Zhou, X. H., Duan, X. R., and Yang, H. S. (2020). Identification of the regulatory networks and hub genes controlling alfalfa floral pigmentation variation using RNA-sequencing analysis. BMC Plant Biol. 20:110. doi: 10.1186/s12870-020-2322-9
Esfeld, K., Berardi, A. E., Moser, M., Bossolini, E., Freitas, L., and Kuhlemeier, C. (2018). Pseudogenization and resurrection of a speciation gene. Curr. Biol. 28, 3776–3786. doi: 10.1016/j.cub.2018.10.019
Fan, X., Fan, B., Wang, Y., and Yang, W. (2016). Anthocyanin accumulation enhanced in Lc-transgenic cotton under light and increased resistance to bollworm. Plant Biotechnol. Rep. 10, 1–11. doi: 10.1007/s11816-015-0382-3
Feng, C., Ding, D., Feng, C., and Kang, M. (2020). The identification of an R2R3-MYB transcription factor involved in regulating anthocyanin biosynthesis in Primulina swinglei flowers. Gene 752:144788. doi: 10.1016/j.gene.2020.144788
Fenster, C. B., Armbruster, W. S., Wilson, P., Dudash, M. R., and Thomson, J. D. (2004). Pollination syndromes and floral specialization. Annu. Rev. Ecol. Evol. Syst. 35, 375–403. doi: 10.1146/annurev.ecolsys.34.011802.132347
Ferguson, L. F. (1972). “Anagallis L,” in Flora Europaea, Vol. 3, eds T. G. Tutin, V. H. Heywood, N. A. Burges, D. H. Valentine, S. M. Walters, and D. A. Webb (Cambridge: Cambridge University Press), 28–29.
Freyre, R., and Griesbach, R. J. (2004). Inheritance of flower color in Anagallis monelli L. HortScience 39, 1220–1223. doi: 10.21273/HORTSCI.39.6.1220
Freyre, R., Wilson, S. B., Knox, G. W., Uzdevenes, C., Gu, L., and Quesenberry, K. H. (2015). Breeding and genetic studies of Ruellia simplex (Mexican petunia). Acta Hortic. 1087, 113–120. doi: 10.17660/actahortic.2015.1087.12
Gao, J., Peng, H., Chen, F., Luo, M., and Li, W. (2019). Genome-wide analysis of transcription factors related to anthocyanin biosynthesis in carmine radish (Raphanus sativus L.) fleshy roots. PeerJ 7:e8041. doi: 10.7717/peerj.8041
Gao, L., Yang, H., Liu, H., Yang, J., and Hu, Y. (2016). Extensive transcriptome changes underlying the flower color intensity variation in Paeonia ostii. Front. Plant Sci. 6:1205. doi: 10.3389/fpls.2015.01205
Gates, D. J., Olson, B. J. S. C., Clemente, T. E., and Smith, S. D. (2017). A novel R3 MYB transcriptional repressor associated with the loss of floral pigmentation in Iochroma. New Phytol. 217, 1346–1356. doi: 10.1111/nph.14830
Gehrig, H. H., Winter, K., Cushman, J., Borland, A., and Taybi, T. (2000). An improved RNA isolation method for succulent plant species rich in polyphenols and polysaccharides. Plant Mol. Biol. Rep. 18, 369–376. doi: 10.1007/bf02825065
Gibbs, P. E., and Talavera, S. (2001). Breeding system studies with three species of Anagallis (Primulaceae): self-incompatibility and reduced female fertility in A. monelli L. Ann. Bot. 88, 139–144. doi: 10.1006/anbo.2001.1439
Gigord, L. D. B., Macnair, M. R., and Smithson, A. (2001). Negative frequency-dependent selection maintains a dramatic flower color polymorphism in the rewardless orchid Dactylorhiza sambucina (L.) Soo. Proc. Natl. Acad. Sci. U.S.A. 98, 6253–6255. doi: 10.1073/pnas.111162598
Giordano, D., Provenzano, S., Ferrandino, A., Vitali, M., Pagliarani, C., Roman, F., et al. (2016). Characterization of a multifunctional caffeoyl-CoA O -methyltransferase activated in grape berries upon drought stress. Plant. Physiol. Biochem. 101, 23–32. doi: 10.1016/j.plaphy.2016.01.015
Gómez, J. M., Perfectti, F., Armas, C., Narbona, E., González-Megías, A., Navarro, L., et al. (2020). Within-individual phenotypic plasticity in flowers fosters pollination niche shift. Nat. Commun. 11:4019. doi: 10.1038/s41467-020-17875-1
Grabherr, M. G., Haas, B. J., Yassour, M., Levin, J. Z., Thompson, D. A., Amit, I., et al. (2011). Full-length transcriptome assembly from RNA-Seq data without a reference genome. Nat. Biotechnol. 29, 644–652. doi: 10.1038/nbt.1883
Guo, J., Yu, D.-L., Xu, L., Zhu, M., and Yang S.-L. (1998). Flavonol glycosides from Lysimachia congestiflora. Phytochemistry 48, 1445–1447. doi: 10.1016/s0031-9422(97)01025-x
Guo, L., Gao, L., Ma, X., Guo, F., Ruan, H., Bao, Y., et al. (2019). Functional analysis of flavonoid 3′-hydroxylase and flavonoid 3′,5′-hydroxylases from tea plant (Camellia sinensis), involved in the B-ring hydroxylation of flavonoids. Gene 717:144046. doi: 10.1016/j.gene.2019.144046
Haas, B., Papanicolaou, A., Yassour, M., Grabherr, M., Blood, P. D., Bowden, J., et al. (2013). De novo transcript sequence reconstruction from RNA-seq using the Trinity platform for reference generation and analysis. Nat. Protoc. 8, 1494–1512. doi: 10.1038/nprot.2013.084
Halbwirth, H. (2010). The creation and physiological relevance of divergent hydroxylation patterns in the flavonoid pathway. Int. J. Mol. Sci. 11, 595–621. doi: 10.3390/ijms11020595
Harborne, J. B. (1968). Comparative biochemistry of the flavonoids. VII. Correlations between flavonoid pigmentation and systematics in the family Primulaceae. Phytochemistry 7, 1215–1230. doi: 10.1016/S0031-9422(00)85616-2
Henikoff, S., and Henikoff, J. G. (1992). Amino acid substitution matrices from protein blocks. Proc. Natl. Acad. Sci. U.S.A. 89, 10915–10919. doi: 10.1073/pnas.89.22.10915
Hichri, I., Barrieu, F., Bogs, J., Kappel, C., Delrot, S., and Lauvergeat, V. (2011). Recent advances in the transcriptional regulation of the flavonoid biosynthetic pathway. J. Exp. Bot. 62, 2465–2483. doi: 10.1093/jxb/erq442
Ho, W. W., and Smith, S. D. (2016). Molecular evolution of anthocyanin pigmentation genes following losses of flower color. BMC Evol. Biol. 16:98. doi: 10.1186/s12862-016-0675-3
Holton, T. A., and Cornish, E. C. (1995). Genetics and biochemistry of anthocyanin biosynthesis. Plant Cell 7, 1071–1083. doi: 10.1105/tpc.7.7.1071
Hopkins, R., and Rausher, M. D. (2011). Identification of two genes causing reinforcement in the texas wildflower Phlox drummondii. Nature 469, 411–414. doi: 10.1038/nature09641
Irwin, R. E., and Strauss, S. Y. (2005). Flower color microevolution in wild radish: evolutionary response to pollinator−mediated selection. Am. Nat. 165, 225–237. doi: 10.1086/426714
Ishiguro, K., Taniguchi, M., and Tanaka, Y. (2012). Functional analysis of Antirrhinum kelloggii flavonoid 3′-hydroxylase and flavonoid 3′,5′-hydroxylase genes; critical role in flower color and evolution in the genus Antirrhinum. J. Plant Res. 125, 451–456. doi: 10.1007/s10265-011-0455-5
Ishikura, N. (1981). Flavonoids in the petal cells of Anagallis arvensis f. coerulea containing a blue crystalline anthocyanin. Z. Pflanzenphysiol. 103, 469–473. doi: 10.1016/s0044-328x(81)80170-5
Jiang, N., Doseff, A., and Grotewold, E. (2016). Flavones: from biosynthesis to health benefits. Plants 5:27. doi: 10.3390/plants5020027
Jiménez-López, F. J. (2019). Polimorfismo en el Color Floral y Especiación en Lysimachia Arvensis. Ph.D. dissertation, University of Seville, Seville.
Jiménez-López, F. J., Matas, L., Arista, M., and Ortiz, P. L. (2019). Flower colour segregation and flower discrimination under the bee vision model in the polymorphic Lysimachia arvensis. Plant Biosyst. 154, 535–543. doi: 10.1080/11263504.2019.1651776
Jiménez-López, F. J., Ortiz, P. L., Talavera, M., Pannell, J. R., and Arista, M. (2020). The role of lateral and vertical herkogamy in the divergence of the blue- and red-flowered lineages of Lysimachia arvensis. Ann. Bot. 125, 1127–1135. doi: 10.1093/aob/mcaa047
Jiménez-López, F. J., Viruel, J., Arista, M., Ortiz, P. L., and Talavera, M. (in review). Molecular approaches reveal speciation between red and blue flowered plants in the Mediterranean species of Lysimachia arvensis and Lysimachia monelli (Primulaceae). Bot. J. Linn. Soc.
Johnson, E. T., Ryu, S., Yi, H., Shin, B., Cheong, H., and Choi, G. (2001). Alteration of a single amino acid changes the substrate specificity of dihydroflavonol 4-reductase. Plant J. 25, 325–333. doi: 10.1046/j.1365-313x.2001.00962.x
Kähkönen, M. P., and Heinonen, M. (2003). Antioxidant activity of anthocyanins and their aglycons. J. Agric. Food Chem. 51, 628–633. doi: 10.1021/jf025551i
Kawashty, S., El-Garf, I., and El-Negoumy, S. (1998). Chemosystematics of Anagallis arvensis L. (Primulaceae). Biochem. Syst. Ecol. 26, 663–668. doi: 10.1016/s0305-1978(98)00008-8
Kearse, M., Moir, R., Wilson, A., Stones-Havas, S., Cheung, M., Sturrock, S., et al. (2012). Geneious Basic: an integrated and extendable desktop software platform for the organization and analysis of sequence data. Bioinformatics 28, 1647–1649. doi: 10.1093/bioinformatics/bts199
Kellenberger, R. T., Byers, K. J. R. P., De Brito Francisco, R. M., Staedler, Y. M., LaFountain, A. M., Schönenberger, J., et al. (2019). Emergence of a floral colour polymorphism by pollinator-mediated overdominance. Nat. Commun. 10:63. doi: 10.1038/s41467-018-07936-x
Koes, R., Verweij, W., and Quattrocchio, F. (2005). Flavonoids: a colorful model for the regulation and evolution of biochemical pathways. Trends Plant Sci. 10, 236–242. doi: 10.1016/j.tplants.2005.03.002
Koski, M. H., MacQueen, D., and Ashman, T.-L. (2020). Floral pigmentation has responded rapidly to global change in ozone and temperature. Cur. Biol. 30, 4425–4431. doi: 10.1016/j.cub.2020.08.077
Lai, Y., Li, H., and Yamagishi, M. (2013). A review of target gene specificity of flavonoid R2R3-MYB transcription factors and a discussion of factors contributing to the target gene selectivity. Front. Biol. 8:577–598. doi: 10.1007/s11515-013-1281-z
Lang, X., Li, N., Li, L., and Zhang, S. (2019). Integrated metabolome and transcriptome analysis uncovers the role of anthocyanin metabolism in michelia maudiae. Int. J. Genomics 2019:4393905. doi: 10.1155/2019/4393905
Langmead, B., and Salzberg, S. L. (2012). Fast gapped-read alignment with Bowtie 2. Nat. Methods 9, 357–359. doi: 10.1038/nmeth.1923
Larter, M., Dunbar-Wallis, A., Berardi, A. E., and Smith, S. D. (2018). Convergent evolution at the pathway level: predictable regulatory changes during flower color transitions. Mol. Biol. Evol. 35, 2159–2169. doi: 10.1093/molbev/msy117
Lawrence, W. J. C., Price, J. R., Robinson, G. M., and Robinson, R. (1939). The distribution of anthocyanins in flowers, fruits and leaves. Phil. Trans. Roy. Soc. Lond. B 230, 149–178. doi: 10.1098/rstb.1939.0006
Le Maitre, N. C., Pirie, M. D., and Bellstedt, D. U. (2019). An approach to determining anthocyanin synthesis enzyme gene expression in an evolutionary context: an example from Erica plukenetii. Ann. Bot. 124, 121–130. doi: 10.1093/aob/mcz046
Lee, W. J., Jeong, C. Y., Kwon, J., Van Kien, V., Lee, D., Hong, S. W., et al. (2016). Drastic anthocyanin increase in response to PAP1 overexpression in fls1 knockout mutant confers enhanced osmotic stress tolerance in Arabidopsis thaliana. Plant Cell Rep. 35, 2369–2379. doi: 10.1007/s00299-016-2040-9
Li, B., and Dewey, C. N. (2011). RSEM: accurate transcript quantification from RNA-Seq data with or without a reference genome. BMC Bioinformatics 12:323. doi: 10.1186/1471-2105-12-323
Li, B., Fan, R., Guo, S., Wang, P., Zhu, X., Fan, Y., et al. (2019). The Arabidopsis MYB transcription factor, MYB111 modulates salt responses by regulating flavonoid biosynthesis. Environ. Exp. Bot. 166:103807. doi: 10.1016/j.envexpbot.2019.103807
Li, L., Zhai, Y., Luo, X., Zhang, Y., and Shi, Q. Q. (2019). Comparative transcriptome analyses reveal genes related to pigmentation in the petals of red and white Primula vulgaris cultivars. Physiol. Mol. Biol. Plants 25, 1029–1041. doi: 10.1007/s12298-019-00664-6
Li, S. (2014). Transcriptional control of flavonoid biosynthesis. Plant Signal Behav. 9:e27522. doi: 10.4161/psb.27522
Liu, Q., Luo, L., and Zheng, L. (2018). Lignins: biosynthesis and biological functions in plants. Int. J. Mol. Sci. 19:335. doi: 10.3390/ijms19020335
Lou, Q., Liu, Y., Qi, Y., Jiao, S., Tian, F., Jiang, L., et al. (2014). Transcriptome sequencing and metabolite analysis reveals the role of delphinidin metabolism in flower colour in grape hyacinth. J. Exp. Bot. 65, 3157–3164. doi: 10.1093/jxb/eru168
Lulin, H., Xiao, Y., Pei, S., Wen, T., and Shangqin, H. (2012). The first Illumina-based de novo transcriptome sequencing and analysis of safflower flowers. PLoS One 7:e38653. doi: 10.1371/journal.pone.0038653
Martin, J. A., and Wang, Z. (2011). Next-generation transcriptome assembly. Nat. Rev. Genet. 12, 671–682. doi: 10.1038/nrg3068
McCarthy, E. W., Berardi, A. E., Smith, S. D., and Litt, A. (2017). Related allopolyploids display distinct floral pigment profiles and transgressive pigments. Am. J. Bot. 104, 92–101. doi: 10.3732/ajb.1600350
Moneim, A. I, Atta, A., and Shehata, A. A. (2003). On the delimitation of Anagallis arvensis L. (Primulaceae) 1. Evidence based on micromorphological characters, palynological features and karyological studies. Pak. J. Biol. Sci. 6, 29–35. doi: 10.3923/pjbs.2003.29.35
Morita, Y., Hoshino, A., Kikuchi, Y., Okuhara, H., Ono, E., Tanaka, Y., et al. (2005). Japanese morning glory dusky mutants displaying reddish-brown or purplish-gray flowers are deficient in a novel glycosylation enzyme for anthocyanin biosynthesis, UDP-glucose:anthocyanidin 3-O-glucoside-2”-O-glucosyltransferase, due to 4-bp insertions in. Plant J. 42, 353–363. doi: 10.1111/j.1365-313x.2005.02383.x
Narbona, E., Wang, H., Ortiz, P. L., Arista, M., and Imbert, E. (2018). Flower colour polymorphism in the Mediterranean Basin: occurrence, maintenance and implications for speciation. Plant Biol. 20, 8–20. doi: 10.1111/plb.12575
Ng, J., Freitas, L. B., and Smith, S. D. (2018). Stepwise evolution of floral pigmentation predicted by biochemical pathway structure. Evolution 72:13589. doi: 10.1111/evo.13589
Nguyen, N. H., Kim, J. H., Kwon, J., Jeong, C. Y., Lee, W., Lee, D., et al. (2016). Characterization of Arabidopsis thaliana flavonol synthase 1 (FLS1) -overexpression plants in response to abiotic stress. Plant Physiol. Biochem. 103, 133–142. doi: 10.1016/j.plaphy.2016.03.010
Ortiz, P. L., Berjano, R., Talavera, M., Rodríguez-Zayas, L., and Arista, M. (2015). Flower colour polymorphism in Lysimachia arvensis: how is the red morph maintained in Mediterranean environments? Perspect. Plant Ecol. Evol. Syst. 17, 142–150. doi: 10.1016/j.ppees.2015.01.004
Ortiz-Barrientos, D. (2013). The color genes of speciation in plants. Genetics 194, 39–42. doi: 10.1534/genetics.113.150466
Petit, P., Granier, T., d’ Estaintot, B. L., Manigand, C., Bathany, K., Schmitter, J. M., et al. (2007). Crystal structure of grape dihydroflavonol 4-reductase, a key enzyme in flavonoid biosynthesis. J. Mol. Biol. 368, 1345–1357. doi: 10.1016/j.jmb.2007.02.088
Price, J. R., and Sturgess, V. C. (1938). A survey of anthocyanins. VI. Biochem. J. 32, 1658–1660. doi: 10.1042/bj0321658
Pujadas, A. (1997). “Anagallis,” in Flora Ibérica, Vol. V, eds S. Castroviejo, S. Aedo, M. Laínz, R. Morales, F. M. Garmendia, and G. N. Feliner (Madrid: C.S.I.C).
Quast, C., Pruesse, E., Yilmaz, P., Gerken, J., Schweer, T., Yarza, P., et al. (2013). The SILVA ribosomal RNA gene database project: improved data processing and web-based tools. Nucleic Acids Res. 41, D590–D596. doi: 10.1093/nar/gks1219
Quattrocchio, F., Baudry, A., Lepiniec, L., and Grotewold, E. (2006). “The regulation of flavonoid biosynthesis,” in The Science of Flavonoids, ed. E. Grotewold (New York, NY: Springer-Verlag), 97–122. doi: 10.1007/978-0-387-28822-2_4
R Core Team (2020). R: A Language and Environment for Statistical Computing. Vienna: R Foundation for Statistical Computing.
Rausher, M. D. (2008). Evolutionary transitions in floral color. Int. J. Plant Sci. 169, 7–21. doi: 10.1086/523358
Rausher, M. D., and Simms, E. L. (1989). The evolution of resistance to herbivory in Ipomoea purpurea. I. Attempts to detect selection. Evolution 43, 563–572. doi: 10.1111/j.1558-5646.1989.tb04252.x
Reiseberg, L. H., and Blackman, B. K. (2010). Speciation genes in plants. Ann. Bot. 106, 439–455. doi: 10.1093/aob/mcq126
Roberts, W. R., and Roalson, E. H. (2017). Comparative transcriptome analyses of flower development in four species of Achimenes (Gesneriaceae). BMC Genomics 18:240. doi: 10.1186/s12864-017-3623-8
Robinson, M. D., McCarthy, D. J., and Smyth, G. K. (2009). edgeR: a Bioconductor package for differential expression analysis of digital gene expression data. Bioinformatics 26, 139–140. doi: 10.1093/bioinformatics/btp616
Robinson, M. D., and Oshlack, A. (2010). A scaling normalization method for differential expression analysis of RNA-seq data. Genome Biol. 11:R25. doi: 10.1186/gb-2010-11-3-r25
Ruegger, M., Meyer, K., Cusumano, J. C., and Chapple, C. (1999). Regulation of Ferulate-5-hydroxylase expression in Arabidopsis in the context of sinapate ester biosynthesis. Plant Physiol. 119, 101–110. doi: 10.1104/pp.119.1.101
Saito, K., Yonekura-Sakakibara, K., Nakabayashi, R., Higashi, Y., Yamazaki, M., Tohge, T., et al. (2013). The flavonoid biosynthetic pathway in Arabidopsis: structural and genetic diversity. Plant Physiol. Biochem. 72, 21–34. doi: 10.1016/j.plaphy.2013.02.001
Schemske, D. W., and Bierzychudek, P. (2007). Spatial differentiation for flower color in the desert annual Linanthus parryae: was wright right? Evolution 61, 2528–2543. doi: 10.1111/j.1558-5646.2007.00219.x
Seitz, C., Ameres, S., and Forkmann, G. (2007). Identification of the molecular basis for the functional difference between flavonoid 3′-hydroxylase and flavonoid 3′,5′-hydroxylase. FEBS Lett. 581, 3429–3434. doi: 10.1016/j.febslet.2007.06.045
Shimada, N., Sasaki, R., Sato, S., Kaneko, T., Tabata, S., Aoki, T., et al. (2005). A comprehensive analysis of six dihydroflavonol 4-reductases encoded by a gene cluster of the Lotus japonicus genome. J. Exp. Bot. 56, 2573–2585. doi: 10.1093/jxb/eri251
Shipunov, A., Kosenko, Y., and Volkova, P. (2011). Floral polymorphism in common primrose (Primula vulgaris Huds., Primulaceae) of the Northeastern Black Sea coast. Plant Syst. Evol. 296, 167–178. doi: 10.1007/s00606-011-0484-5
Smith, S. D., and Rausher, M. D. (2011). Gene loss and parallel evolution contribute to species difference in flower color. Mol. Biol. Evol. 28, 2799–2810. doi: 10.1093/molbev/msr109
Smith, S. D., Wang, S., and Rausher, M. D. (2012). Functional evolution of an anthocyanin pathway enzyme during a flower color transition. Mol. Biol. Evol. 30, 602–612. doi: 10.1093/molbev/mss255
Sobel, J. M., and Streisfeld, M. A. (2013). Flower color as a model system for studies of plant evo-devo. Front. Plant Sci. 4:321. doi: 10.3389/fpls.2013.00321
Song, L., and Florea, L. (2015). Rcorrector: efficient and accurate error correction for Illumina RNA-seq reads. GigaScience 4, 48. doi: 10.1186/s13742-015-0089-y
Stracke, R., Werber, M., and Weisshaar, B. (2001). The R2R3-MYB gene family in Arabidopsis thaliana. Curr. Opin. Plant Biol. 4, 447–456. doi: 10.1016/s1369-5266(00)00199-0
Strauss, S., and Whittall, J. B. (2006). “Non-pollinator agents of selection on floral traits,” in Ecology and Evolution of Flowers, eds L. D. Harder and S. C. H. Barrett (Oxford: Oxford University Press), 120–138.
Streisfeld, M. A., and Rausher, M. D. (2009). Genetic changes contributing to the parallel evolution of red floral pigmentation among Ipomoea species. New Phytol. 183, 751–763. doi: 10.1111/j.1469-8137.2009.02929.x
Streisfeld, M. A., and Rausher, M. D. (2011). Population genetics, pleiotropy, and the preferential fixation of mutations during adaptive evolution. Evolution 65, 629–642. doi: 10.1111/j.1558-5646.2010.01165.x
Tanaka, Y., Sasaki, N., and Ohmiya, A. (2008). Biosynthesis of plant pigments: anthocyanins, betalains and carotenoids. Plant J. 54, 733–749. doi: 10.1111/j.1365-313x.2008.03447.x
Tripp, E. A., and Manos, P. S. (2008). Is floral specialization an evolutionary dead-end pollination system transitions in Ruellia (Acanthaceae). Evolution 62, 1712–1737. doi: 10.1111/j.1558-5646.2008.00398.x
Van der Kooi, C. J., Kevan, P. G., and Koski, M. H. (2019). The thermal ecology of flowers. Ann. Bot. 124, 343–353.
Van der Niet, T., Peakall, R., and Johnson, S. D. (2014). Pollinator-driven ecological speciation in plants: new evidence and future perspectives. Ann. Bot. 113, 199–212. doi: 10.1093/aob/mct290
Wang, Z., Gerstein, M., and Snyder, M. (2009). RNA-Seq: a revolutionary tool for transcriptomics. Nat. Rev. Genet. 10, 57–63. doi: 10.1038/nrg2484
Wessinger, C. A., and Rausher, M. D. (2012). Lessons from flower colour evolution on targets of selection. J. Exp. Bot. 63, 5741–5749. doi: 10.1093/jxb/ers267
Wessinger, C. A., and Rausher, M. D. (2013). Predictability and irreversibility of genetic changes associated with flower color evolution in Penstemon barbatus. Evolution 68, 1058–1070. doi: 10.1111/evo.12340
Wessinger, C. A., and Rausher, M. D. (2014). Ecological transition predictably associated with gene degeneration. Mol. Biol. Evol. 32, 347–354. doi: 10.1093/molbev/msu298
Wheeler, L. C., and Smith, S. D. (2019). Computational modeling of anthocyanin pathway evolution: biases, hotspots, and trade-offs. Integr. Comp. Biol. 59, 585–598. doi: 10.1093/icb/icz049
Widmer, A., Lexer, C., and Cozzolino, S. (2009). Evolution of reproductive isolation in plants. Heredity 102, 31–38. doi: 10.1038/hdy.2008.69
Winkel-Shirley, B. (2002). Biosynthesis of flavonoids and effects of stress. Curr. Opin. Plant Biol. 5, 218–223. doi: 10.1016/s1369-5266(02)00256-x
Wood, D. E., Lu, J., and Langmead, B. (2019). Improved metagenomic analysis with Kraken 2. Genome Biol. 20, 257. doi: 10.1186/s13059-019-1891-0
Xu, W., Dubos, C., and Lepiniec, L. (2015). Transcriptional control of flavonoid biosynthesis by MYB–bHLH–WDR complexes. Trends Plant Sci. 20, 176–185. doi: 10.1016/j.tplants.2014.12.00
Yuan, Y. W., Byers, K. J., and Bradshaw, H. (2013). The genetic control of flower–pollinator specificity. Curr. Opin. Plant Biol. 16, 422–428. doi: 10.1016/j.pbi.2013.05.004
Zhang, Y., Zhou, T., Dai, Z., Dai, X., Li, W., Cao, M., et al. (2020). Comparative transcriptomics provides insight into floral color polymorphism in a Pleione limprichtii orchid population. Int. J. Mol. Sci. 21:247. doi: 10.3390/ijms21010247
Zhao, L., Gao, L., Wang, H., Chen, X., Wang, Y., Yang, H., et al. (2013). The R2R3-MYB, bHLH, WD40, and related transcription factors in flavonoid biosynthesis. Funct. Integr. Genomics 13, 75–98. doi: 10.1007/s10142-012-0301-4
Keywords: DFR, F3′5′H, flavonoid biosynthetic pathway, malvidin, pelargonidin, RNA-Seq
Citation: Sánchez-Cabrera M, Jiménez-López FJ, Narbona E, Arista M, Ortiz PL, Romero-Campero FJ, Ramanauskas K, Igić B, Fuller AA and Whittall JB (2021) Changes at a Critical Branchpoint in the Anthocyanin Biosynthetic Pathway Underlie the Blue to Orange Flower Color Transition in Lysimachia arvensis. Front. Plant Sci. 12:633979. doi: 10.3389/fpls.2021.633979
Received: 26 November 2020; Accepted: 01 February 2021;
Published: 22 February 2021.
Edited by:
Verónica S. Di Stilio, University of Washington, United StatesReviewed by:
Stacey Smith, University of Colorado Boulder, United StatesCarolyn Wessinger, University of South Carolina, United States
Copyright © 2021 Sánchez-Cabrera, Jiménez-López, Narbona, Arista, Ortiz, Romero-Campero, Ramanauskas, Igić, Fuller and Whittall. This is an open-access article distributed under the terms of the Creative Commons Attribution License (CC BY). The use, distribution or reproduction in other forums is permitted, provided the original author(s) and the copyright owner(s) are credited and that the original publication in this journal is cited, in accordance with accepted academic practice. No use, distribution or reproduction is permitted which does not comply with these terms.
*Correspondence: Mercedes Sánchez-Cabrera, bWVyY2VzY0B1cy5lcw==
†ORCID: Mercedes Sánchez-Cabrera, orcid.org/0000-0002-3786-0392
‡These authors have contributed equally to this work