 Chandan Roy
 Navin C. Gahtyari
 Xinyao He
 Vinod K. Mishra
 Ramesh Chand
 Arun K. Joshi
 Pawan K. Singh
- 1Department of Plant Breeding and Genetics, Bihar Agricultural University, Sabour, India
- 2ICAR–Vivekanand Parvatiya Krishi Anushandhan Sansthan, Almora, India
- 3International Maize and Wheat Improvement Center (CIMMYT), Texcoco, Mexico
- 4Department of Genetics and Plant Breeding, Institute of Agricultural Sciences, Banaras Hindu University, Varanasi, India
- 5Department of Mycology and Plant Pathology, Institute of Agricultural Sciences, Banaras Hindu University, Varanasi, India
- 6CIMMYT-India/Borlaug Institute for South Asia, New Delhi, India
Spot blotch (SB) disease causes significant yield loss in wheat production in the warm and humid regions of the eastern Gangetic plains (EGP) of South Asia (SA). Most of the cultivated varieties in the eastern part of SA are affected by SB under favorable climatic conditions. To understand the nature of SB resistance and map the underlying resistant loci effective in SA, two bi-parental mapping populations were evaluated for 3 years, i.e., 2013–2015 for the BARTAI × CIANO T79 population (denoted as BC) and 2014–2016 for the CASCABEL × CIANO T79 population (CC), at Varanasi, Uttar Pradesh, India. DArTSeq genotyping-by-sequencing (GBS) platform was used for genotyping of the populations. Distribution of disease reaction of genotypes in both populations was continuous, revealing the quantitative nature of resistance. Significant “genotype,” “year,” and “genotype × year” interactions for SB were observed. Linkage map with the genome coverage of 8,598.3 and 9,024.7 cM in the BC and CC population, respectively, was observed. Two quantitative trait loci (QTLs) were detected on chromosomes 1A and 4D in the BC population with an average contribution of 4.01 and 12.23% of the total phenotypic variation (PV), respectively. Seven stable QTLs were detected on chromosomes 1B, 5A, 5B, 6A, 7A, and 7B in the CC population explaining 2.89–10.32% of PV and collectively 39.91% of the total PV. The QTL detected at the distal end of 5A chromosome contributed 10.32% of the total PV. The QTLs on 6A and 7B in CC could be new, and the one on 5B may represent the Sb2 gene. These QTLs could be used in SB resistance cultivar development for SA.
Introduction
Spot blotch (SB) disease caused by Cochliobolus sativus (Ito and Kuribayashi) Drechsler ex Dastur [anamorph Bipolaris sorokiniana (Sacc.) Shoemaker] is considered a significant disease of wheat (Triticum aestivum L.) in South Asia (SA) (Gupta et al., 2018). High temperature and humidity favor the disease development in the warmer wheat growing areas of the eastern Gangetic plains (EGP), particularly in Bangladesh (Siddique et al., 2006), Nepal (Sharma et al., 2007b), and eastern India (Joshi et al., 2007a). The long-established practice of rice–wheat cropping system in the EGP delays the sowing of wheat crop that provides a congenial humid and warm environment for the SB development in the later stages of crop growth. Average yield loss due to SB ranges from 15 to 20%, but under favorable environment, up to 87% yield loss has been observed in susceptible genotypes (Hetzler et al., 1991). Delayed seeding of wheat in the EGP resulted on an average loss of 30% yield due to complex foliar blights, especially SB (Duveiller et al., 2005). Trait association analysis revealed that days to heading (DH) and plant height (PH) often showed a negative correlation with SB severity (Singh et al., 2015). Several attempts have been made including cultural practices and chemical application to control SB, but none of them was completely successful. Integrated disease management using host resistance, chemical control, and cultural practices is considered most effective in managing the disease (Joshi and Chand, 2002).
Except for a recent attempt (Kumar et al., 2019), no host immunity has been observed for SB, and the best released cultivars are only partially resistant. SB resistance is under polygenic control, with quantitative trait loci (QTL) of various phenotypic effects; hence, the progress of cultivar development is relatively slow. Genetic studies for SB resistance have identified multiple QTLs, of which four with major effects have been nominated, i.e., Sb1 through Sb4. The Sb1 is located on chromosome 7DS flanked by the markers Xgwm1220 and Xgwm295, being co-located with the leaf rust resistance locus Lr34 having pleiotropic effects on resistance to yellow rust (Yr57), powdery mildew (Pm8), and leaf tip necrosis (Ltn+) (Lillemo et al., 2013). The Sb2 (Qsb.bhu-5B) has been mapped on chromosome 5BL flanked by the simple sequence repeat (SSR) markers Xgwm639 and Xgwm1043 (Kumar et al., 2015). The third gene, Sb3, was mapped on chromosome 3BS (Lu et al., 2016), being in the same region where two previously reported QTLs Qsb.bhu 3B and Qsb.cim 3B reside. Recently, the Sb4 gene has been mapped on the long arm of chromosome 4B, where 21 putative genes were predicted (Zhang et al., 2020). QTLs with minor effects are also important for SB resistance since stacking such QTLs significantly reduced SB severity (Singh et al., 2018). Multiple minor QTLs have been mapped on 1A, 1B, 1D, 2B, 2D, 3A, 3B, 4A, 5A, 5B, 6A, and 7A (Gurung et al., 2014; Zhu et al., 2014; Singh et al., 2016; Bainsla et al., 2020).
Germplasm development for SB resistance started in the 1980s, which led to the identification of several wheat genotypes with variable resistance like Saar, Yangmai 6, Shanghai 4, M3, Chirya 1, Chirya 3, Chirya 7, and SYN1 (Ibeagha et al., 2005). Looking at the growing incidence of SB in SA, CIMMYT developed a special nursery in 2009 for SA named CSISA-SB, under the Cereal System Initiative for South Asia (CSISA) project. The purpose was to share CIMMYT breeding lines with SB resistance and good agronomic performance with the researchers of other countries and to test the nursery over various locations. This nursery was renamed Helminthosporium Leaf Blight Screening Nursery (HLBSN) in 2015 and distributed beyond SA to South American and African countries like Brazil, Bolivia, Paraguay, and Zambia, where SB is of major concern. The SB screening platform of CIMMYT in Mexico is located at Agua Fria, where the climate is similar to SA, providing strong support in the selection of SB-resistant genotypes for SA (Singh et al., 2015).
In SA, the Varanasi center of India has been identified as one of the most suitable sites for the evaluation of SB; it has a close similarity with the climatic conditions of Bhairahawa and Rampur of Nepal (Joshi et al., 2007a). Previously, four bi-parental mapping populations were evaluated at Agua Fria, Mexico, and their underlying QTLs have been identified (Singh et al., 2018; He et al., 2020). In the present study, we evaluated two of those four mapping populations at Varanasi, India, to determine the resistant QTLs effective under the SA environment.
Materials and Methods
Plant Materials
Two SB-resistant lines BARTAI (BABAX/LR 42//BABAX/3/ERA F 2000) and CASCABEL (SOKOLL//W15.92/WEEBILL1) identified in the previous experiments were crossed with a common susceptible parent CIANO T79 (BUCKY/(SIB)MAYA-74/4/BLUEBIRD//HD-832.5.5/OLESEN/3/CIANO-67/PENJAMO-62) to develop two bi-parental mapping populations (Singh et al., 2018; He et al., 2020). Recombinant inbred lines (RILs) were generated following the single seed descent method from F2 generation of the cross BARTAI × CIANO T79 (BC population) and CASCABEL × CIANO T79 (CC population) at CIMMYT, Mexico. Field experiments were conducted using a total of 231 RILs of BC and 226 RILs of CC in F2:7 generation along with the parents constituting the populations, and genotypes Chirya 3 and Sonalika were included as resistant and susceptible check, respectively.
Field Experiments
Field evaluation was carried out at the experimental station of Banaras Hindu University (BHU, 25.2°N, 83.0°E), Varanasi, India, in the years 2012–2013 (denoted as 2013), 2013–2014 (2014), and 2014–2015 (2015) for the BC population, and in the years 2013–2014 (2014), 2014–2015 (2015), and 2015–2016 (2016) for the CC population. Sowing was done in December, under late sown conditions to expose the crop to high temperature and humidity at the later stage of crop growth, which favors SB disease development. The experiments were conducted in a randomized complete block design with two replications, where each entry was sown in 2-m double rows spaced 25 cm apart, with a plant-to-plant distance of 5 cm.
Inoculation Method and SB Assessment
The pure culture of B. sorokiniana (isolate HD 3069/MCC 1572) was maintained using potato dextrose agar (PDA) medium (Chand et al., 2003). The pathogen was mass multiplied on previously soaked and autoclaved sorghum grains, which was kept under room temperature for at least 6 weeks. Spore suspension culture was prepared at a concentration of 1 × 10⁴ spores ml–1. To create an artificial epiphytotic condition, the spore suspension was inoculated at the heading stage [Zadok’s growth stage (GS) 55] in the evening time. Light irrigation was given after inoculation to maintain high humidity for disease development.
Disease scoring was done for three subsequent growth stages at the beginning of anthesis (GS 63), after completion of anthesis (GS 69), and late milking (GS 77) using a double-digit (00–99) scale as prescribed by Saari and Prescott (1975). The first digit (D1) measured disease progress in PH and the second digit (D2) measured the disease severity in terms of the proportion of infected leaf area. The percentage of disease severity for each score was measured as:
Area under disease progress curve (AUDPC) was calculated using percent of severity estimations corresponding to disease rating as:
where
Yi = disease level at the time ti.
Y(i+1) = disease level at time ti+1.
ti+1 – ti = time difference in days between two disease scores.
n = number of readings.
Area under disease progress curve average of two replications in a single year and mean AUDPC across all 3 years were used for QTL analysis. DH and PH were also measured to determine their association with SB.
Statistical Analysis
Analysis of variance (ANOVA) and Pearson correlation coefficients were calculated using statistical software OPSTAT1. Marker-based narrow sense heritability was calculated with the “heritability” package of R (Kruijer et al., 2015).
Genotyping and Linkage Analysis
Genomic DNA was isolated using the cetyltrimethylammonium bromide (CTAB) method from each entry including the parental lines of respective populations. Genotyping was carried out using the DArTSeq genotyping-by-sequencing (GBS) platform (Li et al., 2015) at the Genetic Analysis Service for Agriculture (SAGA) in Guadalajara, Mexico. Several gene-based markers and D-genome-specific single-nucleotide polymorphism (SNP) markers using “Kompetitive allele-specific PCR” (KASP) were also used. QTL analysis was carried out using an integrated software package ICIMapping version 4.1 (Meng et al., 2015). Monomorphic markers, markers with missing value >20%, and minor allele frequency <30% were removed from QTL analysis. Chromosome anchoring was done for each marker as per the GBS map described by Li et al. (2015). Linkage groups (LGs) were constructed using the MAP function in the ICIMapping software version 4.1, with the LOD threshold set at 15 and the rest parameters at default.
Quantitative trait loci mapping was performed using the BIP function of ICIMapping, where interval mapping was first carried out to identify significant QTLs and after that inclusive composite interval mapping was performed to identify more robust QTLs. QTL mapping was also carried out after adjusting for DH and PH. Adjusted mean was calculated by the software Multi-Environment Trial Analysis with R (META-R) version 6.0 using DH and PH as cofactors. A QTL was considered significant when it exceeded the LOD threshold of 3.4 (1,000 permutations at α = 0.05) for BC and LOD of 3.6 for CC populations in at least one environment. However, QTL with an LOD value of 2.5 or above appearing in more than one environment was also considered as significant. To draw the LGs and LOD curve, software MapChart v. 2.3 (Voorrips, 2002) was used.
Results
Phenotyping for SB Resistance
Significant genetic variation was observed for SB among the genotypes in both the BC and CC populations. Effects of climatic fluctuations across years on SB development were revealed by significant variation in “year” and “genotype × year” interaction effects; however, for the CC population, the latter effect was non-significant (Table 1). Disease pressure was maximum in the year 2014 and least in 2015 for both populations. A similar trend was also observed for Sonalika and Chirya 3, the susceptible and resistant checks, respectively. Continuous distribution of genotypes for SB resistance in different years and their mean were observed (Figure 1). Transgressive segregants for resistance and susceptibility were obtained in both the populations. Twenty-three resistant transgressive segregants were found in the BC population, out of which seven genotypes performed better than the resistant check Chirya 3, whereas in the CC population, 55 genotypes showed higher resistant than CASCABEL, out of which 10 genotypes were better than Chirya 3.
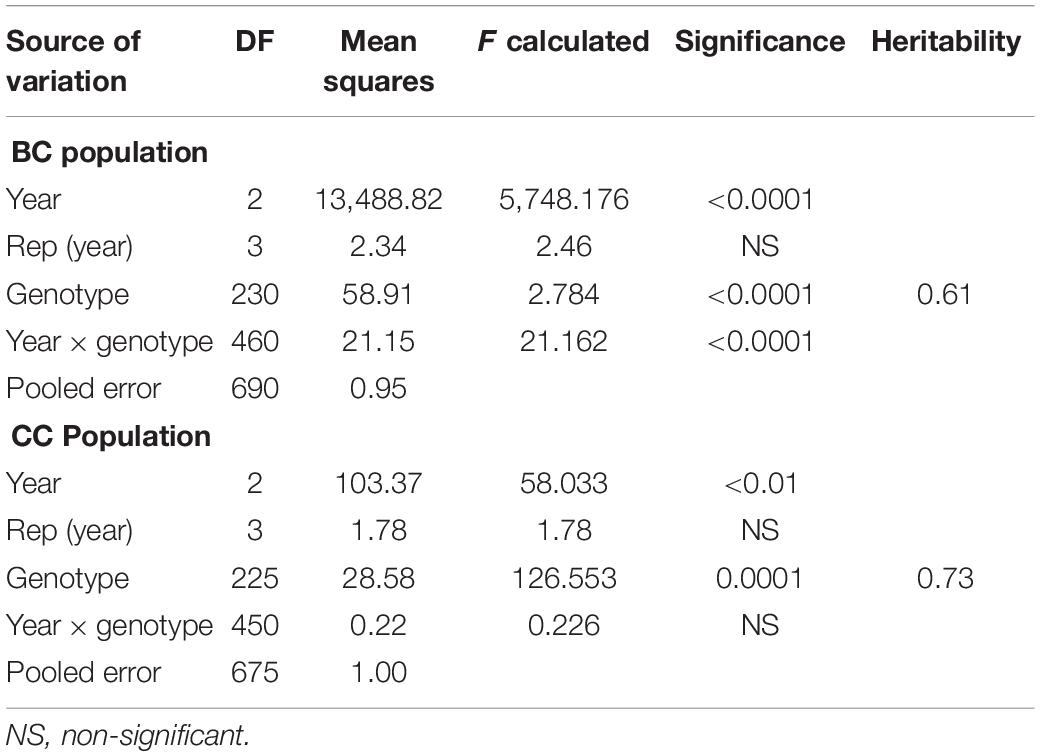
Table 1. Analysis of variance and heritability estimates of spot blotch resistance in BARTAI × CIANOT79 (BC) and CASCABEL × CIANOT79 (CC) populations.
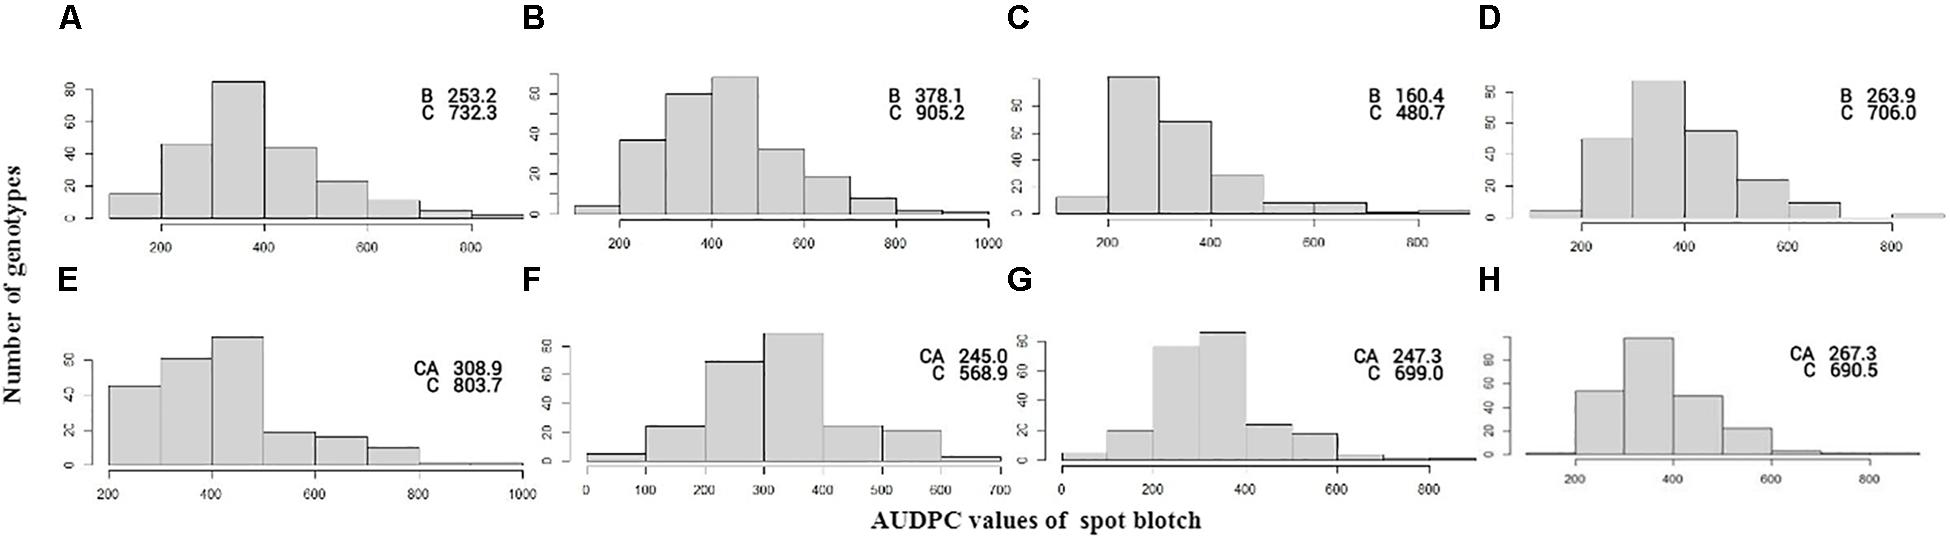
Figure 1. Frequency distribution of AUDPC scores in the BC population in the year 2013 (A), 2014 (B), 2015 (C), and mean (D) and CC population in the year 2014 (E), 2015 (F), 2016 (G), and mean (H). AUDPC score of parents BARTAI, CASCABEL, and CIANO T79 is denoted as B, CA, and C.
Moderate heritability estimates for SB in BC (0.61) and CC (0.73) were recorded (Table 1). DH and PH were mostly negatively correlated with SB. PH was found to be more closely associated with SB than DH as exhibited in the significantly negative association across all the environments in both populations (Table 2).
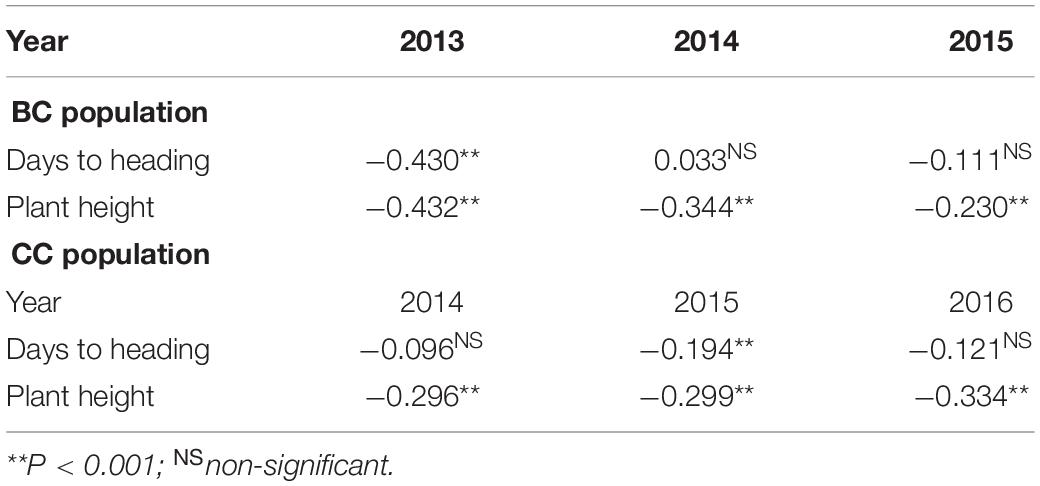
Table 2. Pearson correlation coefficient analysis of spot blotch resistance with days to heading and plant height in BARTAI × CIANOT79 (BC) and CASCABEL × CIANOT79 (CC) populations.
Genotyping and Linkage Analysis
Out of 18,000 GBS markers scored in both populations, 3,174 and 3,197 high-quality non-redundant markers in BC and CC populations, respectively, were screened out for linkage analysis and QTL mapping (Supplementary Tables 1, 2). Both populations contained 21 large LGs representing all the 21 wheat chromosomes, as well as a few fragmented LGs that were not used in subsequent analysis. The linkage map of the BC population covered 8,598.3 cM with an average distance of 2.71 cM between markers, while in the CC population, 9024.21 cM was covered with an average distance of 2.82 cM between markers. All chromosomes were in good coverage with the least length of 199.22 cM for 1D in the BC population and 223.69 cM for 4D in the CC population. The coverage for chromosomes of A and B sub-genome was better than that of D genome in both populations (Supplementary Tables 1, 2).
QTL Identification for SB Resistance
The QTL with the largest phenotypic variation explained (PVE) in the BC population was detected on chromosome 4D, with a mean PVE of 12.23% (Table 3). This QTL was found to be associated with PH. Another QTL was detected on chromosome 1A with the mean phenotypic effect of 4%. Two additional QTLs with minor effects were detected on 4D in 2013 and 5B in 2015 (Table 3 and Figure 2). All the resistance alleles of the QTLs in BC population were contributed by the resistant parent BARTAI. When PH was used as a covariate, the effect of the QTL reduced; in addition, few other QTLs on 4B, 5B, and 6B chromosomes were detected (Supplementary Table 3).
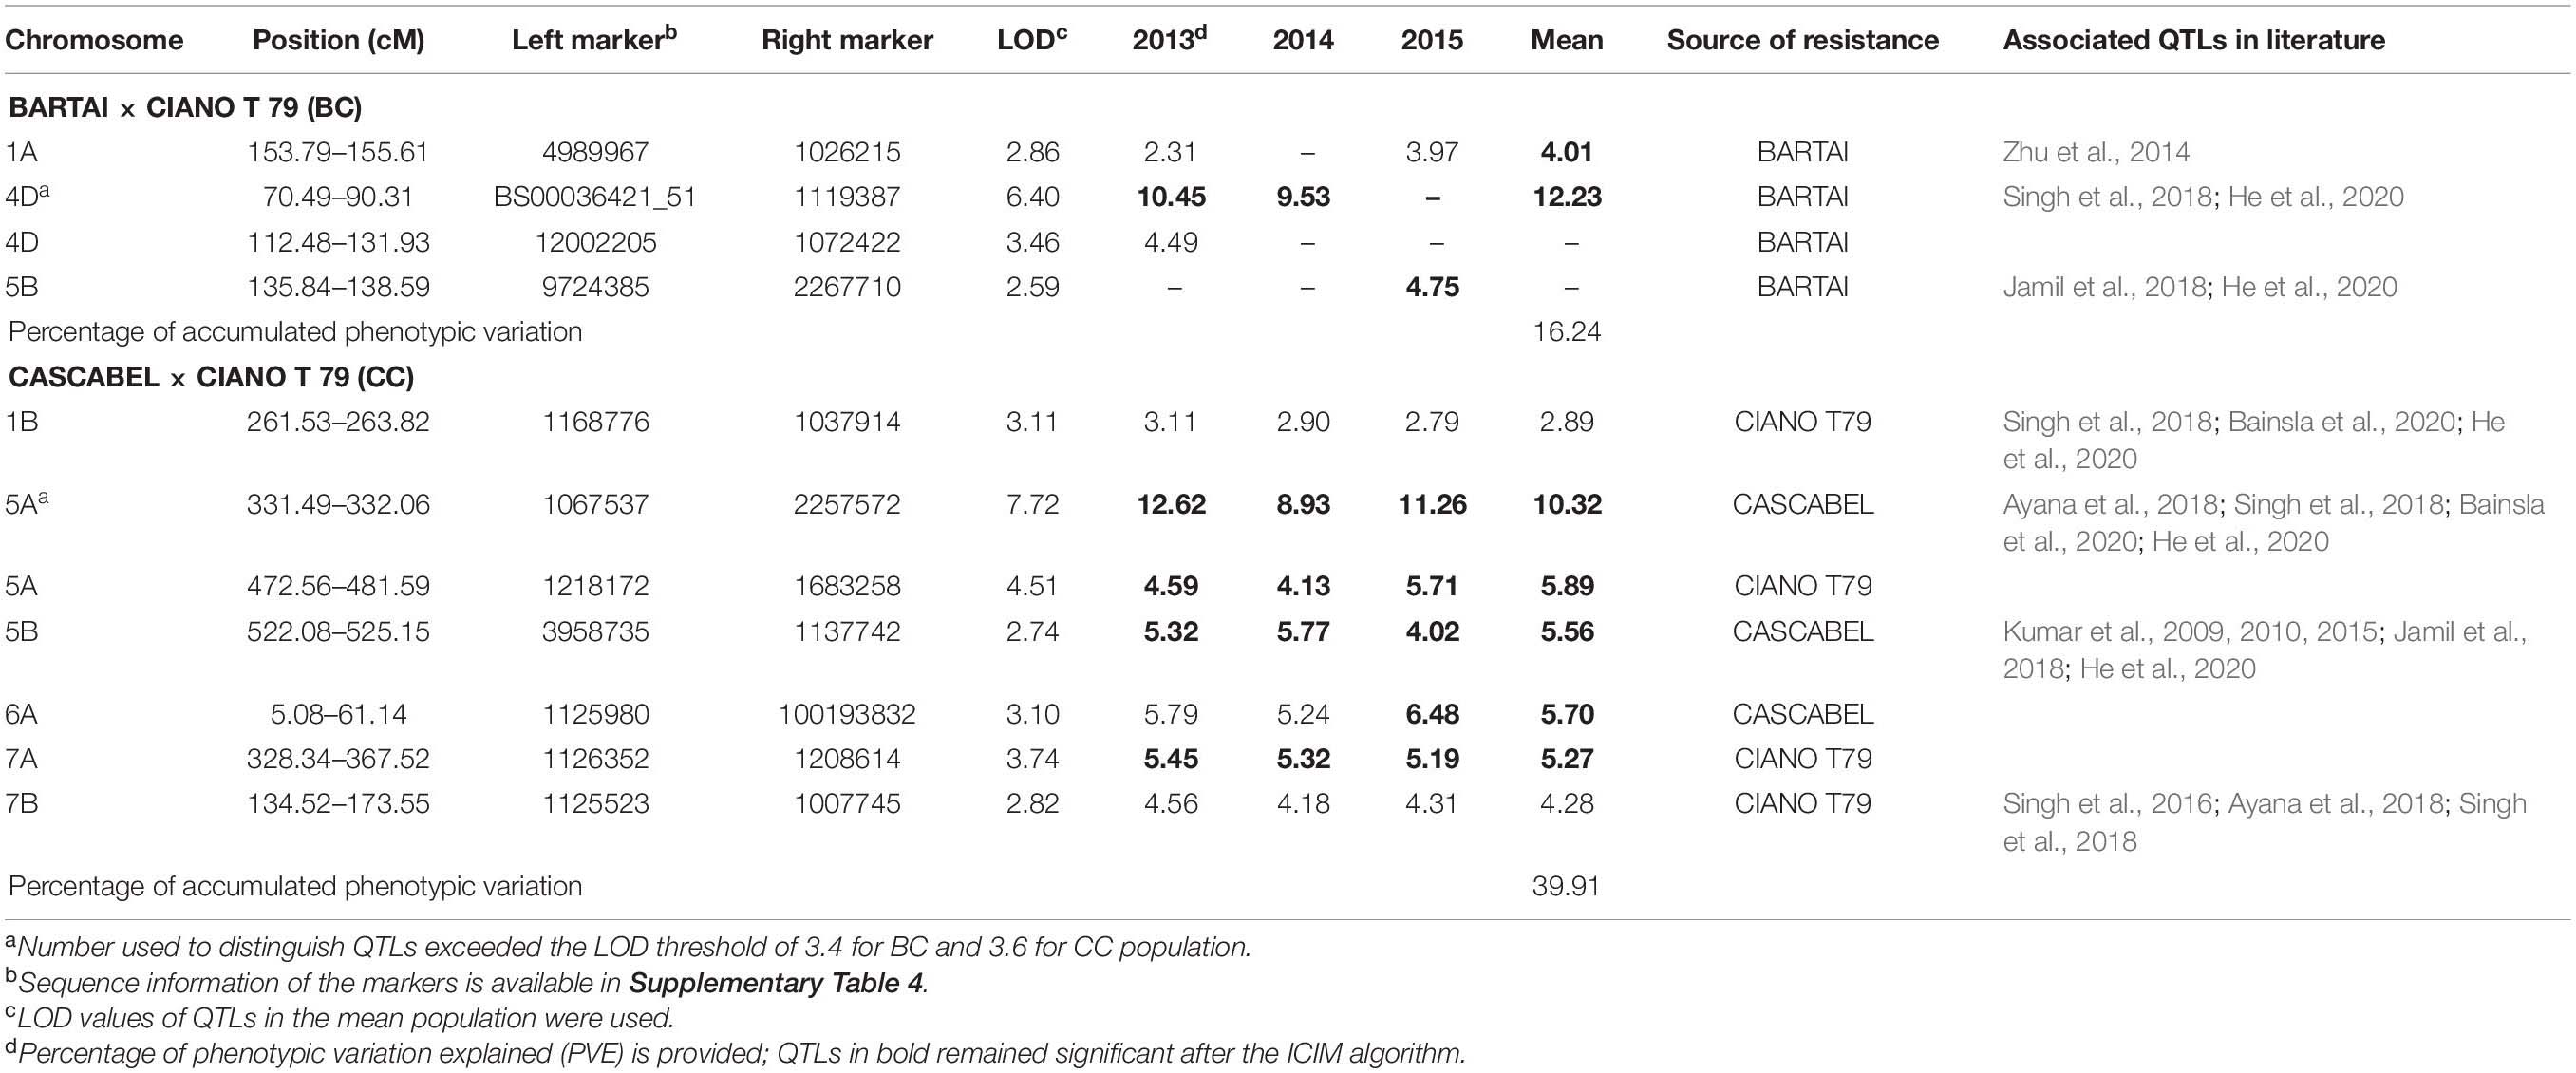
Table 3. Quantitative trait loci (QTLs) identified for SB in the BARTAI × CIANO T79 (BC) and CASCABEL × CIANO T79 (CC) populations and their associated QTLs in literature.
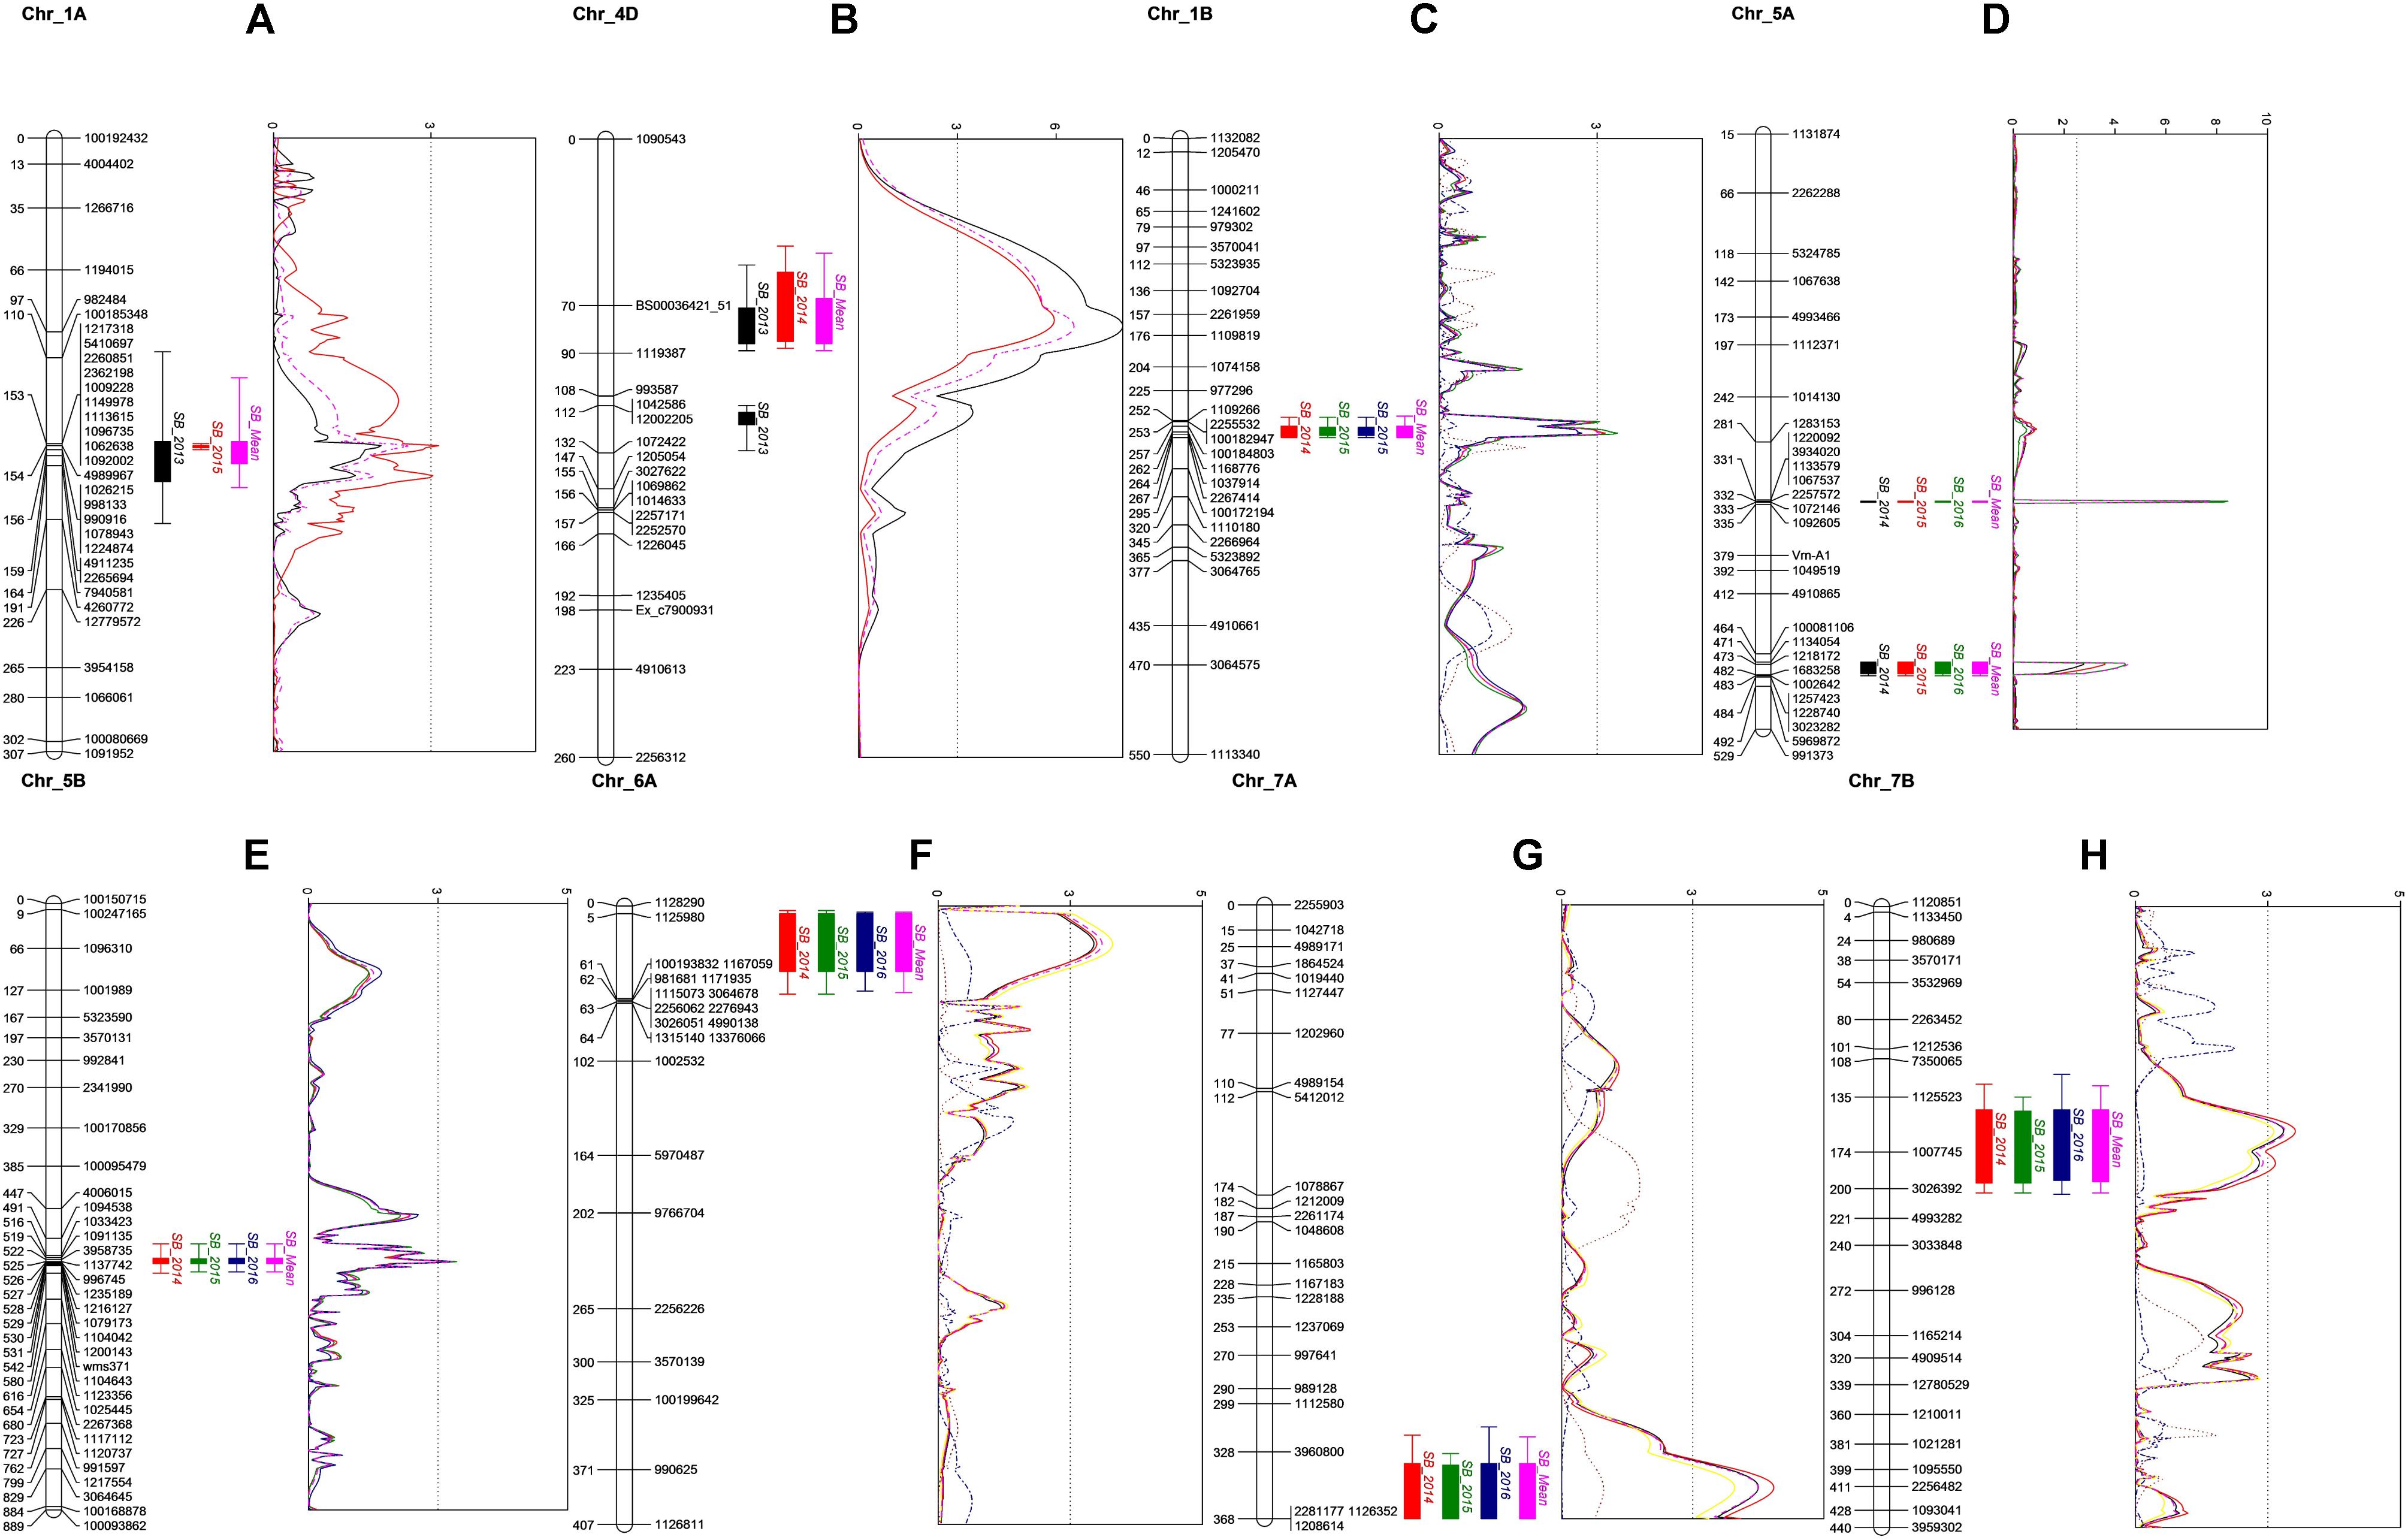
Figure 2. QTL profiles for SB in BC population on chromosomes 1A (A) and 4D (B), and in CC population on chromosomes 1B (C), 5A (D), 5B (E), 6A (F), 7A (G), and 7B (H). Genetic distance in cM is presented in the left side of each chromosome. A LOD threshold of 2.5 is indicated by the vertical dashed line.
Seven QTLs were detected in the CC population, altogether explaining 39.91% of phenotypic variation (PV). The QTLs were detected on six chromosomes (1B, 5A, 5B, 6A, 7A, and 7B) with the mean PVE ranging from 2.89 to 10.32%. The resistance alleles of QTLs on 1B, 5A (proximal), 7A, and 7B were contributed by CIANO T79, whereas those of QTLs on 5A (distal), 5B, and 6A were contributed by CASCABEL. Out of 55 resistant transgressive segregants, 40 were carrying at least one QTL contributed by CIANO T79. The major QTL was detected on the distal end of chromosome 5A with a PV ranging from 8.93 to 12.62% in 2015 and 2014, respectively, with a mean PV of 10.32%. The effect of QTLs in the reduction of AUDPC appeared to be additive in nature (Figure 3).
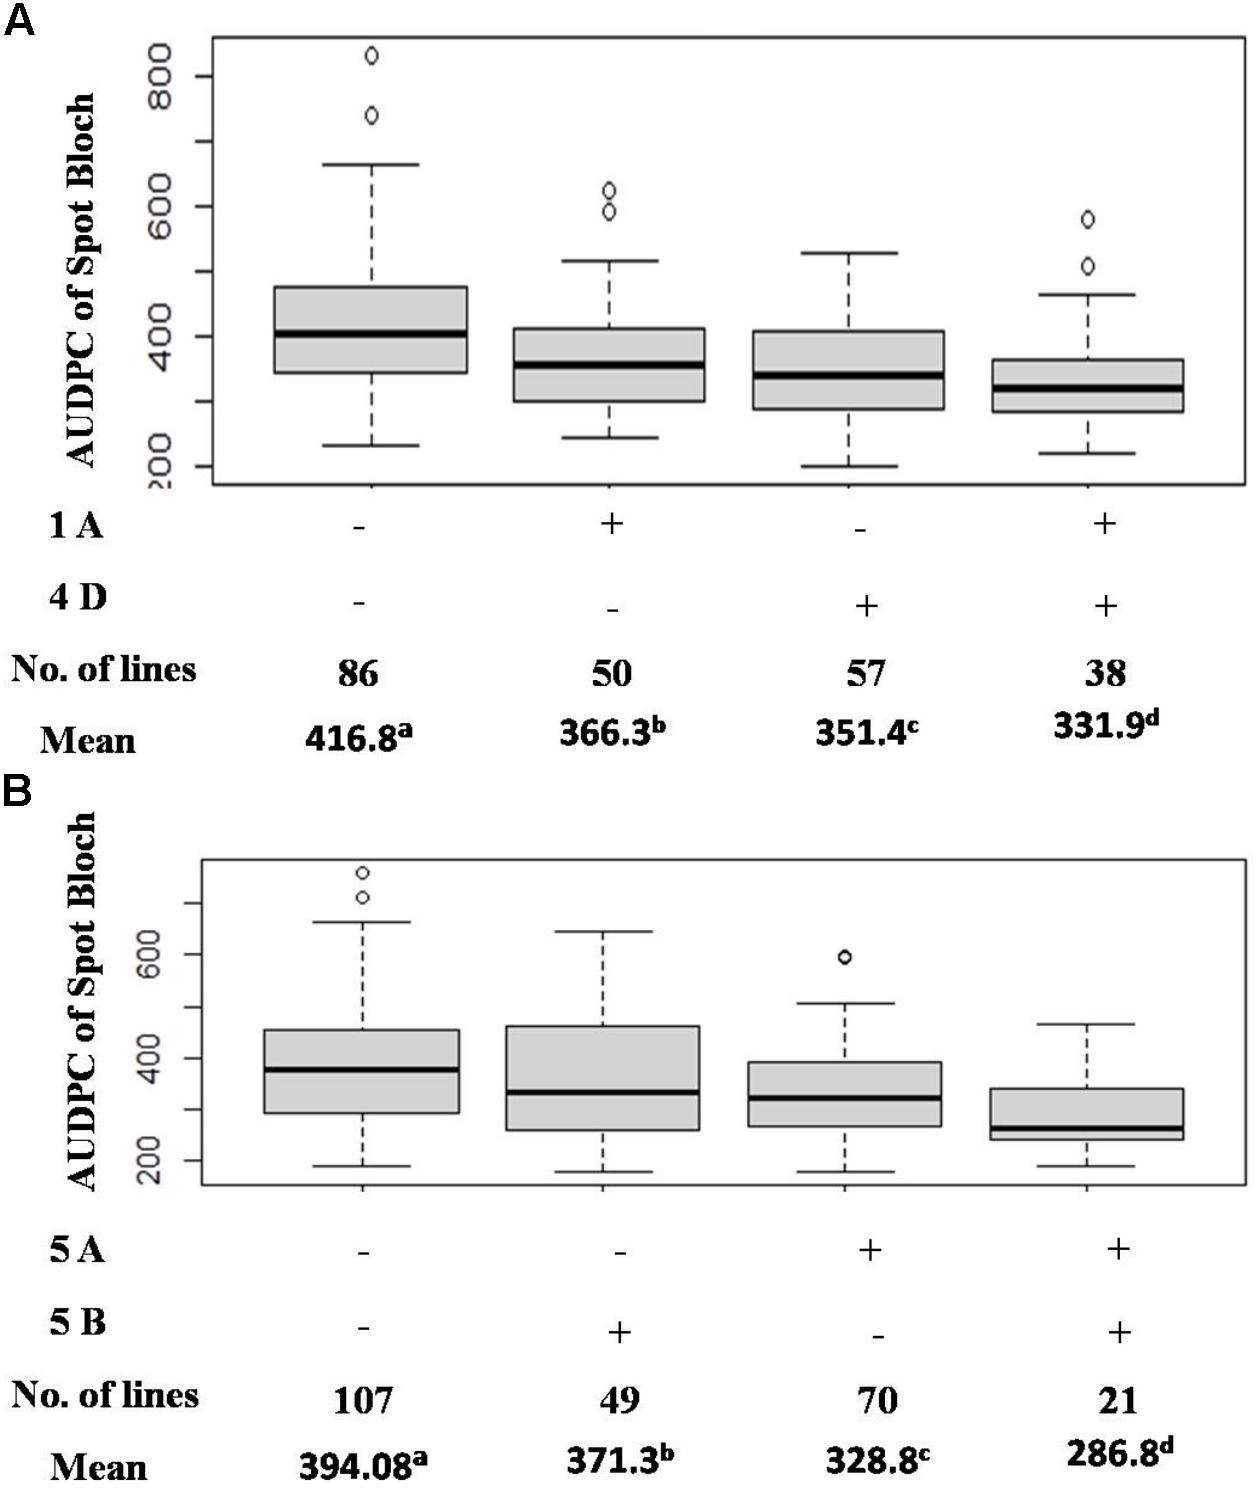
Figure 3. Effects of QTL combinations in reducing AUDPC in the BC (A) and CC (B) population.
Discussion
Due to global warming and climate change, wheat production is predicted to be adversely affected (Rosyara et al., 2010). Higher temperature combined with rains during the grain filling stages increases the chances of SB in EGP, resulting in significant yield losses. Since the vulnerability of the wheat crop to SB increases when temperature exceeds 26°C at post-anthesis stage (Chaurasia et al., 2000), sowing in this study was delayed, exposing the populations under higher disease pressure. Joishi et al. (2002) reported that the resistance is independent of plant growth stage as there is appearance of substantial proportion of resistance in tall and dwarf progenies obtained from resistant tall × susceptible dwarf and in early and late progenies from resistant tall × susceptible early cross, respectively. However, to avoid the influence of growth stages on the disease appearance, scoring was done at different growth stages. The present observation on the negative correlation of DH and PH with SB has shown similarity with the previous reports from Agua Fria (Singh et al., 2018) and SA (Singh et al., 2016). Negative association of DH and PH with SB implies the selection of late and tall genotypes for better SB resistance, but such cultivars are not suitable for high rainfall and warmer regions like EGP of SA (Joshi et al., 2007b). Fortunately, this association has been broken, and several early maturing SB resistance cultivars have been identified for warm climatic conditions of SA (Sharma et al., 2004; Joshi et al., 2007b).
All experiments in the current study exhibited a typical quantitative inheritance of SB resistance with strong genotype × environment (G × E) interactions, which has also been reported in earlier studies constituting Indian germplasm, CIMMYT derivatives, and Afghan landraces (Kumar et al., 2016; Singh et al., 2018; Bainsla et al., 2020). Strong G × E interaction has always been a concern for plant breeders as it influences varietal adaptation across the environments. QTL × environment interaction, a component of G × E interaction, affects the efficiency of marker-assisted selection. Identification of QTLs across the location and year helps breeders in design and implementation of breeding strategies for the improvement of complex traits for adaptation in specific or mega environment. Veldboom and Lee (1996) reported that QTLs identified in the mean and across the environment are of major importance. In our study, two stable QTLs on chromosomes 1A and 4D were detected in the BC population, with the latter explaining major PVs. In a previous report, when the same population was evaluated at CIMMYT’s Agua Fria station, a QTL on 4D chromosome was mapped at the same chromosomal region but was significant only in 1 year, having a PVE of 3.6% (Singh et al., 2018), implying a stronger influence of PH on SB resistance in SA. The QTL on 1A was not found in Singh et al. (2018) and thus might be specific only to SA environments. In a previous study, Zhu et al. (2014) identified a QTL on 1A, being close to the QTL identified in the present study.
A QTL on chromosome 5A delimited by the flanking markers 1067537–2257572 was significant in all 3 years explaining major PV in CC population. The same QTL was identified in the previous studies at Agua Fria but with higher phenotypic effects that reduced significantly when adjusted for PH and DH (Singh et al., 2018; He et al., 2020). In the current study, the QTL was identified 47.0 cM distance away from the vernalization locus Vrn-A1; also, the effect of QTL remained significant in all the 3 years when DH and PH were used as covariates. The allele vrn-A1 responsible for late maturity was associated with SB resistance, escaping the disease due to delayed phenology. However, the possibility of the presence of a SB resistance QTL in close proximity of Vrn-A1 cannot be excluded (Singh et al., 2018; He et al., 2020) due to remnant effects of the QTL after adjusting for DH. Similarly, Bainsla et al. (2020) reported a marker 0.8 Mb away from Vrn-A1 that is responsible for SB resistance. Likewise, Zhu et al. (2014) mapped a SB resistance QTL QSb.cim-5A at 30.3 cM away from Vrn-A1. The strong marker trait association would be useful for the selection of SB resistance QTL based on Vrn-A1.
The QTL identified on 5B chromosome in the CC population was also reported earlier when evaluated at Agua Fria (He et al., 2020). However, in the present study, the contribution of this QTL was lower than the previous report, ranging from 4.02 to 5.77% in different years of evaluation. Comparing the QTL position using the sequences of flanking markers through BLAST to the IWGSC RefSeq v1.0 genome sequence of Chinese Spring (CS), the position of this QTL coincides with the previously identified Sb2 gene (He et al., 2020). The presence of Sb2 was reported in resistant genotypes Yangmai 6 (Kumar et al., 2009), Ning8201 (Kumar et al., 2010) and CASCABEL (He et al., 2020). Additionally, this gene has been detected in an Afghan population (Bainsla et al., 2020), CIMMYT germplasm (Jamil et al., 2018), and a diverse germplasm panel with global origin (Gurung et al., 2014), suggesting that Sb2 has been selected by breeders of different continents due to its positive effects on SB resistance. Recently, Tsn1 on 5BL was identified as a sensitivity gene for the pathogen carrying the corresponding virulent gene ToxA (Friesen et al., 2018). It was suggested that Tsn1 gene is the susceptibility gene of Sb2 (Friesen et al., 2018), but He et al. (2020) proposed that the two genes might be different. A recent study of Indian B. sorokiniana population indicated that about 70% of the isolates carried ToxA (Navathe et al., 2019). The presence of ToxA in Mexican B. sorokiniana isolates (Wu et al., 2021) indicates the similarity in virulence factors of pathogenic population in Mexico and SA that reflects why the selections in Agua Fria are effective for SA.
Three QTLs on 6A, 7A, and 7B in the CC population were identified only in SA. Anchoring the flanking markers of the 6A and 7B QTLs in the CS reference genome indicated that they both reside at the distal end of their respective chromosomes. Earlier, SB resistance QTL was mapped on 6A (Sharma et al., 2007a) and 7B (Singh et al., 2016; Ayana et al., 2018) but at different positions, implying that those mapped in the current study might be new. However, the QTL on 7A might not be new, since QTLs with similar confidence intervals were reported in the KATH × CIANO T79 population (Singh et al., 2018), in a CIMMYT wheat panel (Jamil et al., 2018), as well as in the Afghan landrace collection (Bainsla et al., 2020).
The pathotype diversity of B. sorokiniana and some climatic difference among SA and Mexico environments possibly play a significant role in the identification of effective QTLs. In our study, QTLs specific to SA were detected in both populations, providing an opportunity for breeding SB resistance cultivars in SA. In CC, an average of 27.2% reduction in SB was observed when the 5A and 5B QTLs were combined, compared to a 42.3% reduction of SB at Agua Fria (He et al., 2020). Detection of QTLs on 5A and Sb2 at both SA and Agua Fria indicated the potentiality of these genes in resistance breeding for SA, but their lower phenotypic effects for SB in SA environment indicates the role of other QTLs, like those on 4D, 6A, and 7A. Furthermore, validation of these QTLs and markers over multiple locations and years will provide not only more insight into the SB resistance in SA but also more robust markers for the development of SB-resistant cultivars targeting SA.
Data Availability Statement
The original contributions presented in the study are publicly available. This data can be found here: https://hdl.handle.net/11529/10548547.
Author Contributions
PS, AJ, and XH designed the research and provided the plant material. VM and RC conducted the field experiments. CR, NG, and XH analyzed the data. CR drafted the first version of the manuscript. All authors contributed to the writing of the manuscript.
Funding
Financial support from the Bill and Melinda Gates Foundation and USAID through the CSISA, BGRI, DGGW projects, and CGIAR Research Program on WHEAT for conducting this research is gratefully acknowledged. The financial support received by the first and second authors from the Indian Council of Agriculture Research (ICAR), India, is also acknowledged.
Conflict of Interest
The authors declare that the research was conducted in the absence of any commercial or financial relationships that could be construed as a potential conflict of interest.
Supplementary Material
The Supplementary Material for this article can be found online at: https://www.frontiersin.org/articles/10.3389/fpls.2021.641324/full#supplementary-material
Footnotes
References
Ayana, G. T., Ali, S., Sidhu, J. S., Gonzalez-Hernandez, J. L., Turnipseed, B., and Sehgal, S. K. (2018). Genome-wide association study for spot blotch resistance in hard winter wheat. Front. Plant Sci. 9:926. doi: 10.3389/fpls.2018.00926
Bainsla, N. K., Phuke, R. M., He, X., Gupta, V., Bishnoi, S. K., Sharma, R. K., et al. (2020). Genome-wide association study for spot blotch resistance in Afghan wheat germplasm. Plant Pathol. 69, 1161–1171. doi: 10.1111/ppa.13191
Chand, R., Pandey, S., Singh, H., Kumar, S., and Joshi, A. K. (2003). Variability and its probable cause in natural populations of spot blotch pathogen Bipolaris sorokiniana of wheat (T. aestivum L.) in India / Variabilitätundihrewahrscheinlicheursache in natürlichenpopulationendeser-regersvonblattflecken (Bipolaris sorokiniana) anweizen (Triticum aestivum L.) in Indien.”. Z. Pflanzenkr. Pflanzenschutz J. Plant Dis. Prot. 110, 27–35. doi: 10.14492/hokmj/1381758488
Chaurasia, S., Chand, R., and Joshi, A. K. (2000). Relative dominance of Alternaria triticina Pras. et Prab. and Bipolaris sorokiniana (Sacc.) Shoemaker in different growth stages of wheat (T. aestivum L.). J. Plant Dis. Prot. 107, 176–181.
Duveiller, E., Kandel, Y. R., Sharma, R. C., and Shrestha, S. M. (2005). Epidemiology of foliar blights (spot blotch and tan spot) of wheat in the plains bordering the himalayas. Phytopathology 95, 248–256. doi: 10.1094/phyto-95-0248
Friesen, T. L., Holmes, D. J., Bowden, R. L., and Faris, J. D. (2018). ToxA is present in the U.S. Bipolaris sorokiniana population and is a significant virulence factor on wheat harboring Tsn1. Plant Dis. 102, 2446–2452. doi: 10.1094/pdis-03-18-0521-re
Gupta, P. K., Chand, R., Vasistha, N. K., Pandey, S. P., Kumar, U., Mishra, V. K., et al. (2018). Spot blotch disease of wheat: the current status of research on genetics and breeding. Plant Pathol. 67, 508–531. doi: 10.1111/ppa.12781
Gurung, S., Mamidi, S., Bonman, J. M., Xiong, M., Brown-Guedira, G., and Adhikari, T. B. (2014). Genome-wide association study reveals novel quantitative trait loci associated with resistance to multiple leaf spot diseases of spring wheat. PLoS One 9:e108179. doi: 10.1371/journal.pone.0108179
He, X., Dreisigacker, S., Sansaloni, C., Duveiller, E., Singh, R. P., and Singh, P. K. (2020). QTL mapping for spot blotch resistance in two bi-parental mapping populations of bread wheat. Phytopathology 110, 1980–1987. doi: 10.1094/phyto-05-20-0197-r
Hetzler, J., Eyal, Z., Mehta, Y. R., Campos, L. A., Fehrmann, H., Kushnir, U., et al. (1991). “Interaction between spot blotch and wheat cultivars,” in Wheat for the Nontraditional Warm Areas: A Proceedings of the International Conference, ed. D. A. Saunders (Foz do Iguaçu: CIMMYT), 125–145.
Ibeagha, A. E., Hückelhoven, R., Schäfer, P., Singh, D. P., and Kogel, K. H. (2005). Model wheat genotypes as tools to uncover effective defense mechanisms against the hemibiotrophic fungus Bipolaris sorokiniana. Phytopathology 95, 528–532. doi: 10.1094/phyto-95-0528
Jamil, M., Ali, A., Gul, A., Ghafoor, A., Ibrahim, A. M. H., and Mujeeb-Kazi, A. (2018). Genome-wide association studies for spot blotch (Cochliobolus sativus) resistance in bread wheat using genotyping-by-sequencing. Phytopathology 108, 1307–1314. doi: 10.1094/phyto-02-18-0047-r
Joishi, A. K., Chand, R., and Arun, B. (2002). Relationship of plant height and days to maturity with resistance to spot blotch in wheat. Euphytica 123, 221–228.
Joshi, A. K., and Chand, R. (2002). Variation and inheritance of leaf angle, and its association with spot blotch (Bipolaris sorokiniana) severity in wheat (Triticum aestivum). Euphytica 124, 283–291.
Joshi, A. K., Ortiz-Ferrara, G., Crossa, J., Singh, G., Alvarado, G., Bhatta, M. R., et al. (2007a). Associations of environments in South Asia based on spot blotch disease of wheat caused by Cochliobolus sativus. Crop Sci. 47, 1071–1081. doi: 10.2135/cropsci2006.07.0477
Joshi, A. K., Ortiz-Ferrara, G., Crossa, J., Singh, G., Sharma, R. C., Chand, R., et al. (2007b). Combining superior agronomic performance and terminal heat tolerance with resistance to spot blotch (Bipolaris sorokiniana) of wheat in the warm humid Gangetic plains of South Asia. Field Crop Res. 103, 53–61. doi: 10.1016/j.fcr.2007.04.010
Kruijer, W., Boer, M. P., Malosetti, M., Flood, P. J., Engel, B., Kooke, R., et al. (2015). Marker-based estimation of heritability in immortal populations. Genetics 199, 379–398. doi: 10.1534/genetics.114.167916
Kumar, S., Archak, S., Tyagi, R. K., Kumar, J., Vikas, V. K., Jacob, S. R., et al. (2016). Evaluation of 19,460 wheat accessions conserved in the Indian national genebank to identify new sources of resistance to rust and spot blotch diseases. PLoS One 11:e0167702. doi: 10.1371/journal.pone.0167702
Kumar, S., Röder, M. S., Tripathi, S. B., Kumar, S., Chand, R., Joshi, A. K., et al. (2015). Mendelization and fine mapping of a bread wheat spot blotch disease resistance QTL. Mol. Breed. 35, 218.
Kumar, U., Joshi, A. K., Kumar, S., Chand, R., and Röder, M. S. (2009). Mapping of resistance to spot blotch disease caused by Bipolaris sorokiniana in spring wheat. Theor. Appl. Genet. 118, 783–792. doi: 10.1007/s00122-008-0938-5
Kumar, U., Joshi, A. K., Kumar, S., Chand, R., and Röder, M. S. (2010). Quantitative trait loci for resistance to spot blotch caused by Bipolaris sorokiniana in wheat (T. aestivum L.) lines ‘Ning 8201’ and ‘Chirya 3’. Mol. Breed. 26, 477–491. doi: 10.1007/s11032-009-9388-2
Kumar, U., Kumar, S., Prasad, R., Röder, M. S., Kumar, S., Chand, R., et al. (2019). Genetic gain on resistance to spot blotch of wheat by developing lines with near immunity. Crop Breed. Genet.Genom. 1:e190017. doi: 10.20900/cbgg20190017
Li, H., Vikram, P., Singh, R. P., Kilian, A., Carling, J., Song, J., et al. (2015). A high density GBS map of bread wheat and its application for dissecting complex disease resistance traits. BMC Genomics 16:216. doi: 10.1186/s12864-015-1424-5
Lillemo, M., Joshi, A. K., Prasad, R., Chand, R., and Singh, R. P. (2013). QTL for spot blotch resistance in bread wheat line Saar co-locate to the biotrophic disease resistance loci Lr34 and Lr46. Theor. Appl. Genet. 126, 711–719. doi: 10.1007/s00122-012-2012-6
Lu, P., Liang, Y., Li, D., Wang, Z., Li, W., Wang, G., et al. (2016). Fine genetic mapping of spot blotch resistance gene Sb3 in wheat (Triticum aestivum). Theor. Appl. Genet. 129, 577–589. doi: 10.1007/s00122-015-2649-z
Meng, L., Li, H., Zhang, L., and Wang, J. (2015). QTL Ici mapping: integrated software for genetic linkage map construction and quantitative trait locus mapping in bi-parental populations. Crop J. 3, 269–283. doi: 10.1016/j.cj.2015.01.001
Navathe, S., Yadav, P. S., Chand, R., Mishra, V. K., Vasistha, N. K., Meher, P. K., et al. (2019). ToxA-Tsn1 interaction for spot blotch susceptibility in Indian wheat: an example of inverse gene-for-gene relationship. Plant Dis. 104, 71–81. doi: 10.1094/pdis-05-19-1066-re
Rosyara, U. R., Subedi, S., Duveiller, E., and Sharma, R. C. (2010). The effect of spot blotch and heat stress on variation of canopy temperature depression, chlorophyll fluorescence and chlorophyll content of hexaploid wheat genotypes. Euphytica 174, 377–390. doi: 10.1007/s10681-010-0136-9
Saari, E. E., and Prescott, J. M. (1975). A scale for appraising the foliar intensity of wheat disease. Plant Dis. Rep. 59, 377–380.
Sharma, R. C., Duveiller, E., Ahmed, F., Arun, B., Bhandari, D., Bhatta, M. R., et al. (2004). Helminthosporium leaf blight resistance and agronomic performance of wheat genotypes across warm regions of South Asia. Plant Breed. 123, 520–524. doi: 10.1111/j.1439-0523.2004.01006.x
Sharma, R. C., Duveiller, E., and Jacquemin, J. M. (2007a). Microsatellite markers associated with spot blotch resistance in spring wheat. J. Phytopathol. 155, 316–319. doi: 10.1111/j.1439-0434.2007.01238.x
Sharma, R. C., Duveiller, E., and Ortiz-Ferrara, G. (2007b). Progress and challenge towards reducing wheat spot blotch threat in the Eastern Gangetic Plains of South Asia: is climate change already taking its toll? Field Crop Res. 103, 109–118. doi: 10.1016/j.fcr.2007.05.004
Siddique, A. B., Hossain, M. H., Duveiller, E., and Sharma, R. C. (2006). Progress in wheat resistance to spot blotch in Bangladesh. J. Phytopathol. 154, 16–22. doi: 10.1111/j.1439-0434.2005.01049.x
Singh, P. K., He, X., Sansaloni, C. P., Juliana, P., Dreisigacker, S., Duveiller, E., et al. (2018). Resistance to spot blotch in two mapping populations of common wheat is controlled by multiple QTL of minor effects. Int. J. Mol. Sci. 19:4054. doi: 10.3390/ijms19124054
Singh, P. K., Zhang, Y., He, X., Singh, R. P., Chand, R., Mishra, V. K., et al. (2015). Development and characterization of the 4th CSISA-spot blotch nursery of bread wheat. Eur. J. Plant Pathol. 143, 595–605. doi: 10.1007/s10658-015-0712-x
Singh, V., Singh, G., Chaudhury, A., Ojha, A., Tyagi, B. S., Chowdhary, A. K., et al. (2016). Phenotyping at hot spots and tagging of QTLs conferring spot blotch resistance in bread wheat. Mol. Biol. Rep. 43, 1293–1303. doi: 10.1007/s11033-016-4066-z
Veldboom, L. R., and Lee, M. (1996). Genetic mapping of quantitative trait loci in maize in stress and non-stress environments: I. Grain yield and yield components. Crop Sci. 36, 1310–1319. doi: 10.2135/cropsci1996.0011183x003600050040x
Voorrips, R. E. (2002). MapChart: software for the graphical presentation of linkage maps and QTLs. J. Hered. 93, 77–78. doi: 10.1093/jhered/93.1.77
Wu, L., He, X., Lozano, N., Zhang, X., and Singh, P. K. (2021). ToxA, a significant virulence factor involved in wheat spot blotch disease, exists in the Mexican population of Bipolaris sorokiniana. Trop. Plant Pathol. doi: 10.1007/s40858-020-00391-4
Zhang, P., Guo, G., Wu, Q., Chen, Y., Xie, J., Lu, P., et al. (2020). Identification and fine mapping of spot blotch (Bipolaris sorokiniana) resistance gene Sb4 in wheat. Theor. Appl. Genet. 133, 2451–2459. doi: 10.1007/s00122-020-03610-3
Keywords: Bipolaris sorokiniana, SNPs, bi-parental mapping, DArTSeq, wheat QTLs for SB resistance
Citation: Roy C, Gahtyari NC, He X, Mishra VK, Chand R, Joshi AK and Singh PK (2021) Dissecting Quantitative Trait Loci for Spot Blotch Resistance in South Asia Using Two Wheat Recombinant Inbred Line Populations. Front. Plant Sci. 12:641324. doi: 10.3389/fpls.2021.641324
Received: 14 December 2020; Accepted: 26 January 2021;
Published: 04 March 2021.
Edited by:
Anna Maria Mastrangelo, Research Centre for Cereal and Industrial Crops, Council for Agricultural and Economics Research (CREA), ItalyReviewed by:
Bernardo Ordas, Consejo Superior de Investigaciones Científicas (CSIC), SpainWeiya Xue, Pennsylvania State University (PSU), United States
Copyright © 2021 Roy, Gahtyari, He, Mishra, Chand, Joshi and Singh. This is an open-access article distributed under the terms of the Creative Commons Attribution License (CC BY). The use, distribution or reproduction in other forums is permitted, provided the original author(s) and the copyright owner(s) are credited and that the original publication in this journal is cited, in accordance with accepted academic practice. No use, distribution or reproduction is permitted which does not comply with these terms.
*Correspondence: Pawan K. Singh, cGsuc2luZ2hAY2dpYXIub3Jn