 Nasreen Bano
 Shafquat Fakhrah1
 Sumit Kumar Bag
- 1Council of Scientific & Industrial Research-National Botanical Research Institute (CSIR-NBRI), Lucknow, India
- 2Academy of Scientific and Innovative Research (AcSIR), Ghaziabad, India
Tubby-like proteins (TLPs) possess a highly conserved closed β barrel tubby domain at C-terminal and N-terminal F-box. The role of TLP gene family members has been widely discussed in numerous organisms; however, the detailed genome-wide study of this gene family in Gossypium species has not been reported till date. Here, we systematically identified 105 TLP gene family members in cotton (Gossypium arboreum, Gossypium raimondii, Gossypium hirsutum, and Gossypium barbadense) genomes and classified them into eight phylogenetic groups. Cotton TLP12 gene family members clustered into two groups, 4 and 8. They experienced higher evolutionary pressure in comparison to others, indicating the faster evolution in both diploid as well as in tetraploid cotton. Cotton TLP gene family members expanded mainly due to segmental duplication, while only one pair of tandem duplication was found in cotton TLPs paralogous gene pairs. Subsequent qRT-PCR validation of seven putative key candidate genes of GhTLPs indicated that GhTLP11A and GhTLP12A.1 genes were highly sensitive to salt and drought stress. The co-expression network, pathways, and cis-regulatory elements of GhTLP11A and GhTLP12A.1 genes confirmed their functional importance in salt and drought stress responses. This study proposes the significance of GhTLP11A and GhTLP12A.1 genes in exerting control over salt and drought stress responses in G. hirsutum and also provides a reference for future research, elaborating the biological roles of G. hirsutum TLPs in both stress responses.
Introduction
Tubby-like proteins are a family of bipartite transcription factors that were first studied in animals (Boggon et al., 1999; Santagata et al., 2001; Carroll et al., 2004) but have subsequently been identified from single-celled to multicellular organisms (Liu, 2008). Tubby-like proteins (TLPs) are characterized by the presence of the conserved C-terminal tubby domain, comprising of 12 anti-parallel closed β-barrel strands with a central hydrophobic α-helix (Boggon et al., 1999). In animals, TLPs are present in fewer numbers (ranging up to five) but have been ascribed to a wide range of cellular functions, including involvement in neuronal functions and development (Kleyn et al., 1996). In contrast to animals, the TLP family in plants is much larger with more than 10 members. Moreover, unlike animal TLPs, which possess a variable N-terminal region, plant TLP proteins possess a conserved N-terminal F-box domain besides the C-terminal tubby domain (Noben-Trauth et al., 1996; Gagne et al., 2002; Lai et al., 2004; Xu et al., 2016). F-box-comprising proteins are involved in the ubiquitin-mediated degradation of proteins (Kile et al., 2002), suggesting a role for TLPs in such processes.
In plants, tubby-like proteins have been studied in some dicot and monocots, such as Arabidopsis thaliana, poplar, rice (Yang Z. et al., 2008), apple (Xu et al., 2016), and maize (Chen et al., 2016). In A. thaliana (At), 11 TLP genes have been identified while 14, 15, and 10 genes have been identified in rice, maize, and apple (Yang Z. et al., 2008; Chen et al., 2016; Xu et al., 2016). Studies of the TLP families in these plants reveal expression in different tissues and in response to different hormone treatments or under abiotic stress conditions (Lai et al., 2004; Liu, 2008; Xu et al., 2016). In Arabidopsis, AtTLP3, and AtTLP9 were found to function redundantly in response to abscisic acid (ABA) and osmotic stress treatments (Lai et al., 2004), while AtTLP9 was also demonstrated to respond in drought and salt stress (Lai et al., 2004; Bao et al., 2014). In apple, several TLP genes were upregulated in response to abiotic stress treatments, suggesting an important role for TLP genes in stress responses (Xu et al., 2016). In Cicer arietinum, CaTLP1 was expressed in response to dehydration stress, and its expression in tobacco led to enhanced tolerance to drought, oxidative, and salt stress (Wardhan et al., 2012). Collectively, these studies suggest that TLPs might have a significant function in the stress response of diverse plant species (Wang et al., 2018). However, the role of plants TLPs and their mode of action remain largely unknown (Zhang et al., 2020).
Cotton (Gossypium spp.) is the most important natural fiber producing crop worldwide (Yang et al., 2020a). A lot of diversity exists in the Gossypium genus that includes six tetraploid species (2n = 52) and 45 diploids (2n = 26) (Hawkins et al., 2006; Grover et al., 2015). Interspecific hybridization events among the G. herbaceum (A1) or G. arboreum (A2) (A-genome ancestral African species) and G. raimondii or G. gossypioides (D6) (D-genome native species) have resulted in allotetraploid G. hirsutum (upland cotton) and G. barbadense (Senchina et al., 2003; Zhu and Li, 2013), which are possibly the oldest main allopolyploid crops (Paterson et al., 2012; Chalhoub et al., 2014; Marcussen et al., 2014). Diversity within the Gossypium species provides a perfect model for examining the evolution and polyploid domestication (Yang et al., 2020a) and has been facilitated further with the completion of the whole genome sequences of G. raimondii, G. arboreum, G. barbadense, and G. hirsutum in the last few years (Wang K. B. et al., 2012; Li et al., 2014; Liu X. et al., 2015; Zhang et al., 2015). The large evolutionary diversity in cotton allows it to adapt to several different types of regions with differing environmental conditions, although the molecular basis of this adaptation is not yet well-understood.
We are interested in the evolution of the cotton TLP gene family and their possible roles in abiotic stress responses. So far, only a single member of the family GhTULP34 has been characterized (Li et al., 2020). In this study, we have carried out comprehensive genomic exploration of TLP protein family in G. raimondii, G. arboreum, G. barbadense, and G. hirsutum and studied the expression profiles of G. hirsutum TLPs (GhTLPs) in salt and drought stress responses. The aim of this study was to provide a comprehensive understanding of cotton TLP genes for future breeding programs for the improvement of plant quality, production, and response to abiotic stresses.
Materials and Methods
Identification of the TLP Gene Family in Gossypium Species
The protein, cDNA, gene annotation, and genome files (gff) of G. arboreum (BGI_A2 v1), G. raimondii (JGI v2), G. barbadense (HAU v2), and G. hirsutum (HAU v1) were retrieved from the CottonGen resources (Yu et al., 2014) while the protein sequence of A. thaliana was procured from the TAIR database (Lamesch et al., 2012). The Hidden Markov Model (HMM) profiles of the TLP domain (PF01167) were taken from the Pfam database (El-Gebali et al., 2019). The four cotton genomes were employed as queries, and the Pfam database was used as a reference to identify the TLP protein in the cotton dataset, using the HMMER search program (http://hmmer.wustl.edu/; Eddy, 2011). The identified TLP genes were further confirmed by BLASTP search and NCBI Batch-CD search (Lu et al., 2020).
Physiochemical Properties and Characterization of Cotton TLP Genes
The physiochemical properties, such as charge, molecular weight (Da), grand average of hydropathy (GRAVY), instability index, isoelectric points (pI) of G. arboreum (Ga), G. raimondii (Gr), G. barbadense (Gb), and G. hirsutum (Gh) TLPs, were determined through the ProtParam tool in the ExPASy web server (Gasteiger et al., 2003). The subcellular localization of cotton TLP proteins was predicted by using the software CELLO v.2.5 (Yu et al., 2006).
Analysis of the Encoded Protein Motif, Gene Structure, and miRNA Target Sites of Cotton TLP Proteins
The conserved protein motifs of cotton TLP genes were identified through the MEME (Multiple Em for Motif Elicitation) version 5.0.1 (Bailey et al., 2009) by employing the full-length proteins encoded by TLP genes in cotton. The exon-intron structure analysis was carried out with Gene Structure Display Server 2.0 (Guo et al., 2007), using the genomic and coding sequences of the identified cotton TLPs. To decipher the miRNA target sites in the cotton TLP transcripts, the complete sequences of all known and reported miRNAs of the four cotton species were fetched from the miRBase database (http://www.mirbase.org/; Kozomara et al., 2019). miRNA target site prediction analysis was performed through a plant small RNA target analysis server (psRNATarget 2017 release) (Dai et al., 2018), using the 376 cotton miRNA sequences.
Multiple Sequence Alignments (MSA) and Phylogenetic Analysis
To identify conserved regions of predicted cotton TLP proteins, multiple sequence alignments (MSA) were performed with the ClustalX2.1 program (Larkin et al., 2007), using default criteria. Phylogenetic tree construction was carried out through MEGA7 software (Kumar et al., 2016), with the maximum likelihood (ML) method, using the 1,000 bootstrap and the Jones-Taylor-Thornton (JTT) model. Visualization of the tree was carried out through Interactive Tree Of Life (iTOL; Letunic and Bork, 2019).
Gene Duplication Event, Chromosomal Distribution, and Synteny Analysis
To know the evolutionary mechanism of TLP gene in Gossypium, the paralogous TLP genes were identified in G. arboreum, G. raimondii, G. barbadense, and G. hirsutum, using a reciprocal blast with e-value 10−5. Paralogous genes are described as similarity of the aligned regions >70% and shared aligned region covering >70% of the gene length (Yang S. et al., 2008). The Ka/Ks ratio of orthologous and paralogous sequences was identified through the PAL2NAL program (Suyama et al., 2006), which was further used to compute the approximate date of duplication and divergence events with the formula T = Ks/2λ, assuming the clocklike rate (λ) of 1.5 synonymous substitutions per 10−8 years for cotton (Blanc and Wolfe, 2004; Tang et al., 2016). Moreover, the Ka/Ks ratio was also employed to show the selection pressure for the duplicated TLP genes. A Ka/Ks = 1, >1, and <1 demonstrate neutral, positive, and negative (purifying selection) evolution, respectively. Orthologous of TLP genes of cotton with A. thaliana and Theobroma cacao were identified via a reciprocal blast with an e-value 10−5. As per the result of the reciprocal blast, duplication events, and syntenic blocks of cotton TLP genes were detected through McScanX, and visualization of orthologous TLP genes between cotton (G. raimondii, G. arboreum, G. barbadense, and G. hirsutum) and two other species (A. thaliana and T. cacao) was performed through CIRCOS (Krzywinski et al., 2009; Wang Y. P. et al., 2012). The chromosomal location of all cotton TLP genes was found through the BLASTN search program on TLPs CDS sequences against the CottonGen (https://www.cottongen.org/) database. Total cotton TLP genes were mapped on the chromosome through Mapinspect software (http://mapinspect.software.informer.com/).
Expression Profile of Cotton TLP Gene Family Members Under Salt and Drought Stress Conditions
To gain insight into the expression profile of cotton TLP gene family members under salt and drought stress conditions, the Illumina RNA-Seq data of G. hirsutum (accession number: PRJNA532694) were retrieved from the NCBI database. The poor-quality reads were filtered by Fastx-toolkit (Schmieder and Edwards, 2011) and mapped to the G. hirsutum genome, using the TopHat2 (Kim et al., 2013). The estimation of transcript abundance was carried out with fragments per kilobase per million (FPKM) through Cufflinks software (Trapnell et al., 2012). The hierarchical clustered heatmap generation and visualization were done in the R program, using the pheatmap package.
RNA Isolation, cDNA Preparation, and Quantitative Real-Time PCR (qRT-PCR) Validation
The selected putative TLP genes were validated in 2-month-old drought and salt-stressed plants of G. hirsutum, grown in the field under normal photoperiodic conditions. Plants were grown in triplicate, and a single treatment of 300-mM NaCl was used to stimulate salt stress (Wei et al., 2017) and 20% PEG8000 solution to decrease the osmotic potential of the root, inducing drought stress (Shafiq et al., 2015). The non-treated plants were taken as control. Leaf tissues were collected at 6, 12, 24, 48, and 72 h after treatment, RNA isolated as per the protocol (Sigma USA), followed by cDNA (1 μg/μl) synthesis with the verso cDNA synthesis kit (Thermo scientific) as per the provided protocol. Expression of seven genes was checked by qRT-PCR fluorescent quantitative detection system (HiMedia Insta Q 48 M4), using fast the SYBERTM green master mix (Applied Biosystem) with primers designed with the help of primer express 3.0. Ubiquitin was taken as the internal control. The reaction conditions of qRT-PCR were 95°C for 10 min, followed by cycling for 40 cycles of denaturation at 95°C for 10 s, annealing at 56°C for 15 s and extension at 72°C for 30 s. Relative expression of the employed genes was calculated with mean ± SD of biological triplicate samples by the 2–ΔΔCt method (Livak and Schmittgen, 2001).
Co-expression Network and Metabolic Pathway Analysis of Negatively and Positively Co-expressed Genes With GhTLP11A and GhTLP12A.1
The co-expression network of the GhTLP11A and GhTLP12A.1 genes in salt and drought stress conditions was constituted by the FPKM values with the “expression correlation networks” module in Cytoscape version 3.8.0 (Smoot et al., 2011). The module calculated positive Pearson correlations (r ≥ 0.95) and negative correlations (r ≤ −0.95), with interacting members of the network. Network visualization and co-expression of genes were shown in Cytoscape by applying the force-directed layout. The important metabolic pathways and functional categories of positively and negatively co-expressed genes (PCoEGs and NCoEGs) with GhTLP11A and GhTLP12A.1 were estimated, using the MapMan software 3.5.1 version (Thimm et al., 2004). The average statistical test accompanied by the Benjamini Hochberg (multiple correction tests) was employed to know the functional categories.
Identification of cis-Regulatory Elements of GhTLP Genes and Homology Modeling of the Highly Expressed GhTLPs
The 2-Kb sequences upstream of GhTLP genes was analyzed for cis-regulatory elements by using the PlantCARE database (Lescot et al., 2002) by the “Signal Scan Search” program. The three-dimensional structure of GhTLPs was obtained through homology modeling, using the Phyre2 (Kelley et al., 2015) server. Structure visualization of GhTLPs was carried out with Chimera 1.11.1 version (Pettersen et al., 2004).
Statistical Analysis
The statistical analysis of qRT-PCR was carried out, using GraphPad Prism version 8.4.3 software, with two-tailed Student's T-tests in triplicate sample repeats.
Results
Genome-Wide Identification of TLP Genes in Gossypium Species
The protein sequences of G. arboreum, G. raimondii, G. hirsutum, and G. barbadense were utilized to identify cotton TLP genes. The identified TLP genes were confirmed through conserved domain searches. A total of 105 TLPs, i.e., 19 GaTLPs (G. arboreum), 18 GrTLPs (G. raimondii), 33 GhTLPs (G. hirsutum), and 35 GbTLPs (G. barabadense) were determined (Table 1). The length of cotton TLP proteins varied from 68 to 425 amino acid residues (aa) in G. arboreum, 320 to 519 aa in G. raimondii, 206 to 514 aa in G. hirsutum, and 206 to 494 aa in G. barabadense. The theoretical isoelectric point (pI) ranged from 5.1 to 9.7, 9 to 9.3, 8.3 to 9.8, and 7.6 to 9.8; the molecular weight ranged approximately from 8 to 48 kDa, 36 to 58 kDa, 23 to 58 kDa, and 23 to 55 kDa, and the number of introns ranged from 0 to 7, 4 to 8, 2 to 8, and 0 to 8 in G. arboreum, G. raimondii, G. barabadense, and G. hirsutum, respectively. Most of the identified cotton TLP proteins were predicted to be nuclear localized, and others were likely localized in extracellular space, mitochondrion, and on plasma membrane. For the annotation of 105 identified cotton TLP genes, the A. thaliana nomenclature system was pursued with numbers representing the highest sequence similarity with the corresponding AtTLP orthologous. Accordingly, the 19 GaTLPs were named as GaTLP2-GaTLP12 (GaTLP2.1, 2.2, 2.3, 2.4, 5.1, 5.2, 5.3, 6.1, 6.2, 6.3, 7.1, 7.2, 8, 11, 12.1, 12.2, 12.3, 12.4, and 12.5), GrTLPs were classified as GrTLP2-GrTLP12 (GrTLP2.1, 2.2, 2.3, 5.1, 5.2, 5.3, 6.1, 6.2, 6.3, 7.1, 7.2, 7.3, 8, 11, 12.1, 12.2, 12.3, and 12.4). Similarly, GhTLPs and GbTLPs were named GhTLP2-GhTLP12A/D and GbTLP2-GbTLP12A/D (A: At subgenome and D: Dt subgenome). The reciprocal blast demonstrated that cotton TLP genes showed greater homology with AtTLP2, AtTLP5, AtTLP6, AtTLP7, and AtTLP8 as compared with AtTLP1, AtTLP3, AtTLP4, AtTLP9, AtTLP10, and AtTLP11, respectively (Supplementary Table 1).
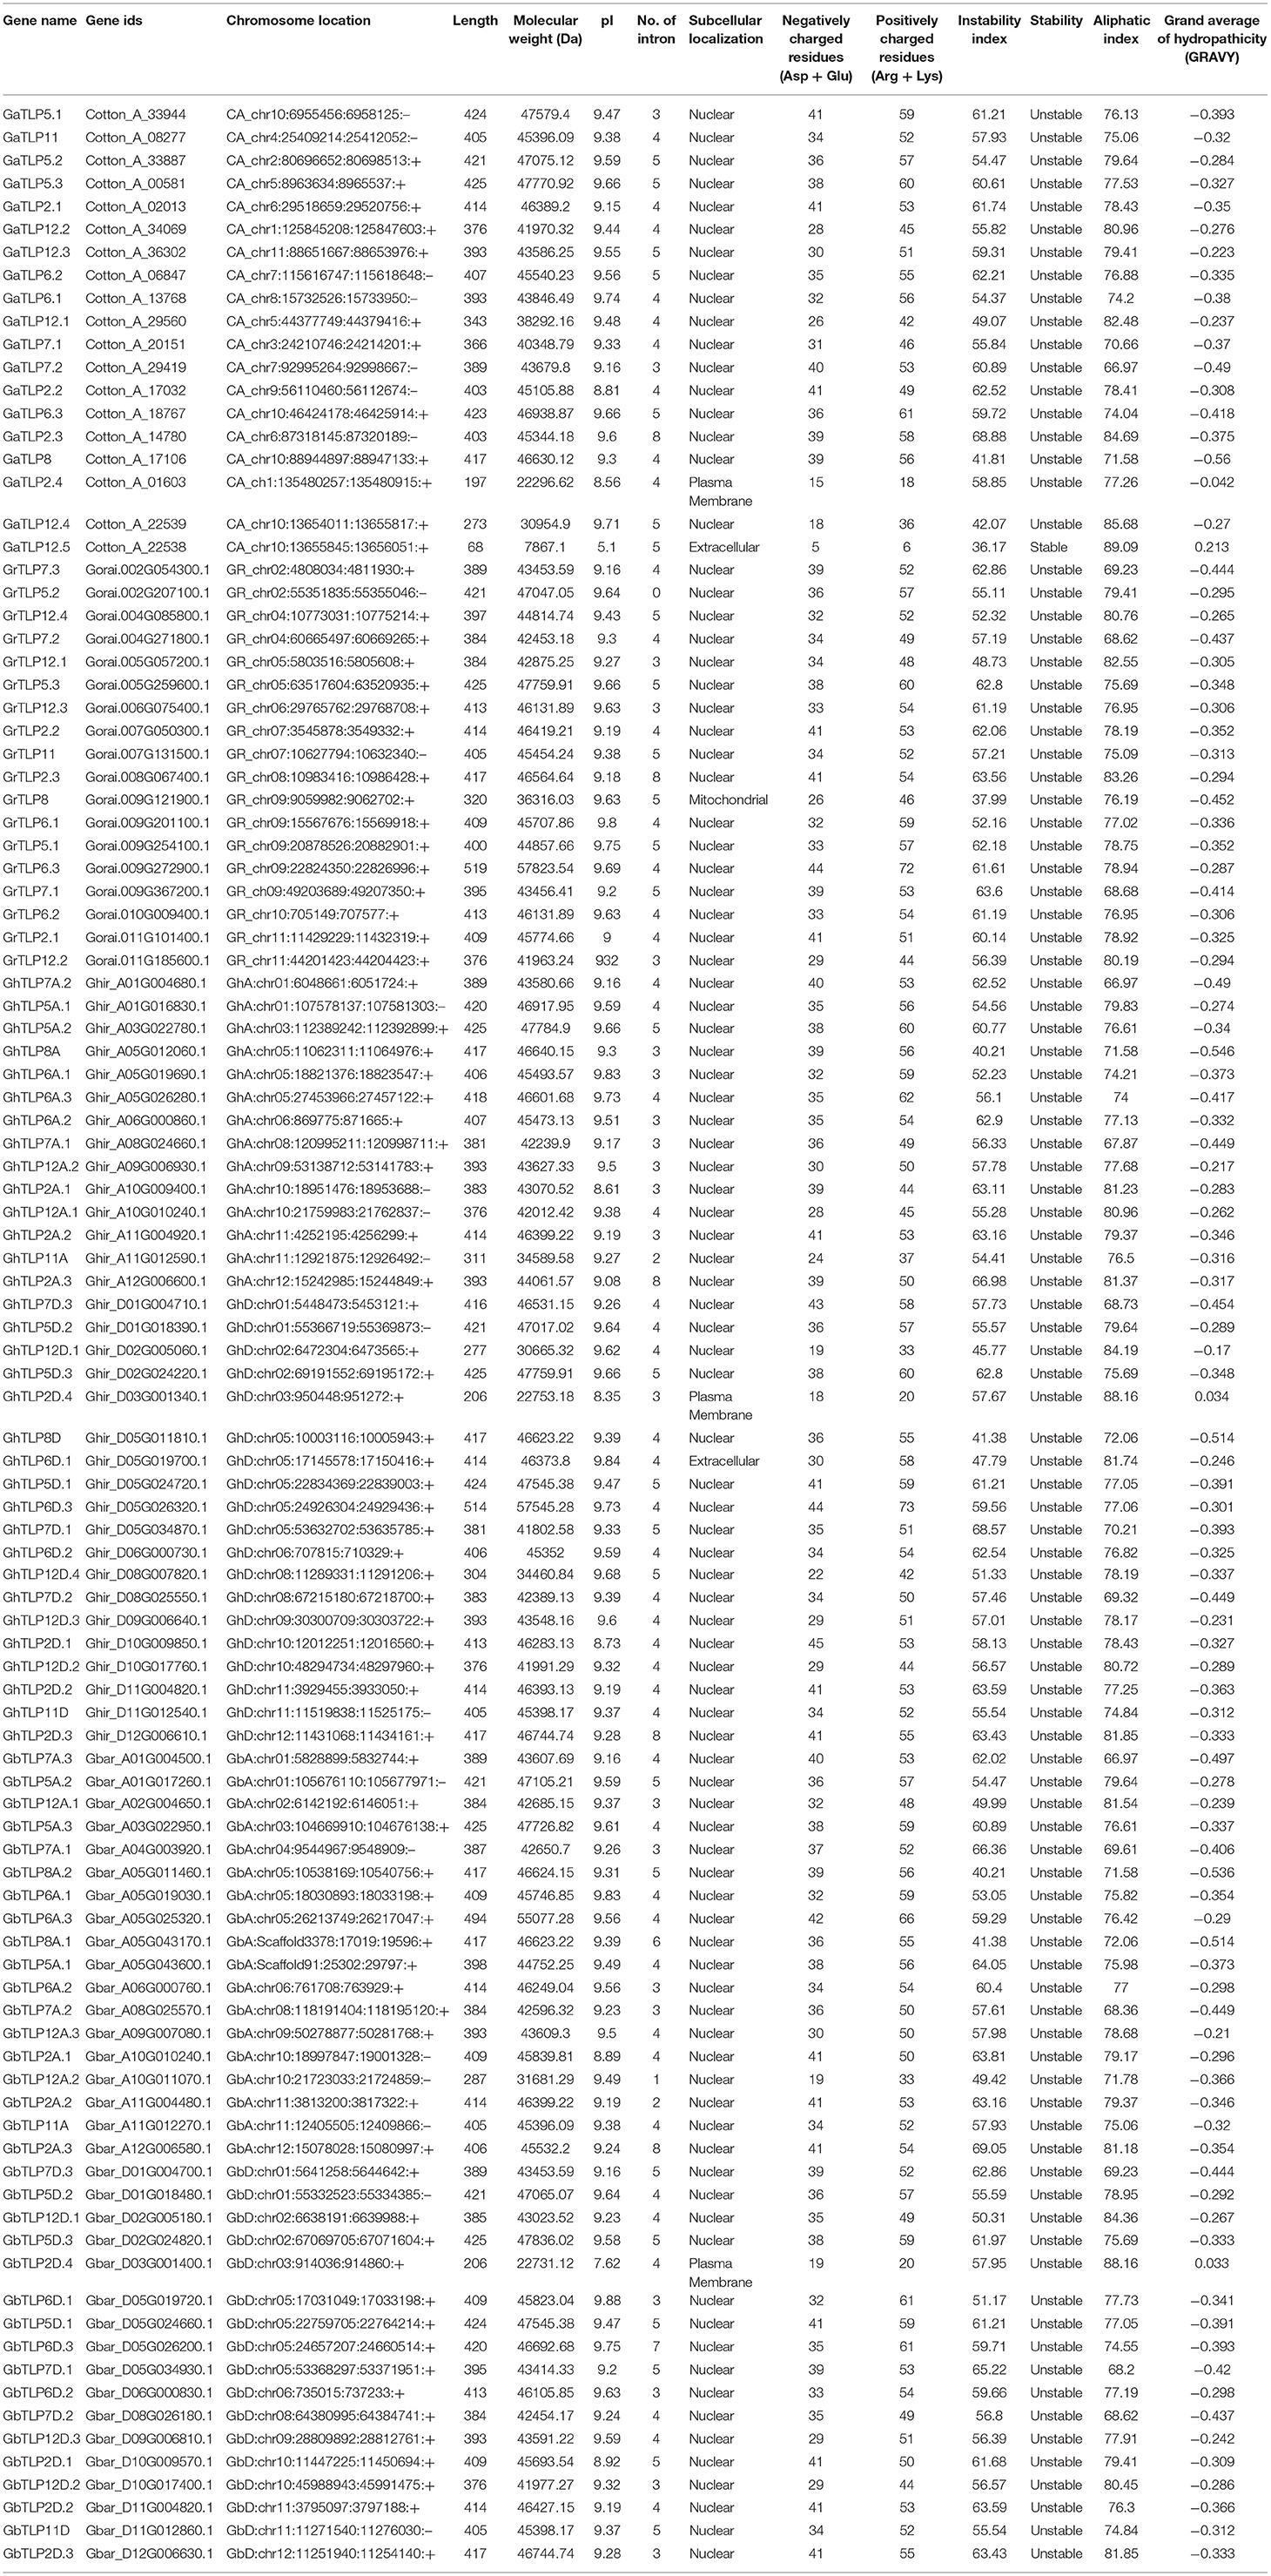
Table 1. Characteristics of TLP genes in cotton.
Domain Structure Analysis of TLP Protein Family Members in Cotton
All the cotton TLP proteins were predicted to contain the tubby domain at the C-terminal end. With the exception of some (GaTLP2.4, GaTLP7.1, GaTLP7.2, GaTLP8, GaTLP12.1, GaTLP12.4, GaTLP12.5, GrTLP7.1, GrTLP7.2, GrTLP7.3, GrTLP8, GhTLP8A, GhTLP2D.1, GhTLP2D.4, GhTLP2A.1, GhTLP7A.1, GhTLP7A.2, GhTLP7D.1, GhTLP7D.2, GhTLP11A, GhTLP12A.1, GhTLP12D.1, GhTLP12D.2, GhTLP12D.4, GbTLP2D.4, GbTLP7A.1, GbTLP7A.2, GbTLP7A.3, GbTLP7D.1, GbTLP7D.2, GbTLP7D.3, GbTLP8A.1, GbTLP8A.2, GhTLP8D, GbTLP12A.1, GbTLP12A.2, and GbTLP12.1), the majority of the proteins encoded by the cotton TLP genes also possessed an F-box domain (Supplementary Figure 1). In A. thaliana, the TLP8 also has the tubby domain at the C-terminal side but lacked F-box at the N-terminal side (Lai et al., 2004). This finding showed that cotton TLP proteins comprised the same domain arrangements as reported earlier (Lai et al., 2004).
Multiple Sequence Alignment (MSA) and Evolutionary Analysis
The multiple sequence alignment (MSA) of all cotton TLP genes showed a highly conserved C-terminal tubby domain and F-box at the C-terminal (Supplementary Figure 2). To determine the evolutionary relationship between TLP proteins of cotton and A. thaliana, MSA of 105 identified cotton TLPs with 11 A. thaliana TLPs was carried out. Furthermore, a phylogenetic tree was constructed, using the maximum likelihood tree (ML) method. On the basis of phylogenetic relationships, cotton TLP genes were clustered into eight major groups (Groups 1–8), each containing 21, 18, 17, 17, 16, 6, 6, and 4 TLPs, respectively (Figure 1).
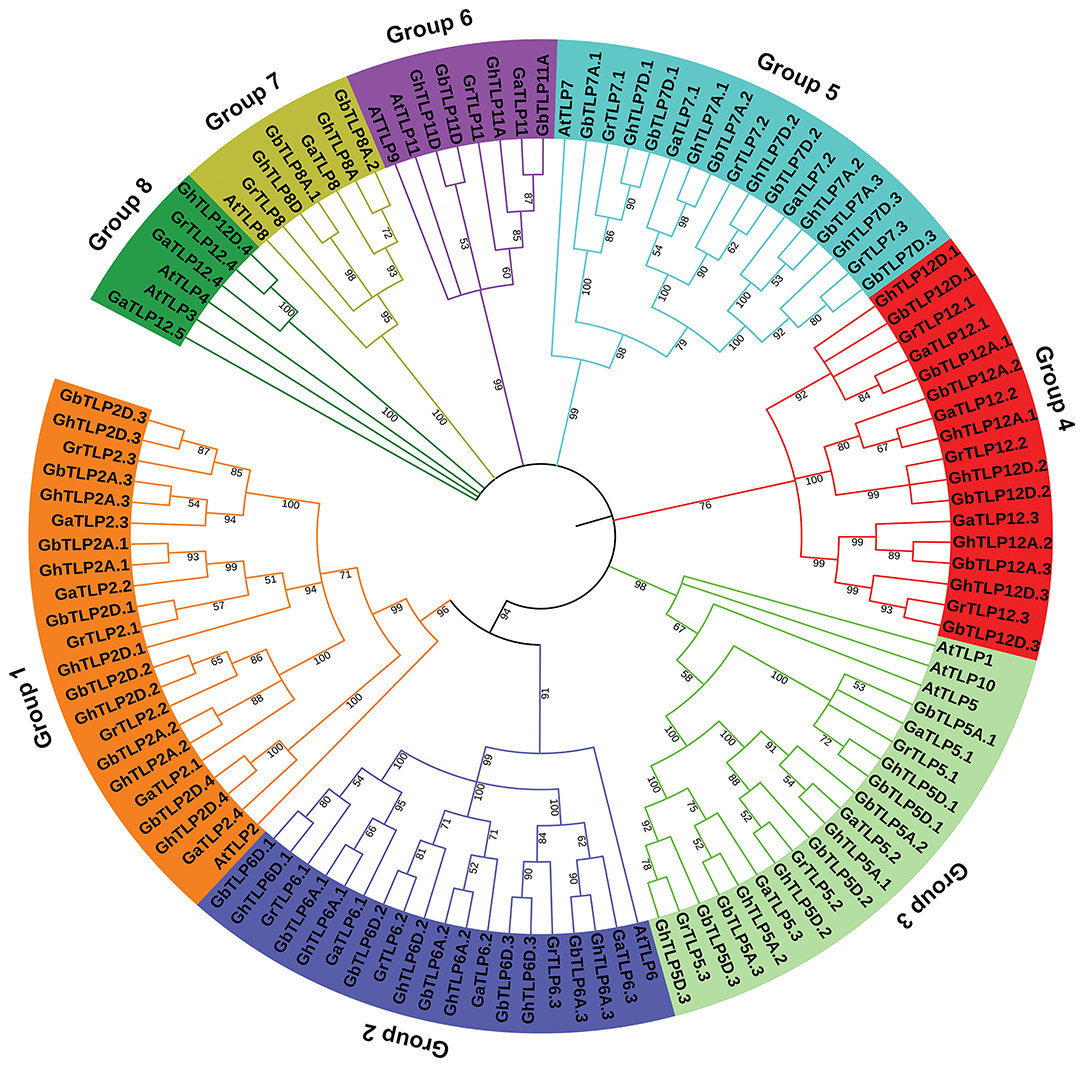
Figure 1. Phylogenetic relationship of Gossypium tubby-like proteins (TLPs) from A. thaliana. The phylogenetic ML tree was built, using the amino acid sequence with 1,000 bootstrap value with MEGA 7.0 software. At, A. thaliana; Ga, Gossypium arboretum; Gr, Gossypium raimondii; Gh, Gossypium hirsutum; Gb, Gossypium barbadense.
The majority of the cotton TLPs were found to be clustered with A. thaliana TLPs, the exception being groups 4 and 8 cotton TLPs (GaTLPs12, GrTLPs12, GhTLPs12A, GhTLPs12D, GbTLPs12A, and GbTLPs12D). To gain insight into the groups 4 and 8 TLPs, a phylogenetic tree of these TLPs with other eudicots (Ranunculaceae, Brassicaceae, Caricaceae, Cucurbitaceae, Rutaceae, Myrtaceae, Rosaceae, Fabaceae, Euphorbiaceae, Scrophulariaceae, Salicaceae, Solanaceae, Malvaceae, and Vitaceae) was generated. Also, synteny analysis of cotton TLPs with those from A. thaliana (Brassicaceae) and T. cacao (Malvaceae) was carried out. This revealed that groups 4 and 8 TLPs were greatly conserved among G. arboreum (A genome), G. raimondii (D genome), G. hirsutum (At and Dt sub-genomes), G. barbadense (At and Dt sub-genomes), and T. cacao genomes. The groups 4 and 8 cotton TLP genes were conserved among closely related species with Gossypium (Byng et al., 2016). On the other hand, no conserved homologs were found in Brassicaceae (Figure 2, Supplementary Figure 3, and Supplementary Table 2). The phylogenetic tree of groups 4 and 8 cotton TLP gene family members (GaTLPs12, GrTLPs12, GhTLPs12A, GhTLPs12D, GbTLPs12A, and GbTLPs12D) also revealed that groups 4 and 8 cotton TLP genes were not clustered with Brassicaceae family members (Supplementary Figure 3). This finding showed that, after the divergence from the common ancestor, the groups 4 and 8 cotton TLP homologs might have been evicted from the Brassicaceae family.
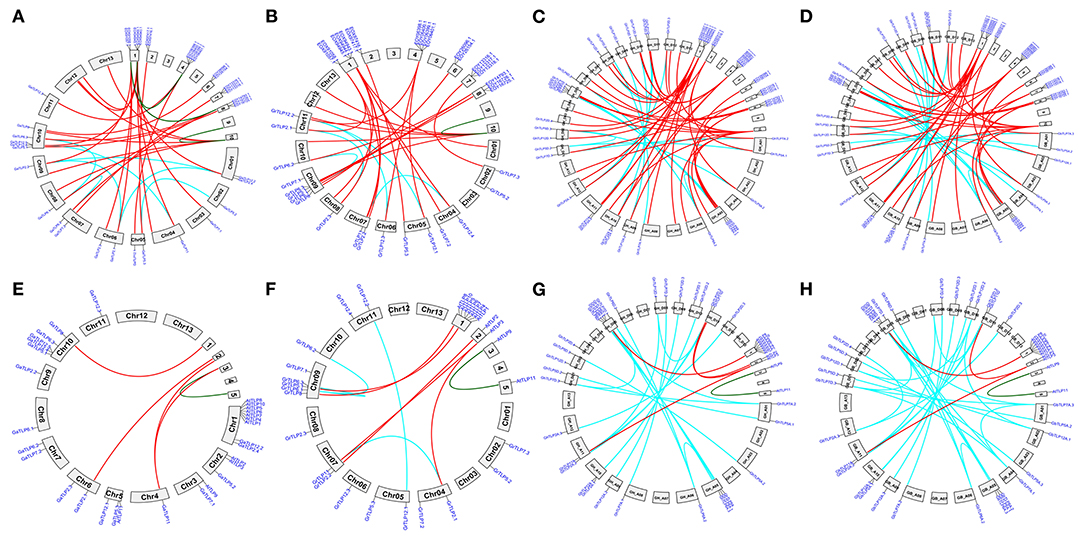
Figure 2. Synteny analysis of cotton TLP genes with T. cacao (Malvaceae) and A. thaliana (Brassicaceae) genomes. A syntenic representation of the identified TLP genes between (A) G. arboreum (Chr01 to Chr13) vs. T. cacao (B) G. raimondii (Chr01 to Chr13) vs. T. cacao (C) G. hirsutum (At1 to At13 and Dt1 to Dt13) vs. T. cacao (1–10) (D) G. barbadense (At1 to At13 and Dt1 to Dt13) vs. T. cacao (1–10) (E) G. arboreum (Chr01 to Chr13) vs. A. thaliana (F) G. raimondii (Chr01 to Chr13) vs. A. thaliana (G) G. hirsutum (At1 to At13 and Dt1 to Dt13) vs. A. thaliana (H) G. barbadense (At1 to At13 and Dt1 to Dt13) vs. A. thaliana chromosomes. Red lines indicate duplicated orthologous TLP genes, and cyan and green lines show the paralogous TLPs genes in G. hirsutum, G. raimondii, G. arboreum, T. cacao, and A. thaliana.
Phylogenetic Tree, Encoded Protein Motifs, and Gene Structure Study of Gossypium TLP Genes
The evolutionary associations among the Gossypium TLPs were deduced by building a separate phylogenetic tree, using the ML method with 1,000 bootstraps value. On the basis of the topology of the tree, paralogous nodes, organization of exon–intron, and conservation of motifs, the cotton TLP genes were categorized into seven groups with higher bootstrap value. The proteins in each group had a high identity (>70%) among orthologous members but differed considerably from the members of the other groups, suggesting a divergent evolution from a common ancestor or origin from gene duplication events (Figure 3A). To determine the consistency of the exon-intron pattern in the phylogenetic groups, a gene structure comparison of the cotton TLPs was carried out. Intron number varied from 3 to 8 (GaTLPs), 0 to 8 (GrTLPs), 2 to 8 (GhTLPs), and 1 to 8 (GbTLPs) (Figure 3B and Table 1). The majority of the cotton TLP genes within the same group showed a similar pattern of exon-intron distribution. To study the conserved motif organization in TLP proteins, the MEME tool was employed for the analysis followed by annotation through InterProScan. A total of 15 conserved motifs were identified in the cotton TLP proteins. Only seven of these, motifs 1–7 (with the exception of motif 3), were found to form parts of the tubby domains. Motif 3 was annotated as the F-box domain (Figure 3D and Supplementary Table 3). Motif 1 was found in all cotton TLP proteins, except GaTLP12.4, GhTLP12D.4, and GhTLP7D.1. The majority of the cotton TLPs with close evolutionary relatives had similar motif composition and were assumed to have a similar function (Figure 3C).
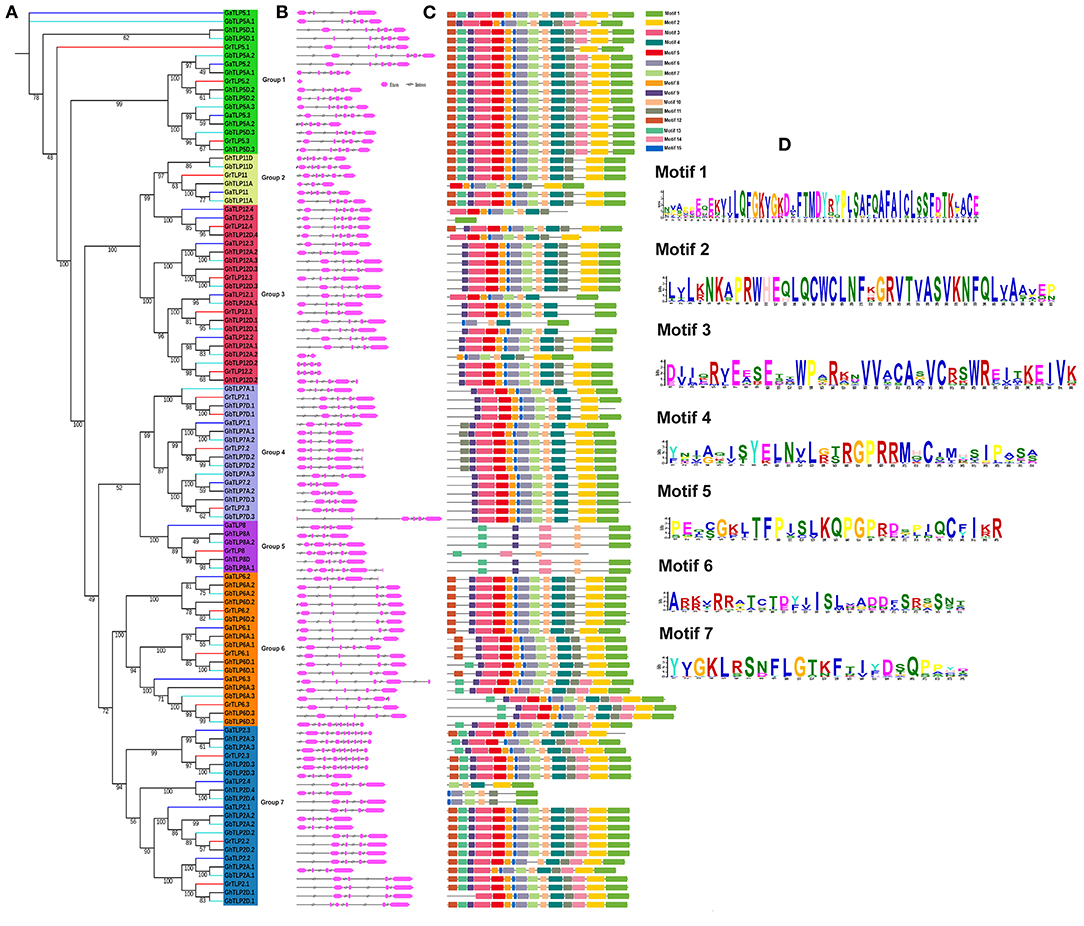
Figure 3. Phylogenetic tree, gene structure, and conserved protein motifs analysis of TLPs in G. arboreum, G. raimondii, G. hirsutum, and G. barbadense. (A) Phylogenetic tree of G. arboreum, G. raimondii, G. hirsutum, and G. barbadense TLPs built with the ML (maximum likelihood) method and using 1,000 bootstrap values. Different colors of lines denoted the different species of Gossypium (Blue, G. arboreum; Red, G. raimondii; Black, G. hirsutum; and cyan, G. barbadense). Groups 1–7 distributed in green, yellow, red, royal, violet, orange, and sky blue colors, respectively. (B) Showing the exon-intron organization of TLPs genes in Gossypium (Pink boxes, exon, and black lines, introns). (C) Identified conserved protein motifs in the Gossypium TLPs, and each motif is indicated with a specific color. (D) The logos are given for functionally annotated motifs only, where the heights of logo depict the degree of conservation of amino acid within the motif. The motifs order corresponds to their positions in protein sequence. Motif descriptions are given in Supplementary Table 3.
Chromosomal Location and Gene Duplication Events of Gossypium TLP Genes
To identify the chromosomal localization of GaTLP, GrTLP, GhTLP, and GbTLP genes in the cotton genome, the BLASTN search was performed. GaTLP genes were distributed on chromosomes 1–11 (Figure 4A), GrTLP genes were localized across chromosomes 2 and 4–11 (Figure 4B), GhTLP genes were located on At chromosomes 1, 3, 5, 6, 8–12 and on Dt chromosomes 1, 2, 3, 5, 6, 8–12 with 14 and 19 genes, respectively (Figures 4C,D), GbTLP genes were distributed on At chromosomes 1–6, 8–12, and Dt chromosomes 1, 2, 3, 5, 6, 8–12 with 16 and 17 genes, respectively (Figures 4E,F). Given the expansion of the number of cotton TLP genes, gene duplication events were next studied. High amino acid sequence similarities were detected among protein encoded by TLP genes, as five pairs of paralogous TLP genes were identified in diploid cotton (G. arboreum and G. raimondii) (Figures 4A,B), while seven pairs of the paralogous genes were determined in G. hirsutum (At and Dt sub-genomes) and 12 in G. barbadense (At and Dt sub-genomes) (Figures 4C–F). These paralogous TLP gene pairs existed in the same group, and most of them showed >70% sequence similarities between the proteins encoded by these TLP gene pairs. Except for the GaTLP2.1/GaTLP2.3 gene pair, which was tandemly arranged, all other paralogous gene pairs were placed on distinct chromosomes, providing evidence that the expansion of the cotton the TLP family was mainly due to segmental duplication, not tandem duplication. In G. arboreum, four segmental gene duplications (GaTLP5.2/5.3, GaTLP2.1/2.2, GaTLP2.2/2.3, and GaTLP5.1/5.3) and one tandem duplication (GaTLP2.1/2.3) were occurred from 15.17 to 50.85 MYA. While five segmental duplications (GrTLP5.2/5.3, GrTLP2.1/2.3, GrTLP2.2/2.3, GrTLP2.2/2.1, and GrTLP7.3/7.2) were found in G. raimondii from 11.95 to 18.88 MYA (Table 2). In G. hirsutum, seven segmental gene duplications (GhTLP5A.1/5A.2, GhTLP2A.2/2A.3, GhTLP7A.2/7A.1, GhTLP5D.2/5D.3, GhTLP5D.1/5D.3, GhTLP2D.1/2D.2, and GhTLP7D.3/7D.2) occurred in At and Dt subgenomes from 14.77 to 53.60 MYA and 12 segmental duplication (GbTLP8A.1/8A.2, GbTLP5A.2/5A.3, GbTLP2A.1/2A.3, GbTLP2A.1/2A.2, GbTLP2A.2/2A.3, GbTLP7A.2/7A.1, GbTLP5D.2/5D.3, GbTLP2D.1/2D.3, GbTLP2D.1/2D.2, GbTLP2D.2/2D.3, GbTLP7D.3/7D.2, and GbTLP5D.1/5D.3 occurred in At and Dt subgenomes of G. barbadense from 0.85 to 52.6 MYA (Table 2). Most of the paralogous gene pairs showed recent duplication events (13–20 MYA) (Li et al., 2014). The non-synonymous and synonymous substitution ratios (Ka/Ks ratios) for the duplicated Gossypium TLP gene pairs were consistently <1 (Table 2). Therefore, duplicated cotton TLP genes experienced intense purifying selection, which contributes to conserving their functions and reveals that not much diversion had taken place during the course of evolution (Gabaldon and Koonin, 2013). The orthologous gene pair, having <90% sequence identity in cDNA, and amino acid sequence were analyzed further for evolutionary studies (Supplementary Table 4). The selection pressure and the potential function of Gossypium TLPs were examined by computing the Ka, Ks, and Ka/Ks ratios among orthologous (A vs. D, At vs. A, Dt vs. D, At vs. At, and Dt vs. Dt) and within the homeologs (At vs. Dt). Interestingly, the Ka value of cotton orthologous TLP2 (GaTLP2/GrTLP2), TLP5 (GaTLP5/GrTLP5), TLP6 (GaTLP6/GrTLP6), TLP7 (GaTLP7/GrTLP7), and TLP12 (groups 4 and 8 TLPs) (GaTLP12/GrTLP12, GhTLP12A/GhTLP12D, and GbTLP12A/GbTLP12D) genes were greater in inter-genomes (A vs. D and At vs. Dt) in comparison to other orthologous TLP gene pairs, suggesting that these pairs experienced faster evolution. Subsequently, during the course of evolution, orthologous TLP gene pairs often retain their corresponding function in different species (Gabaldon and Koonin, 2013). A total of 153 out of 172 orthologous TLP gene pairs have a Ka/Ks ratio <1, and the rest 16 have Ka/Ks >1 in both diploid and allotetraploid species, indicating a greater number of the TLP orthologous genes pairs experienced purifying selection pressure, and some of them experienced Darwinian selection pressure (Figure 4G and Supplementary Table 5). The Ka/Ks values of TLP2, 5, 6, 7, 8, 11, and 12 were higher in A vs. D, At vs. Dt, and Dt vs. D. Therefore, these TLPs experienced greater evolutionary pressure in diploid as well as in allotetraploid cotton and might have evolved rapidly in D subgenome as compared with A subgenome.
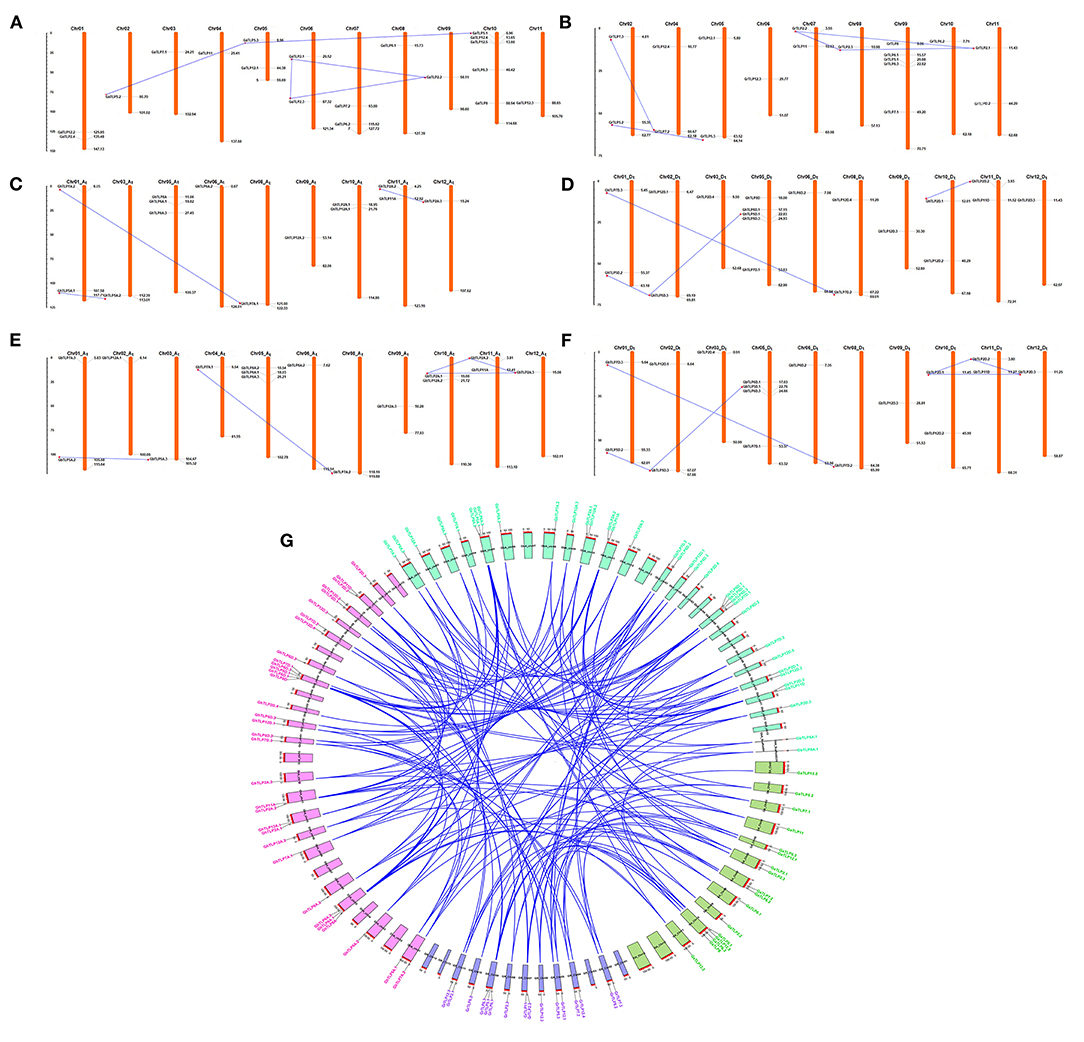
Figure 4. Chromosomal arrangement and paralogous gene duplication of TLP genes on the four genomes of Gossypium. A physical map of chromosomes demonstrates the position of TLP genes on A, D, and AD genomes, respectively. The paralogous TLP genes (segmental gene duplication) linked with blue lines. The locations of each TLP genes are represented through the horizontal gray lines. The numbers of chromosomes are showed at the top. (A,B) Represent the distribution of TLP genes in G. arboreum and G. raimondii genomes, (C,D) showed the arrangement of TLP genes in G. hirsutum genome, and (E,F) represented the TLP genes in G. barbadense genome, respectively. The scale is in mega bases (Mb). (G) The orthologous TLP duplicated genes pairs among four cotton genomes (G. arboreum, G. raimondii, G. hirsutum, and G. barbadense) were also shown with blue lines, and CIRCOS was used to visualize this plot. The gene name and the chromosome of G. arboreum, G. raimondii, G. hirsutum, and G. barbadense were shown with green, violet, pink, and cyan colors, respectively.
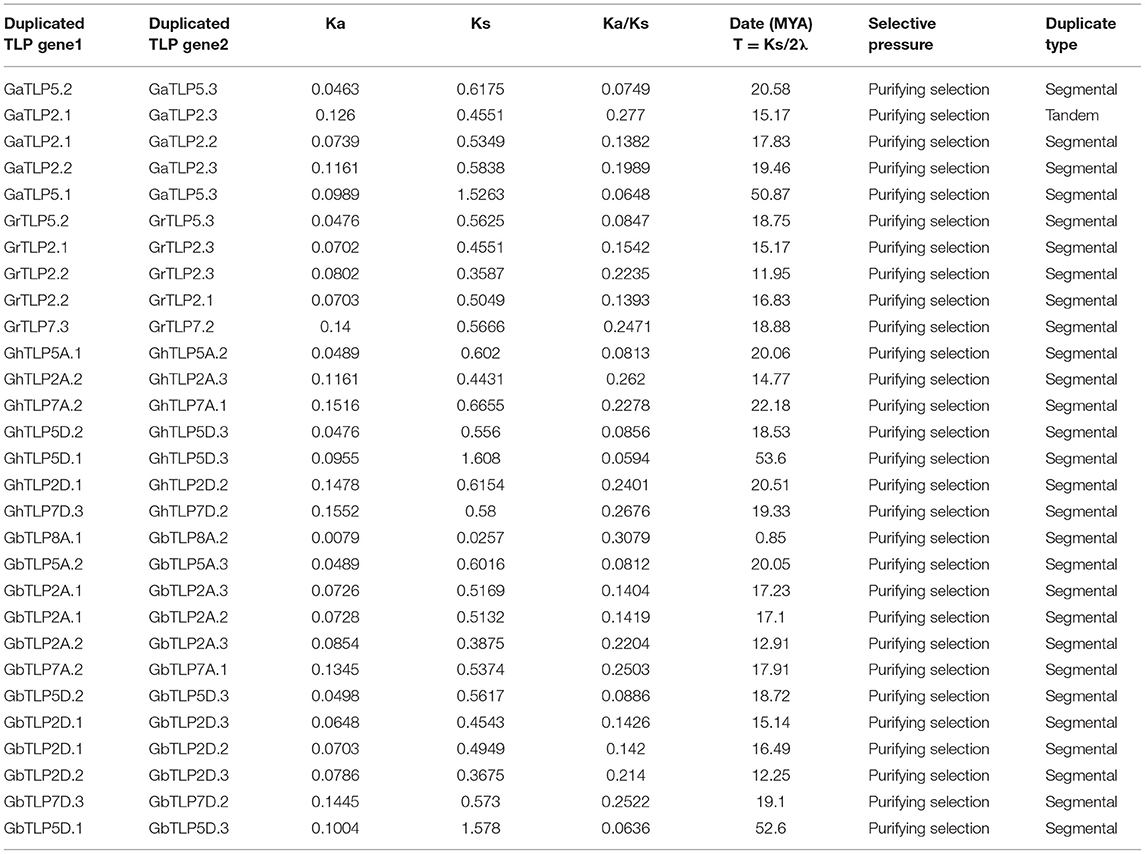
Table 2. The date of duplication and Ka/Ks ratios for duplicate TLP genes in G. arboreum, G. raimondii, G. barbadense, and G. hirsutum.
Effects of Salt and Drought Stress on the Expression Profiles of GhTLP Genes
It has been previously reported that TLP gene family members are expressed and regulated by several abiotic stresses (Lai et al., 2004; Wardhan et al., 2012; Bao et al., 2014). In view of these reports, we studied the involvement of cotton TLP genes in drought and salt stress conditions by analyzing transcriptomic data of leaf transcriptomes in response to drought and salt stress conditions. Thirty GhTLP genes exhibited differential expression, and twelve (GhTLP5A.2, GhTLP5D.2, GhTLP6A.3, GhTLP7D.2, GhTLP7D.3, GhTLP8A, GhTLP11A, GhTLP12A.1, GhTLP12.2, GhTLP12D.1, GhTLP12D.2, and GhTLP12D.3) showed significant higher expression during drought stress (Figure 5P) in transcriptome data. Furthermore, 17 GhTLP genes (GhTLP2D.2, GhTLP6A.1, GhTLP6D.3, GhTLP5A.1, GhTLP5A.2, GhTLP5D.2, GhTLP6A.3, GhTLP7A.2, GhTLP7D.3, GhTLP8A, GhTLP8D, GhTLP11A, GhTLP12A.1, GhTLP12A.2, GhTLP12D.1, GhTLP12D.2, and GhTLP12D.3) demonstrated higher expression in salt stress condition (Figure 5H). The studies show that the GhTLP gene family members respond to different abiotic stresses such as drought and salt and may have a role in regulating stress responses of cotton against salt and drought.
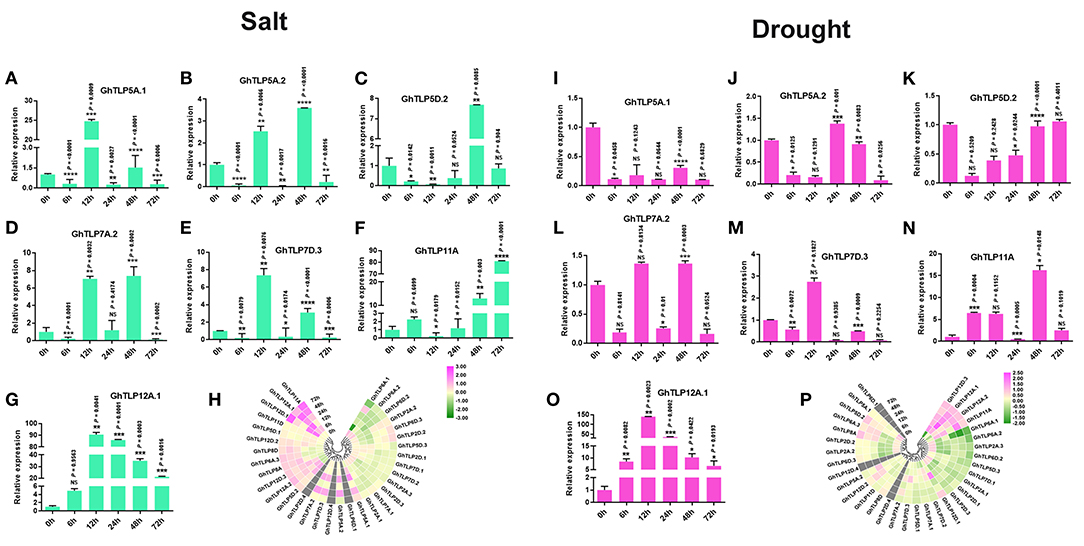
Figure 5. The expression pattern of the TLP gene family members in the G. hirsutum (A–G,I–O) qRT-PCR expression pattern of seven putative genes in normal (0 h), 6, 12, 24, 48, and 72 h of salt (300 MM) and drought (20% PEG solutions PEG8000) stress in cotton. Ubiquitin was used as the loading control. Three replicates were used for each experiment. The statistical analysis was performed, using two-tailed Student's T-tests. The data are plotted as means ± s.d. The error bars represent standard deviations. The asterisks indicate significant differences: *P < 0 0.1; **P < 0 0.01; ***P < 0 0.001; ****P < 0.0001. (H,P) Gene expression profiles of TLP genes under salt and drought condition in RNA-Seq, using Log2 (fold change) values.
Furthermore, to validate the transcriptome data of GhTLPs in response to drought and salt stresses, the qRT-PCR validation of seven putative genes (GhTLP5A.1, GhTLP5A.2, GhTLP5D.2, GhTLP7A.2, GhTLP7D.3, GhTLP11A, and GhTLP12A.1) was carried out. The corresponding primers are listed in Table 3. The expression of seven GhTLP genes was significantly upregulated in salt-stressed plants, where the majority of the GhTLPs showed responses at 12 and 48 h (Figures 5A–G), while GhTLP11A and GhTLP12A.1 showed highest responses in terms of fold change (FC) (>80 and >90) compared with control (Figures 5F,G). Similarly, six out of seven GhTLP genes were upregulated in drought-stressed plants, where GhTLP5A.2 showed responses at 24 h (Figure 5J), GhTLP5D.2 at 72 h (Figure 5K), GhTLP7A.2 at 12 and 48 h (Figure 5L), GhTLP7D.3 at 12 h (Figure 5M), GhTLP11A at 6, 12, 48, and 72 h (Figure 5N), but no expression was detected in GhTLP5A.1 at any time scale (Figure 5I), while GhTLP12A.1 showed highest response in terms of fold change (>140) in comparison to the control (Figure 5O). Altogether, the differential responses of GhTLP gene family members to salt and drought stresses suggest that GhTLP genes may function to combat abiotic stresses in cotton. Still, further studies are required to clone the significantly higher expressed genes to establish the role of individual TLP genes in cotton for salt and drought stress resistance.

Table 3. A list of primers used for validation in qRT-PCR.
Co-expression Network and Pathways Analysis of Highly Expressed GhTLP11A and GhTLP12A.1 Genes at Different Time Intervals Under Drought and Salt Stress Condition
The highly expressed genes (GhTLP11A and GhTLP12A.1) were further selected for co-expression network and pathways study. Using FPKM values, the co-expressed genes with GhTLP11A and GhTLP12A.1 were explored. We identified positively co-expressed genes (PCoEGs) (2 and 4) and negatively co-expressed genes (NCoEGs) (5 and 14) in salt and drought stress with GhTLP11A (Supplementary Figure 4 and Supplementary Tables 6, 7). Similarly, PCoEGs (13 and 48) and NCoEGs (9 and 24) were determined with GhTLP12A.1 in salt and drought stress (Supplementary Figure 4 and Supplementary Tables 6, 7).
PCoEGs and NCoEGs of GhTLP11A and GhTLP12A.1 were subjected for PageMan pathways analysis to understand the molecular and functional role of these genes. The pathway study revealed that NCoEGs of GhTLP11A showed higher expression of calcium signaling, and PCoEGs of GhTLP11A displayed higher expression of AS2 (lateral organ boundaries DOMAIN family protein) (Ma et al., 2006) at all time points (0, 6, 12, 24, 48, and 72 h) under salt stress condition (Supplementary Figure 5A). Earlier studies demonstrated that the elevated calcium levels help to protect plants from salt stress via SOS (salt overly sensitive) with signal transduction (Seifikalhor et al., 2019). In Medicagotruncatula, lateral organ boundaries domain (LBD1), Sorghum bicolorLBD, and Vitis viniferaLBD genes were upregulated under salt stress condition (Ariel et al., 2010; Wang et al., 2010; Grimplet et al., 2017), suggesting its role in salt stress response. Moreover, PCoEGs of GhTLP12A.1 showed higher expression of β-ketoacyl-CoA synthase (KCS), a key enzyme for the fatty acid elongation (Yang et al., 2020b), and NCoEGs of GhTLP12A.1 also displayed upregulation of a PHD-type transcriptional regulator at all time points (0, 6, 12, 24, 48, and 72 h) in salt stress response (Supplementary Figure 5B). Results revealed that β-ketoacyl-CoA synthase improves salt tolerance in A. thaliana (Yang et al., 2020b), and a PHD-type transcriptional regulator also improves salt tolerance in transgenic A. thaliana (Wei et al., 2009). Additionally, NCoEGs of GhTLP11A demonstrated little higher expression of jasmonate hormone metabolism, abiotic stresses for 12 h while the MYB domain and the G2-like transcriptional regulator highly expressed at all time points (0, 6, 12, 24, 48, and 72 h) in drought stress response (Supplementary Figure 5C). Methyl jasmonate (MeJA) has been reported to get enhanced during drought stress (Wu et al., 2012) and causes stomatal closure to save the water in wheat and enhance the antioxidant ability under the drought stress condition (Ma C. et al., 2014). Moreover, MYB has been reported to play a crucial role in providing tolerance under drought stress in A. thaliana and cotton (Zhang et al., 2012; Chen et al., 2015). These results suggested the important roles in drought stress tolerance. Alteration of its expression might improve tolerance under drought stress in cotton. Furthermore, NCoEGs of GhTLP12A.1 showed higher expression in cellulose synthase enzyme related to the cell wall; PCoEGs of GhTLP12A.1 displayed significantly highly expressed in lipid metabolism-related enzymes, the DOF zinc finger family, and MAP (mitogen-activated protein) kinases, signaling at all time points (0, 6, 12, 24, 48, and 72 h) in drought stress response (Supplementary Figure 5D). An earlier report revealed the importance of cellulose synthase in drought stress via induction of gene expression in A. thaliana (Chen et al., 2005), and lipid metabolism also showed an important role in drought stress response in A. thaliana by decreasing the lipid content progressively (Gigon et al., 2004). Moreover, overexpressed the DOF zinc finger family provides resistance under drought stress in Populustrichocarpa (Wang H. et al., 2017), and MAP kinases signaling also enables to enhance the tolerance under drought stress via the transmission of definite stimuli and regulating the antioxidant defense system (Sinha et al., 2011).
Potential miRNA Target Sites in Gossypium TLP Transcripts
A large number of transcripts are regulated by miRNAs in response to stresses, signal transduction, and in plant development (Witkos et al., 2011). To study whether the cotton TLP genes may be regulated by miRNAs, target sites for miRNA binding were analyzed in the identified cotton TLP genes through the plant small RNA target analysis server (psRNATarget). The miRBase database possesses 378 cotton miRNAs. For the identification of miRNA target sites, the cut-off threshold of 4 was set in the search parameter. We were able to identify target sites for 41 cotton miRNAs in 56 cotton TLP transcripts with an expectation score (e) varied from 0.5 to 4 (Supplementary Table 8). Only the miRNA/target site pairs with cut-off 3.5 were selected to reduce the false-positive identification. Later, 44 miRNAs from the 14 miRNA families, comprising the target sites among 28 cotton TLP genes, were considered reliable in terms of e ≤3.5 (Table 4). Although the majority of the cotton TLP genes contain target sites for a single miRNA, some genes, such as GbTLP2D.1, GbTLP7D.1, GhTLP2D.1, GhTLP7D.1, GrTLP2.1, and GrTLP7.1, have target sites for more than one miRNA. Target site accessibility was evaluated by estimating unpaired energy (UPE), an essential factor in the identification of targets. The UPE of the target sites varies from 7.274 (gra-miR7494b) to 24.749 (gra-miR7486d), where a lesser amount of energy illustrated the greater chance of interaction among a miRNA and target sites (Marin and Vanicek, 2011).
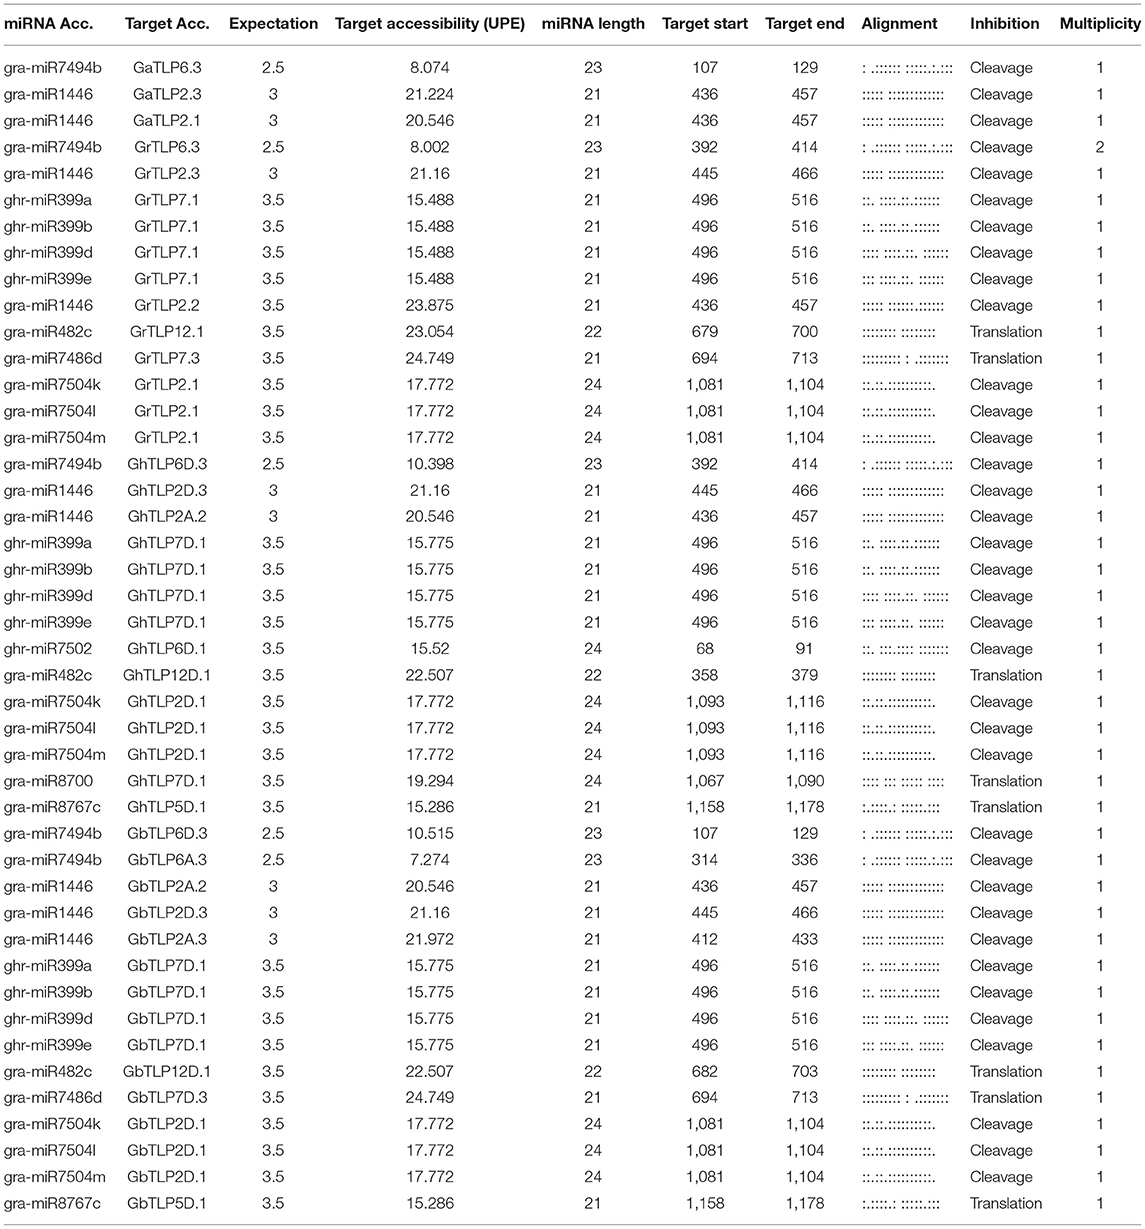
Table 4. The potential miRNA target sites in cotton TLP transcripts.
cis-Regulatory Element Analysis of GhTLPs
The cis-regulatory elements are crucial to controlling the regulation of transcription in several stress conditions (Nakashima et al., 2009). To identify cis-regulatory elements that may govern TLP expression in cotton, a 2-Kb region upstream from the translational start site of GhTLPs was scanned for various cis elements. A total of 1,182 proximal elements were identified in 33 GhTLPs that included 737 for abiotic stresses, 343 for hormonal responses, 30 for biotic stresses and 72 elements for the other cis-regulatory elements (Figure 6 and Table 5). A higher number of cis-regulatory elements were identified in GhTLP2D.2 (60), whereas the least number of cis-regulatory elements were detected in GhTLP12A.1 (18) (Supplementary Table 9). In abiotic stress-responsive cis-regulatory elements, the majority of the elements were involved in light responses, followed by low temperature, flavonoid biosynthesis, defense, and stress (Supplementary Table 9). The cis-regulatory elements related to hormonal responses comprised auxin, salicylic acid (SA), abscisic acid, gibberellin, and methyl jasmonate-responsive elements (Supplementary Table 9). The SA-responsive TCA element was present in a higher number in GhTLP11A. The auxin-responsive AuxRR-core element, which has an important role in salt, as well as drought stress responses (Guo et al., 2018; Kang et al., 2018), was detected in GhTLP5A.2, GhTLP5D.3, and GhTLP6A.2. Ethylene-responsive elements (EREs), which provide defense against salt and drought stress conditions (Pei et al., 2017; Sharma et al., 2019), were also detected and present in a higher number in GhTLP5D.2. The presence of these cis-regulatory elements in GhTLPs hints at their potential roles in the regulation of gene expression in cotton growth and development as well as under various environmental conditions (Nawaz et al., 2014).
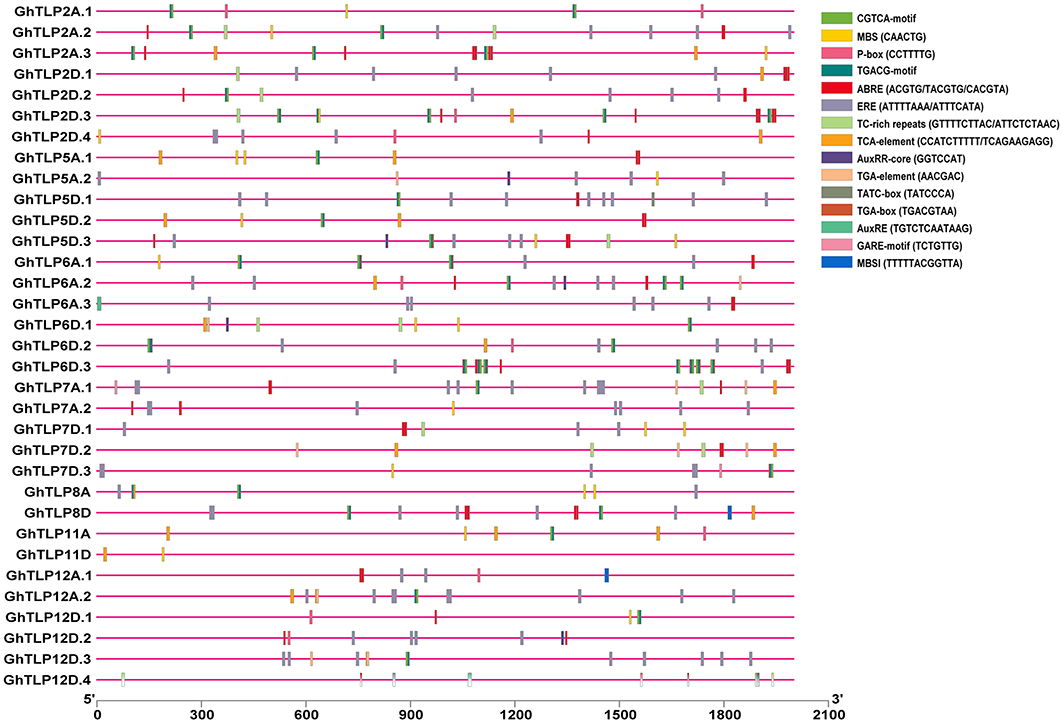
Figure 6. cis-regulatory elements analysis of G. hirsutum TLP genes. The micro-parts in diverse colors are the putative elements sequence.
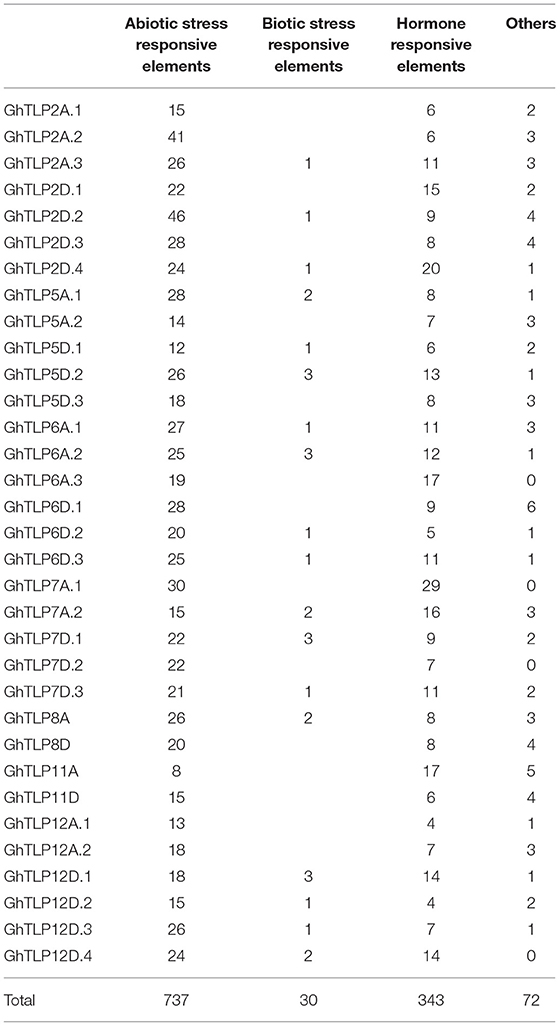
Table 5. Identified cis-regulatory elements in the GhTLPs genes.
Three-Dimensional (3D) Structural Analysis of the Putative GhTLPs Tubby Domain
The 3D structures of the GhTLPs tubby domain were determined through homology modeling of a central alpha-helix surrounded by a beta-barrel (Figure 7). All the putative GhTLPs have a typical tubby structure with a closed beta-barrel formed by 12 anti-parallel strands and a central alpha helix. While most GhTLPs contain five alpha-helices, GhTLP7A.2 and GhTLP12A.1 comprise six alpha-helices. These three-dimensional structural differences might lead to the functional diversification of different GhTLPs and suggest a slightly altered role for GhTLP7A.2 and GhTLP12A.1 as compared with the other GhTLP proteins. The higher transcript level of GhTLP12A.1 during drought and salt stress conditions further supported this hypothesis.
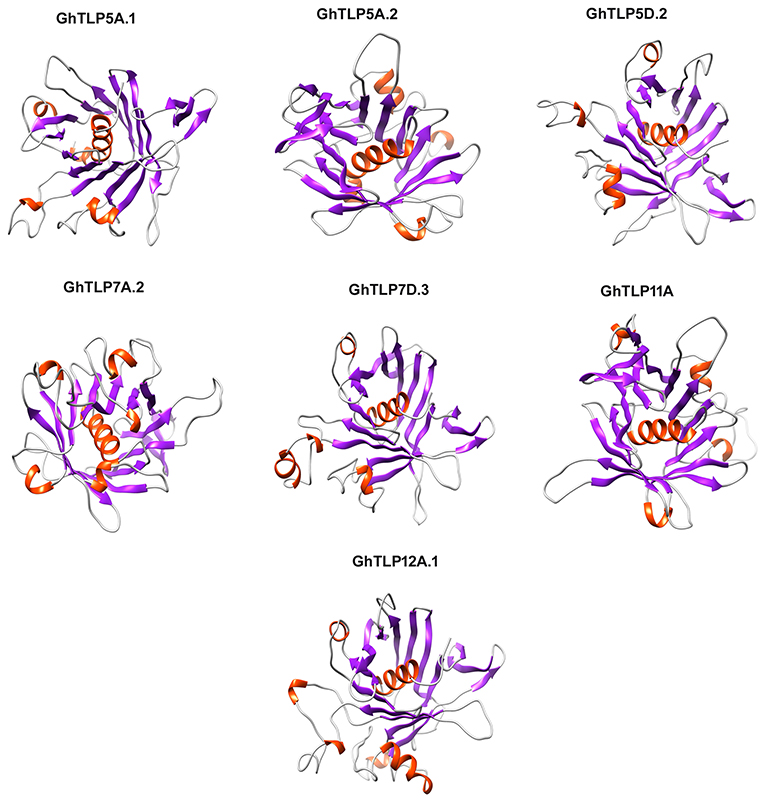
Figure 7. The homology 3D model of the GhTLPs tubby domain. The GhTLPs were selected for three-dimensional structure prediction and display with confidence level >99%. The alpha helix is shown with red and beta fold is shown with violet color.
Discussion
The genus Gossypium includes ~45 diploid (2n = 2x = 26) and six tetraploid (2n = 4x = 52) species (Hawkins et al., 2006; Grover et al., 2015). G. hirsutum and G. barbadense are allotetraploids that have been arisen in the new world from interspecific hybridization among A-genome-like ancestral African species and D-genome-like American species (Chen et al., 2007). The closest relatives of the tetraploid progenitors are the A-genome species G. herbaceum (A1) and G. arboreum (A2) and the D-genome species, G. raimondii (D5) or G. gossypioides (D6) (Brubaker et al., 1999; Senchina et al., 2003). Approximately, 1–2 million years ago, polyploidization occurred, giving rise to allotetraploid species (Wendel and Cronn, 2003). G. hirsutum and G. barbadense are possibly the oldest main allopolyploid crops (Paterson et al., 2012; Chalhoub et al., 2014; Marcussen et al., 2014).
In our efforts to study the TLP family in cotton, we have identified a total of 105 cotton TLP genes in four Gossypium genomes (G. arboreum, G. ramondii, G. hirsutum, and G. barbadense), 19 GaTLPs, 18 GrTLPs, 33 GhTLPs, and 35 GbTLPs (Table 1 and Supplementary Table 1). The genome sizes of G. arboreum and G. raimondii are 1,746 and 885 Mb (Li et al., 2014), respectively, and, expectedly, G. arboreum had higher numbers of TLP genes as compared with G. raimondii. However, although the genome size of G. hirsutum (~2.30 Gb) (Hu et al., 2019) was about the same as G. barbadense genome size (~2.22 Gb) (Hu et al., 2019), G. barbadense had a greater number of TLP genes as compared with G. hirsutum. The higher number of the TLP gene family members in G. barbadense might be due to the whole genome duplication events (Zhang et al., 2015; Qiao et al., 2019) which facilitate diversification (Clark and Donoghue, 2018).
The domain study revealed that all the conserved cotton TLP proteins comprised the tubby domain at the C-terminal and F-box domain at the N- terminal end while some of the cotton TLPs lack the F-box (Supplementary Figure 1). This was also observed in Arabidopsis thaliana, indicating the functional role of TLP proteins lacking the F box (Lai et al., 2004). The phylogenetic analysis of cotton TLPs and A. thaliana protein sequences grouped the cotton TLP proteins into eight major groups (Groups 1–8). However, groups 4 and 8 cotton TLP genes were not clustered with any of A. thaliana genes (Figure 1). Further analysis of groups 4 and 8 cotton TLP genes with other eudicots showed the loss of these genes from the brassicaceae family only. The orthologous gene pair analysis of the cotton TLP12 genes (Groups 4 and 8) with A. thaliana and T. cacao (closest relative of Gossypium). The outcomes of synteny analysis showed that cotton the TLP12 gene family members (Groups 4 and 8) have orthologous duplicated genes in T. cacoa (Figures 2A–D) while no orthologous duplicated genes were detected in A. thaliana (Figures 2E–H). Therefore, it may be hypothesized that groups four and eight cotton TLP genes (TLP12) were the consequence of recent species-specific duplication events that led to independent functional diversification. Groups four and eight TLPs orthologous pairs experienced faster evolution as compared with the other TLP gene family members, indicating their functional divergence in Gossypium, proposing that groups four and eight TLPs might have a specific function in cotton species. The identified orthologous TLP12 gene pairs in G. hirsutum and G. barbadense are approximately double in comparison to G. arboreum and G. raimondii, respectively, showing the effect of polyploidy. This leads to more orthologous gene pairs in GhTLP12 and GbTLP12 genes than GaTLP12 and GrTLP12 genes (Qanmber et al., 2019a).
The evolutionary analysis within the Gossypium TLP genes showed most of them were greatly conserved during evolution, showed introns of these genes were not lost during evolution, and, at the early expansion stages of evolution, these genes diverged, whereas, over evolutionary time, other genes lost their introns (Qanmber et al., 2019b), indicating that group specific genes may have similar functions. According to a previous report on gene structure, introns performed essential functions during the course of evolution in several plant species (Roy and Gilbert, 2006). During the early expansion period, there was more intron, which subsequently decreased over the passage of time (Roy and Penny, 2007). GrTLP5.2 comprises no intron in gene structure; lack of intron indicates that the TLP gene is advanced where introns were disappeared over the evolutionary time period (Qanmber et al., 2019a); this gene might have some conserved evolutionary function in cotton. These findings demonstrated more advanced species comprise fewer introns in their genomes (Roy and Gilbert, 2005). Higher number of introns led to new functions (Qanmber et al., 2019a). Moreover, several gene families comprise no intron or with fewer introns in their genes (Zhang et al., 2015; Qanmber et al., 2018). Insertions or deletions events participate in the structural differences of exon/intron that might be useful to calculate the evolutionary mechanisms (Lecharny et al., 2003). Introns are absent in some genes that might be due to a rapid evolution rate, whereas a greater number of introns comprising genes leads to a gain of function in evolution (Qanmber et al., 2019b). The loss or gain of genes through segmental duplication or incomplete sequencing of genomes is the major cause for TLP genes distribution in cotton (Qanmber et al., 2019b).
Chromosomal allocation studies demonstrated that cotton TLP genes expansion has arisen due to segmental duplication except for GaTLP2.1/GaTLP2.3 (Figures 4A–F). The purifying selection probably excludes the deleterious loss-of-function mutations, refining functional alleles at both duplicate loci and fixing recent duplicate genes (Tanaka et al., 2009). All the identified paralogous cotton TLP gene pairs indicated the purifying selection (Table 2). The recent duplication events in Gossypium TLPs have had implicit ecological, morphological, and physiological diversification (Wendel and Cronn, 2003). The diploid genomes of G. arboreum and G. raimondii were diverged 2–13 MYA, and allotetraploid cotton (G. hirsutum and G. barbadense) was originated about 1–2 MYA (Li et al., 2014; Wang M. J. et al., 2017; Wang et al., 2019). The duplication time of GaTLPs (15.17–50.87 MYA), GrTLPs (11.95–18.88 MYA), GhTLPs (14.77–53.60 MYA), and GbTLPs (0.85–52.6 MYA) implied that duplication events in Gossypium TLP gene families were more ancient than that of both polyploid formation and divergence of diploid species. This duplication might facilitate the unique role of TLP genes in Gossypium, i.e., cotton stress responses. The average duplication time of GaTLPs and GrTLPs was around 24.78 and 16.31 MYA, which probably took place after their divergence from T. cacoa (33 MYA) (Li et al., 2014) and A. thaliana (93 MYA) (Ma et al., 2016); before the reunification of A and D diploid genomes that lead to allotetraploid cotton (Zhang et al., 2015; Wang et al., 2019) (Table 2). These observations suggested that TLP2.2 and TLP2.3 in G. arboreum, G. raimondii, and G. barbadense might have arisen from the same duplication event of cotton TLP2.1 genes. All paralogous cotton TLP gene pairs except GaTLP2.1/GaTLP2.3 experienced segmental duplication (Figures 4A–F). Here, both segmental and tandem duplication helped in the TLP gene family expansion, but segmental duplication might have some significant role in the expansion of the TLP gene family members (Liu et al., 2018; Qanmber et al., 2019a; Ali et al., 2020).
The orthologous gene pairs had the sequence identity >90% in cDNA and also in amino acid compositions (Supplementary Table 4), which were carried out for further evolutionary study. Among orthologous-duplicated pairs, the Ka/Ks values of TLP2, TLP5, TLP6, TLP7, TLP8, TLP11, and TLP12 were higher in A vs. D, At vs. Dt, and Dt vs. D. The divergence analysis showed that cotton TLPs experienced greater evolutionary pressure in diploid as well as in allotetraploid cotton and might have evolved rapidly in D subgenome as compared with A subgenome (Supplementary Table 5). All the identified orthologous cotton TLP gene pairs show purifying selection (Figure 4G and Supplementary Table 5).
The TLP genes are known to play important roles in stress responses in various plant species (Lai et al., 2004; Liu, 2008; Xu et al., 2016). The transcriptome analysis data of G. hirsutum showed the high expression of GhTLP genes in salt and drought stresses. The expression analysis showed that GhTLP5A.1 and GhTLP5D.2 genes have a significantly higher relative expression in salt stress response, but not in drought stress; therefore, these genes might have a major role in salt-stress tolerance. Moreover, GhTLP11A and GhTLP12A.1 showed higher expression in both salt and drought-stress responses. Therefore, these two genes might have an important role in salt and drought tolerance and could be appropriate targets for further manipulation to protect the cotton from salt and drought stress.
To further characterize the function of GhTLP11A and GhTLP12A.1 genes, the co-expression network of these two genes (Supplementary Figure 4) was studied. This study revealed that PCoEGs of GhTLP11A comprised the lateral organ boundaries (LOB) domain (LBD), which were upregulated via ABA treatment in Vitis vinifera under salt-stress response (Grimplet et al., 2017). NCoEGs of GhTLP11A contained ABC transporter-like protein, actively involved in salt-stress recovery in Populuseuphratica (Gu et al., 2004) and calcium protein, which was considered as one of the important molecules in response to salinity (Seifikalhor et al., 2019), and, in a seedling of rice, Ca2+ induces antioxidant enzyme activity and retains cellular redox potential under salt stress (Rahman et al., 2016; Supplementary Tables 6, 7). In salt stress, PCoEGs of GhTLP12A.1 comprised the SANT/MYB domain and the sugar-phosphate transporter domain. Sugarcane MYB18, containing the SANT/MYB DNA-binding domain, remarkably improved tolerance to salt stress (Shingote et al., 2015) and phosphate transporter PHT4;6 of A. thaliana function in cell wall biosynthesis and protein N-glycosylation, which are crucial to salt tolerance (Cubero et al., 2009). NCoEGs of GhTLP12A.1 contained a FYVE/PHD-type zinc finger and MADS-box in salt stress. A. thaliana RING/FYVE/PHD ZFP (AtRZFP) is found to bind with zinc and provides tolerance to salt stress (Zang et al., 2016), and MADS-box considered a positive regulator of salt-stress response via regulating the maintenance of ABA signaling, primary metabolism, detoxification, and ROS homeostasis through antioxidant enzymatic activities (Castelán-Muñoz et al., 2019; Supplementary Tables 6, 7). Results demonstrated that PCoEGs and NCoEGs of GhTLP11A and GhTLP12A.1 genes might be crucial in salt-stress responses. In drought stress, PCoEGs of GhTLP11A comprised a protein kinase domain and haloacid dehalogenase-like hydrolase (HAD hydrolase). Calcium-dependent protein kinase may function as calcium sensors and have an important role in drought-stress response. In A. thaliana, calcium-dependent protein kinase 10 (CPK10) provides tolerance under drought stress via ABA and Ca2+-mediated stomatal regulation (Zou et al., 2010). A. thaliana trehalose-6-phosphate phosphatases (AtTPPs) encodes a protein in the HAD hydrolase superfamily that is involved in the biosynthesis of trehalose. Overexpressed AtTPPF leads to the accumulation of trehalose in response to drought stress and can increase the tolerance under drought stress (Lin et al., 2019). NCoEGs of GhTLP11A contained a B3 domain, which improves drought-stress tolerance via reducing the stomatal density and changed the shape of stomata in Zea mays (Liu Y. H. et al., 2015) and a late embryogenesis abundant (LEA) gene, whose higher expression provides tolerance under drought stress in upland cotton (Magwanga et al., 2018; Supplementary Table 7). PCoEGs of GhTLP12A.1 comprised expansin and a Dof-type zinc finger in drought-stress response. Transgenic wheat expansin 2 (TaEXPA2) positively regulates tolerance under drought stress (Yang et al., 2020), and Brassica rapa expansin-like B1 (BrEXLB1) also associated with drought stress tolerance (Muthusamy et al., 2020), while the overexpressed DOF zinc finger family provides resistance under drought stress in P. trichocarpa (Wang H. et al., 2017). NCoEGs of GhTLP12A.1 contained UBA-like superfamily and dirigent protein under drought stress response (Supplementary Table 7). In wheat, a UBA protein (TaUBA), a negative regulator of drought stress, might function via downregulating some stress responsive transcription factors (Li et al., 2015), and, in Boeahygrometrica, dirigent proteins provide a protective role under drought-stress response via changing the physical characters of lignin, which further affects the flexibility and mechanical strength of the plant cell wall (Wu et al., 2009). Taken together, our results showed that PCoEGs and NCoEGs of GhTLP11A and GhTLP12A.1 genes might have a crucial role in drought-stress tolerance.
Moreover, we determined 41 miRNA target sites in 56 cotton TLP transcripts with an expectation score (E) varied from 0.5 to 4 (Supplementary Table 8). In this study, 15 miRNA families, comprising target sites in 28 cotton TLP genes, were detected (Table 4). An earlier report showed that some of the miRNA families were conserved among the plants, which displayed their function in the adaptation of plants to various stress responses (Jones-Rhoades and Bartel, 2004; Yuan et al., 2013). In Vitis vinifera, miR7494 has a prominent role in plants under abiotic stresses, and, in Zea mays, the expression of miR399 gets induced during abiotic stress response (Zhang et al., 2008; Kumar, 2014; Pagliarani et al., 2017; Snyman et al., 2017; Inal et al., 2020). These miRNAs that have been detected in this study are with lower UPE value (7.27–15.77) (Table 4). These outcomes suggested that cotton miRNAs might also be involved in abiotic stress responses to enhance drought- and salt-stress tolerance.
Moreover, cis-regulatory element analysis demonstrated that, among the selected putative genes for validation, only GhTLP12A.1 cis-regulatory elements comprised an MBSI cis-regulatory element related to flavonoid biosynthetic regulatory genes, which are very crucial to provide drought tolerance in wheat (Ma D. Y. et al., 2014). Overexpressing many of the genes of flavonoid pathways also provides tolerance under salt stress (Ashraf, 2009; Yang et al., 2009; Matus et al., 2010; Le Martret et al., 2011; Bharti et al., 2015). GhTLP11A comprised the higher number of salicylic acid (SA)-responsive TCA elements. Salicylic acid was identified as a potential hormone to provide tolerance against salinity (Khan et al., 2012) and improves the drought tolerance in rice (Farooq et al., 2009).
GhTLP5A.2, GhTLP5D.2, GhTLP11A, and GhTLP12A.1 also showed significant relative expression in qRT-PCR. From these observations, it could be speculated that the proximal elements of GhTLP11A and GhTLP12A.1 might have an important role in controlling the regulation and improvement of salt- and drought-stress responses in cotton. The results of the metabolic pathway study of PCoEGs and NCoEGs of GhTLP11A and GhTLP12A.1 genes and cis-regulatory elements also provided evidence of the involvement of two of these genes in salt- and drought-stress responses. However, detailed molecular explorations are required to understand the structural-functional relationship of cotton TLP genes and the involvement of GhTLPs to enhance the tolerance against drought and salt stresses.
Conclusion
In this study, a total of 105 cotton TLP proteins with a highly conserved tubby domain at C-terminal and N-terminal F-box were identified in four cotton species (G. arboreum, G. raimondii, G. hirsutum, and G. barbadense). Their protein domains, conserved motifs, and gene structure within the same groups shared a notable similarity, which leads to some similar functions. Furthermore, the cotton TLP12 gene family members clustered into 4 and 8 groups and experienced higher evolutionary pressure in comparison to others, showing their functional divergence in Gossypium species. Several G. hirsutum TLP genes showed significantly high expression in both drought- and salt-stress conditions. Two genes GhTLP11A and GhTLP12A.1 demonstrated comparatively higher expression and provided strong evidence that these genes can play a predominant role during drought and salt stress. Our investigation enhances the understanding of TLP genes in cotton at the level of function, evolution, and structure, which further highlights the intriguing field of TLP genes that have immense prospects for future manipulation.
Data Availability Statement
The datasets presented in this study can be found in online repositories. The names of the repository/repositories and accession number(s) can be found at: NCBI (https://www.ncbi.nlm.nih.gov/geo/) under accession numbers PRJNA532694.
Author Contributions
NB carried out the bioinformatics analysis and design and drafted the manuscript. SF performed quantitative expression analysis. CM and SB participated to supervise the study. All the authors have read and approved the final manuscript.
Funding
This work was supported by a grant (MLP0035) from Council of Scientific and Industrial Research (CSIR), India. NB acknowledges the financial support from CSIR-UGC SRF.
Conflict of Interest
The authors declare that the research was conducted in the absence of any commercial or financial relationships that could be construed as a potential conflict of interest.
Acknowledgments
The authors acknowledge HPC facility, CSIR-4PI, Bangaluru. The authors are also grateful to Dr. Mehar Hasan Asif and Aniruddha P. Sane for correcting the manuscript and Mousumi Mukherjee for editing the English text of this manuscript. This manuscript number was provided by the institute CSIR-NBRI_MS/2021/02/04.
Supplementary Material
The Supplementary Material for this article can be found online at: https://www.frontiersin.org/articles/10.3389/fpls.2021.667929/full#supplementary-material
Supplementary Figure 1. Diagrammatic representation of the functional domain of GaTLPs, GrTLPs, GhTLPs, and GbTLPs. Bioinformatics study of conserved domains was done by the NCBI Batch CD-search tool.
Supplementary Figure 2. Multiple sequence alignment of all identified TLP genes in cotton (Gossypium arboreum, Gossypium raimondii, Gossypium hirsutum, and Gossypium barbadense). The conserved residues are shown by dark background.
Supplementary Figure 3. Cotton TLP12 genes phylogenetic tree with different eudicots. Cotton TLP12 genes (GaTLPs12, GrTLPs12, GhTLPs12A, GhTLPs12D, GbTLPs12A, and GbTLPs12D) with different eudicots were aligned with each other. The phylogenetic tree ML was built, using 1,000 bootstrap values.
Supplementary Figure 4. Co-expression network analysis of GhTLP11A and GhTLP12A.1 genes. Positively and negatively co-expressed genes (PCoEGs and NCoEGs) with GhTLP11A and GhTLP12A.1 in salt and drought stress at different time scales. Rhombus (nodes) represents transcripts, and lines (edges) represent transcriptional interaction between GhTLPs and transcripts.
Supplementary Figure 5. PageMan-based functional classification of Positively and negatively co-expressed genes (PCoEGs and NCoEGs) in transcriptional regulation, signaling, lipid metabolism, stress, signaling, secondary and hormone metabolism in (A,B) salt- and (C,D) drought-stress condition at 0, 6, 12, 24, 48, and 72 h. BINs colored in green and red are positively and negatively regulated groups, respectively. Expression values in the log 2 scale indicated by the scale bar.
Supplementary Table 1. Reciprocal blast of cotton and A. thaliana TLP proteins.
Supplementary Table 2. A list of eudicots plants used for groups 4 and 8 cotton TLP genes (TLP12) phylogenetic analysis.
Supplementary Table 3. Fifteen conserved protein motif sequences and their annotation in cotton TLPs.
Supplementary Table 4. Orthologous TLP gene pairs among Gossypium taxa with their chromosomal location and percentage identity.
Supplementary Table 5. The molecular evolutionary rates (Ka, Ks, Ka/Ks ratios) of orthologous TLP gene pairs among Gossypium taxa.
Supplementary Table 6. A list of positively and negatively co-expressed genes (Pearson correlation coefficient r ≥ 0.95/r ≤ −0.95) with GhTLP711A and GhTLP12A.1 in salt stress.
Supplementary Table 7. A list of positively and negatively co-expressed genes (Pearson correlation coefficient r ≥ 0.95/r ≤ −0.95) with GhTLP711A and GhTLP12A.1 in drought stress.
Supplementary Table 8. Identified miRNAs and their targets.
Supplementary Table 9. Distribution of cis-regulatory elements in the promoter regions of GhTLP genes and their annotations.
References
Ali, F., Qanmber, G., Wei, Z., Yu, D., Hui Li, Y., Gan, L., et al. (2020). Genome-wide characterization and expression analysis of geranylgeranyl diphosphate synthase genes in cotton (Gossypium spp.) in plant development and abiotic stresses. BMC Genomics, 21:561. doi: 10.1186/s12864-020-06970-8
Ariel, F. D., Diet, A., Crespi, M., and Chan, R. L. (2010). The LOB-like transcription factor Mt LBD1 controls Medicago truncatula root architecture under salt stress. Plant Signal. Behav. 5, 1666–1668. doi: 10.4161/psb.5.12.14020
Ashraf, M. (2009). Biotechnological approach of improving plant salt tolerance using antioxidants as markers. Biotechnol. Adv. 27, 84–93. doi: 10.1016/j.biotechadv.2008.09.003
Bailey, T. L., Boden, M., Buske, F. A., Frith, M., Grant, C. E., Clementi, L., et al. (2009). MEME SUITE: tools for motif discovery and searching. Nucleic Acids Res. 37, W202–W208. doi: 10.1093/nar/gkp335
Bao, Y., Song, W. M., Jin, Y. L., Jiang, C. M., Yang, Y., Li, B., et al. (2014). Characterization of Arabidopsis Tubby-like proteins and redundant function of AtTLP3 and AtTLP9 in plant response to ABA and osmotic stress. Plant Mol. Biol. 86, 471–483. doi: 10.1007/s11103-014-0241-6
Bharti, P., Mahajan, M., Vishwakarma, A. K., Bhardwaj, J., and Yadav, S. K. (2015). AtROS1 overexpression provides evidence for epigenetic regulation of genes encoding enzymes of flavonoid biosynthesis and antioxidant pathways during salt stress in transgenic tobacco. J. Exp. Bot. 66, 5959–5969. doi: 10.1093/jxb/erv304
Blanc, G., and Wolfe, K. H. (2004). Widespread paleopolyploidy in model plant species inferred from age distributions of duplicate genes. Plant Cell 16, 1667–1678. doi: 10.1105/tpc.021345
Boggon, T. J., Shan, W. S., Santagata, S., Myers, S. C., and Shapiro, L. (1999). Implication of tubby proteins as transcription factors by structure-based functional analysis. Science 286, 2119–2125. doi: 10.1126/science.286.5447.2119
Brubaker, C. L., Bourland, F. M., and Wendel, J. F. (1999). “The origin and domestication of cotton,” in Cotton: Origin, History, Technology, and Production eds Smith, C. W., and Cothren, J. T. (New York, NY: John Wiley and Sons), 3–31.
Byng, J. W., Chase, M. W., Christenhusz, M. J. M., Fay, M. F., Judd, W. S., Mabberley, D. J., et al. (2016). An update of the Angiosperm Phylogeny Group classification for the orders and families of flowering plants: APG IV. Bot. J. Linnean Soc. 181, 1–20. doi: 10.1111/boj.12385
Carroll, K., Gomez, C., and Shapiro, L. (2004). Tubby proteins: the plot thickens. Nat. Rev. Mol. Cell Biol. 5, 55–63. doi: 10.1038/nrm1278
Castelán-Muñoz, N., Herrera, J., Cajero-Sánchez, W., Arrizubieta, M., Trejo, C., Garcia-Ponce, B., et al. (2019). MADS-box genes are key components of genetic regulatory networks involved in abiotic stress and plastic developmental responses in plants. Front. Plant Sci. 10:853. doi: 10.3389/fpls.2019.00853
Chalhoub, B., Denoeud, F., Liu, S. Y., Parkin, I. A. P., Tang, H. B., Wang, X. Y., et al. (2014). Early allopolyploid evolution in the post-Neolithic Brassica napus oilseed genome. Science 345, 950–953. doi: 10.1126/science.1253435
Chen, T. Z., Li, W. J., Hu, X. H., Guo, J. R., Liu, A. M., and Zhang, B. L. (2015). A cotton MYB transcription factor, GbMYB5, is positively involved in plant adaptive response to drought stress. Plant Cell Physiol. 56, 917–929. doi: 10.1093/pcp/pcv019
Chen, Y. L., Dai, W., Sun, B. M., Zhao, Y., and Ma, Q. (2016). Genome-wide identification and comparative analysis of the TUBBY-like protein gene family in maize. Genes Genom. 38, 25–36. doi: 10.1007/s13258-015-0338-6
Chen, Z. J., Scheffler, B. E., Dennis, E., Triplett, B. A., Zhang, T. Z., Guo, W. Z., et al. (2007). Toward sequencing cotton (Gossypium) genomes. Plant Physiol. 145, 1303–1310. doi: 10.1104/pp.107.107672
Chen, Z. Z., Hong, X. H., Zhang, H. R., Wang, Y. Q., Li, X., Zhu, J. K., et al. (2005). Disruption of the cellulose synthase gene, AtCesA8/IRX1, enhances drought and osmotic stress tolerance in Arabidopsis. Plant J. 43, 273–283. doi: 10.1111/j.1365-313X.2005.02452.x
Clark, J. W., and Donoghue, P. C. (2018). Whole-genome duplication and plant macroevolution. Trends Plant Sci. 23, 933–945. doi: 10.1016/j.tplants.2018.07.006
Cubero, B., Nakagawa, Y., Jiang, X. Y., Miura, K. J., Li, F., Raghothama, K. G., et al. (2009). The phosphate transporter PHT4; 6 is a determinant of salt tolerance that is localized to the Golgi apparatus of Arabidopsis. Mol. Plant 2, 535–552. doi: 10.1093/mp/ssp013
Dai, X., Zhuang, Z., and Zhao, P. X. (2018). psRNATarget: a plant small RNA target analysis server (2017 release). Nucleic Acids Res. 46, W49–W54. doi: 10.1093/nar/gky316
Eddy, S. R. (2011). Accelerated profile HMM searches. PLoS Comput. Biol. 7:e1002195. doi: 10.1371/journal.pcbi.1002195
El-Gebali, S., Mistry, J., Bateman, A., Eddy, S. R., Luciani, A., Potter, S. C., et al. (2019). The Pfam protein families database in 2019. Nucleic Acids Res. 47, D427–D432. doi: 10.1093/nar/gky995
Farooq, M., Basra, S., Wahid, A., Ahmad, N., and Saleem, B. (2009). Improving the drought tolerance in rice (Oryza sativa L.) by exogenous application of salicylic acid. J. Agron. Crop Sci. 195, 237–246. doi: 10.1111/j.1439-037X.2009.00365.x
Gabaldon, T., and Koonin, E. V. (2013). Functional and evolutionary implications of gene orthology. Nat. Rev. Genet. 14, 360–366. doi: 10.1038/nrg3456
Gagne, J. M., Downes, B. P., Shiu, S. H., Durski, A. M., and Vierstra, R. D. (2002). The F-box subunit of the SCF E3 complex is encoded by a diverse superfamily of genes in Arabidopsis. Proc. Natl. Acad. Sci. U.S.A. 99, 11519–11524. doi: 10.1073/pnas.162339999
Gasteiger, E., Gattiker, A., Hoogland, C., Ivanyi, I., Appel, R. D., and Bairoch, A. (2003). ExPASy: the proteomics server for in-depth protein knowledge and analysis. Nucleic Acids Res. 31, 3784–3788. doi: 10.1093/nar/gkg563
Gigon, A., Matos, A. R., Laffray, D., Zuily-Fodil, Y., and Pham-Thi, A. T. (2004). Effect of drought stress on lipid metabolism in the leaves of Arabidopsis thaliana (ecotype Columbia). Ann. Bot. 94, 345–351. doi: 10.1093/aob/mch150
Grimplet, J., Pimentel, D., Agudelo-Romero, P., Martinez-Zapater, J. M., and Fortes, A. M. (2017). The LATERAL ORGAN BOUNDARIES Domain gene family in grapevine: genome-wide characterization and expression analyses during developmental processes and stress responses. Sci. Rep. 7:15968. doi: 10.1038/s41598-017-16240-5
Grover, C. E., Zhu, X., Grupp, K. K., Jareczek, J. J., Gallagher, J. P., Szadkowski, E., et al. (2015). Molecular confirmation of species status for the allopolyploid cotton species, Gossypium ekmanianum Wittmack. Genet. Resour. Crop Evol. 62, 103–114. doi: 10.1007/s10722-014-0138-x
Gu, R. S., Fonseca, S., Puskas, L. G., Hackler, L., Zvara, A., Dudits, D., et al. (2004). Transcript identification and profiling during salt stress and recovery of Populus euphratica. Tree Physiol. 24, 265–276. doi: 10.1093/treephys/24.3.265
Guo, A. Y., Zhu, Q. H., Chen, X., and Luo, J. C. (2007). [GSDS: a gene structure display server]. Yi Chuan 29, 1023–1026. doi: 10.1360/yc-007-1023
Guo, Y., Jiang, Q., Hu, Z., Sun, X., Fan, S., and Zhang, H. (2018). Function of the auxin-responsive gene TaSAUR75 under salt and drought stress. Crop J. 6, 181–190. doi: 10.1016/j.cj.2017.08.005
Hawkins, J. S., Kim, H., Nason, J. D., Wing, R. A., and Wendel, J. F. (2006). Differential lineage-specific amplification of transposable elements is responsible for genome size variation in Gossypium. Genome Res. 16, 1252–1261. doi: 10.1101/gr.5282906
Hu, Y., Chen, J. D., Fang, L., Zhang, Z. Y., Ma, W., Niu, Y. C., et al. (2019). Gossypium barbadense and Gossypium hirsutum genomes provide insights into the origin and evolution of allotetraploid cotton. Nat. Genet. 51, 739–748. doi: 10.1038/s41588-019-0371-5
Inal, B., Ilhan, E., Buyuk, I., and Altintas, S. (2020). Transcriptome wide characterization of water deficit responsive grape mTERF transcription. J. Plant Biochem. Biotechnol. 29, 102–113. doi: 10.1007/s13562-019-00520-4
Jones-Rhoades, M. W., and Bartel, D. P. (2004). Computational identification of plant MicroRNAs and their targets, including a stress-induced miRNA. Mol. Cell 14, 787–799. doi: 10.1016/j.molcel.2004.05.027
Kang, C., He, S., Zhai, H., Li, R., Zhao, N., and Liu, Q. (2018). A sweetpotato auxin response factor gene (IbARF5) is involved in carotenoid biosynthesis and salt and drought tolerance in transgenic Arabidopsis. Front. Plant Sci. 9:1307. doi: 10.3389/fpls.2018.01307
Kelley, L. A., Mezulis, S., Yates, C. M., Wass, M. N., and Sternberg, M. J. E. (2015). The Phyre2 web portal for protein modeling, prediction and analysis. Nat. Protoc. 10, 845–858. doi: 10.1038/nprot.2015.053
Khan, M. I. R., Syeed, S., Nazar, R., and Anjum, N. A. (2012). “An insight into the role of salicylic acid and jasmonic acid in salt stress tolerance,” in Phytohormones and Abiotic Stress Tolerance in Plants, eds, NazarNoushina, N. A. K and Anjum, I. A. (Berlin; Heidelberg: Springer) 277–300. doi: 10.1007/978-3-642-25829-9_12
Kile, B. T., Schulman, B. A., Alexander, W. S., Nicola, N. A., Martin, H. M., and Hilton, D. J. (2002). The SOCS box: a tale of destruction and degradation. Trends Biochem. Sci. 27, 235–241. doi: 10.1016/S0968-0004(02)02085-6
Kim, D., Pertea, G., Trapnell, C., Pimentel, H., Kelley, R., and Salzberg, S. L. (2013). TopHat2: accurate alignment of transcriptomes in the presence of insertions, deletions and gene fusions. Genome Biol. 14, 1–13. doi: 10.1186/gb-2013-14-4-r36
Kleyn, P. W., Fan, W., Kovats, S. G., Lee, J. J., Pulido, J. C., Wu, Y., et al. (1996). Identification and characterization of the mouse obesity gene tubby: a member of a novel gene family. Cell 85, 281–290. doi: 10.1016/S0092-8674(00)81104-6
Kozomara, A., Birgaoanu, M., and Griffiths-Jones, S. (2019). miRBase: from microRNA sequences to function. Nucleic Acids Res. 47, D155–D162. doi: 10.1093/nar/gky1141
Krzywinski, M., Schein, J., Birol, I., Connors, J., Gascoyne, R., Horsman, D., et al. (2009). Circos: an information aesthetic for comparative genomics. Genome Res. 19, 1639–1645. doi: 10.1101/gr.092759.109
Kumar, R. (2014). Role of microRNAs in biotic and abiotic stress responses in crop plants. Appl. Biochem. Biotechnol. 174, 93–115. doi: 10.1007/s12010-014-0914-2
Kumar, S., Stecher, G., and Tamura, K. (2016). MEGA7: molecular evolutionary genetics analysis version 7.0 for bigger datasets. Mol. Biol. Evol. 33, 1870–1874. doi: 10.1093/molbev/msw054
Lai, C. P., Lee, C. L., Chen, P. H., Wu, S. H., Yang, C. C., and Shaw, J. F. (2004). Molecular analyses of the Arabidopsis TUBBY-like protein gene family. Plant Physiol. 134, 1586–1597. doi: 10.1104/pp.103.037820
Lamesch, P., Berardini, T. Z., Li, D. H., Swarbreck, D., Wilks, C., Sasidharan, R., et al. (2012). The Arabidopsis Information Resource (TAIR): improved gene annotation and new tools. Nucleic Acids Res. 40, D1202–D1210. doi: 10.1093/nar/gkr1090
Larkin, M. A., Blackshields, G., Brown, N. P., Chenna, R., Mcgettigan, P. A., Mcwilliam, H., et al. (2007). Clustal W and clustal X version 2.0. Bioinformatics 23, 2947–2948. doi: 10.1093/bioinformatics/btm404
Le Martret, B., Poage, M., Shiel, K., Nugent, G. D., and Dix, P. J. (2011). Tobacco chloroplast transformants expressing genes encoding dehydroascorbate reductase, glutathione reductase, and glutathione-S-transferase, exhibit altered anti-oxidant metabolism and improved abiotic stress tolerance. Plant Biotechnol. J. 9, 661–673. doi: 10.1111/j.1467-7652.2011.00611.x
Lecharny, A., Boudet, N., Gy, I., Aubourg, S., and Kreis, M. (2003). Introns in, introns out in plant gene families: a genomic approach of the dynamics of gene structure. J. Struct. Funct. Genomics 3, 111–116. doi: 10.1023/A:1022614001371
Lescot, M., Dehais, P., Thijs, G., Marchal, K., Moreau, Y., Van De Peer, Y., et al. (2002). PlantCARE, a database of plant cis-acting regulatory elements and a portal to tools for in silico analysis of promoter sequences. Nucleic Acids Res. 30, 325–327. doi: 10.1093/Nar/30.1.325
Letunic, I., and Bork, P. (2019). Interactive Tree Of Life (iTOL) v4: recent updates and new developments. Nucleic Acids Res. 47, W256–W259. doi: 10.1093/nar/gkz239
Li, F. G., Fan, G. Y., Wang, K. B., Sun, F. M., Yuan, Y. L., Song, G. L., et al. (2014). Genome sequence of the cultivated cotton Gossypium arboreum. Nat. Genet. 46, 567–572. doi: 10.1038/ng.2987
Li, X., Zhang, S. S., Ma, J. X., Guo, G. Y., Zhang, X. Y., Liu, X., et al. (2015). TaUBA, a UBA domain-containing protein in wheat (Triticum aestivum L.), is a negative regulator of salt and drought stress response in transgenic Arabidopsis. Plant Cell Rep. 34, 755–766. doi: 10.1007/s00299-015-1739-3
Li, Z., Wang, X., Cao, X., Chen, B., Ma, C., Lv, J., et al. (2020). GhTULP34, a member of tubby-like proteins, interacts with GhSKP1A to negatively regulate plant osmotic stress. Genomics 113(1 Pt 2):462-474. doi: 10.1016/j.ygeno.2020.09.024
Lin, Q. F., Yang, J., Wang, Q. L., Zhu, H., Chen, Z. Y., Dao, Y. H., et al. (2019). Overexpression of the trehalose-6-phosphate phosphatase family gene AtTPPF improves the drought tolerance of Arabidopsis thaliana. BMC Plant Biol. 19:381. doi: 10.1186/S12870-019-1986-5
Liu, Q. P. (2008). Identification of rice TUBBY-like genes and their evolution. Febs J. 275, 163–171. doi: 10.1111/j.1742-4658.2007.06186.x
Liu, X., Zhao, B., Zheng, H. J., Hu, Y., Lu, G., Yang, C. Q., et al. (2015). Gossypium barbadense genome sequence provides insight into the evolution of extra-long staple fiber and specialized metabolites. Sci. Rep. 5:14139. doi: 10.1038/Srep14139
Liu, Y. H., Yuan, J. C., Ma, H. L., Song, J. H., Wang, L. Y., and Weng, Q. Y. (2015). Characterization and functional analysis of a B3 domain factor from zea mays. J. Appl. Genet. 56, 427–438. doi: 10.1007/s13353-015-0287-4
Liu, Z., Qanmber, G., Lu, L., Qin, W., Liu, J., Li, J., et al. (2018). Genome-wide analysis of BES1 genes in Gossypium revealed their evolutionary conserved roles in brassinosteroid signaling. Sci. China Life Sci. 61, 1566–1582. doi: 10.1007/s11427-018-9412-x
Livak, K. J., and Schmittgen, T. D. (2001). Analysis of relative gene expression data using real-time quantitative PCR and the 2−ΔΔCT method. Methods 25, 402–408. doi: 10.1006/meth.2001.1262
Lu, S., Wang, J., Chitsaz, F., Derbyshire, M. K., Geer, R. C., Gonzales, N. R., et al. (2020). CDD/SPARCLE: the conserved domain database in 2020. Nucleic Acids Res. 48, D265–D268. doi: 10.1093/nar/gkz991
Ma, C., Wang, Z. Q., Zhang, L. T., Sun, M. M., and Lin, T. B. (2014). Photosynthetic responses of wheat (Triticum aestivum L.) to combined effects of drought and exogenous methyl jasmonate. Photosynthetica 52, 377–385. doi: 10.1007/s11099-014-0041-x
Ma, D. Y., Sun, D. X., Wang, C. Y., Li, Y. G., and Guo, T. C. (2014). Expression of flavonoid biosynthesis genes and accumulation of flavonoid in wheat leaves in response to drought stress. Plant Physiol. Biochem. 80, 60–66. doi: 10.1016/j.plaphy.2014.03.024
Ma, J., Liu, F., Wang, Q. L., Wang, K. B., Jones, D. C., and Zhang, B. H. (2016). Comprehensive analysis of TCP transcription factors and their expression during cotton (Gossypium arboreum) fiber early development. Sci. Rep. 6:21535. doi: 10.1038/Srep21535
Ma, S. S., Gong, Q. Q., and Bohnert, H. J. (2006). Dissecting salt stress pathways. J. Exp. Bot. 57, 1097–1107. doi: 10.1093/jxb/erj098
Magwanga, R. O., Lu, P., Kirungu, J. N., Lu, H., Wang, X., Cai, X., et al. (2018). Characterization of the late embryogenesis abundant (LEA) proteins family and their role in drought stress tolerance in upland cotton. BMC Genet. 19:6. doi: 10.1186/s12863-017-0596-1
Marcussen, T., Sandve, S. R., Heier, L., Spannagl, M., Pfeifer, M., Jakobsen, K. S., et al. (2014). Ancient hybridizations among the ancestral genomes of bread wheat. Science 345:1250092. doi: 10.1126/Science.1250092
Marin, R. M., and Vanicek, J. (2011). Efficient use of accessibility in microRNA target prediction. Nucleic Acids Res. 39, 19–29. doi: 10.1093/nar/gkq768
Matus, J. T., Poupin, M. J., Canon, P., Bordeu, E., Alcalde, J. A., and Arce-Johnson, P. (2010). Isolation of WDR and bHLH genes related to flavonoid synthesis in grapevine (Vitis vinifera L.). Plant Mol. Biol. 72, 607–620. doi: 10.1007/s11103-010-9597-4
Muthusamy, M., Kim, J. Y., Yoon, E. K., Kim, J. A., and Lee, S. I. (2020). BrEXLB1, a Brassica rapa expansin-Like B1 gene is associated with root development, drought stress response, and seed germination. Genes 11:404. doi: 10.3390/Genes11040404
Nakashima, K., Ito, Y., and Yamaguchi-Shinozaki, K. (2009). Transcriptional regulatory networks in response to abiotic stresses in Arabidopsis and grasses. Plant Physiol. 149, 88–95. doi: 10.1104/pp.108.129791
Nawaz, Z., Kakar, K. U., Saand, M. A., and Shu, Q. Y. (2014). Cyclic nucleotide-gated ion channel gene family in rice, identification, characterization and experimental analysis of expression response to plant hormones, biotic and abiotic stresses. BMC Genomics 15:853. doi: 10.1186/1471-2164-15-853
Noben-Trauth, K., Naggert, J. K., North, M. A., and Nishina, P. M. (1996). A candidate gene for the mouse mutation tubby. Nature 380, 534–538. doi: 10.1038/380534a0
Pagliarani, C., Vitali, M., Ferrero, M., Vitulo, N., Incarbone, M., Lovisolo, C., et al. (2017). The accumulation of miRNAs differentially modulated by drought stress is affected by grafting in grapevine. Plant Physiol. 173, 2180–2195. doi: 10.1104/pp.16.01119
Paterson, A. H., Wendel, J. F., Gundlach, H., Guo, H., Jenkins, J., Jin, D., et al. (2012). Repeated polyploidization of Gossypium genomes and the evolution of spinnable cotton fibres. Nature 492, 423–427. doi: 10.1038/nature11798
Pei, H., Wang, H., Wang, L., Zheng, F., and Dong, C. H. (2017). Regulatory function of ethylene in plant responses to drought, cold, and salt stresses. Mech. Plant Horm. Signal. Under Stress 1, 327–344. doi: 10.1002/9781118889022.ch13
Pettersen, E. F., Goddard, T. D., Huang, C. C., Couch, G. S., Greenblatt, D. M., Meng, E. C., et al. (2004). UCSF chimera - a visualization system for exploratory research and analysis. J. Comput. Chem. 25, 1605–1612. doi: 10.1002/jcc.20084
Qanmber, G., Ali, F., Lu, L., Mo, H., Ma, S., Wang, Z., et al. (2019a). Identification of histone H3 (HH3) genes in Gossypium hirsutum revealed diverse expression during ovule development and stress responses. Genes 10:355. doi: 10.3390/genes10050355
Qanmber, G., Daoqian, Y. U., Jie, L. I., Lingling, W. A. N. G., Shuya, M. A., Lili, L. U., et al. (2018). Genome-wide identification and expression analysis of Gossypium RING-H2 finger E3 ligase genes revealed their roles in fiber development, and phytohormone and abiotic stress responses. J. Cotton Res. 1, 1–17. doi: 10.1186/s42397-018-0004-z
Qanmber, G., Lu, L., Liu, Z., Yu, D., Zhou, K., Huo, P., et al. (2019b). Genome-wide identification of GhAAI genes reveals that GhAAI66 triggers a phase transition to induce early flowering. J. Exp. Bot. 70, 4721–4736. doi: 10.1093/jxb/erz239
Qiao, X., Li, Q. H., Yin, H., Qi, K. J., Li, L. T., Wang, R. Z., et al. (2019). Gene duplication and evolution in recurring polyploidization-diploidization cycles in plants. Genome Biol. 20, 1–23. doi: 10.1186/s13059-019-1650-2
Rahman, A., Nahar, K., Hasanuzzaman, M., and Fujita, M. (2016). Calcium supplementation improves Na+/K+ ratio, antioxidant defense and glyoxalase systems in salt-stressed rice seedlings. Front. Plant Sci. 7:609. doi: 10.3389/fpls.2016.00609
Roy, S. W., and Gilbert, W. (2005). Complex early genes. Proc. Natl. Acad. Sci. U.S.A. 102, 1986–1991. doi: 10.1073/pnas.0408355101
Roy, S. W., and Gilbert, W. (2006). The evolution of spliceosomal introns: patterns, puzzles and progress. Nat. Rev. Genet. 7, 211–221. doi: 10.1038/nrg1807
Roy, S. W., and Penny, D. (2007). A very high fraction of unique intron positions in the intron-rich diatom Thalassiosira pseudonana indicates widespread intron gain. Mol. Biol. Evol. 24, 1447–1457. doi: 10.1093/molbev/msm048
Santagata, S., Boggon, T. J., Baird, C. L., Gomez, C. A., Zhao, J., Shan, W. S., et al. (2001). G-protein signaling through tubby proteins. Science 292, 2041–2050. doi: 10.1126/science.1061233
Schmieder, R., and Edwards, R. (2011). Quality control and preprocessing of metagenomic datasets. Bioinformatics 27, 863–864. doi: 10.1093/bioinformatics/btr026
Seifikalhor, M., Aliniaeifard, S., Shomali, A., Azad, N., Hassani, B., Lastochkina, O., et al. (2019). Calcium signaling and salt tolerance are diversely entwined in plants. Plant Signal. Behav. 14:1665455. doi: 10.1080/15592324.2019.1665455
Senchina, D. S., Alvarez, I., Cronn, R. C., Liu, B., Rong, J. K., Noyes, R. D., et al. (2003). Rate variation among nuclear genes and the age of polyploidy in Gossypium. Mol. Biol. Evol. 20, 633–643. doi: 10.1093/molbev/msg065
Shafiq, F., Batool, H., Raza, S. H., and Hameed, M. (2015). Effect of potassium nitrate seed priming on allometry of drought-stressed cotton (Gossypium hirsutum L.). J. Crop Sci. Biotechnol. 18, 195–204. doi: 10.1007/s12892-015-0035-7
Sharma, A., Kumar, V., Sidhu, G. P. S., Kumar, R., Kohli, S. K., Yadav, P., et al. (2019). “Abiotic stress management in plants: role of ethylene,” in Molecular Plant Abiotic Stress: Biology and Biotechnology, eds, Roychoudhury, A and Tripathi, D. (Hoboken, NJ: John Wiley & Sons) 185–208. doi: 10.1002/9781119463665.ch10
Shingote, P. R., Kawar, P. G., Pagariya, M. C., Kuhikar, R. S., Thorat, A. S., and Babu, K. H. (2015). SoMYB18, a sugarcane MYB transcription factor improves salt and dehydration tolerance in tobacco. Acta Physiol. Plant. 37, 1–12. doi: 10.1007/S11738-015-1961-1
Sinha, A. K., Jaggi, M., Raghuram, B., and Tuteja, N. (2011). Mitogen-activated protein kinase signaling in plants under abiotic stress. Plant Signal. Behav. 6, 196–203. doi: 10.4161/psb.6.2.14701
Smoot, M. E., Ono, K., Ruscheinski, J., Wang, P. L., and Ideker, T. (2011). Cytoscape 2.8: new features for data integration and network visualization. Bioinformatics 27, 431–432. doi: 10.1093/bioinformatics/btq675
Snyman, M. C., Solofoharivelo, M. C., Souza-Richards, R., Stephan, D., Murray, S., and Burger, J. T. (2017). The use of high-throughput small RNA sequencing reveals differentially expressed microRNAs in response to aster yellows phytoplasma-infection in Vitis vinifera cv. ‘Chardonnay’. PLoS ONE 12:e0182629. doi: 10.1371/journal.pone.0182629
Suyama, M., Torrents, D., and Bork, P. (2006). PAL2NAL: robust conversion of protein sequence alignments into the corresponding codon alignments. Nucleic Acids Res. 34, W609–W612. doi: 10.1093/nar/gkl315
Tanaka, K. M., Takahasi, K. R., and Takano-Shimizu, T. (2009). Enhanced fixation and preservation of a newly arisen duplicate gene by masking deleterious loss-of-function mutations. Genet. Res. 91, 267–280. doi: 10.1017/S0016672309000196
Tang, K., Dong, C. J., and Liu, J. Y. (2016). Genome-wide comparative analysis of the phospholipase D gene families among allotetraploid cotton and its diploid progenitors. PLoS ONE 11:e0156281. doi: 10.1371/journal.pone.0156281
Thimm, O., Blasing, O., Gibon, Y., Nagel, A., Meyer, S., Kruger, P., et al. (2004). MAPMAN: a user-driven tool to display genomics data sets onto diagrams of metabolic pathways and other biological processes. Plant J. 37, 914–939. doi: 10.1111/j.1365-313X.2004.02016.x
Trapnell, C., Roberts, A., Goff, L., Pertea, G., Kim, D., Kelley, D. R., et al. (2012). Differential gene and transcript expression analysis of RNA-seq experiments with TopHat and Cufflinks. Nat. Protoc. 7, 562–578. doi: 10.1038/nprot.2012.016
Wang, H., Zhao, S. C., Gao, Y. C., and Yang, J. L. (2017). Characterization of Dof transcription factors and their responses to osmotic stress in poplar (Populus trichocarpa). PLoS ONE 12:e0170210. doi: 10.1371/journal.pone.0170210
Wang, K. B., Wang, Z. W., Li, F. G., Ye, W. W., Wang, J. Y., Song, G. L., et al. (2012). The draft genome of a diploid cotton Gossypium raimondii. Nat. Genet. 44, 1098–1103. doi: 10.1038/ng.2371
Wang, M., Xu, Z., and Kong, Y. (2018). The tubby-like proteins kingdom in animals and plants. Gene 642, 16–25. doi: 10.1016/j.gene.2017.10.077
Wang, M. J., Tu, L. L., Lin, M., Lin, Z. X., Wang, P. C., Yang, Q. Y., et al. (2017). Asymmetric subgenome selection and cis-regulatory divergence during cotton domestication. Nat. Genet. 49, 579–587. doi: 10.1038/ng.3807
Wang, M. J., Tu, L. L., Yuan, D. J., Zhu, D., Shen, C., Li, J. Y., et al. (2019). Reference genome sequences of two cultivated allotetraploid cottons, Gossypium hirsutum and Gossypium barbadense. Nat. Genet. 51, 224–229. doi: 10.1038/s41588-018-0282-x
Wang, S., Bai, Y., Shen, C., Wu, Y., Zhang, S., Jiang, D., et al. (2010). Auxin-related gene families in abiotic stress response in Sorghum bicolor. Funct. Integr. Genomics 10, 533–546. doi: 10.1007/s10142-010-0174-3
Wang, Y. P., Tang, H. B., Debarry, J. D., Tan, X., Li, J. P., Wang, X. Y., et al. (2012). MCScanX: a toolkit for detection and evolutionary analysis of gene synteny and collinearity. Nucleic Acids Res. 40:e49. doi: 10.1093/nar/gkr1293
Wardhan, V., Jahan, K., Gupta, S., Chennareddy, S., Datta, A., Chakraborty, S., et al. (2012). Overexpression of CaTLP1, a putative transcription factor in chickpea (Cicer arietinum L.), promotes stress tolerance. Plant Mol. Biol. 79, 479–493. doi: 10.1007/s11103-012-9925-y
Wei, W., Huang, J., Hao, Y. J., Zou, H. F., Wang, H. W., Zhao, J. Y., et al. (2009). Soybean GmPHD-Type transcription regulators improve stress tolerance in transgenic Arabidopsis plants. PLoS ONE 4:e7209. doi: 10.1371/journal.pone.0007209
Wei, Y., Xu, Y., Lu, P., Wang, X., Li, Z., Cai, X., et al. (2017). Salt stress responsiveness of a wild cotton species (Gossypium klotzschianum) based on transcriptomic analysis. PLoS ONE 12:e0178313. doi: 10.1371/journal.pone.0178313
Wendel, J. F., and Cronn, R. C. (2003). Polyploidy and the evolutionary history of cotton. Adv. Agron. 78, 139–186. doi: 10.1016/S0065-2113(02)78004-8
Witkos, T. M., Koscianska, E., and Krzyzosiak, W. J. (2011). Practical aspects of microRNA target prediction. Curr. Mol. Med. 11, 93–109. doi: 10.2174/156652411794859250
Wu, H. L., Wu, X. L., Li, Z. H., Duan, L. S., and Zhang, M. C. (2012). Physiological evaluation of drought stress tolerance and recovery in cauliflower (Brassica oleracea L.) seedlings treated with methyl jasmonate and coronatine. J. Plant Growth Regul. 31, 113–123. doi: 10.1007/s00344-011-9224-x
Wu, R. H., Wang, L., Wang, Z., Shang, H. H., Liu, X., Zhu, Y., et al. (2009). Cloning and expression analysis of a dirigent protein gene from the resurrection plant Boea hygrometrica. Progr. Natur. Sci. Mater. Int. 19, 347–352. doi: 10.1016/j.pnsc.2008.07.010
Xu, J. N., Xing, S. S., Zhang, Z. R., Chen, X. S., and Wang, X. Y. (2016). Genome-wide identification and expression analysis of the Tubby-like protein family in the Malus domestica genome. Front. Plant Sci. 7:1693. doi: 10.3389/fpls.2016.01693
Yang, J. J., Zhang, G. Q., An, J., Li, Q. X., Chen, Y. H., Zhao, X. Y., et al. (2020). Expansin gene TaEXPA2 positively regulates drought tolerance in transgenic wheat (Triticum aestivum L.). Plant Sci. 298:110596. doi: 10.1016/j.plantsci.2020.110596
Yang, Q., Chen, Z. Z., Zhou, X. F., Yin, H. B., Li, X., Xin, X. F., et al. (2009). Overexpression of SOS (Salt Overly Sensitive) genes increases salt tolerance in transgenic Arabidopsis. Mol. Plant 2, 22–31. doi: 10.1093/mp/ssn058
Yang, S., Zhang, X., Yue, J. X., Tian, D., and Chen, J. Q. (2008). Recent duplications dominate NBS-encoding gene expansion in two woody species. Mol. Genet. Genomics 280, 187–198. doi: 10.1007/s00438-008-0355-0
Yang, Z., Qanmber, G., Wang, Z., Yang, Z., and Li, F. (2020a). Gossypium genomics: trends, scope, and utilization for cotton improvement. Trends Plant Sci. 25, 488–500. doi: 10.1016/j.tplants.2019.12.011
Yang, Z., Yang, X., Dong, S., Ge, Y., Zhang, X., Zhao, X., et al. (2020b). Overexpression of β-ketoacyl-CoA synthase from Vitis vinifera L. improves salt tolerance in Arabidopsis thaliana. Front. Plant Sci. 11:1687. doi: 10.3389/fpls.2020.564385
Yang, Z., Zhou, Y., Wang, X., Gu, S., Yu, J., Liang, G., et al. (2008). Genomewide comparative phylogenetic and molecular evolutionary analysis of tubby-like protein family in Arabidopsis, rice, and poplar. Genomics 92, 246–253. doi: 10.1016/j.ygeno.2008.06.001
Yu, C. S., Chen, Y. C., Lu, C. H., and Hwang, J. K. (2006). Prediction of protein subcellular localization. Proteins Struct. Funct. Bioinform. 64, 643–651. doi: 10.1002/prot.21018
Yu, J., Jung, S., Cheng, C. H., Ficklin, S. P., Lee, T., Zheng, P., et al. (2014). CottonGen: a genomics, genetics and breeding database for cotton research. Nucleic Acids Res. 42, D1229–1236. doi: 10.1093/nar/gkt1064
Yuan, J., Ruan, Y. Z., Wang, B. B., Zhang, J., Waseem, R., Huang, Q. W., et al. (2013). Plant growth-promoting rhizobacteria strain Bacillus amyloliquefaciens NJN-6-enriched bio-organic fertilizer suppressed fusarium wilt and promoted the growth of banana plants. J. Agric. Food Chem. 61, 3774–3780. doi: 10.1021/jf400038z
Zang, D., Li, H., Xu, H., Zhang, W., Zhang, Y., Shi, X., et al. (2016). An Arabidopsis zinc finger protein increases abiotic stress tolerance by regulating sodium and potassium homeostasis, reactive oxygen species scavenging and osmotic potential. Front. Plant Sci. 7:1272. doi: 10.3389/fpls.2016.01272
Zhang, L. C., Zhao, G. Y., Xia, C., Jia, J. Z., Liu, X., and Kong, X. Y. (2012). A wheat R2R3-MYB gene, TaMYB30-B, improves drought stress tolerance in transgenic Arabidopsis. J. Exp. Bot. 63, 5873–5885. doi: 10.1093/jxb/ers237
Zhang, T. Z., Hu, Y., Jiang, W. K., Fang, L., Guan, X. Y., Chen, J. D., et al. (2015). Sequencing of allotetraploid cotton (Gossypium hirsutum L. acc. TM-1) provides a resource for fiber improvement. Nat. Biotechnol. 33, 531–537. doi: 10.1038/nbt.3207
Zhang, Y., He, X., Su, D., Feng, Y., Zhao, H., Deng, H., et al. (2020). Comprehensive profiling of Tubby-like protein expression uncovers ripening-related TLP genes in tomato (Solanum lycopersicum). Int. J. Mol. Sci. 21:1000. doi: 10.3390/ijms21031000
Zhang, Z. X., Wei, L. Y., Zou, X. L., Tao, Y. S., Liu, Z. J., and Zheng, Y. L. (2008). Submergence-responsive microRNAs are potentially involved in the regulation of morphological and metabolic adaptations in maize root cells. Ann. Bot. 102, 509–519. doi: 10.1093/aob/mcn129
Zhu, Y. X., and Li, F. G. (2013). The Gossypium raimondii genome, a huge leap forward in cotton genomics. J. Integr. Plant Biol. 55, 570–571. doi: 10.1111/jipb.12076
Keywords: genome-wide analysis, transcription factor, expression, phylogenetic analysis, salt and drought stress responses, network
Citation: Bano N, Fakhrah S, Mohanty CS and Bag SK (2021) Genome-Wide Identification and Evolutionary Analysis of Gossypium Tubby-Like Protein (TLP) Gene Family and Expression Analyses During Salt and Drought Stress. Front. Plant Sci. 12:667929. doi: 10.3389/fpls.2021.667929
Received: 15 February 2021; Accepted: 09 June 2021;
Published: 21 July 2021.
Edited by:
Hong Zhang, Texas Tech University, United StatesReviewed by:
Zuo Ren Yang, Cotton Research Institute of Chinese Academy of Agricultural Sciences, ChinaXiyan Yang, Huazhong Agricultural University, China
Copyright © 2021 Bano, Fakhrah, Mohanty and Bag. This is an open-access article distributed under the terms of the Creative Commons Attribution License (CC BY). The use, distribution or reproduction in other forums is permitted, provided the original author(s) and the copyright owner(s) are credited and that the original publication in this journal is cited, in accordance with accepted academic practice. No use, distribution or reproduction is permitted which does not comply with these terms.
*Correspondence: Sumit Kumar Bag, c3VtaXQuYmFnQG5icmkucmVzLmlu