 Justine Laoué1*†
 Claire Depardieu1,2†
 Sébastien Gérardi1†
 Manuel Lamothe2†Claude Bomal2Aïda Azaiez1
 Marie-Claude Gros-Louis2Jérôme Laroche3
 Brian Boyle3
 Almuth Hammerbacher4
 Nathalie Isabel1,2†Jean Bousquet1*
- 1Canada Research Chair in Forest Genomics, Centre for Forest Research and Institute for Systems and Integrative Biology, Université Laval, Québec, QC, Canada
- 2Natural Resources Canada, Canadian Forest Service, Laurentian Forestry Centre, Québec, QC, Canada
- 3Institute for Systems and Integrative Biology, Université Laval, Québec, QC, Canada
- 4Department of Zoology, Entomology, Forestry and Agricultural Biotechnology Institute, University of Pretoria, Pretoria, South Africa
Conifer forests worldwide are becoming increasingly vulnerable to the effects of climate change. Although the production of phenolic compounds (PCs) has been shown to be modulated by biotic and abiotic stresses, the genetic basis underlying the variation in their constitutive production level remains poorly documented in conifers. We used QTL mapping and RNA-Seq to explore the complex polygenic network underlying the constitutive production of PCs in a white spruce (Picea glauca) full-sib family for 2 years. QTL detection was performed for nine PCs and differentially expressed genes (DEGs) were identified between individuals with high and low PC contents for five PCs exhibiting stable QTLs across time. A total of 17 QTLs were detected for eight metabolites, including one major QTL explaining up to 91.3% of the neolignan-2 variance. The RNA-Seq analysis highlighted 50 DEGs associated with phenylpropanoid biosynthesis, several key transcription factors, and a subset of 137 genes showing opposite expression patterns in individuals with high levels of the flavonoids gallocatechin and taxifolin glucoside. A total of 19 DEGs co-localized with QTLs. Our findings represent a significant step toward resolving the genomic architecture of PC production in spruce and facilitate the functional characterization of genes and transcriptional networks responsible for differences in constitutive production of PCs in conifers.
Introduction
Empirical evidence indicates that global warming will increase pressure on conifer forests via the intensification of drought events and the introduction of new insects and pathogens (Dale et al., 2001; Sturrock et al., 2011). As long-lived species, trees largely depend on their mechanical and chemical defenses to survive and reproduce (Davis and Shaw, 2001). Trees can protect themselves by producing secondary metabolites such as terpenes and phenolic compounds including flavonoids, monolignols, phenolic acids, stilbenes, and coumarins (Berini et al., 2018). The constitutive production of phenolic compounds (PCs) is usually thought to confer broad resistance to pathogens and abiotic factors in trees (Francheschi et al., 2005; Kessler, 2015). In spruces (Picea spp.), PCs are frequently associated with defense responses against pathogenic fungi (Brignolas et al., 1995; Hammerbacher et al., 2011, 2013, 2014) or pest insects (Brignolas et al., 1998; Faccoli and Schlyter, 2007; Delvas et al., 2011; Schiebe et al., 2012; Warren et al., 2015), and a recent study also highlighted their involvement in drought resistance in Picea abies (Schiop et al., 2017). Hence, PCs likely play a major role in climate adaptation in conifers. However, the genetic basis underlying their quantitative variation remains poorly understood (Ralph et al., 2006a; Warren et al., 2015), mainly due to the occurrence of large and complex gene families in conifers, combined with a limited knowledge of their functions (Hamberger and Bohlmann, 2006; Prunier et al., 2016).
The regulatory mechanism of phenylpropanoid biosynthesis is complex and involves several families of transcription factors (TFs) that regulate the expression of downstream genes (Yang et al., 2012). Recent advances showed that the PCs pathway in plants is also controlled at different branches by R2R3-MYB repressors (Cavallini et al., 2015; Ma and Constabel, 2019). The regulation of late biosynthetic anthocyanin and proanthocyanin genes is orchestrated by the ternary MBW complex, involving transcription factors from the R2R3-MYB, basic helix–loop–helix (bHLH) and WD40 classes (Xu et al., 2015; Ma et al., 2018). Although the MBW network is evolutionary conserved in plants (Ramsay and Glover, 2005), the considerable expansion of TF families in plant lineages (Feller et al., 2011) could lead to functionally divergent genes between angiosperms and gymnosperms. The complex regulatory system of PCs metabolism, i.e., genes and their networks of interactions, remains largely undeciphered in conifer species. Recent work evidenced protein-protein interactions among different MYB, bHLH and WDR (Nemesio-Gorriz et al., 2017) and NAC gene family (Dalman et al., 2017) in Norway spruce, while other studies identified a variety of gene families (Hamberger and Bohlmann, 2006; Ralph et al., 2006a; Warren et al., 2015), genes (Celedon et al., 2017) and transcription factors (Bomal et al., 2008; Bedon et al., 2010; Deng and Lu, 2017) playing a role in the regulation of PC pathway.
The majority of PC traits are known to be predominantly polygenic (Külheim et al., 2011; Francisco et al., 2016; Ganthaler et al., 2017), hence the need to deploy genome-wide approaches to study their synthesis. Quantitative trait loci (QTL) mapping was used successfully to uncover the genetic architecture of PCs production in crops (Li et al., 2016; Czyczyło-Mysza et al., 2019) and tree species (Verdu et al., 2014; Caseys et al., 2015). QTL analyses have also been successfully conducted in the Pinaceae, using traits relative to growth and phenology (Pelgas et al., 2011; Prunier et al., 2013) and biotic stress resistance (Porth et al., 2012; Lind et al., 2014). However, these analyses suffer from low resolution in conifers because of the low density of genetic linkage maps currently available and because of the considerable time and resources needed to grow, phenotype and genotype progenies. Recently, several studies in angiosperms showed that combining QTL mapping and transcriptome profiling is a robust approach to identify candidate genes underlying complex traits (Xu et al., 2015; Ye et al., 2017; Zhang et al., 2017; Jian et al., 2019). Transcriptome profiling can be used in combination with genetic mapping to narrow down the number of candidate genes identified by QTL and pointing out key genes involved in the mechanisms of interest. Hence, we used a similar approach to identify key genes involved in the PC pathway in white spruce [Picea glauca (Moench) Voss], a conifer species with high genome complexity and for which considerable genomic resources such as a draft genome sequences (Birol et al., 2013; Warren et al., 2015), an annotated expressed gene catalog (Rigault et al., 2011), high-throughput genotyping arrays (Pavy et al., 2013), and a high-density genetic linkage map (Pavy et al., 2017) are currently available.
In this study, we first conducted QTL mapping to assess the genomic architecture of the constitutive production of nine candidate PCs in a white spruce full-sib family. Three flavonoids, one neolignan and one stilbenoid, for which we identified QTLs stable across 2 years of measurement, were further analyzed with RNA-Seq in order to identify key genes involved in the regulatory network of PC metabolism. Differentially expressed genes (DEGs) among individuals displaying contrasting phenotypes (high vs. low metabolite content) were identified and compared with genes located in QTLs.
Materials and Methods
Workflow
In this study, QTL and RNA-Seq approaches were used to identify genes involved in the metabolism of nine PCs in a random subset of 1,976 siblings previously used to produce a high-resolution genetic map for white spruce (Pavy et al., 2017). The nine PCs, all related to various biotic and abiotic stress responses in spruce species as well as in other plants (Table 1), were quantified for 164 and 202 siblings in two different years (Figure 1). QTL analyses were conducted with phenotypes obtained for the same progeny used for genetic mapping. From there, five metabolites showed a significant underlying genetic component for both years of assessment and were deemed of prime interest to be further investigated at the transcriptomic level using an RNA-Seq approach. For each of these metabolites, at least 20 siblings presenting contrasting phenotypes (i.e., highest and lowest metabolite content) were selected for individual transcriptome profiling and analyzed to highlight sets of differentially expressed genes.
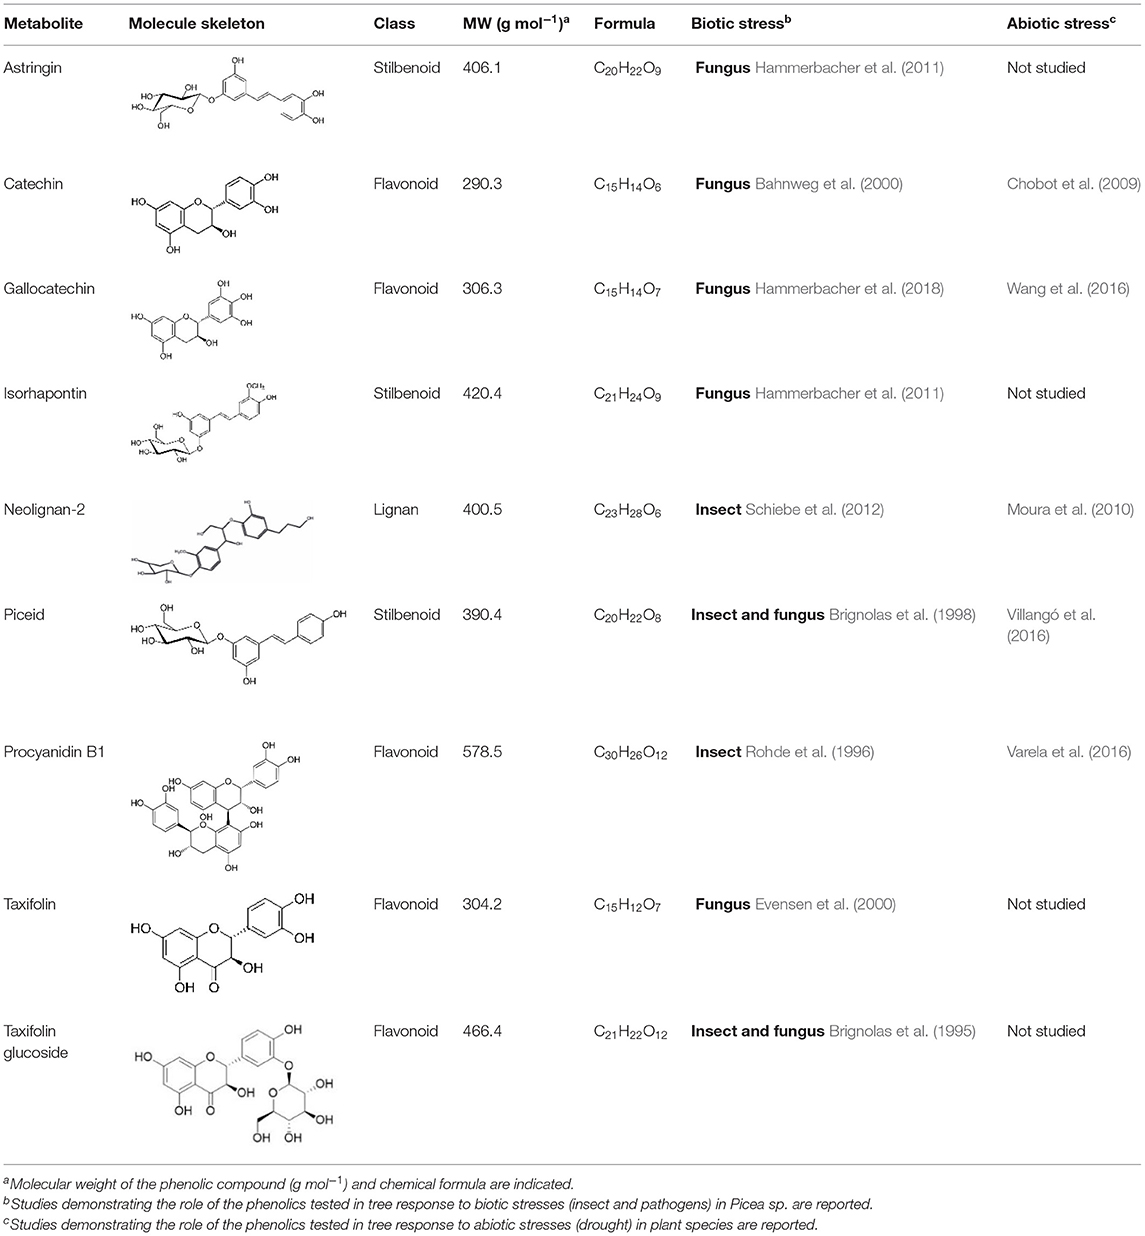
Table 1. Bark phenolic compounds analyzed in a white spruce full-sib family.
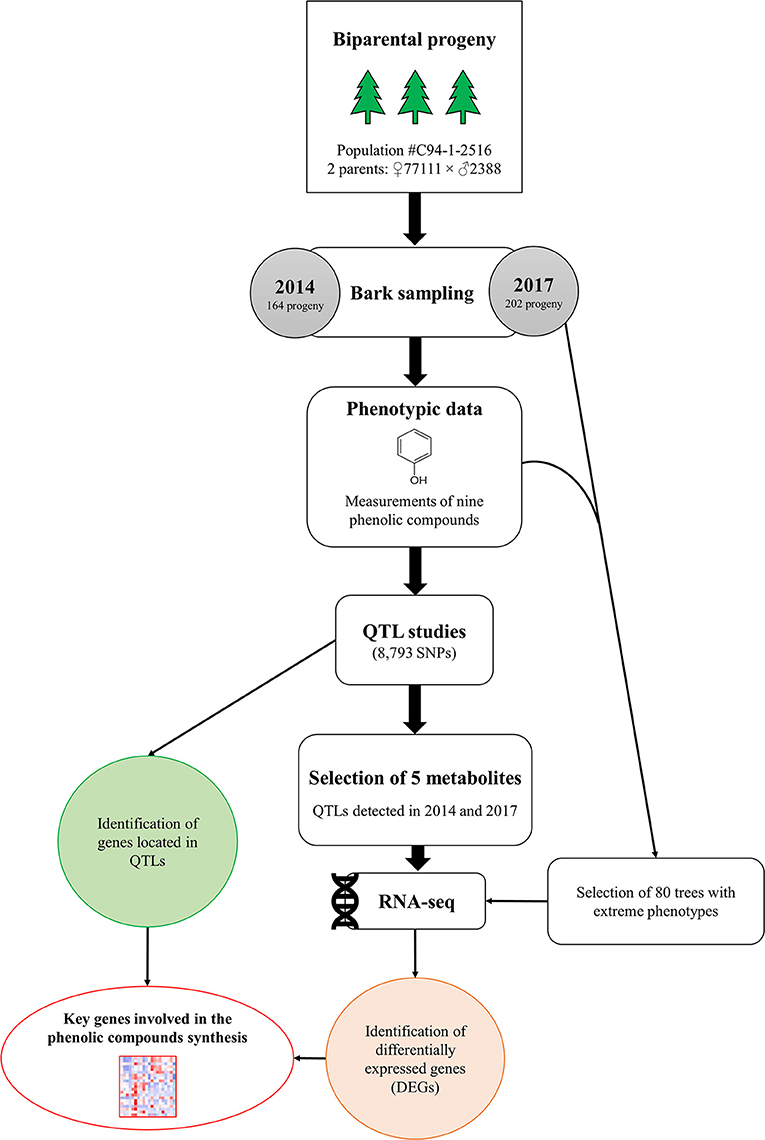
Figure 1. Schematic representation of experimental design. Bark samples were collected from 164 to 202 white spruce siblings in 2014 and 2017, respectively. QTL analyses were performed on nine phenolic compounds for both years. For five metabolites, RNA sequencing was conducted on a subset of individuals displaying high vs. low metabolite contents in 2017. For each of the five metabolites, differentially expressed genes (DEGs) among groups of individuals displaying contrasting phenotypes were identified.
Plant Material and Phenotypic Data Measurements
Twigs were collected on 164 and 202 full-sib siblings in August 2014 (age 15) and August 2017 (age 18), respectively, from a QTL mapping population previously used in several studies (cross C94-1-2516 between ♀77111 × ♂2388; Figure 1; see Pelgas et al., 2011; Pavy et al., 2012, 2017) and raised in a common garden located in Saint-Antonin, Québec (47°45N; 69°28 W). Seventy-nine siblings were common to both sampling years. Twigs (3-4 copies each) corresponding to the two parents originally crossed were also sampled in August 2015, 2016, and 2017 at the Cap-Tourmente Arboretum of Natural Resources Canada, Québec (47°05 N; −70°47 W). All sampled trees were originally produced from grafted material with a normal growth. For each tree, current-year twigs (18 cm long) were collected at breast height on the same side. Each sample was cut longitudinally with a razor blade to separate the woody inner stem tissues, the pith, from the bark tissues. Each sample was then cut into two parts, immediately frozen in liquid nitrogen, and stored at−80°C until further use: one part for metabolite quantification and the other one for transcriptomic analyses.
Metabolite Quantification: Extraction of Phenolic Compounds
Extraction of PCs, namely astringin, catechin, gallocatechin, isorhapontin, 4-[1,3-dihydroxy-2-[2-hydroxy-4-(3-hydroxypropyl)phenoxy]propyl]-β-D-xylopyranoside (neolignan-2; Supplementary Figure 1), piceid, procyanidin B1, taxifolin and taxifolin glucoside, was performed at the Max Planck Institute in Germany. Briefly, PCs were extracted from ground bark samples and quantified by LC-tandem mass spectrometry on an Agilent 1200 HPLC system (Agilent, Santa Clara, CA, United States) coupled to an API 3200 mass analyzer (Sciex, Darmstadt, Germany). Analyst v1.5 software (Applied Biosystems) was used for data acquisition and processing. Linearity of metabolite detection for quantification was verified by external calibration curves for catechin, taxifolin, astringin and procyanidin B1. Other metabolite concentrations were determined relative to the calibration curve of the metabolite most closely resembling it. Detailed procedures are given in Supplementary Methods 1 in Supplementary Material. Descriptive statistics and phenotypic distributions of metabolites are reported in Supplementary Table 1 and Supplementary Figure 2. Pairwise correlations between metabolite concentrations measured in 2014 and 2017 were calculated with the software R 3.5 (R Core Team, 2013) using the rcor function in the Hmisc R package (Harrell, 2014).
QTL Analyses
QTL analyses were conducted in order to identify genomic regions accounting for variation in metabolite concentrations among siblings and underlying candidate genes putatively carrying causal variants. QTLs detection was performed for the nine PCs investigated (Table 1). Data were analyzed on a yearly basis using the two parental linkage maps consisting in 2,774 (female) and 2,308 (male) high-quality SNPs mapping in as many separated genetic bins (see details in Pavy et al., 2017), resulting in four distinct QTL analyses per metabolite. All individuals included herein were part of the progeny originally used to generate the consensus linkage map consisting of 8,793 distinct gene loci (Pavy et al., 2017). QTL analyses were conducted with the software MapQTL v6.0 (van Ooijen and Kyazma, 2009), using interval mapping, which is a robust method against deviations from normality (van Ooijen and Kyazma, 2009). A QTL with a LOD score ≥ 3.1 was considered significant (P < 0.05 based on 1,000 genome-wide permutations of the markers). QTLs detected on each parental map were then positioned on the consensus map. Genes within 1 LOD of either side of the QTL peak were considered as candidate genes. Given the extremely high LOD score associated with neolignan-2 QTL, the window was expanded to 15 cM, which corresponded to the average window size of other significant QTLs detected in this study.
RNA-Seq Experiment
QTL analyses revealed that five metabolites, namely gallocatechin, neolignan-2, piceid, procyanidin B1 and taxifolin glucoside, had significant QTLs across both years surveyed (Figure 1). The expression of genes involved in the biosynthesis of those five metabolites were further investigated using RNA-Seq to identify sets of differentially expressed genes (DEGs) between two groups of individuals that showed contrasting concentrations of metabolites. Out of the 202 siblings collected in 2017, we selected 80 individuals showing high or low concentrations in gallocatechin, piceid, procyanidin B1 and taxifolin glucoside metabolites (Figure 1), some of them showing extreme phenotypes for more than one metabolite. The transcriptomic profiles of 20 phenotypically divergent individuals per PC (10 high-metabolite content vs. 10 low-metabolite content individuals) were then compared. Since the neolignan-2 displayed a bimodal distribution of concentrations (Figure 2), each of the two contrasted groups of individuals included 35 siblings instead of 10.
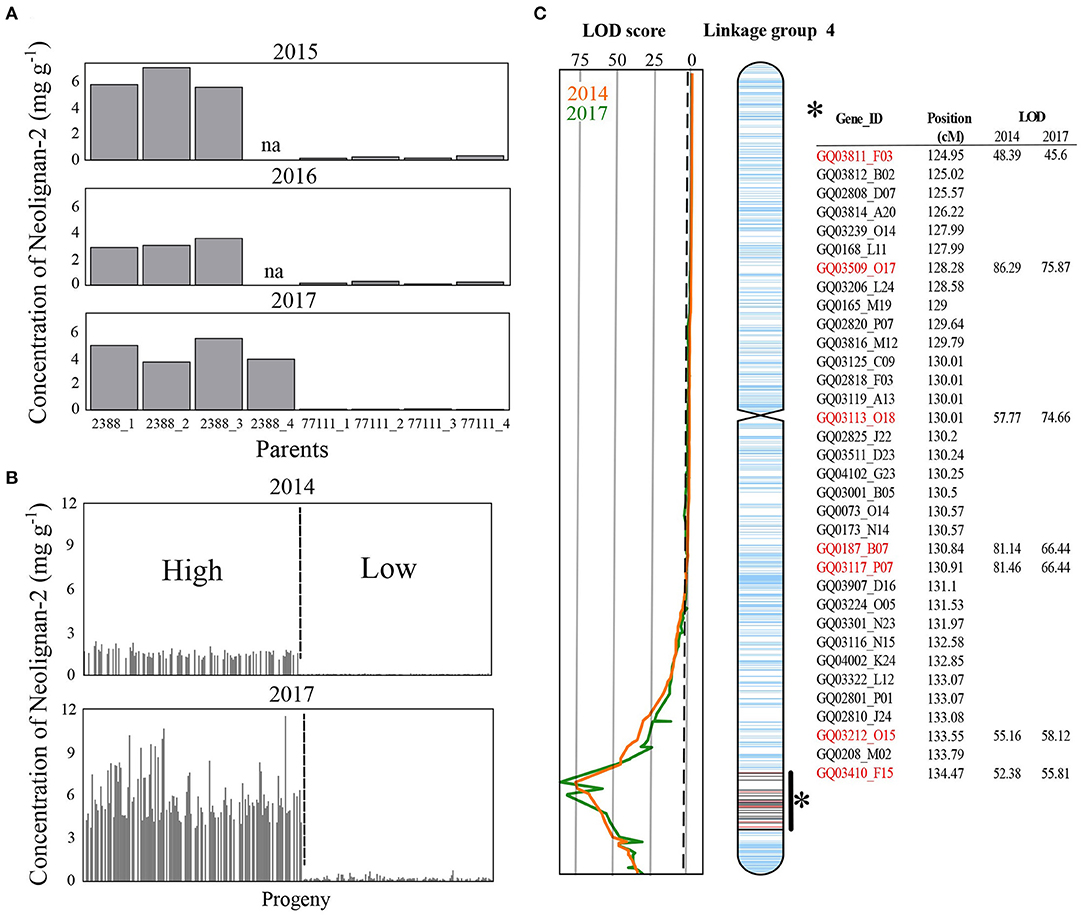
Figure 2. Metabolite concentrations and QTL mapping for neolignan-2. Concentrations of neolignan-2 obtained (A) from grafted material (3–4 ramets) corresponding to both parents (♀77111, ♂2388) sampled in August 2015, 2016, and 2017, and (B) from 164 and 202 siblings sampled in August 2014 and 2017, respectively. (C) Linkage map of the white spruce progeny showing location of the putative QTLs with LOD score for neolignan-2 in 2014 (orange line) and 2017 (green line). The peak LOD score reached 75.87 and 86.29 in 2014 and 2017, respectively. The vertical dotted line indicates the threshold for significant linkages of the LOD scores (i.e., 3.1). Ticks on the chromosome represent mapped genes according to Pavy et al. (2017). Within the QTL interval, red and black ticks are genes for which markers were detected for ♂2388 and ♀77111, respectively.
RNA Extraction, Libraries Preparation and Sequencing
For the 80 individuals selected for RNA-Seq, total RNA was isolated from frozen bark tissues following the method of Chang et al. (1993), with the protocol modifications described in Pavy et al. (2008), as detailed in Supplementary Methods 2 in Supplementary Material. For each sibling, a cDNA library was generated from 1 μg of total RNA using the KAPA stranded mRNA-Seq Kit (KAPA Biosystems, Roche Sequencing solutions, Canada). This kit contains all buffers and enzymes required for the poly(A) mRNA capture and the construction of stranded mRNA-Seq libraries of 100 ng−4 μg of intact total RNA. A PCR of 13 cycles was then performed for each cDNA library having a specific adapter (Illumina TruSeq HT). The quality of total RNA was assessed using the Agilent 2100 Bioanalyzer with RNA 6000 Nano LabChips (Agilent Technologies Inc, Santa Clara, CA, USA) and RNA concentration was determined with a Nanodrop 1000 spectrophotometer (Thermo Fisher Scientific, Wilmington, DE, U.S.A). For all samples, RNA concentration exceeded 100 ng μl−1 and RNA Integrity Number (RIN) exceeded 7.8. Libraries were first tagged individually, and then merged into a single sequencing pool at equimolar concentrations. The pool was sequenced at McGill University and Genome Quebec Innovation Center (Montreal, Quebec, Canada) using two lanes of Illumina NovaSeq 6000 S2 PE100.
Pre-processing and Differential Gene Expression Analyses
For each of the five metabolites tested, gene expression was compared between groups of individuals showing high and low PC contents. Quality of raw sequence data was first checked using FASTQC v0.11.2 (Andrews et al., 2014) for each sibling sequenced. Adapter sequences were trimmed using Cutadapt (Martin, 2011) and checked again with FASTQC v0.11.2 to ensure proper trimming. For each metabolite, reads of individuals making up the high and low PC content groups were pooled. High-quality reads were then aligned against the most recent version of the white spruce reference transcriptome (Rigault et al., 2011) using Salmon v0.11.0 with the following options: –Gcbias, –seqBias, –validatingMappings and minScoreFraction (0.8) (Patro et al., 2017).
Read counts were further normalized using the DESeq2 Bioconductor package in R (Anders and Huber, 2010; Love et al., 2014). Differential gene expression analyses were then carried out using the default pipeline implemented in the function “DESeq.” The DEGs were then determined using a threshold of < 0.05 (adjusted p-value after applying the Benjamini-Hochberg's multiple-testing correction; Benjamini and Hochberg, 1995). Expression level of DEGs was further classified as high (log2fc ≥ 1) or low (log2fc ≤ −1) according to the log2 fold change values (log2fc) obtained when comparing expression in high vs. low metabolite content individuals. DEGs with a total read count lower than 10 were discarded. Venn diagrams were plotted to highlight unique and shared DEGs among metabolites using a bio-analytic web tool (http://bioinformatics.psb.ugent.be/webtools/Venn/).
Functional Characterization and Enrichment Tests of Differentially Expressed Genes
Using the BLAST2GO PRO suite (Gotz et al., 2008), functional annotations of the DEGs were retrieved by performing a BLASTX search against the RefSeq database (RefSeq release 91, using a cut-off e-value of ≤10−10). Homologous protein domains from translated sequences were then identified by searching against the Interpro database. GO annotations (molecular functions and biological processes) were obtained for each DEG and slimmed down into the more general GO plant slim terms. For each metabolite, enrichment tests were performed by comparing GO associated with DEGs with those associated with the full set of expressed genes, using Fisher's exact tests (P < 0.05) in the BLAST2GO PRO suite. The transcription factor database PlantRegMap/PlantTFDB v5.0 was used to identify potential transcription factors among DEGs (TFs; http://planttfdb.cbi.pku.edu.cn/; Jin et al., 2017; Tian et al., 2020). Finally, DEG functions were visualized in MapMan v3.5.1 (Thimm et al., 2004) using DEG mapping files generated by Mercator (v3.6; Lohse et al., 2014). MapMan classifies genes into various relevant functional categories, also referred as BIN classes herein.
Results
Variation in Phenolic Compounds and Correlations
The nine PCs examined in this study belonged to the flavonoid, the stilbenoid, and the lignan biosynthesis pathways (Table 1). Astringin and isorhapontin were the most abundant metabolites (62.35 and 22.20 mg g−1 DW, respectively), followed by taxifolin (12.55 mg g−1 DW). The other PCs were relatively less abundant, with concentrations <3.28 mg g−1 DW (Supplementary Table 1). All metabolites followed a unimodal and continuous distribution (Supplementary Figure 2), except for neolignan-2, which displayed a clear bimodal distribution in parents (Figure 2A) and progeny (Figure 2B), suggesting the possibility of a major gene effect.
Most metabolite concentrations within individuals were positively correlated (Figure 3). An exception was found for gallocatechin and taxifolin glucoside, which appeared negatively correlated in 2014 (Figure 3). As a general trend, PCs synthesized from the same biosynthetic pathway were most highly correlated, as observed for the two stilbenoids astringin and piceid (r = 0.60 in 2014 and r = 0.70 in 2017), and for the flavonoids catechin and procyanidin B1 (r > 0.73). However, one other exception was the strong correlation between piceid (a stilbenoid) and catechin (a flavonoid) (r > 0.78 in 2017). The concentration of neolignan-2 only moderately correlated with other metabolites (0.14 < r < 0.36), but variations in concentration among individuals were stable across time (r = 0.94, P < 0.05; based on the 79 individuals measured in both years; data not shown).
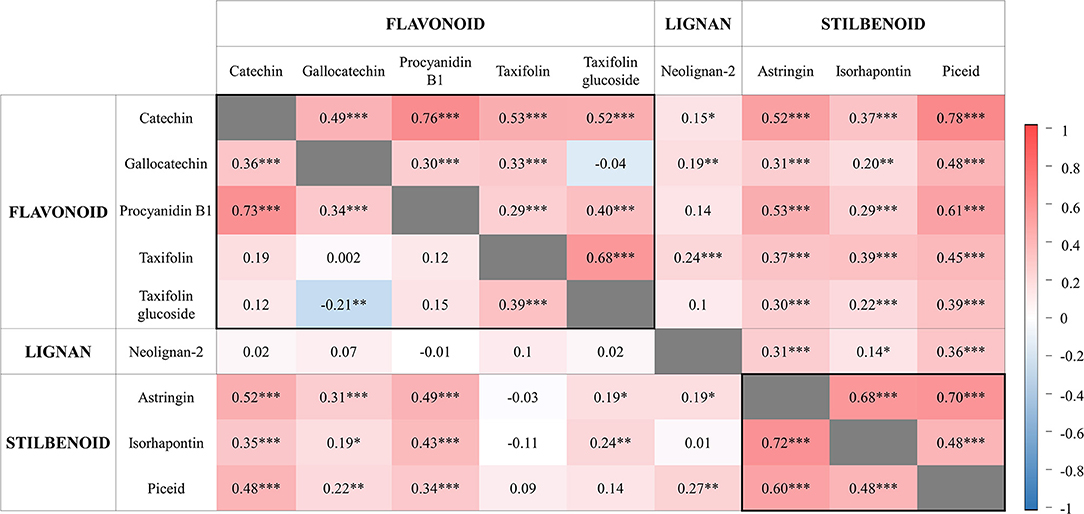
Figure 3. Pairwise correlations between phenolic compounds contents measured in 2014 (bottom left; 164 siblings) and 2017 (top right; 202 siblings). Metabolites are classified into three major classes. The scale bar reports positive (red) and negative (blue) correlations. For each phenotypic correlation, the correlation coefficient and significance level are indicated. Levels of significance are as follows: *P < 0.05, **P < 0.01, and ***P < 0.001.
QTL Analyses
A total of 17 significant QTLs (LOD score ≥ 3.1) were detected for eight of the nine metabolites tested (Table 2). Individual QTLs included between 23 and 160 genes, resulting in a list of 871 unique candidate genes (Supplementary Table 2). QTLs for astringin, catechin and taxifolin were only detected from 2017 data (Table 2). Significant QTLs for gallocatechin, neolignan-2, piceid, and procyanidin B1 were observed for both years on at least one co-localizing region of a unique parent. In addition, two distinct QTLs were detected for taxifolin glucoside in 2014 and 2017, on different parents and genomic regions. The phenotypic variance explained (PVE) by single QTLs ranged between 8.0% (which is approximately corresponding to the genome-wide significance threshold for this experiment) and 91.3%. Interestingly, very high LOD scores (86.3 and 75.9) and PVE values (91.3 and 82.4%) were obtained for the only QTL detected for neolignan-2 in both years (Table 2; Figure 2C). Those observations highlight the occurrence of a genetic effect with strong impact on this phenotype on linkage group 4 (Figure 2C). Overall, QTLs were located on seven out of the 12 linkage groups (LG), corresponding to the 12 chromosomes of white spruce. Co-localization of QTLs for both years of measurement was observed for four PC (gallocatechin on LG8; neolignan-2 and piceid on LG4; and procyanidin B1 on LG1). This indicates that genotype-phenotype linkages were robust to inter-annual climate variations, which strengthen the involvement of these regions in the control of the studied phenotypes. These compounds were thus selected for transcriptomic analysis along with taxifolin glucoside, for which QTLs were detected for both years of measurement, but on different parents (Table 2; Figure 1).
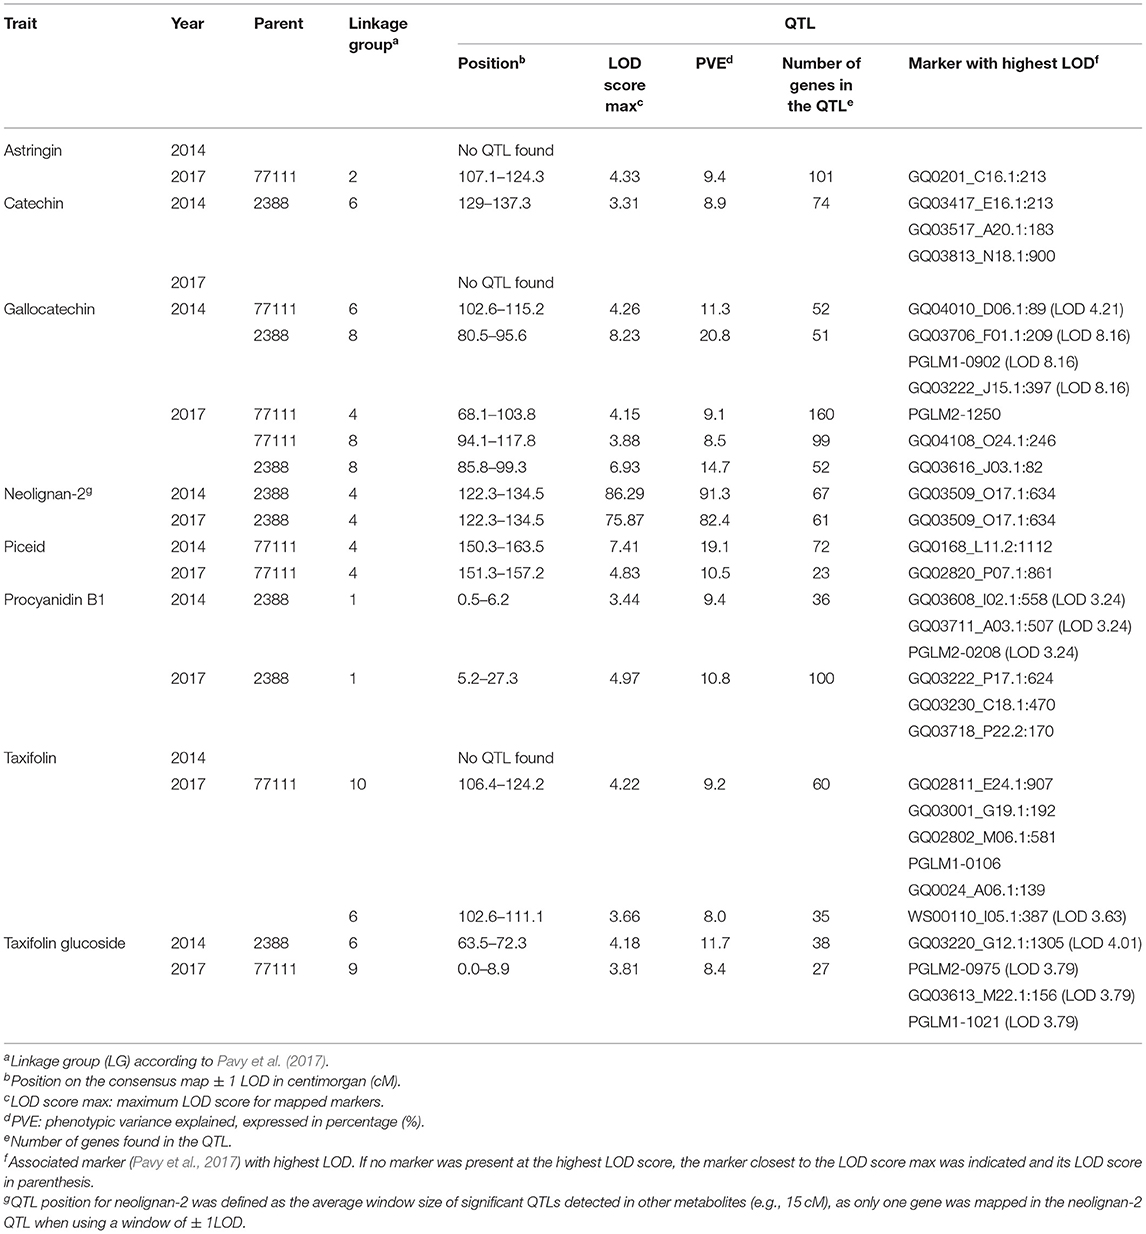
Table 2. Summary statistics of significant QTLs (LOD score ≥ 3.1) detected for eight phenolic compounds in the C94-1-2516 white spruce full-sib family in 2014 and 2017.
The functional annotation of genes located within QTL regions relied on BLAST2GO annotations, GO terms classification, and protein family signatures. While most QTL genes had no known direct role in the phenylpropanoid pathway, we found two genes previously reported as involved in the PC biosynthesis in Picea abies, namely a leucoanthocyanidin reductase-like gene (LAR; GQ03701_M12) for procyanidin B1, and a flavonoid 3′,5′-hydroxylase 2-like gene (F3′5′H; GQ03712_G11) for taxifolin glucoside (Supplementary Table 2).
Relative Functions of Differentially Expressed Genes Between Groups of High and Low PC Content Individuals
The five selected metabolites (gallocatechin, neolignan-2, piceid, procyanidin B1, and taxifolin glucoside) were further investigated using RNA-Seq to compare the transcriptomic profiles of individuals showing contrasting phenotypes (high vs. low metabolite concentrations for each PC). A summary of RNA-Seq statistics is presented in Supplementary Table 3. A total of 603 unique DEGs were identified at a rate of 3 to 372 DEGs per metabolite (Figure 4A; Supplementary Table 4). DEGs overlap among metabolites was very limited to non-existent, except for gallocatechin and taxifolin glucoside, which shared 137 DEGs (Figure 4B). Except for one gene, these DEGs showed higher expression in high taxifolin glucoside content individuals and lower expression in high gallocatechin content individuals (Figure 4C). Among the 603 DEGs, 436 were successfully annotated with a GO term associated to molecular functions and biological processes (Supplementary Figure 3). The GO enrichment analyses revealed that DEGs were particularly overrepresented in monosaccharide metabolic (2.5%), secondary metabolic (1.9%) and phenylpropanoid metabolic (1.9%) processes (Supplementary Figure 3). Overrepresented molecular functions included stress-related functions such as catalytic (59.2%), oxidoreductase (16.8%), lyase (7.6%), and transferase (5.7%) activities, and functions related to the phenylpropanoid pathway such as UDP-glycosyltransferase and O-methyltransferase activities (Supplementary Figure 3).
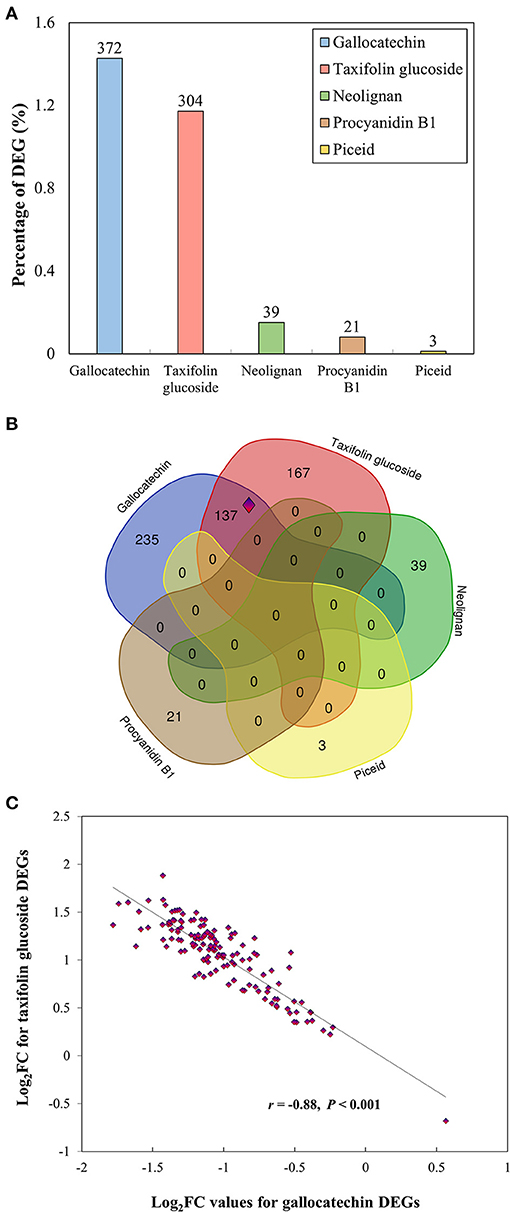
Figure 4. Results of differential expression analyses for five phenolic compounds. (A) Proportion of differentially expressed genes (DEGs) among groups of individuals displaying contrasting phenotypes, for each metabolite. The proportion of DEGs was calculated as the number of DEGs divided by the total number of genes expressed. The number of DEGs is reported above the bars. (B) Venn diagrams showing the overlap among the 603 DEGs identified for all five metabolites. The set of 137 genes shared between gallocatechin and taxifolin glucoside (surrounded by a blue and red diamond) is further presented in panel (c). (C) Opposite expression profiles of the 137 genes shared between gallocatechin and taxifolin glucoside. The log fold changes of DEGs identified for taxifolin glucoside are plotted against log fold changes of DEGs identified for gallocatechin. The correlation coefficient and p-values are reported. Log2FC: log2 fold change.
MapMan analyses were conducted to classify DEGs into relevant functional bins (or functional categories; Supplementary Figure 4; Supplementary Table 5). DEGs were assigned to 29 functional bins. While an important proportion of the 603 DEGs were not assigned (37%), a significant proportion of DEGs was related to secondary metabolism (8.9%), stress (5.9%) and signaling (5%) (Supplementary Figure 4). The stress-related genes included 20 unique DEGs involved in abiotic stress response (Figure 5A). The most relevant functions associated to the 144 unique DEGs involved in biotic stress response included pathogenesis-related (PR) proteins, heat shock proteins, transcription factors as well as various genes involved in hormone signaling and defense (Figure 5A). The 59 defense-related DEGs identified by MapMan (Figure 5A) included 11 putative PR-proteins, and 48 genes involved in secondary metabolism, among which 36 genes were involved in the shikimate/phenylpropanoid pathway (Figure 5B).
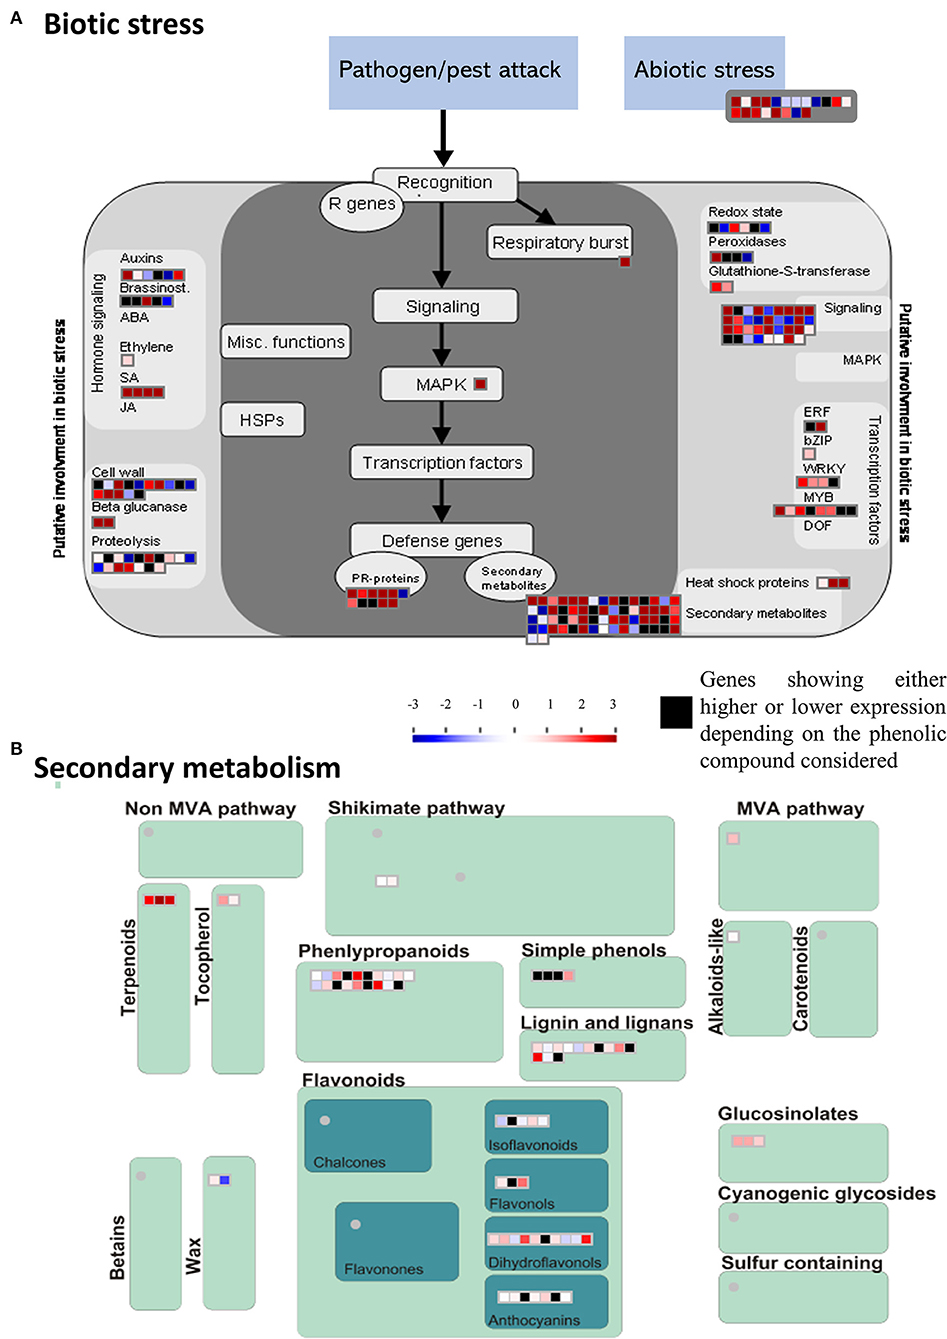
Figure 5. MapMan-based classification of differentially expressed genes (DEGs) involved in stress responses. (A) Expression profiles of DEGs involved in biotic and abiotic stresses. (B) Expression profiles of DEGs involved in secondary metabolism. The scale bar represents positive (red) and negative (blue) regulation of gene expression based on log2fc scores. Black squares represent genes that were either high or low expressed depending on the phenolic compound considered.
Identification of Candidate Genes Specifically Associated to the Phenylpropanoid Pathway
For all metabolites considered, the combination of MapMan classification and Blast2GO functional annotations allowed for the identification of 50 DEGs involved in the phenylpropanoid pathway associated with monophenols, phenylpropanoids, flavonoids, as well as lignins and lignans metabolism (Table 3; Figure 5B). From this subset, 31 and 30 DEGs were respectively associated to gallocatechin and taxifolin glucoside, including 15 genes shared between the two DEG sets. In addition, four other genes were associated with neolignan-2 and procyanidin B1. For all metabolites, the most represented gene families were the putative dirigent proteins (DIR) (9 genes), laccases (7 genes) and plant peroxidases (6 genes) (Table 3). Among the 50 DEGs identified, 36 DEGs were differentially expressed between the groups of high and low PC content individuals. A large proportion of putative DIR showed higher expression, with three genes associated with taxifolin glucoside (GQ03808_J11, GQ03806_D05, GQ03307_E08), two with gallocatechin (GQ036606_J07, GQ03815_M16), one with neolignan-2 (WS00740_J05) and one with procyanidin B1 (GQ01301_K10). Two DIR showing lower expression were detected for gallocatechin (GQ03806_D05, GQ03803_O03). Most laccases associated to the phenylpropanoid pathway were also differentially expressed, with four highly expressed and three lower expressed genes in individuals with high taxifolin glucoside and high gallocatechin content, respectively. In addition, three putative peroxidases (GQ0202_L09, GQ03322_C02, GQ02016_E21), two O-methyltransferases (WS00740_E09, GQ03507_F11), one cytochrome P450 (WS00736_D10) and one NmrA-like (GQ03009_B07) putative protein showed higher expression in high taxifolin glucoside content individuals.
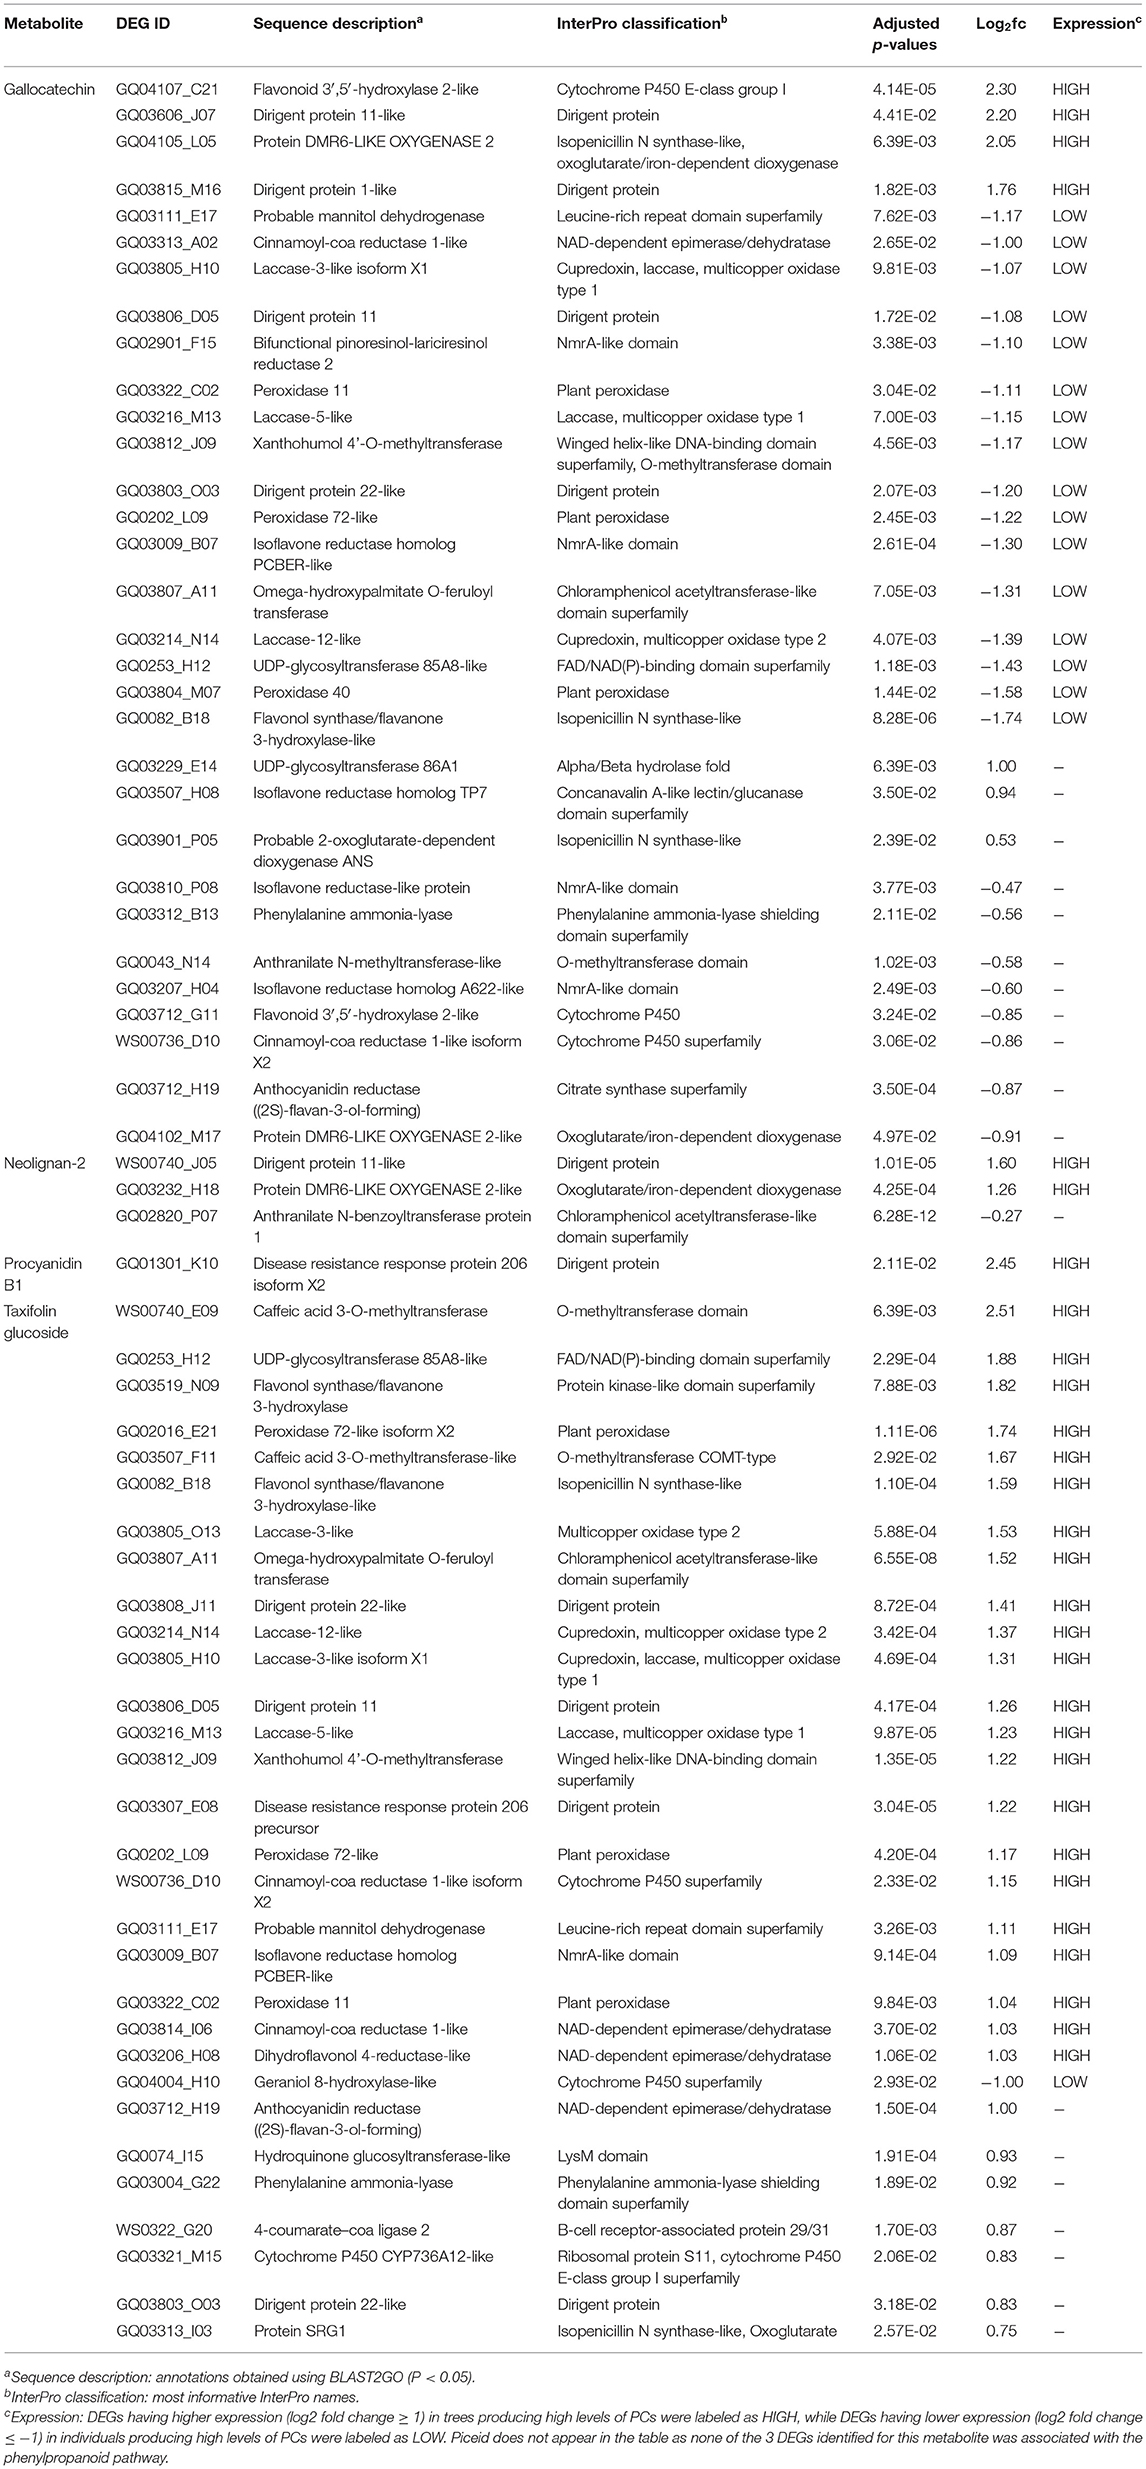
Table 3. List of differentially expressed genes (DEGs; adjusted P < 0.05) involved in phenolic compounds metabolism.
In this study, genes known to be involved in the phenylpropanoid pathway in white spruce or other plant species, and genes that were found differentially expressed were designated as key genes. Among the 50 DEGs associated to the phenylpropanoid pathway (Table 3), we identified five key DEGs, namely the 4-coumarate-CoA ligase (4CL), the phenylalanine ammonia-lyase (PAL), cinnamoyl-CoA reductase (CCR), p-coumaroyl shikimate/quinate 3′–hydroxylase (C3H) and caffeic O-methyltransferase (COMT) (Figure 6). Six other key enzymes were associated specifically to the flavonoid pathway, and included the flavonol synthase (FLS), the UDP-dependent glucosyl transferase (UGT), the flavonoid 3′5′-hydroxylase (F3′5′H - CYP75A), the bifunctional dihydroflavonol 4-reductase/flavanone 4-reductase (DFR), the leucoanthocyanidin reductase (LAR) and the anthocyanidin reductase (ANR) (Figure 6). It should be noted that FLS, UGT and F3H displayed opposite gene expression patterns in individuals producing high levels of taxifolin glucoside, compared to those producing high levels of gallocatechin (see Supplementary Table 4 for details).
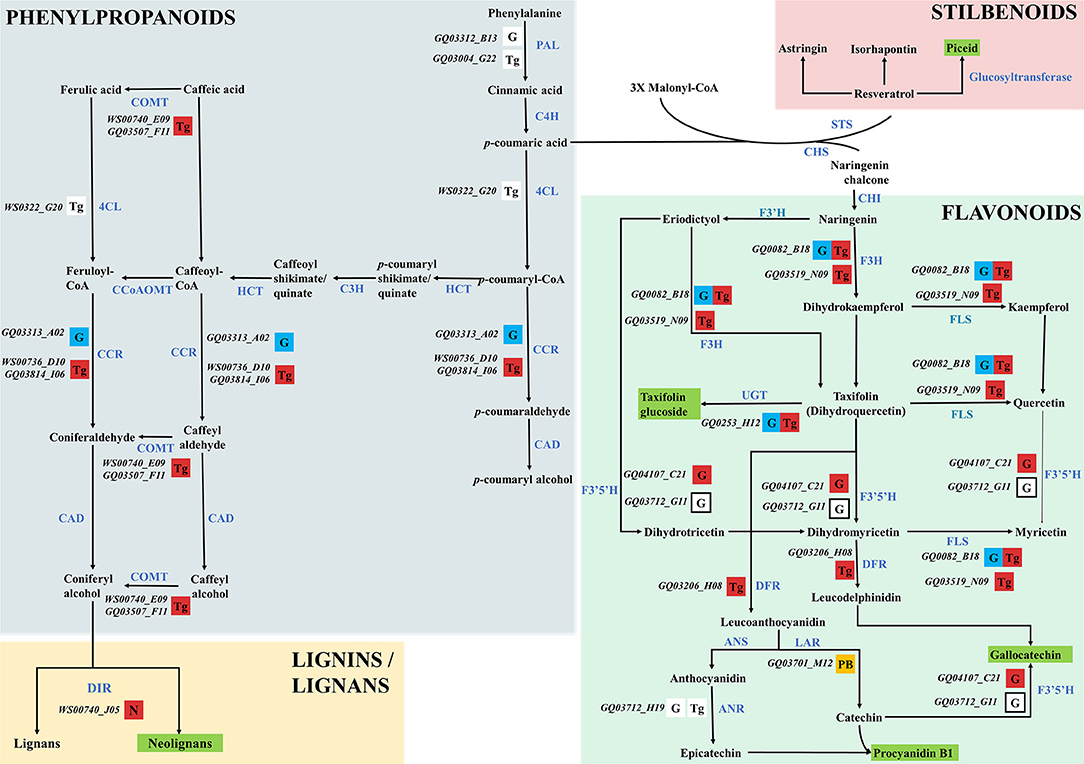
Figure 6. Proposed phenolic compound biosynthesis pathway in spruce. The pathway presented here is adapted from Warren et al. (2015). Candidate gene IDs identified in this study were retrieved from the gene catalog GCAT3.3 (Rigault et al., 2011) and are reported in black and italic. Genes identified in QTLs only are shown in orange boxes. Lower- or highly-expressed genes are indicated by blue and red boxes, respectively. Remaining DEGs (i.e., excluding high- and low expressed genes) are shown in white boxes. Genes within the taxifolin glucoside QTL and differentially expressed for gallocatechin are shown in white boxes with bold margins. The metabolite for which genes are differentially expressed is reported in each box according to the following nomenclature: G, gallocatechin; N, neolignan-2; P, piceid; PB, procyanidin B1; Tg, taxifolin glucoside. The five metabolites studied are underlined in green. Known key enzymes involved in the phenylpropanoid pathway are labeled in blue and bold capital letters. Abbreviations are as follow: 4CL, 4-coumarate-CoA ligase; ANR, anthocyanidin reductase; ANS, anthocyanidin synthase; C3H, p-coumaroyl shikimate/quinate 3′ -hydroxylase; C4H, cinnamate 4-hydroxylase; CAD, cinnamyl-alcohol dehydrogenase; CAD, cinamyl alcohol deshydrogenase; CCoAOMT, caffeoyl-CoA O-methyltransferase; CCR, cinnamoyl-CoA reductase; CHI, chalcone isomerase; CHS, naringenin-chalcone synthase; COMT, caffeic O-methyltransferase DFR, bifunctional dihydroflavonol 4-reductase/flavanone 4-reductase; DIR, dirigent protein; F3H, flavanone 3-hydroxylase; F3′H, flavonoid 3′-hydroxylase; F3′5′H, flavonoid 3′5′-hydroxylase; FLS, flavonol synthase; HCT, hydroxycinnamoyl-CoA:shikimate/quinate hydroxycinnamoyltransferase; LAC, laccase; LAR, leucoanthocyanidin reductase; PAL, phenylalanine ammonia-lyase; PER, peroxidase; PLR, pinoresinol lariciresinol reductase; STS, trihydroxystilbene synthase; UGT, UDP-dependent glucosyl transferase.
Differentially Expressed Transcription Factors as Potential Regulators of the Phenylpropanoid Pathway
A total of 41 transcription factors (TFs) were differentially expressed among the high and low PCs content groups (Supplementary Table 6). Among those, MYB (10 genes), WRKY (5 genes), NAC and AP2-EREBP (3 genes) were the most represented families. No significant TFs were found for piceid, one for procyanidin B1, while only three TFs were detected for neolignan-2. The remaining TFs were associated to taxifolin glucoside and gallocatechin. One bHLH (GQ01301_E17), one WD40 (GQ03304_I14), one WRKY (GQ03304_E19) and eight MYBs genes showed high and low expression in individuals producing high levels of taxifolin glucoside and gallocatechin, respectively.
Combining QTL and Transcriptomic Analyses to Identify Candidate Genes for Phenolic Compound Variation
A total of 19 DEGs that were associated to gallocatechin, neolignan-2, and taxifolin glucoside, were also located within QTL regions (Supplementary Table 7). Those genes can be safely designated as candidate genes for PC variation. They included five hydrolases, four uncharacterized putative proteins as well as two genes encoding methylesterases and transferases. None of them were formally associated to the phenylpropanoid pathway.
Discussion
Neolignan: A Likely Rare Case of Monogenic Trait in Conifers
Two types of phenotypic distributions were observed in the present study (Figure 2; Supplementary Figure 2). Stilbenoids and flavonoids displayed a continuous and unimodal distribution of concentrations typical for quantitative traits controlled by multiple genes with small effects (Supplementary Figure 2), as generally observed for Pinaceae taxa (Routaboul et al., 2012; Wahyuni et al., 2014; Ganthaler et al., 2017). The distribution of their 15 QTLs across 7 linkage groups (Table 2), the moderate proportion of variance explained by single QTLs (10.9% ≤ PVE ≤ 13%; Table 2), and the distribution of 197 DEGs across the 12 spruce linkage groups (Supplementary Table 2) further support the scenario of a polygenic control of stilbenoid and flavonoid production. In contrast, neolignan-2 displayed a bimodal distribution of metabolite content (Figure 2). This distribution suggests a monogenic control of metabolite concentration, consistent with the identification of a single major QTL on LG4 (Figure 2C) explaining up to 91.3% of the phenotypic variance (Table 2). Until now, studies reporting the occurrence of neolignans in the Picea genus, and more generally in conifers, are still scarce [but see Hong et al. (2014); for review see Tanase et al. (2019)]. The neolignan analyzed in the current study (neolignan-2) was recently identified in Norway spruce (Nemesio-Gorriz et al., 2017), and found under the regulation of several MYB genes. Neolignans have diverse physiological roles in angiosperm plants, including defense against fungus and insects (Choi et al., 2009; Saguez et al., 2013), but little is known regarding their specific role in conifers. Monogenic traits usually represent prime candidates for marker-assisted selection in breeding programs. In this sense, further research should focus on the characterization and physiological role of neolignan-2 in white spruce, and densifying the QTL involved with more gene markers, given that less than one third of the transcriptome has been mapped in white spruce (Pavy et al., 2017).
Metabolite Data and Expression Profiles Reveal New Insights Into the Transcriptional Control of Flavonoids
Transcriptomic data highlighted a set of 137 genes showing opposite expression patterns between high gallocatechin and high taxifolin glucoside individuals (r = −0.88, P < 0.001; Figure 4). While further investigations are needed to determine which of these genes play a role in the constitutive production of these two flavonoids, such a strong negative relationship suggests that these 137 genes are likely co-regulated, as commonly observed for genes related to the biosynthesis of flavonoids (Honda et al., 2002; Tian et al., 2017). This opposite expression pattern also points to a possible feedback mechanism influencing the production of these two metabolites. However, the lack of significant negative correlation between gallocatechin and taxifolin glucoside concentrations in contrasted phenotypes (Supplementary Figure 5) indicates that gene expression and metabolite levels are decoupled. This does not rule out the possibility of a feedback mechanism, given that metabolite concentrations can be affected by metabolic network connectivity, when metabolites are involved in several metabolic pathways (Wegner and Kummer, 2005; Zelezniak et al., 2014). Alternatively, the activation of these genes, or a subset of them, may simply enhance the production of taxifolin glucoside, without affecting the production of gallocatechin, while their repression would yield an opposite pattern. Since both pathways require the same substrate, this scenario would imply that substrate availability is not a limiting factor for the synthesis of these two metabolites.
Trancriptomics Highlighted Key Genes Involved in the Phenylpropanoid Pathway and Environmental Stress Response
Transcriptomics revealed that members of gene families generally associated with the phenylpropanoid pathway in plants (Reinprecht et al., 2017) such as DIR, PER-LAC, cytochrome P450, NmrA-like and O-methyltransferases were differentially expressed in white spruce (Table 3; Figure 6). Some key genes involved in the flavonoid pathway (FLS, UGT and F3H; Figure 6) displayed opposite gene expression patterns in individuals producing high levels of taxifolin glucoside and gallocatechin. This observation indicates that these genes are important actors of the transcriptional machinery governing the production of flavonoids. Two genes showing higher expression in trees producing high taxifolin glucoside and gallocatechin contents (GQ03519_N09 and GQ0082_B18; Figure 6) encoded the flavanone 3-hydroxylase (F3H), an enzyme mediating the production of taxifolin in spruce (Hammerbacher et al., 2019). A previous study reported a negative feedback regulation of F3H expression by catechins in Camellia sinensis (Singh et al., 2008). Similar mechanism may occur in white spruce, since catechin and taxifolin metabolite levels were strongly positively correlated in trees producing high or low levels of gallocatechin and taxifolin glucoside (Supplementary Figure 5). Expression level of UGT85A8 was higher in individuals producing high levels of taxifolin glucoside, in line with the commonly accepted hypothetical biosynthesis pathway in spruce where UGT facilitated the glucosylation of taxifolin to taxifolin glucoside (Hammerbacher et al., 2019). One gene encoding a flavonoid 3′5′-hydroxylase (F3′5′H; GQ04107_C21) had a higher expression level in high gallocatechin content individuals (Table 3; Figure 6). F3′5′H is an important branch point enzyme in flavonoid biosynthesis that catalyzes the conversion of flavonols into 3′,4′,5′-hydroxylated derivatives and allows the formation of gallocatechin (Deng and Lu, 2017; Figure 6). In Norway spruce, the formation of gallocatechin preferentially leads through catechin rather than dihydromyricetin and leucodelphinidin, and was induced following bark beetle-fungus infection (Hammerbacher et al., 2018, 2019). Finally, one gene located in the procyanidin B1 QTL (GQ03701_M12) encoded the leucoanthocyanidin reductase (LAR) (Figure 6), a bifunctional enzyme catalyzing the reduction of leucocyanidin and controlling the degree of polymerization of proanthocyanidins (Jun et al., 2018; Yu et al., 2019). In Norway spruce, the homologous gene of GQ03701_M12 (Hammerbacher et al., 2014) and other LAR genes (Oliva et al., 2015; Nemesio-Gorriz et al., 2016) were found to be involved in response to fungus infection. Interestingly, one dirigent protein (DIR, WS00740_J05) was highly expressed in individuals with high neolignan-2 content (Table 3; Figure 6). Dirigent proteins are involved in the stereoselective reaction forming the lignan pinoresinol from coniferyl alcohol (Davin and Lewis, 2005), and could also act in the formation of lignin (Burlat et al., 2001). These proteins are usually induced by wounding as well as weevil and budworm herbivory attacks (Ralph et al., 2006b; Lippert et al., 2007).
Phenylpropanoid biosynthesis is a common plant response to biotic and abiotic stress. In line with this idea, several DEGs identified herein were previously found involved in climate adaptation (Supplementary Table 8; Hornoy et al., 2015), cold hardening and cold acclimation in various spruce species (Supplementary Table 8; Holliday et al., 2008; Kayal et al., 2011; Pelgas et al., 2011). We also identified DEGs related to plant defense pathways other than the phenylpropanoid pathway, such as the terpenoid pathway (Figure 5B; Supplementary Tables 4, 8), possibly indicating signaling crosstalk between secondary metabolites production and stress response (Jacobo-Velázquez et al., 2015; Isah, 2019).
Identification of Transcription Factors Potentially Involved in the Transcriptional Control of Flavonoids
We identified 40 differentially expressed TFs from families (i.e., MYB, bHLH, WD40, WRKY and AP2/EREBP; Supplementary Table 6) known as involved in spruce PCs pathway (e.g., Bomal et al., 2008; Bedon et al., 2010; Nemesio-Gorriz et al., 2017). This is consistent with the fact that in higher plants, several R2R3-MYB proteins are known to activate the early steps of flavonoid biosynthesis, whereas late biosynthetic genes are rather controlled by the MYB-bHLH-WD40 (MBW) complex (Xu et al., 2015; Ma et al., 2018). In addition, recent studies reported that the action of the MBW complex can be modified by WRKY TFs (Lloyd et al., 2017). In this study, we found two R2R3-MYBs (GQ03719_G10, white spruce homolog of PaMYB33; and GQ04002_F03, white spruce homolog of PaMYB31) showing higher expression in high taxifolin glucoside content individuals (Supplementary Table 6), and for which protein-protein interactions with bHLH members were shown to play a role in the regulation of the flavonoid pathway in Norway spruce (Nemesio-Gorriz et al., 2017). Interestingly, the overexpression of PaMYB33 in transgenic cell lines also activated the expression of genes encoding PAL, ANR and LAR enzymes (Nemesio-Gorriz et al., 2017), suggesting that similar mechanisms may govern the late flavonoid biosynthesis in white spruce. The 12 TFs displaying opposite expression patterns between gallocatechin and taxifolin glucoside in our study (Supplementary Table 6) might be directly involved in the formation of the MBW complex or might be downstream target genes of the MBW complex. Given that the regulatory mechanism involving the MBW complex appears highly conserved in higher plants (Xu et al., 2015), our findings provide a relevant framework for studying the complex transcriptional network governing the biosynthesis of flavonoids, in white spruce and other conifer species.
Integrating QTL Mapping and Transcriptomic Approaches: Potential, Limits and Perspectives
While RNA-Seq provided valuable insights into genes involved in white spruce phenylpropanoid pathway and their regulation, the combination of both QTL mapping and RNA-Seq approaches yielded mixed results. We identified 19 candidate DEGs colocalizing within QTLs, but none of them were formally associated with the PC pathway (Supplementary Table 7). However, considering that the landscape of genes essential for the regulation of phenylpropanoids in plants is still not exhaustive (for a review see Biala and Jasiński, 2018), we should not exclude the possibility that these candidate genes could be indirectly linked to the phenylpropanoid biosynthesis pathway. Further, the fact that one third (203) of the 603 DEGs identified herein have not been positioned yet on the current white spruce genetic map (Pavy et al., 2017) suggests that some additional DEGs could have colocalized with the detected QTLs. Association studies focusing on these DEGs would also help identify more candidate genes. Transcriptomics alone proved powerful to investigate the combinatorial gene regulation of flavonoids in white spruce. It allowed the identification of 137 genes likely co-regulated, along with several candidate regulators, and 50 genes encoding key enzymes of the white spruce phenylpropanoid pathway. These results may be further explored by focusing on the discovery of variable genomic regions responsible for variations in gene expression (i.e., eQTL studies), given that PCs regulatory networks appear relatively conserved in plants (e.g., MBW complex; see Xu et al., 2015).
Data Availability Statement
The original contributions presented in the study are publicly available. This data can be found here: Concentrations in phenolic compounds (file: Concentration_metabolites.xlsx) were deposited in Dryad and are available at the following link: https://doi.org/10.5061/dryad.z08kprrcd. The raw read sequencing data was deposited in the European Nucleotide Archive (Accessions: ERR5545518, ERR5545555, ERR5545556, ERR5545558, ERR5545562, ERR5545566, ERR5545567, ERR5545569, ERR5545571, ERR5545573, ERR5545575, ERR5545578-ERR5545580, ERR5545583, ERR5545584, ERR5545586, ERR5545587, ERR5545591, ERR5545621-ERR5545624, ERR5545643-ERR5545645, ERR5545647-ERR5545649, ERR5545651-ERR5545653, ERR5545656, ERR5545657, ERR5545660, ERR5545661-ERR5545664, ERR5545666-ERR5545671, ERR5545673, ERR5545674, ERR5545676-ERR5545680, ERR5545682, ERR5545684-ERR5545687, ERR5545689-ERR5545695, ERR5545697-ERR5545699, ERR5545739-ERR5545743, ERR5545745, ERR5545746, ERR5545748-ERR5545753). The reference transcriptome (file: GCAT_WS-3.3.cluseq.fasta) used to map RNA-Seq reads was deposited in Dryad and is available at the following link: https://doi.org/10.5061/dryad.z08kprrcd.
Author Contributions
JLao, AH, NI, and JB designed the study. JLao, SG, AH, AA, M-CG-L, BB, and JLar designed methods and carried out the experiments. JLao, CD, SG, CB, and ML performed the analyses and discussed the results. JLao and CD wrote the manuscript with contributions and feedbacks from SG, ML, CB, AA, M-CG-L, JLar, BB, AH, NI, and JB. All authors contributed to the article and approved the submitted version.
Funding
This study was funded by a National Sciences and Engineering Research Council of Canada of Canada discovery grant to JB, and by the Spruce-Up LSARP project co-lead by J. Bohlmann and JB with funding from Genome Canada and Genome Quebec to NI and JB. The project was also supported by contributions from Genomics Research and Development Initiative of Canada to NI.
Conflict of Interest
The authors declare that the research was conducted in the absence of any commercial or financial relationships that could be construed as a potential conflict of interest.
Acknowledgments
The authors would like to thank J. Beaulieu (Univ. Laval and formerly from Canadian Forest Service) for performing crosses and providing the original full-sib family seedlot. We are also grateful to E. Dussault, D. Plourde, S. Labrie, J.-A. Bélanger, P. Labrie, E. Pouliot, and J.-F. Légaré of the Laurentian Forestry Centre (Natural Resources Canada) for their assistance with sampling and phenotypic assessments of trees. Thanks are extended to J. Gravel-Grenier and J. Gingras and their teams from Pépinière St-Modeste (Québec Ministry of Forests, Wildlife and Parks) for hosting our team at their tree nursing installation during field trips. The authors also thank S. Carles (Québec Ministry of Forests, Wildlife and Parks) for validating field sampling protocols. We are grateful to A. Hammerbacher's laboratory staff for the measurement of metabolites at the Max Planck Institute for Chemical Ecology (Germany). We also thank G. Pelletier (Natural Resources Canada) for his help on enrichment analyses. The authors are also indebted to J. Prunier and I. Porth (Univ. Laval) for constructive discussions. We also thank F. Robidoux (Genome Quebec) for RNA sequencing at the Genome Quebec Innovation Centre.
Supplementary Material
The Supplementary Material for this article can be found online at: https://www.frontiersin.org/articles/10.3389/fpls.2021.675108/full#supplementary-material
Abbreviations
DEG, differentially expressed gene; DW, dry weight; Log2fc, log2 fold change; PCs, phenolic compounds; PVE, phenotypic variance explained; QTL, quantitative trait loci; sp. (spp.), Species.
References
Anders, S., and Huber, W. (2010). Differential expression analysis for sequence count data. Genome Biol. 11:106. doi: 10.1186/gb-2010-11-10-r106
Andrews, K. R., Hohenlohe, P. A., Miller, M. R., Hand, B. K., Seeb, J. E., and Luikart, G. (2014). Trade-offs and utility of alternative RADseq methods: reply to Puritz et al. Mol. Ecol. 23, 5943–5946. doi: 10.1111/mec.12964
Bahnweg, G., Schubert, R., Kehr, R. D., Müller-Starck, G., Heller, W., Langebartels, C., et al. (2000). Controlled inoculation of Norway spruce (Picea abies) with Sirococcus conigenus: PCR-based quantification of the pathogen in host tissue and infection-related increase of phenolic metabolites. Trees 14, 435–441. doi: 10.1007/s004680000058
Bedon, F., Bomal, C., Caron, S., Levasseur, C., Boyle, B., Mansfield, S. D., et al. (2010). Subgroup 4 R2R3-MYBs in conifer trees: gene family expansion and contribution to the isoprenoid- and flavonoid-oriented responses. J. Exp. Bot. 61, 3847–3864. doi: 10.1093/jxb/erq196
Benjamini, Y., and Hochberg, Y. (1995). Controlling the false discovery rate: a practical and powerful approach to multiple testing. J. R. Stat. Soc. Series B. Stat. Methodol. 57, 289–300. doi: 10.1111/j.2517-6161.1995.tb02031.x
Berini, J. L., Brockman, S. A., Hegeman, A. D., Reich, P. B., Muthukrishnan, R., Montgomery, R. A., et al. (2018). Combinations of abiotic factors differentially alter production of plant secondary metabolites in five woody plant species in the boreal-temperate transition zone. Front. Plant Sci. 9:1257. doi: 10.3389/fpls.2018.01257
Biala, W., and Jasiński, M. (2018). The phenylpropanoid case – it is transport that matters. Front. Plant Sci. 9:1610. doi: 10.3389/fpls.2018.01610
Birol, I., Raymond, A., Jackman, S. D., Pleasance, S., Coope, R., Taylor, G. A., et al. (2013). Assembling the 20 Gb white spruce (Picea glauca) genome from whole-genome shotgun sequencing data. Bioinformatics 29, 1492–1497. doi: 10.1093/bioinformatics/btt178
Bomal, C., Bedon, F., Caron, S., Mansfield, S. D., Levasseur, C., Cooke, J. E. K., et al. (2008). Involvement of Pinus taeda MYB1 and MYB8 in phenylpropanoid metabolism and secondary cell wall biogenesis: a comparative in planta analysis. J. Exp. Bot. 59, 3925–3939. doi: 10.1093/jxb/ern234
Brignolas, F., Lacroix, B., Lieutier, F., Sauvard, D., Drouet, A., Claudot, A.-C., et al. (1995). Induced responses in phenolic metabolism in two norway spruce clones after wounding and inoculations with Ophiostoma polonicum, a bark beetle-associated fungus. Plant Physiol. 109, 821–827. doi: 10.1104/pp.109.3.821
Brignolas, F., Lieutier, F., Sauvard, D., Christiansen, E., and Berryman, A. A. (1998). Phenolic predictors for Norway spruce resistance to the bark beetle Ips typographus (Coleoptera: Scolytidae) and an associated fungus, Ceratocystis polonica. Can. J. For. Res. 28, 720–728. doi: 10.1139/x98-037
Burlat, V., Kwon, M., Davin, L. B., and Lewis, N. G. (2001). Dirigent proteins and dirigent sites in lignifying tissues. Phytochemistry 57, 883–897. doi: 10.1016/S0031-9422(01)00117-0
Caseys, C., Stritt, C., Glauser, G., Blanchard, T., and Lexer, C. (2015). Effects of hybridization and evolutionary constraints on secondary metabolites: the genetic architecture of phenylpropanoids in European Populus species. PLoS ONE 10:e0128200. doi: 10.1371/journal.pone.0128200
Cavallini, E., Matus, J. T., Finezzo, L., Zenoni, S., Loyola, R., Guzzo, F., et al. (2015). The phenylpropanoid pathway is controlled at different branches by a set of R2R3-MYB C2 repressors in grapevine. Plant Physiol. 167, 1448–1470. doi: 10.1104/pp.114.256172
Celedon, J. M., Yuen, M. M. S., Chiang, A., Henderson, H., Reid, K. E., and Bohlmann, J. (2017). Cell-type- and tissue-specific transcriptomes of the white spruce (Picea glauca) bark unmask fine-scale spatial patterns of constitutive and induced conifer defense. Plant J. 92, 710–726. doi: 10.1111/tpj.13673
Chang, S., Puryear, J., and Cairney, J. (1993). A simple and efficient method for isolating RNA from pine trees. Plant Mol. Biol. Rep. 11, 113–116. doi: 10.1007/BF02670468
Chobot, V., Huber, C., Trettenhahn, G., and Hadacek, F. (2009). (±)-Catechin: chemical weapon, antioxidant, or stress regulator? J. Chem. Ecol. 35, 980–996. doi: 10.1007/s10886-009-9681-x
Choi, N. H., Choi, G. J., Min, B. S., Jang, K. S., Choi, Y. H., Kang, M. S., et al. (2009). Effects of neolignans from the stem bark of Magnolia obovata on plant pathogenic fungi. J. Appl. Microbiol. 106, 2057–2063. doi: 10.1111/j.1365-2672.2009.04175.x
Czyczyło-Mysza, I. M., Cyganek, K., Dziurka, K., Quarrie, S., Skrzypek, E., Marcińska, I., et al. (2019). Genetic parameters and QTLs for total phenolic content and yield of wheat mapping population of CSDH lines under drought stress. Int. J. Mol. Sci. 20:6064. doi: 10.3390/ijms20236064
Dale, V. H., Joyce, L. A., Mcnulty, S., Neilson, R. P., Ayres, M. P., Flannigan, M. D., et al. (2001). Climate change and forest disturbances: climate change can affect forests by altering the frequency, intensity, duration, and timing of fire, drought, introduced species, insect and pathogen outbreaks, hurricanes, windstorms, ice storms, or landslides. Bioscience 51, 723–734. doi: 10.1641/0006-3568(2001)051[0723:CCAFD]2.0.CO;2
Dalman, K., Wind, J. J., Nemesio-Gorriz, M., Hammerbacher, A., Lundén, K., Ezcurra, I., et al. (2017). Overexpression of PaNAC03, a stress induced NAC gene family transcription factor in Norway spruce leads to reduced flavonol biosynthesis and aberrant embryo development. BMC Plant Biol. 17:6. doi: 10.1186/s12870-016-0952-8
Davin, L. B., and Lewis, N. G. (2005). Lignin primary structures and dirigent sites. Curr. Opin. Biotechnol. 16, 407–415. doi: 10.1016/j.copbio.2005.06.011
Davis, M. B., and Shaw, R. G. (2001). Range shifts and adaptive responses to quaternary climate change. Science 292, 673–679. doi: 10.1126/science.292.5517.673
Delvas, N., Bauce, É., Labbé, C., Ollevier, T., and Bélanger, R. (2011). Phenolic compounds that confer resistance to spruce budworm. Entomol. Exp. Appl. 141, 35–44. doi: 10.1111/j.1570-7458.2011.01161.x
Deng, Y., and Lu, S. (2017). Biosynthesis and regulation of phenylpropanoids in plants. CRC Crit. Rev. Plant Sci. 36, 257–290. doi: 10.1080/07352689.2017.1402852
Evensen, P. C., Solheim, H., Høiland, K., and Stenersen, J. (2000). Induced resistance of Norway spruce, variation of phenolic compounds and their effects on fungal pathogens. For. Pathol. 30, 97–108. doi: 10.1046/j.1439-0329.2000.00189.x
Faccoli, M., and Schlyter, F. (2007). Conifer phenolic resistance markers are bark beetle antifeedant semiochemicals. Agric. For. Entomol. 9, 237–245. doi: 10.1111/j.1461-9563.2007.00339.x
Feller, A., Machemer, K., Braun, E. L., and Grotewold, E. (2011). Evolutionary and comparative analysis of MYB and bHLH plant transcription factors. Plant J. 66, 94–116. doi: 10.1111/j.1365-313X.2010.04459.x
Francheschi, V. R., Krokene, P., Christiansen, E., and Krekling, T. (2005). Anatomical and chemical defenses of conifer bark against bark beetles and other pests. New Phytol. 167, 353–376. doi: 10.1111/j.1469-8137.2005.01436.x
Francisco, M., Ali, M., Ferreres, F., Moreno, D. A., Velasco, P., and Soengas, P. (2016). Organ-specific quantitative genetics and candidate genes of phenylpropanoid metabolism in Brassica oleracea. Front. Plant Sci. 6:1240. doi: 10.3389/fpls.2015.01240
Ganthaler, A., Stöggl, W., Kranner, I., and Mayr, S. (2017). Foliar phenolic compounds in Norway spruce with varying susceptibility to Chrysomyxa rhododendri: analyses of seasonal and infection-induced accumulation patterns. Front. Plant Sci. 8:1173. doi: 10.3389/fpls.2017.01173
Gotz, S., Garcia-Gomez, J. M., Terol, J., Williams, T. D., Nagaraj, S. H., Nueda, M. J., et al. (2008). High-throughput functional annotation and data mining with the Blast2GO suite. Nucleic Acids Res. 36, 3420–3435. doi: 10.1093/nar/gkn176
Hamberger, B., and Bohlmann, J. (2006). Cytochrome P450 mono-oxygenases in conifer genomes: discovery of members of the terpenoid oxygenase superfamily in spruce and pine. Bioch. Soc. Trans. 34, 1209–1214. doi: 10.1042/BST0341209
Hammerbacher, A., Kandasamy, D., Ullah, C., Schmidt, A., Wright, L. P., and Gershenzon, J. (2019). Flavanone-3-Hydroxylase plays an important role in the biosynthesis of spruce phenolic defenses against bark beetles and their fungal associates. Front. Plant Sci. 10:208. doi: 10.3389/fpls.2019.00208
Hammerbacher, A., Paetz, C., Wright, L. P., Fischer, T. C., Bohlmann, J., Davis, A. J., et al. (2014). Flavan-3-ols in Norway spruce: biosynthesis, accumulation, and function in response to attack by the bark beetle-associated fungus Ceratocystis polonica. Plant Physiol. 164, 2107–2122. doi: 10.1104/pp.113.232389
Hammerbacher, A., Raguschke, B., Wright, L. P., and Gershenzon, J. (2018). Gallocatechin biosynthesis via a flavonoid 3′, 5′-hydroxylase is a defense response in Norway spruce against infection by the bark for beetle-associated sap-staining fungus Endoconidiophora polonica. Phytochemistry 148, 78–86. doi: 10.1016/j.phytochem.2018.01.017
Hammerbacher, A., Ralph, S. G., Bohlmann, J., Fenning, T. M., Gershenzon, J., and Schmidt, A. (2011). Biosynthesis of the major tetrahydroxystilbenes in spruce, astringin and isorhapontin, proceeds via resveratrol and is enhanced by fungal infection. Plant Physiol. 157, 876–890. doi: 10.1104/pp.111.181420
Hammerbacher, A., Schmidt, A., Wadke, N., Wright, L. P., Schneider, B., Bohlmann, J., et al. (2013). A common fungal associate of the spruce bark beetle metabolizes the stilbene defenses of Norway spruce. Plant Physiol. 162, 1324–1336. doi: 10.1104/pp.113.218610
Harrell, F. E. Jr. (2014). Hmisc Package v3.14–4. Available online at: https://cran.r-project.org/web/packages/Hmisc/index.html (accessed March 15, 2018).
Holliday, J. A., Ralph, S. G., White, R., Bohlmann, J., and Aitken, S. N. (2008). Global monitoring of autumn gene expression within and among phenotypically divergent populations of Sitka spruce (Picea sitchensis). New Phytol. 178, 103–122. doi: 10.1111/j.1469-8137.2007.02346.x
Honda, C., Kotoda, N., Wada, M., Kondo, S., Kobayashi, S., Soejima, J., et al. (2002). Anthocyanin biosynthetic genes are coordinately expressed during red coloration in apple skin. Plant Physiol. Biochem. 40, 955–962. doi: 10.1016/S0981-9428(02)01454-7
Hong, S. S., Jeong, W., Kim, J. K., Kwon, J. G., Lee, J. Y., Ahn, E.-K., et al. (2014). Neolignan inhibitors of antigen-induced degranulation in RBL-2H3 cells from the needles of Pinus thunbergii. Fitoterapia 99, 347–351. doi: 10.1016/j.fitote.2014.10.015
Hornoy, B., Pavy, N., Gérardi, S., Beaulieu, J., and Bousquet, J. (2015). Genetic adaptation to climate in white spruce involves small to moderate allele frequency shifts in functionally diverse genes. Genome Biol. Evol. 7, 3269–3285. doi: 10.1093/gbe/evv218
Isah, T. (2019). Stress and defense responses in plant secondary metabolites production. Biol. Res. 52:39. doi: 10.1186/s40659-019-0246-3
Jacobo-Velázquez, D. A., González-Agüero, M., and Cisneros-Zevallos, L. (2015). Cross-talk between signaling pathways: the link between plant secondary metabolite production and wounding stress response. Sci. Rep. 5:8608. doi: 10.1038/srep08608
Jian, H., Zhang, A., Ma, J., Wang, T., Yang, B., Shuang, L. S., et al. (2019). Joint QTL mapping and transcriptome sequencing analysis reveal candidate flowering time genes in Brassica napus L. BMC Genomics 20:21. doi: 10.1186/s12864-018-5356-8
Jin, J., Tian, F., Yang, D.-C., Meng, Y.-Q., Kong, L., Luo, J., et al. (2017). PlantTFDB 4.0: toward a central hub for transcription factors and regulatory interactions in plants. Nucleic Acids Res. 45, D1040–D1045. doi: 10.1093/nar/gkw982
Jun, J. H., Xiao, X., Rao, X., and Dixon, R. A. (2018). Proanthocyanidin subunit composition determined by functionally diverged dioxygenases. Nat. Plants 4, 1034–1043. doi: 10.1038/s41477-018-0292-9
Kayal, W. E., Allen, C. C., Ju, C. J.-T., Adams, E. R. I., King-Jones, S., Zaharia, L. I., et al. (2011). Molecular events of apical bud formation in white spruce, Picea glauca. Plant Cell. Environ. 34, 480–500. doi: 10.1111/j.1365-3040.2010.02257.x
Kessler, A. (2015). The information landscape of plant constitutive and induced secondary metabolite production. Curr. Opin. Insect Sci. 8, 47–53. doi: 10.1016/j.cois.2015.02.002
Külheim, C., Yeoh, S. H., Wallis, I. R., Laffan, S., Moran, G. F., and Foley, W. J. (2011). The molecular basis of quantitative variation in foliar secondary metabolites in Eucalyptus globulus. New Phytol. 191, 1041–1053. doi: 10.1111/j.1469-8137.2011.03769.x
Li, M.-W., Muñoz, N. B., Wong, C.-F., Wong, F.-L., Wong, K.-S., Wong, J. W.-H., et al. (2016). QTLs regulating the contents of antioxidants, phenolics, and flavonoids in soybean seeds share a common genomic region. Front. Plant Sci. 7:854. doi: 10.3389/fpls.2016.00854
Lind, M., Källman, T., Chen, J., Ma, X.-F., Bousquet, J., Morgante, M., et al. (2014). A Picea abies linkage map based on SNP markers identifies QTLs for four aspects of resistance to heterobasidion parviporum infection. PLoS ONE 9:e101049. doi: 10.1371/journal.pone.0101049
Lippert, D., Chowrira, S., Ralph, S. G., Zhuang, J., Aeschliman, D., Ritland, C., et al. (2007). Conifer defense against insects: proteome analysis of Sitka spruce (Picea sitchensis) bark induced by mechanical wounding or feeding by white pine weevils (Pissodes strobi). Proteomics 7, 248–270. doi: 10.1002/pmic.200600525
Lloyd, A., Brockman, A., Aguirre, L., Campbell, A., Bean, A., Cantero, A., et al. (2017). Advances in the MYB–bHLH–WD repeat (MBW) pigment regulatory model: addition of a WRKY factor and co-option of an anthocyanin MYB for betalain regulation. Plant Cell Physiol. 58, 1431–1441. doi: 10.1093/pcp/pcx075
Lohse, M., Nagel, A., Herter, T., May, P., Schroda, M., Zrenner, R., et al. (2014). Mercator: a fast and simple web server for genome scale functional annotation of plant sequence data. Plant Cell Environ. 37, 1250–1258. doi: 10.1111/pce.12231
Love, M. I., Huber, W., and Anders, S. (2014). Moderated estimation of fold change and dispersion for RNA-seq data with DESeq2. Genome Biol. 15:550. doi: 10.1186/s13059-014-0550-8
Ma, D., and Constabel, C. P. (2019). MYB repressors as regulators of phenylpropanoid metabolism in plants. Trends Plant Sci. 24, 275–289. doi: 10.1016/j.tplants.2018.12.003
Ma, D., Reichelt, M., Yoshida, K., Gershenzon, J., and Constabel, C. P. (2018). Two R2R3-MYB proteins are broad repressors of flavonoid and phenylpropanoid metabolism in poplar. Plant J. 96, 949–965. doi: 10.1111/tpj.14081
Martin, M. (2011). Cutadapt removes adapter sequences from high-throughput sequencing reads. EMBnet J. 17, 10–12. doi: 10.14806/ej.17.1.200
Moura, J. C. M. S., Bonine, C. A. V., de Oliveira Fernandes Viana, J., Dornelas, M. C., and Mazzafera, P. (2010). Abiotic and biotic stresses and changes in the lignin content and composition in plants. J. Integr. Plant Biol. 52, 360–376. doi: 10.1111/j.1744-7909.2010.00892.x
Nemesio-Gorriz, M., Blair, P. B., Dalman, K., Hammerbacher, A., Arnerup, J., Stenlid, J., et al. (2017). Identification of Norway spruce MYB-bHLH-WDR transcription factor complex members linked to regulation of the flavonoid pathway. Front. Plant Sci. 8:305. doi: 10.3389/fpls.2017.00305
Nemesio-Gorriz, M., Hammerbacher, A., Ihrmark, K., Källman, T., Olson, Å., Lascoux, M., et al. (2016). Different alleles of a gene encoding leucoanthocyanidin reductase (PaLAR3) influence resistance against the fungus Heterobasidion parviporum in Picea abies. Plant Physiol. 171, 2671–2681. doi: 10.1104/pp.16.00685
Oliva, J., Rommel, S., Fossdal, C. G., Hietala, A. M., Nemesio-Gorriz, M., Solheim, H., et al. (2015). Transcriptional responses of Norway spruce (Picea abies) inner sapwood against Heterobasidion parviporum. Tree Physiol. 35, 1007–1015. doi: 10.1093/treephys/tpv063
Patro, R., Duggal, G., Love, M. I., Irizarry, R. A., and Kingsford, C. (2017). Salmon provides fast and bias-aware quantification of transcript expression. Nat. Methods 14, 417–419. doi: 10.1038/nmeth.4197
Pavy, N., Gagnon, F., Rigault, P., Blais, S., Deschênes, A., Boyle, B., et al. (2013). Development of high-density SNP genotyping arrays for white spruce (Picea glauca) and transferability to subtropical and Nordic congeners. Mol. Ecol. Resour. 13, 324–336. doi: 10.1111/1755-0998.12062
Pavy, N., Lamothe, M., Pelgas, B., Gagnon, F., Birol, I., Bohlmann, J., et al. (2017). A high-resolution reference genetic map positioning 8.8 K genes for the conifer white spruce: structural genomics implications and correspondence with physical distance. Plant J. 90, 189–203. doi: 10.1111/tpj.13478
Pavy, N., Pelgas, B., Beauseigle, S., Blais, S., Gagnon, F., Gosselin, I., et al. (2008). Enhancing genetic mapping of complex genomes through the design of highly-multiplexed SNP arrays: application to the large and unsequenced genomes of white spruce and black spruce. BMC Genomics 9:21. doi: 10.1186/1471-2164-9-21
Pavy, N., Pelgas, B., Laroche, J., Rigault, P., Isabel, N., and Bousquet, J. (2012). A spruce gene map infers ancient plant genome reshuffling and subsequent slow evolution in the gymnosperm lineage leading to extant conifers. BMC Biol. 10:84. doi: 10.1186/1741-7007-10-84
Pelgas, B., Bousquet, J., Meirmans, P. G., Ritland, K., and Isabel, N. (2011). QTL mapping in white spruce: gene maps and genomic regions underlying adaptive traits across pedigrees, years and environments. BMC Genomics 12:145. doi: 10.1186/1471-2164-12-145
Porth, I., White, R., Jaquish, B., Alfaro, R., Ritland, C., and Ritland, K. (2012). Genetical genomics identifies the genetic architecture for growth and weevil resistance in spruce. PLoS ONE 7:e44397. doi: 10.1371/journal.pone.0044397
Prunier, J., Pelgas, B., Gagnon, F., Desponts, M., Isabel, N., Beaulieu, J., et al. (2013). The genomic architecture and association genetics of adaptive characters using a candidate SNP approach in boreal black spruce. BMC Genomics 14:368. doi: 10.1186/1471-2164-14-368
Prunier, J., Verta, J.-P., and MacKay, J. J. (2016). Conifer genomics and adaptation: at the crossroads of genetic diversity and genome function. New Phytol. 209, 44–62. doi: 10.1111/nph.13565
R Core Team (2013). R: A Language and Environment for Statistical Computing. Vienna: R Foundation for statistical computing. Available online at: http://www.R-project.org
Ralph, S., Park, J.-Y., Bohlmann, J., and Mansfield, S. D. (2006b). Dirigent proteins in conifer defense: gene discovery, phylogeny, and differential wound- and insect-induced expression of a family of DIR and DIR-like genes in spruce (Picea spp.). Plant Mol. Biol. 60, 21–40. doi: 10.1007/s11103-005-2226-y
Ralph, S. G., Yueh, H., Friedmann, M., Aeschliman, D., Zeznik, J. A., Nelson, C. C., et al. (2006a). Conifer defence against insects: microarray gene expression profiling of Sitka spruce (Picea sitchensis) induced by mechanical wounding or feeding by spruce budworms (Choristoneura occidentalis) or white pine weevils (Pissodes strobi) reveals large-scale changes of the host transcriptome. Plant Cell Environ. 29, 1545–1570. doi: 10.1111/j.1365-3040.2006.01532.x
Ramsay, N. A., and Glover, B. J. (2005). MYB–bHLH–WD40 protein complex and the evolution of cellular diversity. Trends Plant Sci. 10, 63–70. doi: 10.1016/j.tplants.2004.12.011
Reinprecht, Y., Perry, G. E., and Pauls, K. P. (2017). “A comparison of phenylpropanoid pathway gene families in common bean. Focus on P450 and C4H genes” in The Common Bean Genome, eds M. Pérez de la Vega, M. Santalla, and F. Marsolais (Cham: Springer International Publishing), 219–261. doi: 10.1007/978-3-319-63526-2_11
Rigault, P., Boyle, B., Lepage, P., Cooke, J. E. K., Bousquet, J., and MacKay, J. J. (2011). A white spruce gene catalog for conifer genome analyses. Plant Physiol. 157, 14–28. doi: 10.1104/pp.111.179663
Rohde, M., Waldmann, R., and Lunderstädt, J. (1996). Induced defence reaction in the phloem of spruce (Picea abies). and larch (Larix decidua) after attack by Ips typographus and Ips cembrae. Forest Ecol. Manag. 86, 51–59. doi: 10.1016/S0378-1127(96)03802-9
Routaboul, J.-M., Dubos, C., Beck, G., Marquis, C., Bidzinski, P., Loudet, O., et al. (2012). Metabolite profiling and quantitative genetics of natural variation for flavonoids in Arabidopsis. J. Exp. Bot. 63, 3749–3764. doi: 10.1093/jxb/ers067
Saguez, J., Attoumbré, J., Giordanengo, P., and Baltora-Rosset, S. (2013). Biological activities of lignans and neolignans on the aphid Myzus persicae (Sulzer). Arthropod Plant Interact. 7, 225–233. doi: 10.1007/s11829-012-9236-x
Schiebe, C., Hammerbacher, A., Birgersson, G., Witzell, J., Brodelius, P. E., Gershenzon, J., et al. (2012). Inducibility of chemical defenses in Norway spruce bark is correlated with unsuccessful mass attacks by the spruce bark beetle. Oecologia 170, 183–198. doi: 10.1007/s00442-012-2298-8
Schiop, S. T., Al Hassan, M., Sestras, A. F., Boscaiu, M., Sestras, R. E., and Vicente, O. (2017). Biochemical responses to drought, at the seedling stage, of several Romanian Carpathian populations of Norway spruce (Picea abies L. Karst). Trees 31, 1479–1490. doi: 10.1007/s00468-017-1563-1
Singh, K., Rani, A., Kumar, S., Sood, P., Mahajan, M., Yadav, S. K., et al. (2008). An early gene of the flavonoid pathway, flavanone 3-hydroxylase, exhibits a positive relationship with the concentration of catechins in tea (Camellia sinensis). Tree Physiol. 28, 1349–1356. doi: 10.1093/treephys/28.9.1349
Sturrock, R. N., Frankel, S. J., Brown, A. V., Hennon, P. E., Kliejunas, J. T., Lewis, K. J., et al. (2011). Climate change and forest diseases. Plant Pathol. 60, 133–149. doi: 10.1111/j.1365-3059.2010.02406.x
Tanase, C., Coşarcă, S, and Muntean, D.-L. (2019). A critical review of phenolic compounds extracted from the bark of woody vascular plants and their potential biological activity. Molecules 24:1182. doi: 10.3390/molecules,24061182
Thimm, O., Bläsing, O., Gibon, Y., Nagel, A., Meyer, S., Krüger, P., et al. (2004). MAPMAN: a user-driven tool to display genomics data sets onto diagrams of metabolic pathways and other biological processes. Plant J. 37, 914–939. doi: 10.1111/j.1365-313X.2004.02016.x
Tian, F., Yang, D.-C., Meng, Y.-Q., Jin, J., and Gao, G. (2020). PlantRegMap: charting functional regulatory maps in plants. Nucleic Acids Res. 48, D1104–D1113. doi: 10.1093/nar/gkz1020
Tian, J., Zhang, J., Han, Z.-Y., Song, T.-T., Li, J.-Y., Wang, Y.-R., et al. (2017). McMYB12 transcription factors co-regulate proanthocyanidin and anthocyanin biosynthesis in Malus crabapple. Sci. Rep. 7:43715. doi: 10.1038/srep43715
van Ooijen, J. W., and Kyazma, B. V. (2009). MapQTL® 6, Software for the Mapping of Quantitative Trait Loci in Experimental Populations of Diploid Species. Wageningen: Kyazma B.V.
Varela, M. C., Arslan, I., Reginato, M. A., Cenzano, A. M., and Luna, M. V. (2016). Phenolic compounds as indicators of drought resistance in shrubs from Patagonian shrublands (Argentina). Plant Physiol. Biochem. 104, 81–91. doi: 10.1016/j.plaphy.2016.03.014
Verdu, C. F., Guyot, S., Childebrand, N., Bahut, M., Celton, J.-M., Gaillard, S., et al. (2014). QTL analysis and candidate gene mapping for the polyphenol content in cider apple. PLoS ONE 9:e107103. doi: 10.1371/journal.pone.0107103
Villangó, S. Z., Szekeres, A., Bencsik, O., Láposi, R., Pálfi, Z., and Zsófi, Z. S. (2016). The effect of postveraison water deficit on the phenolic composition and concentration of the Kékfrankos (Vitis vinifera L.) berry. Sci. Hortic. 209, 113–116. doi: 10.1016/j.scienta.2016.06.010
Wahyuni, Y., Stahl-Hermes, V., Ballester, A.-R., de Vos, R. C. H., Voorrips, R. E., Maharijaya, A., et al. (2014). Genetic mapping of semi-polar metabolites in pepper fruits (Capsicum sp.).: towards unravelling the molecular regulation of flavonoid quantitative trait loci. Mol. Breed. 33, 503–518. doi: 10.1007/s11032-013-9967-0
Wang, W., Xin, H., Wang, M., Ma, Q., Wang, L., Kaleri, N. A., et al. (2016). Transcriptomic analysis reveals the molecular mechanisms of drought-stress-induced decreases in Camellia sinensis leaf quality. Front. Plant Sci. 7:385. doi: 10.3389/fpls.2016.00385
Warren, R. L., Keeling, C. I., Yuen, M. M. S., Raymond, A., Taylor, G. A., Vandervalk, B. P., et al. (2015). Improved white spruce (Picea glauca) genome assemblies and annotation of large gene families of conifer terpenoid and phenolic defense metabolism. Plant J. 83, 189–212. doi: 10.1111/tpj.12886
Wegner, K., and Kummer, U. (2005). A new dynamical layout algorithm for complex biochemical reaction networks. BMC Bioinformatics 6:212. doi: 10.1186/1471-2105-6-212
Xu, E., Vaahtera, L., Hõrak, H., Hincha, D. K., Heyer, A. G., and Brosché, M. (2015). Quantitative trait loci mapping and transcriptome analysis reveal candidate genes regulating the response to ozone in Arabidopsis thaliana. Plant Cell Environ. 38, 1418–1433. doi: 10.1111/pce.12499
Yang, C.-Q., Fang, X., Wu, X.-M., Mao, Y.-B., Wang, L.-J., and Chen, X.-Y. (2012). Transcriptional regulation of plant secondary metabolism. J. Integr. Plant Biol. 54, 703–712. doi: 10.1111/j.1744-7909.2012.01161.x
Ye, J., Yang, Y., Chen, B., Shi, J., Luo, M., Zhan, J., et al. (2017). An integrated analysis of QTL mapping and RNA sequencing provides further insights and promising candidates for pod number variation in rapeseed (Brassica napus L.). BMC Genomics 18:71. doi: 10.1186/s12864-016-3402-y
Yu, K., Jun, J. H., Duan, C., and Dixon, R. A. (2019). VvLAR1 and VvLAR2 are bifunctional enzymes for proanthocyanidin biosynthesis in grapevine. Plant physiol. 180, 1362–1374. doi: 10.1104/pp.19.00447
Zelezniak, A., Sheridan, S., and Patil, K. R. (2014). Contribution of network connectivity in determining the relationship between gene expression and metabolite concentration changes. PLoS Comput. Biol. 10:e1003572. doi: 10.1371/journal.pcbi.1003572
Keywords: conifers, phenolic compounds, Picea glauca, metabolites, QTL, RNA-Seq, co-regulation
Citation: Laoué J, Depardieu C, Gérardi S, Lamothe M, Bomal C, Azaiez A, Gros-Louis M-C, Laroche J, Boyle B, Hammerbacher A, Isabel N and Bousquet J (2021) Combining QTL Mapping and Transcriptomics to Decipher the Genetic Architecture of Phenolic Compounds Metabolism in the Conifer White Spruce. Front. Plant Sci. 12:675108. doi: 10.3389/fpls.2021.675108
Received: 02 March 2021; Accepted: 08 April 2021;
Published: 17 May 2021.
Edited by:
Breeanna Urbanowicz, University of Georgia, United StatesReviewed by:
Jaime Barros, University of North Texas, United StatesMelissa Hamner Mageroy, Norwegian Institute of Bioeconomy Research (NIBIO), Norway
Copyright © 2021 Laoué, Depardieu, Gérardi, Lamothe, Bomal, Azaiez, Gros-Louis, Laroche, Boyle, Hammerbacher, Isabel and Bousquet. This is an open-access article distributed under the terms of the Creative Commons Attribution License (CC BY). The use, distribution or reproduction in other forums is permitted, provided the original author(s) and the copyright owner(s) are credited and that the original publication in this journal is cited, in accordance with accepted academic practice. No use, distribution or reproduction is permitted which does not comply with these terms.
*Correspondence: Justine Laoué, anVzdGluZS5sYW91ZUBnbWFpbC5jb20=; Jean Bousquet, amVhbi5ib3VzcXVldEBzYmYudWxhdmFsLmNh
†ORCID: Justine Laoué orcid.org/0000-0003-3560-419X
Claire Depardieu orcid.org/0000-0003-1340-1586
Sébastien Gérardi orcid.org/0000-0003-3198-4551
Manuel Lamothe orcid.org/0000-0002-5947-533X
Nathalie Isabel orcid.org/0000-0001-8621-9801