 Patrick Obia Ongom1*
 Christian Fatokun2
 Abou Togola1
 Stella Salvo3
 Oluwaseye Gideon Oyebode1
 Mansur Sani Ahmad1
 Ishaya Daniel Jockson1
 Garba Bala1
 Ousmane Boukar1
- 1International Institute of Tropical Agriculture (IITA), Kano, Nigeria
- 2International Institute of Tropical Agriculture (IITA), Ibadan, Nigeria
- 3Bayer Research and Development Services LLC, Chesterfield, MO, United States
Optimization of a breeding program for increased genetic gain requires quality assurance (QA) and quality control (QC) at key phases of the breeding process. One vital phase in a breeding program that requires QC and QA is the choice of parents and successful hybridizations to combine parental attributes and create variations. The objective of this study was to determine parental diversity and confirm hybridity of cowpea F1 progenies using KASP (Kompetitive Allele-Specific PCR)-based single nucleotide polymorphism (SNP) markers. A total of 1,436 F1 plants were derived from crossing 220 cowpea breeding lines and landraces to 2 elite sister lines IT99K-573-1-1 and IT99K-573-2-1 as male parents, constituting 225 cross combinations. The progenies and the parents were genotyped with 17 QC SNP markers via high-throughput KASP genotyping assay. The QC markers differentiated the parents with mean efficiency of 37.90% and a range of 3.4–82.8%, revealing unique fingerprints of the parents. Neighbor-Joining cladogram divided the 222 parents into 3 clusters. Genetic distances between parents ranged from 0 to 3.74 with a mean of 2.41. Principal component analysis (PCA) depicted a considerable overlap between parents and F1 progenies with more scatters among parents than the F1s. The differentiation among parents and F1s was best contributed to by 82% of the markers. As expected, parents and F1s showed a significant contrast in proportion of heterozygous individuals, with mean values of 0.02 and 0.32, respectively. KASP markers detected true hybridity with 100% success rate in 72% of the populations. Overall, 79% of the putative F1 plants were true hybrids, 14% were selfed plants, and 7% were undetermined due to missing data and lack of marker polymorphism between parents. The study demonstrated an effective application of KASP-based SNP assay in fingerprinting, confirmation of hybridity, and early detection of false F1 plants. The results further uncovered the need to deploy markers as a QC step in a breeding program.
Introduction
Cowpea [Vigna unguiculata (L.) Walp.] is a predominantly self-pollinated crop and a diploid (2n = 2x = 22) with genome size of 640.6 Mbp (Lonardi et al., 2019). Cowpea is one of the most important legume crops cultivated and consumed in dry areas of the tropics and subtropics (Boukar et al., 2016). The crop plays vital roles as a nutritional and food security crop and generates income for farmers and food vendors. On average, cowpea grains contain 25% protein, 53.2 mg/kg iron, 38.1 mg/kg zinc, 826 mg/kg calcium, 1,915 mg/kg magnesium, 14,890 mg/kg potassium, and 5,055 mg/kg phosphorus (Boukar et al., 2011). The crop is also an important source of nutritious fodder for ruminants mainly in the Sahel regions of West and Central Africa (Boukar et al., 2016, 2019). Global annual cowpea production is estimated at 6.5 million metric tons on about 14.5 million hectares (Boukar et al., 2016; Kebede and Bekeko, 2020). Of the total world production, about 83% is obtained in Africa, with West Africa accounting for 80% of African production, and Nigeria taking the lead in world production and consumption. Despite the importance of cowpea, its productivity is still below expectation in most African countries due to attack by multiple insect pests, diseases and parasitic weeds, as well as drought, heat, and low soil fertility (Carsky et al., 2001; Agbicodo et al., 2009; Boukar et al., 2016, 2018; Togola et al., 2017, 2020; Ongom et al., 2021). These constraints, if not mitigated by crop improvement through plant breeding, will continually dwindle the future of cowpea, denying farmers and consumers the opportunities to reap the potential benefits of agricultural productivity and food and nutrition security from this crop. Among multiple mitigation measures that have been advanced to curve the highlighted challenges in cowpea production, the deployment of cultivars that display resistance and/or tolerance to the stresses in farmers’ fields has been the focus of breeding programs in many research institutions.
Conventionally, the development of an improved cultivar involves an initial step in hybridization among selected parental lines having attributes of interest such as higher yield, resistance to any of the stress causing factors. This is then followed by advancing the progenies through repeated self-pollination until the lines are homozygous and stable before extensive testing are conducted to identify improved lines (Khanna, 2018; Osei et al., 2020). This process is lengthy and costly, yet the eventual creation of the intended variation through hybridization and the ability to further study the genetics of cowpea cultivar development requires validity of the initial cross. First, the parents of a cross should not be genetically similar in order to maximize the diversity for selection and improvement (Mafakheri et al., 2017; Nkhoma et al., 2020). It is therefore advantageous to fingerprint parental lines and assess relatedness prior to hybridization. Secondly, the progenies being advanced must be a product of successful cross pollination so as to capture the intended inheritance of trait combinations while maintaining an optimal level of diversity in the breeding program. Cowpea, being a highly self-pollinated crop, is inherently and botanically designed to avoid outcrossing. Consequently, hybridization requires special techniques to remove the anthers just before selfing occurs (Myers, 1996). Therefore, inaccurate timing of flower emasculation may result in self- pollinated plants and not true F1 hybrids as the breeders intended. This quickly becomes a quality concern in breeding programs that often produce thousands of crosses. A routine best practice in modern breeding programs incorporates quality control (QC) steps by leveraging molecular breeding tools at stages in the breeding workflow that optimize the cost benefit of delivering high quality cultivars. It has been observed that crossing in cowpea by hand emasculation is relatively easy compared to some other legumes given that its flowers are large and easy to manipulate, the keel is straight, beaked and not twisted. However, the success rate is reportedly as low as 10–20% (Myers, 1996). This low success rate is attributable to high flower abscission due to mechanical handling during emasculation (Myers, 1996). Interestingly, out of the perceived successful crosses, some end up as self-pollinated plants having escaped the manual cross-pollination process. Without any quick detection technique, these escapes would not be easily detectable, constituting in potential wasted time and resources that would be carried forward in the breeding program. Efficient and optimized breeding programs include routine QC to eliminate the false F1 plants early enough to make the most impact with the resources available (PASSeL, 2019). With the advancements in genetics, molecular biology and tissue culture, plant breeding is now increasingly being carried out using molecular genetic tools (Tester and Langridge, 2010; Boukar et al., 2018, 2020; Khanna, 2018). Parental fingerprinting and hybridity tests, which are among the key aspects of QC in the breeding process can now be conducted using molecular markers (Weerasinghe et al., 2004; Wu et al., 2010; PASSeL, 2019; Osei et al., 2020). The past few decades have witnessed notable progresses in the evolution of molecular marker systems and the detection platforms (Mammadov et al., 2012). Of all the marker systems, single nucleotide polymorphism (SNP) has become a standard marker type of choice in molecular breeding and genetics due to its specificity and abundance in the genome coupled with ease of automation and high-throughput detection system (Mammadov et al., 2012; Jiang, 2013). The wide-scale use and application of SNP markers in molecular breeding has been enabled by the development of user-friendly tools and platforms (Jiang, 2013). For greater precision and effectiveness in marker assisted selection (MAS), multiplex detection system for SNPs has been developed (Jiang, 2013; Bernardo et al., 2015; Nadeem et al., 2018). KASP, developed by Laboratory of the Government Chemist (LGC) Genomics (Braae et al., 2014) is an example of a recently developed multiplexed SNP marker detection system that combines several markers in a single assay (Nadeem et al., 2018). It is a standardized technology whereby genotyping is based on fluorescence. The technique rests on an allele-specific oligo extension and fluorescence resonance energy transfer that are used for signal detection (Braae et al., 2014; Nadeem et al., 2018). The KASP assay, together with other types of markers, have been applied successfully for germplasm diversity analysis or fingerprinting and hybrid purity tests in several crops including tomato (Osei et al., 2020), melon (Kishor et al., 2020), lettuce (Patella et al., 2019a), rice (Yashitola et al., 2002; Sundaram et al., 2008), maize (Patella et al., 2019a), and cotton (Selvakumar et al., 2010).
Recently in cowpea, there has been tremendous efforts to develop genomic resources to facilitate molecular-aided breeding. In this regard, Muchero et al. (2009a) developed an Illumina 1,536-SNP GoldenGate genotyping array for cowpea derived from 183,118 expressed sequence tags (ESTs). Out of these, 928 quality SNPs were incorporated into a consensus genetic map of cowpea, developed based on 741 recombinant inbred lines derived from 6 mapping populations. This linkage map spans 680 cm with 11 linkage groups and an average marker distance of 0.73 cm. This linkage map provides a framework for molecular marker deployment in cowpea breeding. In addition, a whole-genome shotgun (WGS) assembly and a bacterial artificial chromosome (BAC) physical map were developed from the IITA cowpea variety IT97K−499−35 (Muñoz-Amatriaín et al., 2017). These genomic resources allowed the development of 51,128 Illumina Cowpea iSelect Consortium Array (Muñoz-Amatriaín et al., 2017). Several of these SNPs were utilized to develop KASP markers and are available either as trait-linked markers for marker-assisted breeding or for QA/QC system (Huynh et al., 2015; Boukar et al., 2016, 2018). A database of available KASP markers for QC in cowpea is obtainable from Excellence in Breeding platform at https://excellenceinbreeding.org/module3/kasp. However, the effectiveness of these QC markers for large scale detection of F1 hybridity in cowpea and the rate of success in obtaining true F1s in highly productive breeding programs are not well-documented. The objective of the present study was to evaluate the genetic relationships among cowpea parental lines and determine the hybridity of resultant putative F1 progenies for further advancement in the program using KASP-based SNP assay. The study highlights the significance of molecular marker deployment for QC in cowpea breeding and corroborates the efforts toward optimization of the breeding program for increased genetic gain.
Materials and Methods
Plant Materials
Parental lines consisted of 89 lines recycled from Initial Evaluation Trial (IET), 31 lines from Preliminary Yield Trials (PYT), 85 from Advanced Yield Trials (AYT), and 15 landraces, making a total of 220 female parents (Table 1). These were crossed with two male sister lines (IT99K-573-1-1 and IT99K-573-2-1) developed by IITA and are known to be sources of striga resistance. The line IT99K-573-2-1 was used as a male for 15 IET and 2 PYT lines while the rest of the crosses involved IT99K-573-1-1 as a male parent. Five of the female lines were used twice, that is, they received pollen from both males. Overall, 222 parents were used to create 225 unique cross combinations that gave rise to a total of 1,436 F1. The F1 plants were technically half-sibs given that the progenies share two sister lines as their male parents but with different female parents. Sources of parental lines and statistics of the crossing design is provided in Table 1.
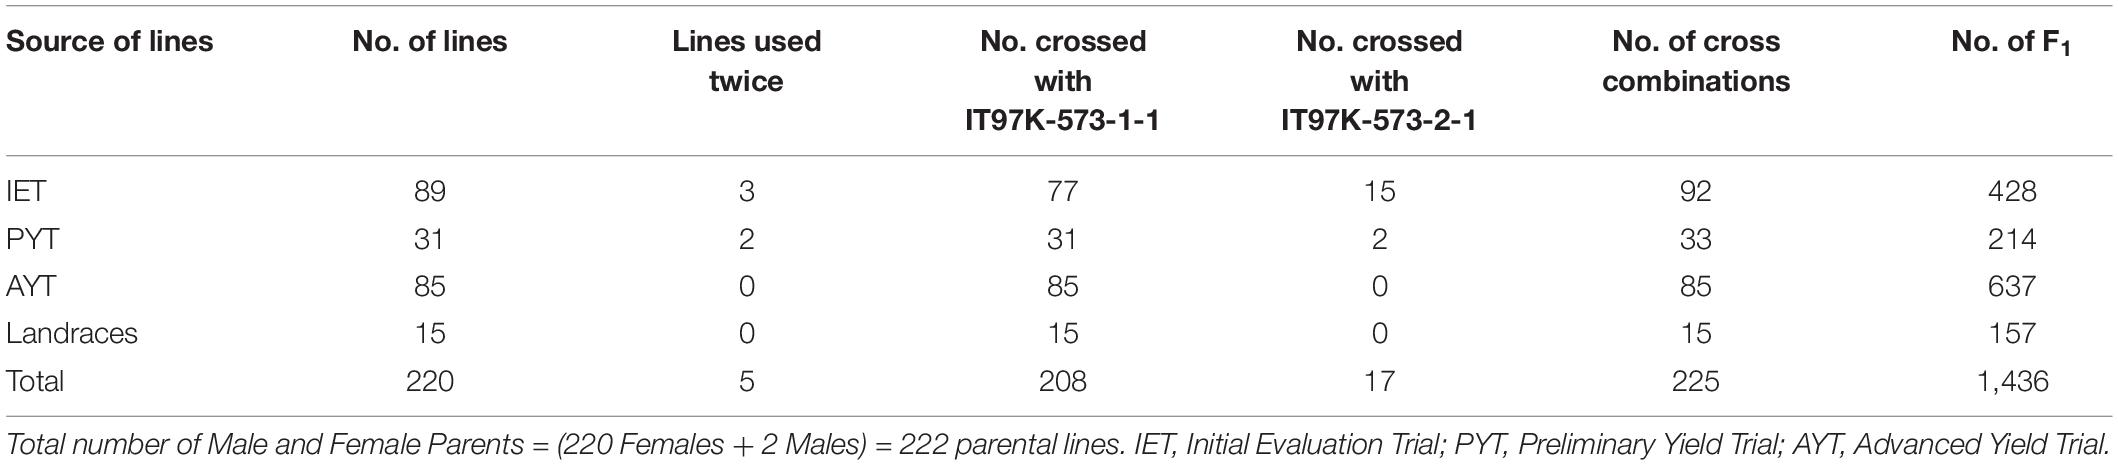
Table 1. Source of parental lines and the statistics of the crossing structure.
Emasculation and Pollination
Parental lines were planted in pots of size 24 cm (height) × 25.4 cm (diameter), three-quarter filled with sterilized topsoil, and placed on the crossing benches in the screenhouse at IITA research station in Kano (Figure 1A). Each pot planted with three seeds of the same cowpea line and after emergence the plants were well-managed through application of fertilizer and regular spraying against insects. At flowering stage, cross pollination was conducted following the rapid hand emasculation technique developed by IITA (Myers, 1996). Pollination consists of removing the upper half of the petals starting with a partial cut opposite the stylar and staminal section, exposing the upper portion of the style, stigma, and stamens. This is followed by removal of the 10 pollen sacs with forceps. To reduce cross contamination, the forceps was sterilized with 75% ethanol in between hybridizations, and care was also taken to avoid touching the receptive green tipped stigmatic surface before pollinating. The emasculated flower buds were pollinated with freshly opened flower. The mass of pollen on the hairy-necked style was used as a brush to deposit pollen grains on the stigma. A small tag listing the cross and date was affixed to the pedicel beneath the pollinated bud. A summary of the steps followed during emasculation and pollination have been provided in Figure 1B. The developing pods following cross pollination were well-maintained through regular watering of the plants, fertilizer application, and protection against insects. At maturity the tagged pods were harvested, threshed, and resulting F1 seeds stored.
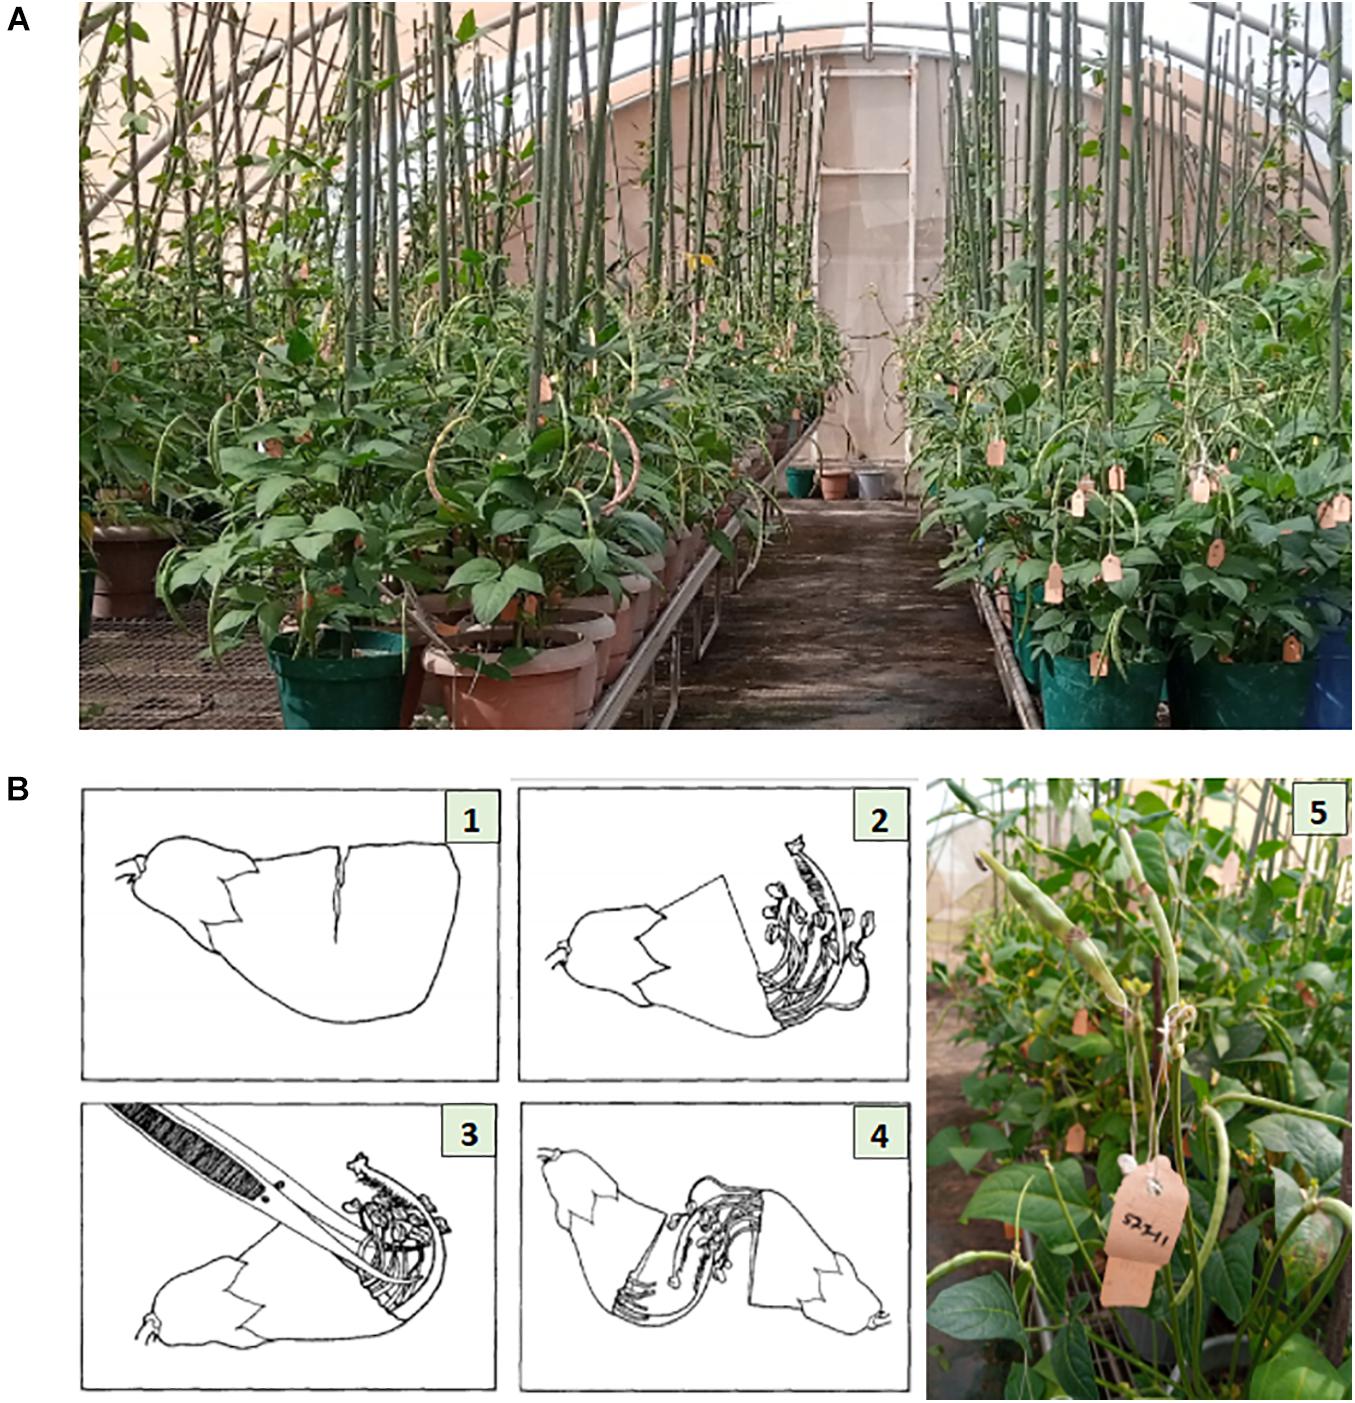
Figure 1. Illustration of cowpea crossing procedure. Panel (A) shows the cowpea crossing block with genotypes growing in pots placed on crossing benches in a screen house at IITA research station, Kano Nigeria. Panel (B) depicts the crossing steps: (1) Cut about two-thirds the width of the unopened bud. (2) Gently tear off the cut segment exposing the anther sacs. (3) Remove all anther sacs with forceps. (4) Pollinate the emasculated bud. (5) Fix a tag beneath the pollinated bud, listing the cross and the date of pollination. Photo source: Illustration 1–4 is adopted from Myers (1996), Photo (A,B)-5 were taken from IITA cowpea crossing block, Kano Nigeria.
Leaf Tissue Sampling for DNA Analysis
F1 seeds from each of the 225 crosses (or populations) were planted in the screenhouse in new pots and placed on the crossing benches. At 2 weeks after planting, a young trifoliate leaf from each F1 plant was sampled for DNA analysis. The sampling was done according to the required procedure by Intertek-Agritech laboratory (Intertek-Agritech, 2016). First, unique sample identifications (UIDs) were generated from the EiB galaxy website1 and these were used to track the samples throughout from the time of sampling up to genotyping. The F1 plants to be sampled were labeled and a single hole-puncher (6.0 mm diameter) was used to punch and collect two leaf discs per sample from young and healthy newly developed trifoliate leaf. The punched leaf discs from each sample were transferred with forceps directly into a single well of 96-well plates (1.2 ml AbGene Storage Plate, number AB0564, Thermo Fisher Scientific). Wells H11 and H12 of the sampling plates were left blank as control wells according to Intertek-Agritech lab standard protocol. The forceps were cleaned before and after placing each sample in a well to avoid cross contamination. The sample plates were later placed in a box containing silica gel and allowed to dry slowly for 2 weeks. The 96-well sample plates were sealed with sealing mats (AB0674, Thermo Fisher Scientific), wrapped in plastic bags, secured firmly and shipped for DNA isolation and KASP genotyping to Intertek-Agritech laboratory in Sweden.2
DNA Isolation and Genotyping
High throughput DNA extraction was achieved with the aid of robotics at the Intertek-Agritech lab. Genotyping was done based on KASP assay for 17 cowpea QC SNP markers. QC SNP markers for hybridity testing were selected by leveraging a previous study where cowpea parental accessions were genotyped with a 1,200 SNP Illumina GoldenGate assay (Muchero et al., 2009a). Marker selection considered a set of criteria to establish a SNP panel that could serve a broad range of cowpea breeding pools. In order to set up an assay relevant for different cowpea breeding pipelines, each SNP was considered for neutrality such that the probability of genotype calls for allele 1 and allele 2 across a diverse set of cowpea accessions were near 50%. If SNP calls were not neutral, i.e., calling allele 1 >75% of the time (or calling allele 2 > 75% of the time), those markers were considered biased and not considered for the QC SNP markers. In addition, SNPs were also selected for low percent heterozygosity (<4% heterozygous calls). Finally, with exception of linkage groups 1, 2, and 8 where one marker each was found to meet the technical validation criteria, two markers were selected per linkage group and to the extent possible, spread across the genetic map capturing regions at opposite ends of the centromere in order to maximize ability to capture recombination and probable crossovers. Once markers were selected, LGC genomics furthered the assay development leveraging the KASP marker system for cowpea genotyping (Boukar et al., 2016). The list of SNP markers and their genomic positions have been provided in Table 2 and are also accessible through excellence in breeding (EiB) platform.3
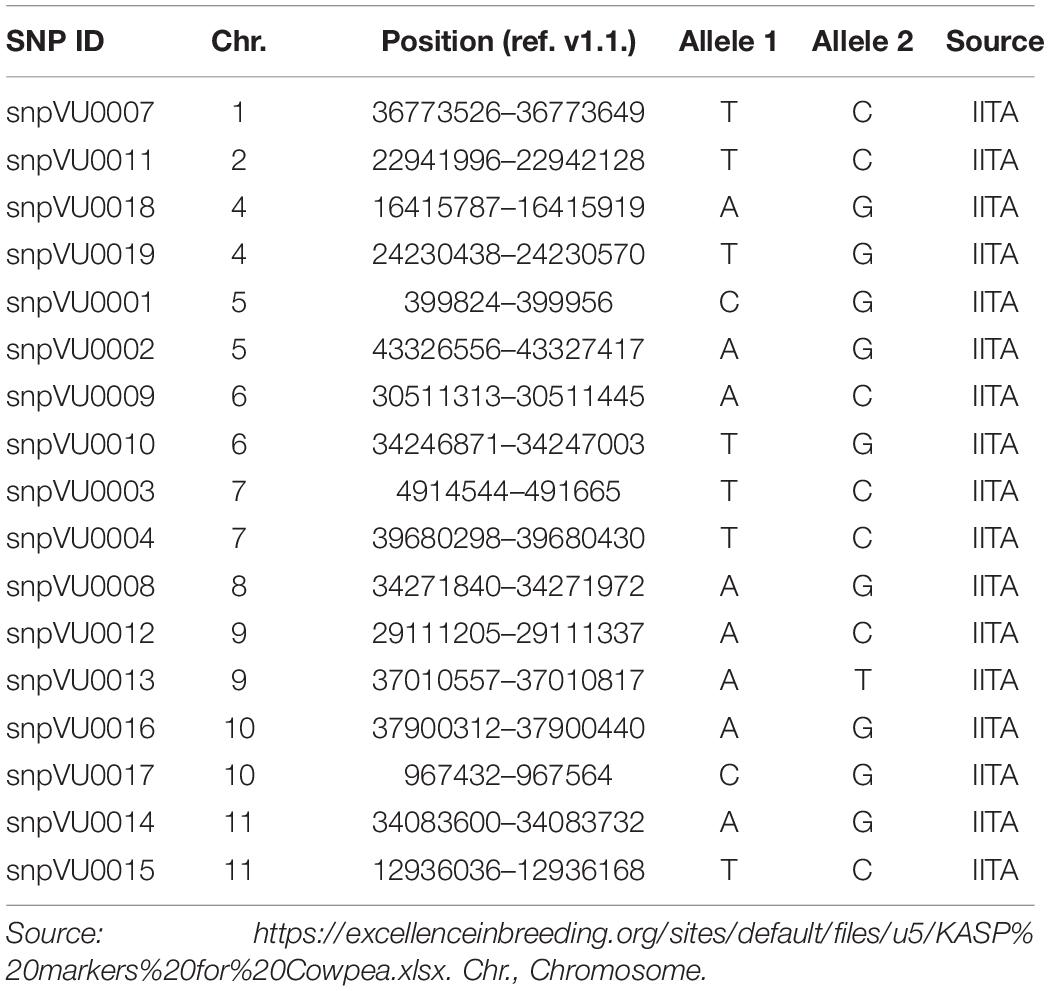
Table 2. Quality control (QC) Kompetitive Allele-Specific PCR (KASP) markers used for hybridity test.
Statistical Analysis
Data Quality and Estimates of Genetic Parameters
Genotyping data from Intertek-Agritech lab were examined for completeness and quality using SNPviewer genotyping software developed by BIOSEARCH TECHNOLOGIES/LGC genomics.4 The software allows genotyping data to be visualized as a cluster plot on a plate-by-plate basis, revealing the clusters that group the similarity in genotyped allele calls. We were therefore able to evaluate and confirm the genotype call of each sample relative to the genotyping data obtained. A representative cluster plot for the first four SNPs in plate one is presented in Supplementary Figure 1-1. Genotyping data was converted into a HapMap file format and subjected to QC analysis in TASSEL 5 (Bradbury et al., 2007) by filtering for missingness and minor allele frequency (MnAF). Summary statistics for extent of missing data, overall heterozygosity and average MnAF for the filtered data was generated using the “Geno Summary” function of the data panel in TASSEL and output exported to R for graphical visualizations. Overall, average polymorphism information content (PIC) for markers using data on both F1 and their parents was estimated from the allele frequencies according to Anderson et al. (1993) as:
where; i = the ith allele of the jth marker, n = the number of alleles at the jth marker, and p = allele frequency.
Analysis of Polymorphism and Marker Efficiency
To determine polymorphism of markers between the parents of the F1s, the genotyping data were sorted in Microsoft Excel to bring the 225 cross combinations together. The SNP markers that differentiated between each pair of parents in a cross were identified and the numbers recorded. The proportion of polymorphic markers in each cross were obtained as a ratio of the number of polymorphic markers to the total number of markers used, expressed as:
where; Pm is the number of polymorphic markers per pair of parents and Tm is the total number of markers used to genotype the pairs of parents.
To assess the efficiency of each marker in differentiating between the parents of a cross, each marker was evaluated for polymorphism across all the 225 parental pairs using a score of 1 = Polymorphic, 0 = Not polymorphic, NA = missing data (Supplementary File 1-1). The scores were then used to compute the performance of each marker by counting the number of times a marker was polymorphic in the pool of 225 parental pairs. Marker efficiency was computed as:
where; fm is the frequency of marker polymorphism among parental pairs (i.e., the number of times a marker is polymorphic across 225 parental pairs), Tc is the total number of parental combinations (excluding pairs with missing SNP calls). The computed marker efficiency was used to visualize the performance of each marker using a bar plot generated in R studio version 3.6.2 (R Core Team, 2019).
Analysis of Genetic Relationships
The KASP fingerprints of the 222 parents were used to evaluate genetic relatedness among the parents. The data was restricted to parents and a genetic dissimilarity analysis was conducted in TASSEL 5. For this analysis, parental lines with more than 10% of missing SNP data were removed, leaving 184 lines for diversity analysis. A second data set merging SNP data for both the F1 and parents was used to assess the relationships among the progenies and their parents. Genetic relationship trees were created using Neighbor-Joining clustering method (Nei and Saitou, 1987) and visualized using Archaeopteryx tree viewer in TASSEL 5. Principal component analysis (PCA) was conducted using the merged data to assess the contributions of markers and the relationship between the progenies and their parents. PCA values were generated using the prcomp() function in base R. A scree plot and cumulative variance plot depicting amount of variance explained by PCs were generated using screplot() and cumsum() functions of base R, respectively. PCA visualizations for marker contributions and parents vs. F1 scatters were performed utilizing factoextra R package (Kassambara and Mundt, 2020).
Hybridity Assessment
Initially, a general comparison was made between the F1s and the parents based on the proportion of heterozygosity obtained from TASSEL 5. The distributions of heterozygosity level between F1s and the parents were visualized using bar charts and box plots in R. Determination of the hybrid status of all F1s were based on the number of polymorphic loci that were heterozygous. Therefore, for each F1 sample, counts of SNPs detecting it as a true hybrid (heterozygous) were made and expressed as a ratio of the total number of markers that were polymorphic between its parents. Hybridity status of each F1 plant was computed as:
where; Lhet is the number of polymorphic SNPs detecting an F1 as heterozygous (true hybrid), Pm is the total number of SNPs that are polymorphic between the parents of a particular F1. Samples scoring <20% hybridity were regarded as untrue F1 (self). A pie chart was used to summarize the hybridity of the F1 samples into four categories: (i) successful (these are true F1s with hybridity scores of more than 20%), (ii) failed (these are untrue F1s which are products of self-pollination), (iii) undetermined due to missing data, and (iv) undetermined due to lack of polymorphism between the parents. In addition, a summary of hybridity success rate per population/cross was obtained a ratio of the number of true F1 plants in a cross divided by the total number of F1 plants in that cross.
Results
Marker Properties and Efficiencies
To evaluate the accuracies with which the hybridity of the progenies were measured, the allele frequencies of SNP markers, locus heterozygosity (proportion of individuals identified to be heterozygous at specific marker locus), polymorphism information content (PIC) and the extent of missingness in the entire dataset were examined and the results are presented in Figure 2. The SNP markers showed variation in the genetic estimates, with snpVU00007 having the lowest values for MnAF, PIC, and proportion of heterozygous loci among both F1s and the parents, while snpVU00008 had the highest values. When both F1 and their parents were considered together, the average major allele frequency (MAF), MnAF, PIC, and heterozygosity were 0.76, 0.24, 0.29, and 0.32, respectively (Figure 2A). The MAF among F1 and parents ranged from 0.53 to 0.99, while MnAF varied from 0.01 to 0.4. Proportion of heterozygous loci among F1 and parents ranged from 0.02 to 0.58 and PIC ranged from 0.03 to 0.5. Similar values were observed when parents were considered alone except for proportion of heterozygous loci, where low proportions ranging from 0.0 to 0.7 and a mean of 0.02 were recorded (Figure 2B). In both cases, the patterns of MnAF, PIC, and heterozygosity per marker locus were similar and portrayed a sharp contrast with MAF. That is, the loci that showed high MnAF, PIC, and heterozygosity had low proportions of major allele frequencies and vice versa. These genetic properties provided a picture of which markers were more informative and could therefore accurately differentiate between parents and identify the true hybrids.
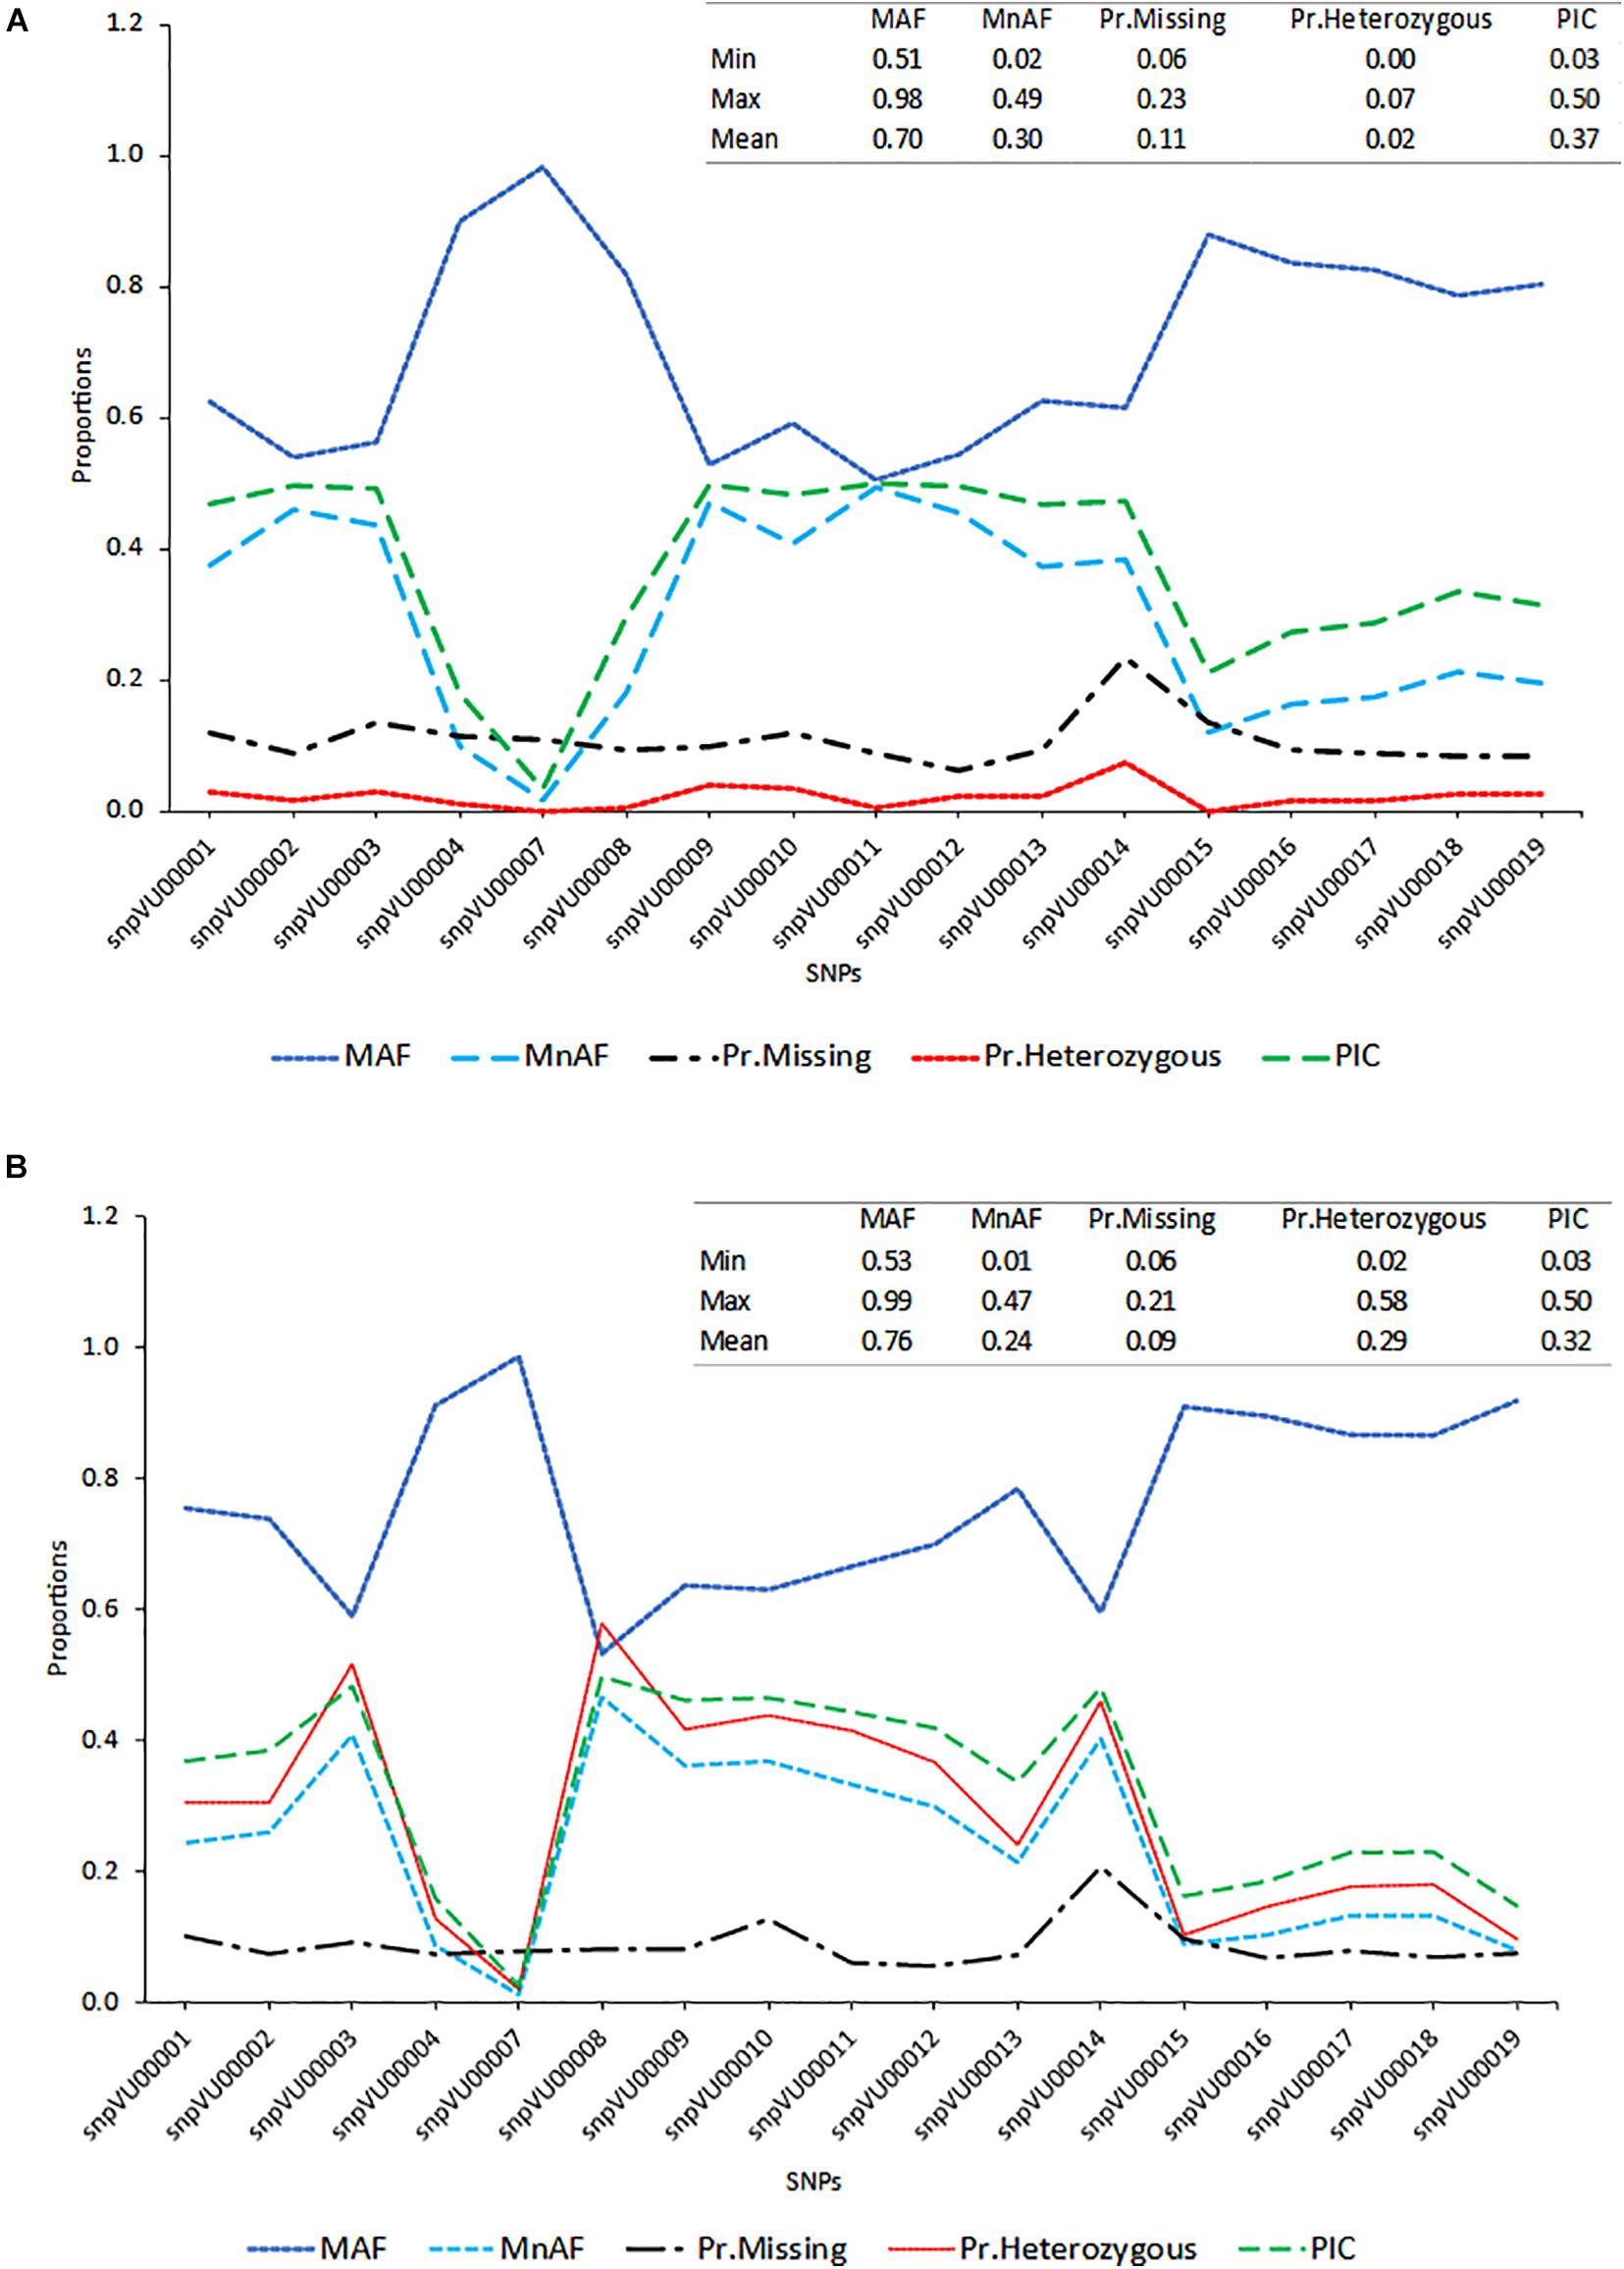
Figure 2. Distribution of major allele frequency (MAF), minor allele frequency (MnAF), proportion of locus heterozygosity (Pr.Heterozygous), proportion of missing data (Pr.Missing), and polymorphism information content (PIC). (A) Line graph based on combined data of both F1s and their parents. (B) Line graph based on data for parents alone. Inserts on the top right-hand corner of both graphs depicts summary statistics (Minimum, Maximum, and Mean values) of the estimated parameters.
To further assess the effectiveness of the markers, the efficiencies were computed based on their ability to distinguish between the parents involved in a specific cross combination. The SNP markers displayed variable levels of polymorphisms between the parent combinations (Figure 3). The analysis revealed that snpVU00008 was polymorphic across several pairs of parents and therefore, it was the best marker with 82.2% efficiency while snpVU00007 was the least polymorphic and the least efficient marker (Figure 3A). The overall mean efficiency of markers in distinguishing between different pairs of parents was 37.90% with a range of 3.40–82.80%.
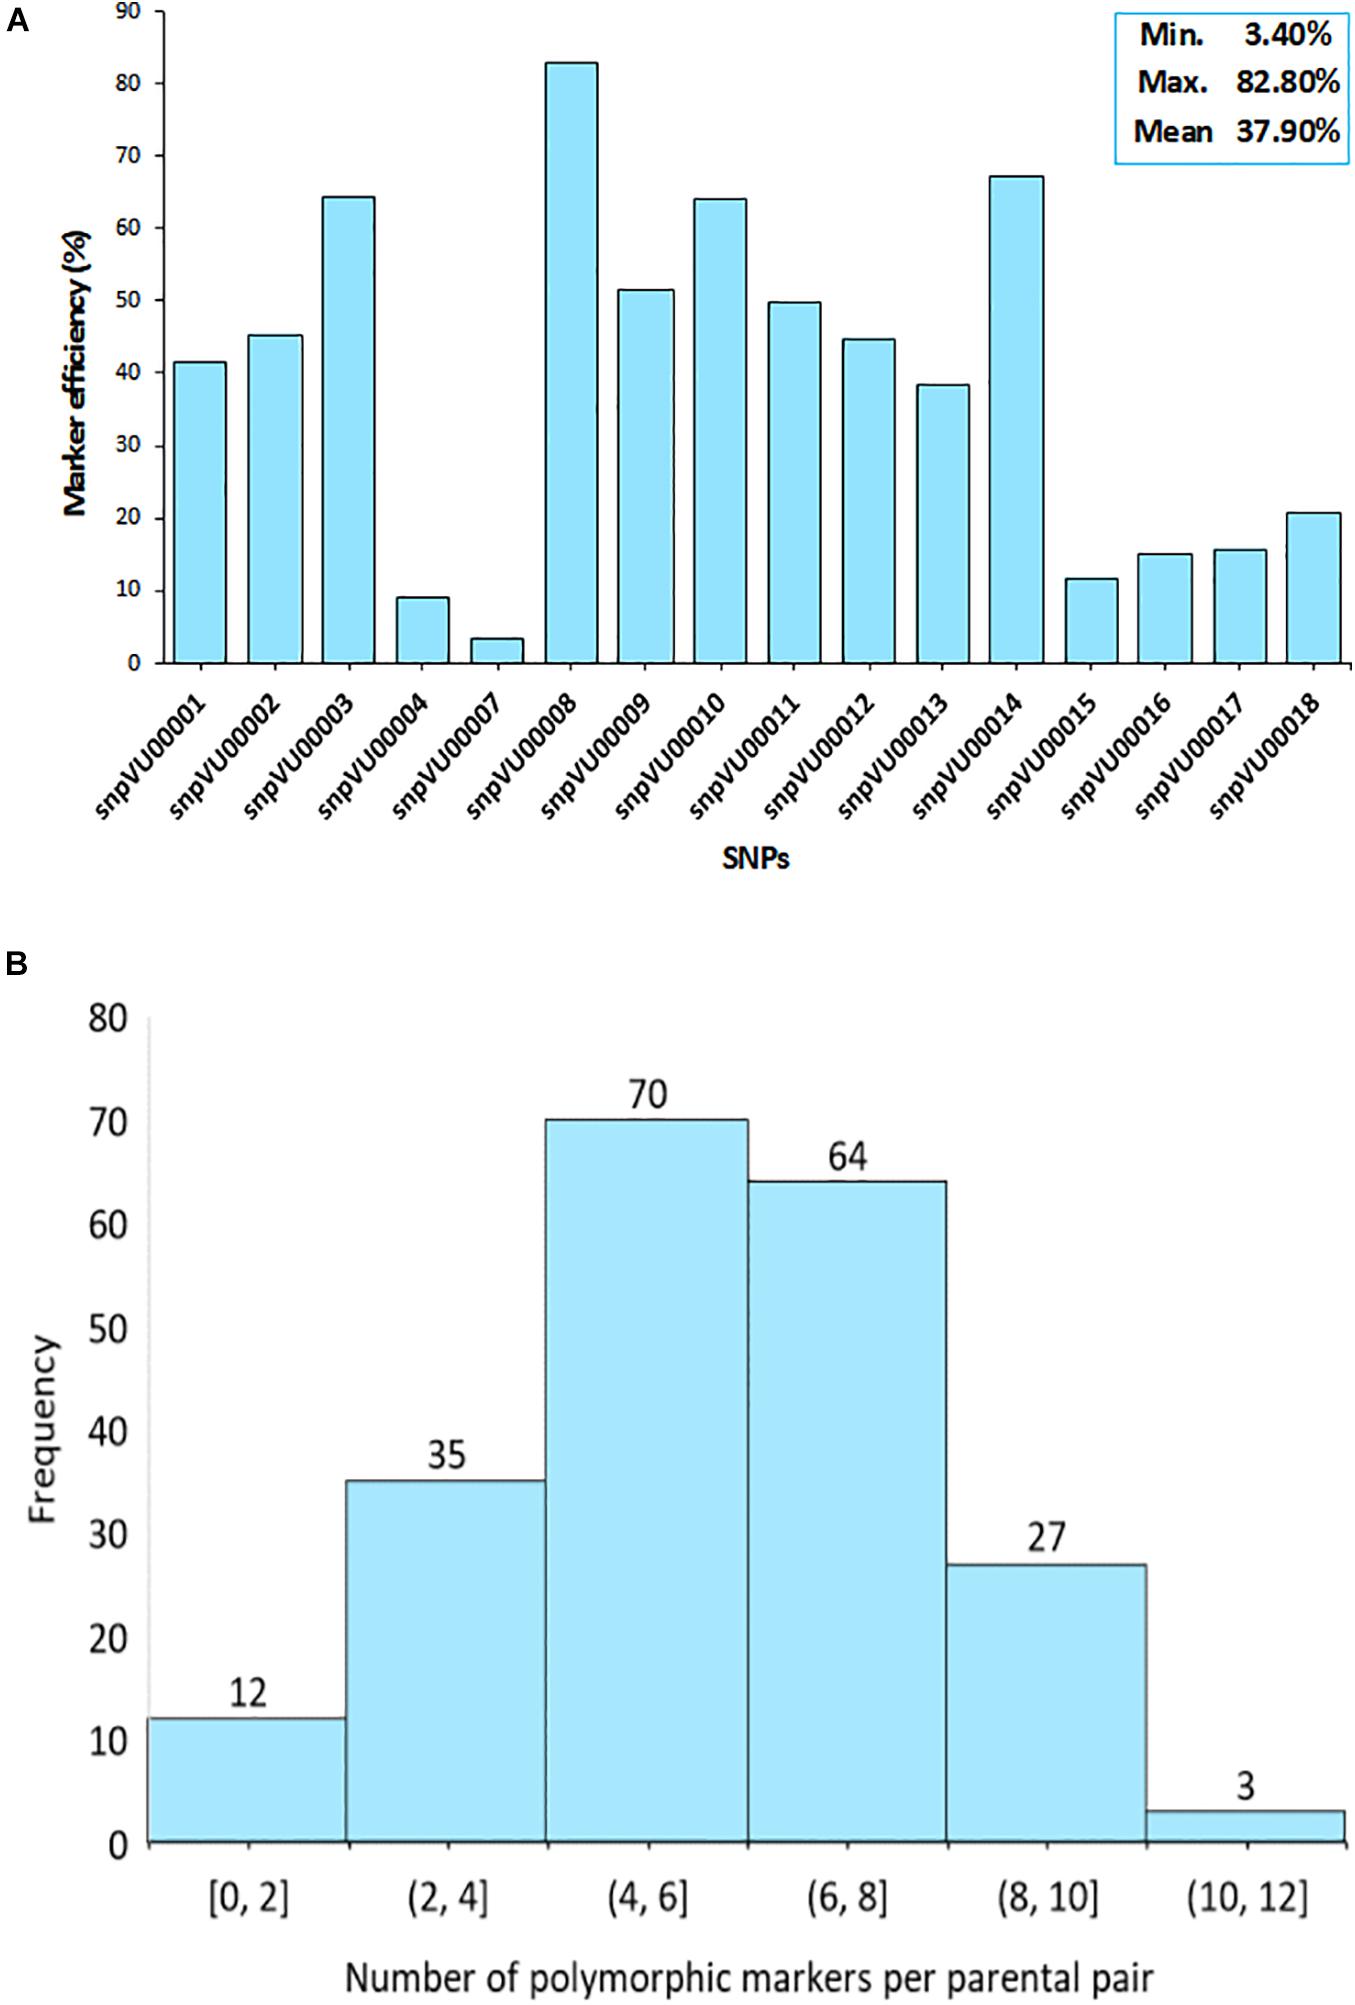
Figure 3. Informativeness of markers in differentiating parental pairs. (A) Bar chart shows the efficiency of each single nucleotide polymorphism (SNP) marker in distinguishing between pairs of parents. Insert on top right-hand corner is the summary statistics for marker efficiency indicating the Minimum, Maximum, and the Mean values. (B) Histogram depicts the distribution of polymorphism among pairs of parents as a measure of marker efficiency. Percentage of polymorphic markers in a cross is shown on the x-axis while the number of crosses is on the y-axis.
Consequently, there were some pairs of parents in which the level of marker polymorphisms was very low. This is depicted by the histogram in Figure 3B, where about 12 pairs of parents on the left tail of the distribution had between 0 and 2 informative markers. The number of informative markers in the rest of cross combinations ranged from 4 to 12 markers, with 4–6 informative markers being the most frequent. Marker polymorphism scores reflecting the number and percentage of polymorphic markers for each cross combination is presented in Supplementary File 1-1. The affected parental combinations with zero parental marker polymorphism included 2130-1x573-1-1 and 2091-2x573-2-1.
Parental Fingerprints and Genetic Relationships
The KASP-based SNP fingerprints of all 222 parental cowpea lines is presented in Supplementary File 1-2. A total of 16 parents (7%) had unreliable fingerprints due to missing SNP information of more than 55%, while the KASP fingerprints of 209 other parents were of high quality, the profiles of which are suitable for future identity of these parents. Based on these fingerprints, the parents were found to display variable genetic relationships. Neighbor-Joining clustering algorithm divided the parents into three major groups (Figure 4A). A considerable diversity was still detectable within each of the sub-clusters. Cluster I harbored the highest number of parental lines including the landraces and was the most diverse cluster. The two male parents IT99K-573-1-1 and IT99K-573-2-1 occupied Cluster III and were close together in the same tree branch. Interestingly, all the landraces showed close genetic relationships and they occupied the same tree branch in Cluster I. However, when the landraces were considered alone, the diversity among them were noticeable (Figure 4B). The landraces formed three sub-groups with Bahaushe1, Bahaushe1, Aloka, Gwalam, silver brown, and Drum1 being in Group I, while Danmisra, Kanannado, Danila, Bosad, Oloyin, and Kalbas were in Group II, and Iron bean and Iron brown eye forming in Group III. Pairwise Euclidean genetic distances between 184 parents that had sufficient SNP calls ranged from 0 to 3.4 with a mean distance of 2.40 (Supplementary File 1-3). When we considered the relationships between 1 of the male parents IT99K-573-1-1 and the females, 19 pairs were found to have genetic distances below 2.0. Considering all the pairwise comparisons, a total of 183 parental pairs were identified to have genetic distances of <2.0 (Supplementary File 1-3).
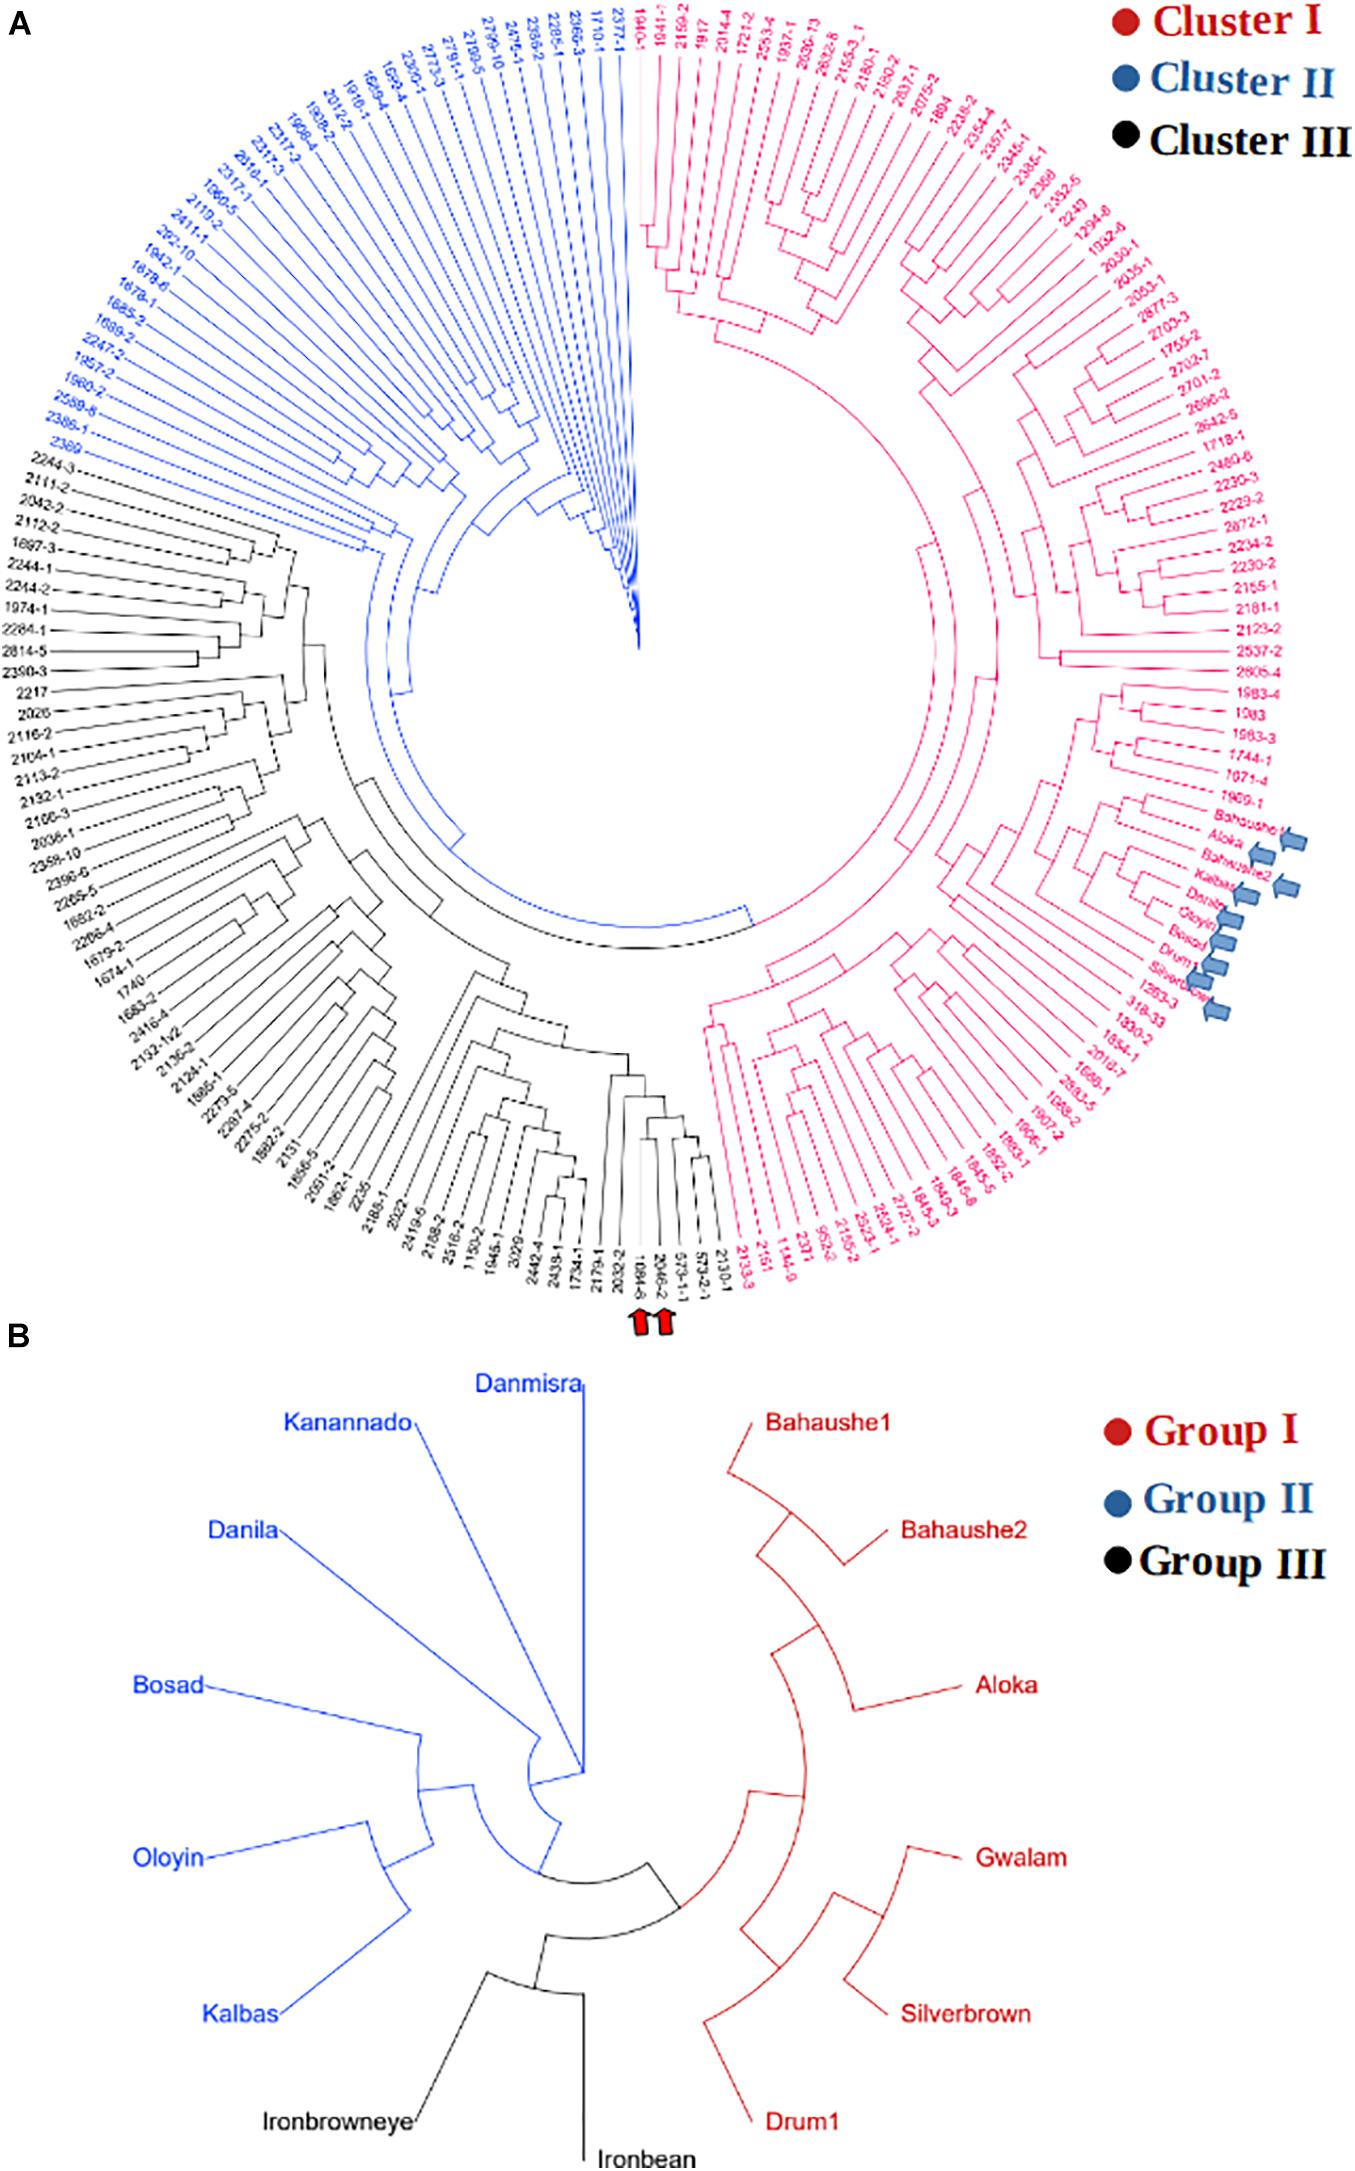
Figure 4. Relationship among parents that were used to derive the F1 progenies. (A) Cladogram showing grouping of parents into three clusters. The two elite varieties IT99K-573-1-1 and IT99K-573-2-1 were used as males and are emphasized in panel (A) by the red arrows, while cluster harboring the landraces are shown by the blue arrows. (B) Cladogram of landraces only, showing diversity among them despite being grouped together in Cluster I of panel (A).
A clustering of both parents and the F1 hybrids based on SNP markers is presented in Figure 5. The genotypes were grouped into four main clusters, hereafter, referred to as the “Group I,” “Group II,” “Group III,” and “Group IV,” and the parents were clearly divergent from each other, as they are distributed throughout the four clusters. That is, the parents did not form any unique or a separate cluster of their own but were spread across all the four groups. Crosses involving the landraces were mostly clustered together with their parents in Group II. This group contained over 248 F1 progenies, of which 200 F1s carried alleles from a local varietal parent. Cluster analysis also revealed that over 286 F1 plants shared the same main cluster (Group I) with the 2 male parents IT99K-573-1-1 and IT99K-573-2-1. Groups III and IV had the highest number of progenies with 335 and 346 F1s, respectively.
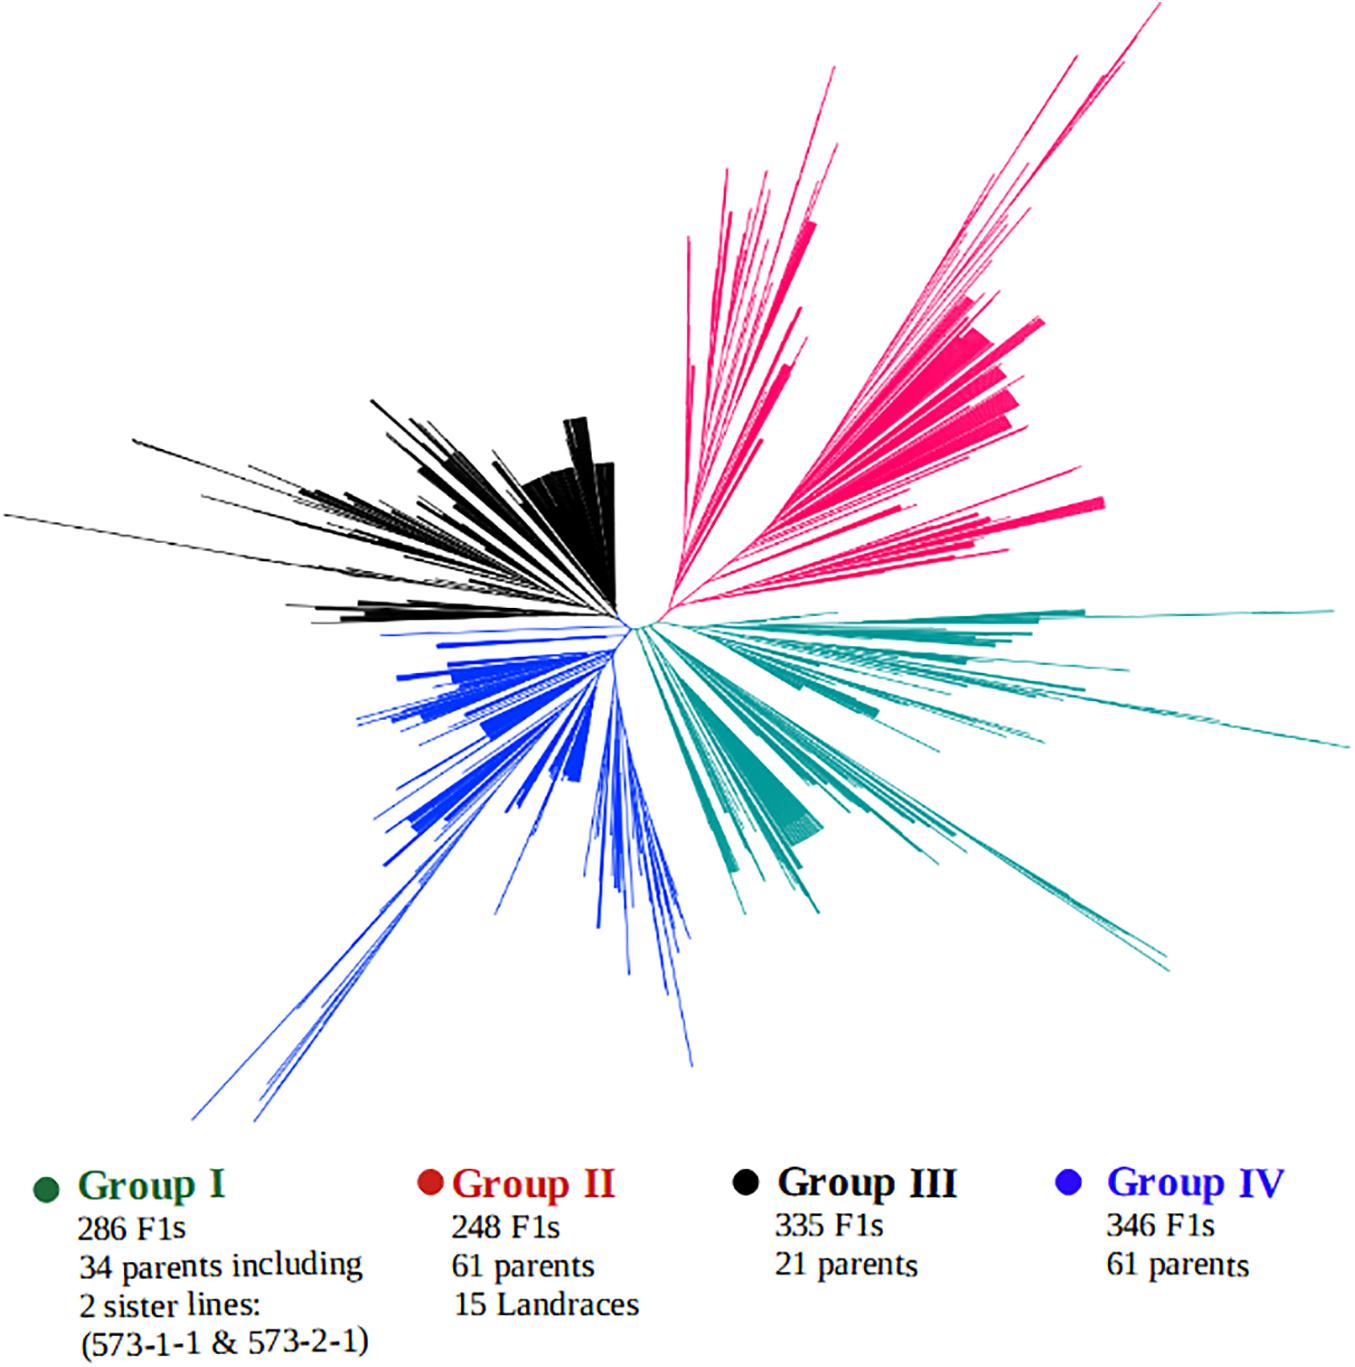
Figure 5. Clustering of F1 hybrids and the parents using 17 KASP-based single nucleotide polymorphism (SNP) markers. Four sub-groups were formed with parents distributed across all the groups. Group II contained the local varieties while Group I harbored the two male parents IT99K-573-1-1 and IT99K-573-2-1.
Based on SNP data, PCA using the combined F1 and parents showed the first 2 PCs to account for about 35% variation and it required 10 PCs to account for over 90% of total variance (Supplementary Figure 1-2). About 14 markers (82%) contributed most to the observed variation with snpVU00012 and snpVU00008 being the highest contributors, while snpVU00007 and snpVU00019 were the least contributors (Figure 6A), a result that is analogous to the outcome of polymorphism and marker efficiency analysis in Figures 2, 3. The PCA results depicted a majority of the F1 progenies to be closer together while the parents were widely distributed such that the F1s were a sub-set of the parents (Figure 6B).
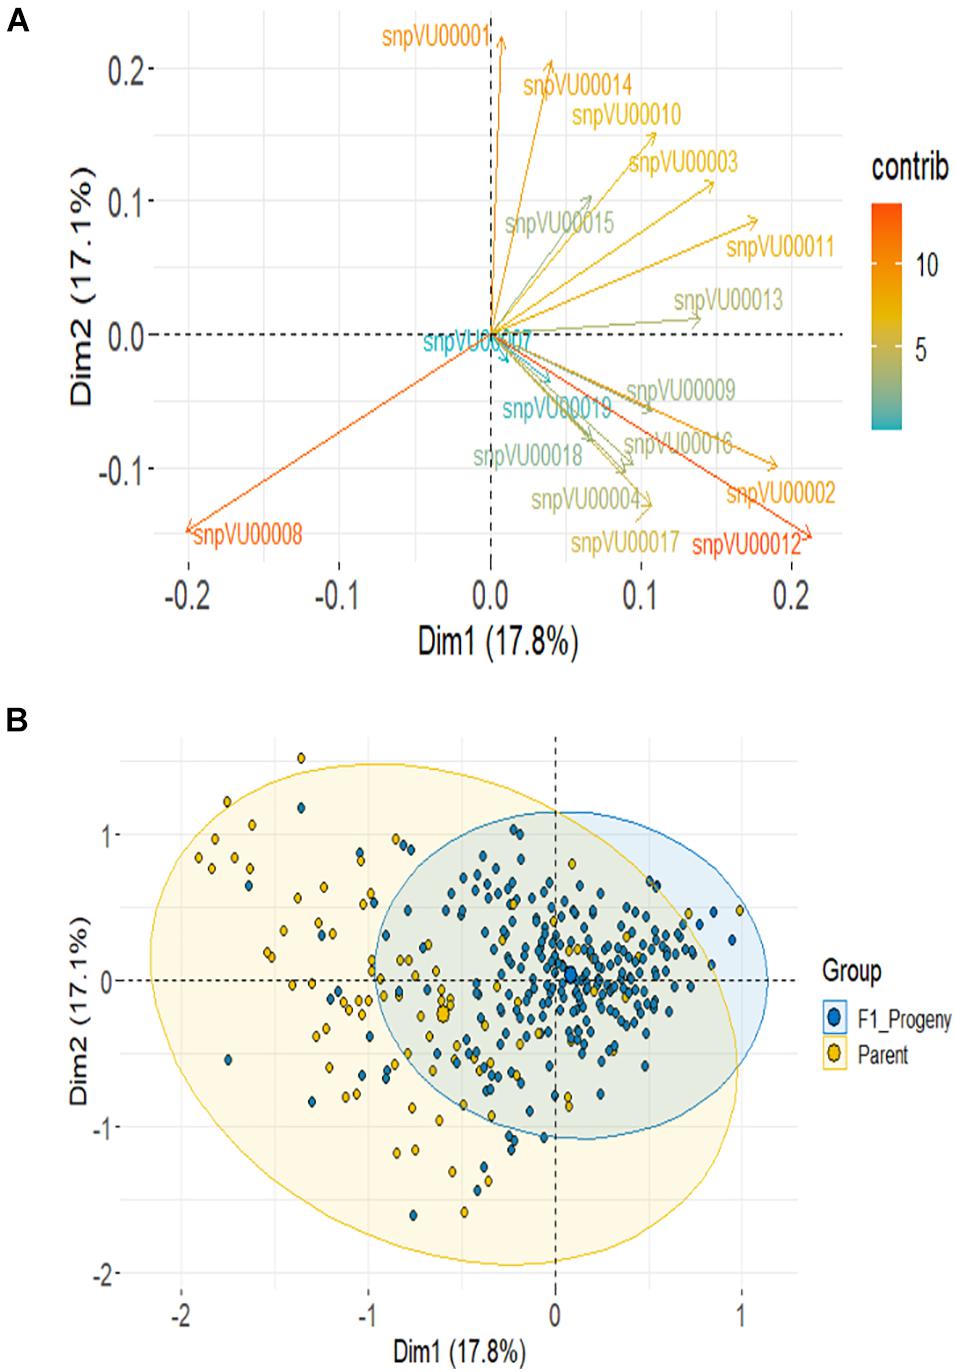
Figure 6. Principal component analysis (PCA) of F1 and the parents. (A) Contribution of each KAP-based single nucleotide polymorphism (SNP) markers to variation among genotypes; color scale on the right side indicates level of contribution. (B) PCA scatter highlighting the F1 progenies and the parents.
Hybridity of F1 Progenies
A general comparison of the proportion of heterozygous loci as a measure of hybridity of F1 progenies revealed a clear contrast between the F1 hybrids and their parents, with the F1 hybrids showing an overall higher heterozygosity than the parents as would be expected (Figure 7). However, there were few instances depicted in the bar plot (Figure 7A) and the boxplot (Figure 7B) where some F1 hybrids and parents displayed low and high proportions of heterozygous loci, respectively. In fact, 13 (6%) parental lines had more than 10% level of heterozygosity while 177 (79%) parents were 100% homozygous (Table 3). Of the 13 heterozygous parents 5 were recycled from IET stage, one from PYT, five from Advance Yield Trial (AYT), and two were landraces. The proportion of heterozygosity among F1 progenies ranged from 0 to 0.8 with a mean of 0.32, while for parents it ranged from 0 to 0.67 with a mean of 0.02 (Figure 7B).
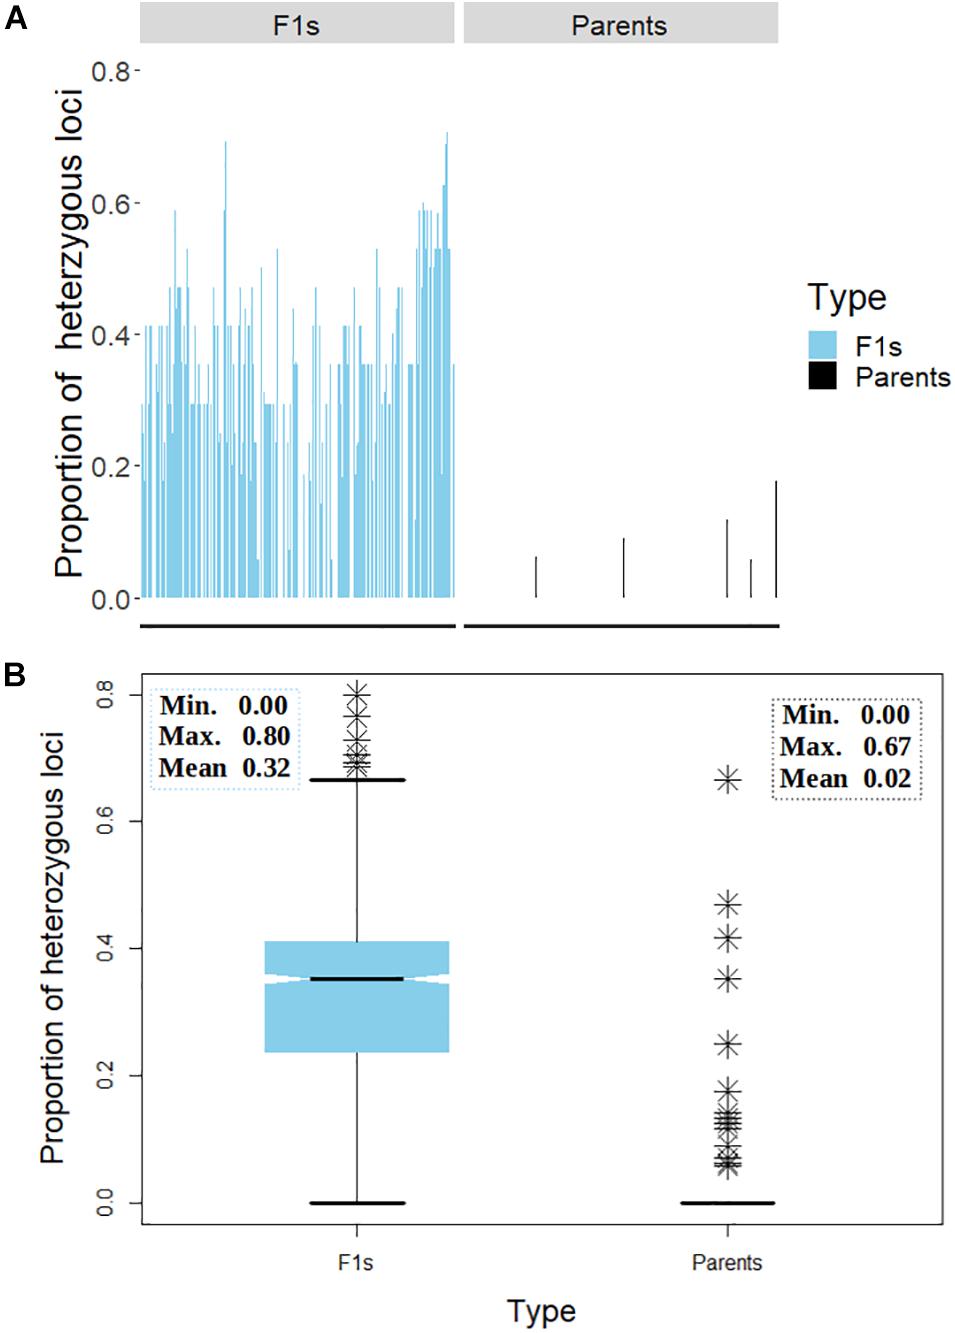
Figure 7. Distribution of heterozygosity between the F1 and their parents. (A) Bar chart displaying the proportion of heterozygous loci on the y-axis and the genotypes on the x-axis. (B) Box plot depicting the dispersion of heterozygosity between the F1 and the parents. Inserts in panel (B) depicts summary statistics; minimum, maximum, and mean heterozygosity among F1 and the parents, respectively. The symbol ∗ represents genotypes (both parents and F1s) with high proportion of heterozygous loci.
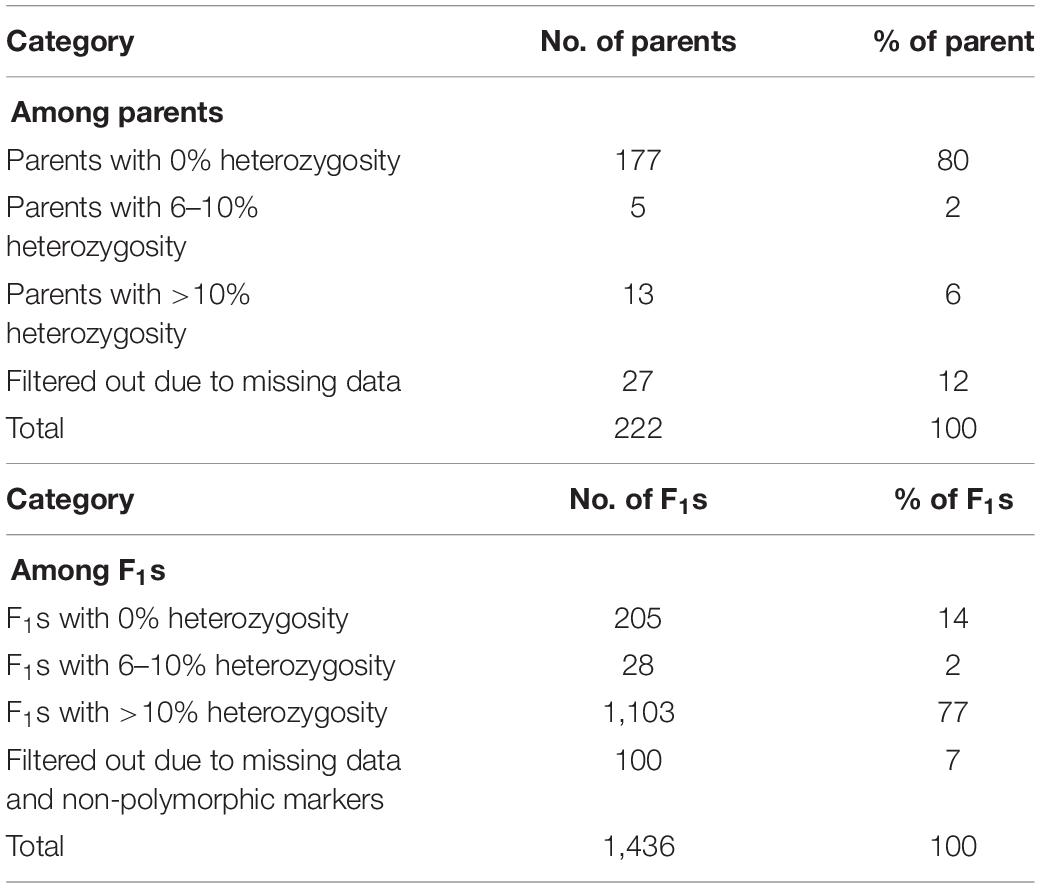
Table 3. Summary level of heterozygosity among parents and F1 progenies.
A summary of hybridity success rate based only on polymorphic markers between parents is presented in Figure 8. The distribution in Figure 8A depicted a general shift toward high success rate with 72% of the crosses attaining 100% hybridity success, 19% had intermediate success rates, 8% had 0% success (that is, none of the purported F1s in these crosses were true hybrids), and 1% had undetermined hybridity due to lack of polymorphism and missing data. When we considered all the 1,436 F1 progenies individually and computed the hybridity success rate, the results identified 1,131 (79%) progenies to be true F1 hybrids (successful crosses) (Figure 8B). These progenies were also detected as being heterozygous at more than 5% of polymorphic loci (Table 3). However, 205 (14%) putative progenies turned out to the products of self-pollination, while the hybrid status of 1 and 6% of the progenies could not be determined due to lack of polymorphism and missing data, respectively (Figure 8B and Table 3).
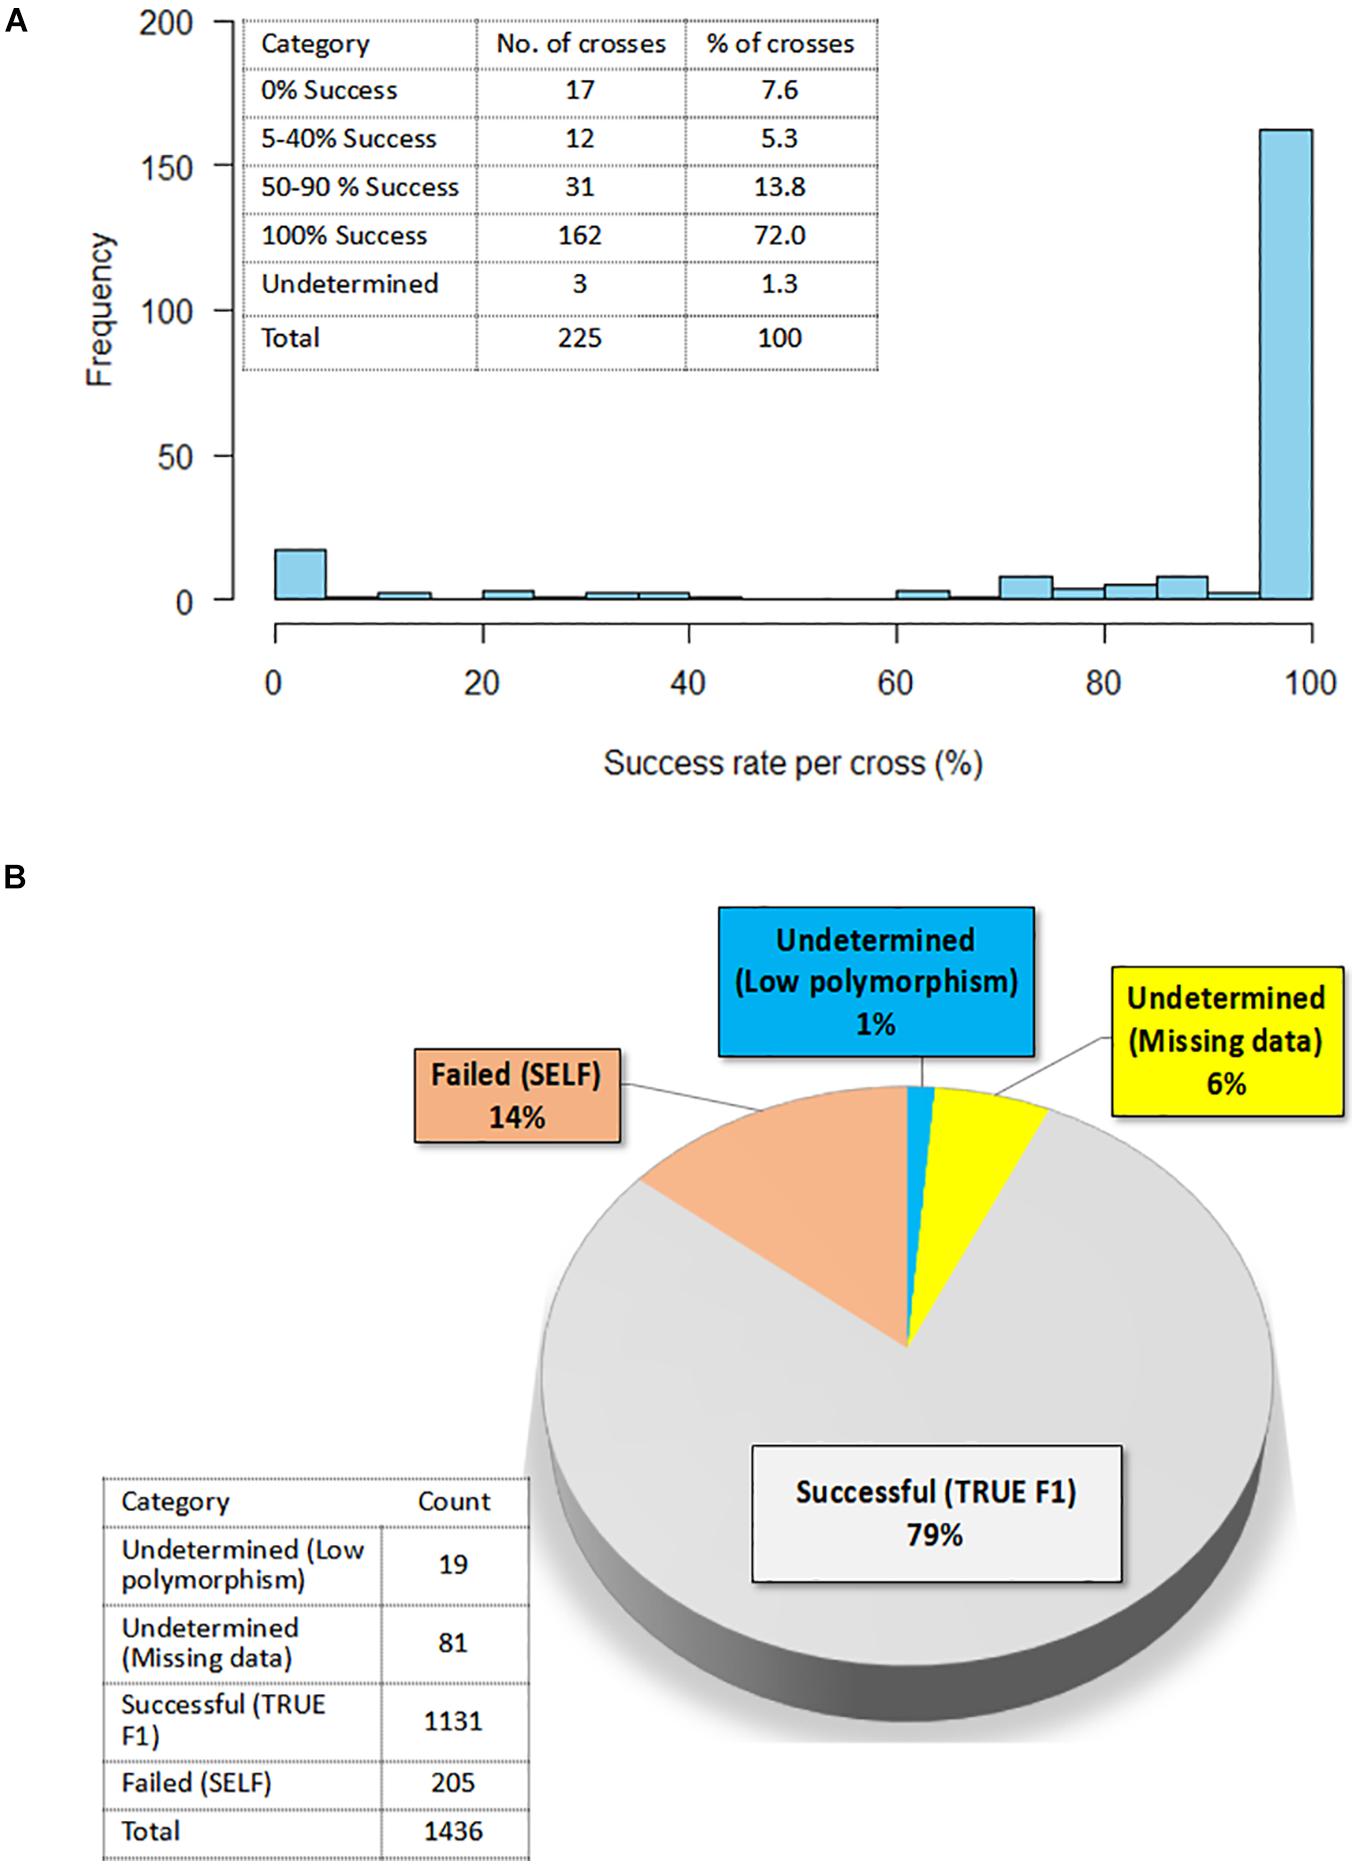
Figure 8. Confirmation of hybridity. (A) Histogram showing the distribution of success rate for true F1 hybrids in 225 crosses; Insert on the top left shows the exact number of crosses and a corresponding percentage in each success category (B) Pie chart depicting percentage of true F1s out of 1,436 F1 progenies as determined by the level of heterozygosity of F1 progenies for the polymorphic SNP markers; Insert on the left-hand bottom corner reflects the actual numbers of F1 progenies in each category.
Discussion
The demands of mankind for food, feed and various agricultural products have been increasing. To develop products that meet this increasing demand, breeders are challenged to accelerate genetic gain continuously, at ever higher rates, while they bridge the gaps that remain between the yield potential in breeders demonstration trials and the actual yield in farmers’ fields (Xu et al., 2017). The use of molecular markers has been demonstrated to play key roles in breeding optimization to attain enhanced genetic gain, mainly, through improved precision and reduction in time through more rapid and efficient breeding cycles (Perez-de-Castro et al., 2012; Sussumu Sakiyama et al., 2014). The past 15 years has seen key advances in development of cowpea genetics and genomics resources (Singh, 2007; Muchero et al., 2009a; Boukar et al., 2016, 2018; Munoz-Amatriain et al., 2016; Muñoz-Amatriaín et al., 2017; Fatokun et al., 2018; Huynh et al., 2018; Lonardi et al., 2019). This has facilitated the discovery of molecular markers for traits discovery and deployment in the breeding programs. For example, a number of studies have identified quantitative traits loci (QTLs) associated with resistance to biotic and abiotic stresses in cowpea (Muchero et al., 2009b; Agbicodo et al., 2010; Lucas et al., 2013; Huynh et al., 2015; Benoit et al., 2016; Essem et al., 2019; Miesho et al., 2019). However, although the application of molecular markers in hybridity testing and hybrid purity assessment have been demonstrated in several other crops (Patella et al., 2019a; Kishor et al., 2020; Osei et al., 2020), there is no documentation of its deployment in cowpea. Our work, therefore, is intended to integrate SNP markers as a QC mechanism against the unintended self-pollination or cross contamination following hybridization. This study has demonstrated that the strategy is also effective in cowpea. This is of paramount importance considering the significance of cowpea in food and nutrition (Kebede and Bekeko, 2020) and the need for constant and rapid development of new varieties. Released varieties of cowpea are often pure lines given its autogamous nature. Manual pollination between homozygous parents carrying agronomic traits of interest is, therefore, required to introduce genetic variability required for improved variety development. Despite the efficiency of hand emasculation method developed in the past (Myers, 1996), it remains difficult to rapidly differentiate true F1 seeds from self-pollinated ones in cowpea and yet this is a crucial step in the breeding process. The use of molecular assays to quickly and accurately screen progeny makes it possible to overcome some of the potentially frustrating occurrences in conventional breeding. Our KASP-based SNP markers have facilitated routine use of low-density fingerprinting of cowpea parental lines and allowed accurate detection of hybrids amongst their progenies.
This study began by assessing the informativeness of 17 QC cowpea SNP markers based on allele frequencies and PIC. The minor allele frequencies refer to the proportion of the second-most-common alleles at a genetic locus in a population and play a key role in determining allele diversity and heritability in the population (Dussault and Boulding, 2018; Hernandez et al., 2019). Dussault and Boulding (2018) reported that markers with high minor allele frequencies have high resolving power in distinguishing between individuals. PIC on the other hand, measures the ability of a marker to detect polymorphisms, hence, it determines the quality of a molecular marker for genetic analysis (Serrote et al., 2020). Results from our study revealed that 16 out of the 17 (94%) markers had minor allele frequencies of >0.05 and PIC above 0.2. Average level of heterozygosity was 0.29 when both parents and F1 progenies were considered together but this measure dropped drastically to a mean of 0.02 when parents were considered alone, which suggested that the SNPs had the power to distinguish heterozygotes from homozygotes. Overall, the estimates of these marker properties implied that the 17 SNP marker panel used were informative, that is, they were capable of distinguishing between parents, henceforth, identify true hybrids. These outcomes were supported by the estimates of marker efficiency which revealed only one marker (snpVU00007) with the lowest marker efficiency of about 3.4%.
We continued to assemble SNP fingerprints of parental lines and used them to dissect the genetic relationships among parents and the F1 progenies to discern which crosses benefited from maximum diversity between the parents. Analysis of genetic relatedness among plant germplasm plays a key role in plant breeding as it allows effective characterization of parental lines for hybridization (Govindaraj et al., 2015; Mafakheri et al., 2017; Khanna, 2018; Nkhoma et al., 2020). In the present study, genetic similarity analysis placed the parental lines into three groups, with a modest amount of variation still detectable within the groups. The landraces were grouped together in Cluster I, however, when considered alone, a considerable diversity was detectable among them and they were clustered into three sub-groups. The clustering of the landraces together when the all lines were considered is likely due to the fact, they are quite unrelated to the other parental lines, and as such the cladogram placed them in the same sub-group. Interestingly, a number of the parental lines shared the same cluster with the landraces, and therefore, they potentially carry some beneficial adaptation traits. As expected, the two male parents IT99K-573-1-1 and IT99K-573-2-1, showed 100% similarity and were grouped together with several other parents in the same cluster. Given that the rest of the parental lines were females, hybridizations between all closely related females and the two sister male lines is likely not beneficial. The parental similarity analysis, therefore, allowed us to identify progenies from crosses that involved closely related parents. Most of the female parents were selected from IET, PYT, and AYT based on their yield potentials and quickly recycled into the hybridization program. However, it was expected that some of these parents would be closely related since they shared common pedigrees. The fact that crosses were made prior to genetic similarity analysis, results from the present study provided a QC tool for early discarding of crosses with closely related parents. Representative crosses can be selected based on parental clustering and advanced in the breeding program. While comparing the F1 and their parents, the first two principal components revealed a considerable overlap between the F1 and parents. However, the F1 progenies appeared to be more closely related to each other while the parents were highly divergent. This outcome is expected given that all the F1 progenies were technically half-sibs, having received a common set of alleles from the two sister lines (IT99K-573-1-1 and IT99K-573-2-1). The expected variation for effective selection at later generations, therefore, comes solely from the diversity among the female parents. It is important therefore, to sort the crosses to be advanced based on relationships among parents.
A final focus was made on the molecular assessment of hybridity of the F1 plants derived from multi-parental crosses. Molecular determination of hybridity has been successfully demonstrated in various crops; tomato (Osei et al., 2020), maize (Salgado et al., 2006), lettuce (Patella et al., 2019a), Capsicum (Mongkolporn et al., 2004), rice (Yashitola et al., 2002), cotton (Dongre and Parkhi, 2005), cassava (Vincent et al., 2014), and peanut (Gomez et al., 2008). Apart from that on tomato, these studies deployed microsatellite markers for hybridity testing as a QC to determine true F1 for advancement. The present study, utilizing 17 KASP-based SNP markers, determined the homozygosity of parental lines and successfully identified true F1s. We found that 6% of the parents were unstable (heterozygous) at 2–8 loci, however, their inclusion as parents in hybridization was based on their yield potential and several other farmer-preferred attributes. Most of the parents detected as heterozygous were recycled at IET (F5 generation), PYT (F6 generation), and AYT (F7 generation) stages, while two of them were landraces. Heterozygosity observed among parents could be attributed to residual heterozygosity, outcrossing and heterogeneity (Plaschke et al., 1995; Fatokun and Ng, 2007; Gioi et al., 2012). To distinguish between F1 individuals resulting from cross-pollination and those resulting from self-pollination, we first examined the informative loci among the parental lines used in the crosses. Only polymorphic loci between pairs of parents were considered informative and used in hybridity assessment. Among the cross combinations, our analysis showed a range of 0–11 informative markers out of the 17 SNPs, 4–6 being the most frequent (70 parental combinations). Overall, 94% of the parental combinations had more than two informative markers, allowing for the authentication of putative hybrids from these cross combinations. Patella et al. (2019a) reported that restricting this kind of analysis to the informative loci brings considerable savings in terms of time and costs. All in all, molecular assessment of hybridity was successful: Over 72% of the crosses yielded 100% true F1 progenies (100% success rate) while 8% had unsuccessful F1 offspring (Selfed progeny). In lettuce, a highly self-pollinated crop, 100% success rate was reported in only 30% of the crosses (Patella et al., 2019a). Considering all the 1,436 F1 plants developed through manual hybridizations and tested in the present study, a success rate of 79% was attained. In peanut, out of 179 putative F1s, 70% were detected by SSR marker to be true hybrids (Gomez et al., 2008). To our knowledge, the present study is the first report on hybridity testing using molecular makers in cowpea. The crossing success rates of 10–20% reported by Myers (1996) and 28.36% by Ajayi et al. (2020) in cowpea are not necessarily the percentage of true F1s obtained, but the percentage of hybridizations that survived mechanical handlings and other stresses during manual emasculation. Our study found that of the hybridizations that survived mechanical handling during hand emasculation, 14% were a product of self-pollination. We also found that the hybridity status of about 1% of the progenies could not be determined because all the 17 markers were not polymorphic between their parents. This lack of polymorphism was observed in about 12 parental pairs and this could be attributed to the genetic similarity among parents. In fact, when we checked the pedigrees of lines involved in these parental pairs, we found that 9 out of 12 had 573-1-1, 573-2-1, and IT97K-499-35 as 1 of their parents. Interestingly, all the three lines (IT99K-573-1-1, IT99K-573-2-1, and IT97K-499-35) share a common striga resistant parent IT93K-596-9-12 (Singh et al., 2006). The remaining three lines shared TVu450 genome, a landrace with unknown pedigree, as one of their parents. These observations provide a plausible reason for lack of polymorphism between these lines and 573-1-1/573-2-1 (the two sisters lines used in this study). The limitation of detecting differences among closely related lines could be minimized by increasing the number of markers for hybridity tests and using genetically diverse parents. Usually, 20–30 SNP markers that are carefully chosen to have good genome coverage is sufficient (PASSeL, 2019). However, different marker densities, some with lower numbers than what is employed in the present study have been used to successfully dissect hybridity and fingerprints in crop plants (Nandakumar et al., 2004; Romdhane et al., 2018; Josia et al., 2021). According to Josia et al. (2021), the common assumption that the use of a large number of markers results in higher accuracy should be considered carefully due to the fact that in most sequence-based marker systems, the levels of missing data can lead to wrong interpretation. Therefore, the selection of fewer markers with high and repeatable representation across samples is desired and is cost-effective. Chen et al. (2016) also noted that fewer markers with high expected heterozygosity, missing value of <20%, and observed heterozygosity of <6% are ideal markers for accurate QC genotyping. The present study used 17 informative SNPs and we included as control, known sister lines and landraces which are quite diverse from some of the elite breeding lines. The fact that these markers were able to consistently diagnose these differences and further delineate the F1s from the homozygous parents demonstrated the effectiveness of the 17 QC marker set for fingerprinting and hybridity testing of cowpea.
Conclusion
The results of this study contribute to the body of knowledge about the advantages of integrating molecular markers as a QC step in a breeding program. We used KASP-based SNP markers in the first breeding phase which involves parental selection and identification of true hybrids. We demonstrated, firstly, the efficiency of SNP markers not only in detecting the best parental lines for crossing based on their observed homozygosity and genetic relatedness, but also in screening the resulting F1 progeny to distinguish between the offspring resulting from cross-pollination and those resulting from self-pollination. The markers identified true hybridity with 100% success in 72% of the populations. Overall, we detected 79% of the putative F1 plants to be true hybrids while 14% were selfed plants. Furthermore, given the ability of the SNP marker panel to detect heterozygosity or admixture in the parental lines, these markers can be utilized downstream the breeding scheme to assess the uniformity of potential candidate or pre-commercial cowpea lines. The fact that these sets of SNP markers are reproducible through the KASP assays, the genotype data from this study constitute a molecular fingerprint of the parents that would be utilized for future identity and purity assessment. The markers could also be used by seed companies to assess newly developed varieties for distinctiveness, uniformity and stability (DUS), which are the three key necessities for registering plant materials (Patella et al., 2019b).
Data Availability Statement
The original contributions presented in the study are publicly available. This data can be found here: European Nucleotide Archive (https://www.ebi.ac.uk/ena/browser/home) database under accession number: PRJEB46458.
Author Contributions
PO wrote the manuscript, organized samples for genotyping, and conducted the statistical analysis. CF, OB, AT, and SS revised the manuscript. OO, MA, IJ, and GB organized and coordinated pollination and tissue sampling for DNA analysis. OB and CF developed the populations and designed the study. All authors reviewed and approved the manuscript.
Funding
This research was funded by the Bill and Melinda Gates Foundation (BMGF) (Grant No. OPP1198373/INV-009649) through the Accelerated Varietal Improvement and Seed Delivery of Legumes and Cereals in Africa (AVISA) project and CRP GLDC funds from the International Institute of Tropical Agriculture (IITA).
Conflict of Interest
SS is employed by the company Bayer Research and Development Services LLC.
The remaining authors declare that the research was conducted in the absence of any commercial or financial relationships that could be construed as a potential conflict of interest.
Publisher’s Note
All claims expressed in this article are solely those of the authors and do not necessarily represent those of their affiliated organizations, or those of the publisher, the editors and the reviewers. Any product that may be evaluated in this article, or claim that may be made by its manufacturer, is not guaranteed or endorsed by the publisher.
Acknowledgments
Under the grant conditions of the Bill and Melinda Gates Foundation, a Creative Commons Attribution 4.0 Generic License has already been assigned to the author Accepted Manuscript version that might arise from this submission. We acknowledge the Excellence in Breeding (EiB) platform through HTPG services for supporting the KASP genotyping at the Intertek Lab Sweden. We thank Chamathi Siva who supported the development of KASP markers. We also thank all our field technicians, especially Abdullahi D. Haruna and Safiya Abubakar, who conducted the hand emasculation and pollination.
Supplementary Material
The Supplementary Material for this article can be found online at: https://www.frontiersin.org/articles/10.3389/fpls.2021.734117/full#supplementary-material
Footnotes
- ^ http://13.250.212.83
- ^ http://www.intertek.com/agriculture/agritech/
- ^ https://excellenceinbreeding.org/sites/default/files/u5/KASP%20markers%20for%20Cowpea.xlsx
- ^ https://www.biosearchtech.com/support/tools/genotyping-software/snpviewer
References
Agbicodo, E. M., Fatokun, C. A., Bandyopadhyay, R., Wydra, K., Diop, N. N., Muchero, W., et al. (2010). Identification of markers associated with bacterial blight resistance loci in cowpea [Vigna unguiculata (L.) Walp.]. Euphytica 175, 215–226. doi: 10.1007/s10681-010-0164-5
Agbicodo, E. M., Fatokun, C. A., Muranaka, S., Visser, R. G. F., and Linden Van Der, C. G. (2009). Breeding drought tolerant cowpea: constraints, accomplishments, and future prospects. Euphytica 16, 353–370. doi: 10.1007/s10681-009-9893-8
Ajayi, A. T., Gbadamosi, A. E., Olotuah, O. F., and David, E. A. (2020). Crossability and inheritance of seed coat colour in cowpea at F1 generation. Front. Life Sci. Relat. Technol. 1, 58–62.
Anderson, J. A., Churchill, G. A., Autrique, J. E., Tanksley, S. D., and Sorrells, M. E. (1993). Optimizing parental selection for genetic linkage maps. Genome 36, 181–186. doi: 10.1139/g93-024
Benoit, J. B., Eric, D., Jean-Baptiste, T., Bao-Lam, H., Issa, D., Timothy, J. C., et al. (2016). Application of marker-assisted backcrossing to improve cowpea (Vigna unguiculata L. Walp) for drought tolerance. J. Plant Breed. Crop Sci. 8, 273–286. doi: 10.5897/jpbcs2016.0607
Bernardo, A., Wang, S., Amand, P. S., and Bai, G. (2015). Using next generation sequencing for multiplexed trait-linked markers in wheat. PLoS One 10:e0143890. doi: 10.1371/journal.pone.0143890
Boukar, O., Abberton, M., Oyatomi, O., Togola, A., Tripathi, L., and Fatokun, C. (2020). Introgression breeding in cowpea [Vigna unguiculata (L.) Walp.]. Front. Plant Sci. 11:567425. doi: 10.3389/fpls.2020.567425
Boukar, O., Belko, N., Chamarthi, S., Togola, A., Batieno, J., Owusu, E., et al. (2018). Cowpea (Vigna unguiculata): genetics, genomics and breeding. Plant Breed. 138, 415–424. doi: 10.1111/pbr.12589
Boukar, O., Fatokun, C. A., Huynh, B. L., Roberts, P. A., and Close, T. J. (2016). Genomic tools in cowpea breeding programs: status and perspectives. Front. Plant Sci. 7:757. doi: 10.3389/fpls.2016.00757
Boukar, O., Massawe, F., Muranaka, S., Franco, J., Maziya-Dixon, B., Singh, B., et al. (2011). Evaluation of cowpea germplasm lines for protein and mineral concentrations in grains. Plant Genet. Resour. Charact. Util. 9, 515–522. doi: 10.1017/S1479262111000815
Boukar, O., Togola, A., Chamarthi, S., Belko, N., Ishikawa, H., Suzuki, K., et al. (2019). “Cowpea [Vigna unguiculata (L.) Walp.] breeding,” in Advances in Plant Breeding Strategies: Legumes, eds J. Al-Khayri, S. Jain, and D. Johnson (Cham: Springer), 201–243. doi: 10.1007/978-3-030-23400-3_6
Braae, A., Thompson, C. E., and Morgan, K. (2014). Comparison of Custom Designed KASP and TaqMan Genotyping Assays for a Rare Genetic Variant Identified Through Resequencing GWAS Loci. LGC Appl. Note GAPP-0003. Available online at: www.lgcgroup.com (accessed February 15, 2021).
Bradbury, P. J., Zhang, Z., Kroon, D. E., Casstevens, T. M., Ramdoss, Y., and Buckler, E. S. (2007). TASSEL: software for association mapping of complex traits in diverse samples. Bioinformatics 23, 2633–2635. doi: 10.1093/bioinformatics/btm308
Carsky, R. J., Singh, B. B., and Oyewole, B. (2001). Contribution of early season cowpea to late season maize in the savanna zone of west africa. Biol. Agric. Hortic. 18, 303–315. doi: 10.1080/01448765.2001.9754894
Chen, J., Zavala, C., Ortega, N., Petroli, C., Franco, J., Burgueño, J., et al. (2016). The development of quality control genotyping approaches: a case study using elite maize lines. PLoS One 11:e0157236. doi: 10.1371/JOURNAL.PONE.0157236
Dongre, A., and Parkhi, V. (2005). Identification of cotton hybrid through the combination of PCR based RAPD, ISSR and microsatellite markers. J. Plant Biochem. Biotechnol. 14, 53–55. doi: 10.1007/BF03263226
Dussault, F. M., and Boulding, E. G. (2018). Effect of minor allele frequency on the number of single nucleotide polymorphisms needed for accurate parentage assignment: a methodology illustrated using Atlantic salmon. Aquac. Res. 49, 1368–1372. doi: 10.1111/are.13566
Essem, F., Ohlson, E. W., Asare, A. T., and Timko, M. P. (2019). Genetic markers linked to Striga gesnerioides resistance for the improvement of Ghanaian cowpea (Vigna unguiculata) cultivars. Plant Breed. 138, 599–604. doi: 10.1111/pbr.12702
Fatokun, C., Girma, G., Abberton, M., Gedil, M., Unachukwu, N., Oyatomi, O., et al. (2018). Genetic diversity and population structure of a mini-core subset from the world cowpea (Vigna unguiculata (L.) Walp.) germplasm collection. Sci. Rep. 8:16035. doi: 10.1038/s41598-018-34555-9
Gioi, T. D., Boora, K. S., and Chaudhary, K. (2012). Identification and characterization of SSR markers linked to yellow mosaic virus resistance Gene(s) in Cowpea (Vigna unguiculata). Int. J. Plant Res. 2, 1–8. doi: 10.5923/j.plant.20120201.01
Gomez, S. M., Denwar, N. N., Ramasubramanian, T., Simpson, C. E., Burow, G., Burke, J. J., et al. (2008). Identification of peanut hybrids using microsatellite markers and horizontal polyacrylamide gel electrophoresis. Peanut Sci. 35, 123–129. doi: 10.3146/ps07-109.1
Govindaraj, M., Vetriventhan, M., and Srinivasan, M. (2015). Importance of genetic diversity assessment in crop plants and its recent advances: an overview of its analytical perspectives. Genet. Res. Int. 2015:431487. doi: 10.1155/2015/431487
Hernandez, R. D., Uricchio, L. H., Hartman, K., Ye, C., Dahl, A., and Zaitlen, N. (2019). Ultrarare variants drive substantial cis heritability of human gene expression. Nat. Genet. 51, 1349–1355. doi: 10.1038/s41588-019-0487-7
Huynh, B., Ehlers, J. D., Huang, B. E., Muñoz-Amatriaín, M., Lonardi, S., Santos, J. R. P., et al. (2018). A multi-parent advanced generation inter-cross (MAGIC) population for genetic analysis and improvement of cowpea (Vigna unguiculata L. Walp.). Plant J. 93, 1129–1142. doi: 10.1111/tpj.13827
Huynh, B. L., Ehlers, J. D., Ndeve, A., Wanamaker, S., Lucas, M. R., Close, T. J., et al. (2015). Genetic mapping and legume synteny of aphid resistance in African cowpea (Vigna unguiculata L. Walp.) grown in California. Mol. Breed. 35:36. doi: 10.1007/s11032-015-0254-0
Intertek-Agritech (2016). Agri-Services CGIAR HTPG PROJECT Sampling Instructions for SNP Verification and Routine SNP Analysis. Laboratory Mannual published by Excellence in Breeding (EiB) platform. Available Online at: https://dev.excellenceinbreeding.org/sites/default/files/manual/Sampling%20instructions%20CGIAR%20HTPG%20Project_0.pdf (accessed February 17, 2021).
Jiang, G.-L. (2013). “Molecular markers and marker-assisted breeding in plants,” in Plant Breeding from Laboratories to Fields, ed. S. B. Andersen (London: IntechOpen), 45–83. doi: 10.5772/52583
Josia, C., Mashingaidze, K., Amelework, A. B., Kondwakwenda, A., Musvosvi, C., and Sibiya, J. (2021). SNP-based assessment of genetic purity and diversity in maize hybrid breeding. PLoS One 16:e0249505. doi: 10.1371/JOURNAL.PONE.0249505
Kassambara, A., and Mundt, F. (2020). factoextra: Extract and Visualize the Results of Multivariate Data Analyses. CRAN.R-project. Available Online at: https://cran.r-project.org/web/packages/factoextra/index.html (accessed February 17, 2021).
Kebede, E., and Bekeko, Z. (2020). Expounding the production and importance of cowpea (Vigna unguiculata (L.) Walp.) in Ethiopia. Cogent Food Agric. 6:1769805. doi: 10.1080/23311932.2020.1769805
Khanna, V. (2018). Studies on crossability and genetic diversity in cowpea (Vigna unguiculata L. Walp.). Int. J. Environ. Sci. Nat. Resour. 13, 1–9. doi: 10.19080/ijesnr.2018.13.555852
Kishor, D. S., Noh, Y., Song, W. H., Lee, G. P., Jung, J. K., Shim, E. J., et al. (2020). Identification and purity test of melon cultivars and F1 hybrids using fluidigm-based snp markers. Hortic. Sci. Technol. 38, 686–694. doi: 10.7235/HORT.20200062
Lonardi, S., Muñoz-Amatriaín, M., Liang, Q., Shu, S., Wanamaker, S. I., Lo, S., et al. (2019). The genome of cowpea [Vigna unguiculata (L.) Walp.]. Plant J. 98, 767–782. doi: 10.1111/tpj.14349
Lucas, M. R., Ehlers, J. D., Huynh, B. L., Diop, N. N., Roberts, P. A., and Close, T. J. (2013). Markers for breeding heat-tolerant cowpea. Mol. Breed. 31, 529–536. doi: 10.1007/s11032-012-9810-z
Mafakheri, K., Bihamta, M. R., and Abbasi, A. R. (2017). Assessment of genetic diversity in cowpea (Vigna unguiculata L.) germplasm using morphological and molecular characterisation. Cogent Food Agric. 3:1327092.
Mammadov, J., Aggarwal, R., Buyyarapu, R., and Kumpatla, S. (2012). SNP markers and their impact on plant breeding. Int. J. Plant Genom. 2012:11. doi: 10.1155/2012/728398
Miesho, B., Hailay, M., Msiska, U., Bruno, A., Malinga, G. M., Obia Ongom, P., et al. (2019). Identification of candidate genes associated with resistance to bruchid (Callosobruchus maculatus) in cowpea. Plant Breed. 138, 605–613.
Mongkolporn, O., Dokmaihom, Y., Kanchana-Udomkan, C., and Pakdeevaraporn, P. (2004). Genetic purity test of F1 hybrid Capsicum using molecular analysis. J. Hortic. Sci. Biotechnol. 79, 449–451. doi: 10.1080/14620316.2004.11511788
Muchero, W., Diop, N. N., Bhat, P. R., Fenton, R. D., Wanamaker, S., Pottorff, M., et al. (2009a). A consensus genetic map of cowpea [Vigna unguiculata (L) Walp.] and synteny based on EST-derived SNPs. Proc. Natl. Acad. Sci. U.S.A. 106, 18159–18164. doi: 10.1073/pnas.0905886106
Muchero, W., Ehlers, J. D., Close, T. J., and Roberts, P. A. (2009b). Mapping QTL for drought stress-induced premature senescence and maturity in cowpea [Vigna unguiculata (L.) Walp.]. Theor. Appl. Genet. 118, 849–863.
Munoz-Amatriain, M., Lo, S., Herniter, I., Guo, Y.-N., Roberts, P. A., and Close, T. J. (2016). “Development and characterization of a mini-core collection of cowpea,” in Resilience Emerging From Scarcity and Abundance, (Phoenix: American Society of Agronomy).
Muñoz-Amatriaín, M., Mirebrahim, H., Xu, P., Wanamaker, S. I., Luo, M. C., Alhakami, H., et al. (2017). Genome resources for climate-resilient cowpea, an essential crop for food security. Plant J. 89, 1042–1054. doi: 10.1111/tpj.13404
Myers, G. O. (1996). Hand Crossing of Cowpeas, 3rd Edn, Ibadan: International Institute of Tropical Agriculture (IITA).
Nadeem, M. A., Nawaz, M. A., Shahid, M. Q., Doğan, Y., Comertpay, G., Yıldız, M., et al. (2018). DNA molecular markers in plant breeding: current status and recent advancements in genomic selection and genome editing. Biotechnol. Biotechnol. Equip. 32, 261–285. doi: 10.1080/13102818.2017.1400401
Nandakumar, N., Singh, A. K., Sharma, R. K., Mohapatra, T., Prabhu, K. V., and Zaman, F. U. (2004). Molecular fingerprinting of hybrids and assessment of genetic purity of hybrid seeds in rice using microsatellite markers. Euphytica 136, 257–264. doi: 10.1023/B:EUPH.0000032706.92360.C6
Nei, M., and Saitou, N. (1987). The neighbor-joining method: a new method for reconstructing phylogenetic trees. Mol. Biol. Evol. 4, 406–425.
Nkhoma, N., Shimelis, H., Laing, M. D., Shayanowako, A., and Mathew, I. (2020). Assessing the genetic diversity of cowpea [Vigna unguiculata (L.) Walp.] germplasm collections using phenotypic traits and SNP markers. BMC Genet. 21:110. doi: 10.1186/s12863-020-00914-7
Ongom, P. O., Fatokun, C., Togola, A., Oyebode, O. G., Ahmad, M. S., Jockson, I. D., et al. (2021). Genetic worth of multiple sets of cowpea breeding lines destined for advanced yield testing. Euphytica 30:217.
Osei, M. K., Danquah, E., Danquah, A., Blay, E., and Adu-Dapaah, H. (2020). Hybridity testing of tomato F1 progenies derived from parents with varying fruit quality and shelf life using single nucleotide polymorphism (SNPs). Sci. Afric. 8:e00267. doi: 10.1016/j.sciaf.2020.e00267
PASSeL (2019). Application of Molecular Marker Technology to QA/QC in Plant Breeding. Plant Soil Science eLibrary. Available online at: https://digitalcommons.unl.edu/passel/10 (accessed February 15, 2021).
Patella, A., Palumbo, F., Galla, G., and Barcaccia, G. (2019a). The molecular determination of hybridity and homozygosity estimates in breeding populations of lettuce (Lactuca sativa L.). Genes 10:916.
Patella, A., Scariolo, F., Palumbo, F., and Barcaccia, G. (2019b). Genetic structure of cultivated varieties of radicchio (Cichorium intybus L.): a comparison between F1 hybrids and synthetics. Plants 8:213. doi: 10.3390/plants8070213
Perez-de-Castro, A. M., Vilanova, S., Canizares, J., Pascual, L., Blanca, J. M., Diez, J. M., et al. (2012). Application of genomic tools in plant breeding. Curr. Genom. 13, 179–195. doi: 10.2174/138920212800543084
Plaschke, J., Ganal, M. W., and Röder, M. S. (1995). Detection of genetic diversity in closely related bread wheat using microsatellite markers. Theor. Appl. Genet. 91, 1001–1007. doi: 10.1007/BF00223912
Romdhane, M. B., Riahi, L., Jardak, R., Ghorbel, A., and Zoghlami, N. (2018). Fingerprinting and genetic purity assessment of F1 barley hybrids and their salt-tolerant parental lines using nSSR molecular markers. 3 Biotech. 8:57. doi: 10.1007/S13205-017-1080-3
Salgado, K. C. P. C., Vieira, M. G. G. C., Pinho, E. V. R. V., Guimarães, C. T., Pinho, R. G. V., and AndSouza, L. (2006). Genetic purity certificate in seeds of hybrid maize using molecular markers. Rev. Bras. Sement. 128:24. doi: 10.1590/S0101-31222006000100024
Selvakumar, P., Ravikesavan, R., Gopikrishnan, A., Thiyagu, K., Preetha, S., and Boopathi, N. M. (2010). Genetic purity analysis of cotton (Gossypium spp.) hybrids using SSR markers. Seed Sci. Technol. 32, 358–366.
Serrote, C. M. L., Reiniger, L. R. S., Silva, K. B., Rabaiolli, S. M., dos, S., and Stefanel, C. M. (2020). Determining the polymorphism information content of a molecular marker. Gene 726:144175. doi: 10.1016/j.gene.2019.144175
Singh, B. B. (2007). Recent progress in cowpea genetics and breeding. Acta Hortic. 752, 69–76. doi: 10.17660/actahortic.2007.752.7
Singh, B. B., Olufajo, O. O., Ishiyaku, M. F., Adeleke, R. A., Ajeigbe, H. A., and Mohammed, S. G. (2006). Registration of six improved germplasm lines of cowpea with combined resistance to Striga gesnerioides and Alectra vogelii. Crop Sci. 46, 2332–2333. doi: 10.2135/CROPSCI2006.03.0148
Sundaram, R. M., Naveenkumar, B., Biradar, S. K., Balachandran, S. M., Mishra, B., Ilyasahmed, M., et al. (2008). Identification of informative SSR markers capable of distinguishing hybrid rice parental lines and their utilization in seed purity assessment. Euphytica 163, 215–224. doi: 10.1007/s10681-007-9630-0
Sussumu Sakiyama, N., Christine, H., Ramos, C., Caixeta, E. T., and Pereira, M. G. (2014). Plant breeding with marker-assisted selection in Brazil. Crop Breed. Appl. Biotechnol. 14, 54–60.
Tester, M., and Langridge, P. (2010). Breeding technologies to increase crop production in a changing world. Science 327, 818–822.
Togola, A., Boukar, O., Belko, N., Chamarthi, S. K., Fatokun, C., Tamo, M., et al. (2017). Host plant resistance to insect pests of cowpea (Vigna unguiculata L. Walp.): achievements and future prospects. Euphytica 213, 1–16. doi: 10.1007/s10681-017-2030-1
Togola, A., Boukar, O., Servent, A., Chamarthi, S., Tamò, M., and Fatokun, C. (2020). Identification of sources of resistance in cowpea mini core accessions to Aphis craccivora Koch (Homoptera: Aphididae) and their biochemical characterization. Euphytica 216:88. doi: 10.1007/s10681-020-02619-5
Vincent, K., Robert, K., Morag, F., Tadeo, K., Yona, B., and Peter, V. (2014). Identification of F1 cassava (Manihot esculenta Crantz) progeny using microsatellite markers and capillary electrophoresis. Am. J. Plant Sci. 05, 119–125. doi: 10.4236/ajps.2014.51015
Weerasinghe, O. R., Perera, A. L. T., De Costa, W. A. J. M., Jinadase, D. M., and Vishnukanthasingham, R. (2004). Production of tomato hybrids for dry zone conditions of Sri Lanka using combining ability analysis, heterosis and DNA testing procedures. Trop. Agric. Res. 16, 79–90.
Wu, M., Jia, X., Tian, L., and Lv, B. (2010). Rapid and reliable purity identification of F1 hybrids of maize (Zea may L.) using SSR markers. Maize Genom. Genet. 1, 1–4. doi: 10.5376/mgg.2010.01.0001
Xu, Y., Li, P., Zou, C., Lu, Y., Xie, C., Zhang, X., et al. (2017). Enhancing genetic gain in the era of molecular breeding. J. Exp. Bot. 68, 2641–2666. doi: 10.1093/jxb/erx135
Keywords: cowpea (Vigna unguiculata), fingerprinting, hybridity test, QC markers, KASP assay, true F1 progeny, genetic distance
Citation: Ongom PO, Fatokun C, Togola A, Salvo S, Oyebode OG, Ahmad MS, Jockson ID, Bala G and Boukar O (2021) Molecular Fingerprinting and Hybridity Authentication in Cowpea Using Single Nucleotide Polymorphism Based Kompetitive Allele-Specific PCR Assay. Front. Plant Sci. 12:734117. doi: 10.3389/fpls.2021.734117
Received: 30 June 2021; Accepted: 13 September 2021;
Published: 05 October 2021.
Edited by:
Sean Mayes, University of Nottingham, United KingdomReviewed by:
Manish Kumar Pandey, International Crops Research Institute for the Semi-Arid Tropics (ICRISAT), IndiaEster Murube Torcida, Servicio Regional de Investigación y Desarrollo Agroalimentario (SERIDA), Spain
Copyright © 2021 Ongom, Fatokun, Togola, Salvo, Oyebode, Ahmad, Jockson, Bala and Boukar. This is an open-access article distributed under the terms of the Creative Commons Attribution License (CC BY). The use, distribution or reproduction in other forums is permitted, provided the original author(s) and the copyright owner(s) are credited and that the original publication in this journal is cited, in accordance with accepted academic practice. No use, distribution or reproduction is permitted which does not comply with these terms.
*Correspondence: Patrick Obia Ongom, UC5PbmdvbUBjZ2lhci5vcmc=